

Submitted:
15 July 2026
Posted:
16 July 2026
You are already at the latest version
Abstract
The marine microalga Nannochloropsis oceanica is a promising organism for sustainable production of lipids, omega-3 fatty acids, and biomass with a high nutritional value. We demonstrate UV mutagenesis combined with visual screening to generate novel non-GMO strains with improved industrial traits. Four mutants displayed altered pigmentation and/or enhanced growth after UV treatment, of which mutants M34 and M181 were selected for detailed characterization. Mutant M34 displayed enhanced biomass productivity under high light conditions (500 µmol m⁻² s⁻¹) in small-scale photobioreactor cultivations, indicating improved tolerance to elevated irradiance. Pigment analyses revealed reduced levels of several xanthophyll carotenoids, suggesting altered light adaptation and photoprotective responses. However, the improved growth phenotype was not consistently maintained at medium and pilot scale, highlighting the strong influence of cultivation conditions on measured strain performance. Mutant M181 exhibited strongly reduced chlorophyll content, accompanied by impaired growth at elevated light intensities. Pilot-scale cultivation demonstrated significantly increased lipid accumulation, reaching up to 25% of dry matter compared to 17% in the wild type. While M181 showed unaltered composition of amino acids, total fatty acids and eicosapentanoic acid, we found elevated vitamin D3 accumulation after UVB exposure and significantly higher menaquinone-4 (MK-4) bioaccessibility, indicating improved nutritional functionality. The results demonstrate that UV mutagenesis combined with simple visual screening is an effective strategy to generate N. oceanica strains with altered biomass composition and growth performance. Our study shows the importance of evaluating mutants under industrially relevant conditions, as phenotypes observed at laboratory scale may not translate well to pilot-scale systems.
Keywords:
Nannochloropsis oceanica
; UV mutagenesis
; microalgal breeding
; photobioreactor cultivation
; lipid accumulation
; nutritional quality
1. Introduction
Microalgae are unicellular photosynthetic organisms gaining increasing research interest because of their high growth rates and ability to convert CO2 and light energy into valuable biomass relevant for food, feed and bioenergy applications (Barbosa et al., 2023; Canelli et al., 2022; Karageorgou et al., 2023; Südfeld et al., 2021). Microalgae have the potential to become a sustainable source of high-quality protein, lipids, vitamins, and other valuable bio-compounds (Fernández et al., 2021). However, realizing this potential will require the use of sunlight or LED light as energy source, together with industrial side streams to supply media nutrients, combined with local production (Barbosa et al., 2023).
The unicellular lifestyle of microalgae is advantageous to biomass productivity when compared with plants, which must devote significant resources to maintain structural support and generate specialized tissues such as roots, stems and leaves. In addition, a wider diversity of pigments together with advanced carbon concentrating mechanisms (CCMs) allows microalgae to use a broader range of the available light spectrum and fixate CO2 more efficiently than terrestrial plants (Hu et al., 2023; Prasad et al., 2021). However, the potential benefits of higher photosynthetic efficiency relative to terrestrial crops are far from being realized in industrial cultivation systems, as cell shading limits achievable cell densities (Dall’Osto et al., 2014; Perin and Morosinotto, 2023). In addition, harvesting algal biomass is energy-intensive, making high cell densities essential for maintaining profitability. Current estimates suggest that increasing photosynthetic efficiency from 2.7% to 6.0% could enhance the profitability of an existing production plant by 45–50% (Ruiz et al., 2016).
For algal cultivation to become economically viable, it is essential to optimize light utilization by the algae within photobioreactors to ensure efficient growth at both low and high biomass densities. One promising strategy to achieve improved growth at high densities involves reducing the chlorophyll content of the cells to prevent cells from absorbing light in excess to requirements for growth. This reduces shading and provides a more uniform light distribution throughout photobioreactor tubes (Pinnola et al., 2017), and has been demonstrated by breeding mutants with truncated antenna systems (Kumar et al., 2021). Breeding of microalgae with reduced (i.e., truncated) light harvesting antennae has been proven to efficiently increase light utilization and photosynthetic efficiency of dense microalgae culture inside photobioreactor (PBR) tubes (Kumar et al., 2021; Perin et al., 2015; Pinnola et al., 2017).
Nannochloropsis oceanica is a small (2-5 µm in diameter) marine microalgae belonging to the class Eustigmatophyceae. Being obligate photoautotrophs, N. oceanica only contains chlorophyll a (chl a) and their carotenoid composition is dominated by violaxanthin. Still, it can synthesize various carotenoids depending on cultivation conditions, with light intensity especially causing changes in their carotenoid profiles (Perin et al., 2023). N. oceanica can be an efficient lipid producer, accumulating up to 60-70% of the total biomass as lipids (Canini et al., 2024), of which 3-6% (of the dry weight) can be the omega-3 fatty acid eicosapentaoic acid (EPA) known to have multiple benefits on human health (Ma et al., 2014: Karageorgou et al., 2023; Safafar et al., 2016). Owing to these properties, many studies have aimed to breed N. oceanica with improved photosynthetic efficiency and EPA synthesis (Wan Razali et al., 2022; Poliner et al., 2018; Südfeld et al., 2021b; Cecchin et al., 2020). In addition, Ljubic et al. (2020, 2021) discovered that N. oceanica can synthesize vitamin D3 in response to UVB treatment, likely by conversion of 7-hydrocholesterol (provitamin D3), offering another potential application for this microalga. Vitamin D3 insufficiency causes physical and mental health issues of those affected and is an increasing problem worldwide (Mendes et al., 2020). The current dietary intake of both vitamin D3 and long chain omega-3 poly-unsaturated fatty acids (PUFAs) mainly derives from wild fish, which is an unsustainable and overexploited resource, making microalgae an interesting non-animal alternative as source of vitamin D3 and omega-3 PUFAs (Jakobsen et al., 2019; Remize et al., 2021; Zakaria et al., 2025). Recently, it was also demonstrated that N. oceanica is a potent source of the primary vitamin K2 constituent menaquinone 4 (MK-4) (Gundersen et al., 2026b), ), which provides another promising application for Nannochloropsis, given that menaquinones, including MK-4, are normally sourced from foods of animal and bacterial origin (Jensen et al., 2021). However, Nannochloropsis species are not yet approved for food applications in the EU but are currently applied mainly for aquaculture feed (Mendes et al., 2022).
A challenging feature of the Nannochloropsis genus is their robust cell wall consisting of a thick cellulose layer coated with the chemically recalcitrant polymer algaenan (Khamila et al., 2025; Scholz et al., 2014).This feature makes whole cell Nannochloropsis biomass difficult to digest for most animals, including humans, and as a consequence, several studies have demonstrated very low bioaccessibility of intracellular nutrients when performing in vitro digestion assays (Bernaerts et al., 2020; Cavonius et al., 2016; Gundersen et al., 2026a). As an example, the in vitro bioaccessibility of EPA in whole cell Nannochloropsis sp. biomass has previously been measured to just 13% (Bernaerts et al., 2020). However, several studies have demonstrated that cell disruption, for example by high pressure homogenization or pH-shift, can significantly increase the in vitro bioaccessibility of intracellular compounds in different microalgal species (Bernaerts et al., 2020; Cavonius et al., 2016; Demarco et al., 2022; Gille et al., 2016), thus improving the overall nutritional quality of the biomass.
A main advantage of applying N. oceanica as a model for breeding is the fact that it is a monoploid asexually reproducing algae with a small and compact genome relative to other microalgae with a genome of 29 Mb with 7.330 protein coding genes with only few introns and repetitive sequences (Guo et al., 2019), which provides obvious advantages for breeding. For comparison, both Chlorella vulgaris and Chlamydomonas reinhardtii undergo sexual reproduction in which they transition through diploid stages, and both harbor larger genomes than N. oceanica at 40 Mb with estimated 10.724 genes for C. vulgaris, and 107 Mb with an estimated 17.741 genes in the case of C. reinhardtii (Cecchin et al., 2019). Random mutagenesis using ethyl methanesulfonate (EMS) treatment or UV-radiation has been employed for mutational studies on N. oceanica (Beacham et al., 2015; Park et al., 2021; Trovão et al., 2022). Both EMS and UV mutagenesis generate single nucleotide mutations that will have a high chance of causing phenotypic changes when applied on gene-dense organisms like Nannochloropsis sp. (Perin et al., 2015).
In the present study we applied UV-mutagenesis combined with simple visual screening to obtain novel strains of N. oceanica with potential for industrial cultivation by selecting mutants with improved growth and/or increased lipid content. Selected mutants were cultivated both in lab scale (10 mL and 800 mL) cultivation systems and indoor 220-liter pilot-scale reactors. The mutants were characterized and compared to wild type N. oceanica based on growth performance as well as the nutritional quality of the biomass with focus on amino acid composition, fatty acids, vitamin D, vitamin K precursors and nutrient bioaccessibility.
2. Materials and Methods
2.1. UV-Mutagenesis
For this study, we used a culture of the marine microalgae Nannochloropsis oceanica (NORCCA 2/03) obtained from the Norwegian Culture Collection of Algae (Oslo, Norway). Prior to use, single colonies were picked from agar plates and cleaned using established protocols (Raus, 2016).
To generate mutants, liquid cultures of N. oceanica in linear growth was diluted to an optical density (OD750) of 1.0, measured using an Eppendorf BioSpectrometer (Eppendorf, Hamburg, Germany), and applied to petri-dishes in a thin layer. Petri dishes were irradiated at 254 nm using an energy intensity of 70.000 µJ·cm-2 using a Hoefer UVC 500 UV Crosslinker (Thermo Fisher Scientific, Waltham, MA, US) at 13 cm distance from the UV-source.
To prevent photo-repair the plates were placed in darkness for 24h at 23 °C. After dark incubation 100 µL of the irradiated culture suspensions were plated on agar plates sealed with Parafilm and placed at constant illumination (100 µmol·m-2·s-1) at 23 ˚C until colonies appeared (3-4 weeks).
2.2. Cultivation Media
All cultivations carried out in this study used Nutribloom Plus nutrient media (Necton, Olhão, Portugal) undiluted stock comprising 2M NaNO3, 100 mM KH2PO4, 1 mM ZnCl2, 1 mM ZnSO4, 1 mM MnCl, 0.1 mM Na2MoO4, 0.1 mM CoCl, 0.1 mM CuSO4, 26.4 mM EDTA, 2 mM MgSO4, 20 mM FeCl3, 35 mM Thiamin, 5 mg/L Biotin, 3 mg/L Cobalamin (Gao et al., 2020). A salt mix (Instant Ocean, Aquarium Systems, Sarrebourg, France), was applied to mimic marine conditions at 3% w/v concentration. Lab-scale cultivations were buffered using 20 mM HEPES-buffer adjusted to pH 7.5. For agar plates, media was supplemented with 1.2% w/v agar (VWR, Radnor, PE, US).
For all lab scale cultivations, the saltwater medium (without Nutribloom Plus) was autoclaved at 121 °C for 20 min. Nutribloom Plus was filter sterilized (0.2 µm cellulose acetate filter) and added to the autoclaved media at 4 mL·L-1. For the pilot scale PBR cultivations, Nutribloom Plus was added during cultivation (described in more detail under the PBR cultivation section).
2.3. Cell DEG Cultivations
The growth of the selected mutant strains was evaluated in small-scale laboratory cultivations using a CellDEG system (CellDEG, Berlin, Germany). Cultures were inoculated with a preculture in linear growth diluted to an OD750 of 0.1 and with a final cultivation volume of 10 mL in each growth chamber. Cultivations were carried out for 9-11 days with sampling approx. every 2 days. The CellDEG buffer vessel contained 1.5 M KHCO3 with 1.5 M K2CO3 to generate a CO2 concentration of 4.5% inside the growth chambers. All CellDEG cultivations were carried out in triplicates at 23 ˚C with constant illumination.
2.4. GLS80 Bottle Reactor
Medium-scale laboratory cultivations were carried out using 1 L GLS80 stirred bottle reactors (Duran, Duisburg, Germany)(Appendix Fig. A1). Precultures and main cultures (800 mL) were grown inside a Fitoclima 600 growth chamber (Aralab, Rio de Mouro, Portugal) set to 23 or 27 °C (Appendix Fig. A1). Pre-cultures were used to inoculate main cultures to a starting OD750 of 0.2. Cultures were sparged with 100 mL·min-1 air enriched with 1% CO2 and continuous white light (approx. 360 µmol·m-2·s-1) applied using T8 LED tubes (Systion Electronics, Palvilhão, Portugal). Light intensity was measured on the outside of the bottle (center of bottom) using a Universal Light Meter ULM-500 (Heinz Walz GmbH, Effeltrich, Germany). Precultures were cultivated until reaching a cell density sufficient for inoculating the main experimental units.
Culture OD was monitored every second day by absorbance measurements at 750 nm (OD750) using a Jenway 7205 UV/VIS spectrophotometer (Cole-Parmer, Vernon Hills, IL, USA). All cultures were stopped and harvested at OD750 6-7.
2.5. Pilot-Scale Cultivations
Strains were cultivated in technical duplicates in parallel in identical indoor tubular airlift photobioreactors (Appendix Fig. A2), constructed following a layout similar to the one described by Thoisen et al. (2020). Flow was generated in the photobioreactors by injecting compressed air at the bottom of each reactor adjusted to a constant flow of 40 L air min-1 with the inlet air passing through a filter (0.3 µm polypropylene). Cultivations were initiated by inoculating the reactors with seed culture in linear growth to an of OD750 of 0.1 on day 0. Cultivation settings were 24 h of illumination at 240 µmol·m-2·s-1 at ambient temperature. The pH of the cultures was adjusted to 7.5 +/- 0.1 by injecting pure CO2 from a cylinder into the inlet air when the pH-value increased above 7.6. Optical density (OD750) and dry matter content was measured approx. every second day during 18 d of cultivation. Cultivations were conducted in two stages: after the first week of cultivation, 75 liters (approx. 1/3 of total culture volume) were harvested from each reactor by centrifugation (H1), the reactors were replenished with 75 L fresh media and the cultivation continued for another 11 days. At the initiation of the cultivation Nutribloom plus was added at a concentration of 4 ml· L-1. During the cultivation period additional Nuribloom Plus was supplied to the two reactors when nitrogen content dropped below 11 mg NO3·L-1 measured using nitrate-sticks (MQuant, Merck, Germany). After a total of 18 days of cultivation the entire volume of the two photobioreactors was harvested (H2).
2.6. Whole Cell Absorption Spectra
Whole cell absorption spectra were measured for strains cultivated at 10 mL scale using a light intensity of 200 µmol·m-2·s-1. Prior to measurement, 1.5 mL culture was pelleted by centrifugation at 5,000 rpm for 5 min. The pellet formed was gently washed twice with 1.5 mL sterile deionized water. Washed cell suspensions were diluted to an OD750 of 1.0 and absorbance spectra measured between 400 nm to 700 nm using an Ultrospec 4000 (Pharmacia Biotech, Stockholm Sweden), measuring every 0.5 nm with a scan speed of 2200 nm/min.
2.7. Growth Measurements
To evaluate and compare the biomass productivity of the different cultures, growth from the lab-scale and pilot-scale cultivations was monitored every 2-3 days based on optical density at 750 nm (OD750) and dry matter (DM) content as described by Perin et al. (2015).
The volumetric biomass productivity (g DM·L-1·day-1) was calculated as follows
Volumetric biomass productivity = (B2-B1)/T
B2 and B1 are the dry matter content where B1 is the initial biomass density and B2 the final biomass density in a cultivation period of T days.
A single biomass productivity was calculated for the lab-scale cultivations whereas two biomass productivities were calculated for the pilot scale cultivations: one for the first week of cultivation before the first biomass harvest, and a second for the last 11 days of cultivation (period between harvest 1 and harvest 2).
2.8. Post-Cultivation UVB Treatment to Stimulate Vitamin D3 Production in Lab Scale
UVB treatment was performed at the end of 0.8 L lab-scale cultivations. Culture samples were adjusted to an OD750 of 0.6 in 300 mL using fresh media and transferred to 500 mL glass beakers (sides covered with aluminum foil). UVB treatment corresponding to a vitamin D3-active dose of 9.6 J·m-2 (Ložnjak Švarc et al., 2022) was carried out for 1 h with stirring (150 rpm). UVB exposure was delivered from the top using two 120 cm UVB fluorescent light tubes (UVB-313 40W, Q-Lab Corp., Westlake, OH, USA) covered with 2 mm UVB-transparent plexiglass at 10 cm distance. Treatments were performed once per culture.
2.9. Biomass Harvesting and Drying
Biomass produced at 800 mL laboratory scale was harvested by centrifugation at 7000 × g for 15 min at 5 °C. Pellets were resuspended in 0.5 M NH4HCO2 and centrifuged at 7,000 × g for 15 min at 5 °C. Pellets were resuspended in 10 mL deionized H2O and frozen at −80 °C. Frozen samples were then freeze-dried for 48 h at 0.5 mbar at room temperature using a Scanvac Coolsafe –55 freeze dryer (Labogene, Allerød, Denmark). Freeze-dried biomass was pulverized using a porcelain mortar and transferred to airtight containers. All powder samples were stored in the dark at −20 °C.
Biomass produced at pilot scale was harvested twice during cultivation: after 7 days and after 18 days designated H1 and H2, respectively. Biomass was harvested using a Z41 high-speed tubular centrifuge at 18,000 x g (Cepa, Lahr, Germany). The wet biomass paste was mixed thoroughly by manual kneading and divided into aliquots. Afterwards the biomass was frozen at − 80 °C and freeze dried for 48 hours at 0.5 mbar at room temperature using a Scanvac Coolsafe –55 freeze dryer (Labogene, Allerød, Denmark). Freeze-dried biomass samples were pulverized in a coffee grinder and transferred to airtight containers, stored in the dark at − 20 °C.
2.10. Pigment Composition
Pigments were extracted from freeze-dried biomass suspended in milli-Q water to an OD750 of 10 using chloroform:methanol (2:1 v/v), added glass beads and vortexed for 2 min. Hexane and 5 M NaCl were added to the samples in a 1:1:1 volume ratio. The samples were then vortexed 30 s and centrifuged for 1 min at 500 × g. Extracted pigments were transferred from the top hexane layer into a fresh vial and evaporated under nitrogen (N2). Pigments were redissolved in 90% MeOH with 5 mg·L-1 Beta-apo-8′-carotenal as internal standard and filtered through a 96-well polyvinylidene fluoride membrane (PVDF) filter plate with 0.2 μm pore size (Agilent, 203980-100).
Pigment extracts were analyzed using an Ultimate 3000 UHPLC+ Focused system (Dionex Corporation, Sunnyvale, CA, USA) coupled to a Bruker Compact ESI-QTOF-MS (Bruker, Billerica, MA, USA) system, using the method based on (Bijttebier et al., 2014). Samples were separated on a ACQUITY UPLC HSS C18 SB Column, (100Å, 1.8 µm, 2.1 mm x 100 mm; Phenomenex Inc., Torrance, USA) at a constant temperature of 40 °C and a flow rate of 0.5 ml·min-1. Injected volume was 5 μL. Mobile phase consisted of A: 50:22.5:22.5:5 water, 5 mM ammonium acetate:methanol:acetonitrile:ethyl acetate and B: 50:50 acetonitrile:ethyl acetate. LC used: 0–0.1 min, 10% B; 0.1– 0.8 min, 10–30% B; 0.8–20 min, 30%–91% B; 20-20.1 min, 91%–100% B; 20.1-20.4 min isocratic 100%; 20.4–20.5 min 100%–10% B; 20.5–23 min, isocratic 10%. Positive mode ionization was used for acquisition of the mass spectra over a scan range of m/z 100–900 and 2 Hz sample rate. The settings for MS and electrospray ionization (ESI) were: Capillary voltage, 4000 V; end plate offset, 500 V; dry gas temperature, 220 °C; dry gas flow, 8 L·min-1; nebulizer pressure, 2 bar; in source CID energy, 0 eV; hexapole RF, 50 Vpp; quadrupole ion energy, 4 eV; collision cell energy, 7 eV. Raw mass spectral data was calibrated using an internal sodium formate standard. Data analysis was done with DataAnalysis 4.3 (Bruker, Billerica, MA, USA) and Sigmaplot 14 (Systat Software Inc, CA, USA). Pigments were quantified by peak area of each pigment measured at UVC absorption at 445 nm. Quantification was done by normalizing to the peak area of Beta-apo-8′-carotenal. Relative quantification was normalized to pigment level in the control strain. Identity of all carotenoids mentioned was confirmed by authentic standards acquired from DHI, Hørsholm, DK.
2.11. Amino Acid Composition Analysis
Dried biomass (40 mg) was hydrolyzed with 1 mL 6 M HCl at 110 °C for 18 h. The hydrolysate was filtered, neutralized with 1.5 mL 0.2 M KOH, and mixed with 1.6 mL 100 mM ammonium formate (pH 3.1). Samples were analyzed on an Agilent 1100 LC-MS system (Agilent technologies, Santa Clara, CA, US) using a 100 x 2.1 mm Biozen Glycan 2.6 µM column (Phenomenex, Torrance, CA, US). An isocratic gradient was used consisting of 10 mM ammonium formate in water at 0.5 mL·min-1 with a column temperature of 40 °C and sample injection volume of 1 µL. A set of calibration samples and external standards were run together with the processed microalgal samples. In total 16 amino acids were quantified. The analysis was carried out in technical triplicates allowing a maximum difference of 15% between replicates, and the average used as the result.
2.12. Lipid Content Determination
Lipid extraction followed the Bligh and Dyer (B&D) method (1959) with a reduced solvent volume. Approximately 1 g of dried microalgal biomass was used for extraction. First, 30 mL methanol was added to the biomass, followed by 2 x 15 mL chloroform, and finally 15 mL deionized water. After each addition of chloroform and the final addition of water, the mixture was subjected to intensive mixing for 30 s using an ULTRA-TURRAX® (15.,000 rpm). The samples were then centrifuged at 1400 × g for 10 minutes to separate the lipid-containing chloroform phase. The total lipid content was determined by evaporating chloroform from 15 g of this extract in a fume hood overnight and weighing the remaining lipids.
2.13. Fatty Acid Composition Analysis
Fatty acid composition was determined directly on B&D extracts through conversion of fatty acids to fatty acid methyl esters (FAMEs) and subsequent quantification by GC-FID. B&D extracts equal to 50 mg total lipids were transferred to methylation tubes. To each tube 100 µL internal standard (2% w/v C23:0 in n-heptane) and 1 mL 0.5 M methanolic NaOH was added, followed by 5 min in a 100 °C water bath. Then, 1.5 mL boron trifluoride (BF3) was added, followed by another 5 min in a 100 °C water bath. Finally, 5 mL saturated NaCl and 2.5 mL n-heptane with 0.01% butylhydroxytoluene (BHT) was added and mixed vigorously by hand. The upper (heptane) phase containing FAMEs was transferred into GC vials and analyzed by gas chromatography coupled to flame ionization detector (GC-FID) (HP-5890 A, Agilent Technologies, Santa Clara, CA, USA). Separation was performed using an Agilent DB wax 127-7012 (10 m × 100 μm × 0.1 μm) GC column (Agilent Technologies, Santa Clara, CA, USA). A linear gradient temperature program was applied (ramp rate 10.6 °C·min-1, start 160 °C, 0.3 min at 200 °C, 4.0 min at 220 °C, 3.8 min at 240 °C), running a combined 15.65 min per analysis. A standard mixture of fatty acids methyl esters (Sigma, St. Louis, MO, USA) was used for fatty acid identification. In total 39 fatty acids were identified. Fatty acids were quantified using the internal standard (C23:0) using conversion factors from AOCS official method (Ce 1i-07). The analysis was performed in technical triplicates with a maximum allowed difference of 10% between replicates, and the average used as a result.
2.14. Analysis of Vitamin D
Analysis of vitamin D was performed as previously reported by Švarc et al. (Ložnjak Švarc et al., 2022). Freeze-dried samples (approx. 40 mg) were weighed into 50 mL centrifuge tubes and mixed with 0.2 g sodium ascorbate, 100 µL 80 ng·mL-1 -[23,24,25,26,27-13C5] -labelled vitamin D3 (900234, Sigma-Aldrich, Burlington, MA, US), 9 mL 96% ethanol, and 3 mL of 60% KOH. Atmospheric air was replaced with nitrogen and the samples saponified overnight (approx. 18 h) at 60 °C with constant rotation in a Reax 2 overhead shaker (Heidolph, Scwabach, Germany). Subsequently, 13 mL Milli-Q water and 10 mL 20% ethyl acetate in n-heptane were added to each sample and the organic phase transferred to new centrifuge tubes. The extraction was repeated two times with an additional 10 mL of 20% ethyl acetate in n-heptane added each time. The combined organic phases were washed with 20 mL of Milli-Q water, transferred to new tubes, and concentrated using an RVC 2-33 CDplus vacuum concentrator (Christ, Osterode, Germany) for 90 min. The samples were redissolved in acetonitrile with 0.1% formic acid and purified using a HybridSPE-phospholipid column (Supelco, Bellefonte, Pennsylvania, USA). The eluent was evaporated under nitrogen (TurboVap LV, Biotage, Uppsala, SE) and the dried extract derivatized in the dark with 250 µL of 0.75 mg·mL-1 PTAD in anhydrous acetonitrile. Lastly, 75 µL Milli-Q water was added to each sample and the samples were centrifuged at 10,000 × g for 10 minutes. The supernatant was transferred to HPLC vials and analyzed using UHPLC-MS/MS on an Agilent 1290 Infinity II UHPLC coupled to an Agilent 6470 triple quadrupole mass spectrometer (Agilent Technologies, Santa Clara, CA, USA). The system was equipped with an Ascentis® Express C18 column (10 cm × 2.1 mm, 2 μm) and a guard column (Supelco, Bellafonte, PA, USA) combined with a gradient mobile phase of water/methanol including 2.5 mM. The analysis was performed in duplicates showing a coefficient of variation at 5%.
2.15. Bead Milling to Disrupt Cell Membranes
Freeze-dried biomass from replicate cultures of the final harvest from pilot-scale cultivation was mixed 50:50. The mixture was then suspended to 20 g·L-1 in phosphate buffered saline (PBS), pH 7.5 and left to rehydrate overnight (~20 h) with stirring (150 rpm) at 5 °C in the dark.Bead milling was carried out using a Dyno-Mill Research Lab (WAB AG, Muttenz, Switzerland) The bead mill was operated in recirculation mode with an integrated cooling jacket and a cooling spiral in the feed funnel to keep the suspensions below 25 °C. In all runs, 180 mL of biomass solution were processed for 2.5 min using an agitator speed of 12 m·s-1 with 0.3 mm zirconium beads at a milling chamber filling percentage of 65% (v/v).
2.16. Determination of Cell Disruption Efficiency
Biomass suspensions were sampled before and after bead milling and analyzed using a CytoFlex flow cytometer (Beckman Coulter, Brea, CA, US). Samples were diluted to reach fewer than 3000 events·s−1 using PBS buffer (pH 7.5). A fixed 50,000 events were measured using a flow rate of 35 μL·min−1 and a forward scattering channel threshold of 10,000. The maximum allowed abort-rate was 0.5% for all samples. Forward scattering (FSC), side scattering (SSC) and chlorophyll autofluorescence at 690 nm (FL690) were monitored in parallel. Using the non-disrupted solution as starting point, the main population of cells was gated manually using combined FSC-FL690. Degree of disruption was determined as events·μL-1 within this gated area before (FL690ND) and after milling (FL690D) according to following equation:
2.17. In Vitro Digestion
In vitro bioaccessibility of vitamin K was assessed for biomass produced at pilot-scale, before and after bead milling, using the INFOGEST 2.0—vit K protocol (Jensen et al., 2022), a modified version of the standardized INFOGEST 2.0 method (Brodkorb et al., 2019). This adaptation is optimized for fat-soluble compounds by promoting micelle formation—achieved by administering a standard meal alongside the test sample, as previously described by Jensen et al. (2022) .
Briefly, 0.2 g of freeze-dried biomass, 0.2 g of MQ water, and 0.6 g of the standard meal (Jensen et al. 2022) were combined in a single tube and subjected sequentially to the oral, gastric, and intestinal phases at 37 °C, as described in Brodkorb et al., 2019. Following digestion, samples were centrifuged at 5,500 × g for 30 min at 37 °C. Vitamin K was then analyzed in the micellar fraction using the method described below. The amount of vitamin K available for absorption (mA) and the amount initially present in the microalgal biomass (mW) were used to calculate bioaccessibility (B%) using the following Equation:
The in vitro digestion was performed three times on the mixed biomass used for bead milling and once on each bead milling replicate. The average was used as the result.
2.18. Analysis of Vitamin K for Digestion Experiments
Vitamin K was analyzed as previously described by Jensen et al. (2021), using samples of approximately 10 mg freeze-dried biomass or 1 mL of digestate. In both cases, 125 ng deuterium labelled (d7) of phylloquinone (PK) and menaquinone 4 (MK-4), menaquinone 7 (MK-7), and menaquinone 9 (MK-9) (IsoScience LLC, Ambler, PA, USA) as internal standards. Vitamin K vitamers were identified and quantified as described in Jensen et al. (2021), using a UHPLC-MS/MS system comprising an Agilent 1290 Infinity II coupled to an Agilent 6470 triple quadrupole mass spectrometer (Agilent Technologies, Santa Clara, CA, US) equipped with an Ascentis® Express C18 column (10 cm × 2.1 mm, 2 µm) with an integrated guard column (Supelco, Bellafonte, PA, US). The precision of MK-4 assessed using a house-reference sample (also N. oceanica) was 21.7 µg·g-1 ± 4.2% (eight replicates). The analysis was performed in triplicate on the mixed biomass samples from pilot scale production, and as a single determination on the micellar phase of the INFOGEST 2.0—vitamin K samples. The average value presented as the result.
2.19. Statistical Analysis
Data analysis was performed using GraphPad Prism (San Diego, CA, US) and Statgraphics 18 (Statgraphics Technologies Inc., The Plains, VA, USA). One-way analysis of variance (ANOVA) was used to determine significant differences between individual cultivations/samples. A p-value of less than 0.05 was considered statistically significant. Subsequently, Tukey’s HSD post hoc test was used to detect any significant differences between individual groups, again with p-values below 0.05 considered. Statistical analyses were performed when there were more than two replicates. significant.
3. Results
3.1. UV-Mutagenesis, Mutant Selection and Mutation Stability
To generate random mutations in a wild type strain of N. oceanica, cells were irradiated with UV-light for up to 60 seconds with subsequent cultivation on agar plates (Figure 1A). After 3-4 weeks of incubation 259 colonies were selected by visual screening, choosing colonies larger and/or paler than the wild type (Figure 1A). Optimal irradiation time in this study was 12-15 seconds, which provided an even distribution of colonies on the agar plate including colonies paler or larger than wild type colonies.
We 2020. After a second round of plate screening (Figure 1B) four mutants (M32, M181, M255 and M259) were chosen for further characterization based on stability of traits identified in the initial screen. Table 1 gives an overview of the selected mutants and their visual traits.
To test the stability of the UV-induced mutations, multiple rounds of alternating solid and liquid cultivation were performed to attain multiple generations of the selected mutants. Mutant M255 showed declining growth during these cultivations and was discarded from further characterization. The dependence of growth and pigmentation on light intensity was tested by pipetting drops of 20 µL of each strain to agar plates in triplicates and placing one plate at 200 µmol·m-2·s-1 and another at 500 µmol·m-2·s-1 constant illumination. From this we found pigmentation in mutant M181 highly dependent on light intensity, turning lime green at 200 and white at 500 µmol·m-2·s-1 (Figure 2). The remaining strains showed yellowing pigmentation at high light intensities with M259 showing the most yellowing. The change of pigmentation of mutant M181 at high light intensity is likely caused by photobleaching whereas the yellowing of M34 and M259 and WT could be a result of reduced chlorophyll content and increased content of photoprotective carotenoids.
3.2. Whole Cell Absorption Spectra
Next, we examined the pigment composition of selected mutants. We initially compared the mutants to wild type by taking whole-cell absorption spectra of strains cultivated at 200 µmol·m-2·s-1. The spectra clearly showed M181 to have reduced chlorophyll content relative to the other strains, evident from reduced absorption peaks at about 445nm and 680nm (Figure 3).
3.3. CellDEG Cultivations
After the initial selection, the growth and biomass production of the mutants M34, M181 and M259 was compared to WT in different photobioreactor systems at laboratory scale. We first performed small-scale (10 mL) cultivations for 9-11 days using the CellDEG system under 2 different constant light regimes: A) 200 µmol·m-2·s-1, and B) 500 µmol·m-2·s-1. Mutant M34 grew faster than WT and had the highest and most stable biomass productivity of about 0.3 g·L-1·d-1 under both light regimes (Figure 4A and B). Mutant M181 grew similarly to the WT under light regime A (Figure 4C), but showed little growth under high light intensity, indicating that cultivation of this mutant requires low illumination or to be inoculated at a higher starting OD750.
3.4. Medium-Scale Laboratory Cultivation
Following the small-scale cultivations, strains were grown at a medium-scale using 1-liter GLS80 bottle reactors to compare growth performance as well as contents of amino acids, fatty acids and vitamin D after UVB exposure. During this experiment the M259 mutant cultures repeatedly stopped growing in its pre-cultivation, which led us to exclude this mutant from further characterization. Growth at medium scale was similar for WT and M34, reaching the target OD750 (6.0-7.0) in the same number of days. M181 grew significantly slower, reaching the target OD approximately 2 days later (Figure 5A). The daily dry matter productivity for M181 (0.09 g DM·L-1·day-1) was also significantly lower compared to wildtype N. oceanica (0.12 g DM·L-1·day-1). However, in contrast to the CellDEG cultivations, M34 had significantly lower biomass productivity (0.10 g DM·L-1·day-1) compared to the WT strain (Figure 5B).
For comparison of vitamin D3 accumulation, cultures were grown in an identical setup except cultivation temperature was lowered to 23 °C, which has previously been shown to stimulate vitamin D3 production (Gundersen et al., 2026b). Growth under these conditions followed the same trend as observed at 27 °C (data not shown). Comparison of amino acid and fatty acid content was performed after cultivation at 27 °C. No statistically significant differences (p < 0.05) were found in the content of total amino acid (TAA), essential amino acid (EAA), total fatty acid (TFA), and eicosapentaenoic acid (EPA) between strains (Table 2). The average vitamin D3 content was 27-30% higher in M181 compared to M34 and WT produced in round 2 (Table 2), though the difference was not statistically significant (p > 0.05).
3.5. Pilot Scale Cultivations
Cultivations in 220 L airlift photobioreactors (PBR) (Appendix Fig. A2) were conducted to investigate if results obtained at laboratory scale were translatable to pilot scale cultivation, and to obtain sufficient biomass for further characterization of the three algae strains. The airlift PBR used in this study is in many ways like the CellDEG systems applied in laboratory scale cultivations. The upward flow created by the air/CO2 inlet provides efficient and gentle mixing, creating waves inside the reactor. This ensures continuous movement of the algae culture and provides good light exposure and CO2 utilization enabling algae cultivation at high biomass densities like the CellDEG system.
Growth curves and cultivation parameters for the pilot scale cultivations were performed in duplicate for each strain and showed high technical repeatability (Figure 6). Similar to the cultivation performed at 1 L scale in GLS80 bottle reactors, WT grew faster than both mutants in the pilot scale cultivations (Figure 6 and Figure 7 A and B). During the first 7 days of cultivation (before harvest 1) the biomass productivity of the WT was significantly higher than for M181 and for the last 11 days of cultivation significantly higher than both mutants (Figure 7). During cultivation of M34, two unintended events occurred that impacted on the cultivation conditions: after 3 days of cultivation, there was a power cut causing the airflow and CO2 supply to stop for several hours, leading to an increase in pH to almost 9.5. Later, the CO2 flask ran out of CO2, and the reactors did not receive CO2 until next day (Figure 6 C).
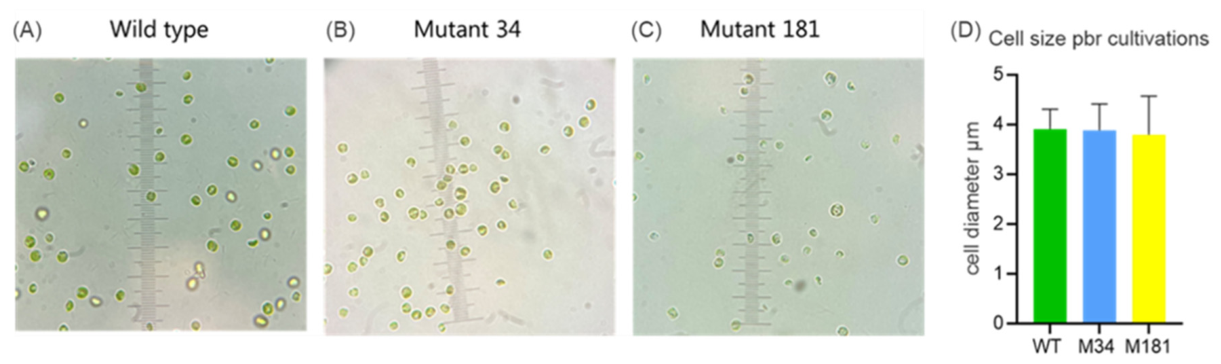
After each PBR cultivation the algae cultures were examined via light microscopy to ensure no contamination of cultures had occurred during 18 days of cultivation (Appendix Fig. A4A-C). No other microalgae were found during the visual inspection, and the morphology and cell size (Appendix Fig. A4D) confirmed the identity of the algal cultures as N. oceanica. In Table 3 the proximate biomass composition of biomass harvested from three algal strains (WT, M34, and M181), cultivated at pilot scale and collected at two different harvest time points.
3.6. Pigment Composition
Pigments were identified and quantified relative to WT (Figure 8A, B), and the results support the initial indication from the whole cell absorption spectra that M181 has a significantly reduced chlorophyll a-content relative to WT. For M34 the content of the three xanthophylls: violaxanthin, dinoaxanthin and vaucheriaxanthin-3-acetate-19octanoate are significantly reduced relative to the WT whereas the astaxanthin-content in M34 is higher compared to the WT.
To investigate if the lipid content and composition of biomass from M34 and M181 was significantly different from the WT, the lipid content and fatty acid profiles of all strains were analyzed after pilot scale cultivations. Total lipid content in the harvested biomass was between 18-25% of dry matter with significantly higher lipid content (25% of DM) in the second harvest of M181 compared to the WT strain (17% of DM) (Table 3). The EPA content of the extracted lipid was in the range of 0.050-0.075 g EPA·g-1 lipid, and the total content of fatty acids in the lipid was in the range of 0.300–0.350 g·g-1 lipid, corresponding to 6-8% of the total dry matter (data not shown).
3.7. Analysis of Amino Acid Composition
Strains were analyzed to determine the potential nutritional value as the sum of amino acids and the percentage of essential amino acids. The amino acid content of the biomass harvested on day 7 (harvest 1 or H1) and day 18 (harvest 2 or H2) were very similar for all three microalgal strains, with amino acids comprising 40-45% of the dry matter content (Table 3). The content of essential amino acids (EAA) was similar, varying between 42-45% (data not shown). The biomass of M181 from harvest 2 had the highest average EAA content, but the differences between the three strains and biomasses from both harvests were not statistically significant.
3.8. Analysis of Bioaccessibility and Effect of Cell Disruption
The bioacessibility of intracellular nutrients was assessed for the different strains by submitting biomass produced at pilot scale to an in vitro digestion assay, focusing on vitamin K2 (MK-4) (Table 4). Resilience towards mechanical cell disruption was also evaluated by subjecting resuspensions of the same biomass to partial cell disruption by bead milling. The degree of cell disruption was measured, together with the bioaccessibility of MK-4, before and after bead milling. The bioaccessibility of MK-4 in the non-disrupted biomass ranged from 14.7-21.1% for WT and M181,repectively, with M181 displaying a significantly higher biomass (p < 0.05) compare to WT and M34 (Table 4).The bead milling treatment resulted in 50.4% disrupted cells for the wildtype strain, in accordance with results from our previous N. oceanica bead milling study (Gundersen et al., 2026b). The treatment resulted in 48.2% and 47.6% disrupted cells for M34 and M181, respectively, but with no significant differences compared to WT. After bead milling the average bioaccessibility of MK-4 increased by 18.4%, 18.0%, and 23.9% for WT, M34, and M181, respectively, though the difference in improved bioaccessibility was only statistically significant for the WT (p < 0.05) (Table 4).
4. Discussion
This study aimed at breeding novel strains of Nannochloropsis oceanica using a simple workflow that combines UV-induced mutagenesis with visual screening to obtain mutants with increased productivity for biomass and lipid content during photobioreactor growth.
Since most commercial microalgae are cultivated in large outdoor facilities, the breeding of novel industrial strains must be non-GMO, making methods that introduce foreign DNA unsuitable for outdoor cultivation. Therefore, classical random mutagenesis tools, which are not considered GMO in the EU (EFSA Panel on Genetically Modified Organisms (GMO) et al., 2021), are currently the only viable approach for novel strain generation.
4.1. UV-Mutagenesis and Mutation Stability
The optimal UV-radiation conditions using our setup allowed us to generate mutants with visible changes without killing all the cells. Mutant selection was based on visual screening, picking out colonies larger and/or paler than the average. We assessed the stability of the four most promising mutant strains (M34, M181, M255, and M259) through multiple rounds of liquid and solid (plate) cultivations, which led to elimination of one mutant strain (M255) due to declining growth. Selection of pale N. oceanica mutants generated by random mutagenesis has previously proven a suitable selection criterion to obtain strains with increased lipid content (Perin et al., 2015). Furthermore, chlorophyll-deficient microalgae are desirable for food production as they confer improved consumer acceptance (Olsen et al., 2024). However, complete abolishment of chlorophyll content is unattainable for obligatory photoautotrophs like N. oceanica and only applicable for microalgae capable of heterotrophic growth (Jian et al., 2024). Nonetheless, reduced pigmentation may still pose advantages for obligate phototrophs as reduced shading can be a major advantage to increase biomass productivities in dense monocultures (Perin and Morosinotto, 2023).
4.2. Pigment Composition Profiles
The pigment profile for M34 revealed a decrease in carotenoid content in this mutant, though unexpectedly the effect did not negatively impact growth at high light intensities. Violaxanthin was found to be significantly reduced in M34 compared to WT, which may indicate that the phenotype is related to differences in light adaptation. Under high light conditions, violaxanthin is normally converted to zeaxanthin as a protective mechanism during the xanthophyll cycle as part of non-photochemical quenching mechanisms (NPQ). Notably, disrupting the conversion of violaxanthin to zeaxanthin in N. gaditana cause severe growth defects at higher light intensities, whereas overexpression of zeaxanthin epoxidase (ZEP) improves growth at these light conditions (Perin et al., 2023). Note, however, that ZEP overexpression was not associated with alterations in violaxanthin content, whereas another NPQ mutant deficient in a key light-harvesting protein showed reduced violaxanthin content but unaltered growth at high light intensity. Further investigation is required to determine whether the altered growth at high light intensity is due to changes in light adaptation or simply reduced shading at increased culture densities.
4.3. Biomass Productivity: Laboratory vs Pilot Scale Cultivation
In the present study we assessed several mutant strains’ performance both at lab and pilot scale. In general, biomass productivities for all mutant stains correlate well with what is reported for N. oceanica in other studies at both laboratory and pilot scale cultivations (Gundersen et al., 2024; Guerra et al., 2021).
Initial CellDEG cultivations confirmed the expected phenotypes after selection from colony appearances: M34 showed faster growth, and M181 had a lighter color and M259 grew fast and with reduced pigmentation (Figure 2 and Figure 3). The biomass productivity of M34 was particularly higher than the WT strain when cultivated at high light intensity (500 µmol·m-2·s-1) whereas at low light intensity (200 µmol·m-2·s-1) growth was similar to the WT. Growth at medium lab scale and 220 L pilot scale did not reflect the results obtained for mutant M34 in the CellDEG cultivations. Instead, WT biomass productivity was 20-40% higher than for M34 under these culture conditions. Since the light intensities applied in these cultivations were 360 and 240 µmol·m-2·s-1, respectively, we expect that growth improvements of mutant M34 are only achievable at higher light intensity. The growth characteristics of M34 are generally in line with other mutants with truncated light harvesting antennae, which limits the capture of excess light preventing damage from reactive oxygen species, but show reduced growth at lower light intensities (Kumar et al., 2021b).
The highly pale M181 mutant had strongly reduced chlorophyll content relative to WT, with the result that growth was severely compromised, demonstrating that achieving effects from pigment-deficient strains that are net positive on growth requires striking a fine balance.
4.4. Biomass Composition
At medium lab scale (800 mL bottle cultures) there was no apparent difference in the overall content of amino acids and fatty acids in biomass from the three analyzed strains. The content of the valuable omega-3 fatty acid EPA also remained stable in the range of 18-20 mg·g-1 DM for the three strains. This overall level, corresponding to 1.8–2.0% of DM, is slightly lower than previously reported values for EPA in N. oceanica biomass produced under similar nitrogen-replete conditions (Chen et al., 2013; Gundersen et al., 2024, 2026b; Sá et al., 2020). Although not statistically significant, the vitamin D3 content after UVB exposure was approximately 30% higher for mutant M181. As the vitamin D3 precursor, 7-dehydrocholesterol (7-DHC), is also a central part of the cholesterol pathway in N. oceanica (Sañé et al., 2023), this could suggest an alteration in the sterol biosynthesis of M181. Alternatively, or in combination, the increased conversion from 7-DHC to vitamin D3 may also be a result of the reduced chlorophyll content in M181. As chlorophyll is capable of absorbing UVB radiation, leading to chlorophyll bleaching (Zvezdanović et al., 2009), a reduced content could improve the likelihood of the applied UVB reaching 7-DHC within the cells. Development of less pigmented strains may therefore also be desirable for the UV-based production of vitamin D3 in N. oceanica.
At pilot scale (220 L), we found M181 to have increased lipid content and reduced growth relative to the wild type. These characteristics mimic the effects of nitrogen depletion in wild type strains (Fakhry and El Maghraby, 2015) and could suggest mutations in genes for nitrogen assimilation as responsible for the phenotype observed in M181. However, we found protein content of M181 to be the same or slightly higher than that of the wild type (Table 3), which indicates that compromised nitrogen uptake is unlikely, since efficient protein synthesis relies on nitrogen assimilation.
4.5. Nutrient Bioaccessibility
The Nannochloropsis genus, including N. oceanica, is known for its resilient cell wall and the overall limited accessibility of intracellular nutrients in whole-cell biomass (Demarco et al., 2022). In this study, the bioaccessibility of MK-4 in whole-cell biomass from the WT strain was approx. 15%. This is in line with our previous study that showed a MK-4 bioaccessibility of 11% for biomass processed in an identical manner (Gundersen et al., 2026b). The MK-4 bioaccessibility of mutant M181 (approx. 21%) was significantly higher than both WT and M34. The underlying mechanism remains untested but could indicate that the cell wall composition or structure of M181 was affected by the UV-based mutagenesis. However, this did not translate into increased susceptibility to bead milling where the level of disruption was similar for the three testes strains. The applied bead milling treatment had a positive effect on all strains, improving MK-4 bioaccessibility by 13-17%. This increase is consistent with earlier studies that have shown a positive effect of cell disruption on the bioaccessibility of different lipid-soluble compounds in species of Nannochloropsis (Bernaerts et al., 2020; Gundersen et al., 2026a). For example, Bernaerts et al. (2020) saw a 1.4-2.0 fold increase in the in vitro bioaccessibility of β-carotene when subjecting resuspensions of lyophilized Nannochloropsis sp. biomass to partial cell disruption by high pressure homogenization (HPH). Despite an improvement in the bioaccessibility of MK-4 after bead milling, the overall level observed in this study is still relatively low compared to other types of food. For example, in eggs the bioaccessibility of MK-4 was found to be 102 ± 8% when analyzed using the same in vitro digestibility method (Jensen et al., 2022). We have previously observed that cell disruption by bead milling only results in minor improvements of the in vitro bioacessibility of vitamin K and EPA in N. oceanica (Gundersen et al., 2026b). As discussed in this previous study, this might be related to structural properties of the lyophilized biomass used in the in vitro digestion model. It is possible that the disrupted biomass generates more compact and coherent powder particles, which mask the full effect of the disruption process at a cellular level. Nevertheless, the results of the current study stress the need for further expansion and optimization of the cell disruption procedure. Alternatively, improved bioacessibility/digestibility could also be achieved through more targeted genetic alterations. This was recently accomplished by Matsui et al. (2026), generating a cellulose synthase (CESA) knockout strain with a thinner and deteriorated cell wall structure. Integrating these two approaches, targeted genetic manipulation and optimized cell disruption, could help achieve a higher nutritional value of whole cell N. oceanica biomass (Gundersen et al., 2026a). In general, combining optimization of both upstream- and downstream processes is key to unlocking the full potential of microalgal production within food applications.
5. Conclusions
In this study we generated novel strains of the marine microalga Nannochloropsis oceanica using UV-radiation and visual screening, which showed improved biomass productivity at high light intensity and increased lipid content.
One mutant, M34, demonstrated significantly higher biomass productivity than the wild type under high light intensity (≥ 500 µmol·m-2·s-1), indicating its potential for industrial cultivation in outdoor photobioreactors utilizing sunlight that easily exceeds 1000 µmol·m-2·s-1. Mutant, M181, showed increased lipid content at pilot scale but also reduced growth, traits that together suggest mutations in lipid and chlorophyll biosynthesis. This mutant also demonstrated enhanced production of vitamin D3 and higher bioaccessibility of MK-4, which from a nutritional perspective compensates partially for the reduced biomass productivity. Collectively, our findings highlight the potential of UV-radiation with visual screening as a viable and scalable method to generate N. oceanica strains with desirable traits for industrial applications.
Our study also highlights the importance of cultivation conditions when assessing strain performance. This is crucial to consider when breeding novel microalgae intended for industrial production, as results obtained under highly controlled and low-density lab-scale conditions may not scale reliable to larger production systems.
Future research should focus on optimization of lab scale cultivation conditions to better reflect conditions encountered at larger scales, which would make the process of screening for suitable phenotypes in the lab more productive.
Author Contributions
Conceptualization, M.L.O. and P.E.J.; methodology, M.L.O., P.E.J., E.G., D.P.-H., J.J., LB; validation, M.L.O., D.P.-H., J.A.-R., and P.E.J.; formal analysis, M.L.O., D.P.-H., LB, and E.G; investigation, M.L.O., E.G., J.S.P. and D.P.-H.; resources, P.E.J., C.J., J.S.P. and J.A.-R.; writing—original draft preparation, M.L.O.; writing—review and editing, P.E.J., D.P.-H., S.M.; C.J., LB and E.G.; supervision, P.E.J., J.J. and C.J.; project administration, M.L.O. and P.E.J.; funding acquisition, P.E.J., C.J. and J.A.-R; correspondence, P.E.J.
Funding
The work presented herein was part of the MASSPROVIT project, funded by the Independent Research Fund Denmark, grant number 1127-00261B (M.L.O., E.G., C.J., P.E.J.). Pigment analysis by D.P.-H funded by Novo Nordisk Foundation grant NNF21OC0070602. J.A.-R. and S.M. was funded by Novo Nordisk foundation grant NNF20OC0061048 and NNF25OC0100606, respectively.
Institutional Review Board Statement
Not applicable.
Informed Consent Statement
Not applicable.
Data Availability Statement
The raw data supporting the conclusions of this article will be made available by the authors on request.
Conflicts of Interest
The authors declare no conflicts of interest.
Appendix A
Figure A1.
Medium-scale laboratory cultivations were carried out using 1 L GLS80 stirred bottle reactors.
Figure A1.
Medium-scale laboratory cultivations were carried out using 1 L GLS80 stirred bottle reactors.
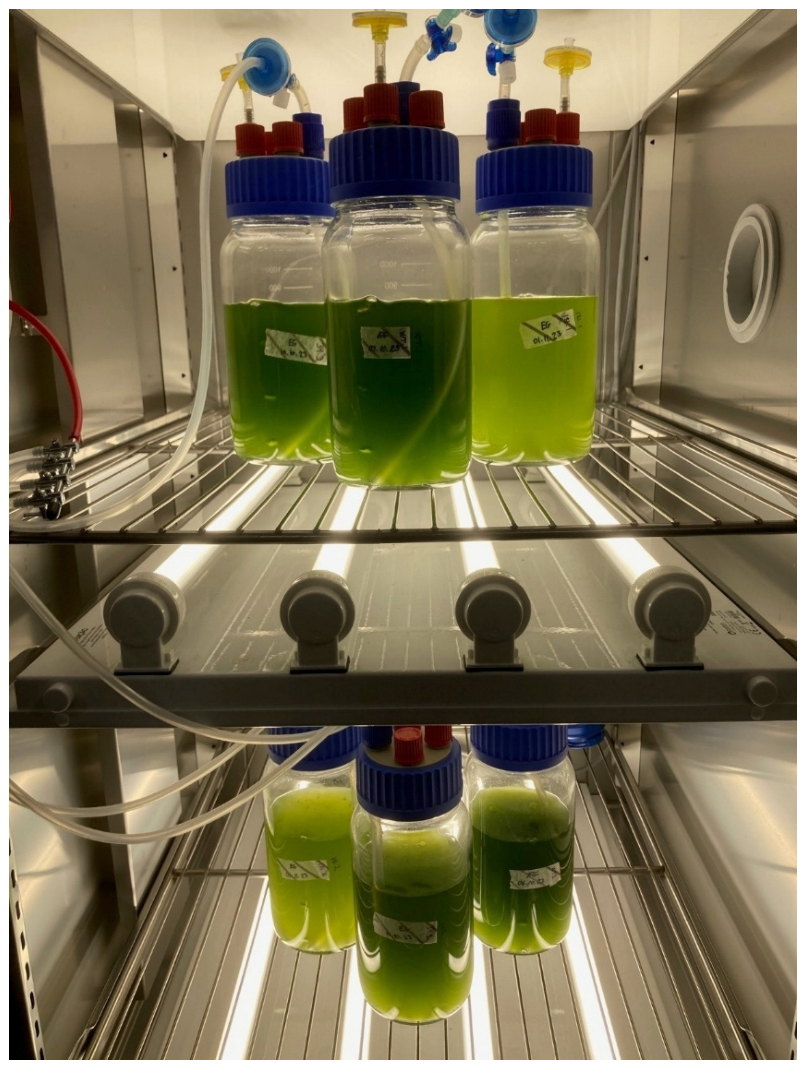
Figure A2.
The two identical tubular air lift photobioreactors applied for the pilot-scale cultivations of the WT, M34 and M181 in duplicates. Each reactor contains 220 L culture incl. 20 L culture volume in the mixing tanks. The reactors are illuminated by 5 vertical LED panels at a light intensity of 240 µmol·m2·s-1. (A) the reactors few days after inoculation. (B) after a total 18-day cultivation before the final harvest (H2). Shown here: cultivation of M34.
Figure A2.
The two identical tubular air lift photobioreactors applied for the pilot-scale cultivations of the WT, M34 and M181 in duplicates. Each reactor contains 220 L culture incl. 20 L culture volume in the mixing tanks. The reactors are illuminated by 5 vertical LED panels at a light intensity of 240 µmol·m2·s-1. (A) the reactors few days after inoculation. (B) after a total 18-day cultivation before the final harvest (H2). Shown here: cultivation of M34.
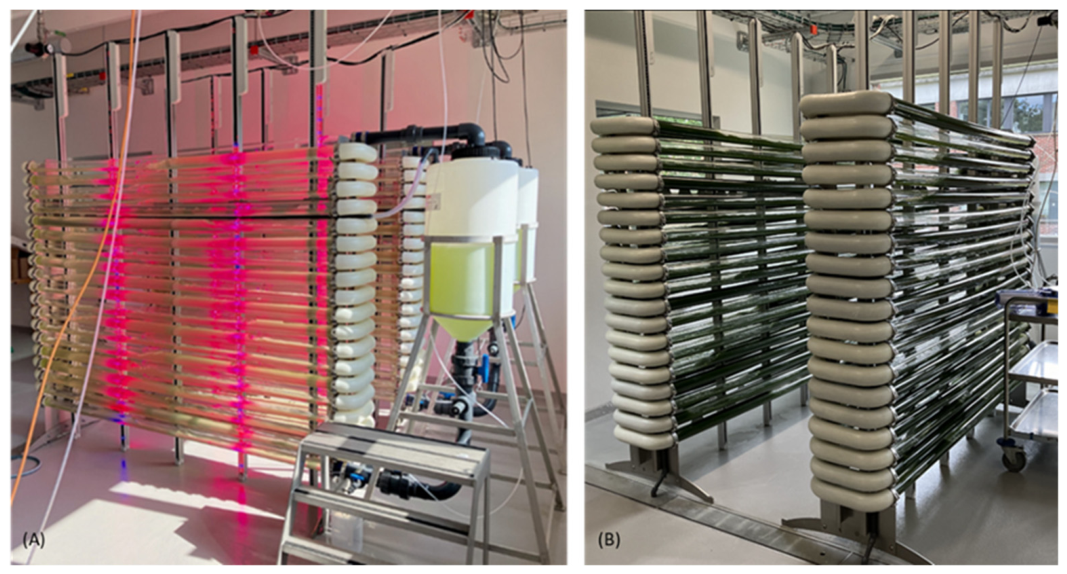
Figure A3.
The ash content of the biomass samples was 5.8-9.5% of the dry matter content determined in Figure 7A. The lowest ash content was measured in M181 (H2), whereas the highest content was found in the WT biomass from the final harvest (H2).
Figure A3.
The ash content of the biomass samples was 5.8-9.5% of the dry matter content determined in Figure 7A. The lowest ash content was measured in M181 (H2), whereas the highest content was found in the WT biomass from the final harvest (H2).
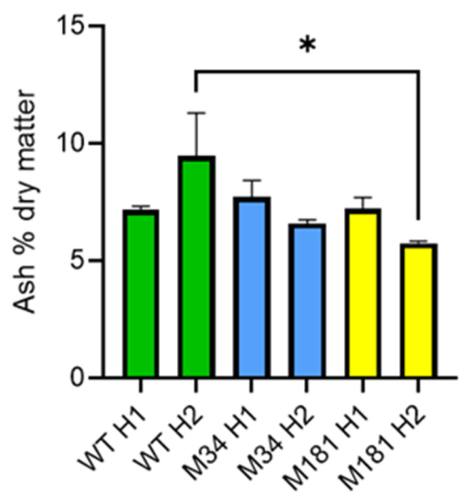
Figure A4.
(A-C): Visual inspection of cultures after 18 days of cultivation in airlift PBR. Light microscopy 400x magnification. (D) Based on the micrographs; the average cell diameter was found by measuring the diameter of 25 cells for each culture of the three cultures at the final day of pilot-scale cultivation.
Figure A4.
(A-C): Visual inspection of cultures after 18 days of cultivation in airlift PBR. Light microscopy 400x magnification. (D) Based on the micrographs; the average cell diameter was found by measuring the diameter of 25 cells for each culture of the three cultures at the final day of pilot-scale cultivation.
References
- Barbosa, M.J.; Janssen, M.; Südfeld, C.; D’Adamo, S.; Wijffels, R.H. Hypes, hopes, and the way forward for microalgal biotechnology. Trends in Biotechnology S0167779922003456 2023. [Google Scholar] [CrossRef] [PubMed]
- Beacham, T.A.; Macia, V.M.; Rooks, P.; White, D.A.; Ali, S.T. Altered lipid accumulation in Nannochloropsis salina CCAP849/3 following EMS and UV induced mutagenesis. Biotechnology Reports 2015, 7, 87–94. [Google Scholar] [CrossRef] [PubMed]
- Bernaerts, T.M.M.; Verstreken, H.; Dejonghe, C.; Gheysen, L.; Foubert, I.; Grauwet, T.; Van Loey, A.M. Cell disruption of Nannochloropsis sp. improves in vitro bioaccessibility of carotenoids and ω3-LC-PUFA. Journal of Functional Foods 2020a, 65, 103770. [Google Scholar] [CrossRef]
- Bijttebier, S.; D’Hondt, E.; Noten, B.; Hermans, N.; Apers, S.; Voorspoels, S. Ultra high performance liquid chromatography versus high performance liquid chromatography: Stationary phase selectivity for generic carotenoid screening. Journal of Chromatography A 2014, 1332, 46–56. [Google Scholar] [CrossRef] [PubMed]
- Brodkorb, A.; Egger, L.; Alminger, M.; Alvito, P.; Assunção, R.; Ballance, S.; Bohn, T.; Bourlieu-Lacanal, C.; Boutrou, R.; Carrière, F.; Clemente, A.; Corredig, M.; Dupont, D.; Dufour, C.; Edwards, C.; Golding, M.; Karakaya, S.; Kirkhus, B.; Le Feunteun, S.; Lesmes, U.; Macierzanka, A.; Mackie, A.R.; Martins, C.; Marze, S.; McClements, D.J.; Ménard, O.; Minekus, M.; Portmann, R.; Santos, C.N.; Souchon, I.; Singh, R.P.; Vegarud, G.E.; Wickham, M.S.J.; Weitschies, W.; Recio, I. INFOGEST static in vitro simulation of gastrointestinal food digestion. Nat Protoc 2019, 14, 991–1014. [Google Scholar] [CrossRef] [PubMed]
- Canelli, G.; Tevere, S.; Jaquenod, L.; Dionisi, F.; Rohfritsch, Z.; Bolten, C.J.; Neutsch, L.; Mathys, A. A novel strategy to simultaneously enhance bioaccessible lipids and antioxidants in hetero/mixotrophic Chlorella vulgaris as functional ingredient. Bioresource Technology 2022, 347, 126744. [Google Scholar] [CrossRef] [PubMed]
- Canini, D.; Martini, F.; Cazzaniga, S.; Miotti, T.; Pacenza, B.; D’Adamo, S.; Ballottari, M. Genetic engineering of Nannochloropsis oceanica to produce canthaxanthin and ketocarotenoids. Microb Cell Fact 2024, 23, 322. [Google Scholar] [CrossRef] [PubMed]
- Cavonius, L.R.; Albers, E.; Undeland, I. In vitro bioaccessibility of proteins and lipids of pH-shift processed Nannochloropsis oculata microalga. Food Funct. 2016, 7, 2016–2024. [Google Scholar] [CrossRef] [PubMed]
- Cecchin, M.; Berteotti, S.; Paltrinieri, S.; Vigliante, I.; Iadarola, B.; Giovannone, B.; Maffei, M.E.; Delledonne, M.; Ballottari, M. Improved lipid productivity in Nannochloropsis gaditana in nitrogen-replete conditions by selection of pale green mutants. Biotechnol Biofuels 2020, 13, 78. [Google Scholar] [CrossRef] [PubMed]
- Cecchin, M.; Marcolungo, L.; Rossato, M.; Girolomoni, L.; Cosentino, E.; Cuine, S.; Li-Beisson, Y.; Delledonne, M.; Ballottari, M. Chlorella vulgaris genome assembly and annotation reveals the molecular basis for metabolic acclimation to high light conditions. The Plant Journal 2019, 100, 1289–1305. [Google Scholar] [CrossRef] [PubMed]
- Chen, C.-Y.; Chen, Y.-C.; Huang, H.-C.; Huang, C.-C.; Lee, W.-L.; Chang, J.-S. Engineering strategies for enhancing the production of eicosapentaenoic acid (EPA) from an isolated microalga Nannochloropsis oceanica CY2. Bioresource Technology 2013, 147, 160–167. [Google Scholar] [CrossRef] [PubMed]
- Dall’Osto, L.; Bassi, R.; Ruban, A. Photoprotective Mechanisms: Carotenoids. In Plastid Biology; Theg, S.M., Wollman, F.-A., Eds.; Springer New York: New York, NY, 2014; pp. 393–435. [Google Scholar] [CrossRef]
- Demarco, M.; Oliveira de Moraes, J.; Matos, Â.P.; Derner, R.B.; de Farias Neves, F.; Tribuzi, G. Digestibility, bioaccessibility and bioactivity of compounds from algae. Trends in Food Science & Technology 2022, 121, 114–128. [Google Scholar] [CrossRef]
- EFSA Panel on Genetically Modified Organisms (GMO); Mullins, E.; Bresson, J.; Dalmay, T.; Dewhurst, I.C.; Epstein, M.M.; Firbank, L.G.; Guerche, P.; Hejatko, J.; Moreno, F.J.; Naegeli, H.; Nogué, F.; Sánchez Serrano, J.J.; Savoini, G.; Veromann, E.; Veronesi, F.; Casacuberta, J.; Lenzi, P.; Munoz Guajardo, I.; Raffaello, T.; Rostoks, N. In vivo and in vitro random mutagenesis techniques in plants. EFS2 19 2021. [Google Scholar] [CrossRef] [PubMed]
- Fakhry, E.M.; El Maghraby, D.M. Lipid accumulation in response to nitrogen limitation and variation of temperature in Nannochloropsis salina. Bot Stud 2015, 56, 6. [Google Scholar] [CrossRef] [PubMed]
- Fernández, F.G.A.; Reis, A.; Wijffels, R.H.; Barbosa, M.; Verdelho, V.; Llamas, B. The role of microalgae in the bioeconomy. New Biotechnology 2021, 61, 99–107. [Google Scholar] [CrossRef] [PubMed]
- Gao, F.; Teles (Cabanelas, Itd), I.; Wijffels, R.H.; Barbosa, M.J. Process optimization of fucoxanthin production with Tisochrysis lutea. Bioresource Technology 2020, 315, 123894. [Google Scholar] [CrossRef] [PubMed]
- Gille, A.; Trautmann, A.; Posten, C.; Briviba, K. Bioaccessibility of carotenoids from Chlorella vulgaris and Chlamydomonas reinhardtii. International Journal of Food Sciences and Nutrition 2016, 67, 507–513. [Google Scholar] [CrossRef] [PubMed]
- Guerra, I.; Pereira, H.; Costa, M.; Silva, J.T.; Santos, T.; Varela, J.; Mateus, M.; Silva, J. Operation Regimes: A Comparison Based on Nannochloropsis oceanica Biomass and Lipid Productivity. Energies 2021, 14, 1542. [Google Scholar] [CrossRef]
- Gundersen, E.; Jacobsen, C. Cultivation of Nannochloropsis oceanica using food grade industrial side streams: Effect on growth and relative abundance of selected amino acids and unsaturated fatty acids. Journal of Biotechnology 2025, 405, 249–253. [Google Scholar] [CrossRef] [PubMed]
- Gundersen, E.; Jakobsen, J.; Holdt, S.L.; Jacobsen, C. Nannochloropsis oceanica as a Source of Bioactive Compounds: Mapping the Effects of Cultivation Conditions on Biomass Productivity and Composition Using Response Surface Methodology. Marine Drugs 2024, 22, 505. [Google Scholar] [CrossRef] [PubMed]
- Gundersen, E.; Kazbar, A.; Boboescu, I.Z.; Kempen, P.; Holdt, S.L.; Jakobsen, J.; Barbosa, M.; Jacobsen, C. Cell disruption of microalga Nannochloropsis oceanica using bead milling: Effect on recovery, composition, and bioaccessibility of partially disrupted biomass. Algal Research 2026a, 93, 104469. [Google Scholar] [CrossRef]
- Gundersen, E.; Samadi, T.; Munk, A.M.H.F.; Holdt, S.L.; Jakobsen, J.; Jacobsen, C. Production of vitamin D3 in Nannochloropsis oceanica by post-cultivation UVB exposure: Effect of dose, culture density, and cultivation conditions. Algal Research 2026e, 93, 104464. [Google Scholar] [CrossRef]
- Guo, L.; Liang, S.; Zhang, Z.; Liu, H.; Wang, S.; Pan, K.; Xu, J.; Ren, X.; Pei, S.; Yang, G. Genome assembly of Nannochloropsis oceanica provides evidence of host nucleus overthrow by the symbiont nucleus during speciation. Commun Biol 2019a, 2, 249. [Google Scholar] [CrossRef] [PubMed]
- Hu, J.; Meng, W.; Su, Y.; Qian, C.; Fu, W. Emerging technologies for advancing microalgal photosynthesis and metabolism toward sustainable production. Front. Mar. Sci. 2023, 10, 1260709. [Google Scholar] [CrossRef]
- Jakobsen, J.; Smith, C.; Bysted, A.; Cashman, K.D. Vitamin D in Wild and Farmed Atlantic Salmon (Salmo Salar)—What Do We Know? Nutrients 2019, 11, 982. [Google Scholar] [CrossRef] [PubMed]
- Jensen, M.B.; Biltoft-Jensen, A.P.; Jakobsen, J. In vitro bioaccessibility of vitamin K (phylloquinone and menaquinones) in food and supplements assessed by INFOGEST 2.0—vit K. Current Research in Food Science 2022, 5, 306–312. [Google Scholar] [CrossRef] [PubMed]
- Jensen, M.B.; Ložnjak Švarc, P.; Jakobsen, J. Vitamin K (phylloquinone and menaquinones) in foods—Optimisation of extraction, clean-up and LC–ESI-MS/MS method for quantification. Food Chemistry 2021, 345, 128835. [Google Scholar] [CrossRef] [PubMed]
- Jian, J.; Torres-Montero, P.; Bai, M.; Lu, Y.; Simonsen, H.T. Genome analysis of Chlorella vulgaris (CCAP 211/12) mutants provided insight into the molecular basis of chlorophyll deficiency. Algal Research 2024, 78, 103426. [Google Scholar] [CrossRef]
- Karageorgou, D.; Rova, U.; Christakopoulos, P.; Katapodis, P.; Matsakas, L.; Patel, A. Benefits of supplementation with microbial omega-3 fatty acids on human health and the current market scenario for fish-free omega-3 fatty acid. Trends in Food Science & Technology 2023, 136, 169–180. [Google Scholar] [CrossRef]
- Khamila, S.; D’Adamo, S.; Eppink, M.H.M.; Wijffels, R.H.; Boboescu, I.Z. Structural and biochemical characterization of Nannochloropsis oceanica IMET1 cell wall and its implications for enzyme-assisted extraction. Algal Research 2025, 90, 104119. [Google Scholar] [CrossRef]
- Kumar, V.; Sharma, N.; Jaiswal, K.K.; Vlaskin, M.S.; Nanda, M.; Tripathi, M.K.; Kumar, S. Microalgae with a truncated light-harvesting antenna to maximize photosynthetic efficiency and biomass productivity: Recent advances and current challenges. Process Biochemistry 2021a, 104, 83–91. [Google Scholar] [CrossRef]
- Ljubic, A.; Holdt, S.L.; Jakobsen, J.; Bysted, A.; Jacobsen, C. Fatty acids, carotenoids, and tocopherols from microalgae: targeting the accumulation by manipulating the light during growth. J Appl Phycol 2021, 33, 2783–2793. [Google Scholar] [CrossRef]
- Ljubic, A.; Jacobsen, C.; Holdt, S.L.; Jakobsen, J. Microalgae Nannochloropsis oceanica as a future new natural source of vitamin D3. Food Chemistry 2020, 320, 126627. [Google Scholar] [CrossRef] [PubMed]
- Ložnjak Švarc, P.; Rahimi, M.; Tønnesen, J.; Corell, D.D.; Petersen, P.M.; Hyldig, G.; Jakobsen, J. Bio-Fortified Pork Cracklings with UVB LED Tailored Content of Vitamin D3. Foods 2022, 11, 726. [Google Scholar] [CrossRef] [PubMed]
- Lyu, J.; Gao, R.; Guo, Z. Galactosyldiacylglycerols: From a Photosynthesis-Associated Apparatus to Structure-Defined In Vitro Assembling. J. Agric. Food Chem. 2021, 69, 8910–8928. [Google Scholar] [CrossRef] [PubMed]
- Ma, Y.; Wang, Z.; Yu, C.; Yin, Y.; Zhou, G. Evaluation of the potential of 9 Nannochloropsis strains for biodiesel production. Bioresource Technology 2014, 167, 503–509. [Google Scholar] [CrossRef] [PubMed]
- Matsui, H.; Nagao, Y.; Sasaki, T.; Ishikawa, M.; Kotani, T.; Sugihara, S. A mutant microalga Nannochloropsis oceanica with deteriorated cell-wall structure: Growth-promoting effects and enzymatic digestibility in tropical and temperate strains of Brachionus plicatilis species complex (Rotifera). Aquaculture 2026, 623, 744125. [Google Scholar] [CrossRef]
- Mendes, M.; Navalho, S.; Ferreira, A.; Paulino, C.; Figueiredo, D.; Silva, D.; Gao, F.; Gama, F.; Bombo, G.; Jacinto, R.; Aveiro, S.; Schulze, P.; Gonçalves, A.T.; Pereira, H.; Gouveia, L.; Patarra, R.; Abreu, M.H.; Silva, J.; Navalho, J.; Varela, J.; Speranza, L. Algae as Food in Europe: An Overview of Species Diversity and Their Application. Foods 2022, 11, 1871. [Google Scholar] [CrossRef] [PubMed]
- Mendes, M.M.; Charlton, K.; Thakur, S.; Ribeiro, H.; Lanham-New, S.A. Future perspectives in addressing the global issue of vitamin D deficiency. Proc. Nutr. Soc. 2020, 79, 246–251. [Google Scholar] [CrossRef] [PubMed]
- Olsen, M.L.; Olsen, K.; Jensen, P.E. Consumer acceptance of microalgae as a novel food—Where are we now? And how to get further. Physiologia Plantarum 2024, 176, e14337. [Google Scholar] [CrossRef] [PubMed]
- Park, S.-B.; Yun, J.-H.; Ryu, A.J.; Yun, J.; Kim, J.W.; Lee, S.; Choi, S.; Cho, D.-H.; Choi, D.-Y.; Lee, Y.J.; Kim, H.-S. Development of a novel nannochloropsis strain with enhanced violaxanthin yield for large-scale production. Microb Cell Fact 2021, 20, 43. [Google Scholar] [CrossRef] [PubMed]
- Perin, G.; Bellan, A.; Michelberger, T.; Lyska, D.; Wakao, S.; Niyogi, K.K.; Morosinotto, T. Modulation of xanthophyll cycle impacts biomass productivity in the marine microalga Nannochloropsis. Proc. Natl. Acad. Sci. U.S.A. 2023, 120, e2214119120. [Google Scholar] [CrossRef] [PubMed]
- Perin, G.; Bellan, A.; Segalla, A.; Meneghesso, A.; Alboresi, A.; Morosinotto, T. Generation of random mutants to improve light-use efficiency of Nannochloropsis gaditana cultures for biofuel production. Biotechnol Biofuels 2015, 8, 161. [Google Scholar] [CrossRef] [PubMed]
- Perin, G.; Morosinotto, T. Understanding regulation in complex environments: a route to enhance photosynthetic light-reactions in microalgae photobioreactors. Front. Photobiol. 2023, 1, 1274525. [Google Scholar] [CrossRef]
- Pinnola, A.; Formighieri, C.; Bassi, R. Algae: A New Biomass Resource. In Encyclopedia of Sustainability Science and Technology; Meyers, R.A., Ed.; Springer New York: New York, NY, 2017; pp. 1–33. [Google Scholar] [CrossRef]
- Poliner, E.; Takeuchi, T.; Du, Z.-Y.; Benning, C.; Farré, E.M. Nontransgenic Marker-Free Gene Disruption by an Episomal CRISPR System in the Oleaginous Microalga, Nannochloropsis oceanica CCMP1779. ACS Synth. Biol. 2018, 7, 962–968. [Google Scholar] [CrossRef] [PubMed]
- Prasad, R.; Gupta, S.K.; Shabnam, N.; Oliveira, C.Y.B.; Nema, A.K.; Ansari, F.A.; Bux, F. Role of Microalgae in Global CO2 Sequestration: Physiological Mechanism, Recent Development, Challenges, and Future Prospective. Sustainability 2021, 13, 13061. [Google Scholar] [CrossRef]
- Raus, M. DECONTAMINATION OF Chlorella sp. CULTURE USING ANTIBIOTICS AND ANTIFUNGAL COCKTAIL TREATMENT. Journal of Engineering and Applied Sciences 2016, 11. [Google Scholar]
- Remize, M.; Brunel, Y.; Silva, J.L.; Berthon, J.-Y.; Filaire, E. Microalgae n-3 PUFAs Production and Use in Food and Feed Industries. Marine Drugs 2021, 19, 113. [Google Scholar] [CrossRef] [PubMed]
- Ruiz, J.; Olivieri, G.; de Vree, J.; Bosma, R.; Willems, P.; Reith, J.H.; Eppink, M.H.M.; Kleinegris, D.M.M.; Wijffels, R.H.; Barbosa, M.J. Towards industrial products from microalgae. Energy Environ. Sci. 2016, 9, 3036–3043. [Google Scholar] [CrossRef]
- Sá, M.; Ferrer-Ledo, N.; Wijffels, R.; Crespo, J.G.; Barbosa, M.; Galinha, C.F. Monitoring of eicosapentaenoic acid (EPA) production in the microalgae Nannochloropsis oceanica. Algal Research 2020, 45, 101766. [Google Scholar] [CrossRef]
- Safafar, H.; Hass, M.; Møller, P.; Holdt, S.; Jacobsen, C. High-EPA Biomass from Nannochloropsis salina Cultivated in a Flat-Panel Photo-Bioreactor on a Process Water-Enriched Growth Medium. Marine Drugs 2016, 14, 144. [Google Scholar] [CrossRef] [PubMed]
- Sañé, E.; Del Mondo, A.; Ambrosino, L.; Smerilli, A.; Sansone, C.; Brunet, C. The Recent Advanced in Microalgal Phytosterols: Bioactive Ingredients Along With Human-Health Driven Potential Applications. Food Reviews International 2023, 39, 1859–1878. [Google Scholar] [CrossRef]
- Scholz, M.J.; Weiss, T.L.; Jinkerson, R.E.; Jing, J.; Roth, R.; Goodenough, U.; Posewitz, M.C.; Gerken, H.G. Ultrastructure and Composition of the Nannochloropsis gaditana Cell Wall. Eukaryot Cell 2014, 13, 1450–1464. [Google Scholar] [CrossRef] [PubMed]
- Südfeld, C.; Hubáček, M.; Figueiredo, D.; Naduthodi, M.I.S.; Van Der Oost, J.; Wijffels, R.H.; Barbosa, M.J.; D’Adamo, S. High-throughput insertional mutagenesis reveals novel targets for enhancing lipid accumulation in Nannochloropsis oceanica. Metabolic Engineering 2021a, 66, 239–258. [Google Scholar] [CrossRef] [PubMed]
- Thoisen, C.; Pedersen, J.S.; Jørgensen, L.; Kuehn, A.; Hansen, B.W.; Nielsen, S.L. The effect of cell density on biomass and fatty acid productivity during cultivation of Rhodomonas salina in a tubular photobioreactor. Aquac Res 2020, 51, 3367–3375. [Google Scholar] [CrossRef]
- Trovão, M.; Schüler, L.M.; Machado, A.; Bombo, G.; Navalho, S.; Barros, A.; Pereira, H.; Silva, J.; Freitas, F.; Varela, J. Random Mutagenesis as a Promising Tool for Microalgal Strain Improvement towards Industrial Production. Marine Drugs 2022, 20, 440. [Google Scholar] [CrossRef] [PubMed]
- Wan Razali, W.A.; Evans, C.A.; Pandhal, J. Comparative Proteomics Reveals Evidence of Enhanced EPA Trafficking in a Mutant Strain of Nannochloropsis oculata. Front. Bioeng. Biotechnol. 2022, 10, 838445. [Google Scholar] [CrossRef] [PubMed]
- Zakaria, M.F.; Mat Zaidi, F.N.A.; Ahmad Kamal, A.H.; Aleng, N.A.; Abd Wahid, M.E.; Katayama, T.; Jusoh, M. PUFA from microalgae: Challenges, factors affecting high production and industrial application. Aquaculture and Fisheries. S2468550X25000048; 2025. [Google Scholar] [CrossRef]
- Zvezdanović, J.; Cvetić, T.; Veljović-Jovanović, S.; Marković, D. Chlorophyll bleaching by UV-irradiation in vitro and in situ: Absorption and fluorescence studies. Radiation Physics and Chemistry 2009, 78, 25–32. [Google Scholar] [CrossRef]
Figure 1.
Overview of the visual screening process after UV-radiation. A) the UV-treated cultures were plated on agar plates and after 3-4 weeks colonies that appeared larger and/or paler than the average were re-steaked on new plates. B) second round of visual selection of the putative mutants.
Figure 1.
Overview of the visual screening process after UV-radiation. A) the UV-treated cultures were plated on agar plates and after 3-4 weeks colonies that appeared larger and/or paler than the average were re-steaked on new plates. B) second round of visual selection of the putative mutants.
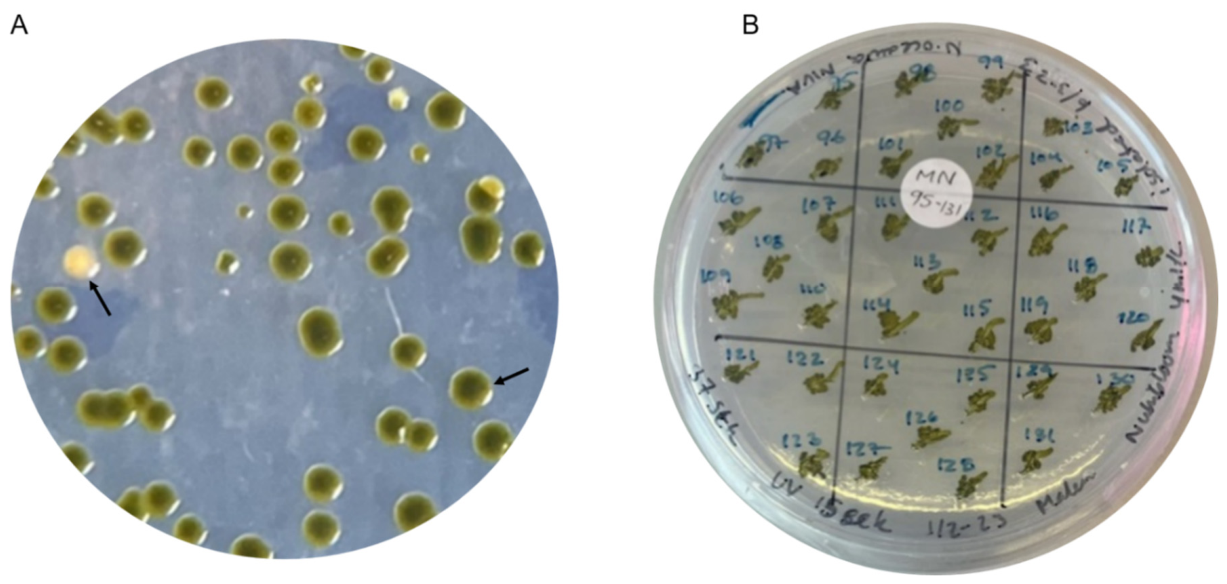
Figure 2.
Plates with N. oceanica WT, M34 (growth mutant), M181 (pigment mutant) and M259 (growth and pigment mutant). The two identical plates were incubated for 3 weeks at (A) 200 µmol·m-2·s-1 and (B) 500 µmol·m-2·s-1.
Figure 2.
Plates with N. oceanica WT, M34 (growth mutant), M181 (pigment mutant) and M259 (growth and pigment mutant). The two identical plates were incubated for 3 weeks at (A) 200 µmol·m-2·s-1 and (B) 500 µmol·m-2·s-1.
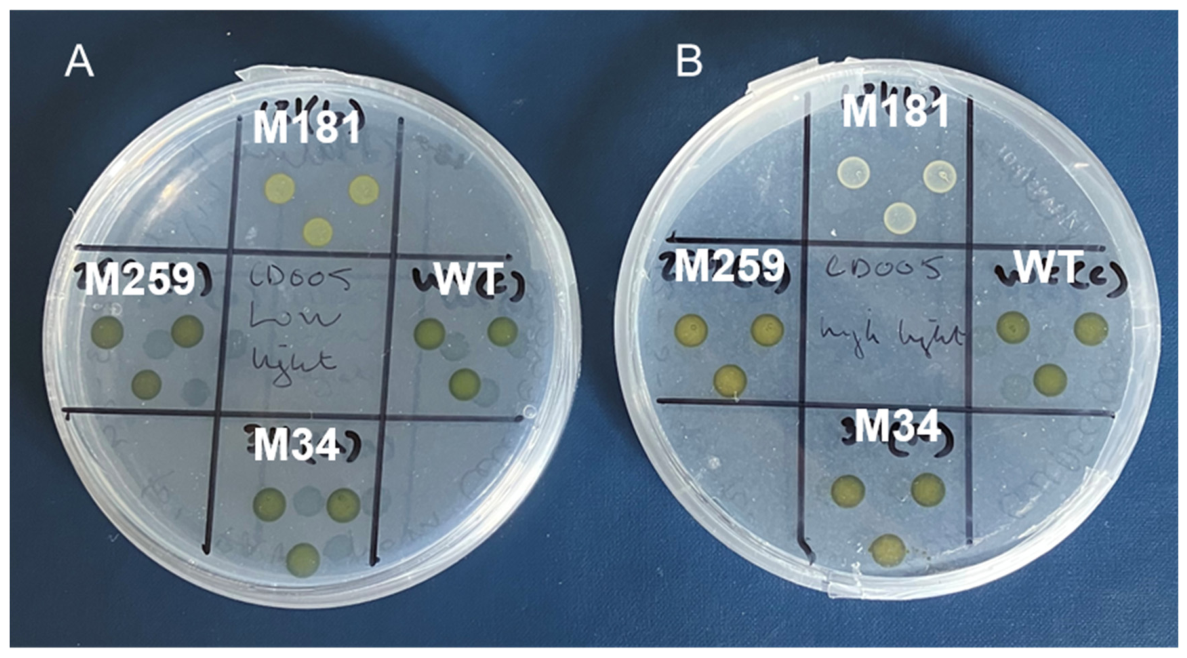
Figure 3.
Whole cell absorption spectra of WT, M34, M181 and M259 cultivated at a light intensity of 200 µmol·m-2·s-1. The density of the four cultures was normalized to an OD750 of 1.0.
Figure 3.
Whole cell absorption spectra of WT, M34, M181 and M259 cultivated at a light intensity of 200 µmol·m-2·s-1. The density of the four cultures was normalized to an OD750 of 1.0.
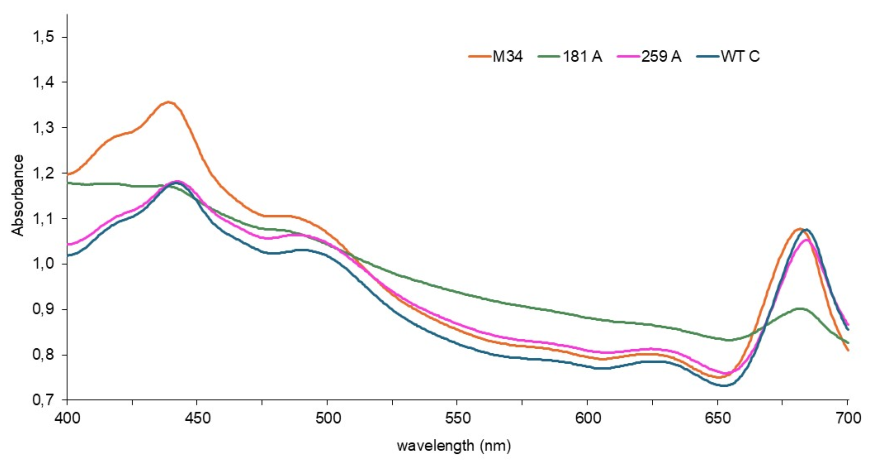
Figure 4.
Growth curves from CellDEG cultivations of (A) wild type (WT), (B) mutant M34, (C) M181 and (D) M259 at 4.5% CO2, and 200 and 400 µmol·m-2·s-1. Dashed lines represent cultivations at 200 µmol m−2 s−1, and solid lines represent cultivations at 200 µmol m−2 s−1. E) Daily biomass productivity (dry matter) for the four algae strains from the two CellDEG cultivations.
Figure 4.
Growth curves from CellDEG cultivations of (A) wild type (WT), (B) mutant M34, (C) M181 and (D) M259 at 4.5% CO2, and 200 and 400 µmol·m-2·s-1. Dashed lines represent cultivations at 200 µmol m−2 s−1, and solid lines represent cultivations at 200 µmol m−2 s−1. E) Daily biomass productivity (dry matter) for the four algae strains from the two CellDEG cultivations.
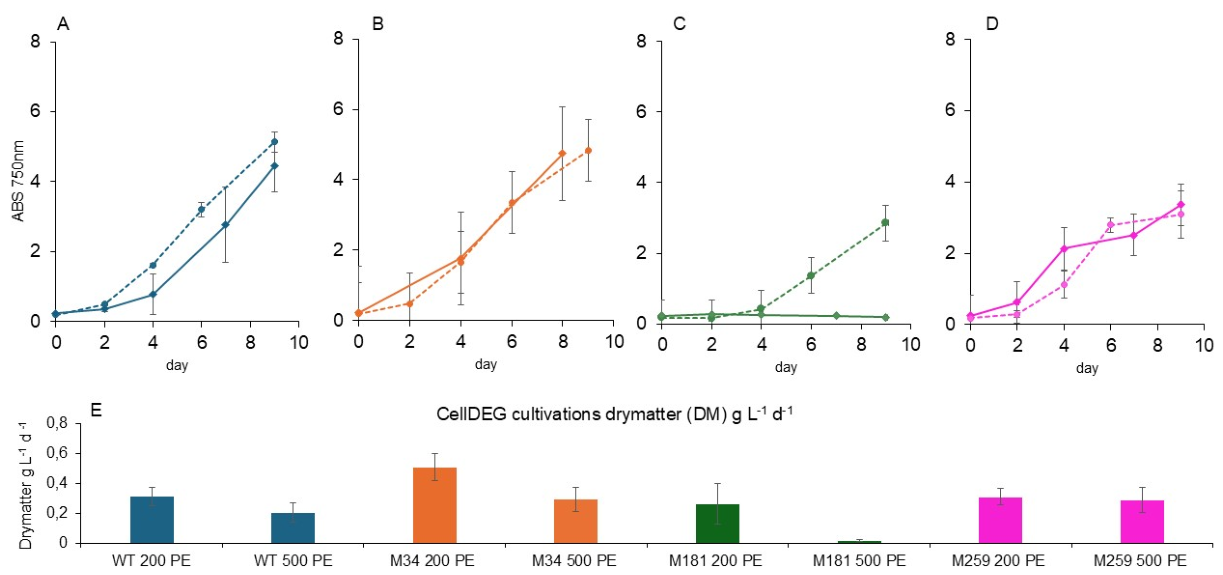
Figure 5.
GLS80 bottle cultivations at 27 °C, 360 µmol·m-2·s-1, and 3.0% salinity. A) Growth curves based on OD750 for N. oceanica WT and mutant 34 and 181. Dotted horizontal lines show the intended culture density harvesting range (6.0-7.0). B) Daily biomass productivity (g DM·L-1·day-1) for the different N. oceanica strains measured over the entire cultivation (from start to biomass harvest).
Figure 5.
GLS80 bottle cultivations at 27 °C, 360 µmol·m-2·s-1, and 3.0% salinity. A) Growth curves based on OD750 for N. oceanica WT and mutant 34 and 181. Dotted horizontal lines show the intended culture density harvesting range (6.0-7.0). B) Daily biomass productivity (g DM·L-1·day-1) for the different N. oceanica strains measured over the entire cultivation (from start to biomass harvest).
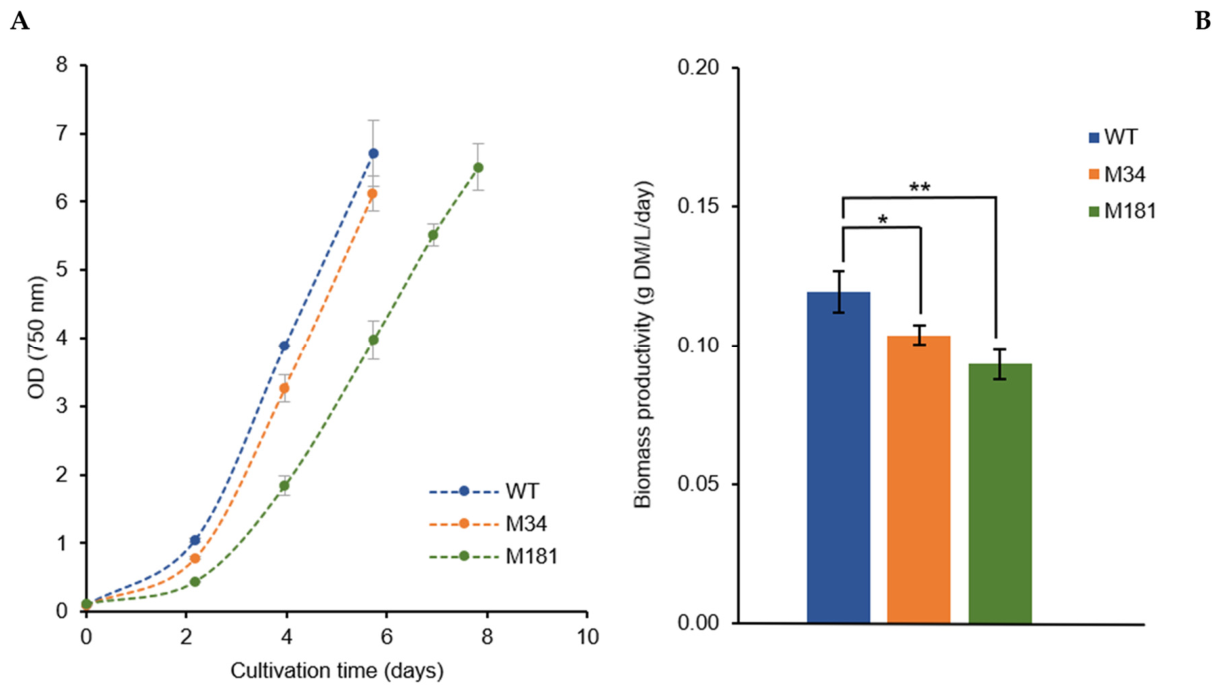
Figure 6.
Pilot scale cultivation of N. oceanica wildtype and the two mutants: M34 and M181 in 220 L tubular airlift photobioreactors for 18 days carried out in duplicates (reactor A and reactor B). A) Optical density (OD750nm), B) dry matter content g·L-1, C) average pH-value and D) average temperature inside the two reactors. The point for harvest 1 and harvest 2 are indicated by arrows.
Figure 6.
Pilot scale cultivation of N. oceanica wildtype and the two mutants: M34 and M181 in 220 L tubular airlift photobioreactors for 18 days carried out in duplicates (reactor A and reactor B). A) Optical density (OD750nm), B) dry matter content g·L-1, C) average pH-value and D) average temperature inside the two reactors. The point for harvest 1 and harvest 2 are indicated by arrows.
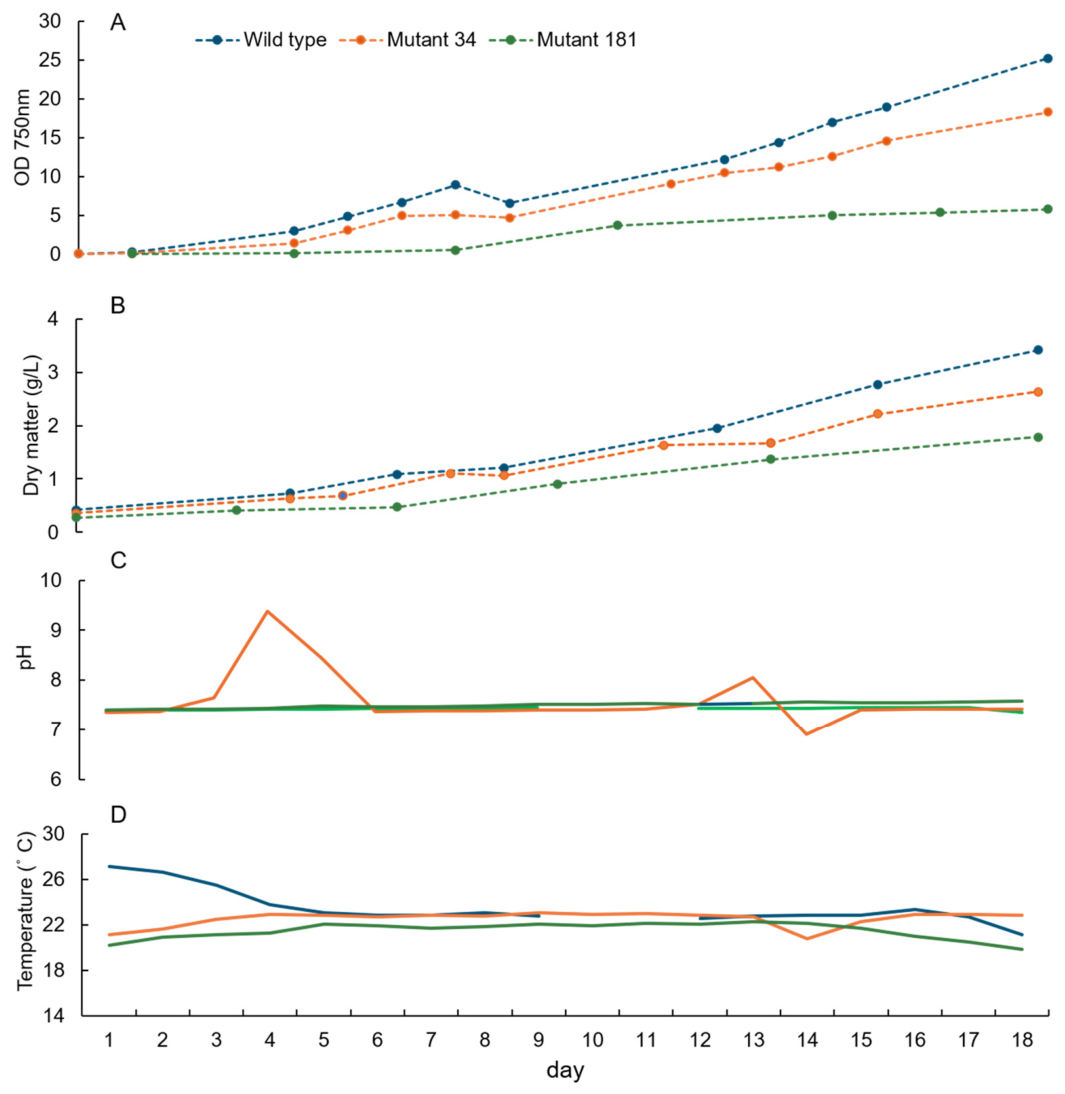
Figure 7.
Biomass productivity for pilot-scale cultivations of N. oceanica WT, and mutant M34 and M181. A) daily biomass productivity (dry matter) before the first harvest after a week of cultivation. B) the daily biomass productivity for the three strains the last 11 days of cultivation.
Figure 7.
Biomass productivity for pilot-scale cultivations of N. oceanica WT, and mutant M34 and M181. A) daily biomass productivity (dry matter) before the first harvest after a week of cultivation. B) the daily biomass productivity for the three strains the last 11 days of cultivation.
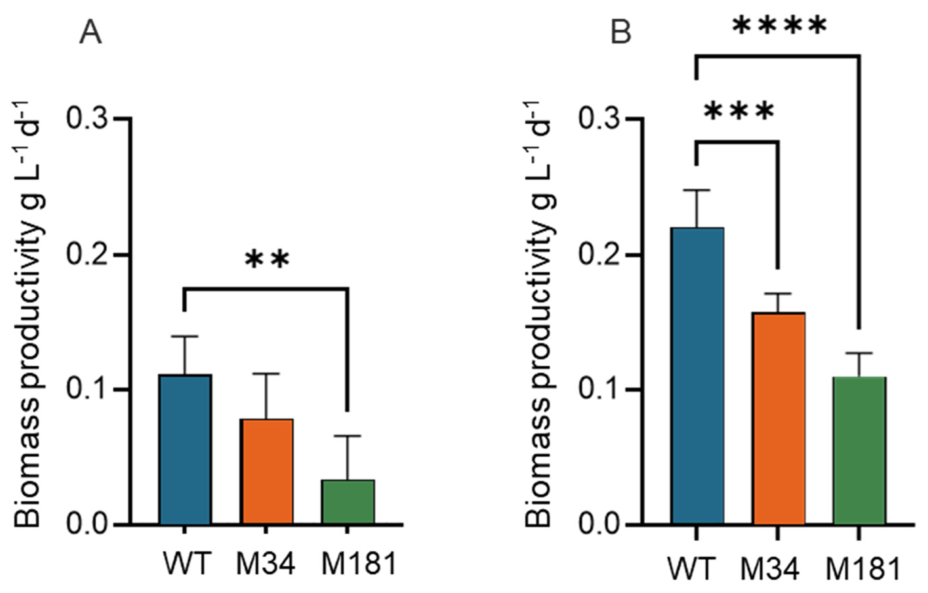
Figure 8.
A) UPLC-UV chromatograms of pigment extracts of N. oceanica WT, M34 and M181. 1: latoxanthin; 2: violaxanthin; 3: astaxanthin; 4: dinoxanthin; 5: vaucheraxanthin 3-acetate 19′-octaonate; 6: vaucheraxanthin 3-acetate 19′-decaoctaonate; 7: chlorophyll a; IS: internal standard (8-apocarotenal). B) Bar graph illustrating the difference in pigment composition of the two mutants M34 and M181 relative to the wildtype.
Figure 8.
A) UPLC-UV chromatograms of pigment extracts of N. oceanica WT, M34 and M181. 1: latoxanthin; 2: violaxanthin; 3: astaxanthin; 4: dinoxanthin; 5: vaucheraxanthin 3-acetate 19′-octaonate; 6: vaucheraxanthin 3-acetate 19′-decaoctaonate; 7: chlorophyll a; IS: internal standard (8-apocarotenal). B) Bar graph illustrating the difference in pigment composition of the two mutants M34 and M181 relative to the wildtype.
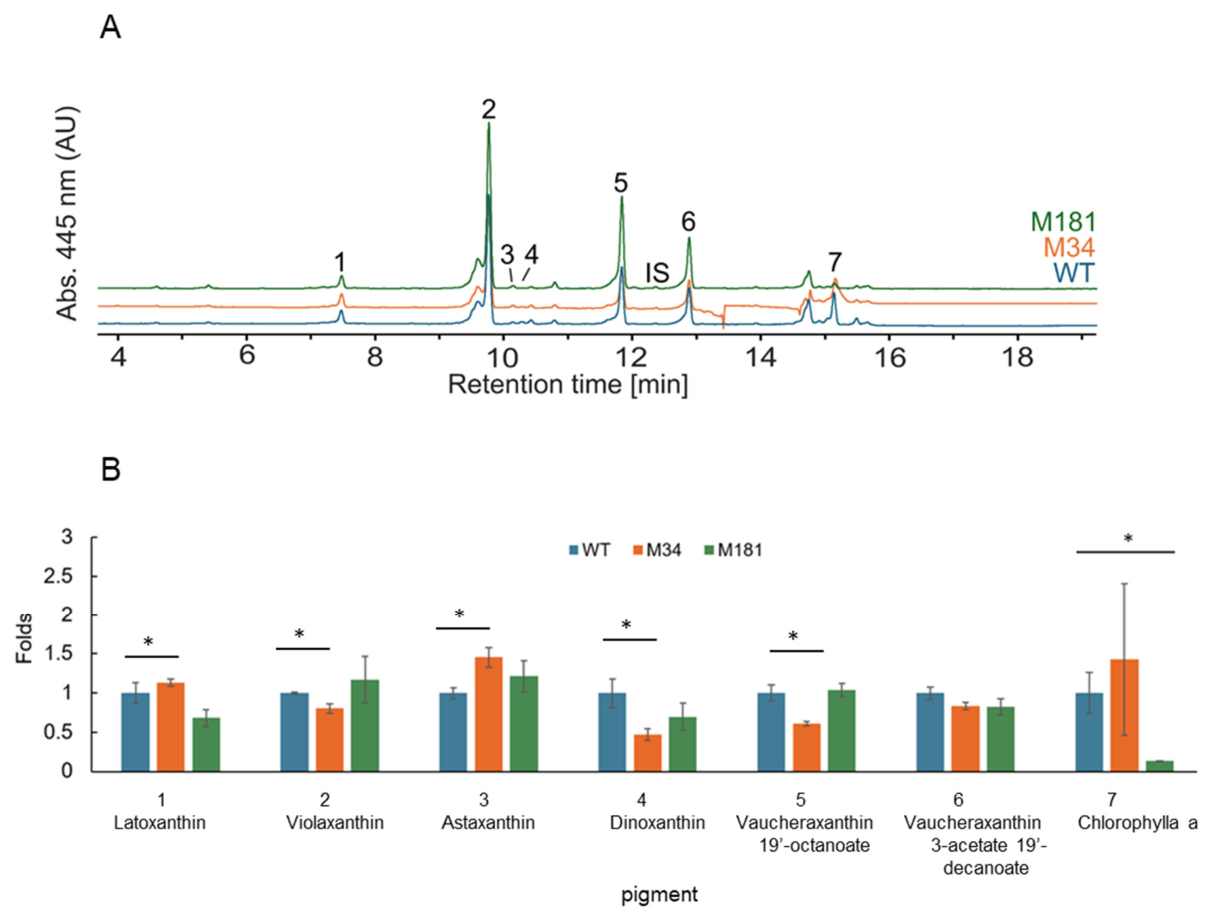

Table 1.
The four mutants initially selected for further characterization: their traits selected by initial visual screening on plates. The optimal radiation dose was between 12-15 seconds.
Table 1.
The four mutants initially selected for further characterization: their traits selected by initial visual screening on plates. The optimal radiation dose was between 12-15 seconds.
| Mutant | UV radiation time (s) | Phenotype |
| M34 | 12 | Growth |
| M181 | 15 | Pale |
| M255 | 15 | Pale |
| M259 | 15 | Growth/pale |
Table 2.
Select biomass composition of WT and mutant N. oceanica. Content of total amino acids (TAA), essential amino acids (EAA), total fatty acids (TFA), eicosapentaenoic acid (EPA), and vitamin D3. Biomass used for analysis of amino acids and fatty acids cultivated at 27 °C. Biomass used for analysis of vitamin D production cultivated at 23 °C. Mean and standard deviation of biological replicates (n = 3) are shown.
Table 2.
Select biomass composition of WT and mutant N. oceanica. Content of total amino acids (TAA), essential amino acids (EAA), total fatty acids (TFA), eicosapentaenoic acid (EPA), and vitamin D3. Biomass used for analysis of amino acids and fatty acids cultivated at 27 °C. Biomass used for analysis of vitamin D production cultivated at 23 °C. Mean and standard deviation of biological replicates (n = 3) are shown.
| Wildtype | Mutant 34 | Mutant 181 | |
| TAA (mg·g-1 DM) | 459.8 ± 21.9 | 464.7 ± 11.7 | 458.8 ± 7.0 |
| EAA (mg·g-1 DM) | 190.6 ± 8.8 | 193.4 ± 4.4 | 189.6 ± 3.6 |
| TFA (mg·g-1 DM) | 80.7 ± 6.8 | 95.2 ± 13.2 | 85.9 ± 12.7 |
| EPA (mg·g-1 DM) | 17.8 ± 0.6 | 19.7 ± 2.8 | 17.8 ± 2.6 |
| Vitamin D3 (µg·g-1 DM) | 0.083 ± 0.006 | 0.085 ± 0.012 | 0.108 ± 0.017 |
Table 3.
The biochemical composition (% dry matter) of N. oceanica WT, M34 and M181 cultivated in pilotscale PBRs. Biomasses from the first harvest after one week (harvest 1: H1) and after 18 days of cultivation (harvest 2: H2) respectively. Ash content is shown in Appendix Fig. A3. Fiber/carbohydrates is calculated as the residual fraction when ash, protein and lipid was subtracted from dry matter.
Table 3.
The biochemical composition (% dry matter) of N. oceanica WT, M34 and M181 cultivated in pilotscale PBRs. Biomasses from the first harvest after one week (harvest 1: H1) and after 18 days of cultivation (harvest 2: H2) respectively. Ash content is shown in Appendix Fig. A3. Fiber/carbohydrates is calculated as the residual fraction when ash, protein and lipid was subtracted from dry matter.
| WT H1 | WT H2 | M34 H1 | M34 H2 | M181 H1 | M181 H2 | |
| Lipids | 21.3 ± 0.3 | 17.2 ± 2.0 | 21.3 ± 0.8 | 20.3 ± 0.3 | 21.3 ± 0.7 | 25.0 ± 0.6 |
| Sum of amino acids | 41.3 ± 1.8 | 41.2 ± 2.2 | 44.7 ± 2.1 | 42.6 ± 0.3 | 42.1 ± 0.9 | 42.2 ± 2.5 |
| Ash | 7.2 ± 0.2 | 9.5 ± 1.8 | 7.7 ± 0.7 | 6.6 ± 0.2 | 7.2 ± 0.5 | 5.8 ± 0.1 |
| Fiber/carbohydrate | 30.2 ± 1.7 | 32.2 ± 1.7 | 26.3 ± 2.9 | 30.5 ± 0.7 | 29.3 ± 1.2 | 27.0 ± 1.8 |
Table 4.
Disruption response and bioaccessibility of wildtype and mutant N. oceanica biomass. The degree of disruption (% disrupted cells) after bead milling, and in vitro bioaccessibility (%) of menaquinone-4 (MK-4) before and after bead milling. Mean and standard deviation of processing replicates (n = 3) are shown. Different letters show significant differences between strains (p < 0.05). The symbol * indicates a significant change in MK-4 bioaccessibility after bead milling (p < 0.05).
Table 4.
Disruption response and bioaccessibility of wildtype and mutant N. oceanica biomass. The degree of disruption (% disrupted cells) after bead milling, and in vitro bioaccessibility (%) of menaquinone-4 (MK-4) before and after bead milling. Mean and standard deviation of processing replicates (n = 3) are shown. Different letters show significant differences between strains (p < 0.05). The symbol * indicates a significant change in MK-4 bioaccessibility after bead milling (p < 0.05).
| Wildtype | Mutant 34 | Mutant 181 | |
| MK-4 bioaccessibility (%) before bead milling |
14.7 ± 0.9a | 15.7 ± 1.5a | 21.1 ± 2.3b |
| Degree of disruption (%) | 50.4 ± 0.5a | 48.2 ± 2.4a | 47.6 ± 1.8a |
| MK-4 bioaccessibility (%) after bead milling |
18.4 ± 1.3a* | 18.0 ± 1.6a | 23.9 ± 3.2b |
Disclaimer/Publisher’s Note: The statements, opinions and data contained in all publications are solely those of the individual author(s) and contributor(s) and not of MDPI and/or the editor(s). MDPI and/or the editor(s) disclaim responsibility for any injury to people or property resulting from any ideas, methods, instructions or products referred to in the content. |
© 2026 by the authors. Licensee MDPI, Basel, Switzerland. This article is an open access article distributed under the terms and conditions of the Creative Commons Attribution (CC BY) license (http://creativecommons.org/licenses/by/4.0/).
Copyright: This open access article is published under a Creative Commons CC BY 4.0 license, which permit the free download, distribution, and reuse, provided that the author and preprint are cited in any reuse.


