
Submitted:
15 July 2026
Posted:
16 July 2026
You are already at the latest version
Abstract
Cerebral Malaria (CM) is a life-threatening disease caused by Plasmodium falciparum. There are currently no reliable tools to predict the progression of cerebral syndromes in humans. Cerebral malaria results in mortality for approximately 1–2% of affected patients, with diagnosis generally established following the onset of neurological manifestations—such as coma, paralysis, or seizures—which may also be indicative of alternative medical conditions. More research is warranted to detect early biomolecular fingerprints of CM in biofluids. In this study, we have investigated the disease's early molecular markers in mice's urine. Our analysis has identified a significant decrease in methylmalonate in urine for mice with CM, a finding that not only provides a potential early detection tool for CM but also opens new avenues for research and intervention strategies.
Keywords:
malaria
; metabolomics
; NMR
; metabolites
1. Introduction
Malaria causes numerous pathological symptoms and ranges from uncomplicated to severe outcomes like Cerebral Malaria (CM), a neurological complication of the disease [1]. In humans, CM is caused by Plasmodium falciparum and is common in sub-Saharan Africa [2]. The prognostic indicators of CM are hyperlactatemia, hypoglycemia, respiratory distress, circulatory failure, and hyporeflexia [3,4,5]. However, these indicators are typically seen in the advanced stages of pediatric cerebral malaria. For example, while coma is commonly associated with CM, it can also result from other neurological disorders and conditions like stroke. In most cases, parasites in comatose patients prompt the administration of anti-malarial drugs. Numerous studies have examined the host response to these infections. For example, CXCL4 and CXCL10 are altered in CM in humans [6]. Previous metabolomics experiments provided evidence of the host's lipid metabolism perturbation in response to CM [7]. Numerous studies have shed light on the post-mortem tissues [8,9], but very little is achieved in understanding the early events of CM when the symptoms are not apparent. Additionally, a growing body of literature suggests that the survivors of CM bear long-term neurological symptoms and cognitive deficits [10,11]; thus, intervention at the early stage of CM is required. At present, there are not enough tools available that can reliably be used to determine an individual's susceptibility toward CM. To date, the pathogenesis of CM is unclear [5]. Previous studies have demonstrated the ability of untargeted metabolomics to understand CM [12]. This approach has been used to understand the serum markers of murine cerebral and non-cerebral malaria at the advanced and early stages of the disease [13]. Furthermore, this methodology was subsequently utilized to examine urinary metabolites in vivax malaria. Our prior research demonstrated that serum lipids and lipoproteins can inform early predictions of cerebral malaria (CM) in murine models [4]. In this study, we investigate urine as a biofluid to elucidate the initial metabolic processes occurring in mice during CM. The difficulty of investigating longitudinal effects in humans is limited by the diversity in genetic background, ethnicity, lifestyle, food habits[14]. The study was thus conducted in rodents as they provide a homogeneous and controlled background to study the host response to CM and NCM. In this study, CM and NCM instances are derived from mice of similar genetic backgrounds, rather than comparing strains inherently susceptible or resistant to CM.
This approach minimizes confounding variables unrelated to phenotype, ensuring that observed metabolic changes are specific to the condition under investigation.
The most widely used rodent model for CM is C57BL/6 in conjunction with Plasmodium berghei ANKA. CM's cumulative incidence is variable, ranging from 50-100%. Our study demonstrates that urine collected on day 1-2 infection was distinct in CM and NCM. The molecule that segregates CM from NCM at such early infection is 2-methylmalonate.
2. Materials and Methods
2.1. Animal Handling
The animals used in this study were treated per the guidelines of the Local Animal Ethics Committee at TIFR. (IEAC approval no: TIFR/IAEC/2010-3).
2.2. Inoculation of Mice, Disease Assessment, and Urine Sample Collection
Each metabolic cage (Techniplast, Italy) housed a single mouse. Before the experiment, the mice were acclimatized in the metabolic cage for seven days. Female C57Bl/6 mice aged 6-8 weeks (N=12) were infected with 107 RBCs infected with Plasmodium berghei ANKA. The mice were monitored daily for disease symptoms after a day post-infection. They were considered to have CM if they had rectal temperature <34ºC [15] and neurological symptoms such as ataxia, convulsions, paralysis, and coma. The animals were kept under the stable environmental condition of the 12-hour day-night cycle at 22±20C and had free access to water and standard food pellets. Urine was collected once daily (14:00 to 17:00 hours) from the collecting tube placed at the bottom of the metabolic cage. The collecting tube contained 1% sodium azide of 100µl volume to prevent microbial growth.
2.3. Sample Collection and Processing
200 µL of urine was mixed with 200 µL of water and 200 µL of phosphate buffer (0.075M Na2HPO4.7H2O, 4% NaN3, 0.02% TSP (3-(trimethylsilyl)-2, 2′, 3, 3′-tetradeuteropropionic acid , pH 7.4) and 50μL of D2O centrifuged at 12,000g for 5 mins. After centrifugation, 550 µL of supernatant was transferred to the 5 mm NMR tube, and 1H NMR spectrum was acquired immediately.
2.4 NMR Experiments for Urine
1H NMR spectrum of urine samples was recorded at 300K. 1D NOESY preset sequence was used to acquire spectra of urine samples. The NMR spectra from the samples were acquired using Bruker AVANCE II 700 MHz NMR spectrometer (Bruker Biospin, Germany) equipped with a broadband inverse probe and BACS automation system. The pulse program is of the form RD-90o-τ-90o-τm-90o-ACQ. RD is the relaxation delay of 4 seconds, which is a short delay, and τm stands for the mixing time which is 100ms. The spectrum was acquired with 32 transients, each recorded with 64k data points on a spectral width of 20 ppm. The spectra were processed using a line broadening factor of 0.1 Hz, Fourier transformed, and phase and baseline corrected in Topspin (Bruker Biospin, Germany). To assign the metabolites, 2-dimensional NMR experiments were carried out. J-resolved 1H NMR experiments were carried out by a single transient with 8k data points in the direct dimension with 100 increments in the indirect dimension. These experiments used a relaxation delay of 2 seconds, and the spectral widths were 16 and 0.1116 ppm in the direct and indirect dimensions, respectively. These spectra were also processed using the automated program mentioned above. 2-dimensional 1H-1H correlation spectroscopy (COSY) and Total Correlation Spectroscopy (TOCSY) were carried out with 32 scans, each with 2k data points in the direct dimension and 512 increments in the indirect dimension. The spectral width used in both dimensions was 12 ppm, and a relaxation delay of 1 second was used. During processing, a linear broadening of 0.3 Hz in both dimensions and a Gaussian broadening of 0.1 Hz in the indirect dimension was applied. The FIDs were Fourier transformed in both dimensions.
2.5 Data Reduction Analysis
All NMR samples were recorded with the same parameters to ensure accuracy in results. The 1H NMR spectrum of urine (0.5-9.5 ppm) is divided into 0.02 ppm bins. The spectrum region corresponding to water and urea (4.2-6.5 ppm) is not included for further processing. The bins are integrated and normalized to the whole spectrum to correct for bias from sample dilutions. Because the sample size was small, samples from days 2 and 3 were combined for both CM and NCM groups. The same approach was used for days 4 and 5, days 6 and 7, and days 8 and 9.
The data matrix was created in AMIX 3.8 software (Bruker Biospin, Germany). This matrix was incorporated in SIMCA P+12 (Umetrics AB, Sweden) for PCA and OPLS-DA analyses. The loading values from the corresponding ‘S’plot and VIP values from the VIP plot are used for segregating the classes are listed in Table 1.
3. Results
The NMR spectrum of urine is given in Figure 1. The 1H NMR spectrum of a control mouse was assigned using COSY and TOCSY analyses, reported literature [16], and databases such as human metabolome databases (www.hmdb.ca). Urine collected from mice on consecutive days is used to build OPLS-DA models. For example, samples collected from CM mice on days 1 and 2 are collectively compared to those collected from NCM mice on days 1 and 2. This strategy was employed because the number of animals was limited, and on some days, insufficient urine was yielded for NMR experiments. It is apparent from the OPLS-DA scores plot that at day 1 and 2 post-infection, CM and NCM mice have distinct urinary profiles. This is evident as these groups are segregated as in Figure 2A. The segregation between CM and NCM is also distinct for other days post-infection, e.g., days 2-3, days 4-5, days 6-7, and days 8-9 post-infection. The p-values for CV ANOVA of these models are 0.07, 0.1, 0.04, 0.29, and 0.07, respectively (Figure 2B-E). The model parameters of the loadings plot are listed in Table 1. The Q2Y for the OPLS-DA models created for CM vs NCM are 0.41, 0.85, 0.48, 0.62, and 0.67 for days 1-2, days 2-3, days 4-5, days 6-7, and days 8-9, respectively. The R2X for the model are 0.71, 0.91, 0.69, 0.94, and 0.83, respectively. The R2Y for the model are 0.61, 0.99, 0.67, 0.98, and 0.96, respectively. The V plot (VIP vs. p(corr)) and the S plot (p(corr) vs. p) demonstrate the features that are altered in CM and NCM (Figure 3). The pathway analysis generated in Metaboanalyst (metaboanalyst.ca) suggests that the “Valine, Leucine and Isoleucine degradation” pathway is enriched in days 1-3 post-infection. The -log(p) =2.70 with an FDR <0.2 and an impact of 0.03348 (Figure 4).
4. Discussion:
The present study has the following findings: The current study shows that multivariate analysis of 1H NMR urinary profiles is crucial for distinguishing CM mice from NCM mice during the first five days post-infection, before the onset of neurological symptoms in mice with CM. This distinction can be attributed to the lower concentration of 2-methylmalonate found in the urine of mice with CM. Metabolic profiling of 2-methylmalonate shows differing levels of this metabolite until days 4 to 5 post-infection. As, 2-Methylmalonate is formed from catabolism of valine [14], thus, an early perturbation in the valine metabolism is indicated in CM mice. This alteration in the metabolic pathway of Valine metabolism is also suggested by the Pathway Analysis. A reason for the decrease in 2-methylmalonate could be the reduced catabolism of valine, which is an essential amino acid converted to its α-ketoacid by transamination and AcylCoA derivatives (Kegg Pathway[14]). These results corroborate with our previous findings which showed Branched chain amino acid metabolism (BCAA) levels to be perturbed in the kidney of mice in malarial infection [15]. A decrease in taurine on day6-7 is also evident from the S plot. Taurine is known to aid in self-healing during malaria, and it has been demonstrated that the deletion of the taurine transporter disrupts this self-healing process in malaria. Previous studies reported an increase in taurine in the urine of P. falciparum-infected individuals [5,17]. A decrease of taurine could be crucial for the CM mice on the day 6, 7 p.i. and could be associated with early death. On days 8-9 post-infection, there is an alteration in Phenylacetylglycine, which is part of the phenylalanine pathway. Our previous study showed phenylalanine metabolism to be perturbed in malaria, which could result in a decrease in the phenylacetylglycine. The disturbances in the level of trimethylamine n oxide (TMAO) could be due to the dysbiosis in gut microbiota. A future detailed study of the metabolic pathway will shed light on the mechanism of perturbation.
The pilot study conducted with female mice showed promising results, but it had limitations due to the exclusive focus on one sex in the analysis. Including both male and female mice in future studies would provide insights into the sexual dimorphism of the disease. Additionally, it is important to follow up with human populations to establish clinical relevance of the findings.
5. Conclusion
It is evident from this study that methylmalonate in urine is altered in mice with CM. This study also indicates early perturbation in valine metabolism in CM mice.
References
- Postels, D.G.; Katangwe-Chirwa, T. Cerebral Malaria. Semin. Pediatr. Neurol. 2025, 54.
- Idro, R.; Marsh, K.; John, C.C.; Newton, C.R.J. Cerebral Malaria: Mechanisms of Brain Injury and Strategies for Improved Neurocognitive Outcome. Pediatr. Res. 2010. [CrossRef]
- Idro, R.; Karamagi, C.; Tumwine, J. Immediate Outcome and Prognostic Factors for Cerebral Malaria among Children Admitted to Mulago Hospital, Uganda. Ann. Trop. Paediatr. 2004. [CrossRef]
- Patel, H.; Dunican, C.; Cunnington, A.J. Predictors of Outcome in Childhood Plasmodium Falciparum Malaria. Virulence 2020, 11, 199–221. [CrossRef]
- Storm, J.; Craig, A.G. Pathogenesis of Cerebral Malaria-Inflammation and Cytoadherence. Front. Cell. Infect. Microbiol. 2014, 4. [CrossRef]
- Wilson, N.O.; Jain, V.; Roberts, C.E.; Lucchi, N.; Joel, P.K.; Singh, M.P.; Nagpal, A.C.; Dash, A.P.; Udhayakumar, V.; Singh, N.; et al. CXCL4 and CXCL10 Predict Risk of Fatal Cerebral Malaria. Dis. Markers 2011, 30, 39–49. [CrossRef]
- Ghosh, S.; Pathak, S.; Sonawat, H.M.; Sharma, S.; Sengupta, A. Metabolomic Changes in Vertebrate Host during Malaria Disease Progression. Cytokine 2018, 112, 32–43. [CrossRef]
- Macpherson, G.G.; Warrell, M.J.; White, N.J.; Looareesuwan, S.; Warrell, D.A. Human Cerebral Malaria A Quantitative Ultrastructural Analysis of Parasitized Erythrocyte Sequestration;
- Rénia, L.; Howland, S.W.; Claser, C.; Gruner, A.C.; Suwanarusk, R.; Teo, T.H.; Russell, B.; Lisa, N.P. Cerebral Malaria Mysteries at the Blood-Brain Barrier. Virulence 2012, 3, 193–201.
- John, C.C.; Bangirana, P.; Byarugaba, J.; Opoka, R.O.; Idro, R.; Jurek, A.M.; Wu, B.; Boivin, M.J. Cerebral Malaria in Children Is Associated with Long-Term Cognitive Impairment. Pediatrics 2008. [CrossRef]
- Dai, M.; Reznik, S.E.; Spray, D.C.; Weiss, L.M.; Tanowitz, H.B.; Gulinello, M.; Desruisseaux, M.S. Persistent Cognitive and Motor Deficits after Successful Antimalarial Treatment in Murine Cerebral Malaria. Microbes Infect 2010, 12, 1198–1207. [CrossRef]
- Ghosh, S.; Sengupta, A.; Sharma, S.; Sonawat, H.M. Early Prediction of Cerebral Malaria by (1)H NMR Based Metabolomics. Malar. J. 2016, 15, 198. [CrossRef]
- Ghosh, S.; Sengupta, A.; Sharma, S.; Sonawat, H.M. Metabolic Fingerprints of Serum, Brain, and Liver Are Distinct for Mice with Cerebral and Noncerebral Malaria: A 1H NMR Spectroscopy-Based Metabonomic Study. J. Proteome Res. 2012, 11, 4992–5004. [CrossRef]
- Barapour, N.; Cao, J.Z.; Wu, Y.; Gupta, S.; Hoopmann, M.R.; Qin, R.; Midha, M.K.; Mireault, M.; Juanes-Velasco, P.; Hanson, C.; et al. A Comparison of Deep Multiomics Profiles across Ethnicity, Geography, and Age. Cell 2026, 189, 3004-3024.e35. [CrossRef]
- Franke-Fayard, B.; Janse, C.J.; Cunha-Rodrigues, M.; Ramesar, J.; Büscher, P.; Que, I.; Löwik, C.; Voshol, P.J.; Den Boer, M.A.M.; Van Duinen, S.G.; et al. Murine Malaria Parasite Sequestration: CD36 Is the Major Receptor, but Cerebral Pathology Is Unlinked to Sequestration. Proc. Natl. Acad. Sci. U. S. A. 2005. [CrossRef]
- Li, J. V.; Wang, Y.; Saric, J.; Nicholson, J.K.; Dirnhofer, S.; Singer, B.H.; Tanner, M.; Wittlin, S.; Holmes, E.; Utzinger, J. Global Metabolic Responses of NMRI Mice to an Experimental Plasmodium Berghei Infection. J. Proteome Res. 2008. [CrossRef]
Figure 1.
Typical 700 MHz 1H NMR spectrum of C57BL/6 female mouse. 1-2 methyl 3 ketovaleric acid, 2 - 2-oxoisocaproate, 3 - 2-oxoisovalerate, 4 - 2-methylmalonic acid, 5 - lactic acid, 6 - alanine, 7 - lysine, 8 - acetate, 9 - uriedopropionic acid, 10 - succinate, 11 - 2-oxoglutaric acid, 13 - dimethylamine, 14 - trimethylamine, 15 - creatinine, 16 – trimethyl-N-oxide, 17 - taurine, 18 - glycine, 19 phenylacetylglycine (PAG), 20 - allantoin, 21 –Hippurate, 22 – Creatinine.
Figure 1.
Typical 700 MHz 1H NMR spectrum of C57BL/6 female mouse. 1-2 methyl 3 ketovaleric acid, 2 - 2-oxoisocaproate, 3 - 2-oxoisovalerate, 4 - 2-methylmalonic acid, 5 - lactic acid, 6 - alanine, 7 - lysine, 8 - acetate, 9 - uriedopropionic acid, 10 - succinate, 11 - 2-oxoglutaric acid, 13 - dimethylamine, 14 - trimethylamine, 15 - creatinine, 16 – trimethyl-N-oxide, 17 - taurine, 18 - glycine, 19 phenylacetylglycine (PAG), 20 - allantoin, 21 –Hippurate, 22 – Creatinine.
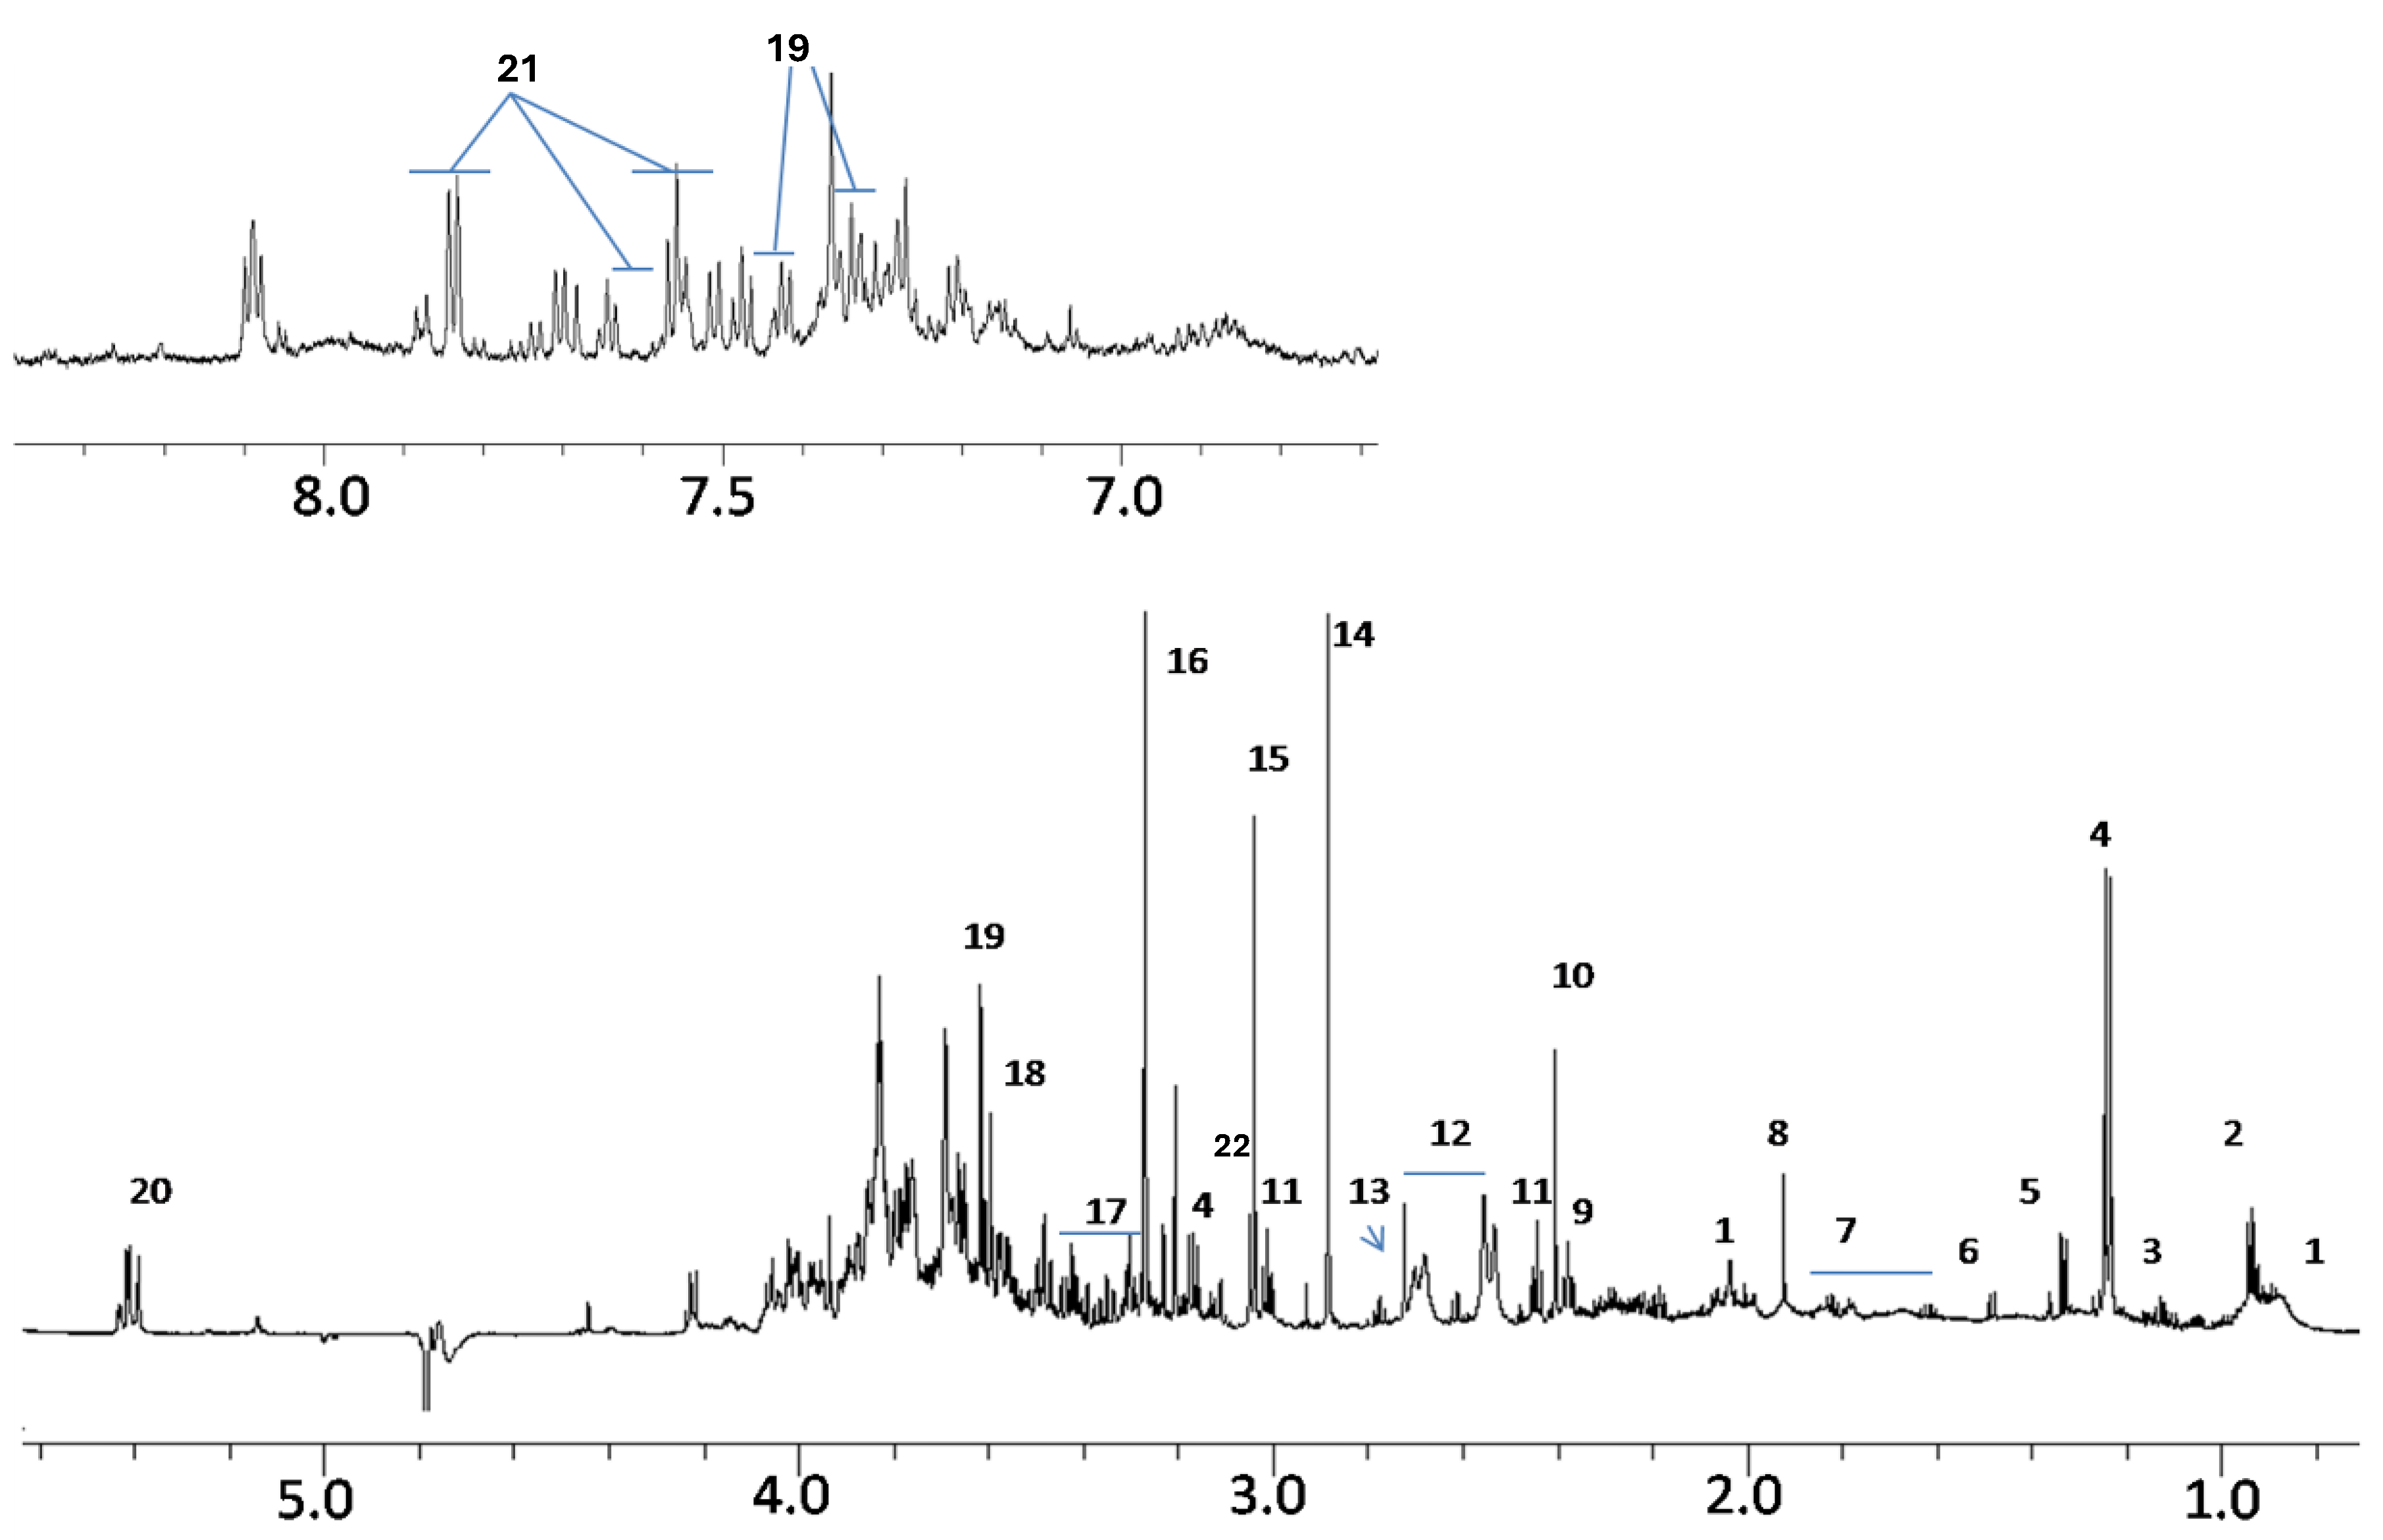
Figure 2.
OPLS-DA scores plot of 1H NMR profile of CM and NCM. A). CM vs. NCM at day 1-2 p.i. B). CM vs. NCM on days 2-3 p.i. C) CM vs. NCM on days 4-5 p.i. D) CM vs. NCM on days 6-7 p.i. E) D) CM vs. NCM on days 8-9 p.i. The number on the right side of the plot refers to the days p.i. for which analysis is performed. Green symbols represent NCM, while blue ones indicate CM. The ellipse in the scores plot is a 95% Hotelling T2 ellipse.
Figure 2.
OPLS-DA scores plot of 1H NMR profile of CM and NCM. A). CM vs. NCM at day 1-2 p.i. B). CM vs. NCM on days 2-3 p.i. C) CM vs. NCM on days 4-5 p.i. D) CM vs. NCM on days 6-7 p.i. E) D) CM vs. NCM on days 8-9 p.i. The number on the right side of the plot refers to the days p.i. for which analysis is performed. Green symbols represent NCM, while blue ones indicate CM. The ellipse in the scores plot is a 95% Hotelling T2 ellipse.
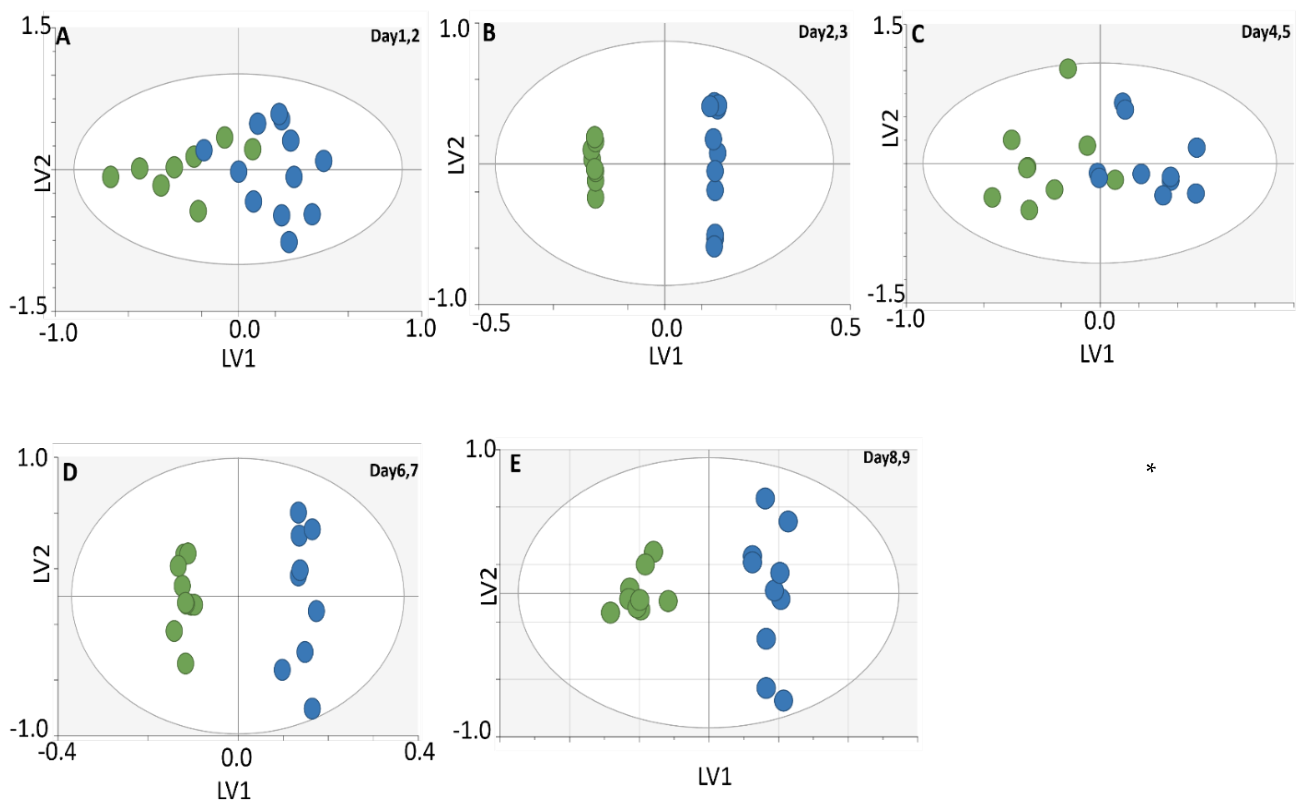
Figure 3.
S plot of the OPLS-DA models in Fig 2. A). CM vs. NCM at day 1-2 p.i. B). CM vs. NCM on days 2-3 p.i. C) CM vs. NCM on days 4-5 p.i. D) CM vs. NCM on days 6-7 p.i. E) D) CM vs. NCM on days 8-9 p.i.
Figure 3.
S plot of the OPLS-DA models in Fig 2. A). CM vs. NCM at day 1-2 p.i. B). CM vs. NCM on days 2-3 p.i. C) CM vs. NCM on days 4-5 p.i. D) CM vs. NCM on days 6-7 p.i. E) D) CM vs. NCM on days 8-9 p.i.
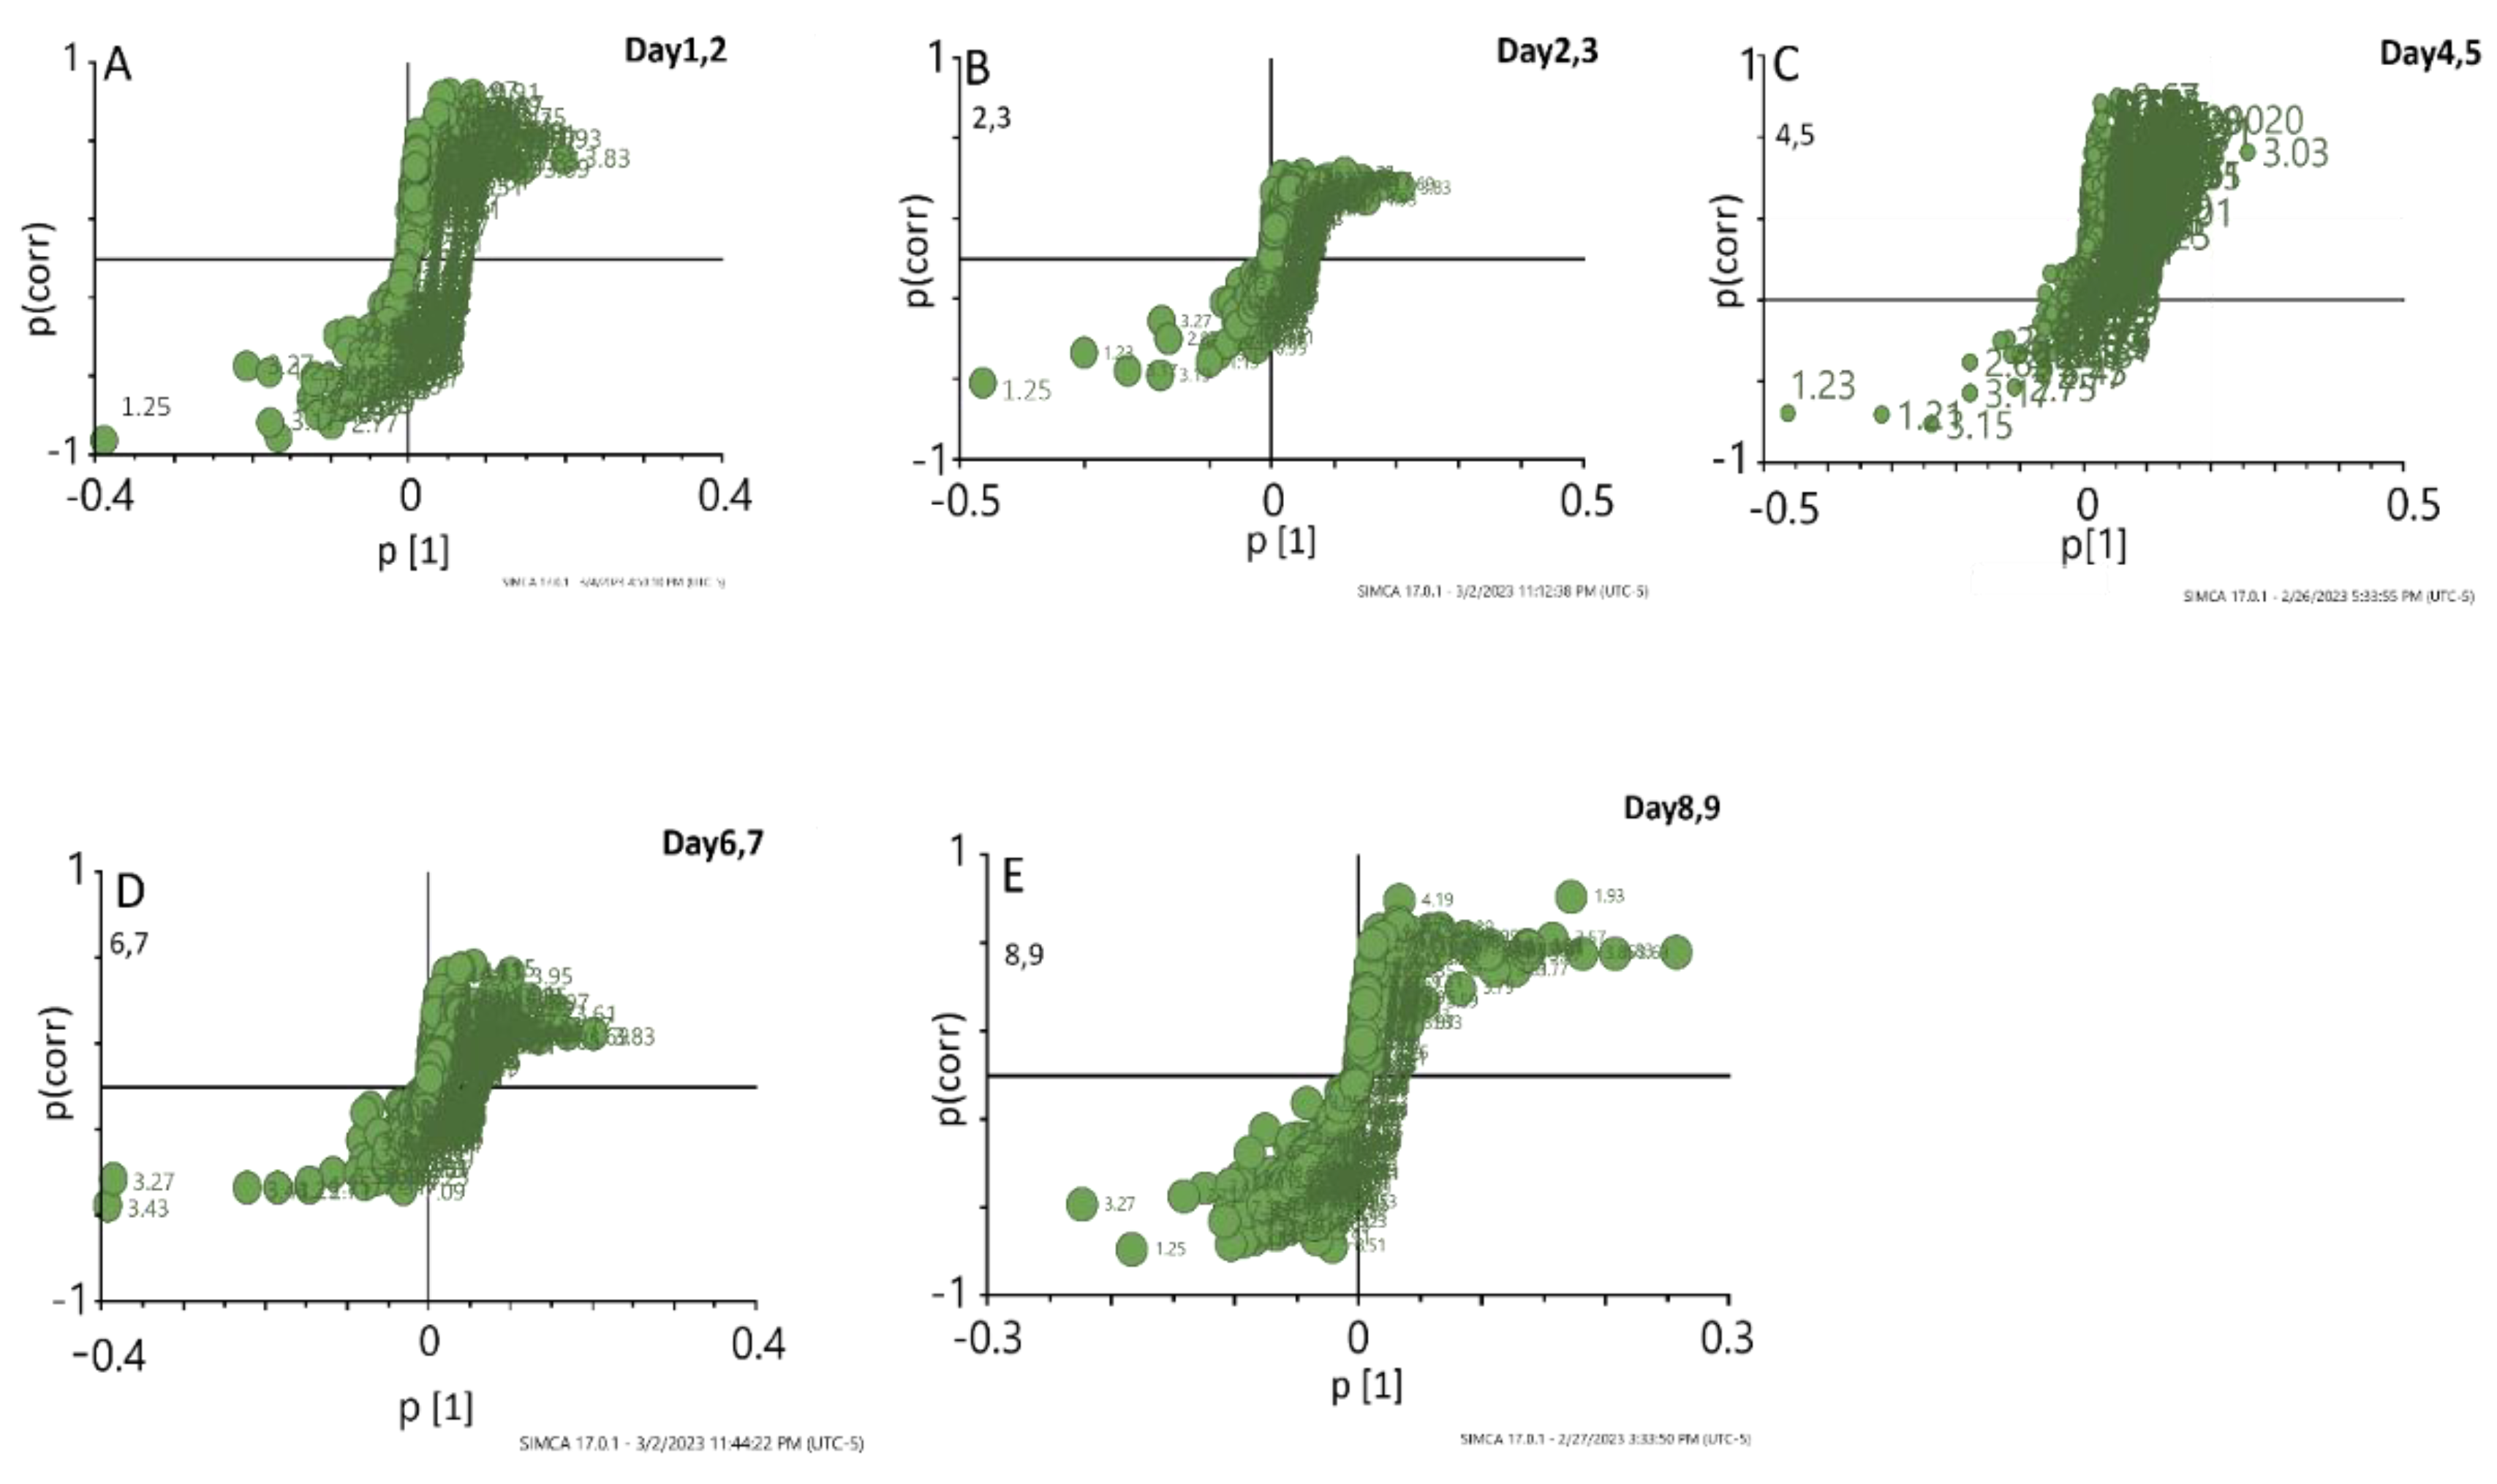
Figure 4.
Pathway analysis of the metabolites day1-3 post infection. The altered metabolites in CM vs. NMM at the early point were used to understand the altered pathways in Cerebral malaria.
Figure 4.
Pathway analysis of the metabolites day1-3 post infection. The altered metabolites in CM vs. NMM at the early point were used to understand the altered pathways in Cerebral malaria.
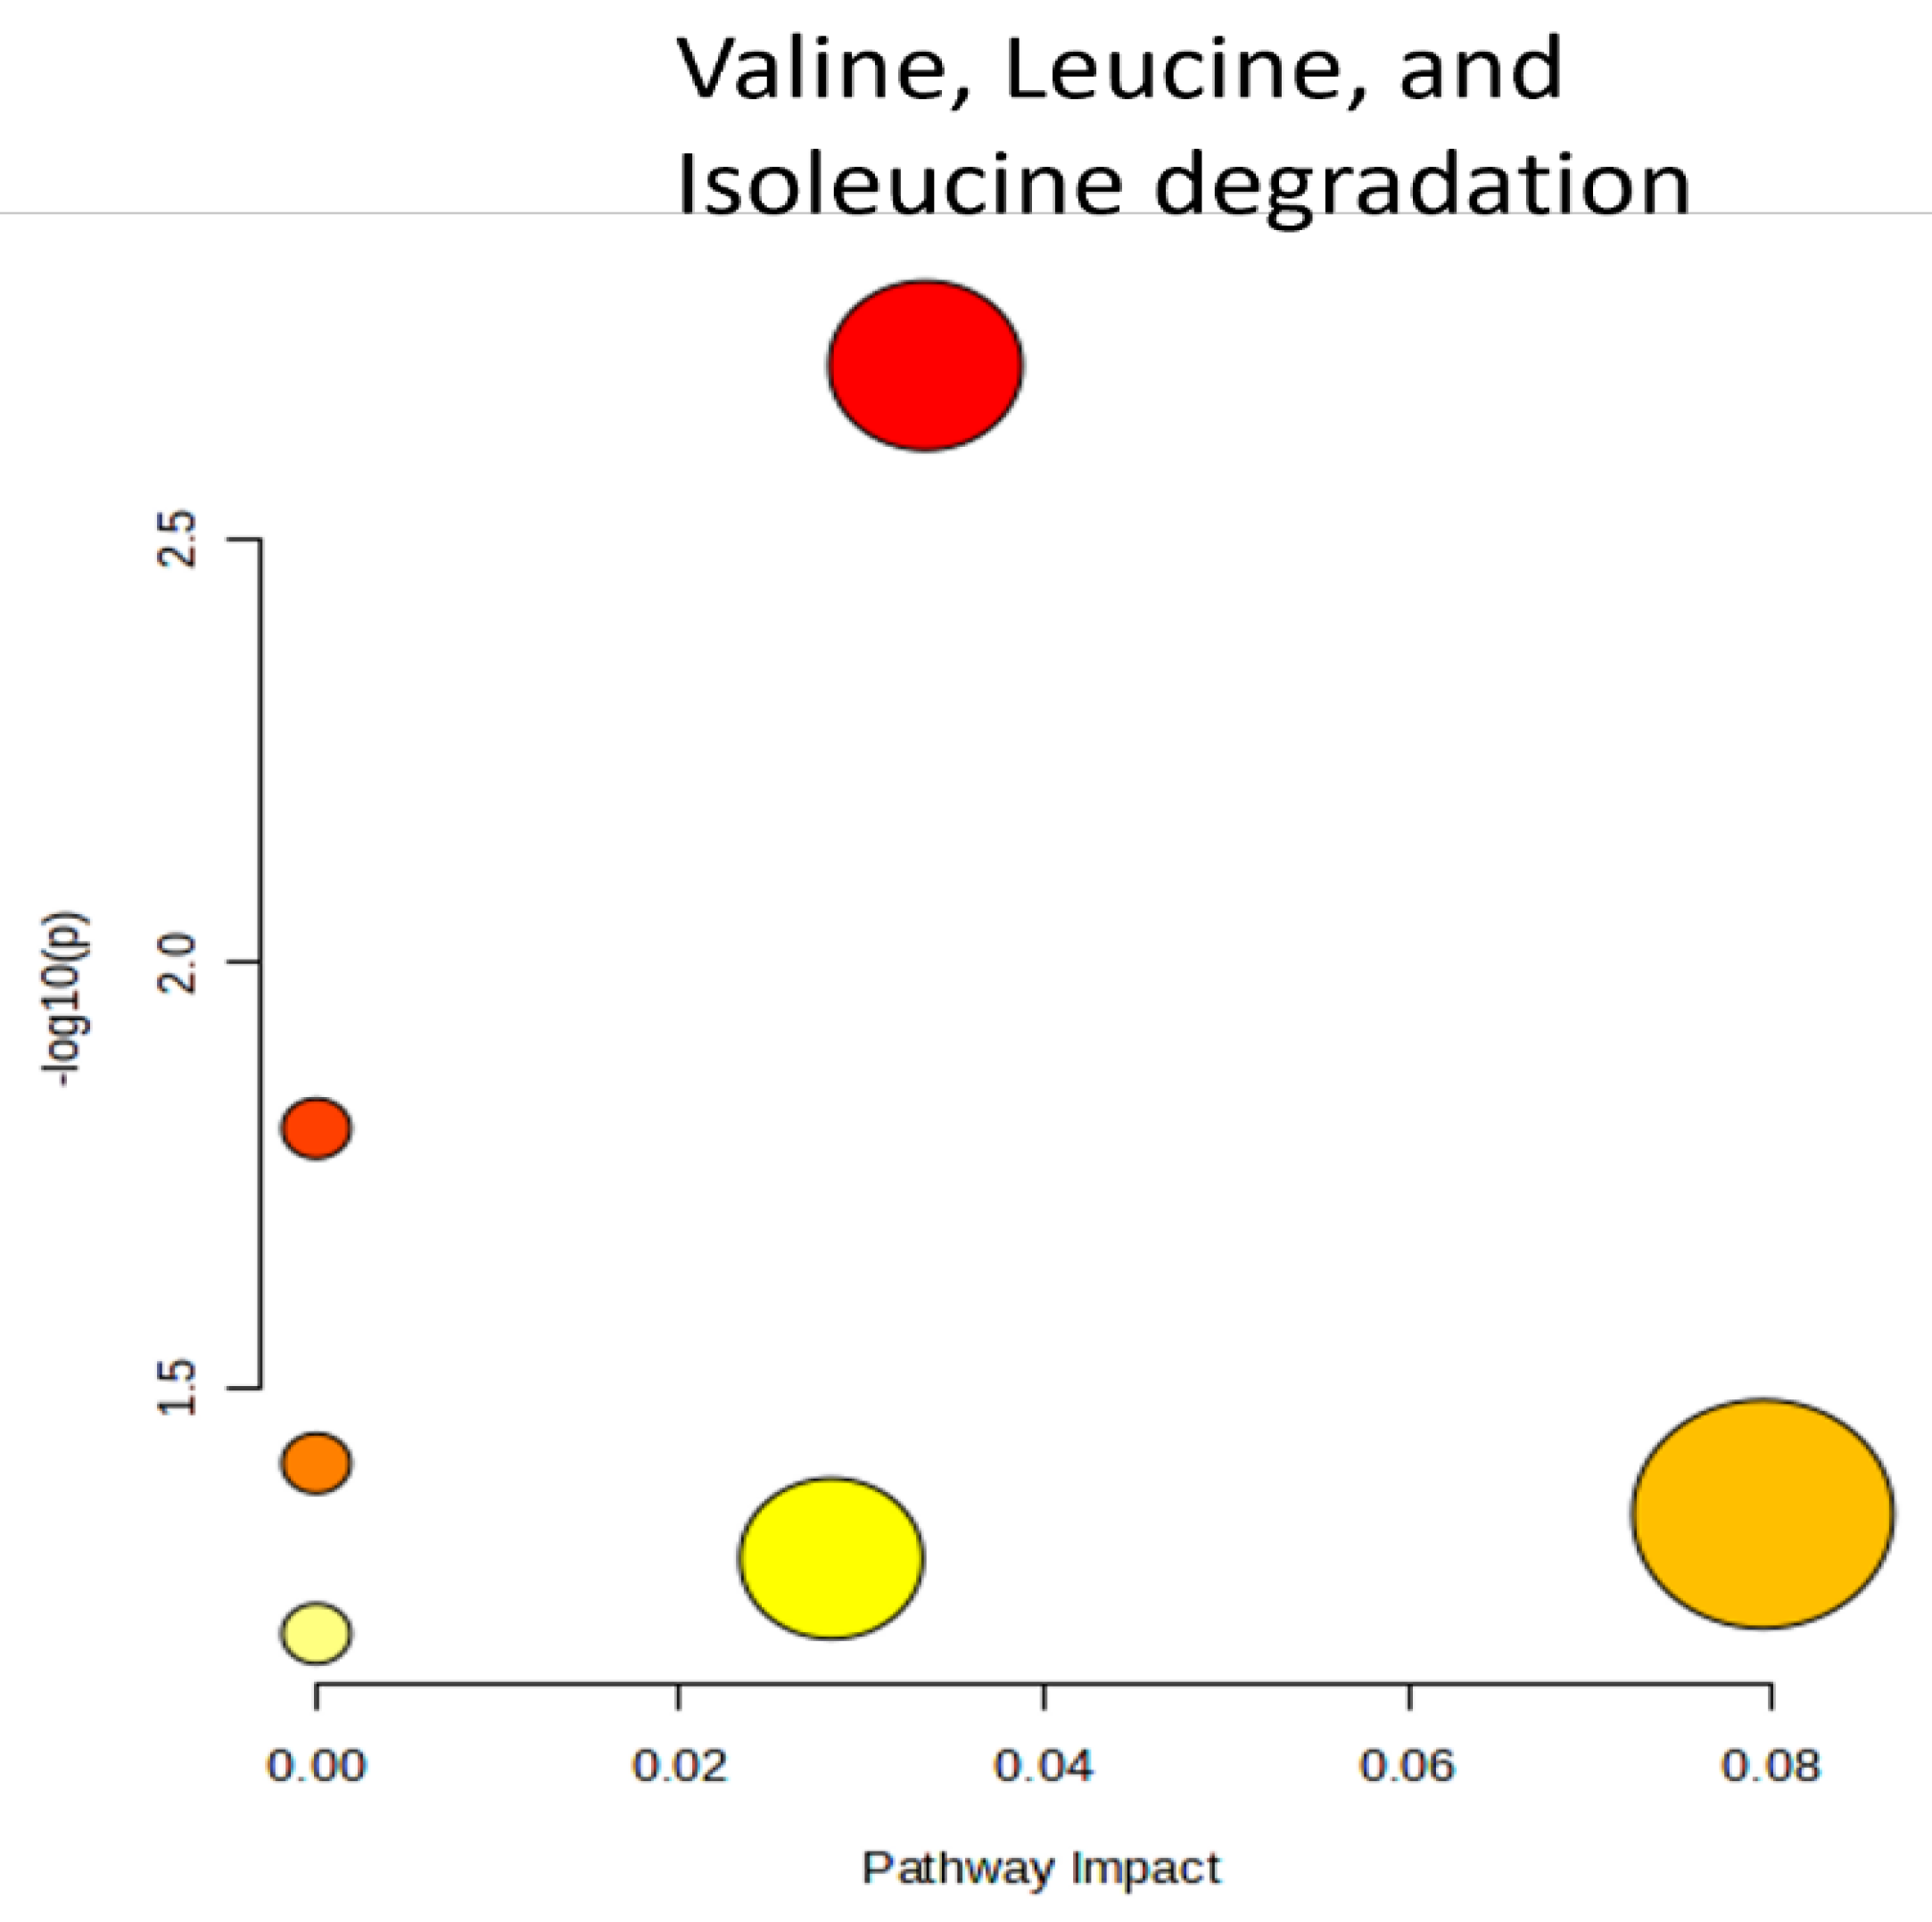

Table 1.
The urinary metabolites that led to segregation between CM and NCM.
| Time points post inoculation |
Metabolites | Chemical Shifts | pcorr | VIP |
|---|---|---|---|---|
| Day 1,2 | 2-Methylmalonate Dimethylamine Acetate |
1.25, 3.17 2.77 1.85 |
-0.93,-0.84 -0.84, -0.79 |
5.96, 2.71 1.53 1.85 |
| Day 2,3 | 2-Methylmalonate 2-Oxoisovalerate |
1.25, 3.17 1.13 |
-0.61, -0.55 -0.51 |
6.89, 3.51 1.56 |
| Day 4,5 | 2- Methylmalonate Trimethylamine |
1.23, 3.17 2.75 |
0.72,0.79 0.61 |
7.9, 4.16 1.67 |
| Day 6,7 | Taurine | 3.43, 3.27 | -0.3, -0.46 | 5.72, 5.96 |
| Day 8, 9 | Trimethyl N oxide 2- Methylmalonate Phenylacetylglycine |
3.27 1.25 7.37, 7.43 |
-0.59 -0.49 -0.58,-0.6 |
4.41 2.33 1.9,1.19 |
Disclaimer/Publisher’s Note: The statements, opinions and data contained in all publications are solely those of the individual author(s) and contributor(s) and not of MDPI and/or the editor(s). MDPI and/or the editor(s) disclaim responsibility for any injury to people or property resulting from any ideas, methods, instructions or products referred to in the content. |
© 2026 by the authors. Licensee MDPI, Basel, Switzerland. This article is an open access article distributed under the terms and conditions of the Creative Commons Attribution (CC BY) license (http://creativecommons.org/licenses/by/4.0/).
Copyright: This open access article is published under a Creative Commons CC BY 4.0 license, which permit the free download, distribution, and reuse, provided that the author and preprint are cited in any reuse.


