

Submitted:
06 October 2026
Posted:
09 October 2026
You are already at the latest version
Abstract
Background: Effective influenza molecular epidemiology depends on curated, temporally representative sequence datasets. The transition from raw GISAID or NCBI/GenBank batch downloads to analysis-ready FASTA often requires command-line pipeline configuration or custom scripting, which may be inaccessible to some field and clinical virologists. To our knowledge, a targeted, non-systematic comparison of widely used viral-genome tools did not identify a single browser-delivered workflow combining supported GISAID-style and NCBI/GenBank-compatible header parsing, interactive human-in-the-loop temporal subsampling, exact-sequence identity-group analysis, and six selectable language catalogues.Methods: We developed VirSift (Viral Sequence Intelligence and Filtering Toolkit), a seven-page Streamlit web application implementing: (1) a custom parser handling five supported GISAID-style and NCBI/GenBank-compatible FASTA header variants with host inference and species normalization; (2) vectorized quality filtering and MD5-based identification of exact-sequence redundancy; (3) six documented human-in-the-loop (HITL) temporal sampling strategies with an operational date-span recommendation, plus a separate multi-attribute diversity filter for balanced host/location/clade subsampling; (4) ten Plotly visualization types, including a configurable N-level Sankey flow diagram and an exact-sequence persistence matrix; and (5) structured export to FASTA, CSV, and segment-organized ZIP bundles. The interface exposes six structurally aligned 921-key language catalogues. English and Russian contain complete or near-complete native-language values (100% and 99.0% respectively); French, Spanish, Arabic, and Chinese now also contain predominantly native-language values (94.1%, 98.0%, 98.9%, and 98.6% respectively) following a subsequent full-catalogue translation pass, with a small residual of proper nouns, format names, and language-specific cognates remaining in English. This tool-description paper documents implemented functions and includes a limited H3N2 demonstration and multi-file round-trip check; comprehensive analytical, usability, performance, and multilingual validation is reserved for separate work.Results: Applied to 59 H3N2 haemagglutinin sequences from Novosibirsk, Russia, spanning October 2021 to April 2025, VirSift identified 12 records redundant by exact nucleotide identity (20.3% of records), retaining 47 unique sequences across 9 calendar months. The observed 1,279-day collection-date span was assigned to the software-defined long-span category (labelled "Endemic" in the version 1.0 interface), for which Custom Checkpoints was recommended. The Molecular Timeline reported 47 exact-sequence identity groups. Clade 3C.2a1b.2a.2a.3a.1 accounted for 69.5% of records. Multi-file ingestion and metadata-based split export were verified by reconciliation of record counts across five source files. All described operations were completed without programming.Conclusions: VirSift provides a reproducible and auditable browser-delivered workflow for pre-phylogenetic curation of influenza sequence datasets. Its six selectable language catalogues, supported parsing rules, HITL sampling options, visualization modules, and structured exports are described here as implemented capabilities. The H3N2 case study and count-reconciliation exercise demonstrate workflow operation but do not constitute comprehensive software validation. VirSift may support institutions seeking an accessible interface for documented sequence-data curation before downstream phylogenetic analysis.
Keywords:
influenza virus
; GISAID
; NCBI/GenBank
; bioinformatics tool
; epidemiological surveillance
; sequence quality control
; surveillance informatics
; molecular epidemiology
1. Introduction
Genomic surveillance is central to monitoring the evolution, transmission, and emergence of influenza viruses [1,2]. However, the reliability of downstream phylogenetic and epidemiological analyses depends not only on the availability of sequence data but also on how those data are quality-controlled, curated, and sampled before analysis [3,4]. Accordingly, reproducible and accessible approaches to pre-phylogenetic dataset curation are increasingly important.
1.1. The Pre-Phylogenetic Curation Problem
Influenza A and B genomic surveillance has been transformed by resources including GISAID EpiFlu [5,6,7] and NCBI/GenBank [8], operating within the wider global surveillance ecosystem that includes the WHO Global Influenza Surveillance and Response System [9]. These resources contain extensive influenza sequence collections contributed by laboratories worldwide. The operational path from a batch download to phylogenetically interpretable input nevertheless requires quality-control, exact-sequence redundancy assessment, and subsampling decisions that are not always reported consistently across research groups.
Three problems are common in raw GISAID and NCBI/GenBank batch data:
Sampling bias: Sequence availability is strongly shaped by seasonal surveillance intensity and submission practices. A naive temporal subsample can over-represent high-volume periods and exclude low-volume or off-season detections that may be relevant to inter-seasonal persistence, zoonotic spillover, or later clade expansion [10]. Russian and regional surveillance studies across wild birds, seals, swine, and human influenza illustrate the diversity of host, seasonal, and inter-seasonal contexts in which low-frequency detections may remain biologically informative [11,12,13,14,15,16,17,18,19,20,21].
Exact-sequence redundancy: Records with identical normalized nucleotide sequences may occur under different accession identifiers because of repeated sampling, passage histories, or resubmission. VirSift classifies records as exact-sequence redundant only when their normalized nucleotide strings are identical; this operational rule does not establish that records originated from the same patient, specimen, transmission event, or biological clone. If retained without explicit justification, repeated identical records can overweight terminal patterns in downstream summaries and phylogenetic datasets.
Header format variability: Influenza records obtained from GISAID and NCBI/GenBank may use different FASTA header structures depending on influenza type, host origin, segment, source, and submission era. Automated pipelines that assume a fixed header format can silently mis-parse records submitted under alternative formats. A concrete instance of this problem was observed in institutional data: a header variant omitting the segment field entirely caused a fixed-position parser to silently write the collection date into the segment column and the clade into the accession column. VirSift v1.1’s parser was subsequently extended to detect field type by content rather than position for exactly this case (see Section 2.2.1).
Host-name and accession-identifier fragmentation: the same host species or accession number is frequently submitted under different spacing, casing, or delimiter conventions across labs, for instance; `EPI_ISL_123456` vs. `EPI ISL 123456`; `mallard` vs. `Mallard_Duck` vs. `Anas platyrhynchos`, causing tools that match on exact string equality to silently treat one entity as several.
1.2. Existing Tools and Their Limitations
Augur filter (Nextstrain [22]) is a widely used bioinformatics tool for sequence subsampling. It provides powerful group-by proportional subsampling but requires installation of the Nextstrain environment and command-line proficiency. Visual inspection of filter effects requires the separate Auspice visualization component. The filtering command itself does not provide an equivalent session-persistent, browser-based curation interface.
Nextclade [23] performs clade assignment, mutation calling, and sequence quality control against supported reference datasets, but it is not a general-purpose temporal filter or subsampler and does not provide the batch HITL workflow described here. BEAST2 [24] and IQ-TREE [25] perform phylogenetic inference on already prepared datasets and do not address the complete pre-phylogenetic curation workflow.
To our knowledge, a targeted, non-systematic comparison of Nextstrain/augur, Nextclade, BEAST2, IQ-TREE, and related browser-based sequence tools did not identify a single application combining the specific set of capabilities implemented in VirSift: browser-delivered operation, supported multi-variant GISAID-style and NCBI/GenBank-compatible parsing, interactive HITL temporal sampling, exact-sequence persistence analysis, session-level audit export, and six selectable language catalogues. This statement describes the comparison scope used for this software paper and is not presented as a systematic review of all available bioinformatics software.
1.3. Rationale for a Multilingual Tool
Effective influenza surveillance is a global undertaking, while routine reporting, training, and laboratory communication may occur in national or regional working languages. Russian public-health guidance and WHO laboratory manuals illustrate the use of institution-specific epidemiological and laboratory terminology [26,27]. A selectable-language interface can therefore reduce the need for ad hoc translation during software operation, although linguistic accuracy and usability require language-specific evaluation.
VirSift implements six selectable language catalogues corresponding to English, Russian, French, Spanish, Arabic, and Chinese. All catalogues contain the same 921 keys. English and Russian contain complete or near-complete native-language values (100% and 99.0% respectively). French, Spanish, Arabic, and Chinese now also contain predominantly native-language values (94.2%, 98.0%, 98.9%, and 98.6% respectively) following a subsequent full-catalogue translation pass, with a small residual of proper nouns, format names, and language-specific cognates remaining identical to English. The present paper describes this architecture but does not claim formal native-speaker linguistic-quality review, right-to-left usability testing, or cross-language task-performance testing.
1.4. Aim and Scope
The aim of this paper is to describe the design, implementation, and intended use of VirSift as a browser-based pre-phylogenetic curation workflow for influenza sequence datasets. We report the implemented parsing, filtering, HITL sampling, visualization, export, audit-log, and six-catalogue language-selection functions; demonstrate their use with a 59-record H3N2 dataset; and verify multi-file ingestion and metadata-based split export by record-count reconciliation. The paper does not claim comprehensive performance, analytical-accuracy, cross-browser usability, or multilingual validation; those evaluations are being addressed in a separate validation study.
2. Methods
2.1. Software Architecture
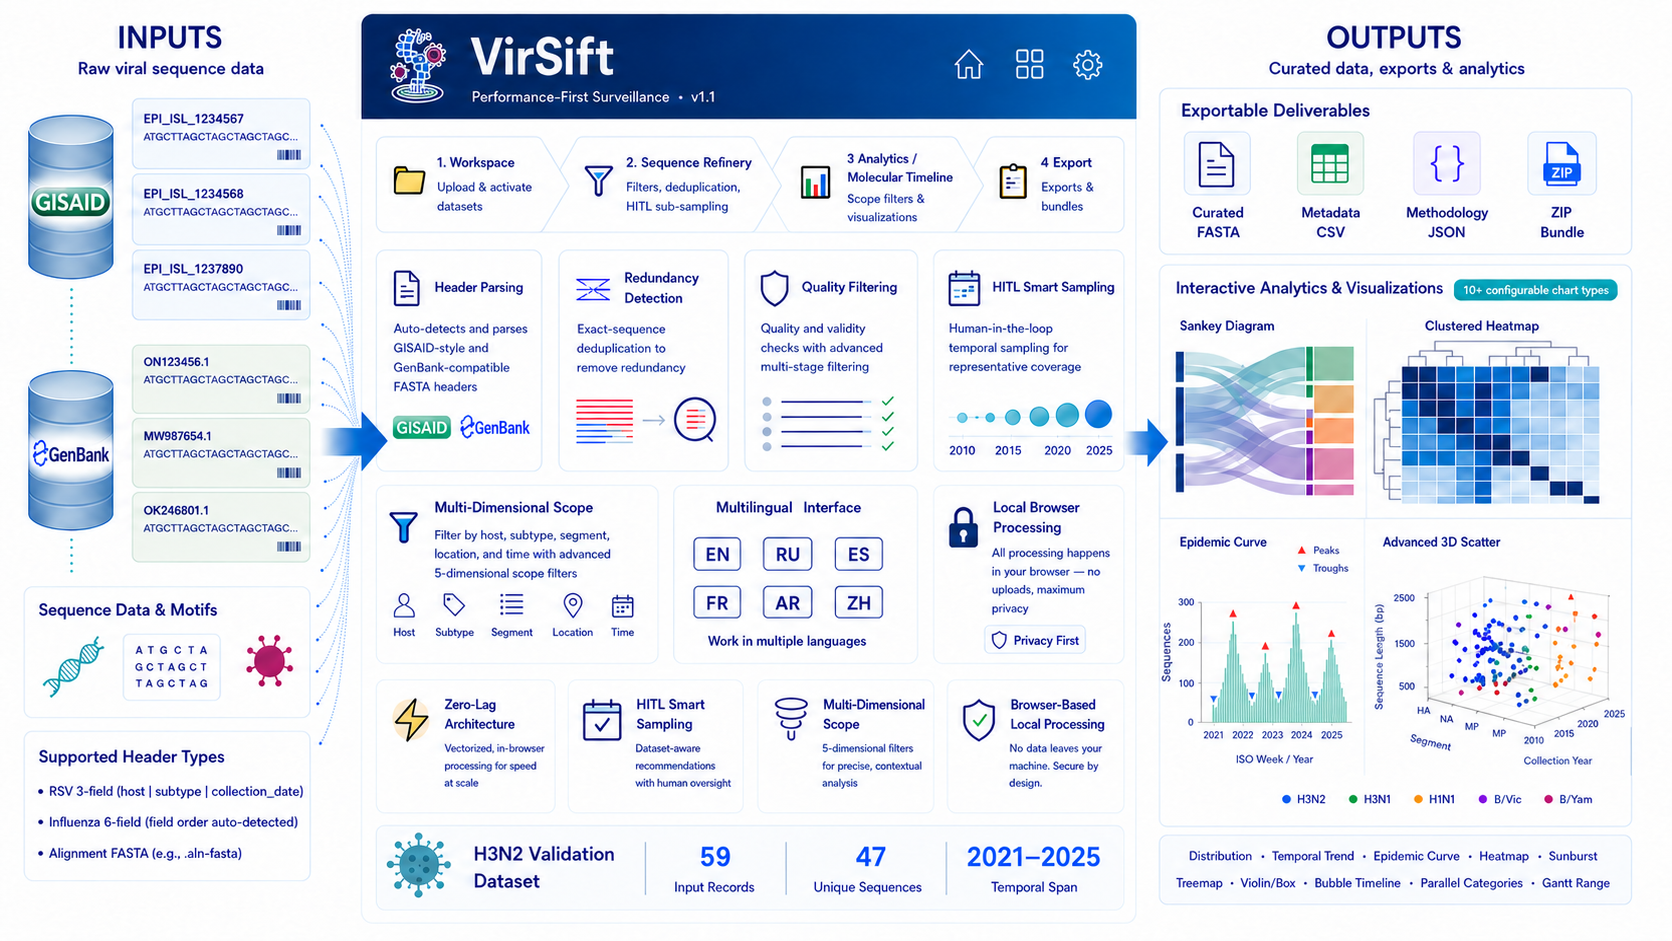
VirSift v1.1 is implemented as a seven-page Streamlit 1.36+ [28] web application written in Python 3.x [29] and using pandas for tabular data operations [30,31]. Page 1 operates in two states: it presents the onboarding Home interface before dataset activation and becomes the Surveillance Observatory after a selected or merged dataset is activated in Workspace. Following activation, Sequence Refinery, Molecular Timeline, Analytics, Export, and Documentation may be visited in any order. The application entry point (app.py) performs translation loading, session-state schema initialization, and page-navigation wiring. The application architecture and separation between the immutable original dataset and mutable filtered dataset are summarized in Figure 1. The user-facing activation workflow and non-sequential relationship among post-activation modules are summarized in Supplementary Figure S1. Representative Observatory interfaces are provided in Supplementary Figure S3.
Session data are partitioned into two disjoint stores: an active dataset, written when the user selects and activates uploaded files in Workspace and not subsequently altered by filtering operations; and a filtered dataset, updated by quality-control and sampling operations. This separation supports non-destructive exploration because filters can be reversed without re-uploading the source FASTA file. Additional session-state details are provided in Supplementary Methods S3.
Performance-critical paths use column-level vectorized data operations. Formal runtime, memory, scalability, and cross-deployment benchmarking are outside the scope of this tool-description paper and are reserved for the separate VirSift validation study.
2.2. VirSift Parser (Version 1.0)
2.2.1. Header Variant Detection
The parser handles five supported GISAID-style 5,6 and NCBI/GenBank-compatible 8 FASTA header variants through a cascade of field-count and segment-name checks (Table 1 and Supplementary Methods S1):
1. Records with three or fewer pipe-delimited fields → hRSV 3-field format
2. Records with nine or more fields → Normalized v1.0 format
3. Six-field records where field 2 is a known influenza segment abbreviation (PB2, PB1, PA, HA, NP, NA, MP, NS) → Avian 6-field (segment-first)
4. Six-field records where field 2 is a subtype string → Human/Influenza B 6-field (subtype-first)
5. Four-to-eight-field records where no field matches a known segment abbreviation (checked before falling back to positional rules 3–4) → No-segment variant (isolate|subtype|date|accession|clade). Because this variant has no reserved segment slot, the remaining fields are assigned by content rather than position: each field is tested against a date pattern, a clade-lineage pattern, and an accession pattern (regex-normalized EPI_ISL_\d+), and only the field that matches none of these is left as the (correctly) missing segment = “Unknown”. This prevents the failure mode described in Section 1.1, where a positional-only parser would otherwise write the date into segment and the clade into accession.
This detection requires no regular-expression compilation and correctly handles ZIP batch uploads containing mixed header types, including a mix of the four position-detected variants and the content-detected no-segment variant.
Worked example (verified against the shipped parser). Input header, institutional export with no segment field: >A/mute swan/Sweden/SVA260225SZ0594/FB000492/AB-2026|A / H5N1|2026-02-23|Unknown|2.3.4.4b|
Parsed fields: isolate = A/mute swan/Sweden/SVA260225SZ0594/FB000492/AB-2026; subtype = A / H5N1 (subtype_clean = H5N1); segment = Unknown (only this field degrades); date = 2026-02-23 (correctly recovered, not overwritten); accession = Unknown (the source header’s own literal placeholder, preserved, not guessed); clade = 2.3.4.4b (correctly recovered, not overwritten).
2.2.2. Host Inference
Host classification uses a three-tier hierarchy that resolves source-header naming ambiguities:
Tier 1 — RSV/coronavirus prefix: hRSV/, RSV/, MERS-CoV/, SARS-CoV/ in the isolate name → Human.
Tier 2 — Part-by-part classification: Each slash-delimited part of the isolate name (and each underscore-separated sub-word within it) is checked against: a curated database of 140+ avian genera (Anas, Gallus, Anser, and others), 30+ mammalian genera (Sus, Canis, Equus, and others), and word-level keyword lists for both host classes (e.g., “duck”, “teal”, “gull”, “swine”, “pig”, “seal”). Tier 2 keyword matching also recognizes a small set of common Cyrillic host terms (e.g., утка→duck, гусь→goose, лебедь→swan, курица→chicken, индейка→turkey), reflecting the mixed-language host naming already documented for Cyrillic location strings elsewhere in this parser.
Tier 3 — Structural slot count: When the host token is unrecognized by the keyword databases, the supported GISAID influenza isolate naming convention provides a structural tiebreaker: human influenza isolate names follow the four-part pattern A/Location/ID/Year and carry no host slot, whereas non-human isolate names insert a host field to become five or more parts (A/HOST/Location/ID/Year). This rule correctly classifies novel host species — for example, Podiceps cristatus (great-crested grebe) — without requiring the genus to be present in the curated database.
Two further isolate-name-level robustness fixes were found via review of a 13,491-record real institutional H3Nx dataset (applied before Tiers 1–3 run, not part of header-variant detection itself). A minority of source isolate names use “-” as the internal field delimiter instead of the GISAID-standard “/” (e.g. A-duck-Ibaraki-1-2016-E1_S1, confirmed against the same isolate correctly slash-delimited elsewhere in the same file as A/duck/Ibaraki/1/2016). Left unconverted, this causes every slash-based rule above to fail outright, since the name no longer starts with “A/” or “B/” — host, host species, and location all defaulted to Unknown, or worse, a downstream fallback scanner returned the entire mangled isolate string as a fabricated “species” value. A narrowly-scoped detector — triggered only when an isolate name contains zero slashes and begins with “A-” or “B-”, an unambiguous signal since a genuine slash-delimited name never begins this way — converts the delimiter before Tier 1–3 classification runs, without altering the isolate name as displayed or exported.
Separately, isolate names following the four-part avian/animal convention without a distinct strain-ID field (e.g. A/turkey/England/1969, Type/Host/Location/Year — structurally indistinguishable in length from genuine four-part Human-format names) were being misclassified by the Tier 3 slot-count tiebreaker as Human, which is not merely a host-field omission: because Human format reads Location from slot 1, this also silently substituted the host token as the reported location (England reported as turkey). Both host-species extraction and location extraction were changed to attempt the Tier 1–2 keyword scan before falling back to slot-count classification — matching how host-class inference already worked — so an unambiguous host keyword at slot 1 is honoured regardless of overall isolate-name length. Verified against the same 13,491-record dataset: Unknown host-species records dropped from 48 to 8 (the residual 8 are legitimately host-class Environment samples with no biological host species to report), and every other parsed field — segment, subtype, accession, collection date — reached 0% Unknown.
2.2.3. Host Biosecurity-Tier Classification
Building on the host and host-species fields (Section 2.2.2 and Section 2.2.3), VirSift v1.1 additionally classifies avian records into one of three operational biosecurity tiers, computed at parse time from the same genus/keyword data used for host inference: Wild Birds — the natural, unmanaged reservoir: migratory waterfowl, shorebirds, and pelagic seabirds, maintained entirely outside human control; Intermediate — the biosecurity-breach zone: peridomestic scavengers (crows, pigeons, gulls), backyard flocks, captive zoo populations, and game birds bred for release, where low biosecurity and high contact rates allow wild-to-domestic viral spillover; Poultry — the industrial amplification host: farmed chickens, turkeys, and domestic ducks under commercial biosecurity protocols, where high density can convert a spillover event into rapid pathogenicity escalation.
Records that are non-avian, or avian but unmatched by the curated genus/keyword tables, are labelled Unclassified rather than assigned a guessed tier. This is a heuristic classification over genus and keyword data, not a certainty — it does not overwrite or replace the underlying host/host_species fields, and is presented in the interface as an additional, overridable filter dimension. An in-app glossary panel documents the tier definitions and their surveillance rationale wherever the dimension is exposed.
2.2.4. Species Normalization
An 80-entry species-name dictionary normalizes scientific source-header tokens to conventional common names at parse time. Key mappings include Anas platyrhynchos → mallard, Gallus gallus → chicken, Corvus frugilegus → rook, and Sus scrofa → pig. Without this step, the same host species can appear under multiple labels in downstream charts (for example, “mallard” and “Anas_platyrhynchos”), artificially inflating apparent host diversity.
During institutional data review, exactly this failure mode was observed in practice: a single host species appeared under five independently-submitted text forms in one dataset — mallard, Mallard_Duck, Mallard, Anas platyrhynchos, and Anas_platyrhynchos — each counted as a separate category in downstream host-species summaries. To close this gap without requiring an exhaustive alias table, the dictionary lookup was extended with a normalization layer that (1) matches scientific-name tokens irrespective of space/underscore/hyphen separators or casing, so Anas platyrhynchos and Anas_platyrhynchos resolve to the same dictionary entry; (2) strips redundant qualifier words (duck, goose, bird, swan) before a second lookup attempt, so compound labels like Mallard_Duck resolve to the existing mallard entry without a new alias; and (3) as a final fallback for species absent from the dictionary, normalizes spacing/casing/punctuation so that at minimum all variant spellings of an unrecognized species collapse to one consistent label rather than fragmenting. The same normalization is applied to source accession identifiers (e.g., EPI_ISL_123456, EPI ISL 123456, and epi-isl-123456 all resolve to one canonical form), addressing the accession-identifier half of the fragmentation problem described in Section1.1.
Three additional mechanisms were added after review of a real multi-subtype avian dataset. First, the dictionary was expanded from 80 to 87 entries (e.g. Arenaria interpres→ruddy turnstone, Sterna paradisaea→arctic tern, three Tadorna shelduck species, Cairina moschata→muscovy duck), each added because the corresponding species appeared in real data without a dictionary entry. Second, a short common-name synonym table resolves fragments that share no normalized key with any dictionary entry — e.g. turnstone and ruddy_turnstone are a shorter/longer form of the same name, not one containing the other plus a stripped qualifier — confirmed necessary when turnstone, ruddy_turnstone, and Arenaria_interpres co-occurred as three separate categories for the same species in one dataset. Third, a compound-label extractor now handles the pattern “common name(scientific name)” (e.g. mallard(anas_platyrhynchos)), treating the parenthetical scientific name as authoritative over the free-text common-name prefix, since submitting labs’ regional common-name conventions are not controlled vocabulary. Separately, the host-biosecurity-tier classifier (Section2.2.5) was extended to recognize domestic-breed qualifiers (domestic, Pekin, bantam) and route them to the Poultry tier even when the underlying species keyword would otherwise match Wild Birds — deliberately without merging the domestic and wild forms at the host-species level, since that distinction remains epidemiologically meaningful. Net effect on the reference dataset: distinct host-species categories fell from 68 to 60.
A separate three-corpus validation study of the released tool cross-checked its host-species output against ground truth external to the tool itself — a real 92-record, 15-isolate avian dataset with independently known host identities — rather than only against the tool’s own internal consistency. This surfaced one further synonym-table gap: the bare common-name fragment teal (as opposed to the already-covered eurasian_teal) had no entry pointing to the canonical common_teal label, so eight records of one isolate’s eight-segment genome were left in a separate teal category from the other fourteen isolates’ common_teal records. The missing entry was added; the isolate-level host-species distribution then matched the external ground truth exactly across all fifteen isolates. This class of defect — a plausible-looking but silently incorrect value, as opposed to a missing one — is undetectable by the tool’s own internal-consistency checks by construction, and was found only because independent ground truth existed to compare against.
The same external cross-check surfaced a second defect: subtype_clean retained the raw, unnormalized subtype string (for example A_/_H3 rather than H3) for haemagglutinin-only or neuraminidase-only submissions, where the cleaning pattern required a full subtype pair (e.g. H3N8) and had no fallback for a single-gene designation. Affected three of the fifteen isolates in the cross-checked dataset, and — checked separately against the large real institutional H3Nx dataset referenced above — forty-two of its 13,491 records. A fallback pattern matching the haemagglutinin or neuraminidase designation alone, used only when the full pair does not match, resolved both.
2.2.5. Parsed Fields
Every sequence, regardless of input format, produces a standardized record containing: isolate name, subtype (raw and cleaned), segment, geographic location, host class, host species, collection date, full clade designation, hierarchical clade levels 1–6, source accession identifier (for example, a GISAID EPI_ISL identifier or an NCBI/GenBank accession), nucleotide sequence, sequence length, and a 12-character molecular identity hash (MD5). Two further fields flag rather than discard ambiguous input: is_reassortant_segment (boolean), set when the segment field itself contains multiple recognized segment tokens (e.g., HA/NA) rather than a single value — the combined tag is retained verbatim; and subtype_isolate_embedded, set when a subtype pattern found embedded in the isolate/strain name conflicts with the header’s own subtype field — both values are retained rather than one silently overwriting the other. The biosecurity tier described in Section 2.2.5 is also added to every parsed record.
2.2.6. Header Diagnostic Panel
A diagnostic panel in the Sequence Refinery page surfaces, for the active dataset, which of the content-aware corrections described above were actually applied: the count and percentage of records recovered via the no-segment variant (Section 2.2.1), the count of records with a retained reassortant segment tag, the count with a flagged embedded-subtype conflict, and the count with no accession number in the source data. The panel also displays a sample of original-header-versus-parsed-field pairs and a reference list of known-good header examples, so that a user with non-standard source data can see specifically what the parser inferred and why, rather than only observing a downstream “Unknown” value with no explanation.
Beyond diagnostics, the panel provides one corrective action: for a field the automatic parser could not confidently resolve (e.g. host species still “Unknown” after all rules above), the user selects the field, the affected isolate, and enters the correct value; the correction is applied to every record sharing that isolate name – propagating consistently across an isolate’s multiple genome segments — and is written to the working (filtered) dataset only, never the immutable active dataset, with the action recorded in the same session audit log as every other filtering operation. Correcting host species also triggers recomputation of the derived biosecurity tier (Section 2.2.5) for the same records, since the tier is not independently editable.
2.3. Quality Filtering and Exact-Sequence Redundancy
The Sequence Refinery page, corresponding to Page 3 of the workflow, provides seven filtering and exact-sequence redundancy operations. Each operation is implemented using a vectorized pandas Boolean mask:
- Minimum sequence length — removes records shorter than the user-specified nucleotide threshold.
- Maximum N-run — removes sequences containing stretches of undetermined bases that exceed a specified length.
- Date range — restricts the analysis to a specified collection period.
- Host, subtype, segment, and location — provides multiselect filters for categorical metadata fields.
- Custom header filter — provides eight matching operators—equals, not equals, contains, does not contain, starts with, is one of (list), date range, and regular expression—for any available column, each presented with a translated field/operator label rather than the raw internal column or operator name.
- EPI_ISL accession filter — accepts a pasted list of accession numbers to include or exclude specified records. Accession matching is normalized before comparison, so a pasted list using inconsistent spacing or casing (e.g., EPI ISL 123456 vs. EPI_ISL_123456) still matches the corresponding dataset records.
- MD5 exact-sequence redundancy filter — identifies records with identical normalized nucleotide strings through their MD5 digests; an optional mode additionally requires agreement in subtype designation. The digest is used as a computational identity key and is not interpreted as evidence of biological clonality or epidemiological linkage.
All active filter criteria are combined using the logical AND operator and applied in a single data pass. The active filter state is recorded in the session audit log and can be exported in CSV or JSON format for methods documentation and workflow reproducibility. Representative quality, metadata, accession, and exact-sequence redundancy controls are shown in Figure 2A–B.
2.4. Human-in-the-Loop Temporal Sampling
The six human-in-the-loop temporal sampling strategies are summarized in Table 2 and described in Supplementary Methods S2. For workflow routing, VirSift assigns operational temporal-span labels from the observed collection_date range: Micro (<90 days), Seasonal (90–270 days), and Long-span (>270 days; labelled “Endemic” in the version 1.0 interface). These labels describe the observed date span only and do not establish epidemiological endemicity. A colour-coded recommendation panel presents a strategy associated with the observed span. The panel and strategy selector are illustrated in Figure 2C.
All strategies retain two mandatory temporal anchors: the globally earliest and globally latest sampled sequences, irrespective of the remaining selection criteria. This preserves the observed temporal endpoints of the dataset and prevents the earliest and latest sampled records from being inadvertently excluded.
Strategy 1: Chronological Sentinel. The observed date range is divided into proportional temporal bins: weekly bins for Micro datasets, monthly bins for Seasonal datasets, and quarterly bins for Long-span datasets. One representative sequence is selected from each bin. This strategy produces relatively uniform temporal coverage and is appropriate for long-span datasets in which no particular epidemic peak is the primary object of investigation.
Strategy 2: Highest Volume Peaks. Weekly sequence-count totals are aggregated from the available collection dates, after which a signal peak-detection algorithm implemented with SciPy [32] identifies candidate crests using a researcher-controlled sensitivity parameter. A value of 0.1 detects relatively minor fluctuations, whereas a value of 1.0 retains only major waves. The detected periods are algorithmic candidates rather than statistically significant epidemiological peaks.
Strategy 3: Peak Checklist. Detected peaks are presented as interactive checkboxes accompanied by their sequence counts and collection-date ranges. The researcher selects the peaks considered biologically or epidemiologically relevant. For example, a March spike known to reflect increased testing rather than increased viral activity may be excluded. Only sequences associated with the selected peak periods are included in the curated output.
Strategy 4: Custom Checkpoints. The researcher specifies exact target dates or months. A tolerance window ranging from 3 days to 3 months, or a custom interval of up to 365 days, defines the selection zone surrounding each checkpoint. This strategy is designed for inter-seasonal or overwintering surveillance, including the forced retention of July–August sequences that might otherwise be excluded by volume-based strategies.
Strategy 5: Visual Lasso. Weekly sequence counts are displayed as an interactive epidemic-curve bar chart. The researcher drags across the chart to highlight periods of interest, and the selected bars define the extraction zone. This strategy is designed to support the identification and exclusion of contextual artefacts. For example, where a researcher knows that a March 2020 spike represents a change in sampling policy rather than a viral event, that period can be excluded while epidemiologically informative adjacent periods are retained.Strategy 6: Clade-Based Monthly Filter. The researcher selects one or more clades present in the active dataset. Within each selected clade, records are grouped by calendar month and the first, last, or both records per month are retained, so the temporal spread of a single clade’s diversity is preserved independently of how frequently that clade was sampled relative to others. An option controls whether each selected clade’s monthly buckets are treated independently (default) or pooled across all selected clades into one shared set of monthly buckets. This strategy targets a different axis than Strategies 1–5, which operate on the whole active dataset’s date distribution regardless of clade; Strategy 6 is intended for tracking how a specific clade’s sampled diversity changed over time, e.g., across a multi-season 3C.2a1b.2a.2a.3a.1 lineage such as the one described in Section 3.1.
2.4.1. Enhanced Temporal Diversity Filter
A separate filtering step, presented outside the HITL strategy selector, supports balanced subsampling across arbitrary combinations of categorical attributes — host, host species, biosecurity tier, location, clade, clade level 1, segment, and cleaned subtype — rather than the date-only grouping used by Strategies 1–6. The researcher selects any combination of these fields to group by, a field to sort within each group (by default, collection date), and whether to keep the first, last, or both record(s) per group. This addresses a distinct curation need from temporal sampling: for example, retaining one representative sequence per (host, location) combination to avoid a single well-sampled site or species dominating a comparative analysis, independent of when those sequences were collected.
2.5. Multi-Dimensional Scope Filtering
The Analytics page and Molecular Timeline page, corresponding to workflow Pages 5 and 4, respectively, provide a seven-dimensional scope filter that is applied after the per-file selector. The available dimensions are segment, cleaned subtype designation, host class, host species, host biosecurity tier, geographic location, and primary clade level.
All active dimensions are combined using the logical AND operator. This permits fine-grained comparative analysis—for example, “H5N1 HA sequences from mallards in Asia, clade 2.3.4.4b”—without modifying the underlying baseline dataset.
2.6. Analytics Visualisation Suite
The Analytics page provides ten chart types mapped to common genomic-surveillance visualisation requirements, as summarised in Table 3. All chart types share a per-file scope selector, a seven-dimensional scope-filter expander, inline title editing, and a colour-palette selector. Three chart types merit further description.
Sunburst and Treemap: clade hierarchy. These visualisations use a three-level hierarchy consisting of host, subtype, and full clade designation. Branch or cell sizes are proportional to their child totals. The complete clade designation—for example, 3C.2a1b.2a.2a.3a.1—is displayed at the leaf level, providing the most granular clade resolution available in the input data. The Treemap uses a continuous Viridis colour scale with white cell borders to improve contrast.
Gantt chart. The Gantt visualisation presents temporal spans using a researcher-selectable grouping field. Bars may represent subtype, host species, geographic location, or another categorical variable. Each bar spans the earliest and latest collection dates observed for the corresponding category. When the first and last dates are identical, one day of padding is applied so that categories represented by a single collection date remain visible.
N-level Sankey diagram. The Observatory supports the selection of up to five categorical levels. Coloured flow bands connect the selected levels, and visible link widths are proportional to sequence-record counts. Duplicate selection of the same level is prevented. Available download formats are HTML, Plotly JSON [33], PNG, and CSV for the underlying links table. Representative Observatory and Analytics interfaces are provided in Supplementary Figure S3 and Figure S4.
Clade-field visualisations surface a distinction worth stating explicitly: the source clade field can hold the literal value “unassigned” (written by GISAID’s own clade-calling pipeline to mean “not yet assigned to a clade,” most commonly for avian subtypes lacking Nextstrain-style clade nomenclature built around human-seasonal H3N2), which is categorically different from VirSift’s own “Unknown” placeholder for a genuinely blank source field. Verified against the reference dataset restricted to the HA segment (n=1,693): 73.1% unassigned, 18.1% Unknown, with the remainder distributed across five named clades. Collapsing these into one “no clade” bucket would discard real information about why a record lacks a clade assignment; the interface keeps them as distinct values and displays an explanatory caption wherever a clade chart contains unassigned records.
2.7. Molecular Timeline Tracker
The four-phase Molecular Timeline workflow shown in Figure 3 addresses a question that cannot be answered by aggregate Analytics visualisations alone: not merely how many sequence records occur in each month, but which exact nucleotide sequences are detected across multiple months [34,35]. Within this workflow, an exact-sequence identity group (termed a “molecular clone” in parts of the version 1.0 interface) is operationally defined as records sharing an identical normalized nucleotide string and the same MD5 digest. This definition does not imply common patient origin, direct transmission, or biological clonality.
Phase 1: Diagnostics. A key-performance-indicator panel reports the total number of sequences, the number of exact-sequence identity groups represented by distinct MD5 digests, and the number of records belonging to multi-member identity groups, which is reported as exact-sequence redundancy burden. A horizontal bar chart displays the top-N identity groups ranked by record count.
Phase 2: Configuration. The researcher specifies a minimum group-size threshold and selects one of four representative-selection modes for choosing a canonical sequence from each exact-sequence identity group: Earliest, Latest, Highest Quality, or Random. Under the Highest Quality mode, the sequence containing the fewest undetermined N bases is selected.
Phase 3: Interactive Matrix. An editable matrix displays exact-sequence identity groups as rows and calendar months as columns. Cells corresponding to the first and last observed occurrence of each group are automatically selected and locked. The researcher may select intermediate months to define the interval retained during curation. An “Auto-fill intermediate months” option pre-fills all months between the first and last occurrence; these filled cells represent an inferred interval between anchors and not independent sequence observations unless records were present in those months. Turning the option off restores the anchor-only state. The matrix state is persisted before rendering so that the downloadable CSV reflects the current checkbox configuration.
Phase 4: Export and Visualisation. Three visualisation modes are available through a selector. The Epidemic Curve presents a before-and-after bar-chart comparison showing the record-count compression achieved through curation. The Monthly Heatmap presents a pivot table of observed or selected monthly states for each exact-sequence identity group. The Persistence Gantt displays one temporal bar per group, extending from its first to its last detection date and ordered by first detection. Export formats include filtered FASTA, metadata CSV, and a per-file ZIP archive when multiple source files contribute to the output.
Sub-threshold group pass-through. Records belonging to identity groups below the selected minimum-size threshold are not silently discarded. The first and last records associated with each sub-threshold group are automatically retained as temporal anchors and merged into the export. For a true singleton, the first and last record are the same sequence and are included only once. A caption reports the number of automatically retained sub-threshold records, including singletons.
2.8. Export Architecture
The Export page (Page 6) provides filtered FASTA, metadata CSV, session-log export (CSV or JSON), accession lists, split-by-column export, and a Segment Folder Structure builder. A header-format toggle, applied consistently across every FASTA download on this page and in Sequence Refinery, allows the exported header to be written either in the standard six-field GISAID-style form (isolate|subtype|segment|date|accession|clade) or a full nine-field form that additionally writes the host and location fields into the exported header text — restoring information that the six-field form does not carry, for workflows downstream of VirSift that expect host/location in the header itself rather than only in the accompanying metadata CSV. Representative export interfaces are provided in Supplementary Figure S5.
The Segment Folder Structure builder creates a ZIP archive organized by influenza gene segment with three data-source modes: scaffold-only (empty folders with .gitkeep), from-export (the active export dataset filtered to the matching segment), and nested (when a non-segment split has been previewed: segment folders each contain sub-folders per split-key value). A live tree preview renders before ZIP generation, and optional README.txt files and a dataset_summary.csv are generated in the user’s selected language. Representative machine-readable metadata and methodology exports generated during technical testing are supplied as Supplementary Data S2 and Supplementary Data S3.
2.9. Multilingual Architecture
VirSift exposes six selectable JSON language catalogues—English, Russian, French, Spanish, Arabic, and Chinese—each containing the same 921 user-facing keys (817 in the originally described catalogue, plus 104 added across this development cycle for the header-diagnostic panel and its manual-fix action, the biosecurity-tier classifier, the two new temporal/diversity filters, related interface-clarity labels, and the Sankey chart’s expanded level selectors, additional color palettes, and color-legend label, plus a full-resolution Clade dimension in the Analytics scope filters). English and Russian contain complete or near-complete native-language values (100% and 99.0% respectively). A subsequent full-catalogue translation pass closed the majority of the remaining gap in French, Spanish, Arabic, and Chinese as well: native-language coverage now stands at 94.2% (French), 98.0% (Spanish), 98.9% (Arabic), and 98.6% (Chinese), verified programmatically against the live catalogue files. The residual English-identical entries in these four languages are predominantly proper nouns, format names (e.g. FASTA, HTML), and language-specific cognates (e.g. “Segment”/”Clade” in French, spelled identically to English) rather than untranslated content, though a small number of genuinely untranslated strings remain and are tracked for a follow-up pass. This paper reports the current catalogue structure and native-language coverage percentages as measured programmatically, but does not claim native-speaker linguistic-quality review, right-to-left usability testing, or cross-language task-performance testing.
Russian terminology was developed with reference to Rospotrebnadzor usage, and French terminology follows WHO laboratory and regional conventions where applicable [26,27]. The structural key-parity check covers navigation, chart labels, download controls, tooltip help text, export metadata headers, README content, dataset-summary fields, processing notices, and sequence-data interpretation disclaimers. The six catalogues are distributed with the source code under assets/translations/. Detailed page-by-page user guidance and translation-contributor procedures are designated for the VirSift repository documentation rather than the main manuscript and should be linked from the README before submission.
3. Results
3.1. Application to H3N2 Haemagglutinin Sequences from Novosibirsk, 2021–2025
We applied VirSift to 59 H3N2 hemagglutinin sequences from Novosibirsk, Russia, spanning October 2021 to April 2025. The complete list of GISAID EPI_ISL accession identifiers used in the analysis is provided as Supplementary Data S1.
Quality filtering results:
| Filter step | Sequences remaining |
| Initial corpus | 59 |
| After exact-sequence redundancy filtering | 47 (12 redundant records removed; 20.3% reduction) |
| Available for sub-sampling | 47 |
No sequences were removed by length or date filters, as all records carried full-length hemagglutinin segments and valid collection dates.
Temporal-span classification and sampling: The dataset spans 1,279 days (October 2021–April 2025), placing it in the software-defined Long-span category (>270 days; labelled “Endemic” in the version 1.0 interface). This classification refers only to the observed collection-date span and does not indicate epidemiological endemicity. VirSift recommended Custom Checkpoints or Peak Checklist for this multi-year dataset. Nine distinct calendar months across four influenza seasons contained sequence records, representing a sparse but longitudinal regional surveillance dataset.
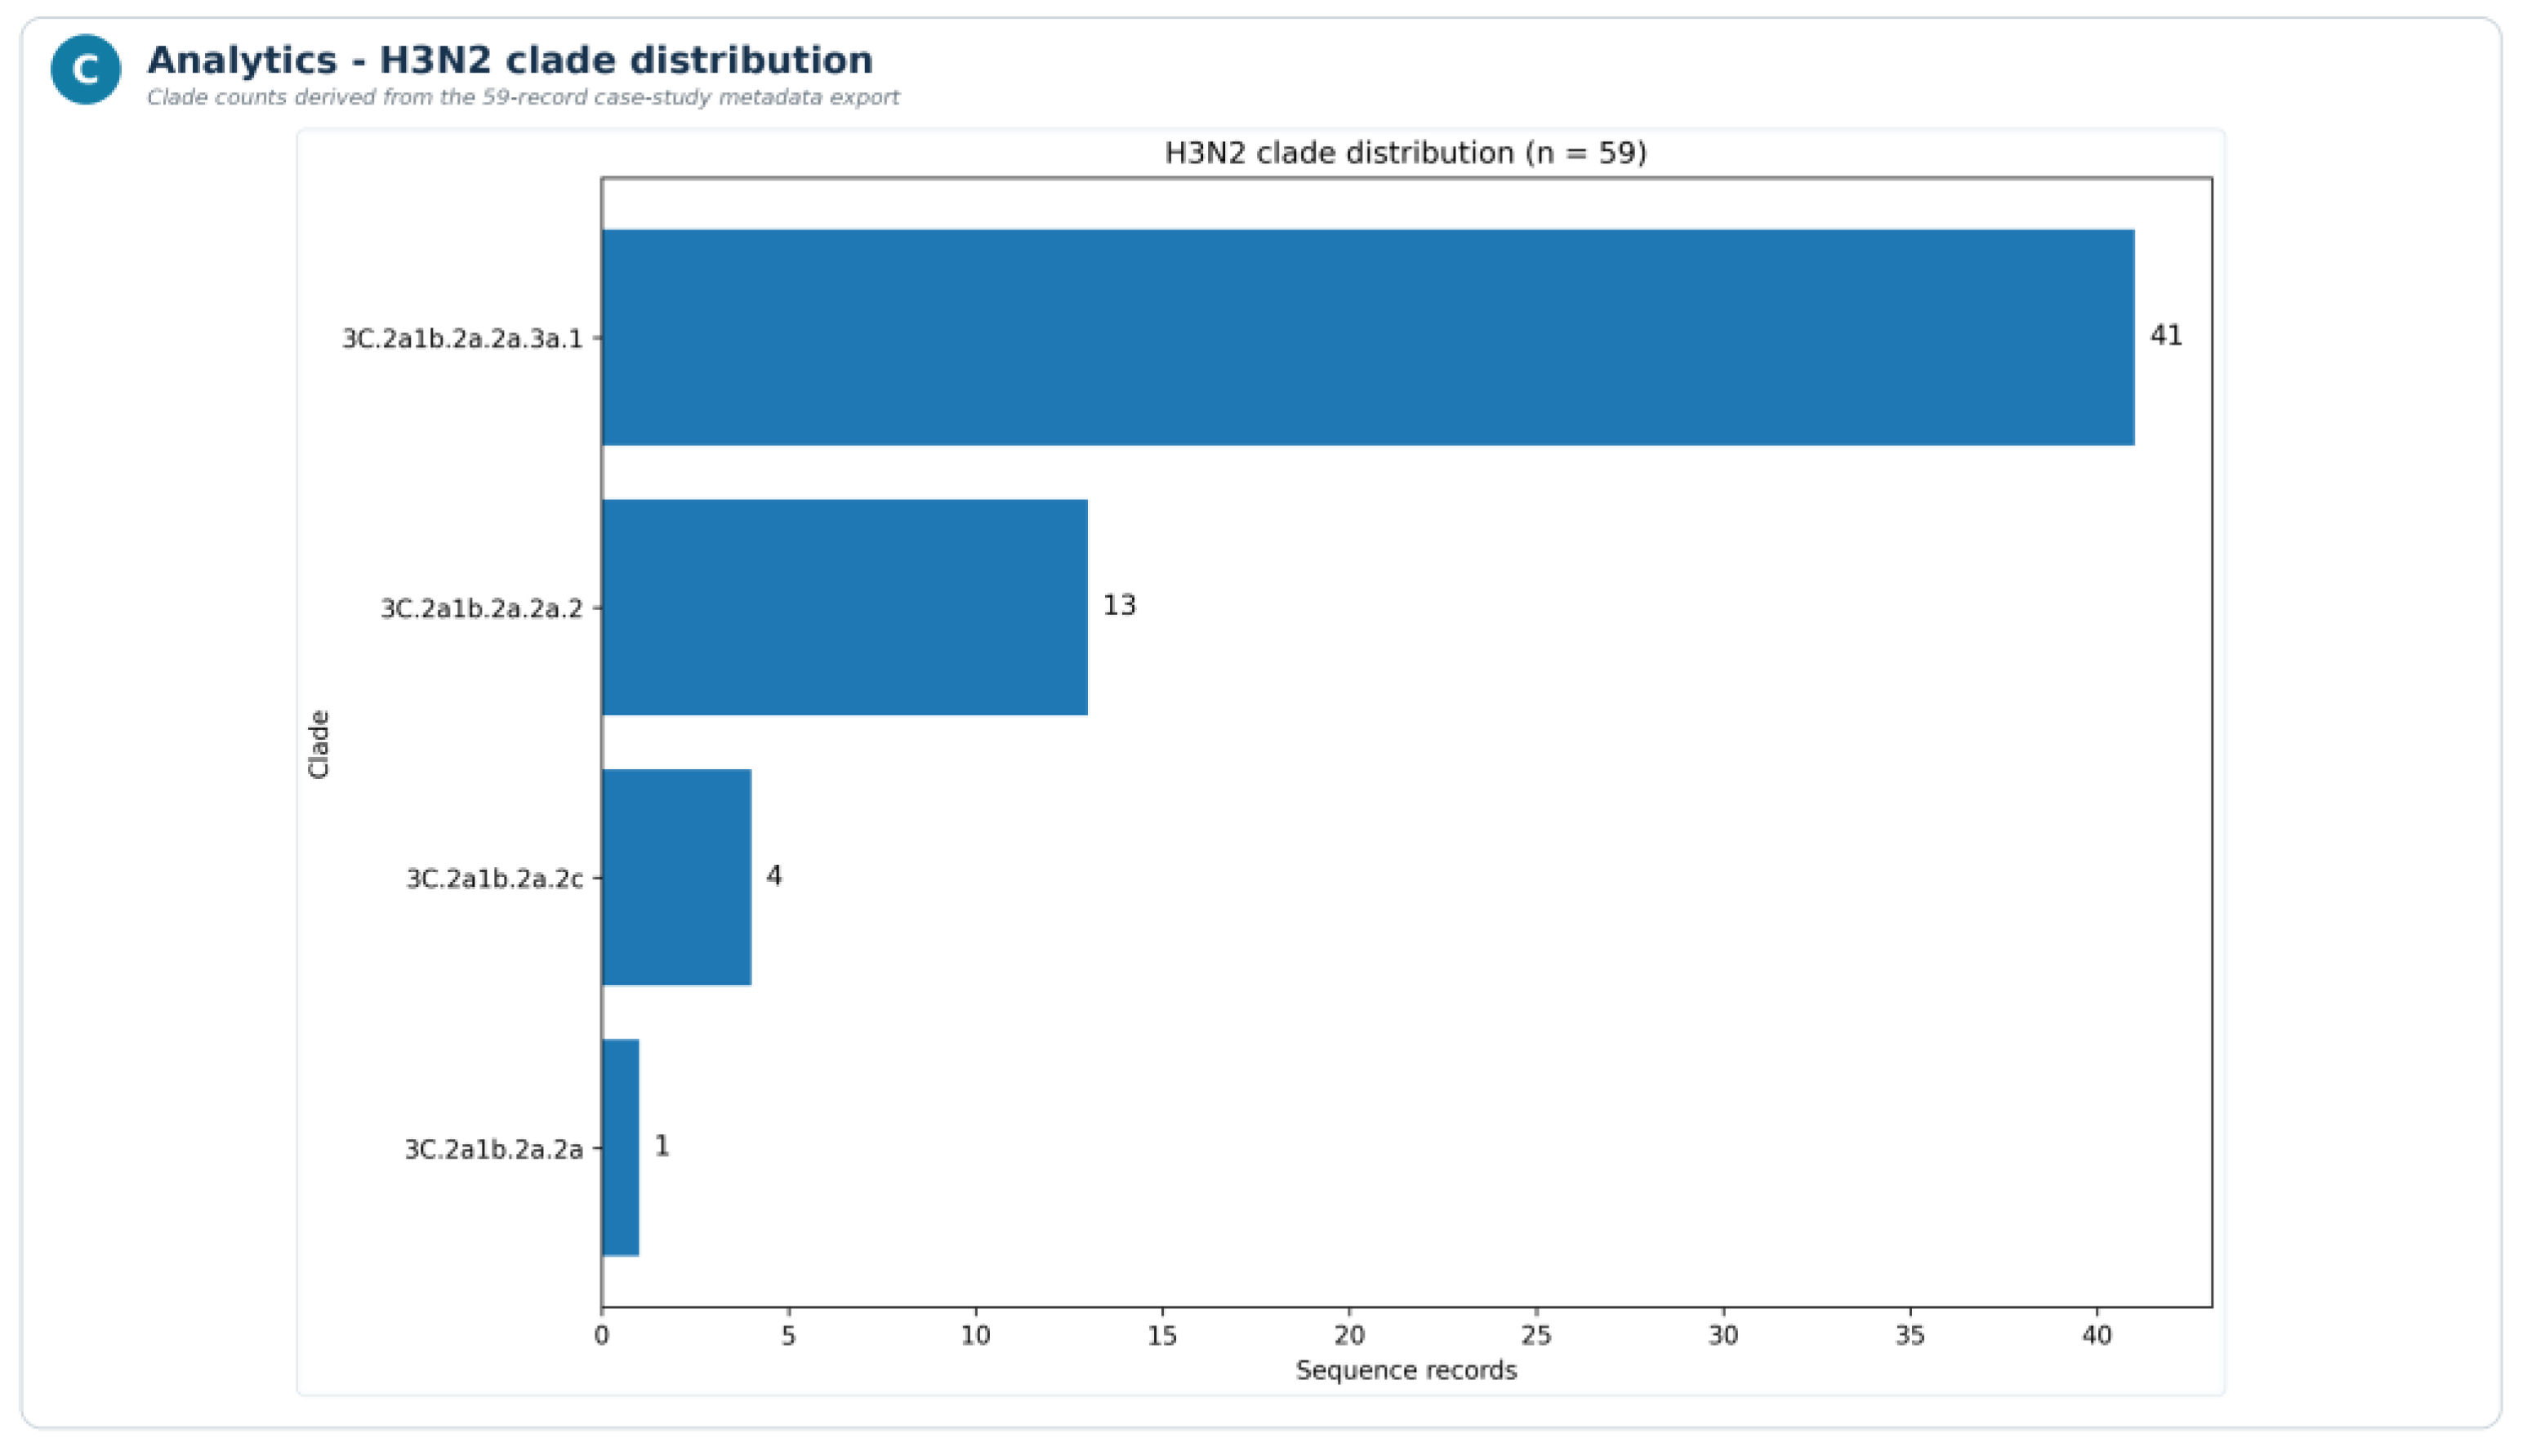
Clade distribution: Sunburst hierarchy visualisation (host → H3N2 → full clade designation, depth 3) showed clade 3C.2a1b.2a.2a.3a.1 as the dominant lineage, accounting for 69.5% of records (41 of 59; Figure 4). Three additional subclades were identified: 3C.2a1b.2a.2a.2 (22.0%), 3C.2a1b.2a.2c (6.8%), and 3C.2a1b.2a.2a (1.7%). The observed pattern is compatible with published H3N2 clade reports, although the present case study was not designed as an independent clade-surveillance validation [36,37].
Molecular Timeline: All 47 unique sequences formed separate exact-sequence identity groups (one unique normalized sequence per MD5 digest). The monthly matrix showed sampling across four influenza seasons (2021–22, 2022–23, 2023–24, and 2024–25), with no identical sequence observed across all four seasons. This is compatible with known H3N2 temporal turnover but should not be interpreted as a formal evolutionary or transmission analysis [10,36].
The parser and host-normalization changes described in Section 2.2.1/Section 2.2.3 were verified not to alter the record counts, redundancy count, or clade distribution reported above for this dataset, since none of its 59 records use the newly added header variant.
Figure 5.
A. Representative quick downloads and per-source-file exports in FASTA, metadata CSV, methodology JSON, and ZIP formats. The displayed counts come from a separate interface-demonstration dataset. B. Molecular Timeline curation downloads and metadata-based split export. C. Segment-folder builder showing segment selection, folder-content controls, and the live ZIP tree preview.
Figure 5.
A. Representative quick downloads and per-source-file exports in FASTA, metadata CSV, methodology JSON, and ZIP formats. The displayed counts come from a separate interface-demonstration dataset. B. Molecular Timeline curation downloads and metadata-based split export. C. Segment-folder builder showing segment selection, folder-content controls, and the live ZIP tree preview.
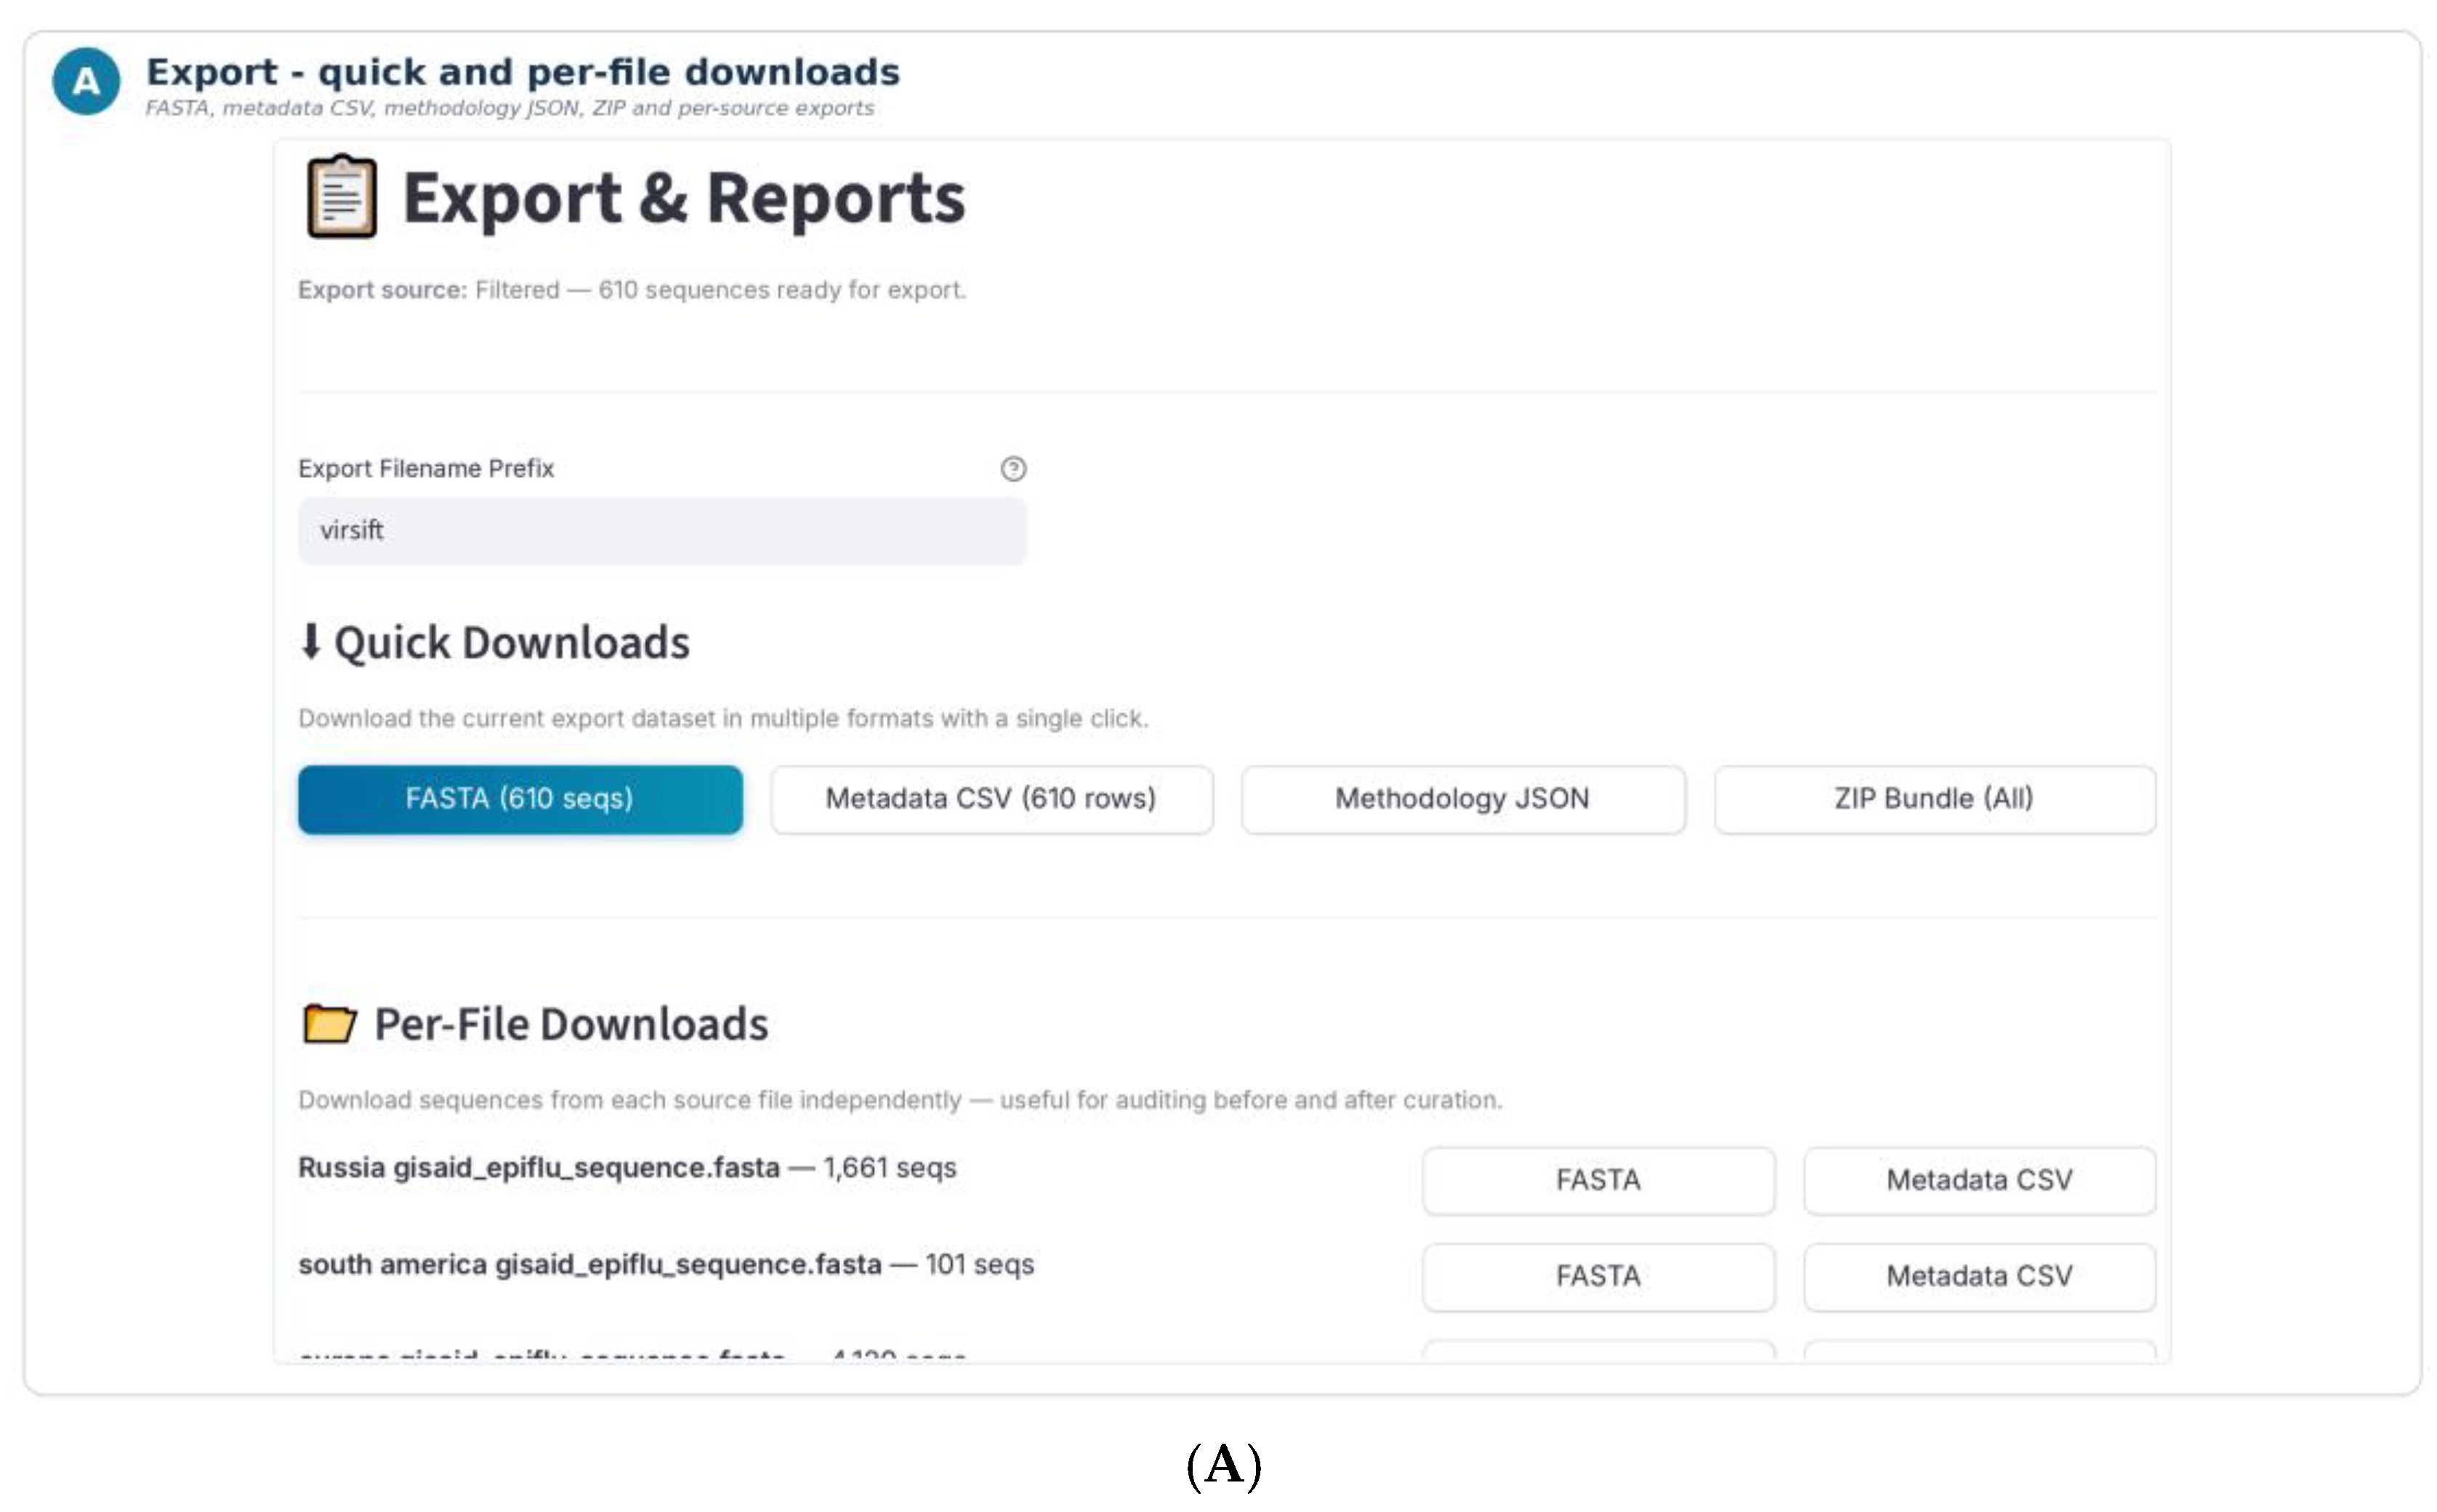
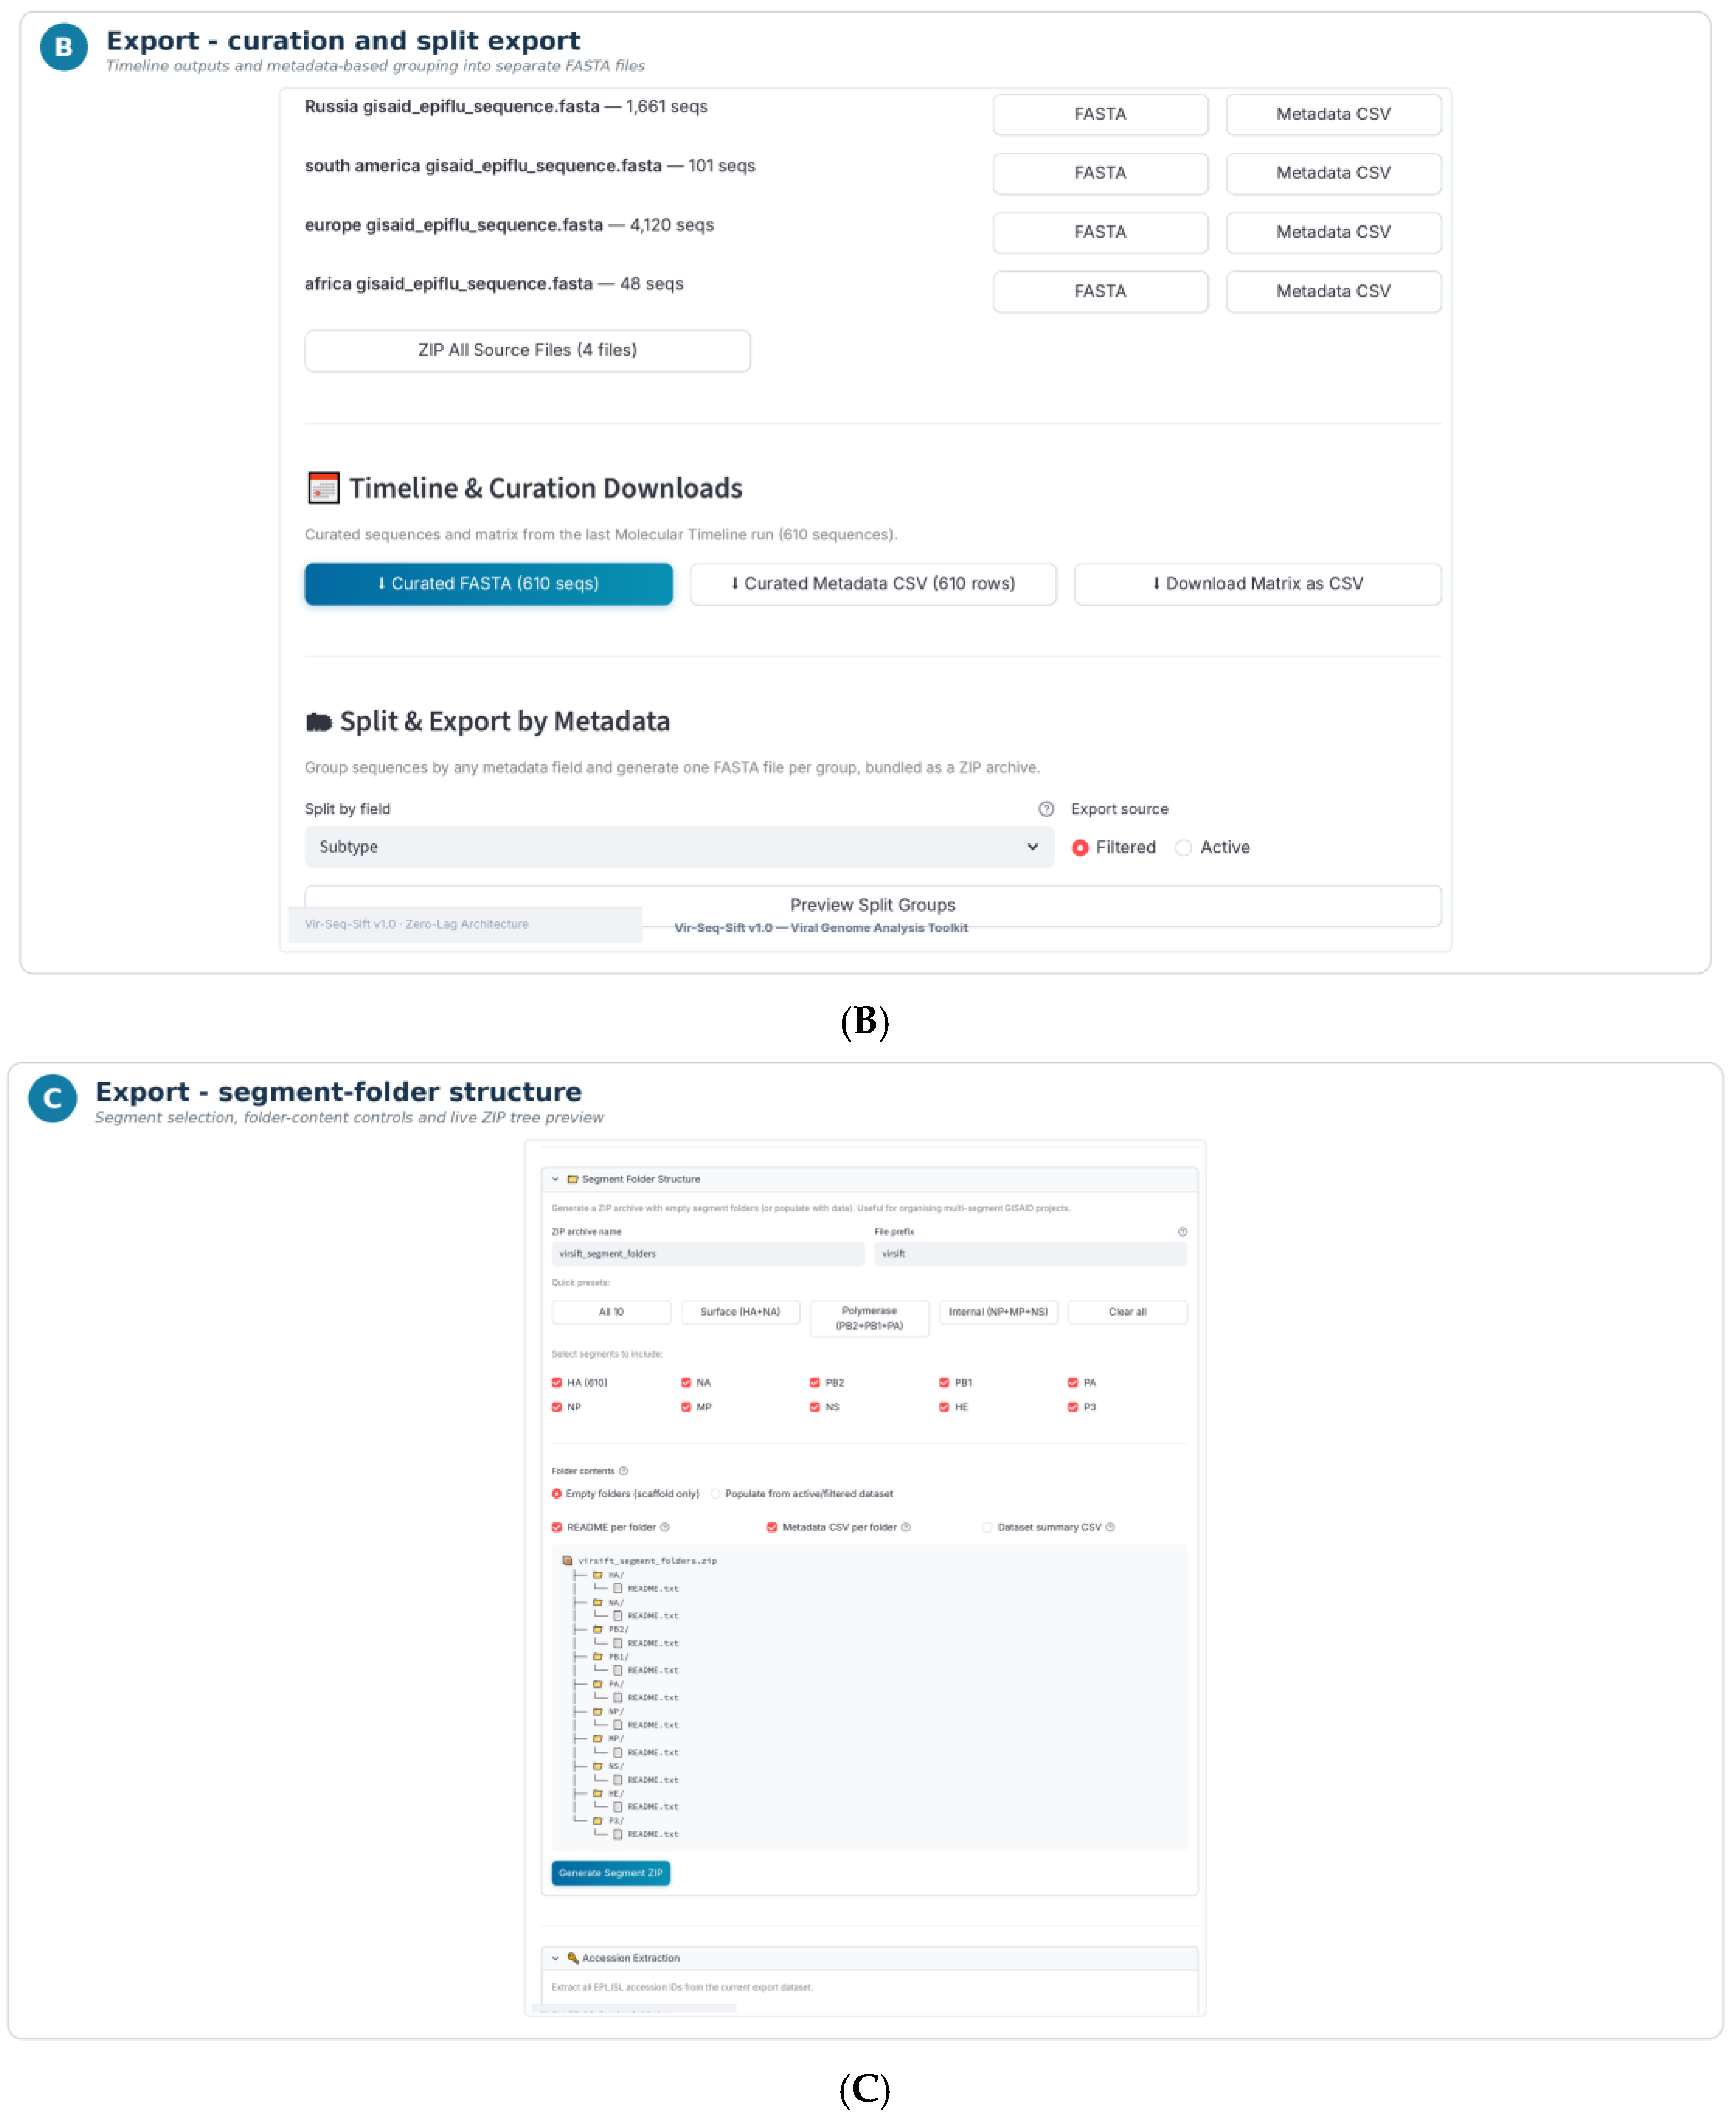
Figure 6.
H3N2 clade distribution derived from the 59-record case-study metadata export; clade 3C.2a1b.2a.2a.3a.1 is dominant.
Figure 6.
H3N2 clade distribution derived from the 59-record case-study metadata export; clade 3C.2a1b.2a.2a.3a.1 is dominant.
3.2. Functional Verification of Multi-File Batch Ingestion and Metadata-Based Export
To evaluate VirSift’s multi-file workflow, the 59-sequence H3N2 dataset was partitioned into five non-overlapping FASTA files according to calendar year. The files contained 17 sequences from 2021, 1 from 2022, 23 from 2023, 15 from 2024, and 3 from 2025. All five files were uploaded simultaneously through the VirSift Workspace.
VirSift parsed each FASTA file independently, retained its source-file identity, and displayed the corresponding sequence count, date range, segment information, and parsing time. The five files were then activated as a single merged dataset containing 59 sequences. Because the merged total equalled the sum of the individual file counts, no records were lost or added during parsing or merged activation.
The merged dataset was subsequently partitioned again by calendar year using the Split & Export by Metadata function. VirSift reproduced five FASTA groups containing 17, 1, 23, 15, and 3 sequences, respectively, with a combined total of 59 sequences. This round-trip count reconciliation verified preservation of record counts across the multi-file ingestion, merged activation, and metadata-based split-export workflow (Supplementary Figure S2).
This exercise was a limited functional verification of file-count preservation and round-trip metadata-based export, not a comprehensive validation of parser accuracy, analytical correctness, performance, or usability. Biological observations were derived from the complete H3N2 dataset and are reported in Section 3.1. A matrix distinguishing directly observed checks, case-study outputs, documented implementations, and items pending formal validation is provided as Supplementary Table S1.
4. Discussion
4.1. Position in the Influenza Surveillance Informatics Ecosystem
VirSift is designed as a pre-phylogenetic curation stage rather than a replacement for phylogenetic tools. The intended workflow is: GISAID or NCBI/GenBank batch download → VirSift curation and subsampling → exported FASTA → IQ-TREE [25], BEAST2 [24], or Nextstrain [22]. Its contribution is the integration of documented curation operations within a browser-delivered interface for users who may not routinely build command-line pipelines.
VirSift is therefore positioned as complementary to Nextstrain, including augur filtering and Auspice visualisation, rather than as a replacement. Researchers requiring established phylogenetic reconstruction, model-based inference, or production-scale Nextstrain builds should continue to use those dedicated tools. VirSift is intended for pre-phylogenetic preparation, inspection, and documented export.
4.2. Strengths of the HITL Sampling Model
The six-strategy HITL model reflects the practical need for domain interpretation when surveillance records are temporally uneven. Algorithmic optimization for coverage or volume may retain periods shaped by testing policy and exclude low-volume intervals that a researcher considers biologically relevant. Examples from regional avian-influenza surveillance illustrate the importance of contextual interpretation of sparse or inter-seasonal detections 17,18. VirSift therefore records user selections rather than presenting the sampling result as an objectively optimal epidemiological subset. The Clade-Based Monthly Filter (Strategy 6) extends this same philosophy to clade-level rather than whole-dataset temporal sampling.
The Custom Checkpoints strategy is intended for inter-seasonal and overwintering questions [34] in which low-volume summer observations may need to be retained despite proportional sampling. The expandable tolerance window accommodates uncertainty in field-collection timing; its selected value should be reported as a user-defined methodological parameter rather than treated as a universally validated threshold.
4.3. Multilingual Infrastructure as a Research Enabler
The multilingual architecture provides six selectable catalogues with complete or near-complete native-language values in English and Russian (100% and 99.0% respectively) and, following a subsequent full-catalogue translation pass, predominantly native-language values in French, Spanish, Arabic, and Chinese as well (94.1%, 98.0%, 98.9%, and 98.6% respectively). Russian terminology was developed with reference to relevant institutional usage, and WHO laboratory conventions informed terminology where applicable 26,27. The architecture can support incremental language completion, but this paper does not demonstrate equivalence of wording, usability, accessibility, or task performance across the six languages.
All six catalogues contain the same 921 keys. Future language work now has a small, well-characterized residual (largely proper nouns and cognates, plus a handful of un-batched strings) rather than a substantial translation backlog, without changing the interface key structure. Formal native-speaker linguistic-quality review, Arabic right-to-left behaviour, cross-browser rendering, and multilingual usability are reserved for the separate validation programme.
4.4. Current Limitations and Future Development
| Limitation | Planned resolution |
| No phylogenetic reconstruction | Out of scope (Nextstrain/IQ-TREE as downstream tools) |
| No dN/dS or selection pressure analysis | Planned for v2.0 via codon-level variant comparison |
| Longitudinal lifecycle analysis not yet implemented | Feature specification in progress; target v2.0 |
| Peak detection not yet a standalone module | Signal processing algorithms currently integrated inline; standalone module planned for Phase 4 |
| Visual Lasso cross-browser usability not yet formally benchmarked | Implementation is described here; cross-browser and usability testing are reserved for the separate validation study. |
| Formal benchmark suite not yet run | Reserved for the separate validation study; the present paper reports only limited functional checks. |
| Docker container / pip package not yet available | Planned after publication milestone |
| Host biosecurity-tier classification is a genus/keyword heuristic and may misclassify rare, ambiguous, or newly-described host species | Expand curated genus/species tables from surveillance literature; evaluate supervised-learning classification for v2.0 |
| Clade-Based Monthly Filter and Enhanced Temporal Diversity Filter groupings are not yet cross-validated against the original strategies for consistency of retained-record counts | Reserved for the separate validation study, consistent with Strategies 1–5 |
Sampling and host context: The value of interactive subsampling is methodological rather than inferential: VirSift records and exports the researcher’s selection but does not claim that any retained subset is epidemiologically optimal. Influenza A ecology spans wild-bird reservoirs and multiple host lineages, making host composition a biologically meaningful part of curation rather than a cosmetic metadata field [38,39]. More generally, simulation studies show that non-representative sampling can distort phylogeographic reconstruction [40]. These observations support preserving the sampling rationale and host context in the audit trail, while leaving formal evolutionary inference to downstream tools.
Sequence curation and reproducibility: Exact-sequence deduplication is one of several established FASTA/Q curation operations; tools such as SeqKit likewise provide deduplication, filtering, splitting, and sampling functions [41]. VirSift differs in combining these pre-phylogenetic operations with browser-based inspection and export, but the reproducibility requirement is the same: software versions, parameter choices, intermediate decisions, and exported artefacts should be recoverable [42]. Usability and portability are also recognised concerns in computational-biology software design [43,44], and FAIR principles provide a broader rationale for machine-readable, reusable data and metadata outputs [45]. VirSift’s audit log and methodology snapshot are therefore best interpreted as provenance aids, not as substitutes for independent validation.
Accessibility and surveillance capacity: The rationale for a browser-delivered and multilingual interface is also bounded. WHO’s global genomic-surveillance strategy calls for stronger end-to-end capacity, including analysis and data sharing, across countries and surveillance networks 46. African bioinformatics initiatives have documented persistent constraints in training, infrastructure, and local analytical capacity 47,48. During the COVID-19 pandemic, sequencing intensity, turnaround time, metadata completeness, and public data availability varied markedly between countries and income groups 49,50. These findings support attention to accessible analytical interfaces, but they do not establish that multilingual software alone reduces surveillance inequity. That proposition requires direct usability and implementation studies in the intended settings.
Accessibility and surveillance capacity: The rationale for a browser-delivered and multilingual interface is also bounded. WHO’s global genomic-surveillance strategy calls for stronger end-to-end capacity, including analysis and data sharing, across countries and surveillance networks [46]. Regional initiatives across sub-Saharan Africa, Latin America, and South/Southeast Asia have documented persistent, parallel constraints in institutional funding, supply chains, and local bioinformatics capacity [47,48,49,50]. During the COVID-19 pandemic, sequencing intensity, turnaround time, metadata completeness, and public data availability varied markedly between countries and income groups worldwide [51,52]. These findings support attention to accessible analytical interfaces globally; by eliminating complex local software dependencies and high-spec hardware requirements, browser-based applications lower the technical barrier to entry for resource-limited laboratories. However, while such digital accessibility enhances operational feasibility, it does not establish that multilingual software alone reduces global surveillance inequity. That proposition requires direct usability and implementation studies in diverse, real-world public health settings.
5. Conclusions
VirSift provides a browser-delivered, auditable workflow for pre-phylogenetic curation of supported GISAID-style and NCBI/GenBank-compatible influenza sequence datasets. The software integrates supported header parsing with content-aware recovery of incomplete headers and a diagnostic panel reporting what was auto-corrected, exact-sequence redundancy assessment, six HITL temporal sampling strategies and a separate multi-attribute diversity filter, ten visualisation types, exact-sequence persistence analysis, host biosecurity-tier classification, six selectable language catalogues, and structured export with a selectable header-field format. This paper describes the implemented system and demonstrates its operation on a 59-record H3N2 dataset with a limited multi-file count-reconciliation exercise. Comprehensive analytical, performance, usability, and multilingual validation is outside the scope of this paper and is being addressed separately. The application is implemented with Streamlit [28].
Ethics approval: Not applicable. This study analyzes sequence records obtained from GISAID under the applicable access terms and public NCBI/GenBank records; no human participants or directly identifiable clinical data were involved.
Consent for publication: Not applicable.
Availability of data and materials: GISAID-derived sequence records used in the case study are accessible to authorized GISAID users under the applicable access agreement using the accession identifiers listed in Supplementary Data S1. NCBI/GenBank records, where used, are accessible through their source accession identifiers. VirSift source code is available at https://github.com/SpatialOmicsLab/virsift under the MIT License and archived at doi:10.5281/zenodo.20699278. Detailed user and developer documentation, including page-by-page interface guidance and translation-contributor procedures, is designated for the repository documentation and should be linked from the README before submission.
Competing interests: The authors declare no competing interests.
Supplementary Materials
The following supporting information can be downloaded at the website of this paper posted on Preprints.org. The accompanying Supplementary Information document contains Supplementary Methods S1–S3 and Supplementary Figure S1–S5. Supplementary Data S1–S3, Supplementary Table S1–S2, and the unmodified GISAID Supplemental Appendix associated with EPI_SET_260703nq are supplied as separate files. Detailed page-by-page user guidance and translation-contributor documentation are maintained in the VirSift GitHub repository. Supplementary Methods S1. Supported GISAID-style and NCBI/GenBank-compatible FASTA header formats, detection rules, examples, and standardized parsed fields. This section describes the five supported header variants, including the no-segment 4-to-8-field content-detected variant, and provides worked examples showing how VirSift recovers subtype, collection date, accession, clade, and missing segment information. Supplementary Methods S2. Human-in-the-loop sampling strategy decision guide, including the operational date-span categories, peak-detection sensitivity guide, Strategy 6 Clade-Based Monthly Filter, and the Enhanced Temporal Diversity Filter. Supplementary Methods S3. Application session-data architecture, including the active and filtered data stores, audit trail, HITL selections, Molecular Timeline state, language-state persistence, and translation-cache persistence. Supplementary Data S1. Plain-text and CSV lists of the 59 GISAID EPI_ISL accession identifiers included in the H3N2 case study and registered collectively as EPI_SET_260703nq. GISAID Supplemental Appendix. Unmodified GISAID-generated supplemental record associated with EPI_SET_260703nq (https://doi.org/10.55876/gis8.260703nq), documenting the 59-virus dataset used in the H3N2 case study. Supplementary Data S2. Example metadata CSV generated through the VirSift export workflow during a 59-record H3N2 PB2 technical test session. The file illustrates the structured metadata-export format and is not a replacement for the haemagglutinin case-study dataset. Supplementary Data S3. Example machine-readable methodology snapshot generated through the VirSift export workflow. The JSON file illustrates the reproducibility metadata recorded by the software at export. Supplementary Table S1. VirSift translation-catalogue coverage summary and complete 921-key multilingual reference for the English, Russian, French, Spanish, Arabic, and Chinese interface catalogues. Supplementary Table S2. VirSift technical feature-verification and evidence-status matrix distinguishing directly observed workflow checks, case-study results, implemented or documented functions, and items reserved for formal benchmarking or validation. Supplementary Figure S1. VirSift logical workflow showing the onboarding Home page, Workspace activation, the Surveillance Observatory, and non-sequential access to the post-activation modules. Supplementary Figure S2. Limited functional verification of five-file batch ingestion, merged-dataset activation, and metadata-based split export, with reconciliation of record counts across the workflow. Supplementary Figure S3. Representative Surveillance Observatory interfaces covering workflow guidance, temporal and categorical summaries, dataset composition, Sankey flow, and batch/audit views. Supplementary Figure S4. Representative Analytics interfaces showing scope filters, dataset-overview gauges, chart configuration, rendered output, and downloadable chart data. Supplementary Figure S5. Representative Export interfaces showing quick and per-file downloads, Molecular Timeline curation outputs, metadata-based split export, segment-folder generation, accession extraction, and session-log export.
Funding
No external funding was received for this work.
Acknowledgements
We gratefully acknowledge all data contributors, i.e., the Authors and their Originating laboratories responsible for obtaining the specimens, and their Submitting laboratories for generating the genetic sequence and metadata and sharing via the GISAID Initiative, on which this research is based. We also acknowledge NCBI/GenBank and the laboratories that deposited the public records used for software development and testing.
Abbreviations
| Abbreviation | Meaning |
| FASTA | Format for nucleotide/amino acid sequences (named after Fast-All algorithm) |
| GISAID | Global Initiative on Sharing All Influenza Data |
| HITL | Human-in-the-Loop |
| KPI | Key Performance Indicator |
| MD5 | Message Digest 5 (hash function) |
| QC | Quality Control |
| NCBI | National Center for Biotechnology Information |
| GenBank | NCBI nucleotide sequence database |
References
- Lam, T.T.Y.; Zhu, H.; Guan, Y.; Holmes, E.C. Genomic analysis of the emergence, evolution, and spread of human respiratory RNA viruses. Annu Rev. Genom. Hum. Genet. 2016, 17, 193–218. [Google Scholar] [CrossRef] [PubMed]
- World Health Organization. WHO information for the sequencing of influenza viruses; World Health Organization: Geneva, 2023. [Google Scholar]
- Stack, J.C.; Welch, J.D.; Ferrari, M.J.; Shapiro, B.U.; Grenfell, B.T. Protocols for sampling viral sequences to study epidemic dynamics. J. R Soc. Interface 2010, 7(48), 1119–1127. [Google Scholar] [CrossRef] [PubMed]
- Suarez, D.L.; Chester, N.; Hatfield, J. Sequencing artifacts in the type A influenza databases and attempts to correct them. Influenza Other Respir. Viruses 2014, 8(4), 499–505. [Google Scholar] [CrossRef] [PubMed]
- Elbe, S.; Buckland-Merrett, G. Data, disease and diplomacy: GISAID’s innovative contribution to global health. Glob. Chall. 2017, 1(1), 33–46. [Google Scholar] [CrossRef] [PubMed]
- Shu, Y.; McCauley, J. GISAID: Global Initiative on Sharing All Influenza Data—from vision to reality. Euro Surveill. 2017, 22(13), 30494. [Google Scholar] [CrossRef] [PubMed]
- Bogner, P.; Capua, I.; Lipman, D.J.; Cox, N.J. A global initiative on sharing avian flu data. Nature 2006, 442(7106), 981. [Google Scholar] [CrossRef]
- Benson, D.A.; Cavanaugh, M.; Clark, K.; Karsch-Mizrachi, I.; Lipman, D.J.; Ostell, J.; et al. GenBank. Nucleic Acids Res. 2013, 41(Database issue), D36–D42. [Google Scholar] [CrossRef] [PubMed]
- World Health Organization. Global Influenza Surveillance and Response System (GISRS) [Internet]; World Health Organization: Geneva, 2023; Available online: https://www.who.int/initiatives/global-influenza-surveillance-and-response-system.
- Bedford, T.; Riley, S.; Barr, I.G.; Broor, S.; Chadha, M.; Cox, N.J.; et al. Global circulation patterns of seasonal influenza viruses vary with antigenic drift. Nature 2015, 523(7559), 217–220. [Google Scholar] [CrossRef] [PubMed]
- Lee, D.H.; Sharshov, K.; Swayne, D.E.; Kurskaya, O.; Sobolev, I.; Kabilov, M.; et al. Novel reassortant clade 2.3.4.4 avian influenza A(H5N8) virus in wild aquatic birds, Russia, 2016. Emerg. Infect. Dis. 2017, 23(2), 359–360. [Google Scholar] [CrossRef] [PubMed]
- Shestopalov, A.M.; Sharshov, K.A.; Varkentin, A.V.; Yushkov, Y.G.; Leonov, S.V.; et al. Results of long-term (2006–2016) avian influenza surveillance in wild birds of Uvs Nuur Lake. South Russ. Ecol. Dev. 2016, 11(3), 106–119. [Google Scholar] [CrossRef]
- Sharshov, K.; Silko, N.; Sousloparov, I.; Zaykovskaya, A.; Shestopalov, A.; Drozdov, I. Avian influenza (H5N1) outbreak among wild birds, Russia, 2009. Emerg. Infect. Dis. 2010, 16(2), 349–351. [Google Scholar] [CrossRef] [PubMed]
- Sobolev, I.; Alekseev, A.; Sharshov, K.; Chistyaeva, M.; Ivanov, A.; Kurskaya, O.; et al. Highly pathogenic avian influenza A(H5N1) virus clade 2.3.4.4b infections in seals, Russia, 2023. Emerg. Infect. Dis. 2024, 30(10), 2160–2164. [Google Scholar] [CrossRef] [PubMed]
- Sobolev, I.; Gadzhiev, A.; Sharshov, K.; Ohlopkova, O.; Stolbunova, K.; Fadeev, A.; et al. Highly pathogenic avian influenza A(H5N1) virus-induced mass death of wild birds, Caspian Sea, Russia, 2022. Emerg. Infect. Dis. 2023, 29(12), 2528–2532. [Google Scholar] [CrossRef] [PubMed]
- Alekseev, A.Y.; Sobolev, I.; Sharshov, K.; Gulyaeva, M.; Kurskaya, O.; Kasianov, N.; et al. Pathobiology of highly pathogenic avian influenza A(H5N1 clade 2.3.4.4b) virus from pinnipeds on Tyuleniy Island in the Sea of Okhotsk, Russia. Viruses 2026, 18(1), 51. [Google Scholar] [CrossRef] [PubMed]
- Sivay, M.V.; Sayfutdinova, S.G.; Sharshov, K.A.; Alekseev, A.Y.; Yurlov, A.K.; Runstadler, J.; et al. Surveillance of influenza A virus in wild birds in the Asian portion of Russia in 2008. Avian Dis. 2012, 56(3), 456–463. [Google Scholar] [CrossRef] [PubMed]
- De Marco, M.A.; Delogu, M.; Sivay, M.; Sharshov, K.; Yurlov, A.; Cotti, C.; et al. Virological evaluation of avian influenza virus persistence in natural and anthropic ecosystems of Western Siberia (Novosibirsk Region, summer 2012). PLoS ONE 2014, 9(6), e100859. [Google Scholar] [CrossRef] [PubMed]
- Sobolev, I.; Kurskaya, O.; Murashkina, T.; Leonov, S.; Sharshov, K.; Kabilov, M.; et al. Genome sequence of an unusual reassortant H1N1 swine influenza virus isolated from a pig in Russia, 2016. Genome Announc. 2017, 5(33), e00747-17. [Google Scholar] [CrossRef] [PubMed]
- Ilyicheva, T.; Sobolev, I.; Susloparov, I.; Kurskaya, O.; Durymanov, A.; Sharshov, K.; et al. Monitoring of influenza viruses in Western Siberia in 2008–2012. Infect. Genet Evol. 2013, 20, 177–187. [Google Scholar] [CrossRef] [PubMed]
- Ilyicheva, T.; Durymanov, A.; Susloparov, I.; Kolosova, N.; Goncharova, N.; Svyatchenko, S.; et al. Fatal cases of seasonal influenza in Russia in 2015–2016. PLoS ONE 2016, 11(10), e0165332. [Google Scholar] [CrossRef] [PubMed]
- Hadfield, J.; Megill, C.; Bell, S.M.; Huddleston, J.; Potter, B.; Callender, C.; et al. Nextstrain: real-time tracking of pathogen evolution. Bioinformatics 2018, 34(23), 4121–4123. [Google Scholar] [CrossRef] [PubMed]
- Aksamentov, I.; Roemer, C.; Hodcroft, E.B.; Neher, R.A. Nextclade: clade assignment, mutation calling and quality control for viral genomes. J. Open Source Softw. 2021, 6(67), 3773. [Google Scholar] [CrossRef]
- Bouckaert, R.; Heled, J.; Kühnert, D.; Vaughan, T.; Wu, C.H.; Xie, D.; et al. BEAST 2: a software platform for Bayesian evolutionary analysis. PLoS Comput Biol. 2014, 10(4), e1003537. [Google Scholar] [CrossRef] [PubMed]
- Nguyen, L.T.; Schmidt, H.A.; von Haeseler, A.; Minh, B.Q. IQ-TREE: a fast and effective stochastic algorithm for estimating maximum-likelihood phylogenies. Mol. Biol. Evol. 2015, 32(1), 268–274. [Google Scholar] [CrossRef] [PubMed]
- Federal Service for Surveillance on Consumer Rights Protection and Human Well-being (Rospotrebnadzor). 2020. Methodological recommendations No. 3.1.0209-20: recommendations on organizing anti-epidemic regimes in medical organizations [Internet]. Rospotrebnadzor: Moscow. Available online: https://www.rospotrebnadzor.ru/region/korono_virus/rek_ros.php.
- World Health Organization. Global Influenza Surveillance and Response System (GISRS): manual for the laboratory diagnosis and virological surveillance of influenza; World Health Organization: Geneva, 2011. [Google Scholar]
- Streamlit, Inc. Streamlit [computer software]; Streamlit Inc.: San Francisco, 29 Jun 2026; Available online: https://streamlit.io/.
- Python Software Foundation. Python language reference, version 3.x [Internet]; Python Software Foundation: Wilmington (DE), 29 Jun 2026; Available online: https://docs.python.org/3/reference/.
- Pandas Development Team. pandas-dev/pandas: pandas [computer software]; Zenodo, 2020. [Google Scholar]
- McKinney, W. Data structures for statistical computing in Python. In Proceedings of the 9th Python in Science Conference; van der Walt, S., Millman, J., Eds.; 2010; pp. 56–61. [Google Scholar]
- Virtanen, P.; Gommers, R.; Oliphant, T.E.; Haberland, M.; Reddy, T.; Cournapeau, D.; et al. SciPy 1.0: fundamental algorithms for scientific computing in Python. Nat. Methods 2020, 17(3), 261–272. [Google Scholar] [CrossRef] [PubMed]
- Plotly Technologies Inc. Collaborative data science [Internet]; Plotly Technologies Inc.: Montreal, 2015; Available online: https://plotly.com/.
- Gulyaeva, M.A.; Sharshov, K.A.; Sobolev, I.A.; Yurlov, A.K.; Gadzhiev, A.A.; Rabazanov, N.I.; et al. Isolation of influenza A virus from plumage of waterfowl during autumn migration. South Russ. Ecol. Dev. 2018, 13(3), 134–141. [Google Scholar] [CrossRef]
- Gulyaeva, M.; Sobolev, I.; Sharshov, K.; Kurskaya, O.; Alekseev, A.; Shestopalova, L.; et al. Characterization of avian-like influenza A(H4N6) virus isolated from Caspian seal in 2012. Virol. Sin. 2018, 33(5), 449–452. [Google Scholar] [CrossRef] [PubMed]
- Kolosova, N.P.; Ilyicheva, T.N.; Unguryan, V.V.; Danilenko, A.V.; Svyatchenko, S.V.; Onhonova, G.S.; et al. Re-emergence of circulation of seasonal influenza during the COVID-19 pandemic in Russia and receptor specificity of new and dominant clade 3C.2a1b.2a.2 A(H3N2) viruses in 2021–2022. Pathogens 2022, 11(11), 1388. [Google Scholar] [CrossRef] [PubMed]
- Melidou, A.; Hungnes, O.; Pereyaslov, D.; Adlhoch, C.; Segaloff, H.; Robesyn, E.; et al. Predominance of influenza virus A(H3N2) 3C.2a1b and A(H1N1)pdm09 6B.1A5A genetic subclades in the WHO European Region, 2018–2019. Vaccine 2020, 38(35), 5707–5717. [Google Scholar] [CrossRef] [PubMed]
- Webster, R.G.; Bean, W.J.; Gorman, O.T.; Chambers, T.M.; Kawaoka, Y. Evolution and ecology of influenza A viruses. Microbiol. Rev. 1992, 56(1), 152–179. [Google Scholar] [CrossRef] [PubMed]
- Olsen, B.; Munster, V.J.; Wallensten, A.; Waldenström, J.; Osterhaus, A.D.M.E.; Fouchier, R.A.M. Global patterns of influenza A virus in wild birds. Science 2006, 312(5772), 384–388. [Google Scholar] [CrossRef] [PubMed]
- Kalkauskas, A.; Perron, U.; Sun, Y.; Goldman, N.; Baele, G.; Guindon, S.; et al. Sampling bias and model choice in continuous phylogeography: getting lost on a random walk. PLoS Comput Biol. 2021, 17(1), e1008561. [Google Scholar] [CrossRef] [PubMed]
- Shen, W.; Le, S.; Li, Y.; Hu, F. SeqKit: a cross-platform and ultrafast toolkit for FASTA/Q file manipulation. PLoS ONE 2016, 11(10), e0163962. [Google Scholar] [CrossRef] [PubMed]
- Sandve, G.K.; Nekrutenko, A.; Taylor, J.; Hovig, E. Ten simple rules for reproducible computational research. PLoS Comput Biol. 2013, 9(10), e1003285. [Google Scholar] [CrossRef] [PubMed]
- List, M.; Ebert, P.; Albrecht, F. Ten simple rules for developing usable software in computational biology. PLoS Comput Biol. 2017, 13(1), e1005265. [Google Scholar] [CrossRef] [PubMed]
- Taschuk, M.; Wilson, G. Ten simple rules for making research software more robust. PLoS Comput Biol. 2017, 13(4), e1005412. [Google Scholar] [CrossRef] [PubMed]
- Wilkinson, M.D.; Dumontier, M.; Aalbersberg, I.J.J.; Appleton, G.; Axton, M.; Baak, A.; et al. The FAIR Guiding Principles for scientific data management and stewardship. Sci. Data 2016, 3, 160018. [Google Scholar] [CrossRef] [PubMed]
- World Health Organization. Global genomic surveillance strategy for pathogens with pandemic and epidemic potential; World Health Organization: Geneva, 2022; ISBN 9789240046979. [Google Scholar]
- Tastan Bishop, Ö.; Adebiyi, E.F.; Alzohairy, A.M.; Everett, D.; Ghedira, K.; Ghouila, A.; et al. Bioinformatics education - perspectives and challenges out of Africa. Brief. Bioinform. 2015, 16(2), 355–364. [Google Scholar] [CrossRef] [PubMed]
- Mulder, N.J.; Adebiyi, E.; Alami, R.; Benkahla, A.; Brandful, J.; Doumbia, S.; et al. H3ABioNet, a sustainable pan-African bioinformatics network for human heredity and health in Africa. Genome Res. 2016, 26(2), 271–277. [Google Scholar] [CrossRef] [PubMed]
- Márquez, S.; Vasquez-Aleman, G.; Juarez, J.G.; Cerpas, C.; Cardenas, P.; Bennett, S.; et al. Enhancing capacities in genomic surveillance capabilities for SARS-CoV-2 and dengue virus: A South-South collaborative partnership. PLoS Glob. Public Health 2025, 5(4), e0004365. [Google Scholar] [CrossRef] [PubMed]
- Getchell, M.; Wulandari, S.; de Alwis, R.; Agoramurthy, S.; Khoo, Y.K.; Mak, T.M.; et al. Pathogen genomic surveillance status among lower resource settings in Asia. Nat. Microbiol. 2024, 9(10), 2738–2747. [Google Scholar] [CrossRef] [PubMed]
- Brito, A.F.; Semenova, E.; Dudas, G.; Hassler, G.W.; Kalinich, C.C.; Kraemer, M.U.G.; et al. Global disparities in SARS-CoV-2 genomic surveillance. Nat. Commun. 2022, 13, 7003. [Google Scholar] [CrossRef] [PubMed]
- Chen, Z.; Azman, A.S.; Chen, X.; Zou, J.; Tian, Y.; Sun, R.; et al. Global landscape of SARS-CoV-2 genomic surveillance and data sharing. Nat. Genet. 2022, 54(4), 499–507. [Google Scholar] [CrossRef] [PubMed]
Figure 1.
A. VirSift application architecture and data flow. Users begin on the onboarding Home interface, upload one or more supported FASTA files in Workspace, and activate a selected or merged dataset. Activation creates the immutable Original (Pre-Filter) Dataset, after which the Home interface becomes the Surveillance Observatory. Sequence Refinery operations update the mutable Current (Filtered) Dataset, while Workspace, Molecular Timeline, Analytics, Export, and Documentation remain available as non-mandatory modules connected to the active session. B. Representative activated Surveillance Observatory showing workflow guidance, headline sequence-record metrics, and dataset-overview gauges. The displayed counts come from a separate interface-demonstration dataset and are not the 59-record H3N2 case study.
Figure 1.
A. VirSift application architecture and data flow. Users begin on the onboarding Home interface, upload one or more supported FASTA files in Workspace, and activate a selected or merged dataset. Activation creates the immutable Original (Pre-Filter) Dataset, after which the Home interface becomes the Surveillance Observatory. Sequence Refinery operations update the mutable Current (Filtered) Dataset, while Workspace, Molecular Timeline, Analytics, Export, and Documentation remain available as non-mandatory modules connected to the active session. B. Representative activated Surveillance Observatory showing workflow guidance, headline sequence-record metrics, and dataset-overview gauges. The displayed counts come from a separate interface-demonstration dataset and are not the 59-record H3N2 case study.
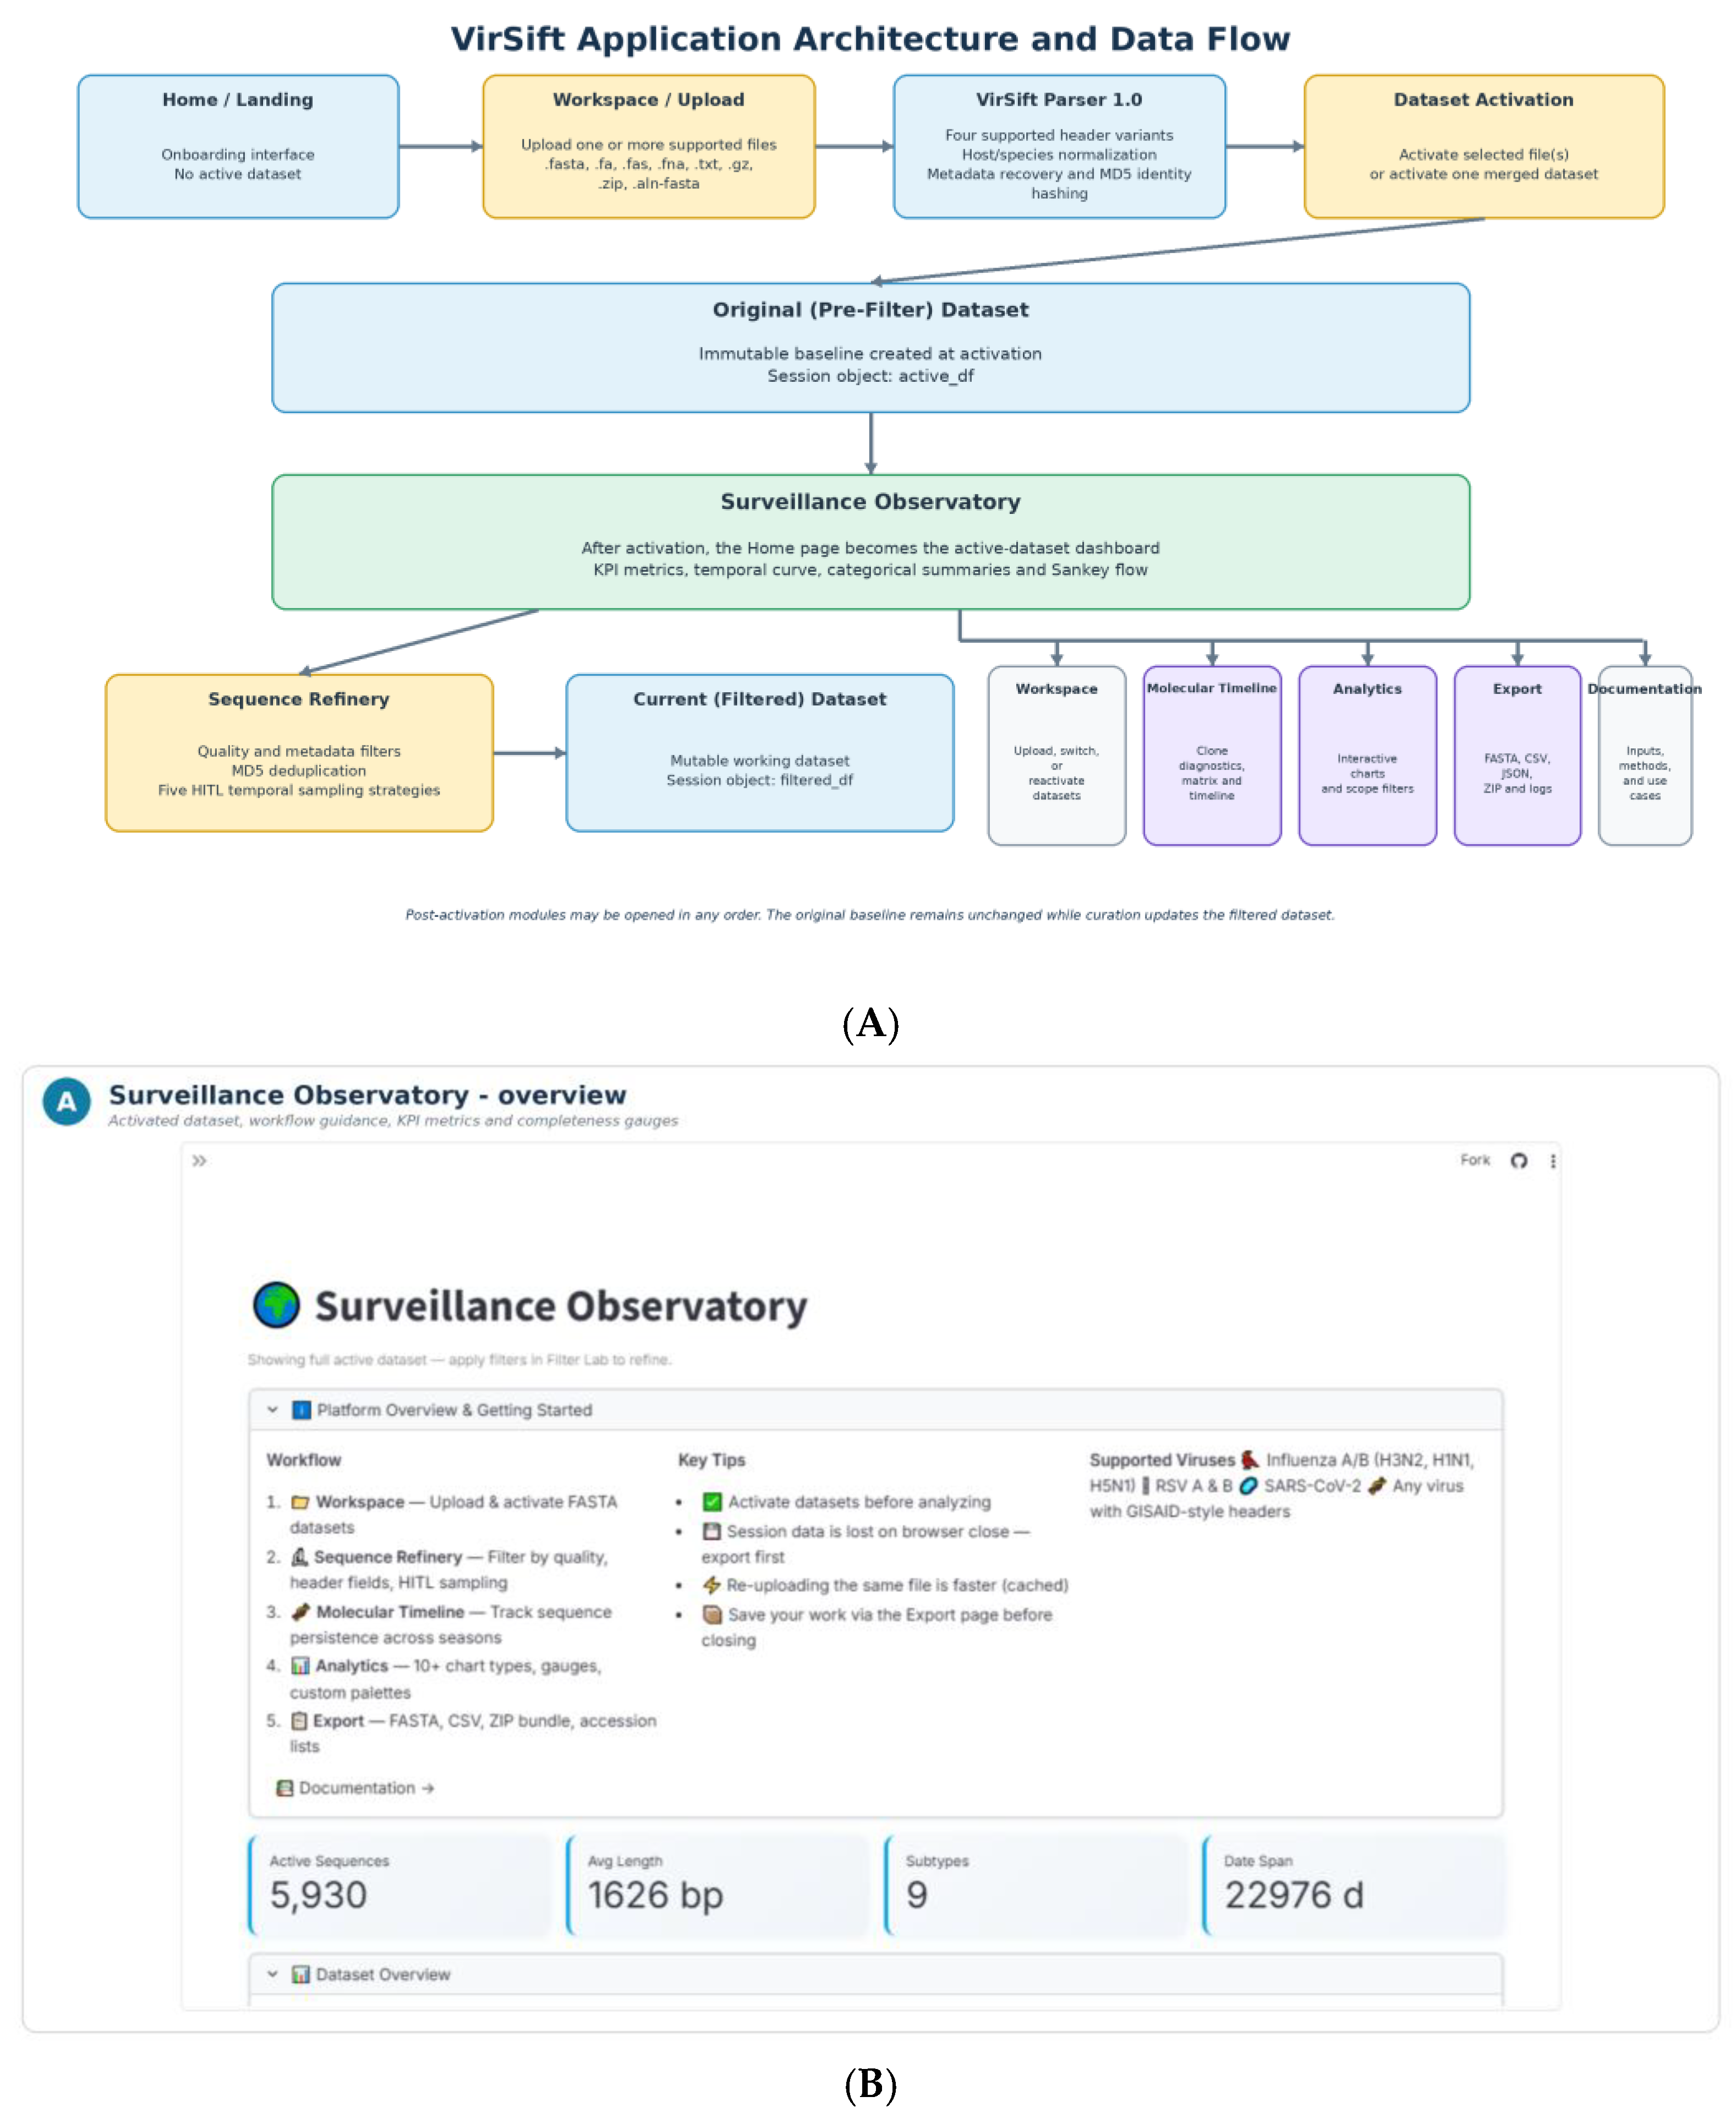
Figure 2.
A. Sequence Refinery quality controls, including sequence-length and N-run thresholds and MD5-based identification of exact-sequence redundancy. B. Header-component rule construction, EPI_ISL accession filtering, and operational temporal-span classification. C. Recommended temporal-sampling strategy, six HITL strategy choices, contextual guidance, and execution controls.
Figure 2.
A. Sequence Refinery quality controls, including sequence-length and N-run thresholds and MD5-based identification of exact-sequence redundancy. B. Header-component rule construction, EPI_ISL accession filtering, and operational temporal-span classification. C. Recommended temporal-sampling strategy, six HITL strategy choices, contextual guidance, and execution controls.
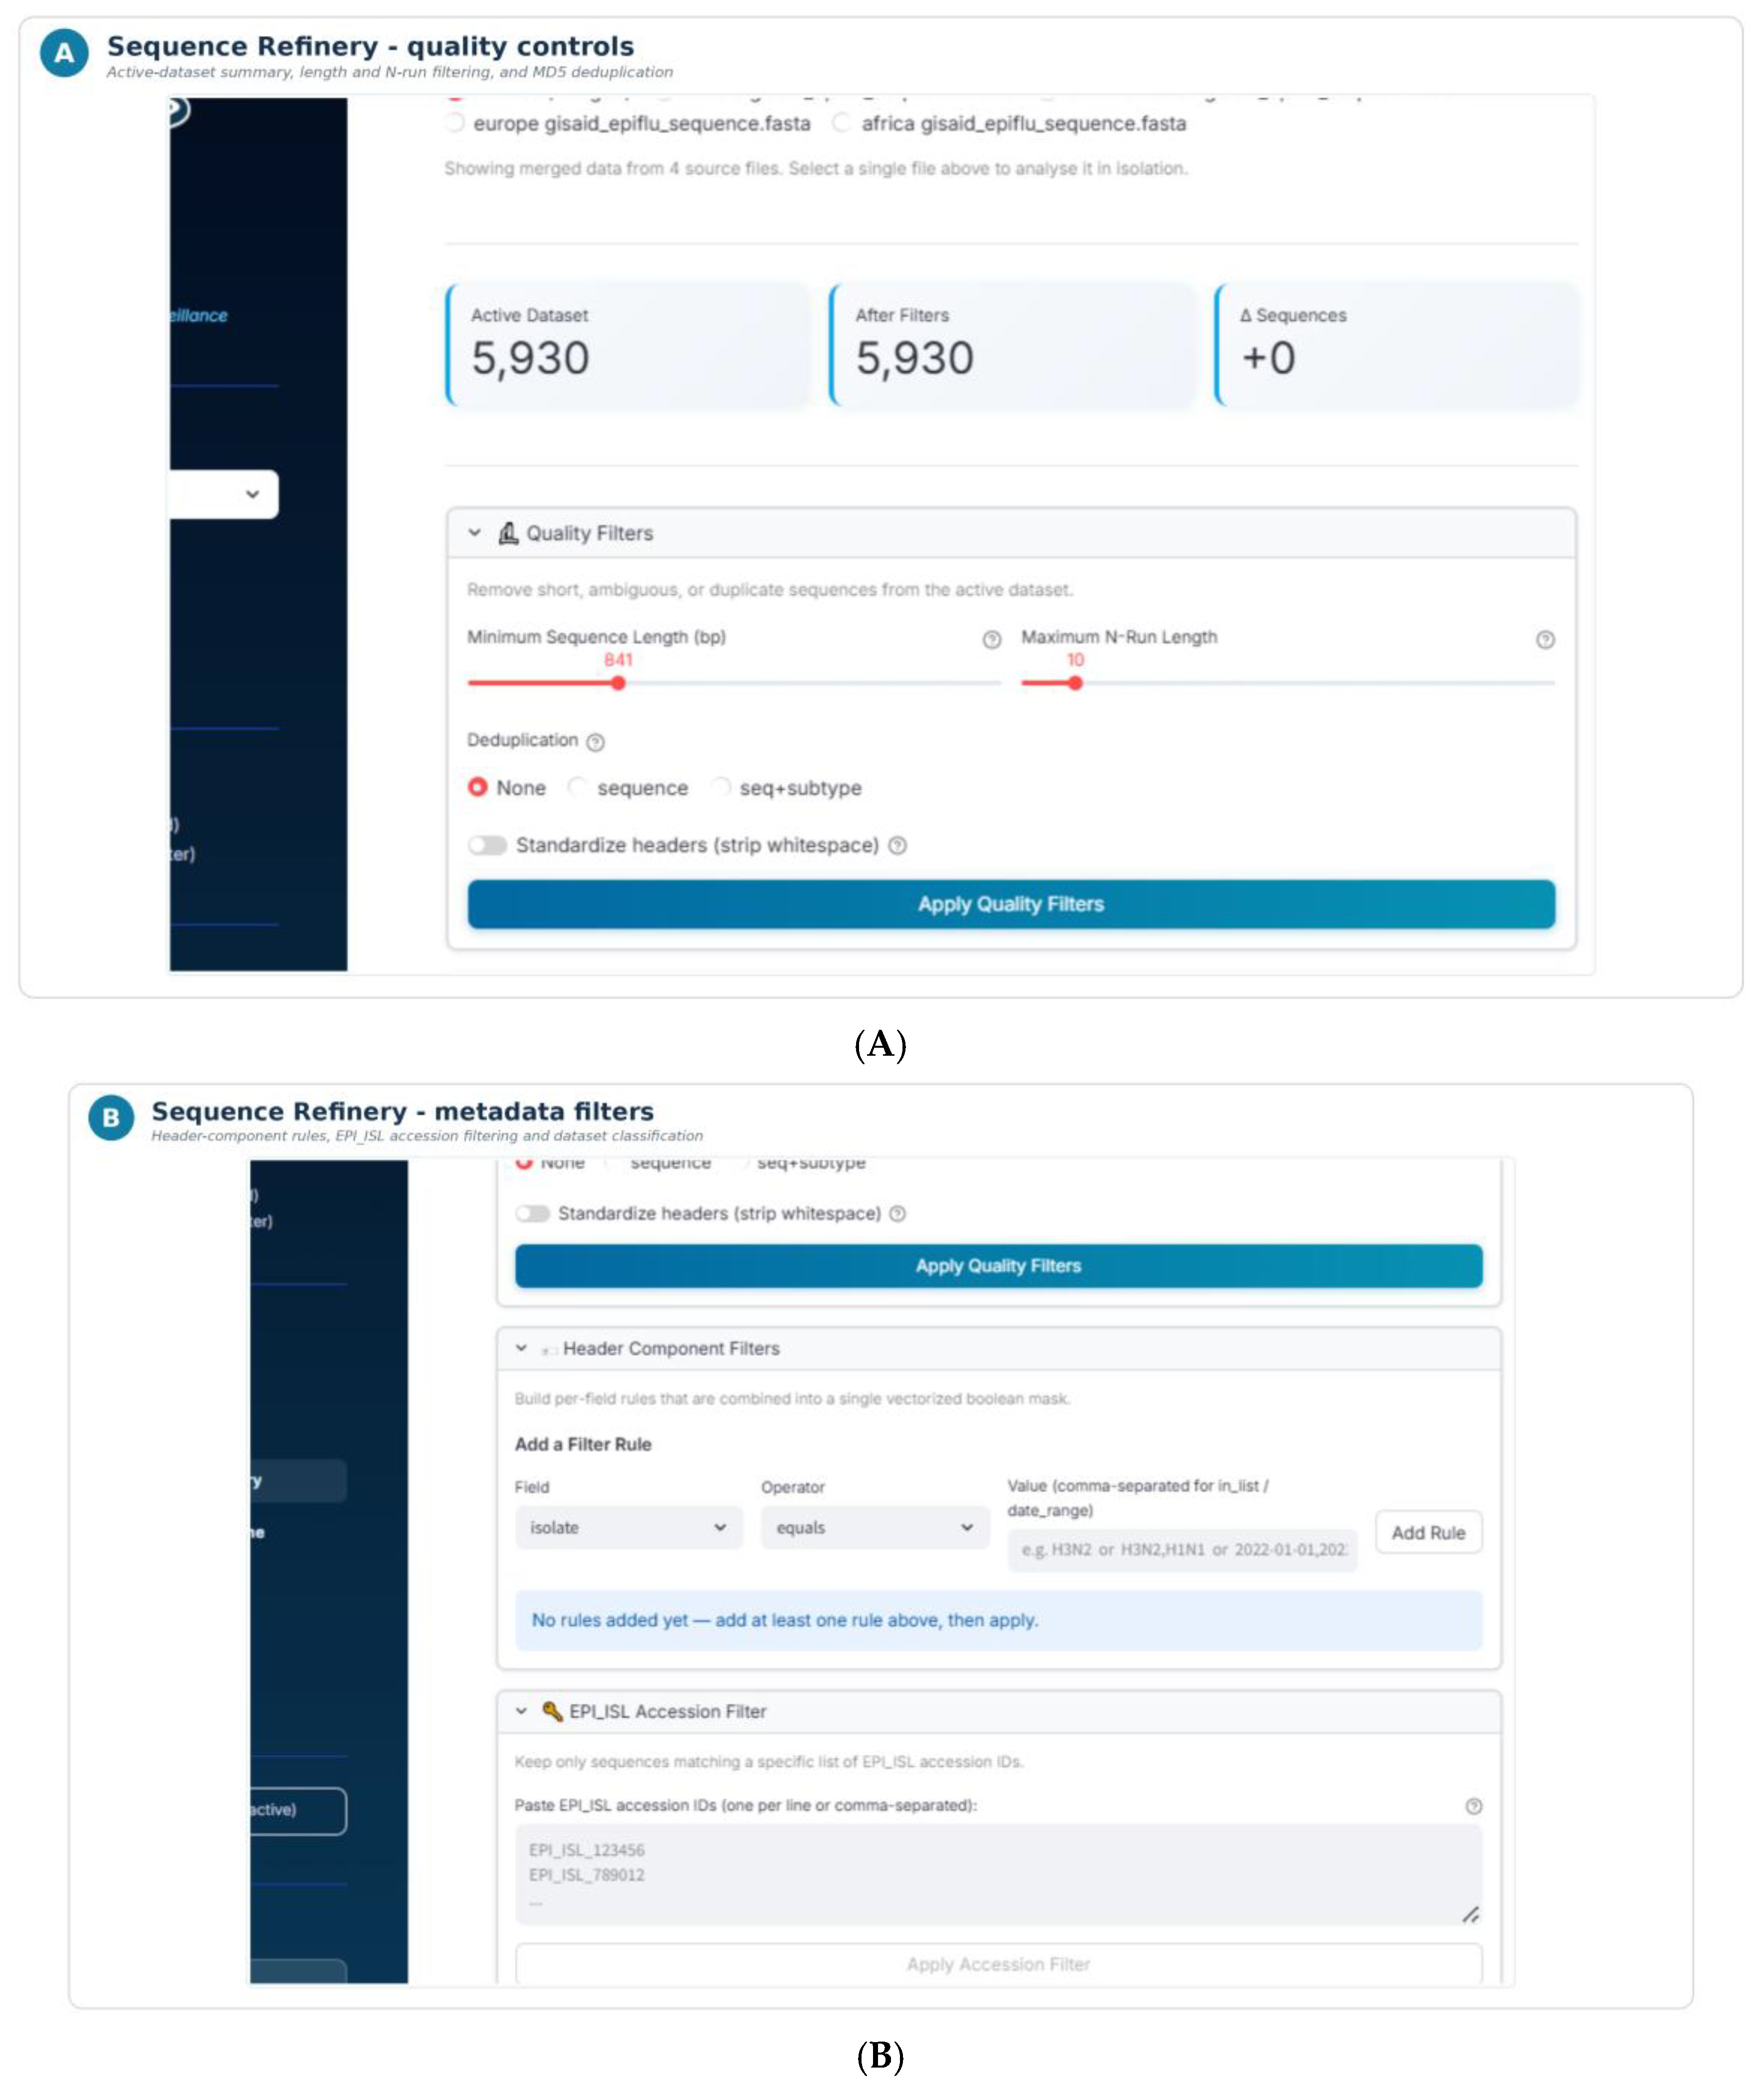
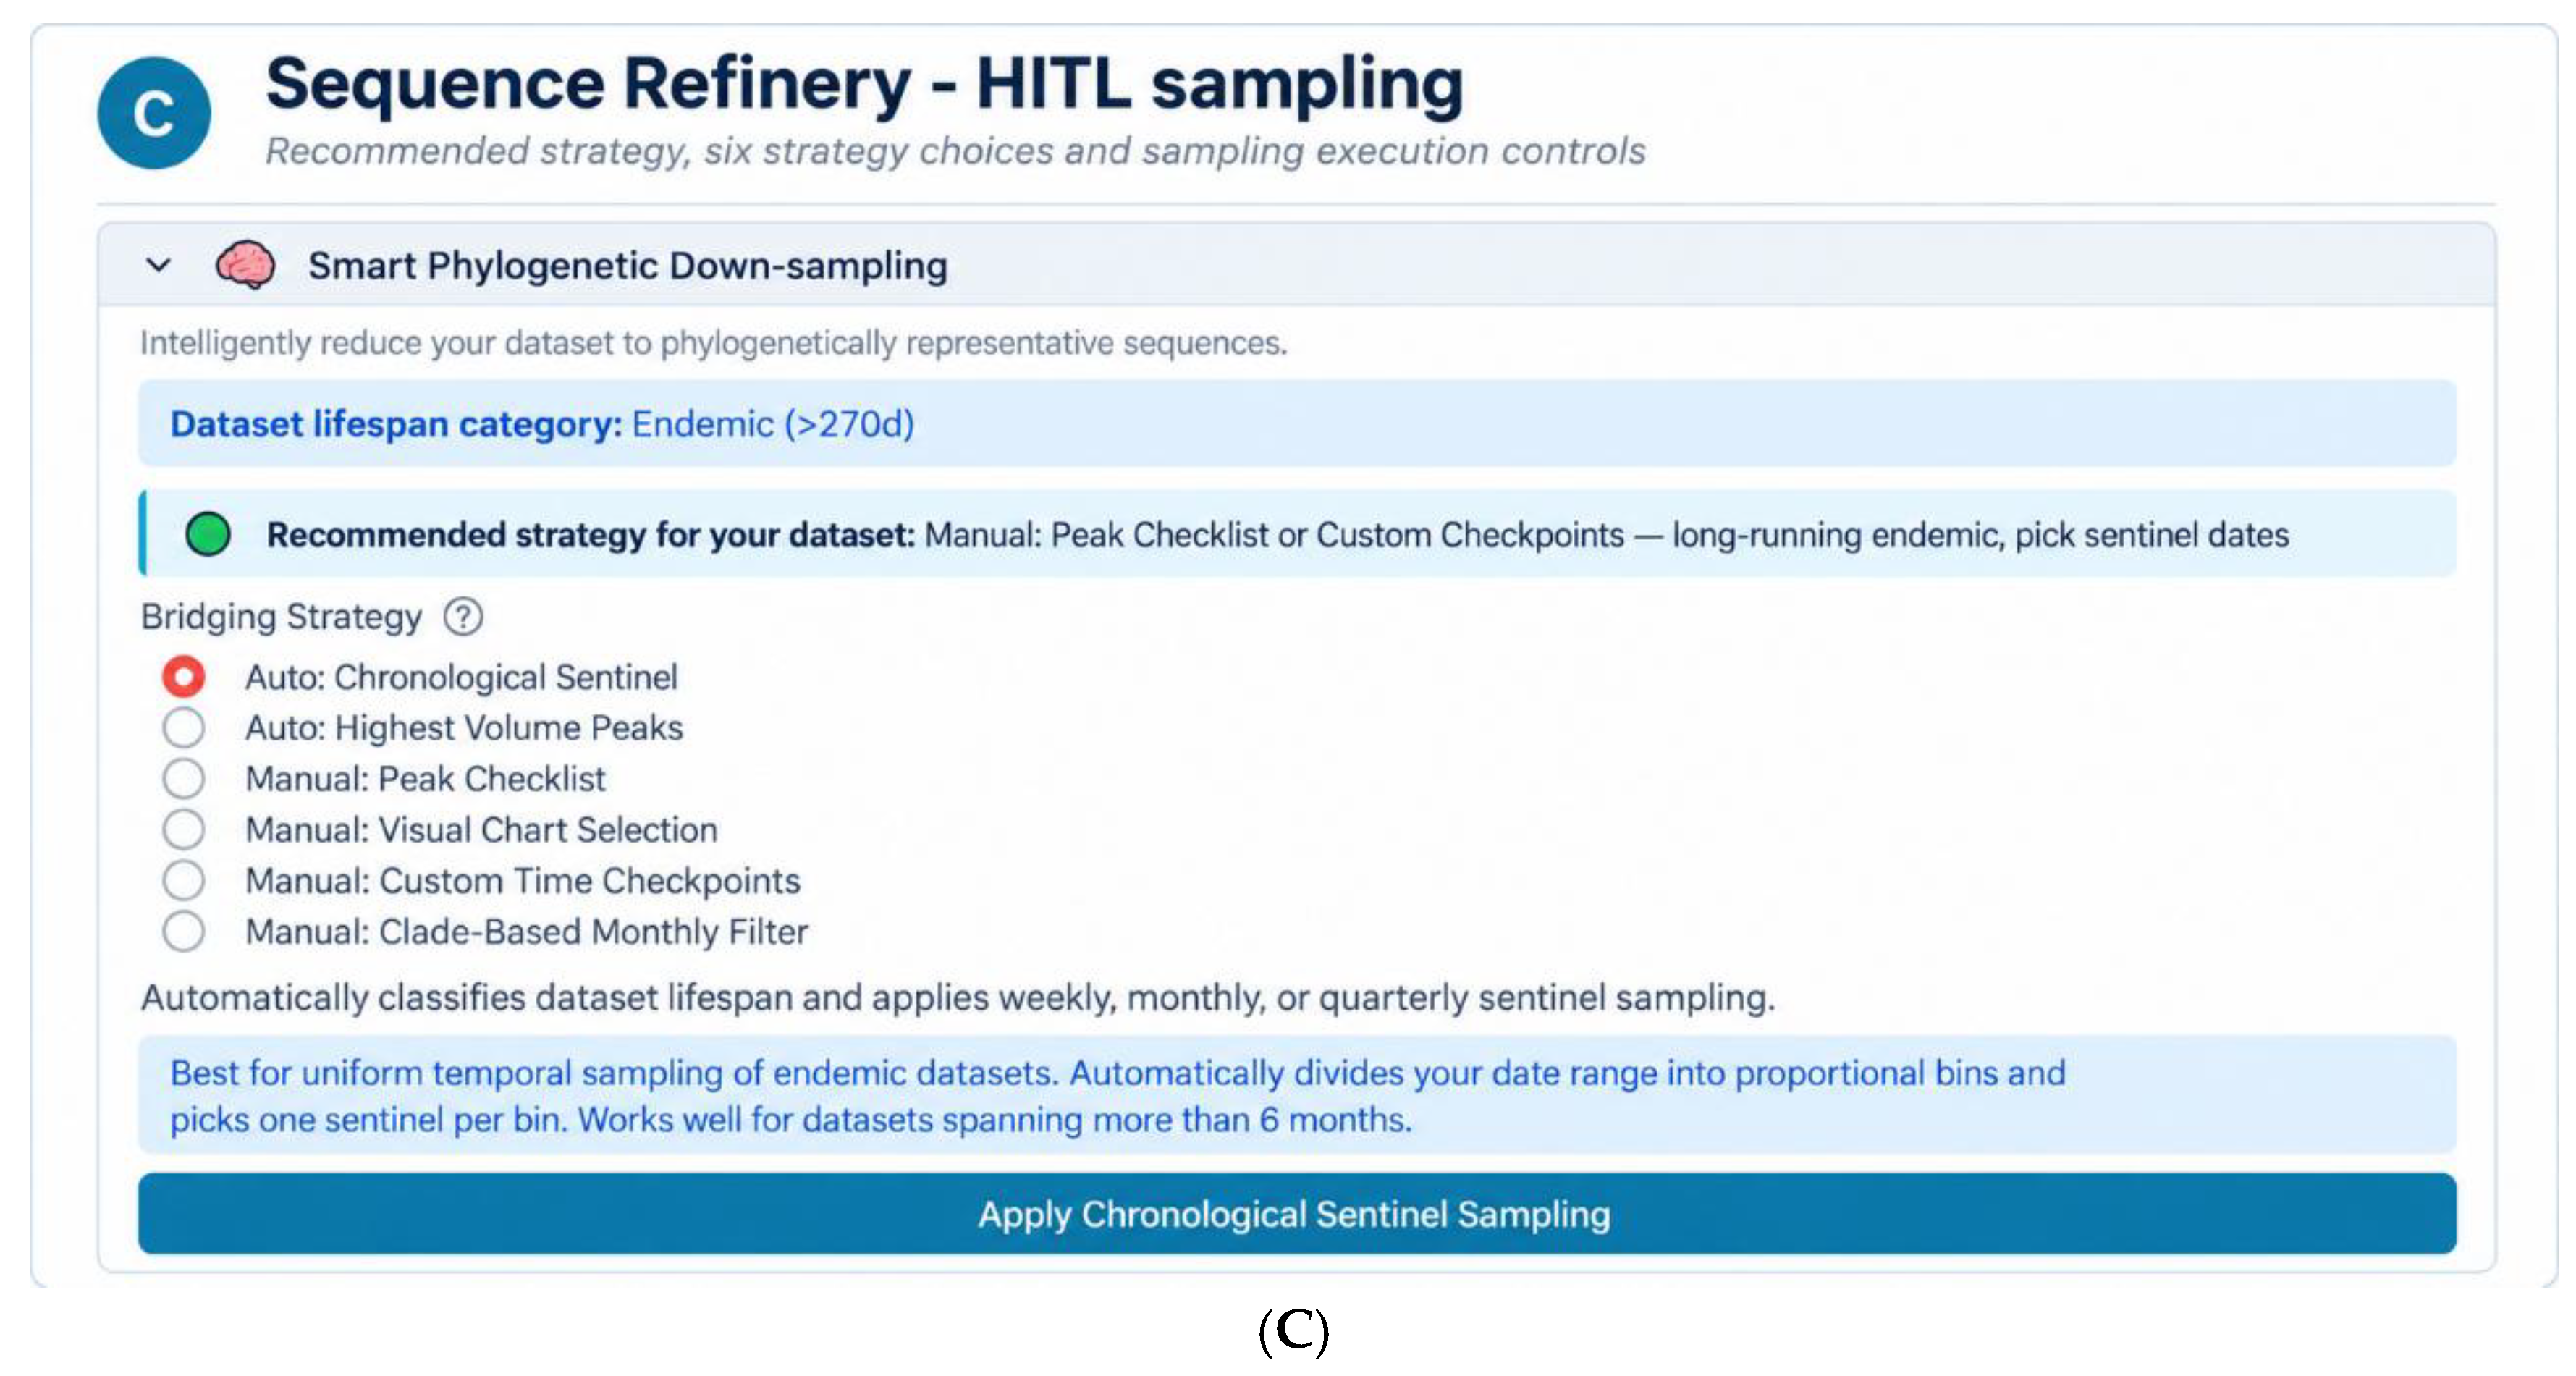
Figure 3.
A. Representative Analytics scope filters and dataset-overview gauges. The displayed counts come from a separate interface-demonstration dataset. B. Analytics chart configuration, palette and title controls, rendered interactive visualization, and downloadable chart data.
Figure 3.
A. Representative Analytics scope filters and dataset-overview gauges. The displayed counts come from a separate interface-demonstration dataset. B. Analytics chart configuration, palette and title controls, rendered interactive visualization, and downloadable chart data.
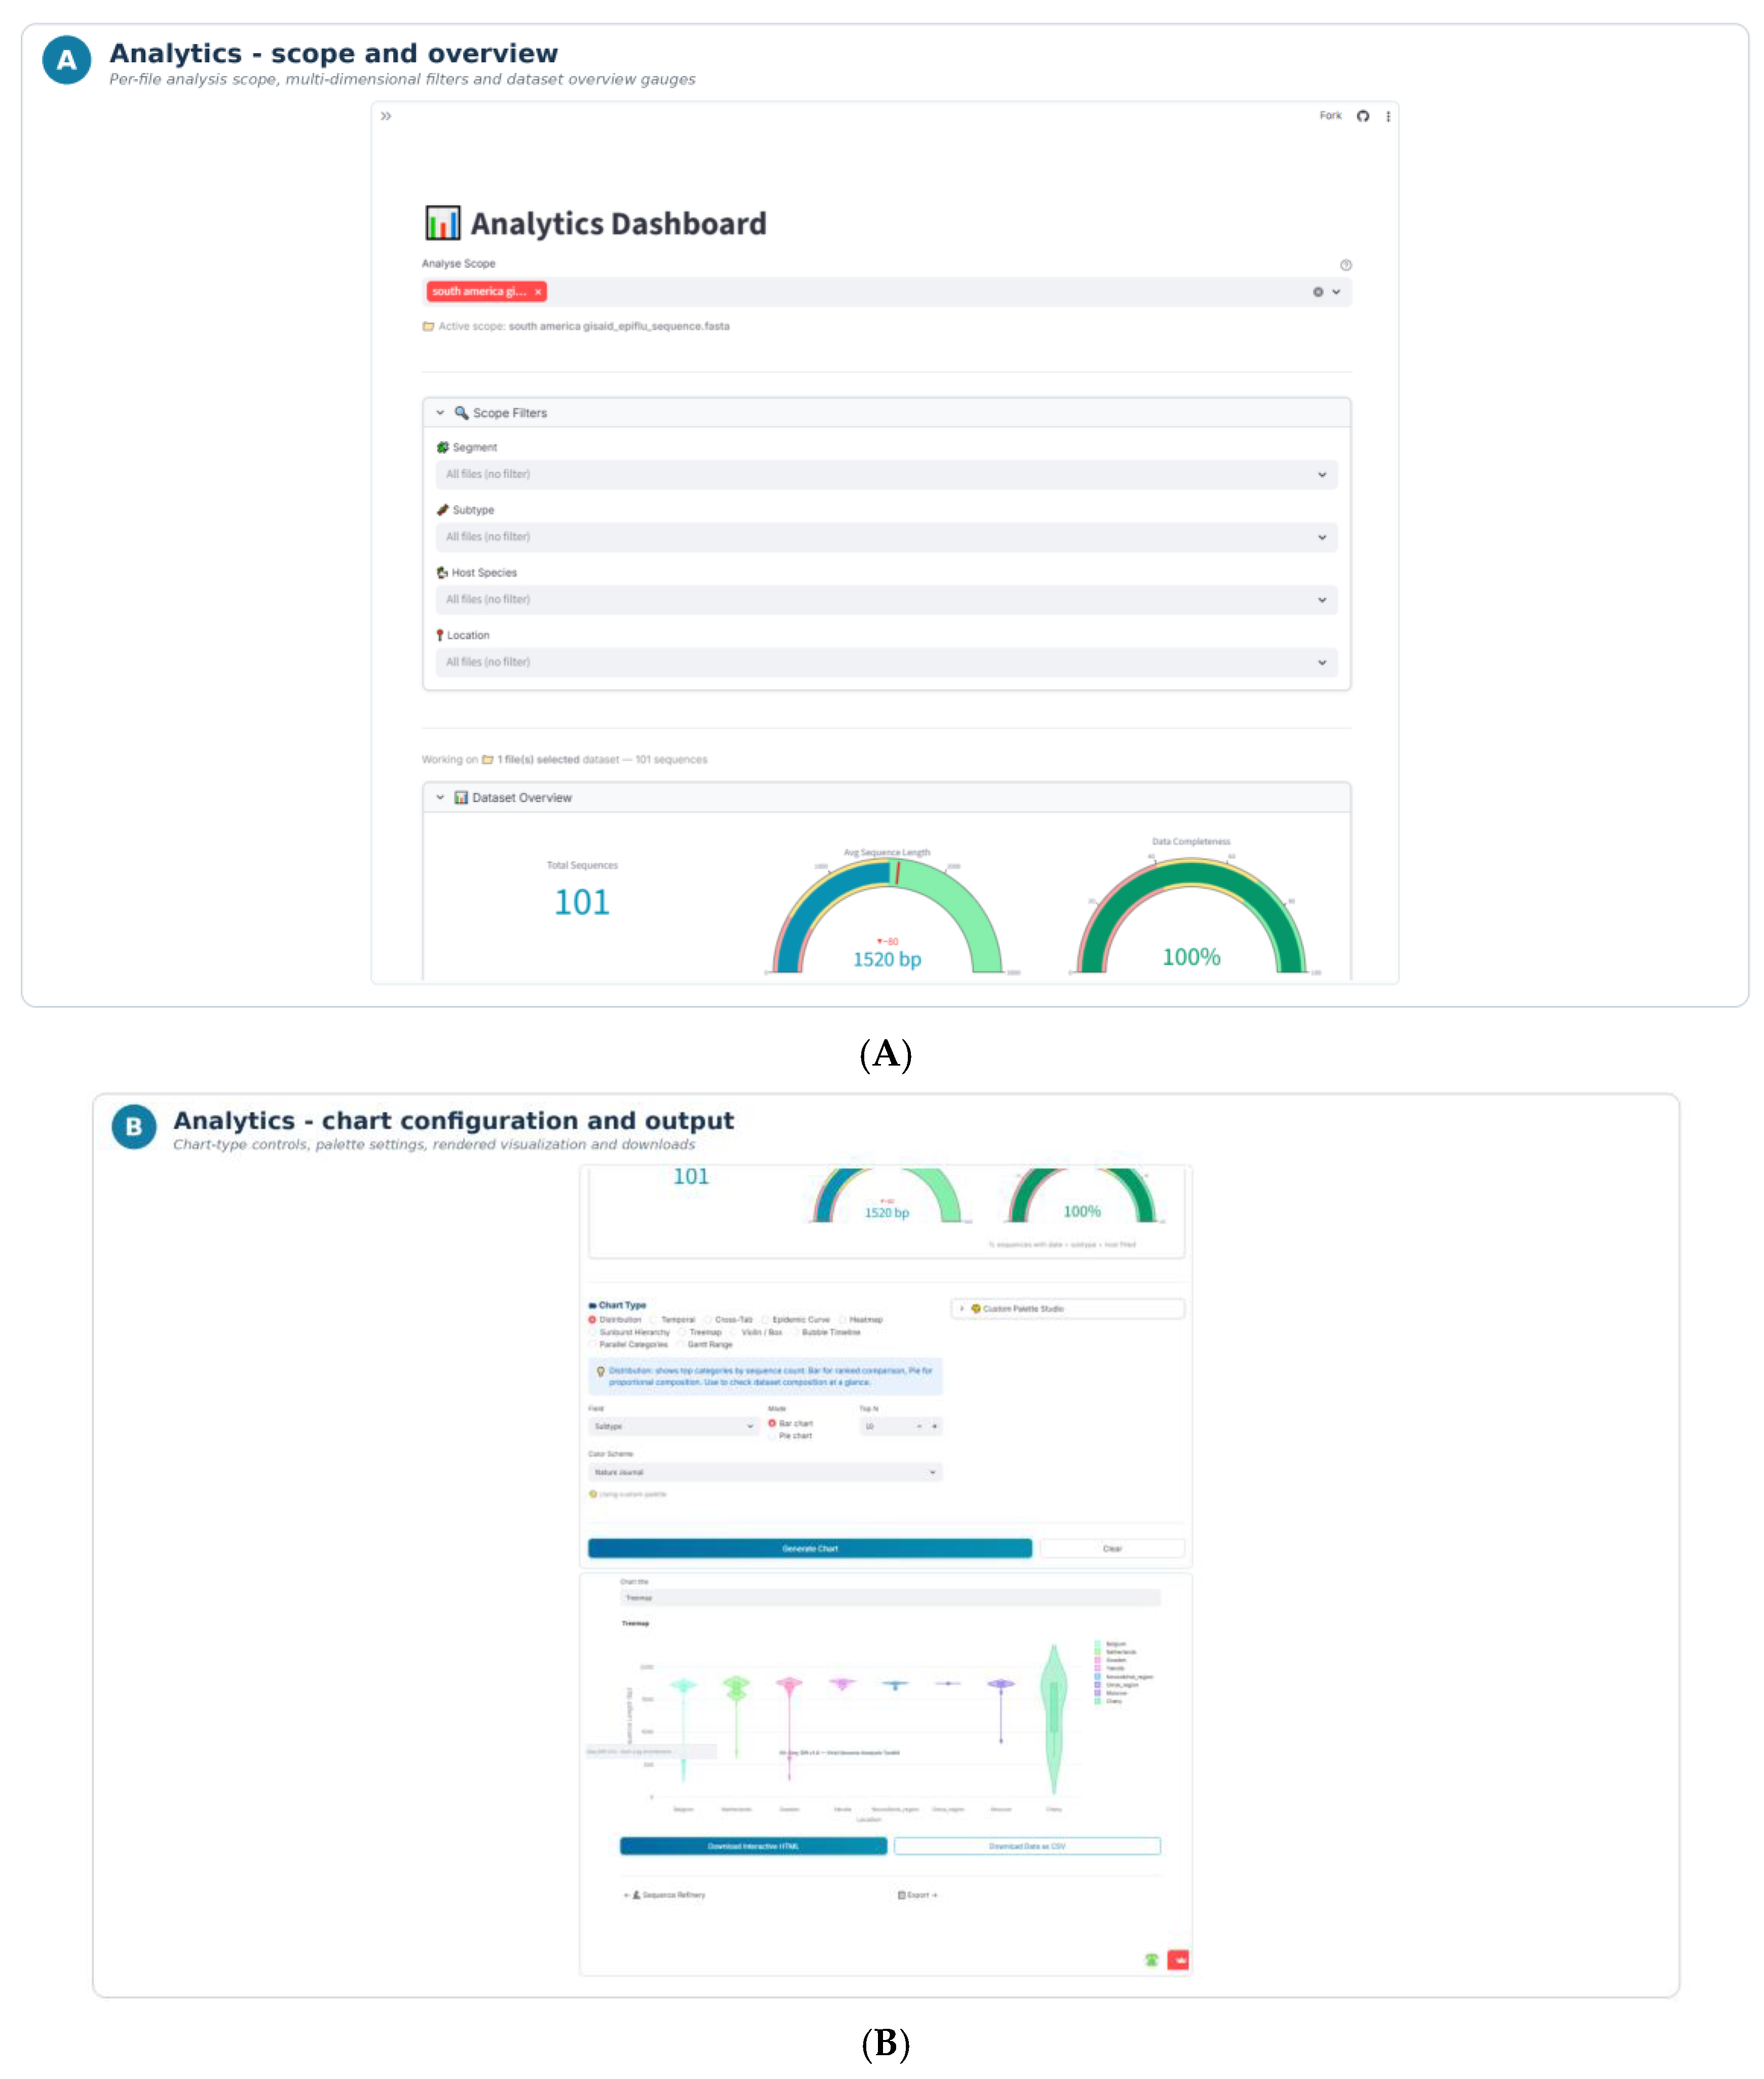
Figure 4.
A. Molecular Timeline workflow guidance, per-file and metadata scope controls, and diagnostic metrics. B. Exact-sequence identity-group summaries, group-size visualisations, representative-selection controls, and timeline configuration. C. Editable month-level persistence matrix and representative-sequence generation controls. D. Persistence visualization, curation-impact metrics, and downloadable FASTA, metadata, and methodology outputs.
Figure 4.
A. Molecular Timeline workflow guidance, per-file and metadata scope controls, and diagnostic metrics. B. Exact-sequence identity-group summaries, group-size visualisations, representative-selection controls, and timeline configuration. C. Editable month-level persistence matrix and representative-sequence generation controls. D. Persistence visualization, curation-impact metrics, and downloadable FASTA, metadata, and methodology outputs.
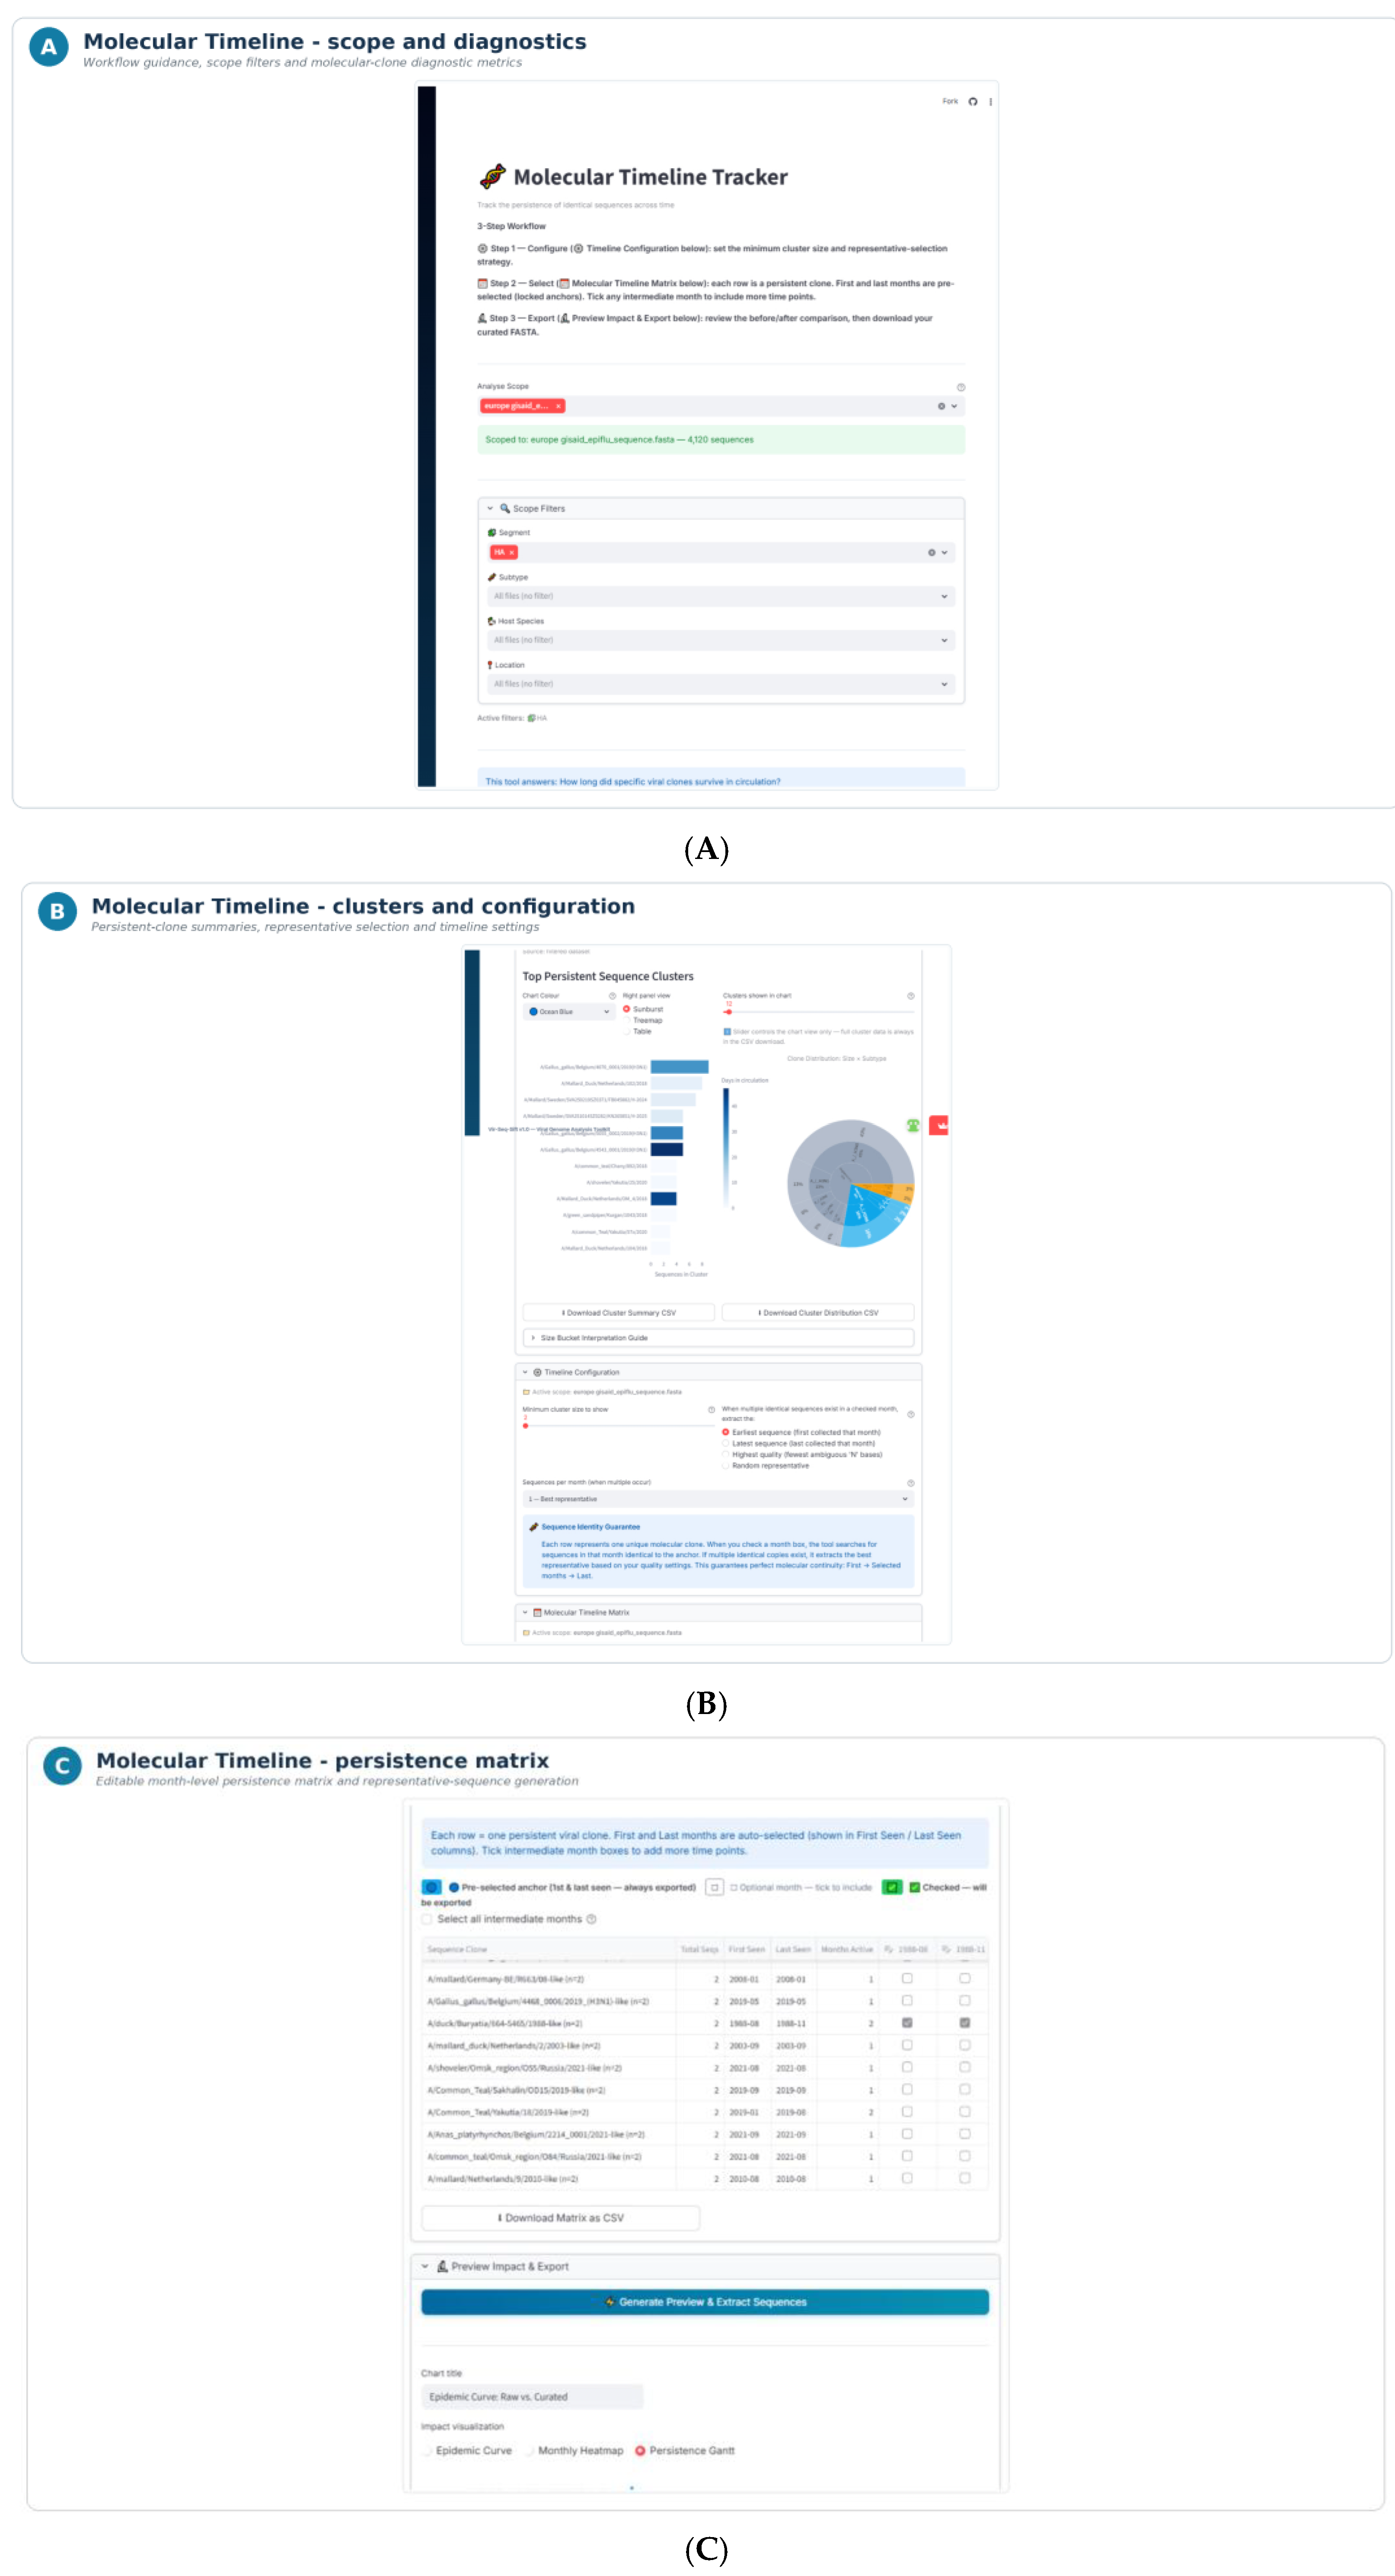
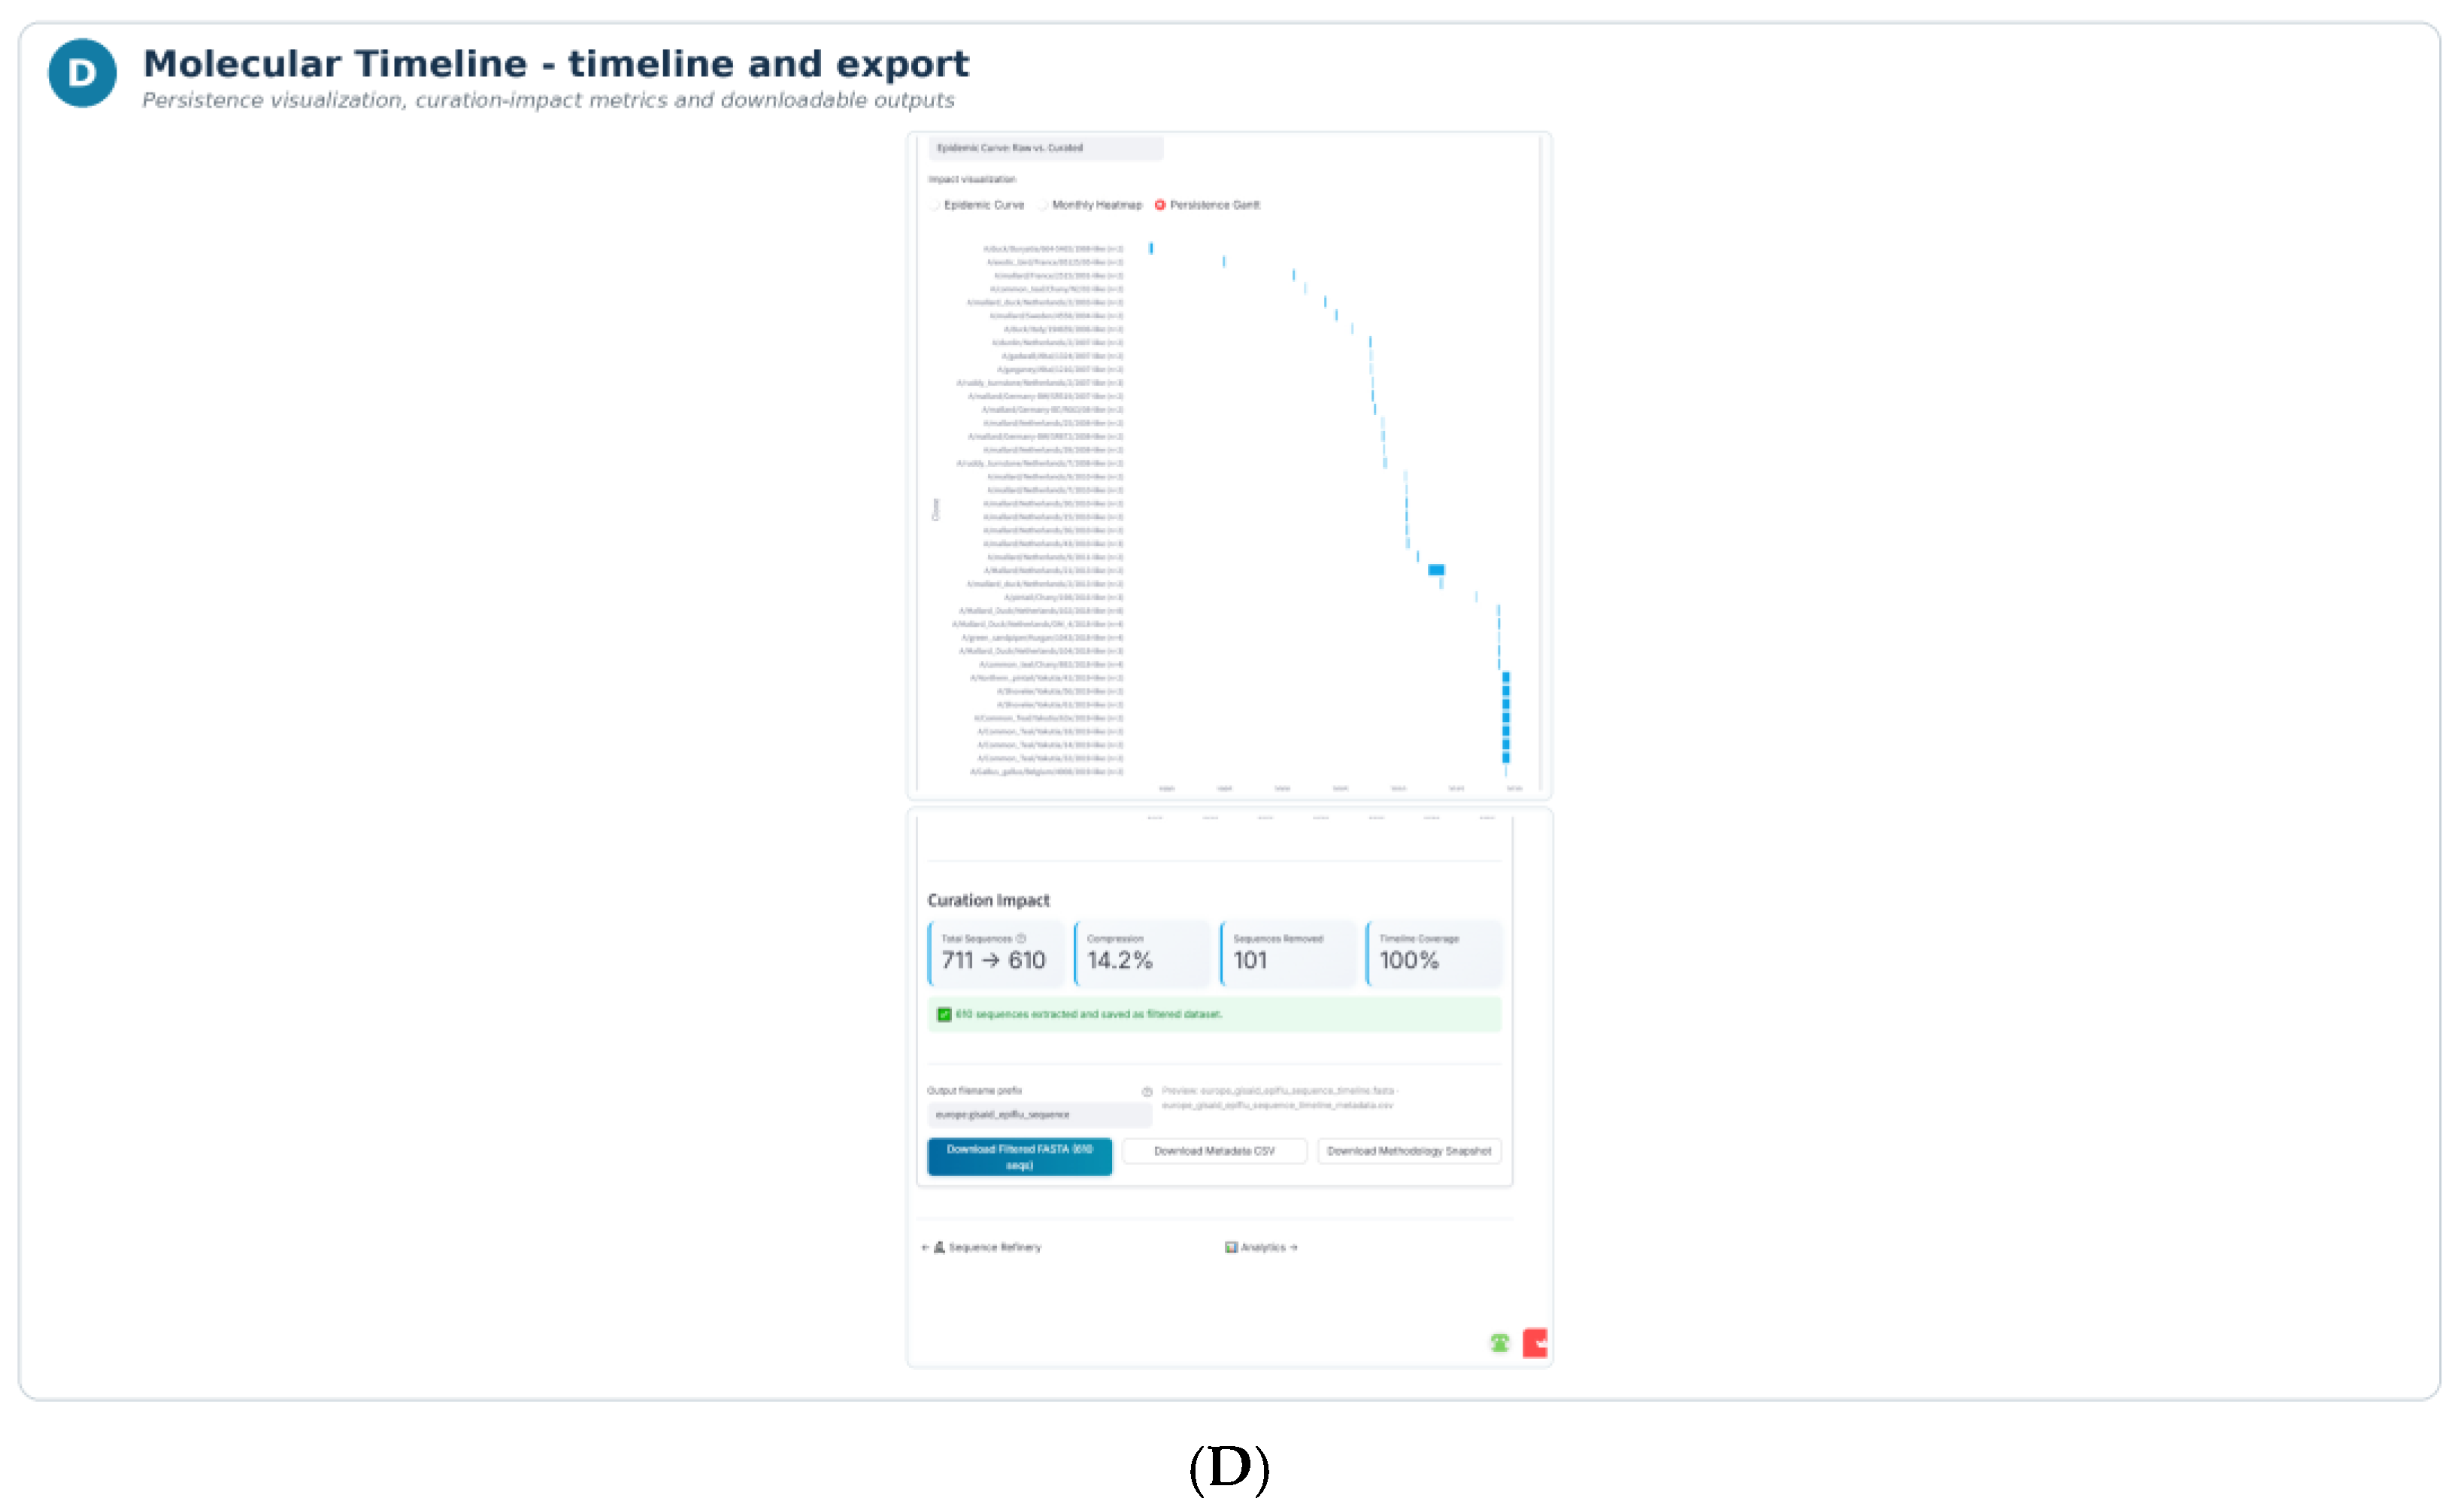

Table 1.
GISAID-style and NCBI/GenBank-compatible FASTA header variants detected by VirSift (parser version 1.1).
Table 1.
GISAID-style and NCBI/GenBank-compatible FASTA header variants detected by VirSift (parser version 1.1).
| Variant | Fields | Detection criterion | Host inference |
| Normalized v1.0 | 9 | Nine or more pipe-delimited fields | Explicit host field |
| Avian/SARS 6-field | 6 | Second field is a known segment name (PB2, PB1, PA, HA, NP, NA, MP, NS, HE, P3) | Slot count + keyword scan |
| Human/Influenza A/B/C/D 6-field | 6 | Second field is a subtype, not a segment | Slot count + keyword scan |
| hRSV 3-field | 3 | Three or fewer fields, or isolate begins with RSV prefix | RSV prefix → Human |
Table 3.
Analytics page chart types and their primary surveillance use.
| Chart type | X / Y / Group | Primary use |
| Bubble timeline | Date / Count / Subtype | Temporal sequence density by subtype |
| Bar chart | Category / Count | Top-N distribution of any categorical field |
| Donut (Pie) | Category segments | Proportional composition |
| Violin | Category / Length | Sequence length distribution by host or subtype |
| Box plot | Category / Length | Length outlier detection |
| Heatmap | Category A / Category B | Co-occurrence matrix (e.g., segment × clade) |
| Sunburst | Host → Subtype → Clade (3 levels) | Hierarchical clade composition |
| Treemap | Host → Subtype → Clade (3 levels) | Proportional hierarchy with size encoding |
| 3D Scatter | Year / Length / Segment | Temporal and size clustering |
| Gantt | Date start–end / Category | Temporal span by group (subtype, host, clade) |
Table 2.
VirSift HITL temporal sampling strategies.
| # | Strategy | Mode | Recommended for | Key parameter |
| 1 | Chronological Sentinel | Automatic | Micro/Seasonal | Lifespan bin size |
| 2 | Highest Volume Peaks | Automatic | Seasonal | Sensitivity (0.1–1.0) |
| 3 | Peak Checklist | Semi-automatic | Seasonal/Long-span | User peak selection |
| 4 | Custom Checkpoints | Manual | Long-span/Overwintering | Target dates ± tolerance window |
| 5 | Visual Lasso | Manual | Complex/mixed | Drag selection on epidemic curve |
| 6 | Clade-Based Monthly Filter | Manual | Clade-specific/Longitudinal | Clade(s) + first/last/both per month |
Disclaimer/Publisher’s Note: The statements, opinions and data contained in all publications are solely those of the individual author(s) and contributor(s) and not of MDPI and/or the editor(s). MDPI and/or the editor(s) disclaim responsibility for any injury to people or property resulting from any ideas, methods, instructions or products referred to in the content. |
© 2026 by the authors. Licensee MDPI, Basel, Switzerland. This article is an open access article distributed under the terms and conditions of the Creative Commons Attribution (CC BY) license (http://creativecommons.org/licenses/by/4.0/).
Copyright: This open access article is published under a Creative Commons CC BY 4.0 license, which permit the free download, distribution, and reuse, provided that the author and preprint are cited in any reuse.