
Submitted:
14 July 2026
Posted:
15 July 2026
You are already at the latest version
Abstract
This study presents a comprehensive experimental and numerical investigation of a rotating propeller using three-dimensional Digital Image Correlation (3D DIC), Computational Fluid Dynamics (CFD), and Finite Element Method (FEM) analysis. The main objective was to assess the applicability and accuracy of 3D DIC for full-field displacement and strain measurements under centrifugal loading conditions. The propeller geometry was reconstructed using 3D scanning and implemented in a numerical model with material parameters identified through mechanical testing. Experimental measurements were carried out on a dedicated test stand enabling controlled rotational speed and synchronized image acquisition. Particular attention was devoted to measurement uncertainty, including calibration errors, motion effects, and coordinate system alignment. The obtained displacement and strain fields were compared with FEM predictions after proper spatial transformation for rotational speeds 4110, 6064, and 6940 rpm. The results demonstrate good agreement between numerical and experimental data in selected regions, confirming the potential of 3D DIC for validation of rotating structures, while also highlighting limitations related to dynamic effects and optical constraints.
Keywords:
digital image correlation
; DIC/FEM validation
; CFD-FEM analysis
; rotating components
; aerodynamic loading
; UAV propellers
; energy-conversion systems
1. Introduction
1.1. Measurement Challenges for Rotating Components
Rotating components in energy-conversion systems and vehicles such as turbine blades, drivetrain elements, fans, and propellers operate under conditions where centrifugal, aerodynamic, and inertial loads, along with vibrations, are superimposed on the structural response. Consequently, in design practice, the reliable determination of displacements and strains under operational conditions is essential for both the validation of computational models and the verification of strength criteria. At the same time, conventional contact-based methods face significant limitations: they require the installation of sensors on the rotating part and the use of a signal transmission path (slip rings or telemetry), which increases the complexity of the test rig, raises costs, and introduces additional sources of error [1,2,3]. Strain-gauge measurements are typically point-based, and the number of channels is often limited, resulting in an incomplete representation of the deformation field in the case of complex geometries and non-stationary strain distributions. Furthermore, both resistive strain gauges and Fiber Bragg Grating (FBG) sensors may exhibit increased intrusiveness (alteration of local stiffness, mass, or aerodynamics) due to the presence of sensors, adhesive layers, protective coatings, and wiring/optical fibers [4,5]. Examples of strain-gauge telemetry applications in real rotating systems confirm the utility and maturity of this technique, but simultaneously highlight its high cost and organizational difficulties in implementation [6,7,8].
1.2. DIC Attempts in Rotating Elements Measurement
In response to the limitations of contact methods, non-contact techniques are being developed (including holographic and moiré interferometry, laser vibrometry, and Blade Tip Timing); however, in practice, they often provide point-based or directionally restricted information. For instance, Blade Tip Timing (BTT) allows for the monitoring of vibrations in all blades, but it essentially concerns tip displacement and does not directly provide full-field strain maps [9,10,11]. Similarly, Laser Doppler Vibrometry (LDV) is highly effective for vibration measurements, but in configurations for rotating objects, it is usually limited to a single motion component (e.g., TLDV) and requires precise point tracking and knowledge of the system geometry [12]. Against this background, three-dimensional Digital Image Correlation (3D DIC) stands out as a method capable of simultaneously determining three-axis displacements and surface strains while maintaining its full-field measurement nature [13,14]. Importantly, 3D DIC allows for the compensation of rigid body motion by analyzing deformations in a reference frame coupled with the rotational movement—a necessary condition for rotating elements to separate global motion (e.g., run-out) from load-induced deformations.
Previous attempts to apply DIC to rotating objects have mostly been proof-of-concept in nature, focusing on capturing displacements (often deflection) by synchronizing camera triggers with the angular position of the rotor [15,16,17,18]. While these studies indicate that the measurement is feasible, most lack rigorous validation against a reference method and uncertainty analysis; furthermore, the aspect of determining actual surface strains is often overlooked. Consequently, the question remains open as to the extent to which 3D DIC can be considered a metrologically closed method for rotating element measurements—i.e., one with known limits of accuracy and repeatability. This work addresses this gap by developing a procedure for selecting key system parameters (including exposure time, resolution, stereo geometry, and synchronization) and verifying the results based on reference measurements, aimed at the reliable measurement of both displacements and strains.
2. Materials and Methods
2.1. Test Object and Experimental Setup
The developed experimental setup is intended for the investigation of UAV propellers under real rotational operating conditions. In this study, an APC Propellers 8×3.8SF propeller was selected as the test specimen, allowing the analysis of rotating components at rotational speeds of up to 11000 rpm. One of the main objectives of the setup was to verify the synchronization between camera triggering and the rotational phase of the propeller in order to effectively freeze the motion during image acquisition. Such synchronization is essential for capturing images at well-defined angular positions during rotation. In addition, the setup enables the assessment of the feasibility of full-field deformation measurements during continuous rotation, which is crucial for evaluating the accuracy and applicability of the Digital Image Correlation (DIC) method in dynamic measurements of rotating structures.
2.1.1. Test Stand
The experimental setup consists of a drive system, an image acquisition system, and a phase synchronization system. The investigated propeller was driven by a REDOX BL 650/1000 brushless motor with a rated power of 285 W, controlled by a REDOX EVO 60 A electronic speed controller and powered by a 3s Li-Po battery (11.1 V, 3600 mAh). In the designation 650/1000kv, the parameter relevant for rotational speed is the 1000 kV constant, corresponding to approximately 1000 rpm per volt. For a 3s battery pack this results in a no-load rotational speed on the order of 11,000 rpm, while under load the achievable speed is lower. The applied power supply allowed the tested propeller to reach rotational speeds of up to 8000 rpm.
The trigger synchronization was based on a cRIO-9063 real-time controller, a high-speed digital NI-9402 module (operation time up to 55 ns), and a SICK KTX Prime contrast sensor with a response time of 10 s and a response-time jitter of 5 s. A jitter of 5 s corresponds to a phase error of approximately 0.21 at the highest tested speed of 7000 rpm. The code implemented on the cRIO controller allowed the introduction of a programmable delay, enabling the cameras to be triggered at the desired rotational phase. The sensor was also used for rotational speed measurement. Image acquisition was performed using two Phantom T4040 high-speed cameras (color sensor 4.2 Mpx, up to 9350 fps at full resolution, minimum exposure time 1 s). The cameras were connected to the computer via an Ethernet switch, with additional LED illumination and a shared trigger line according to the scheme. Figure 1 and Figure 2 present a photograph and schematic diagram of the assembled test stand.
2.1.2. Test Object and Its Material Characteristics
To obtain accurate mechanical properties for subsequent finite element (FE) modeling, tensile tests were performed on the Complet LGF60-PA6 material sourced from a propeller manufactured by APC Propellers—Landing Products Inc. (1222 Harter Ave., Woodland, CA, USA). The investigated specimen was an APC 8×3.8SF propeller manufactured with the Complet LGF60-PA6 material (Figure 3).
The material parameters used in the analysis were determined in our previous study and are adopted here without modification [19]. A detailed description of the material characterization procedure and the corresponding experimental validation can be found in that work. The measured Young’s modulus ranged from 10,259 MPa to 10,794 MPa, and the ultimate tensile strength ranged from 105 MPa to 119 MPa. The Poisson ratio was determined as 0.49.
A stochastic pattern (also called a speckle pattern) was applied on the propeller surface using white and black matte spray paint. The pattern was created such that the typical diameter of a single speckle corresponded to approximately 4 pixels, which falls within the recommended range of 3–5 pixels per speckle reported in the literature [20].
Considering the image scale factor for the adopted optical configuration, this requirement corresponded to a speckle diameter of approximately 0.34 mm. Three propeller specimens were prepared, and the one exhibiting the speckle pattern closest to the assumed characteristics was selected for further analysis (Figure 3).
2.1.3. 3D Scanning of the Propeller
To perform the FEM and CFD analyses, an accurate geometric representation of the propeller was required. Therefore, a 3D scan was performed directly on the same propeller specimen that had previously been investigated in the 3D DIC experiments. The scanning process was carried out using a Creality CR-Scan Raptor Pro 3D scanner, which offers a metrology-grade accuracy of up to 0.02 mm in blue laser mode [21].
During scanning, the propeller was suspended above a reference plane covered with tracking markers. Additional reference markers were placed on the upper half of the propeller to facilitate alignment during scanning. The lower half of the propeller was intentionally left without markers in order to capture its surface geometry as accurately as possible. The scanning process was therefore performed primarily on the marker-free lower side of the blade. Figure 4 shows the scanning setup.
The scanner first generates a dense point cloud, which is subsequently converted into a triangulated surface mesh stored in the STL format. The obtained point cloud was reduced to 49,187 points (below 50,000) to simplify further processing and enable efficient export to a STEP model required for FEM analysis. The STL model was then converted to the STEP format using Autodesk Fusion. Finally, the complete propeller geometry was reconstructed by applying a mirror operation to the scanned lower half of the propeller, resulting in the full symmetric propeller model.
2.2. Numerical Analysis
The numerical analysis was performed based on the 3D geometry of the propeller obtained from the scanning procedure described in the previous section. In order to determine the aerodynamic loads acting on the propeller blades, a CFD analysis was first conducted. The pressure distribution on the blade surfaces was computed in a single iteration for each of the three tested rotational speeds: 4110, 6045, and 6940 rpm.
Subsequently, the obtained pressure fields were applied as external loads in a structural analysis to evaluate the resulting displacements and strain distribution of the propeller blades. The structural calculations were performed using ANSYS Mechanical 2024 R2.
2.2.1. CFD-Based Aerodynamic Load Determination
The first stage of the study involved the development of a numerical model of the flow field around a rotating propeller. A three-dimensional computational domain was prepared to represent the blade geometry and the surrounding air region. Spatial discretization was refined in areas where strong velocity and pressure gradients were expected, particularly near the blade surfaces and domain boundaries. This approach ensured accurate determination of aerodynamic loads, which were subsequently used to evaluate propeller deformations.
The flow was modeled as incompressible and governed by the Navier–Stokes equations:
where is the air density, is the velocity vector, p denotes the pressure, is the body-force vector, and represents the dynamic viscosity.
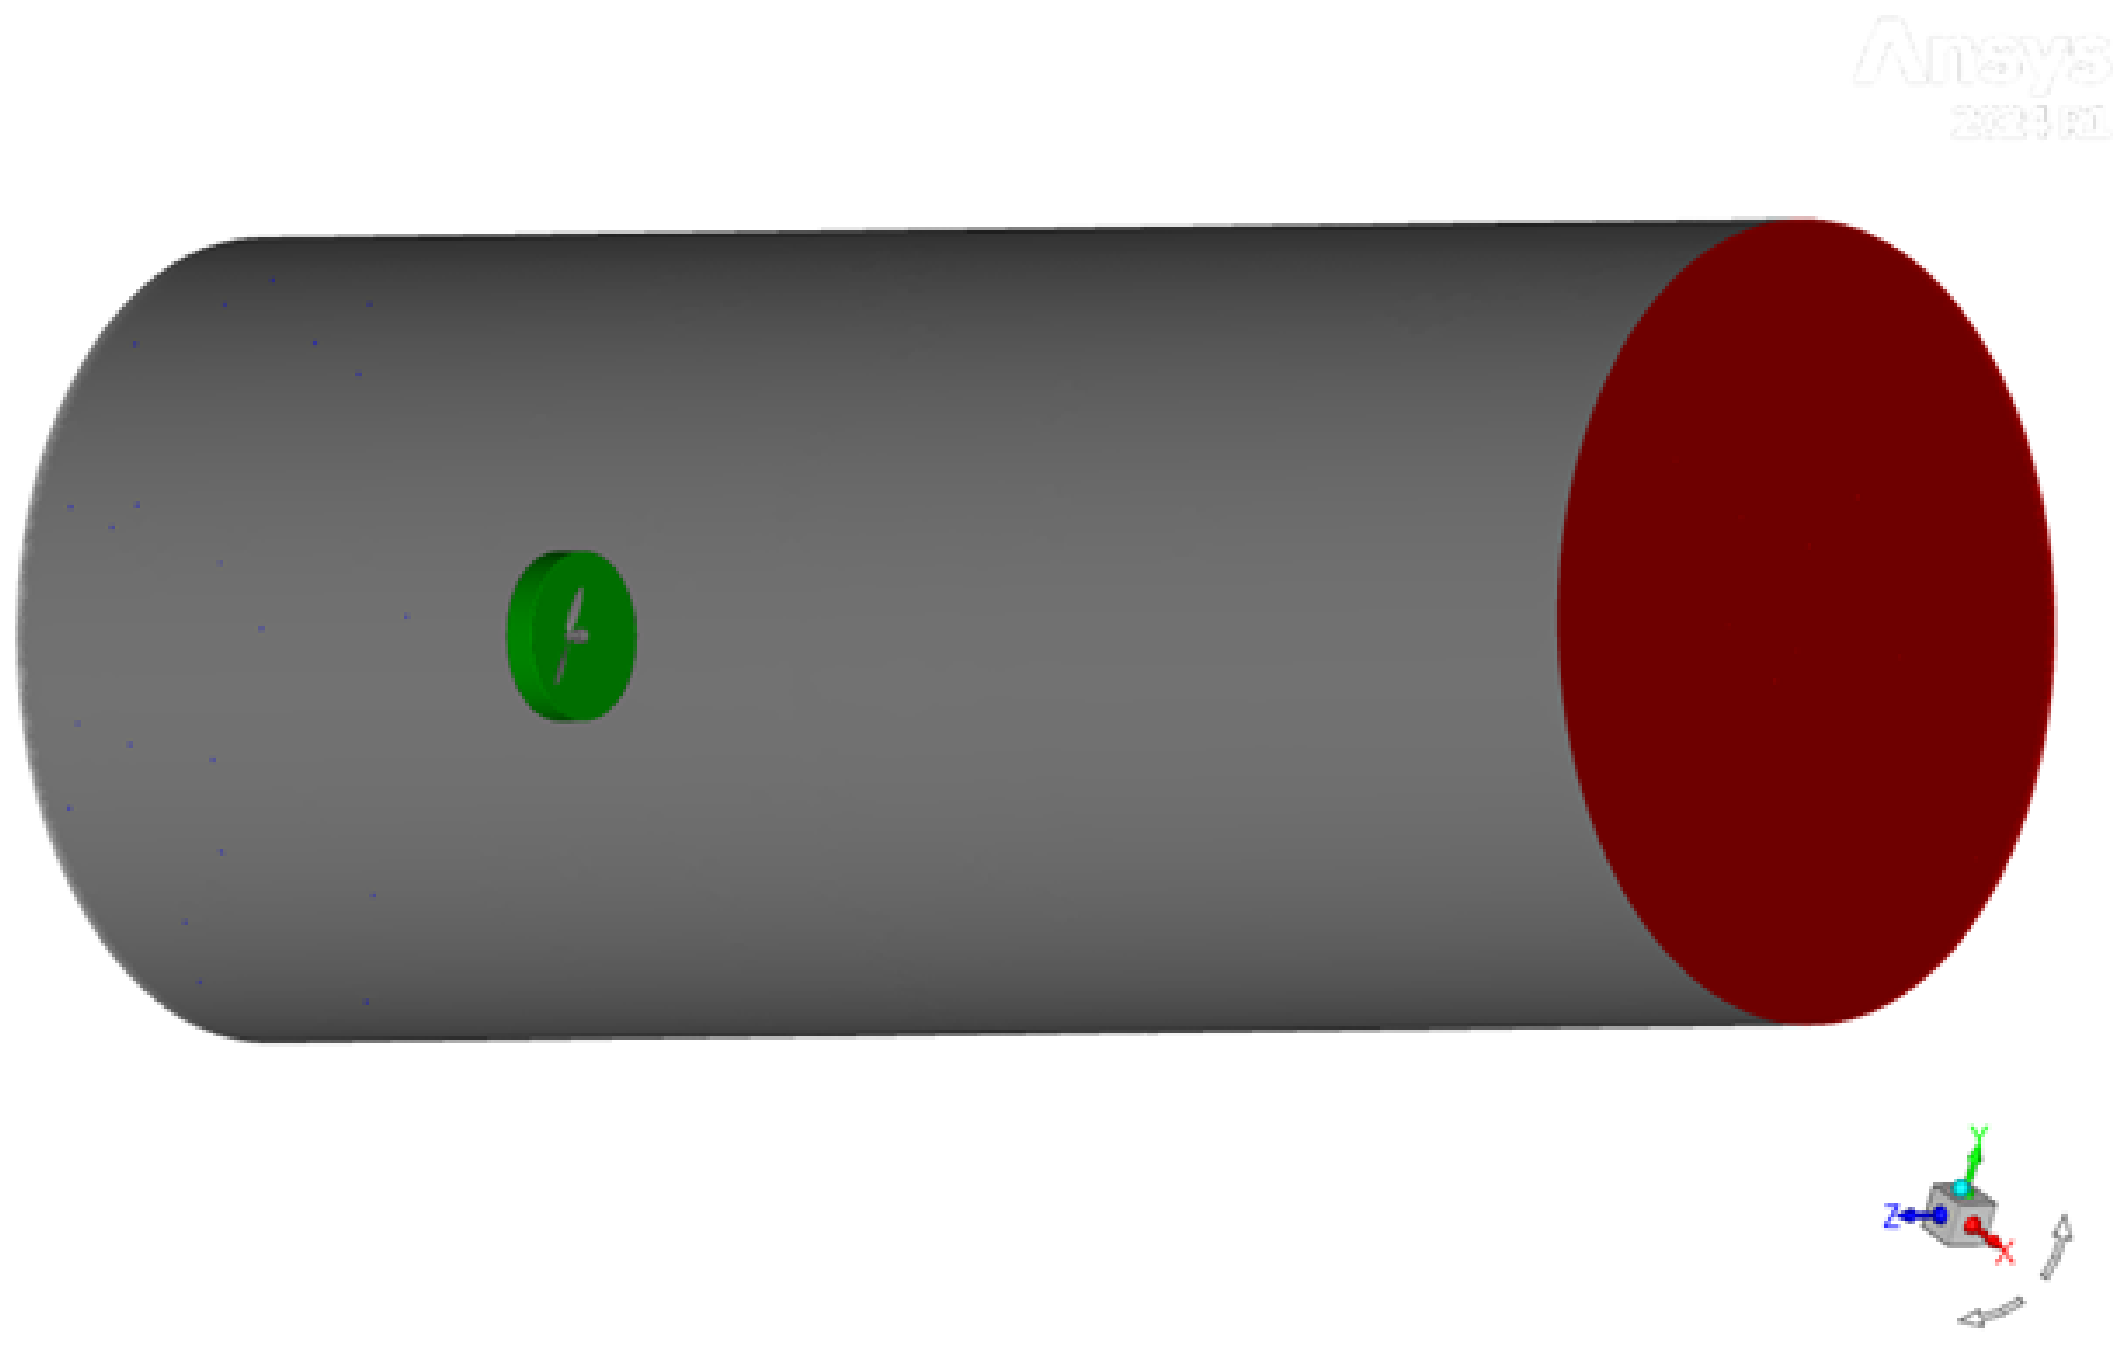
Figure 5.
Numerical domain with the MRF zone highlighted.
To model the rotational motion of the propeller, the Multiple Reference Frame (MRF) method was applied. In this approach, the computational domain is divided into a rotating subdomain containing the propeller and an external stationary subdomain representing the surrounding fluid. The governing equations are solved under steady-state conditions, with the rotor domain formulated in a non-inertial reference frame rotating at a prescribed angular velocity , while the external domain remains in an inertial frame of reference [22].
Within the rotating subdomain, the momentum equations are extended with additional source terms accounting for centrifugal and Coriolis forces. The formulation of relative velocity introduces apparent body forces of the form
where denotes the position vector. At the interface between rotating and stationary regions, appropriate frame transformations are applied to ensure conservation of mass and momentum fluxes. The MRF method provides a steady approximation of the mean rotational effects and is widely used in propeller and turbomachinery simulations due to its favorable balance between accuracy and computational cost [22,23].
The governing equations were discretized using the finite volume method. Reynolds averaging was adopted to describe the turbulent flow field. Turbulence closure was achieved using the two-equation Shear Stress Transport (SST) model, known for its robustness in flows characterized by adverse pressure gradients and near-wall effects [24].
The computational mesh was designed to provide adequate resolution in the boundary-layer region. An inflation polyhedral layer was generated along the blade surface to accurately capture viscous effects. The height of the first cell was selected to maintain , allowing resolution of the viscous sublayer and improving prediction of wall shear stress and pressure loads. Similar near-wall treatment strategies are recommended in numerical studies of rotating propellers and fans [22,23].
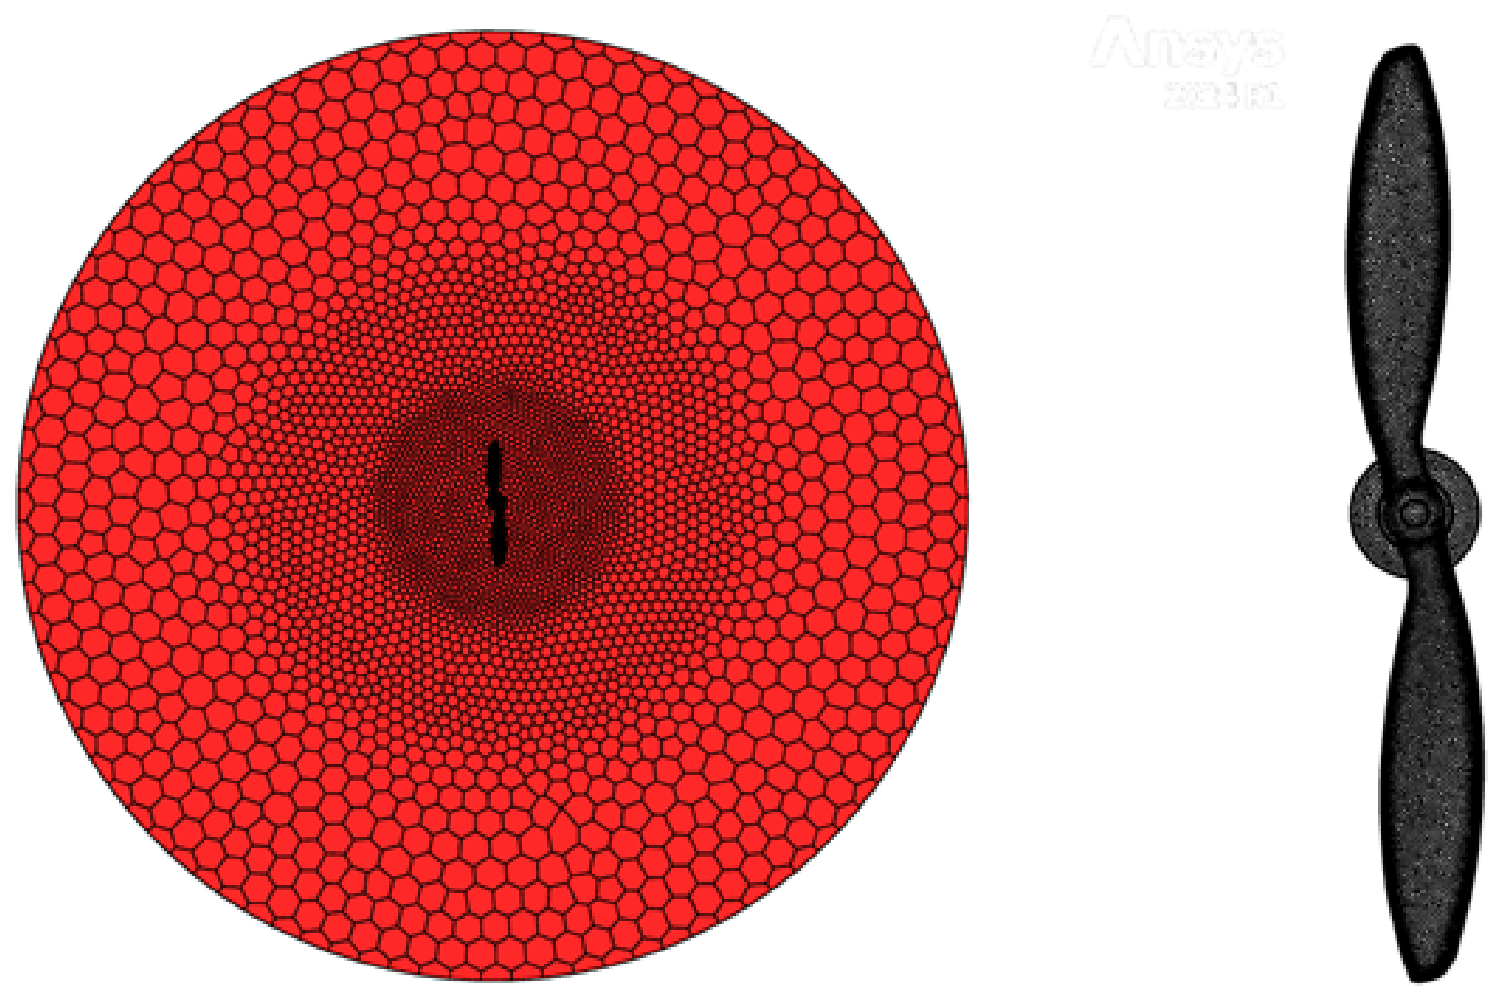
Figure 6.
Numerical domain and propeller mesh.
The CFD solution provided detailed spatial distributions of pressure and shear stresses on the surface of the propeller blades. These aerodynamic loads were transferred to the structural model to calculate blade deformation under rotational conditions. The numerical approach adopted in this study is consistent with methodologies commonly used in rotating machine simulations and propeller analyses reported in the literature [23]. The resulting deformation fields were subsequently compared with experimental measurements to evaluate the predictive capability of the numerical model.
The obtained CFD results were used to determine the aerodynamic pressure distribution acting on the propeller blades. Figure 7 presents the pressure distribution on the suction side of the APC 8×3.8SF propeller for the highest tested rotational speed of 6940 rpm.
2.2.2. FEM Analysis
Implicit structural analysis was performed using ANSYS Mechanical 2024 R2. Second-order finite elements were employed in order to achieve improved geometric representation and higher solution accuracy due to the quadratic interpolation of the shape functions. Higher-order 10-node tetrahedral (TET10) elements were used throughout the model.
Due to the nonlinear behavior of the thermoplastic material observed in the unidirectional tensile test, the true stress–strain curve was implemented in the material model within the plastic deformation range. However, the maximum von Mises stress did not exceed 8.5 MPa, which is significantly below the onset of plastic deformation. The Young’s modulus was determined from tensile test data and equals GPa, while the Poisson ratio was assumed as 0.49.
The Large Deflection option was enabled in the analysis. This formulation accounts for stiffness changes resulting from geometry updates during deformation. In the present simulation, a complex stress state developed due to the combined action of aerodynamic pressure loads and rotational velocity. The pressure load was applied directly to the blade surfaces, acting normal to the surface.
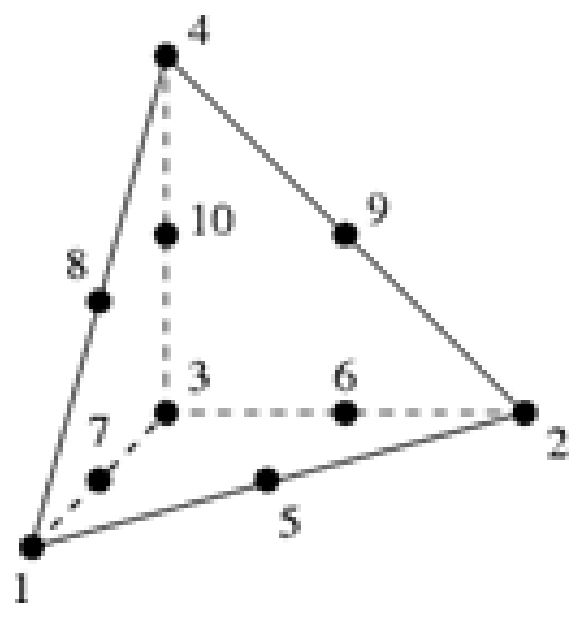
Figure 8.
Geometrical scheme of TET10 finite-element representation.
Similar results were published by Nowicki [25]. In their study, a 240 mm propeller (our blade is 203 mm long) produced 2.9 N of thrust at 7500 RPM (ours 2.29 N). The thrust of this propeller also resulted in lower deformation in their experiment than predicted by the CFD+FEM analysis. The author states that a reason for this is not clear, but it is suspected that the blade was not perfectly balanced and was wobbling on the motor, which resulted in a lower deflection value.
Figure 9 presents the relationship between the calculated thrust obtained from the numerical analysis and the rotational speed. The complete results of the displacement and strain fields of the propeller, together with the corresponding deformation maps, are presented in the section devoted to the comparative analysis of FEM and 3D DIC results.
2.3. 3D DIC Measurement
2.3.1. DIC Setup
Two Vision Research Phantom T4040 high-speed cameras equipped with a 4 Mpx color sensor were used for the measurements. Due to the lack of availability of monochrome cameras at the time of the experiments, color cameras were used instead. Nevertheless, the higher sensor resolution (4 Mpx) allowed the acquisition of images with sufficient spatial resolution for the Digital Image Correlation analysis. Figure 10 presents the stereo camera setup used during the experiments. The detailed parameters of the cameras and the stereo configuration are summarized in Table 1. The DIC analysis was performed using GOM Correlate 2018 software.
2.3.2. Experiment Methodology
It is important to emphasize that in the presented experiments the DIC analysis was performed using phase-locked (stroboscopic) image acquisition synchronized with the rotational motion of the propeller. The camera shutter was triggered at a fixed rotational phase, resulting in the acquisition of exactly one image per revolution of the propeller. This approach effectively freezes the rotating blade in the same angular position for each recorded frame.
This measurement strategy allowed the analysis to be focused on only one half of the propeller blade by positioning the cameras closer to the measurement region and limiting the field of view to a smaller area of interest. As a consequence, a smaller image scale factor was achieved compared to configurations in which the entire propeller must remain within the camera frame. The reduced field of view increases the spatial resolution of the recorded images, which directly improves the accuracy of the displacement and strain measurements obtained using the DIC method.
Before each test, stereo-system calibration had to be performed. Calibration of the 3D DIC system was performed using the CP40-200 calibration panel. The obtained calibration deviation was 0.069 pixels, which confirms the correct calibration of the stereo camera system (the manufacturer recommends that the calibration deviation should not exceed 0.1 pixels). The defined measurement volume was 85/140/125 mm, and the stereoscopic angle between the cameras was 24.6 (Table 1).
After the calibration of the 3D DIC system using the calibration panel and prior to each test, a sequence of 5–7 images of the unloaded propeller was recorded. These images constitute the reference state for the subsequent DIC analysis. Based on these images, the reference frame was defined in the GOM software, relative to which displacements and strains were calculated. Importantly, the acquisition of the reference images was performed without any changes to the camera settings or the geometry of the measurement system.
Three experimental tests were performed for the selected steady rotational speeds of 4110, 6045, and 6940 rpm. After recording the reference images corresponding to the unloaded state of the propeller, the acquisition of the actual measurement data was initiated.
During each test, the propeller was first accelerated to the prescribed rotational speed. After approximately 10 s of operation at the target speed, the image acquisition from the cameras was started. This approach ensured that the transient effects associated with the acceleration phase were eliminated and that the measurements were performed under stable operating conditions.
2.4. Displacement and Strain Uncertainty Assessment
For the purpose of validating the DIC-based displacement and strain measurements, a dedicated validation setup and measurement procedure were developed. Their purpose was to assess the measurement uncertainty of the assembled 3D DIC system for the specific experimental configuration used in this study, including the field of view, camera set, and stereo angle. The setup was based on a PC-ABS cantilever beam subjected to controlled bending with a micrometer screw. Two bonded strain gauges, previously verified with a certified decade resistor through an NI 9237 acquisition module [26,27], were used as reference sensors, while virtual strain gauges (VSGs) were defined at the corresponding locations in the DIC analysis. A random speckle pattern was applied on the opposite side of the beam to enable image correlation. A similar validation-oriented setup and uncertainty-focused approach were reported in recent DIC studies [19].
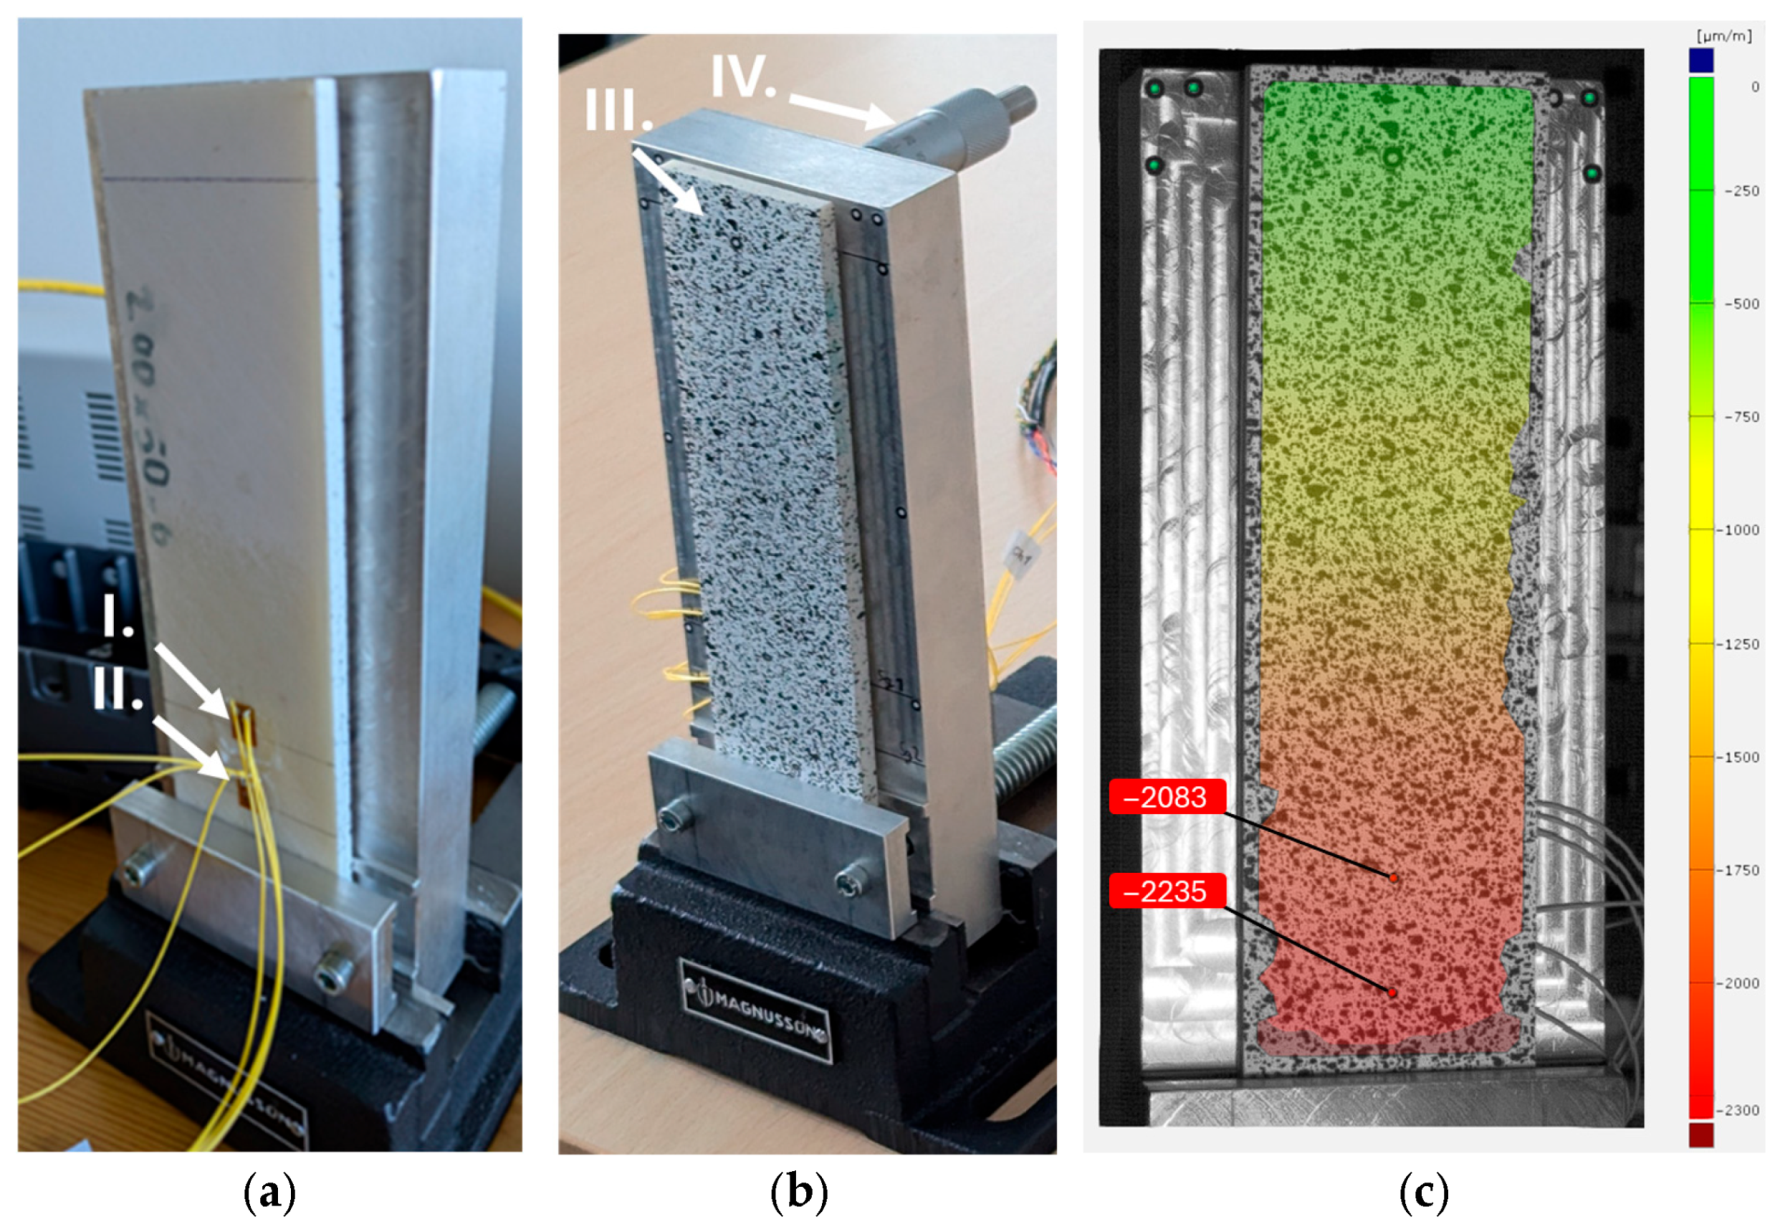
Figure 11.
Validation setup used for DIC strain measurement verification based on the procedure described in [19]: (a) Validation setup used for DIC strain measurement verification: I. Strain gauge 1, II. Strain gauge 2. (b) III. PC-ABS beam with speckled pattern applied. IV. Micrometer screw inducing the deflection of the beam. (c) GOM Correlate analysis screenshot. Two marked VSGs correspond to strain gauges 1 and 2.
Figure 11.
Validation setup used for DIC strain measurement verification based on the procedure described in [19]: (a) Validation setup used for DIC strain measurement verification: I. Strain gauge 1, II. Strain gauge 2. (b) III. PC-ABS beam with speckled pattern applied. IV. Micrometer screw inducing the deflection of the beam. (c) GOM Correlate analysis screenshot. Two marked VSGs correspond to strain gauges 1 and 2.
2.4.1. Validation Procedure
The displacement and strain validation procedure was performed in the same optical configuration as used in the main experiment, i.e., with identical camera positioning, field of view, and stereo angle (Table 1). Prior to the measurements, the 3D DIC system was calibrated using a certified calibration panel according to the software-guided procedure [20,28].
Subsequently, the validation rig was adjusted to a set of predefined micrometer screw positions corresponding to out-of-plane displacements of 0, 1, 2, 3, 4, and 5 mm. For each position, a series of several dozen images was acquired with the 3D DIC system to enable a statistical (Type A) estimation of repeatability. In parallel, strain-gauge signals were recorded using a CompactDAQ-based acquisition system equipped with an NI 9237 bridge/strain module [26].
For strain validation, virtual strain gauges (VSGs) were defined in the DIC analysis at locations corresponding to the bonded strain gauges, and the strain values were compared at each load increment. For displacement validation in the z-direction, the displacement of markers placed directly on the micrometer screw head was evaluated, thus eliminating any influence of beam bending on the reference displacement.
Finally, the measurement uncertainty was assessed by comparing DIC results with reference measurements, i.e., micrometer readings for displacement and strain-gauge measurements for strain, following the GUM-based uncertainty framework [27].
2.4.2. Validation Results
Table 2 presents the results of the displacement measurement error analysis using the 3D DIC method in the range from 0 to 5 mm. The mean value was calculated from a series of 30 measurements for each imposed displacement. The obtained results indicate a consistent level of random error across the entire measurement range, with no significant degradation of accuracy for increasing displacement values. The total error was evaluated using the root mean square error (RMSE), defined as
where denotes the measured value and is the reference value.
To ensure a conservative estimation of displacement measurement uncertainty, the maximum total error (RMSE) observed in the dataset, equal to , was adopted. Based on this value, the expanded uncertainty of the 3D DIC method for a coverage factor was determined as
Thus, for the applied 4 MPx color camera system, the displacement measurement uncertainty can be estimated as 10.3 m.
In the case of strain measurements, two main components of measurement uncertainty were identified based on the comparison with strain-gauge measurements (Table 3). The random error exhibits an approximately constant additive character, with a standard deviation typically in the range of 15–. In contrast, the systematic error shows a multiplicative behavior, increasing proportionally with the measured strain and corresponding to a relative error of approximately .
According to the GUM guidelines [27], the combined standard uncertainty was estimated as
where and . The expanded uncertainty for a coverage factor is therefore expressed as
Although the measurement accuracy is improved, the systematic component remains significant. Therefore, the application of a correction factor is still recommended in order to reduce the overall uncertainty and improve agreement with reference measurements.
It was observed that for strain values below approximately , regions where no physical strain concentration is expected, often near the edges of the measured field, may exhibit artefacts in the form of artificially elevated strain zones, which can lead to misinterpretation of the results.
3. Results and Discussion
3.1. Propeller Deformation Results
In this section, analysis of the displacement and strain results obtained using the 3D Digital Image Correlation (DIC) method and the Finite Element Method (FEM) is presented for the APC 8×3.8SF propeller. The objective of this comparison is to evaluate the consistency between experimentally measured deformation fields and the numerical predictions obtained from the structural simulations.
For the purpose of quantitative comparison, three characteristic points (P1, P2, and P3) located on the surface of the propeller blade were selected. The locations of these points are shown in Figure 12. Point P1 was placed near the blade tip, where the largest displacements are expected due to centrifugal forces and dynamic effects occurring during rotation. Point P2 was located in the mid-span region of the blade, which represents an area subjected alternately to bending and stretching during blade deflection. Point P3 was positioned close to the blade root, in a region of reduced cross-section where increased strain levels may occur.
The positions of the selected points were defined with respect to the propeller rotation center so that they could be easily defined both in the DIC measurements and in the FEM model. This approach ensured that corresponding locations were analyzed in both experimental and numerical datasets.
It is also important to note that the coordinate system adopted for the analysis is visible in the lower-left corner of Figure 12. The coordinate system during the DIC analysis was associated with the reference markers located on the propeller hub. The same reference system was used in both the DIC and FEM analyses. The y-axis was defined along the blade direction, extending from one blade tip to the opposite blade tip, the x-axis represents the transverse direction, while the z-axis is aligned with the axis of rotation. The origin of the coordinate system was placed at the rotational axis of the propeller.
3.2. Comparative Analysis of FEM and 3D DIC Results
This section presents a comparative analysis of the deformation results obtained using the 3D Digital Image Correlation (3D DIC) method and the numerical predictions obtained from the Finite Element Method (FEM). The objective of this comparison is to evaluate the consistency between experimentally measured deformation fields and the structural response predicted by the numerical model of the APC 8×3.8SF propeller.
Four deformation parameters were analyzed in detail: strain in the y direction, strain in the x direction, displacement along the z axis, and the absolute displacement magnitude. These quantities were selected in order to capture both the local strain behavior of the blade material and the global deformation of the propeller during rotation.
For each analyzed parameter, full-field deformation maps obtained from the DIC measurements and FEM simulations are presented and compared. In addition to the qualitative comparison of the deformation fields, a quantitative analysis was performed at three characteristic locations on the blade surface (P1, P2, and P3), previously defined in Figure 12. The values extracted at these points allow a direct comparison between the experimental measurements and the numerical predictions, providing insight into the accuracy of the FEM model in reproducing the deformation behavior of the rotating propeller.
Points P1 and P2 were used for the comparative analysis of out-of-plane () and absolute displacements, while points P2 and P3 were employed for the comparative analysis of directional strains in the x and y directions.
For clarity of presentation and to optimize the overall length of the manuscript, the full-field maps of displacement and strain are shown only for the highest investigated rotational speed. The deformation fields obtained for the lower rotational speeds exhibit a similar distribution of the deformation gradients, differing primarily in the amplitudes.
3.2.1. Displacements Results and Analysis
Figure 13 and Figure 14 present the deformation maps obtained for 6940 rpm, illustrating the total displacement field and the displacement component along the z-axis. The results corresponding to the remaining rotational speeds are summarized in the comparative Table 4, containing the values measured at the characteristic points P1–P3.
Figure 13 and Figure 14 present a comparison between the displacement fields obtained from the FEM simulation and the experimental measurements using the 3D DIC method for the rotational speed of 6945 rpm. The maps illustrate the total displacement field as well as the displacement component along the z-axis.
Both displacement maps indicate a visibly stronger torsional deformation of the blade in the experimental results obtained with the 3D DIC method, as evidenced by the direction of the displacement-gradient vector, which is more steeply inclined along the blade span than in the FEM prediction.
This difference originates from the assumptions adopted in the FEM analysis. In the numerical model, a single pressure distribution corresponding to the undeformed blade geometry and the target rotational speed of 6945 rpm was applied. In reality, however, the propeller undergoes progressive deformation as the rotational speed increases. This deformation modifies both the magnitude and the spatial distribution of aerodynamic pressure on the pressure and suction sides of the blade. As a consequence, the real blade experiences a stronger twist than predicted by the single-step FEM analysis.
To account for this effect more accurately, the FEM analysis would require an iterative aeroelastic approach, in which the blade geometry is updated after each deformation step and a new pressure distribution is recalculated for the modified geometry.
The influence of this phenomenon is also visible in the displacement field along the z-axis shown in Figure 14. In the experimental results, the mid-region of the trailing edge exhibits negative displacement values, whereas the corresponding region in the FEM simulation remains close to zero. This discrepancy further indicates a stronger torsional deformation in the experimental case.
The observed differences in the deformation pattern also contribute to the discrepancies in the displacement values measured at the characteristic points P1–P3, as summarized in Table 4, which presents the measured values for all investigated rotational speeds (4110, 6040, and 6945 rpm). The table also includes the absolute difference between the FEM and DIC results as well as the relative error calculated according to the following expressions:
In Table 4, the FEM predictions are compared against the stereo 3D DIC measurements at points P1–P3 for all investigated rotational speeds (4110, 6040, and 6945 rpm). A clear trend can be observed at point P1: as the measured displacement magnitude increases with rotational speed, the relative error decreases. This behavior is consistent with a measurement chain in which a portion of the DIC uncertainty and/or systematic offset acts approximately on an absolute scale (in mm), so that the same order of absolute discrepancy becomes less significant when normalized by larger reference values.
Moreover, the sign of the FEM–DIC discrepancy at P1 changes with rotational speed. At 4110 rpm, the DIC-measured displacement is approximately 35% higher than the FEM prediction, suggesting that the FEM model underestimates the actual z-direction displacement associated with blade bending. At higher rotational speeds (6040 and 6945 rpm), the trend reverses and the DIC values become lower than the FEM results. This indicates that the deformation pattern becomes more complex with increasing speed, and that the contribution of blade twist becomes more pronounced in the experiment. As a result, at lower speed the discrepancy is dominated mainly by underestimation of bending, whereas at higher speeds the increasing influence of twist, together with the limitation of the FEM model based on a single pressure distribution corresponding to the undeformed blade geometry, changes the local displacement response and leads to the observed reversal of the FEM–DIC difference.
3.2.2. Strains Results and Analysis
Figure 15 and Figure 16 compare the normal strain fields in the y- and x-directions obtained from FEM and 3D DIC at 6945 rpm. In contrast to the displacement maps, the match between both methods is noticeably worse for the strain fields, which is expected because strain is calculated from spatial gradients of displacement and is therefore more sensitive to measurement noise.
For the field (Figure 15), both methods show several common features, including a concentration of positive strain near point P3 at the blade root and a region of negative strain in the mid-span area, associated with the combined effect of bending and twist. However, the DIC result at point P1 is noticeably higher than the FEM prediction. This discrepancy is likely related to the relatively low strain magnitude in this region, which approaches the practical resolution limit of the DIC system and may lead to local overestimation.
For the field (Figure 16), the FEM map exhibits a distribution qualitatively similar to that of , but with the opposite sign and lower amplitude. In contrast, no clear agreement is observed between the FEM and DIC results for . This is attributed to the very low magnitude of the component, which remains close to or below the practical strain resolution of the applied DIC configuration. In addition, the local strain concentration visible at point P1 in the DIC map should be interpreted as a measurement artefact, typical of edge regions and low-level strain measurements. Similar artefacts can also be observed as localized concentrations of negative strain along the leading and trailing edges of the blade.
Table 5 summarizes the comparison between the strain values obtained from FEM simulations and 3D DIC measurements at characteristic points P2–P3 for all investigated rotational speeds. In contrast to the displacement results, the discrepancies between FEM and DIC are significantly larger for strain. This is expected, as strain is derived from spatial gradients of the displacement field and is therefore inherently more sensitive to measurement noise.
Moreover, the measured strain values are relatively low in magnitude and, in many cases, approach the practical measurement uncertainty of the 3D DIC system (approximately 200 m/m). As a result, even small absolute deviations lead to large relative errors and noticeable differences between FEM and DIC results.
At points P2–P3 and across different rotational speeds, not only large relative differences but also changes in the sign of the strain values can be observed. Given the complex strain distribution within the blade, these discrepancies are further amplified by differences in the predicted torsional deformation between FEM and DIC. Consequently, even slight variations in the deformation pattern may lead to significant differences in the locally evaluated strain values at the selected measurement points.
3.2.3. Propeller Leading Edge Deformation
In order to investigate the differences in blade twist observed in the displacement results, a comparative analysis of the propeller leading-edge deformation was performed. For this purpose, an identical curve with a length of 90.6 mm was defined along the leading edge in both FEM simulations and 3D DIC measurements, for the unloaded state and three rotational speeds: 4110 rpm, 6040 rpm, and 6945 rpm. In both analyses, the starting point of the curve was located at the blade root, while the endpoint was defined at the blade tip. The coordinate system origin was established at the starting point of the curve.
Due to the requirement of subset interpolation in the DIC method near boundaries, the deformation maps do not fully cover the exact blade edge. Therefore, the analysis line was offset by 2 mm from the leading edge to ensure reliable and consistent data extraction.
Figure 17 presents the comparison of deformation results obtained from FEM and DIC along the defined curve.
Based on the presented results, noticeable differences in the deformation characteristics of the leading edge can be observed between the numerical FEM analysis and the experimental DIC measurements.
For all analyzed rotational speeds, a clear discrepancy is visible in the terminal region of the blade, above approximately 80 mm of the span. The DIC results reveal a different deformation pattern compared to the FEM predictions. This behavior is consistent with earlier observations indicating a greater blade twist in the experimental analysis.
Furthermore, the DIC results exhibit a distinct change in the slope of the curve around 50 mm of the blade span, which is not present in the FEM results. The curve obtained from the FEM analysis shows a smoother gradient without local extrema, suggesting that the numerical model does not capture the localized deformation inhomogeneities observed in the experimental measurements.
Differences in deformation behavior are also evident near the blade root, at approximately 10 mm of the span. In this region, the DIC results indicate more pronounced deflection compared to the FEM predictions. This may suggest an underestimation of structural compliance in the numerical model or the influence of boundary conditions. Additionally, this discrepancy may be attributed to limitations in the material model representation. The injection-molding process of LGF60-PA6 in the root region could have led to a local redistribution of glass-fiber orientation, differing from the assumed distribution in the remaining part of the blade.
3.2.4. Propeller Tip Displacement During Acceleration
In this part of the study, the testing procedure was modified by recording the propeller spin-up from 0 to 7034 rpm with the shutter synchronized to the rotational motion. The purpose of this section was primarily to demonstrate the capabilities and versatility of the DIC method in capturing transient phenomena in rotating structures. The objective of the measurement was to evaluate the relationship between blade deformation and instantaneous rotational speed during acceleration, and to determine the displacement characteristic as a function of propeller rotational speed.
The acceleration phase was not recorded without phase-lock synchronization, as it lasted approximately 5 s. At a frame rate of 9300 fps and a resolution of 2048×1664, this would result in roughly 52,000 frames per camera and a data volume of about 250 GB for a single camera. Such an approach would substantially increase both the processing time and the computational demands of the GOM Correlate software. For comparison, a single test performed using the adopted configuration (with shutter synchronization) produced a total of 17.48 GB of data from both cameras.
In contrast to the measurements performed at stabilized rotational speeds, the recording in this case started from the unloaded propeller state at 0 rpm. Therefore, it was not necessary to prepare additional reference images prior to the measurement. The analysis of the recorded image sequence in the GOM Correlate environment is illustrated in Figure 18, while the resulting relationship between blade tip displacement and rotational speed during propeller acceleration is presented in Figure 19.
It should be noted that the displacement curve presented in Figure 19 reveals noticeable oscillations in the range of 0–5000 rpm. These oscillations can be attributed to inertial effects occurring during the acceleration phase of the propeller. It is important to emphasize that each data point was acquired once per revolution at the same angular position of the blade, which allows for consistent tracking of the blade-tip motion. The recorded displacement response is consistent with the values obtained in previous measurements performed at stabilized rotational speeds, confirming the reliability of the applied experimental approach.
4. Conclusions
This study investigated the application of high-speed 3D Digital Image Correlation (DIC) for measuring displacement and strain fields on a rotating propeller. The experimental results were compared with numerical simulations performed using the FEM approach. Particular attention was paid to the ability of the DIC method to capture complex deformation mechanisms, including bending and torsion of the rotating propeller. The comparison between experimental and numerical results allowed for the assessment of both the capabilities of the DIC technique and the limitations of the applied FEM model. The study also highlighted the challenges associated with strain measurements in dynamic conditions, especially for low-magnitude strain levels close to the measurement uncertainty.
Based on the conducted research, the following conclusions were drawn:
- The FEM model, based on a single pressure distribution corresponding to the undeformed blade geometry, does not fully capture the real aeroelastic response of the propeller. In particular, the lack of coupling between deformation and pressure redistribution leads to an underestimation of blade twist. The experimental results obtained using the DIC method reveal the actual deformation behavior of the blade, highlighting these discrepancies. Therefore, more advanced numerical approaches, such as iterative aeroelastic analyses, are required for improved accuracy.
- The maximum absolute displacements and z-direction displacements were observed at the blade tip, reaching 1.016 mm (FEM) and 0.863 mm (DIC) for total displacement, and 0.920 mm (FEM) and 0.841 mm (DIC) for the z-direction component at 6945 rpm. This is consistent with the behavior of a cantilever-like rotating structure subjected to aerodynamic and centrifugal loading (see Figure 13 and Figure 14).
- The comparative analysis of the leading-edge deformation reveals that the primary source of discrepancy between FEM and DIC results is associated with differences in the predicted blade twist, which significantly affects the spatial distribution of displacements along the span. While the FEM model provides a smooth and continuous deformation profile, the DIC measurements indicate localized variations and a higher sensitivity to torsional effects, particularly in the tip region. This suggests that the numerical model may not fully capture the complex aeroelastic behavior of the rotating blade, leading to systematic deviations in the deformation shape rather than solely in magnitude.
- Full-field analysis revealed a complex deformation pattern of the propeller, which cannot be fully captured by point-based evaluation alone. The strain field indicates a combined effect of bending, torsion, and axial deformation of the blade.
- The accuracy of strain measurements using DIC was significantly lower than for displacement measurements. This is expected, as strain is calculated from spatial derivatives of displacement and is therefore more sensitive to noise and local correlation differences. As an example, the relative difference for displacement at point P1 is typically within 10–30% (see Table 4), while for strain at point P3 it increases to the order of –% (see Table 5).
- When measuring strain values below the effective resolution limit of the DIC method, determined based on the combined measurement uncertainty obtained during the 4 MPx camera validation (see Section 2.4.2), GOM Correlate 2018 shows an increased tendency to produce artefacts in the form of localized and non-physical strain concentrations, particularly near the edges of the measured surface. For the applied measurement configuration and based on the validation results of the 4 MPx camera system, this corresponds to an effective strain limit of approximately .
- The conducted research confirms that the DIC method is a useful tool for the experimental analysis of deformation in rotating components, especially in terms of displacement measurements and qualitative assessment of strain fields.
- At the same time, strain measurements obtained using DIC show significant potential for improvement. The measurement error of the applied system limited the ability to fully resolve strain distributions consistent with FEM predictions. Although high-speed 4 MPx cameras were used in this study, they were equipped with color sensors. In general, monochromatic sensors exhibit lower noise levels, which is beneficial for strain measurements [20]. Therefore, improved accuracy could be achieved by employing cameras with lower sensor noise and higher resolution, as well as by reducing the scale factor through a closer measurement setup.
Author Contributions
Conceptualization, K.P.; methodology, K.P., M.S., D.M. and E.P.; formal analysis, K.P. and M.S.; investigation, K.P. and M.S.; resources, K.P.; writing-original draft preparation, K.P., M.S. D.M. E.P.; writing-review and editing, K.P. W.K.; supervision, W.K. and K.P.; project administration, W.K.; funding acquisition, W.K. All authors have read and agreed to the published version of the manuscript.
Funding
This articel was funded by the Military University of Technology, grant number UGB 103/2026/WAT
Acknowledgments
The authors also sincerely appreciate the support provided through the ANSYS National License, coordinated by the Interdisciplinary Centre for Mathematical and Computational Modelling, University of Warsaw (ICM UW).
Conflicts of Interest
The authors declare no conflict of interest.
References
- Aerodyn Global. 2025. Available online: www.aerodyn-global.com/products-services/slip-rings/high-speed-slip-rings (accessed on 27 January 2026).
- DATATEL Telemetry GmbH. 2025. Available online: www.datatel-telemetry.de (accessed on 29 January 2026).
- DeAnna, R.G. Wireless Telemetry for Gas-Turbine Applications; Technical Memorandum NASA/TM-2007-214924; National Aeronautics and Space Administration, 2000. [Google Scholar]
- Instrumentation Tools. Difference between Invasive, Non-Invasive, Intrusive and Non-Intrusive Measurements. 2025. (accessed on 1 February 2026).
- Cruz-Cunha, M.M.; Simões, R.; Miranda, I.M.; Martinho, R.; Rijo, R.; Ferreira, L. Non-Intrusive Health-Monitoring Devices. In An E-Marketplace of Health and Social Care Services; IGI Global: Hershey, PA, USA, 2016; chapter 55. [Google Scholar]
- Löfflad, J.; Eissner, M.; Graf, B. Strain Gauge Measurements of Rotating Parts with Telemetry. In Proceedings of the Proceedings of the 9th International Conference on Hydraulic Efficiency Measurements (IGHEM 2012), Trondheim, Norway, 2012. [Google Scholar]
- Rosa, J.; Cagáň, J. Strain Gauge Measurement of Propeller Blade Vibration during Operation on Aircraft Diesel Engine. In Proceedings of the Proceedings of the 34th Danubia-Adria Symposium on Advances in Experimental Mechanics, Trieste, Italy, 2017. [Google Scholar]
- Jiao, S.; Zheng, J. Aerodynamics Analysis of Helicopter Rotor in Flight Test Using Strain Gauge Sensors. Sensors 2025, 25, 1911. [Google Scholar] [CrossRef] [PubMed]
- Chen, Z.; Sheng, H.; Xia, Y.; Wang, W.; He, J. A Comprehensive Review on Blade Tip Timing-Based Health Monitoring: Status and Future. Mech. Syst. Signal Process. 2021, 149, 107330. [Google Scholar] [CrossRef]
- Capponi, L.; Tocci, T.; Marrazzo, M.; Marsili, R.; Rossi, G. Experimental Investigation on Hardware and Triggering Effect in Tip-Timing Measurement Uncertainty. Sensors 2023, 23, 1129. [Google Scholar] [CrossRef] [PubMed]
- Du Toit, R.G.; Diamond, D.H.; Heyns, P.S. A Stochastic Hybrid Blade Tip Timing Approach for the Identification and Classification of Turbomachine Blade Damage. Mech. Syst. Signal Process. 2019, 121, 389–411. [Google Scholar] [CrossRef]
- Rothberg, S.J.; Allen, M.S.; Castellini, P.; Di Maio, D.; Dirckx, J.J.J.; Ewins, D.J.; Halkon, B.J.; Muyshondt, P.; Paone, N.; Ryang, T.; et al. An International Review of Laser Doppler Vibrometry: Making Light Work of Vibration Measurement. Opt. Lasers Eng. 2017, 99, 11–22. [Google Scholar] [CrossRef]
- Pan, B. Digital Image Correlation for Surface Deformation Measurement: Historical Developments, Recent Advances and Future Goals. Meas. Sci. Technol. 2018, 29, 082001. [Google Scholar] [CrossRef]
- Kempny, M. Digital Image Correlation—Method Development, Scope, Principle of Functioning, and Future Goals. J. Met. Mater. 2022, 74, 30–41. [Google Scholar] [CrossRef]
- Sirohi, J.; Lawson, M.S. Measurement of Helicopter Rotor Blade Deformation Using Digital Image Correlation. Opt. Eng. 2012, 51, 043603. [Google Scholar] [CrossRef]
- Rizo-Patron, S.; Sirohi, J. Operational Modal Analysis of a Helicopter Rotor Blade Using Digital Image Correlation. Exp. Mech. 2017, 57, 367–375. [Google Scholar] [CrossRef]
- Sousa, P.J.; Barros, F.; Tavares, P.J.; Moreira, P.M.G.P. Digital Image Correlation Displacement Measurement of a Rotating RC Helicopter Blade. Eng. Fail. Anal. 2018, 90, 371–379. [Google Scholar] [CrossRef]
- Stasicki, B.; Boden, F.; Ludwikowski, K. Fast Rotating Imaging System for In-Flight Measurements of Aircraft Propeller Deformation. In Proceedings of the Proceedings of the 30th International Congress on High-Speed Imaging and Photonics, Pretoria, South Africa, 2012. [Google Scholar] [CrossRef]
- Pazur, K.; Bogusz, P.; Krasoń, W. Utilizing High-Speed 3D DIC for Displacement and Strain Measurement of Rotating Components. Materials 2025, 18, 3974. [Google Scholar] [CrossRef] [PubMed]
- International Digital Image Correlation Society (iDICs). A Good Practices Guide for Digital Image Correlation, 2018. In Print format, Edition 1 ed. [CrossRef]
- Creality. CR-Scan Raptor Pro 3D Scanner: Technical Specifications. 2024. (accessed on 14 March 2026).
- Franzke, R.; Sebben, S.; Bark, T.; Willeson, E.; Broniewicz, A. Evaluation of the Multiple Reference Frame Approach for the Modelling of an Axial Cooling Fan. Energies 2019, 12, 2934. [Google Scholar] [CrossRef]
- Khedr, A.; Castellani, F. Critical Issues in the Moving Reference Frame CFD Simulation of Small Horizontal Axis Wind Turbines. Energy Convers. Manag. X 2024, 100551. [Google Scholar] [CrossRef]
- Menter, F.R. Two-Equation Eddy-Viscosity Turbulence Models for Engineering Applications Check metadata: this DOI is commonly associated with the 1994 AIAA Journal article; verify year, volume, issue, and pages before submission. AIAA J. 2012. [Google Scholar] [CrossRef] [PubMed]
- Nowicki, N. Measurement and Modeling of Multicopter UAS Rotor Blade Deflections in Hover; Technical report; National Aeronautics and Space Administration, 2017. [Google Scholar]
- National Instruments. NI-9237 Getting Started; Module wiring, remote sense and shunt calibration. Verify publication year and official document source before submission. 2025.
- Joint Committee for Guides in Metrology (JCGM). Evaluation of Measurement Data—Guide to the Expression of Uncertainty in Measurement (GUM); Number 100 in JCGM; Joint Committee for Guides in Metrology, 2008. [Google Scholar]
- Blenkinsopp, R.; et al. A Method for Calibrating a Digital Image Correlation System for Full-Field Strain Measurements during Large Deformations. Appl. Sci. Complete author list should be verified before submission.. 2019, 9, 2828. [Google Scholar] [CrossRef]
Figure 1.
Photograph of the experimental setup used for full-rotation measurements of the propeller deformation. The system consists of a BLDC motor, a trigger contrast sensor for phase synchronization, two Phantom T4040 high-speed cameras, and two LED illumination units.
Figure 1.
Photograph of the experimental setup used for full-rotation measurements of the propeller deformation. The system consists of a BLDC motor, a trigger contrast sensor for phase synchronization, two Phantom T4040 high-speed cameras, and two LED illumination units.
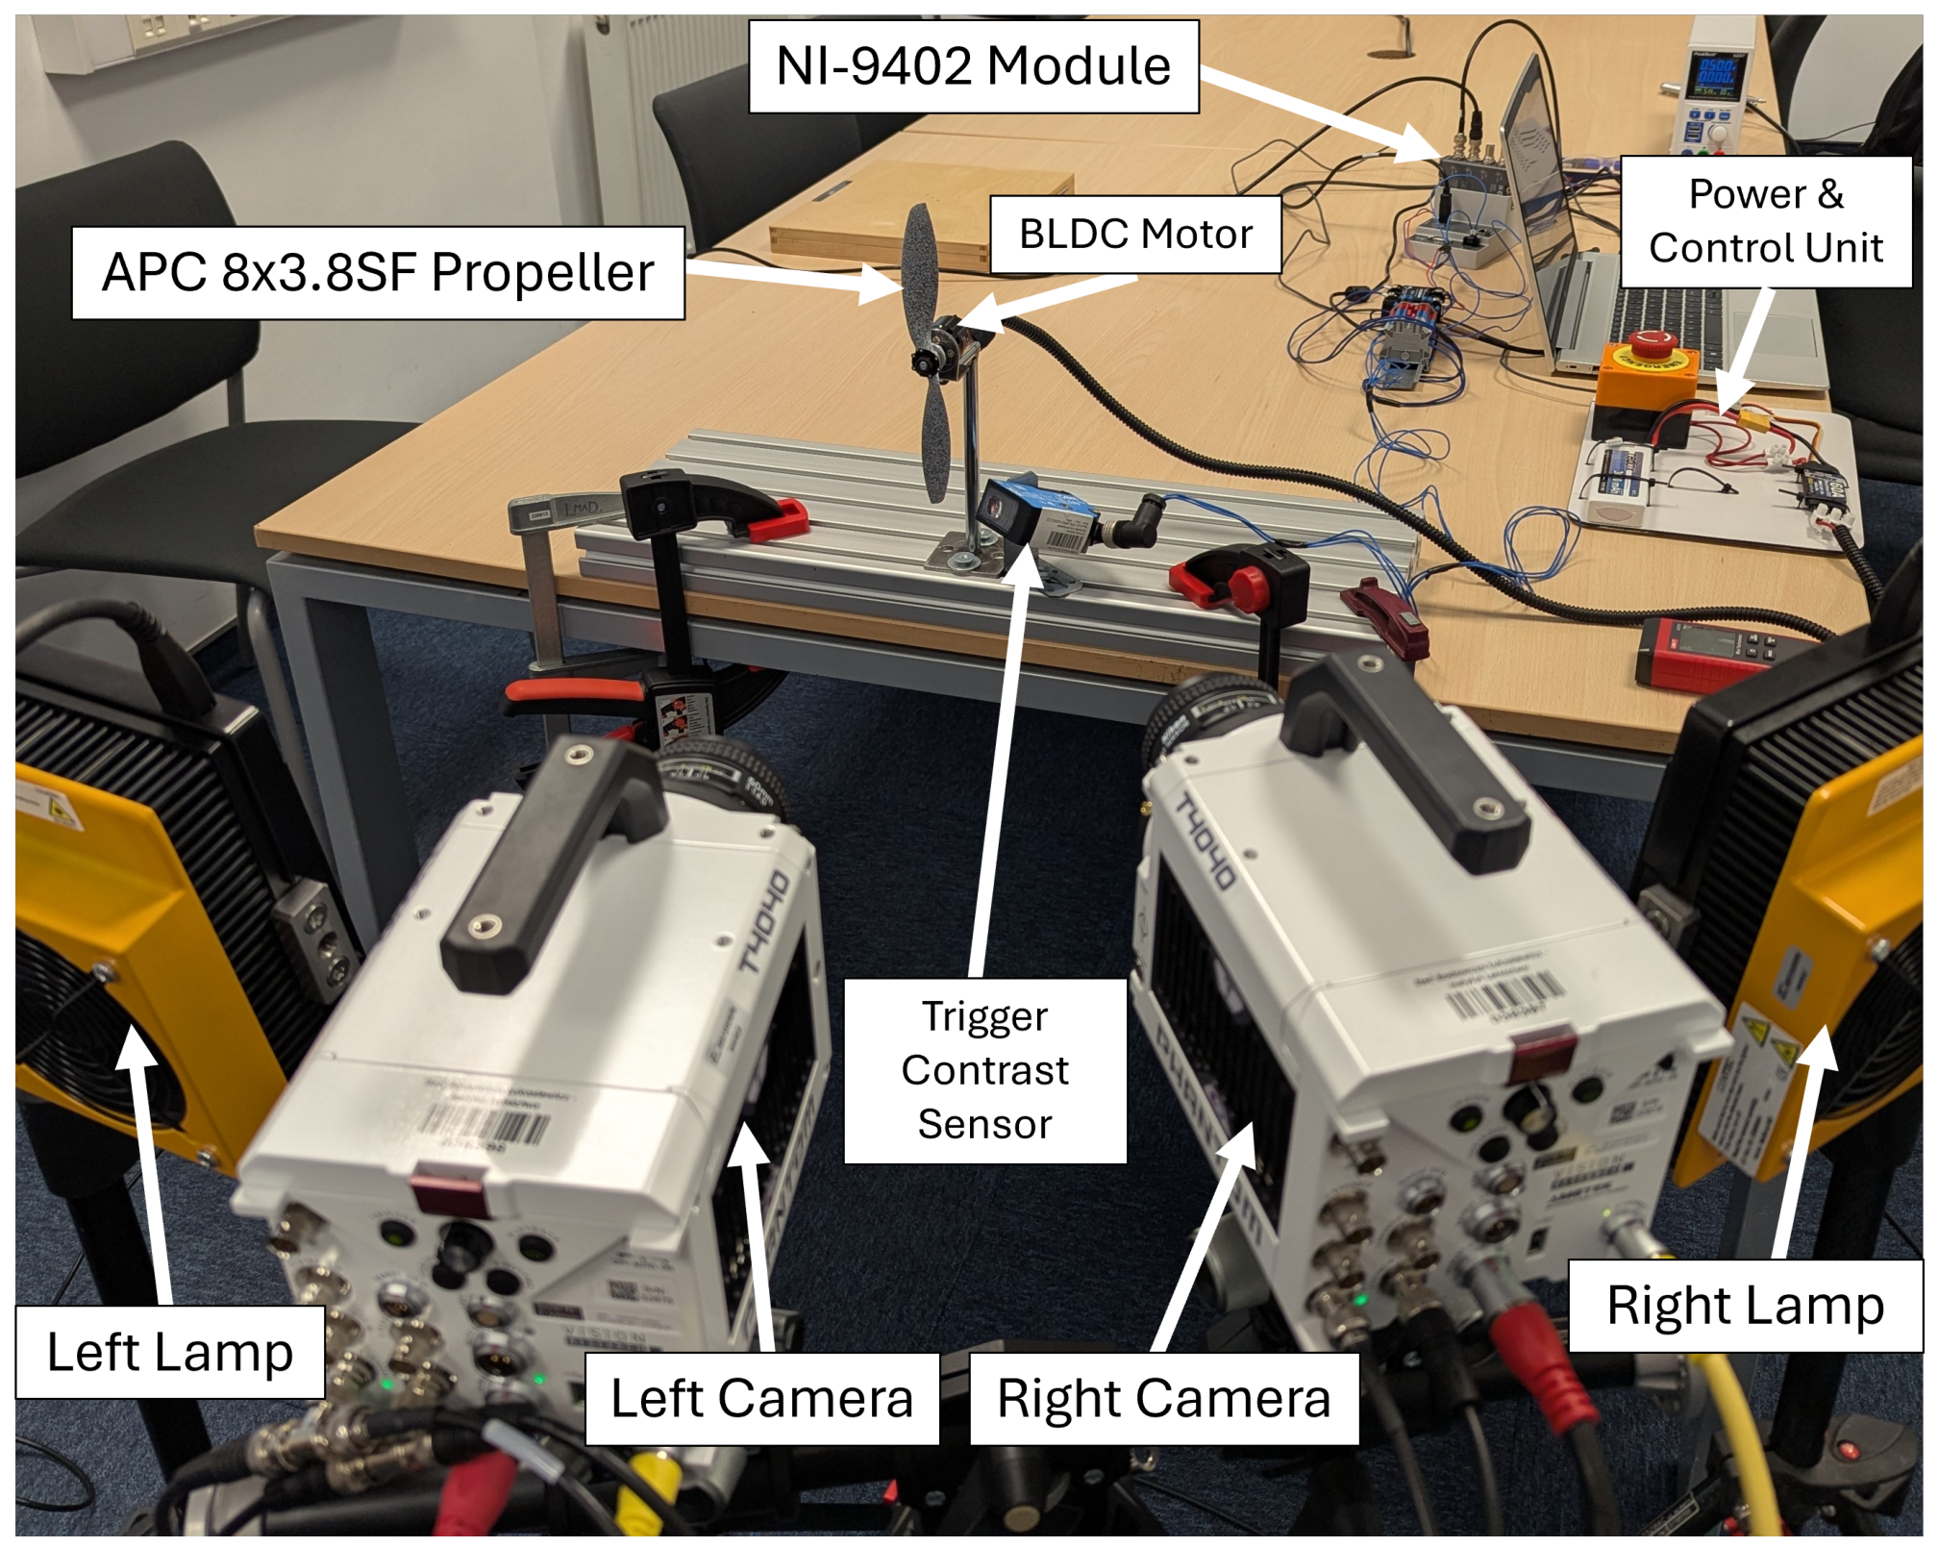
Figure 2.
Schematic diagram of the measurement system. The cameras are connected to the PC via an Ethernet switch, while the propeller rotation and camera triggering are controlled using a NI cRIO-9063 controller with an NI-9402 digital input/output module and a contrast sensor.
Figure 2.
Schematic diagram of the measurement system. The cameras are connected to the PC via an Ethernet switch, while the propeller rotation and camera triggering are controlled using a NI cRIO-9063 controller with an NI-9402 digital input/output module and a contrast sensor.
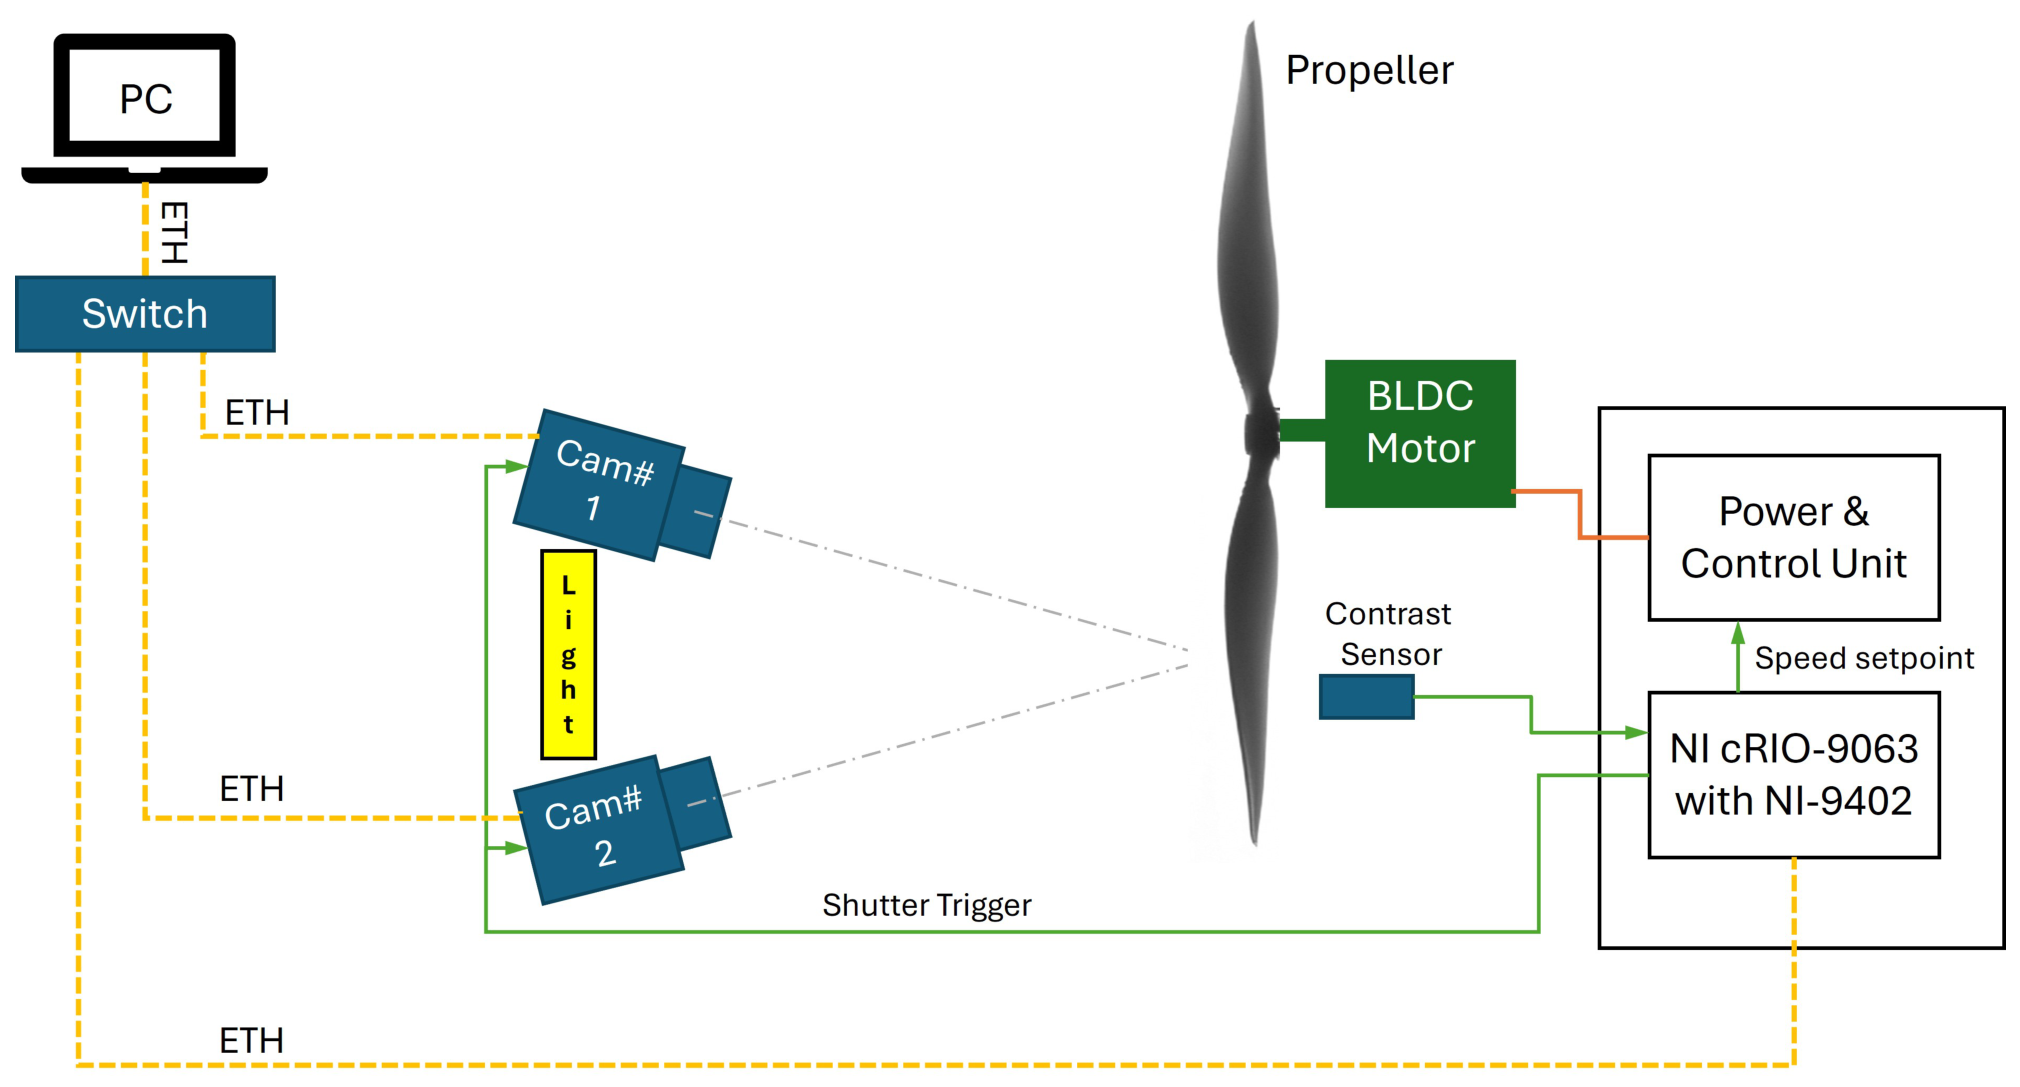
Figure 3.
Photograph of the APC 8×3.8SF propeller specimens prepared for the measurements. A stochastic speckle pattern was applied to the blade surfaces to enable Digital Image Correlation (DIC) analysis.
Figure 3.
Photograph of the APC 8×3.8SF propeller specimens prepared for the measurements. A stochastic speckle pattern was applied to the blade surfaces to enable Digital Image Correlation (DIC) analysis.
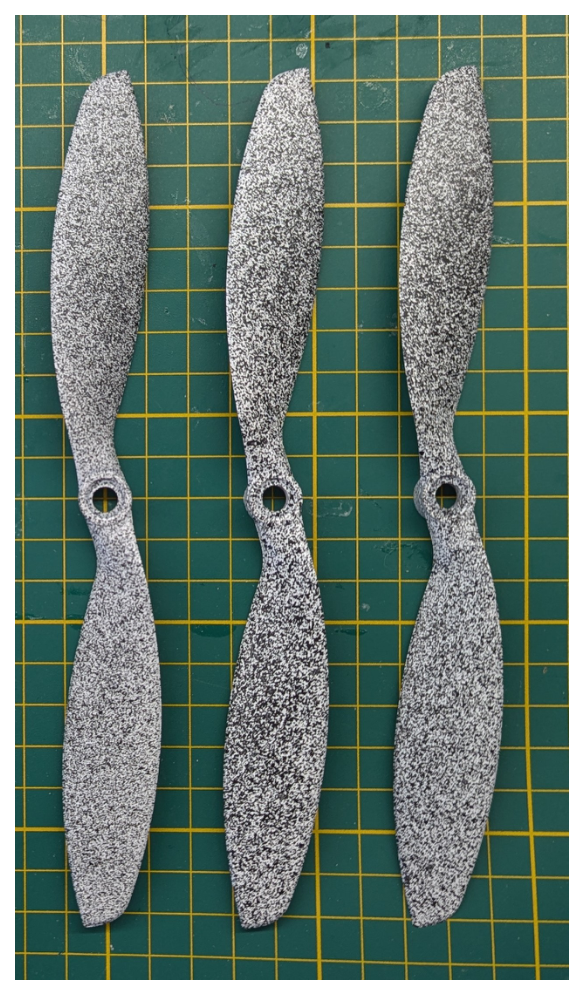
Figure 4.
Setup used for 3D scanning of the 8×3.8SF propeller. The scanning process was performed using a Creality CR-Scan Raptor Pro 3D scanner.
Figure 4.
Setup used for 3D scanning of the 8×3.8SF propeller. The scanning process was performed using a Creality CR-Scan Raptor Pro 3D scanner.
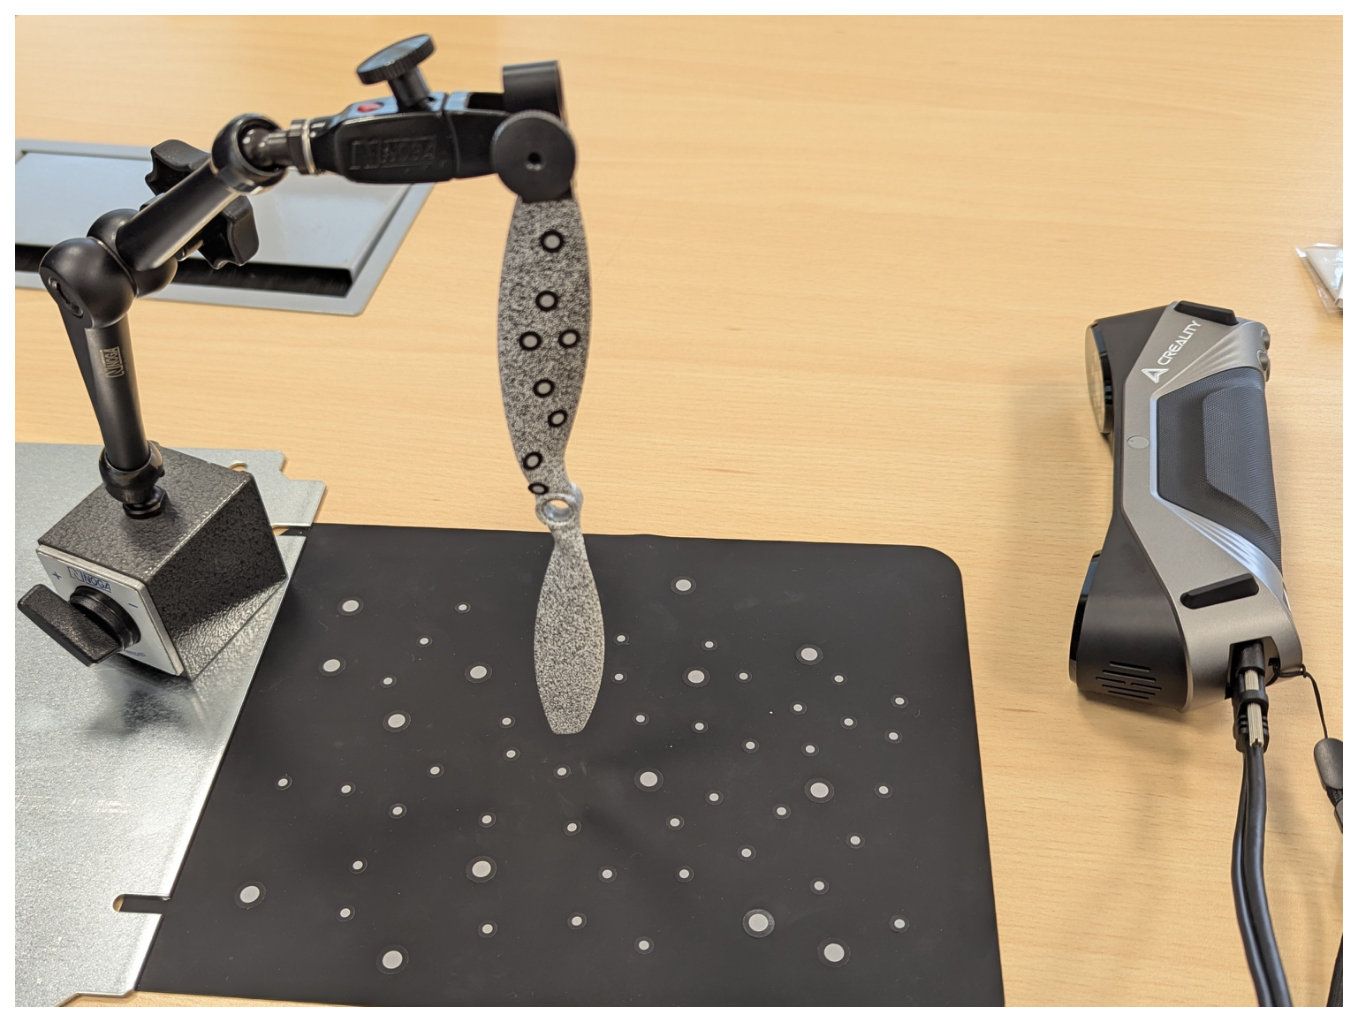
Figure 7.
Pressure distribution on the suction side of the APC 8×3.8SF propeller obtained from CFD analysis for the rotational speed of 6940 rpm.
Figure 7.
Pressure distribution on the suction side of the APC 8×3.8SF propeller obtained from CFD analysis for the rotational speed of 6940 rpm.
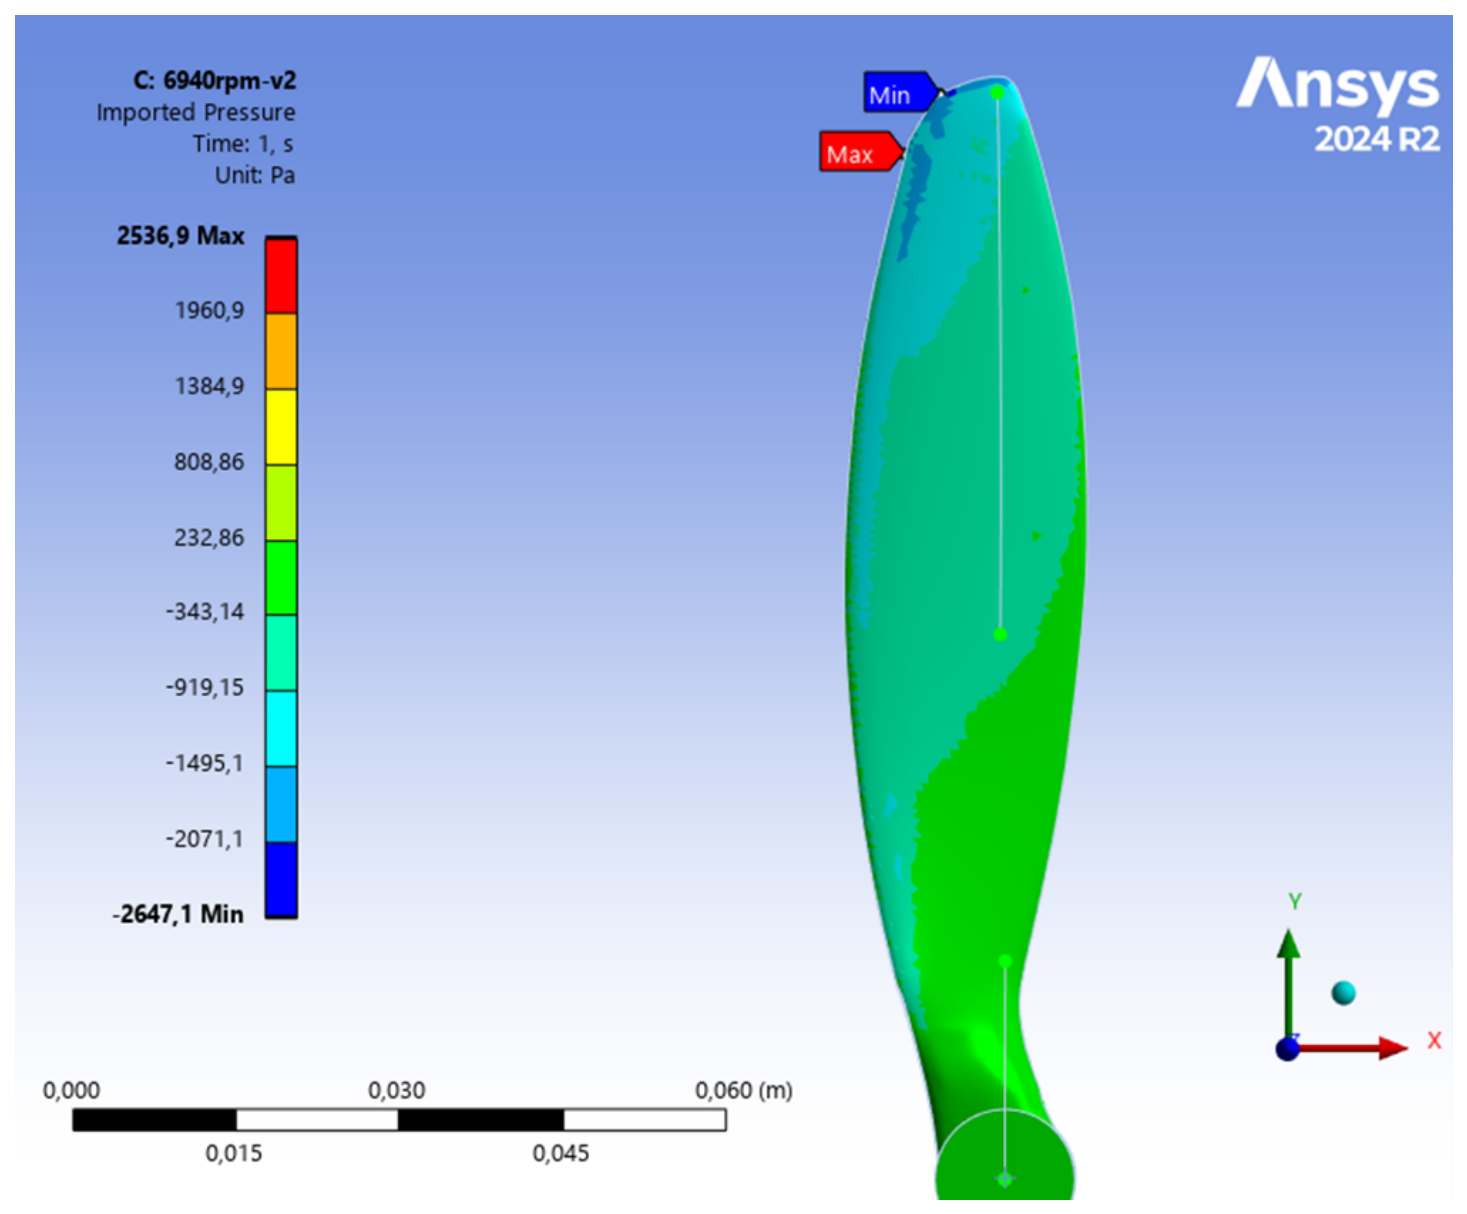
Figure 9.
FEM results: thrust as a function of rotational velocity.
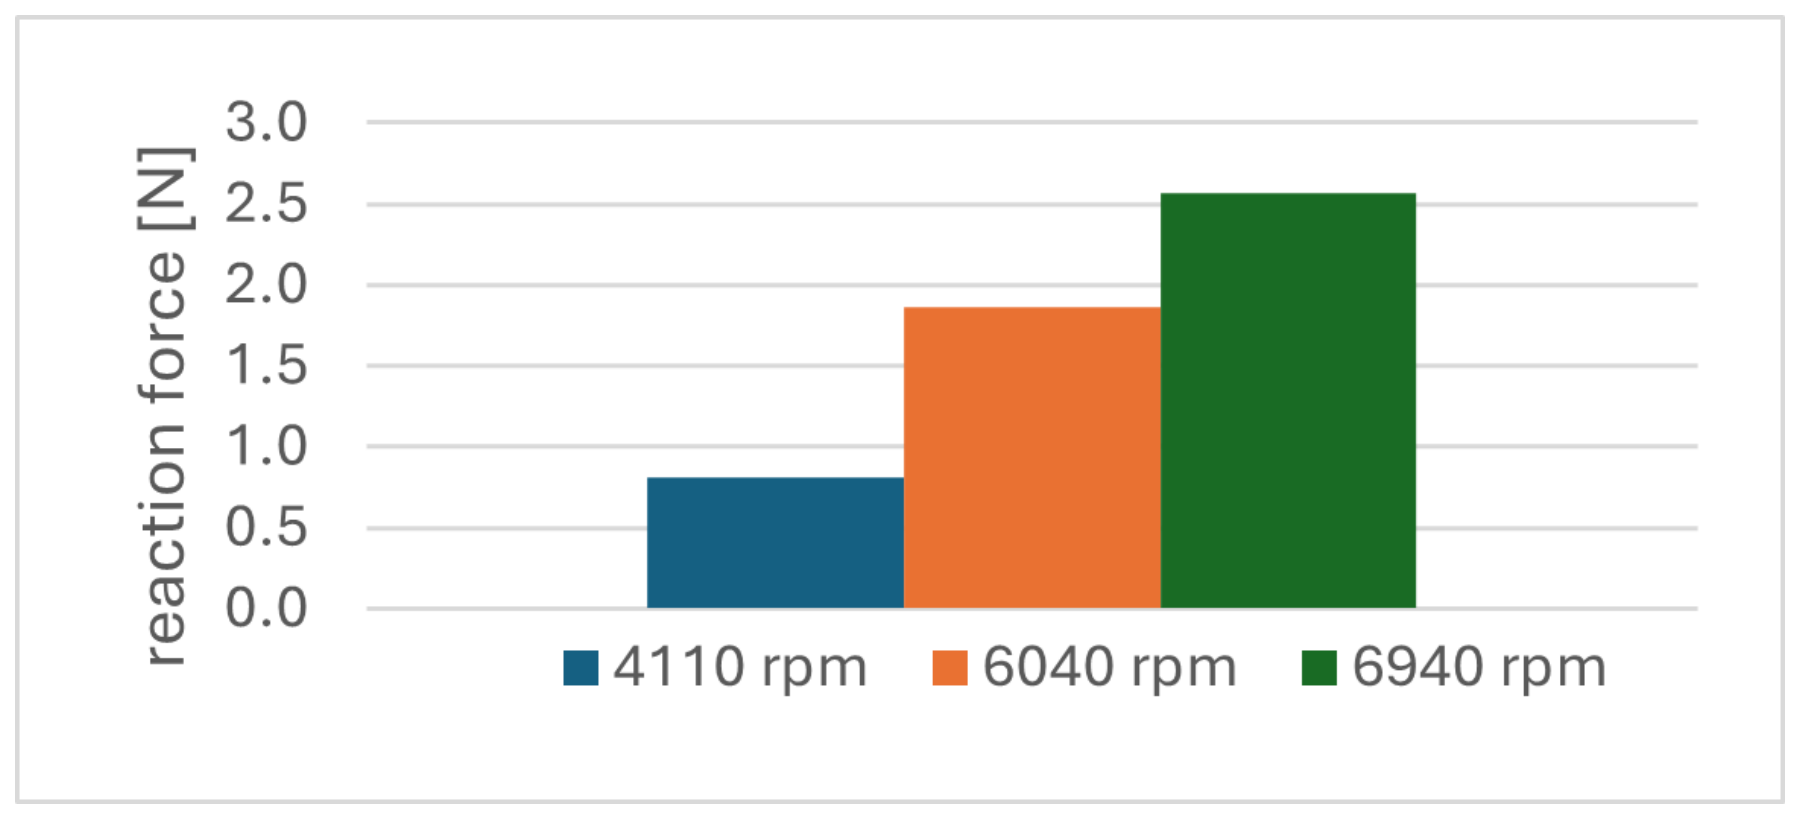
Figure 10.
Side view of the experimental setup used for 3D Digital Image Correlation measurements. Two Phantom T4040 high-speed cameras were arranged in a stereo configuration and synchronized with the rotation of the propeller to capture deformation.
Figure 10.
Side view of the experimental setup used for 3D Digital Image Correlation measurements. Two Phantom T4040 high-speed cameras were arranged in a stereo configuration and synchronized with the rotation of the propeller to capture deformation.
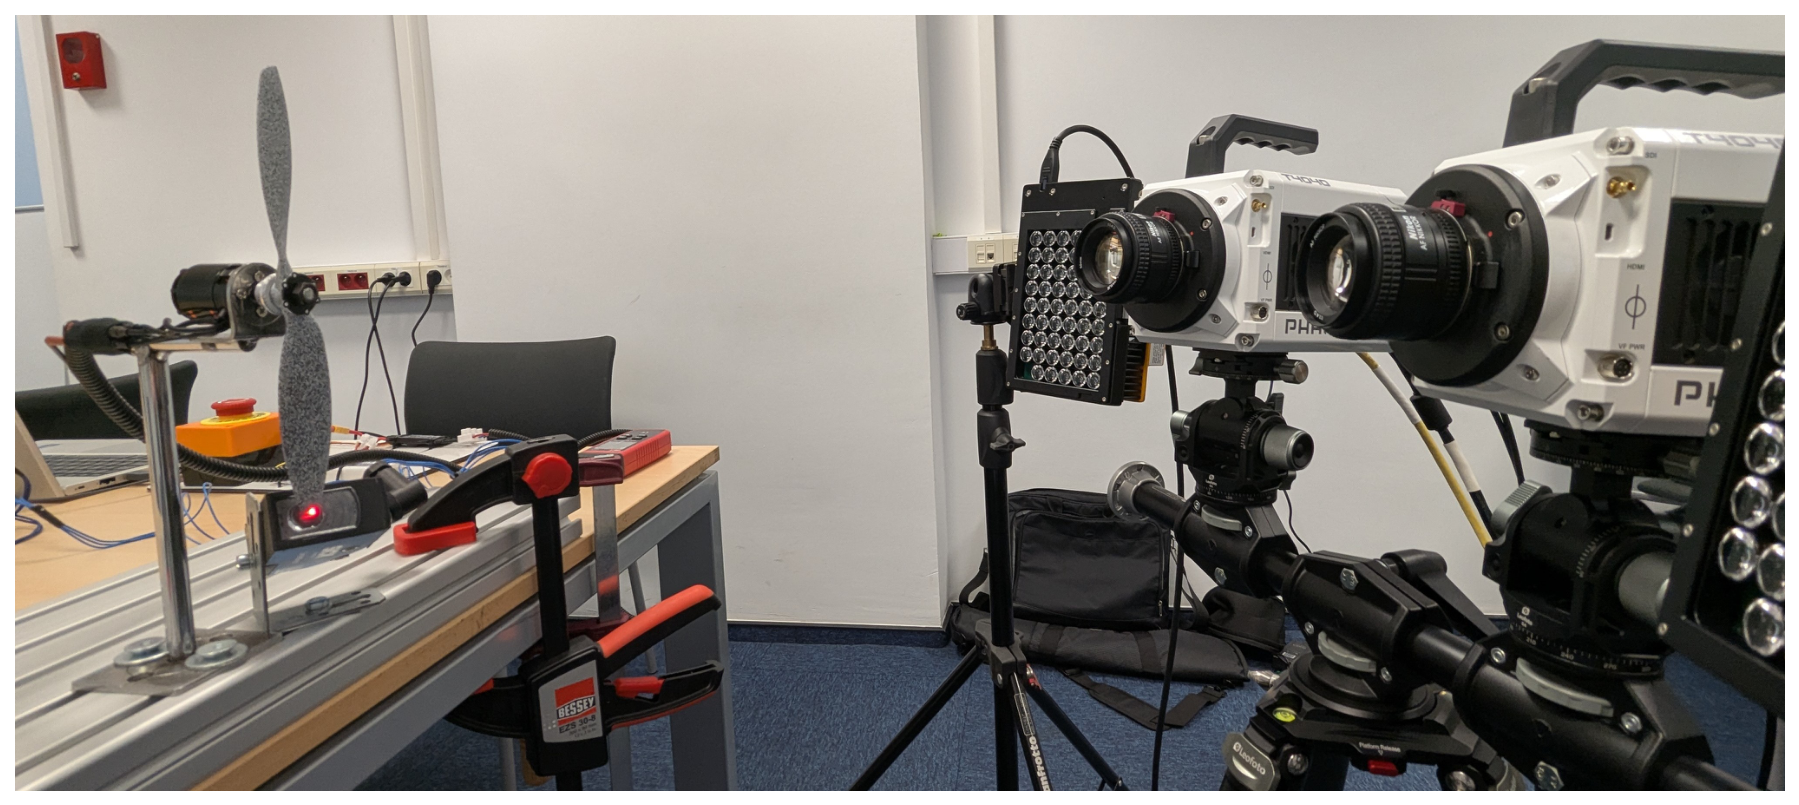
Figure 12.
Left-camera view. Location of the characteristic comparison points (P1, P2, and P3) on the APC 8×3.8SF propeller blade used for quantitative comparison between FEM and 3D DIC results.
Figure 12.
Left-camera view. Location of the characteristic comparison points (P1, P2, and P3) on the APC 8×3.8SF propeller blade used for quantitative comparison between FEM and 3D DIC results.
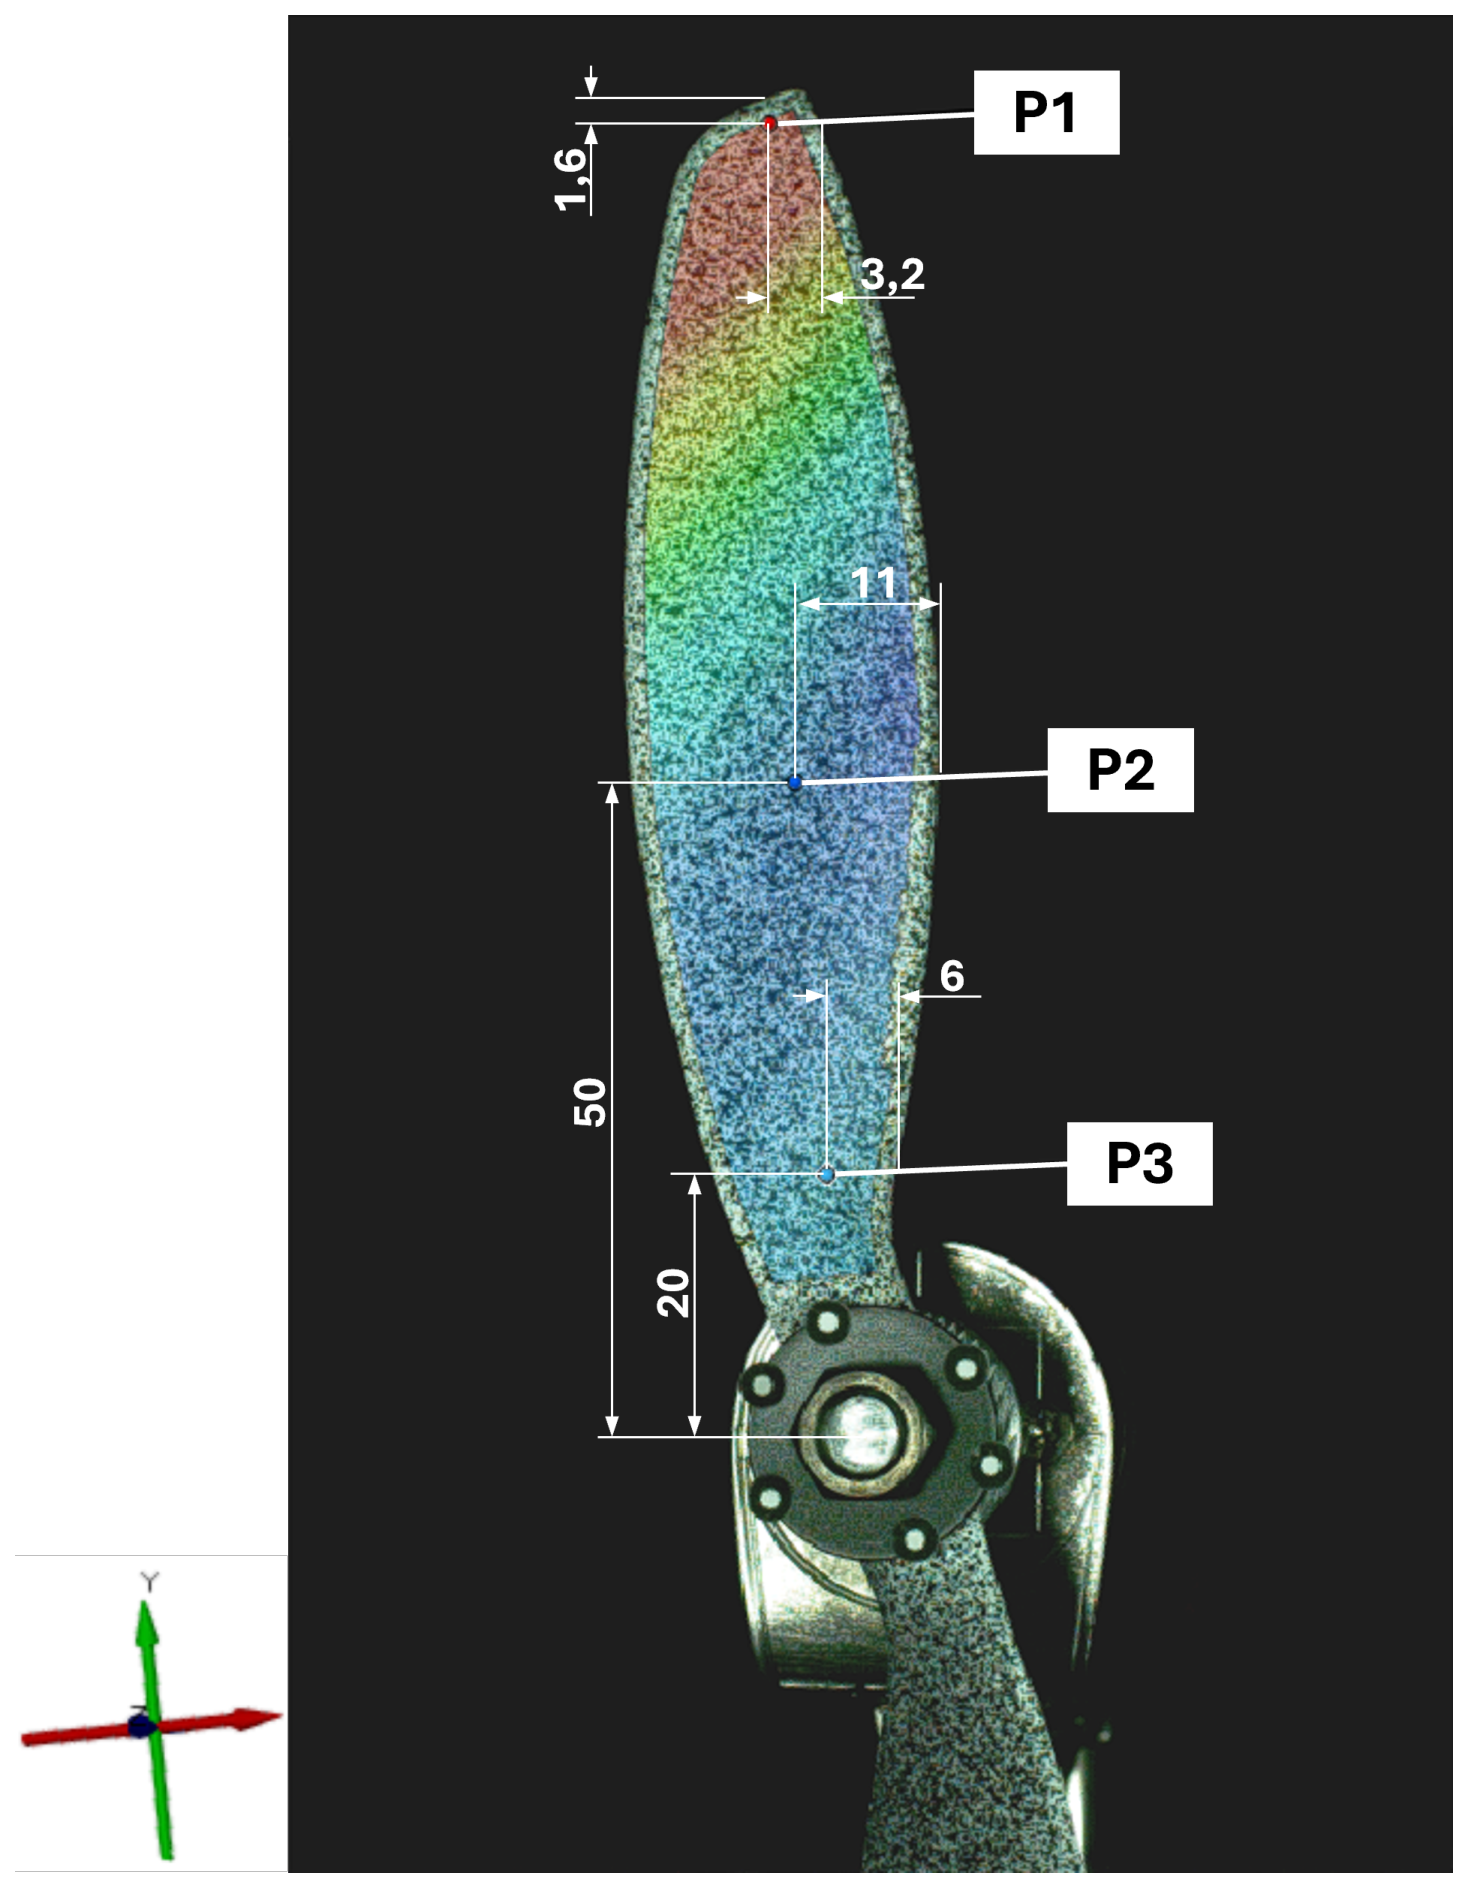
Figure 13.
Absolute displacement map of the propeller blade obtained from (a) FEM simulations and (b) 3D DIC measurements for the rotational speed of 6945 rpm.
Figure 13.
Absolute displacement map of the propeller blade obtained from (a) FEM simulations and (b) 3D DIC measurements for the rotational speed of 6945 rpm.
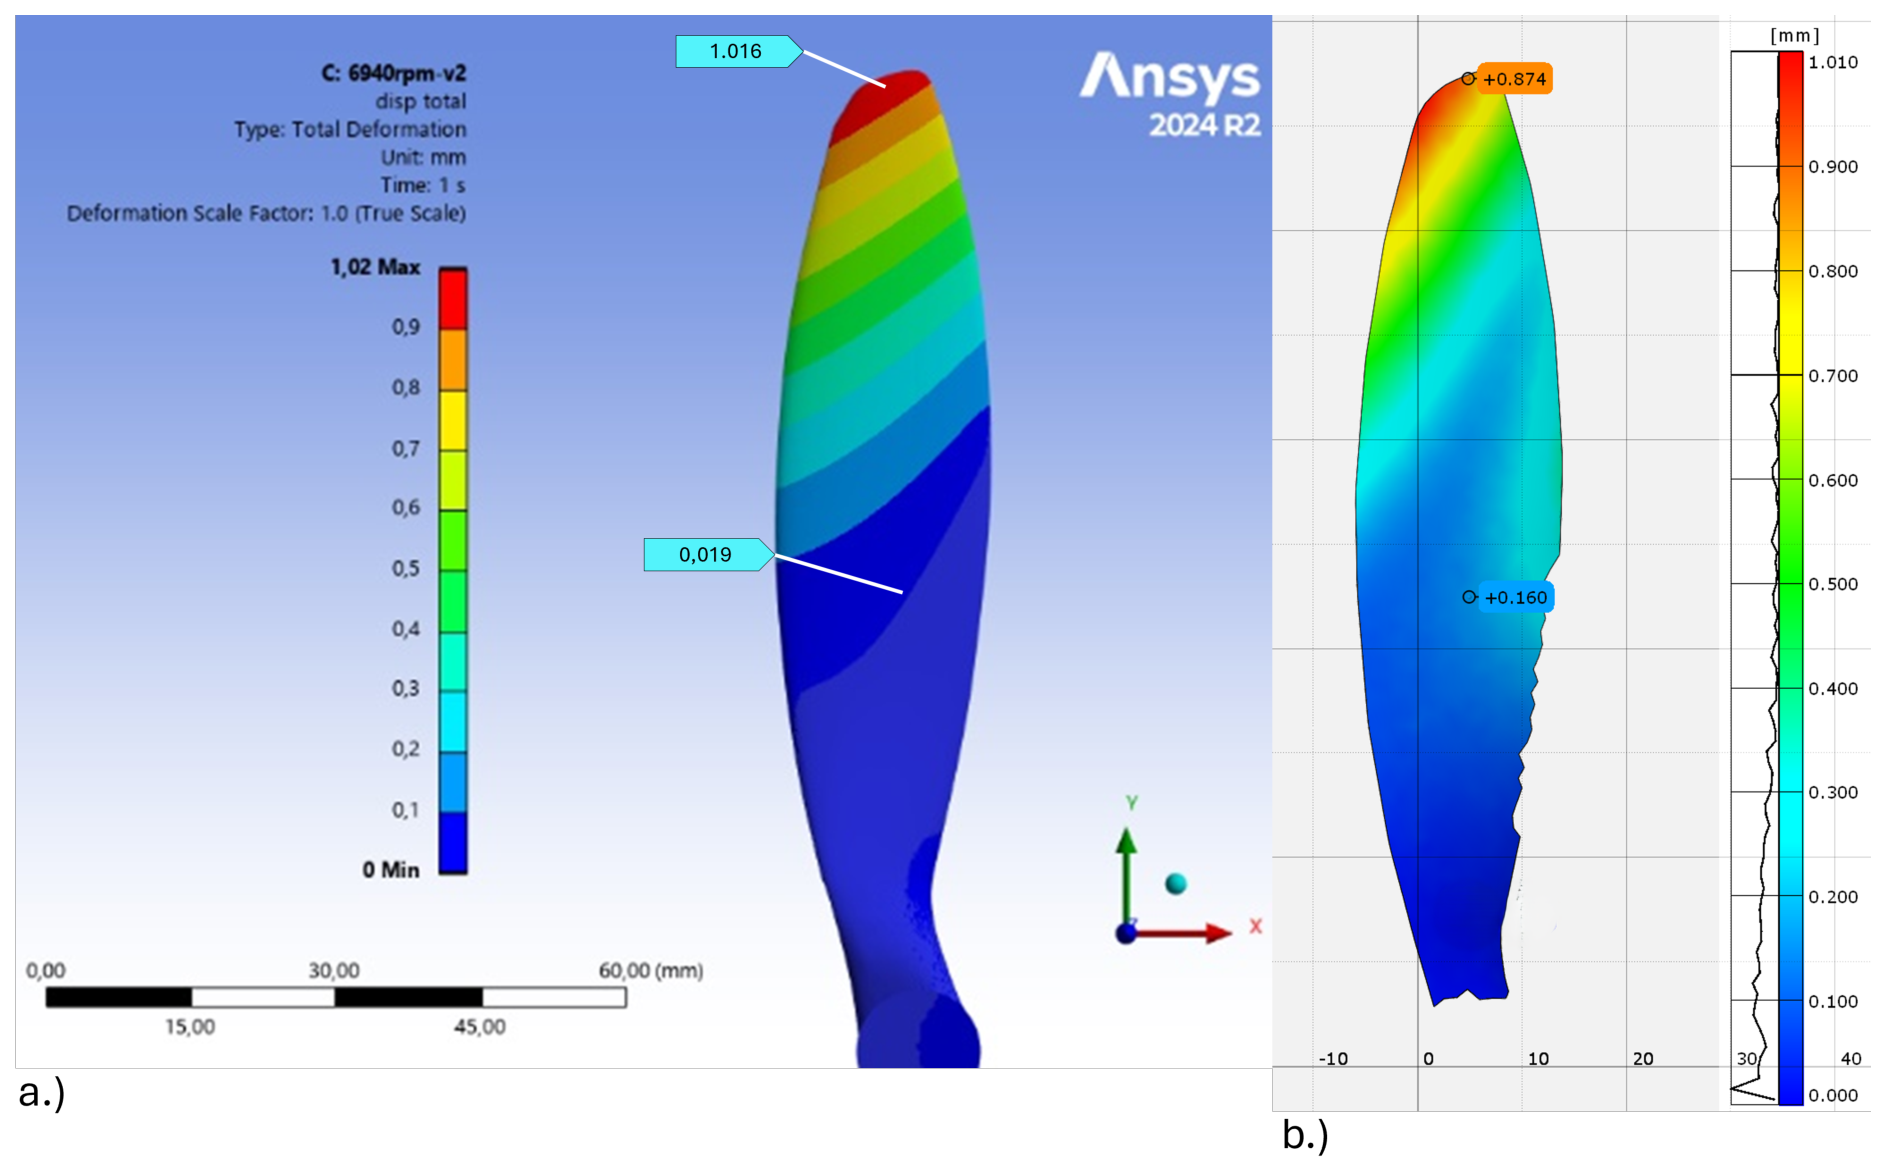
Figure 14.
Displacement in the z direction obtained from (a) FEM simulations and (b) 3D DIC measurements for the rotational speed of 6945 rpm.
Figure 14.
Displacement in the z direction obtained from (a) FEM simulations and (b) 3D DIC measurements for the rotational speed of 6945 rpm.
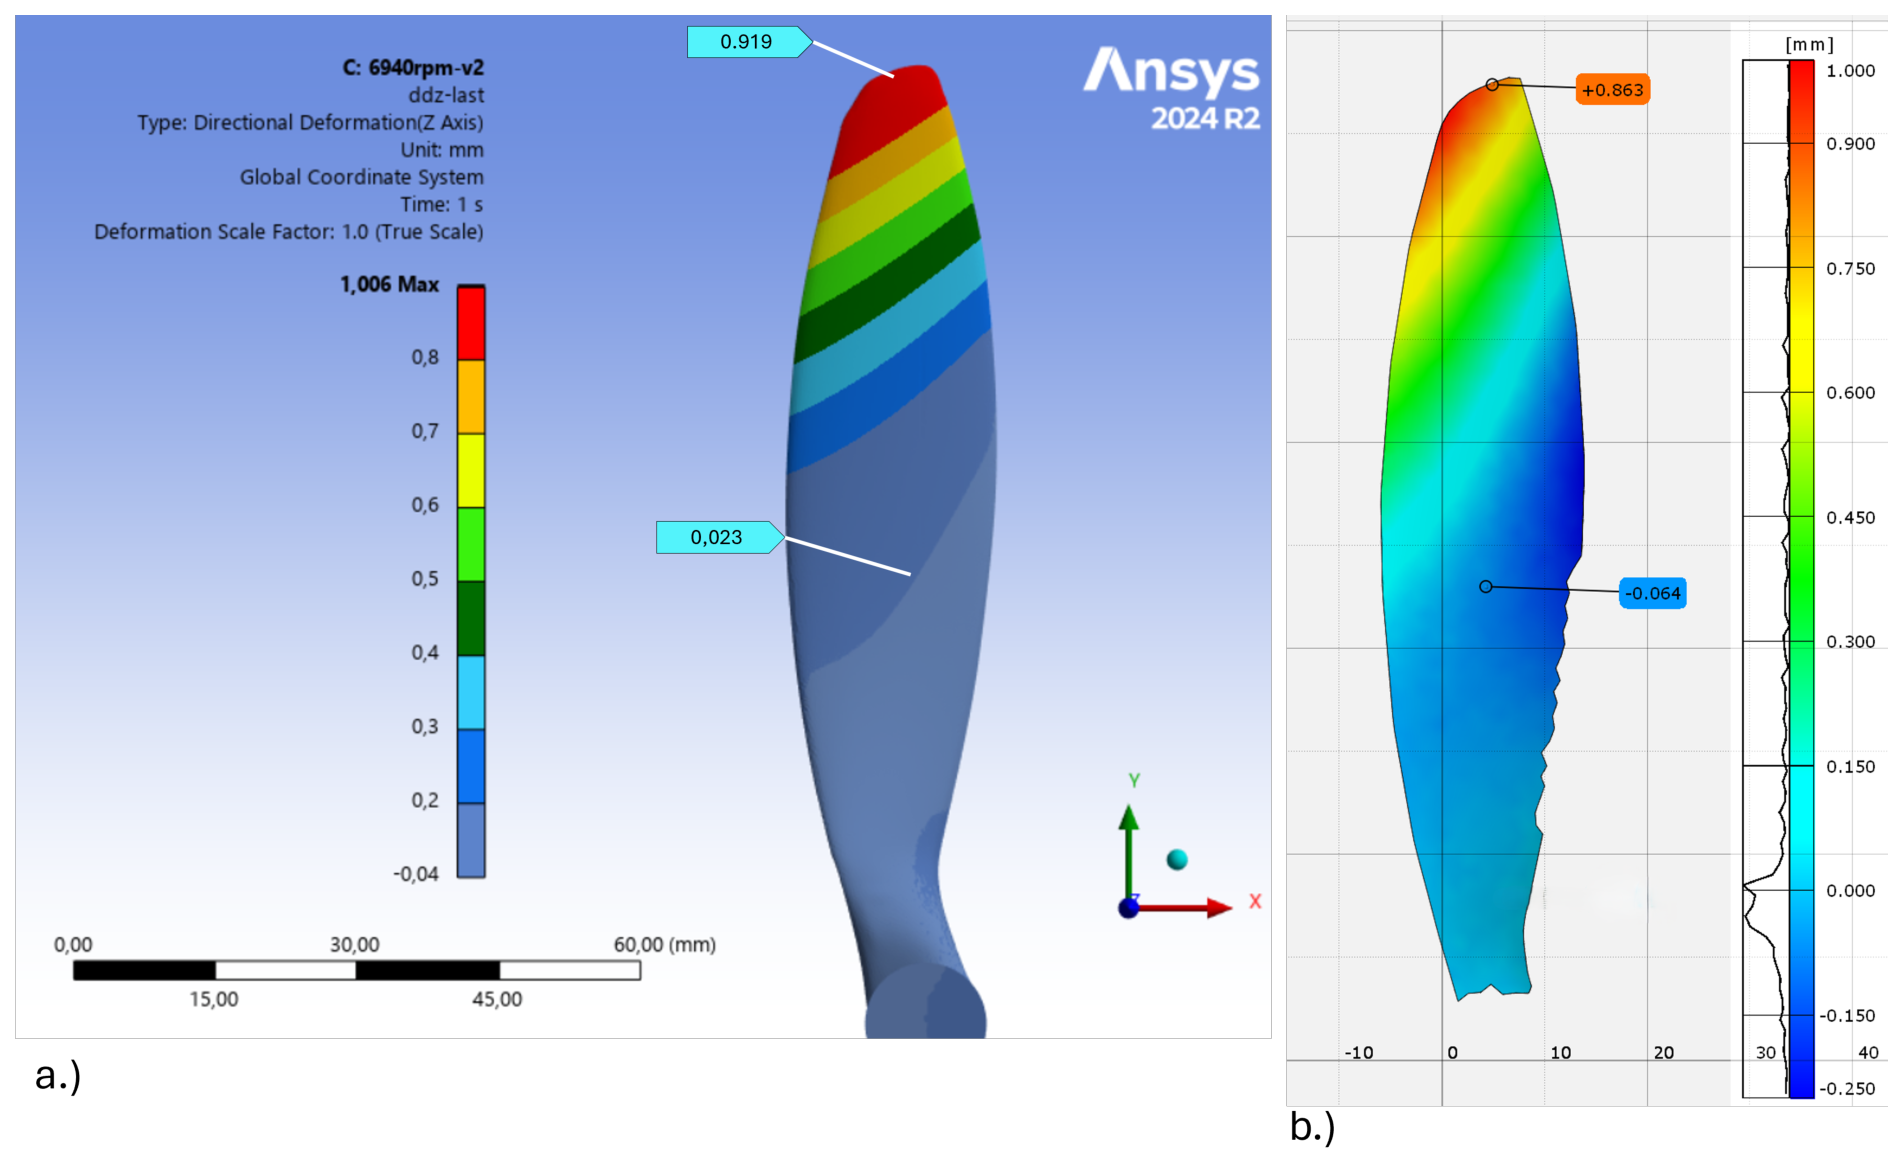
Figure 15.
y-direction strain distribution obtained from (a) FEM simulations and (b) 3D DIC measurements for the rotational speed of 6945 rpm.
Figure 15.
y-direction strain distribution obtained from (a) FEM simulations and (b) 3D DIC measurements for the rotational speed of 6945 rpm.
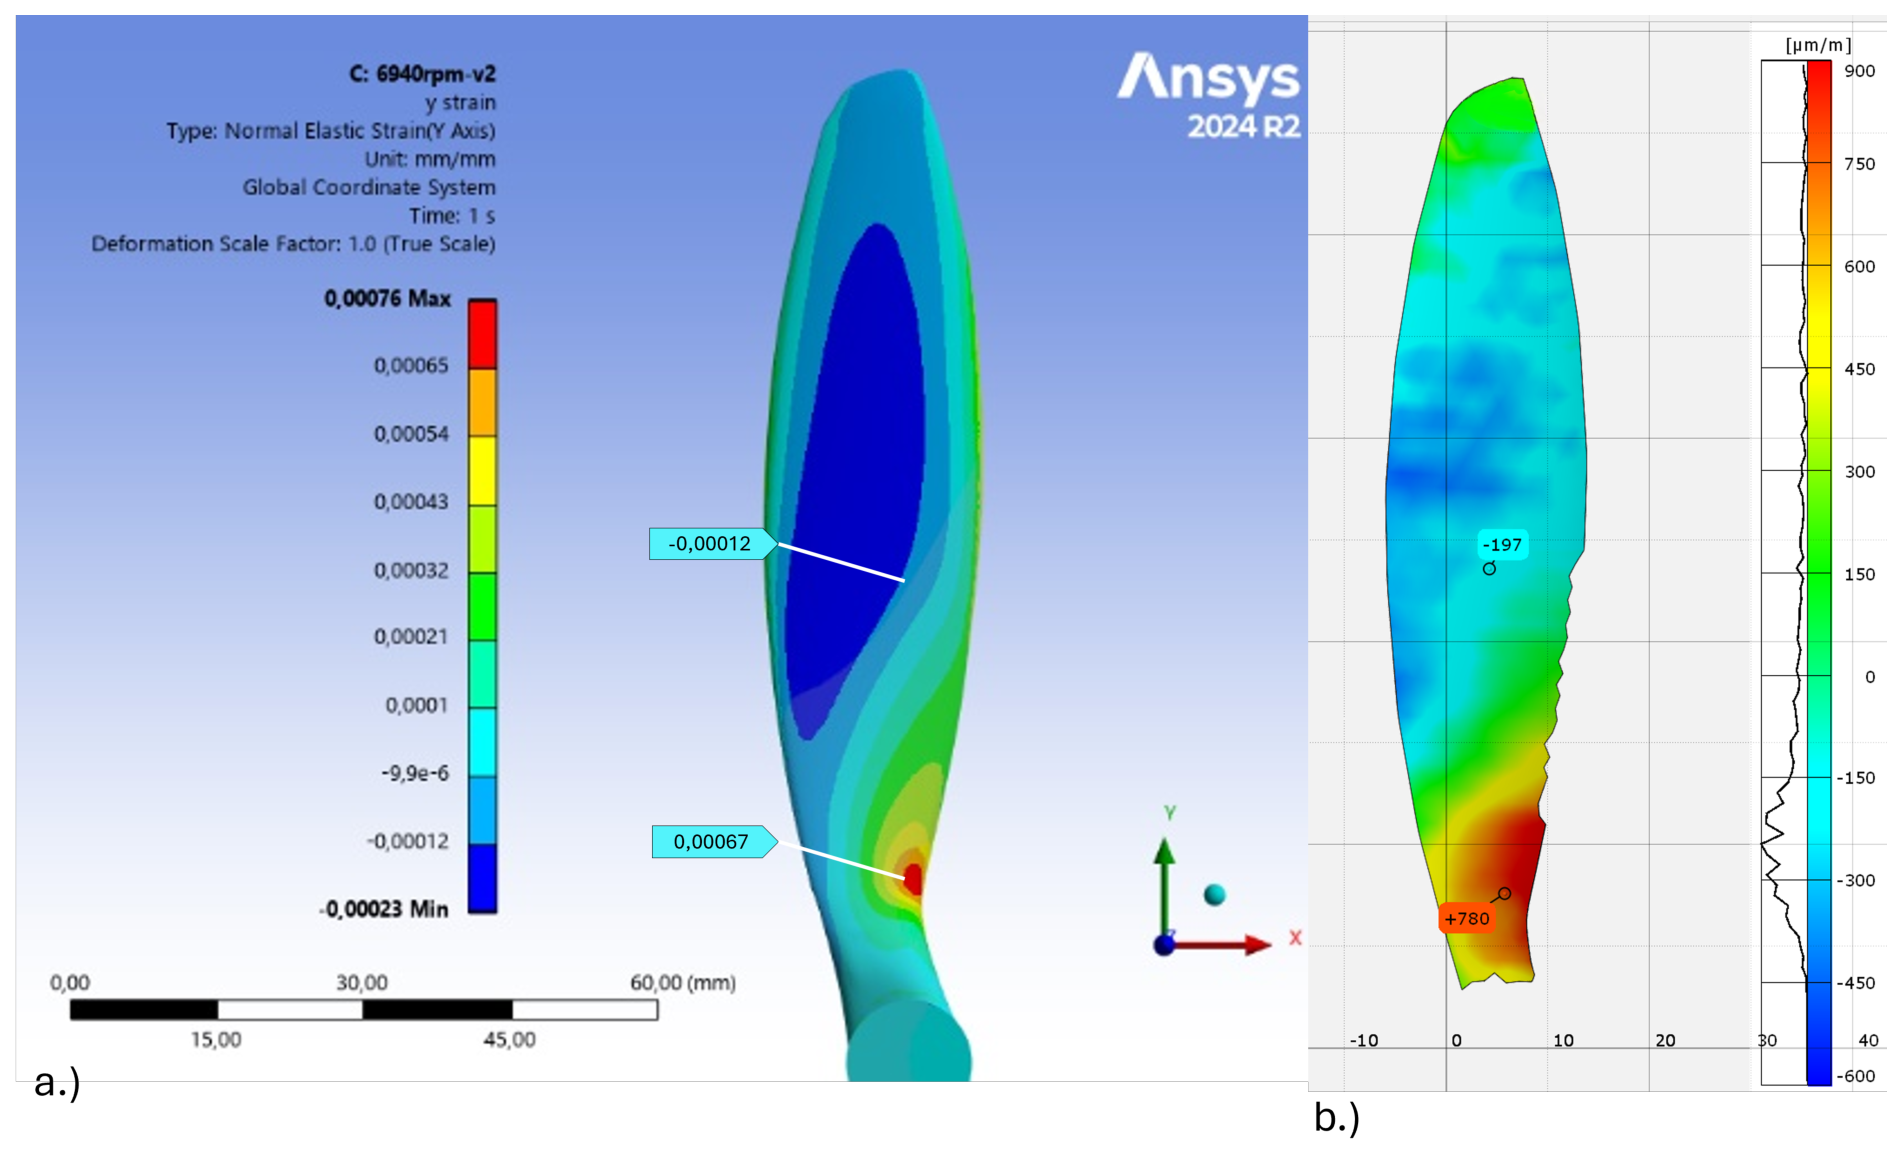
Figure 16.
x-direction strain distribution obtained from (a) FEM simulations and (b) 3D DIC measurements for the rotational speed of 6945 rpm.
Figure 16.
x-direction strain distribution obtained from (a) FEM simulations and (b) 3D DIC measurements for the rotational speed of 6945 rpm.
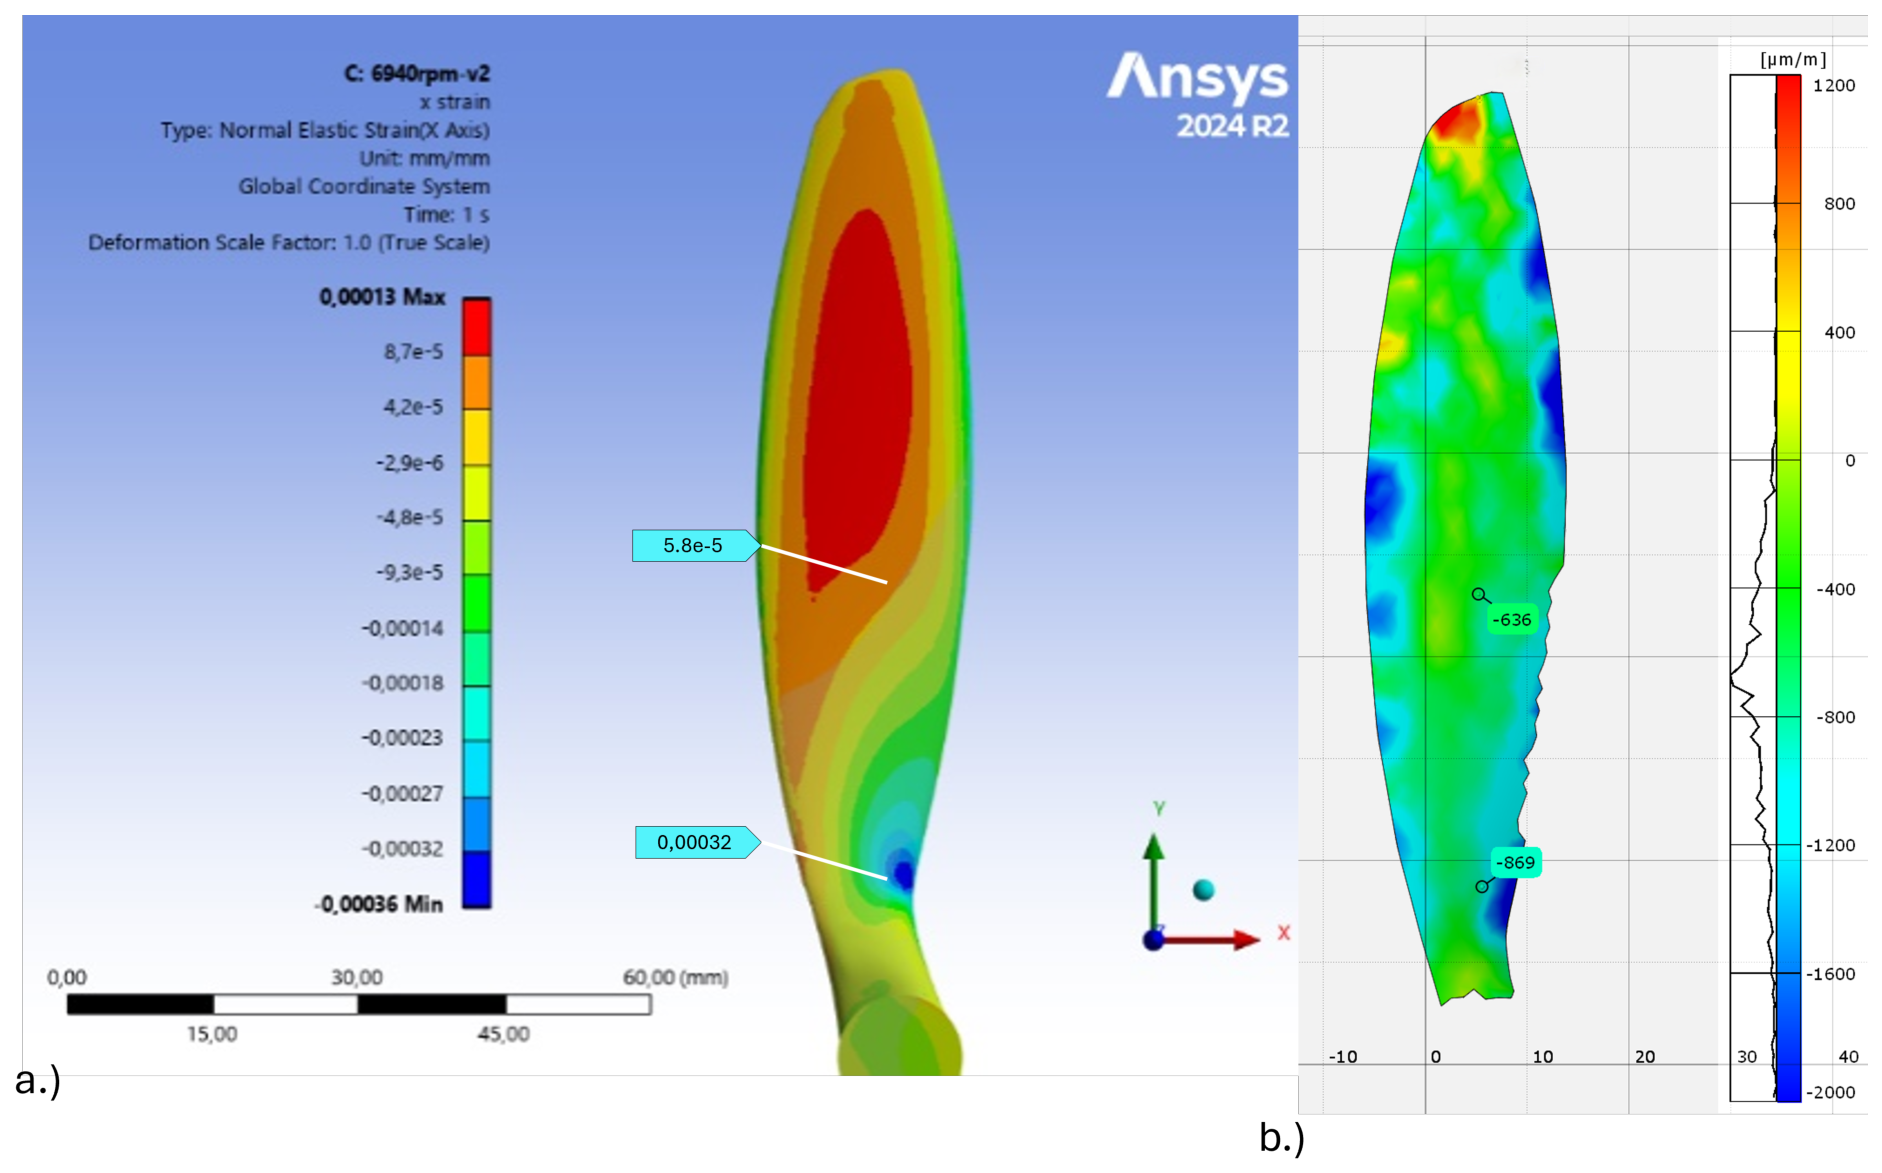
Figure 17.
Comparison of the deformation distribution along the leading-edge curve obtained from FEM and 3D DIC for the unloaded state and selected rotational speeds. The analysis was performed along a curve of length 90.6 mm, offset by 2 mm from the blade edge to ensure reliable DIC data extraction near the boundary.
Figure 17.
Comparison of the deformation distribution along the leading-edge curve obtained from FEM and 3D DIC for the unloaded state and selected rotational speeds. The analysis was performed along a curve of length 90.6 mm, offset by 2 mm from the blade edge to ensure reliable DIC data extraction near the boundary.
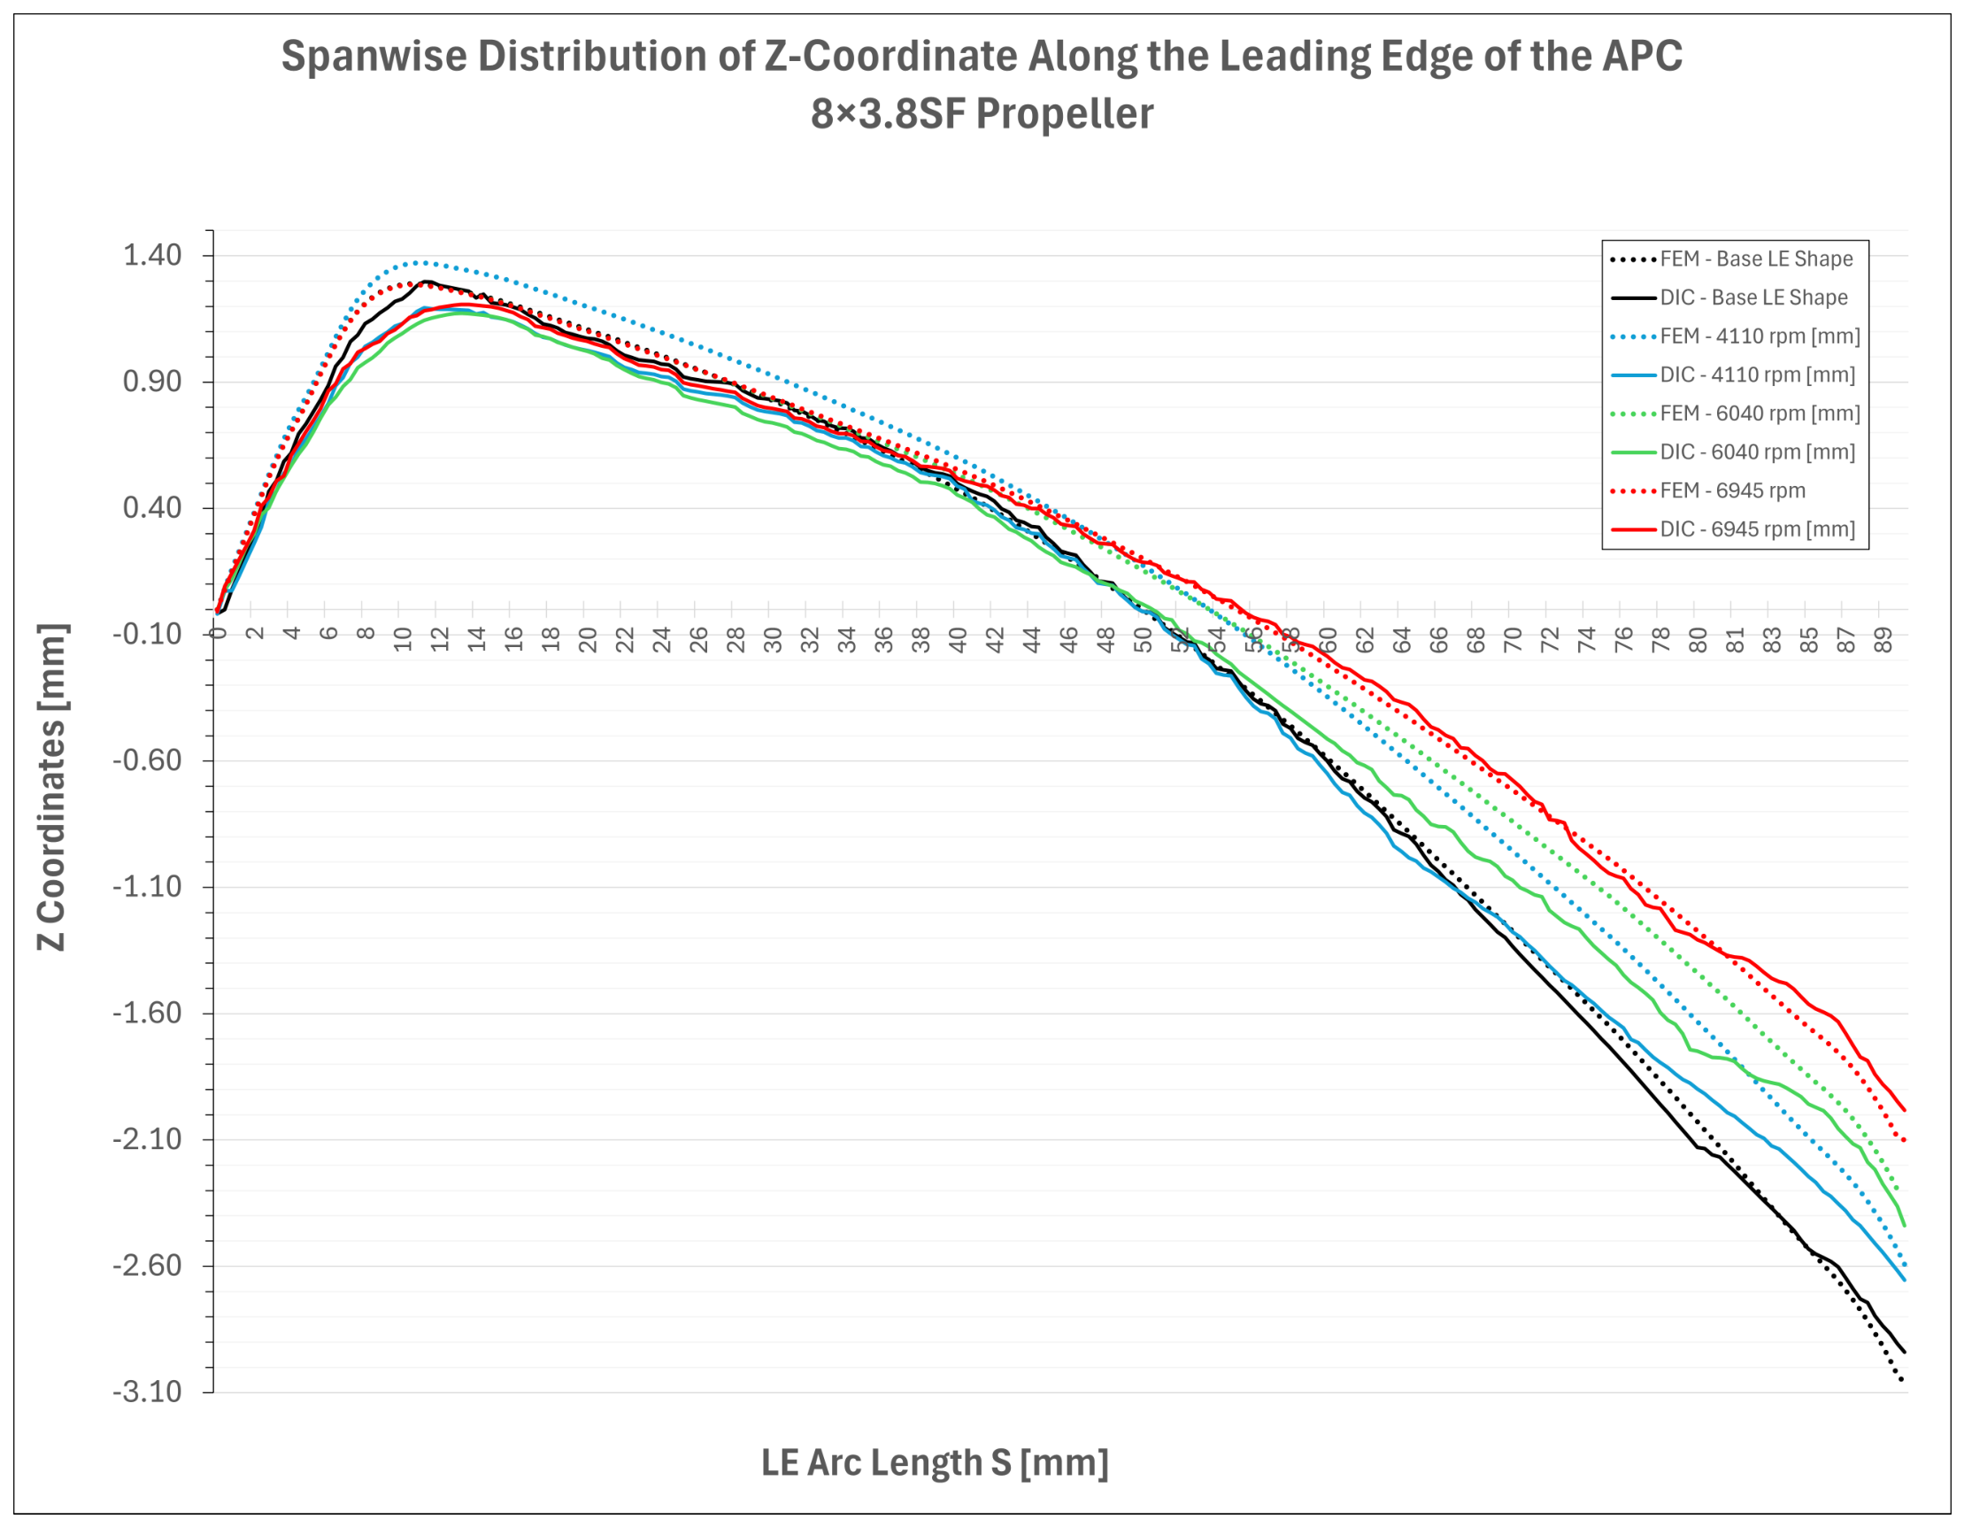
Figure 18.
Screenshot from GOM Correlate 2018 software showing the analysis of the propeller spin-up test (measurement with shutter synchronization) and the displacement response of the blade tip.
Figure 18.
Screenshot from GOM Correlate 2018 software showing the analysis of the propeller spin-up test (measurement with shutter synchronization) and the displacement response of the blade tip.
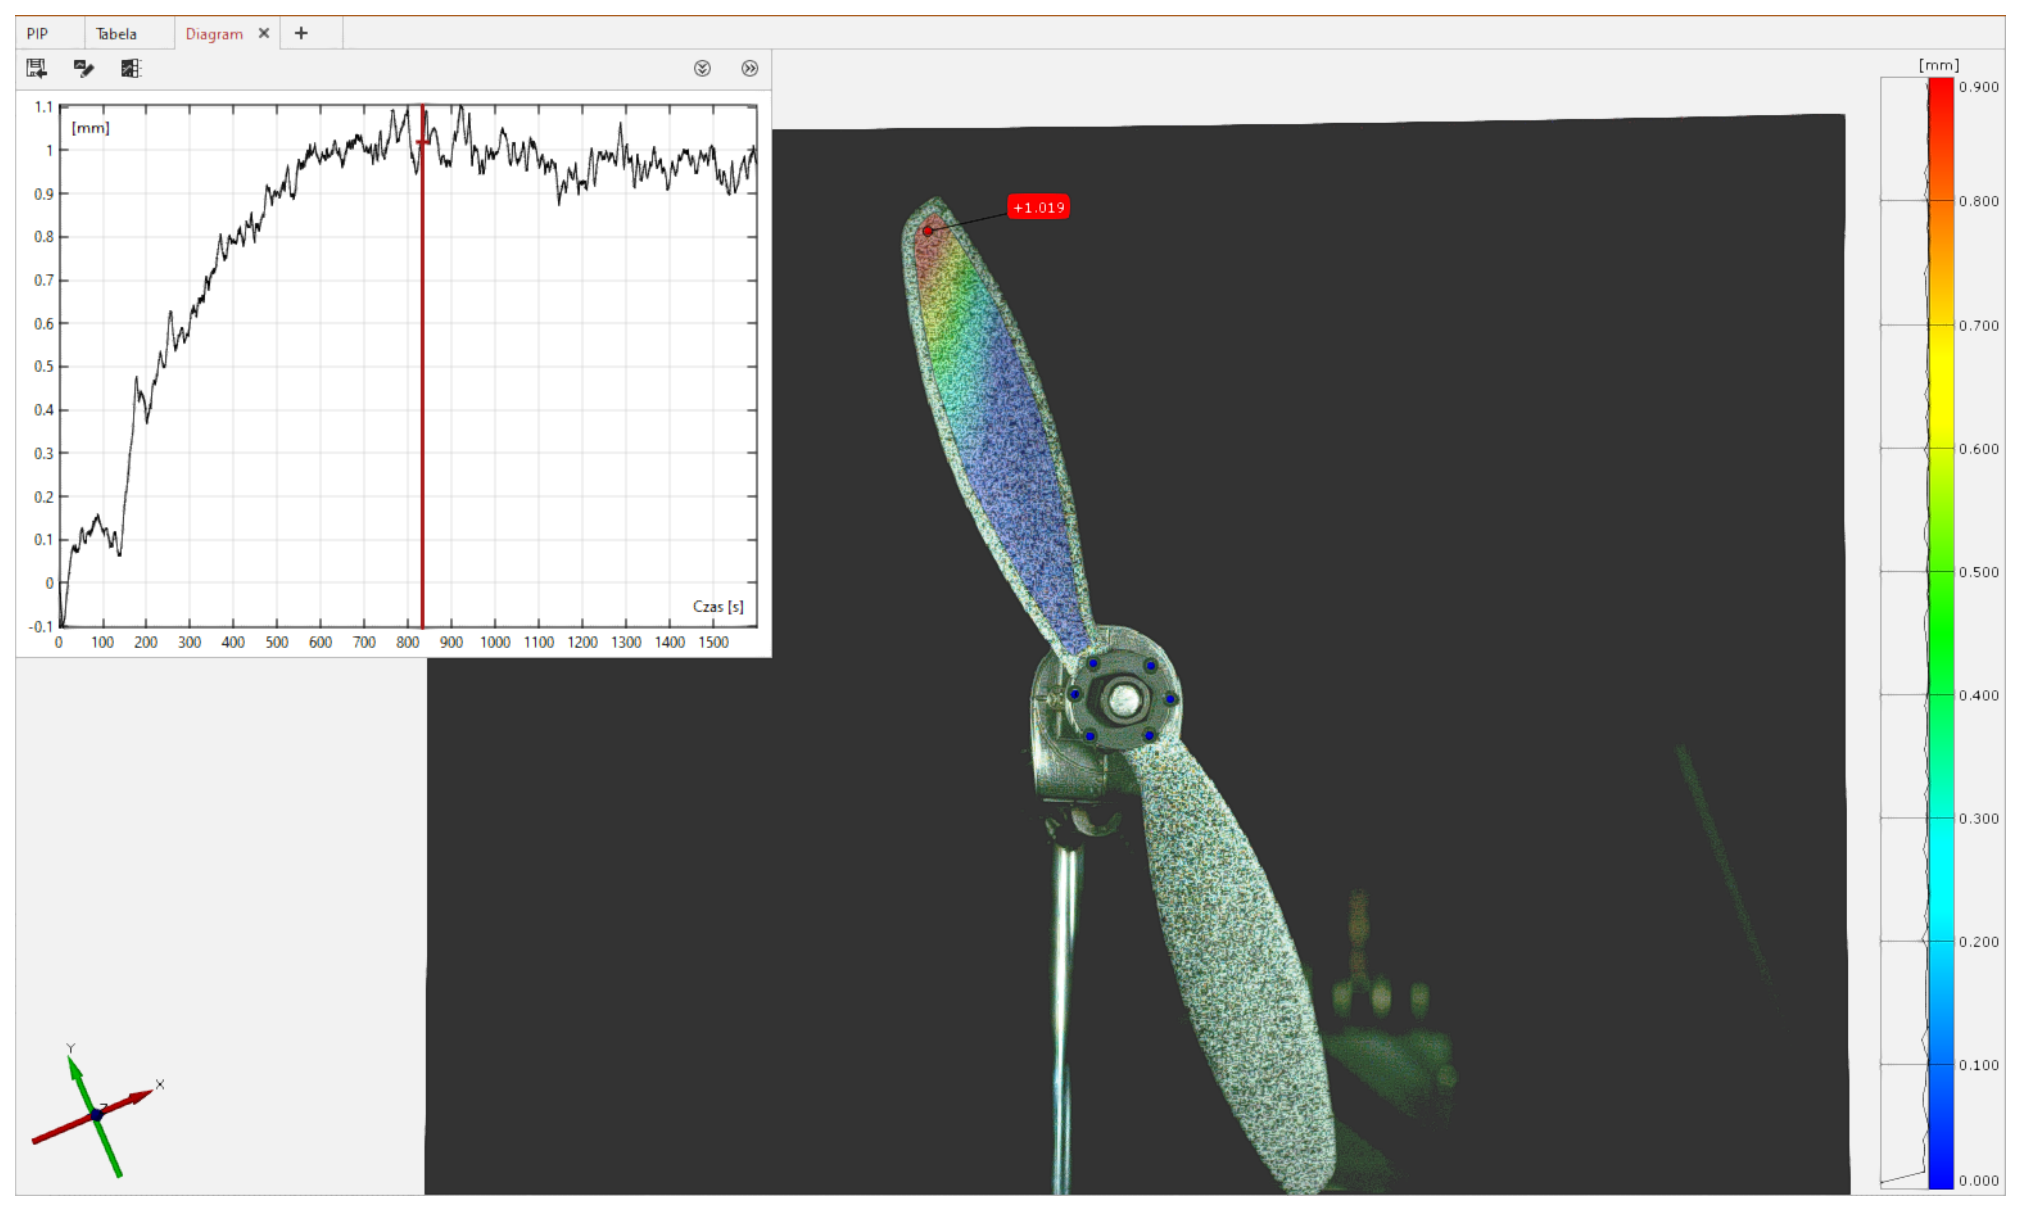
Figure 19.
Blade-tip displacement as a function of rotational speed during propeller acceleration, with a trend line approximated using a 6th-order polynomial.
Figure 19.
Blade-tip displacement as a function of rotational speed during propeller acceleration, with a trend line approximated using a 6th-order polynomial.
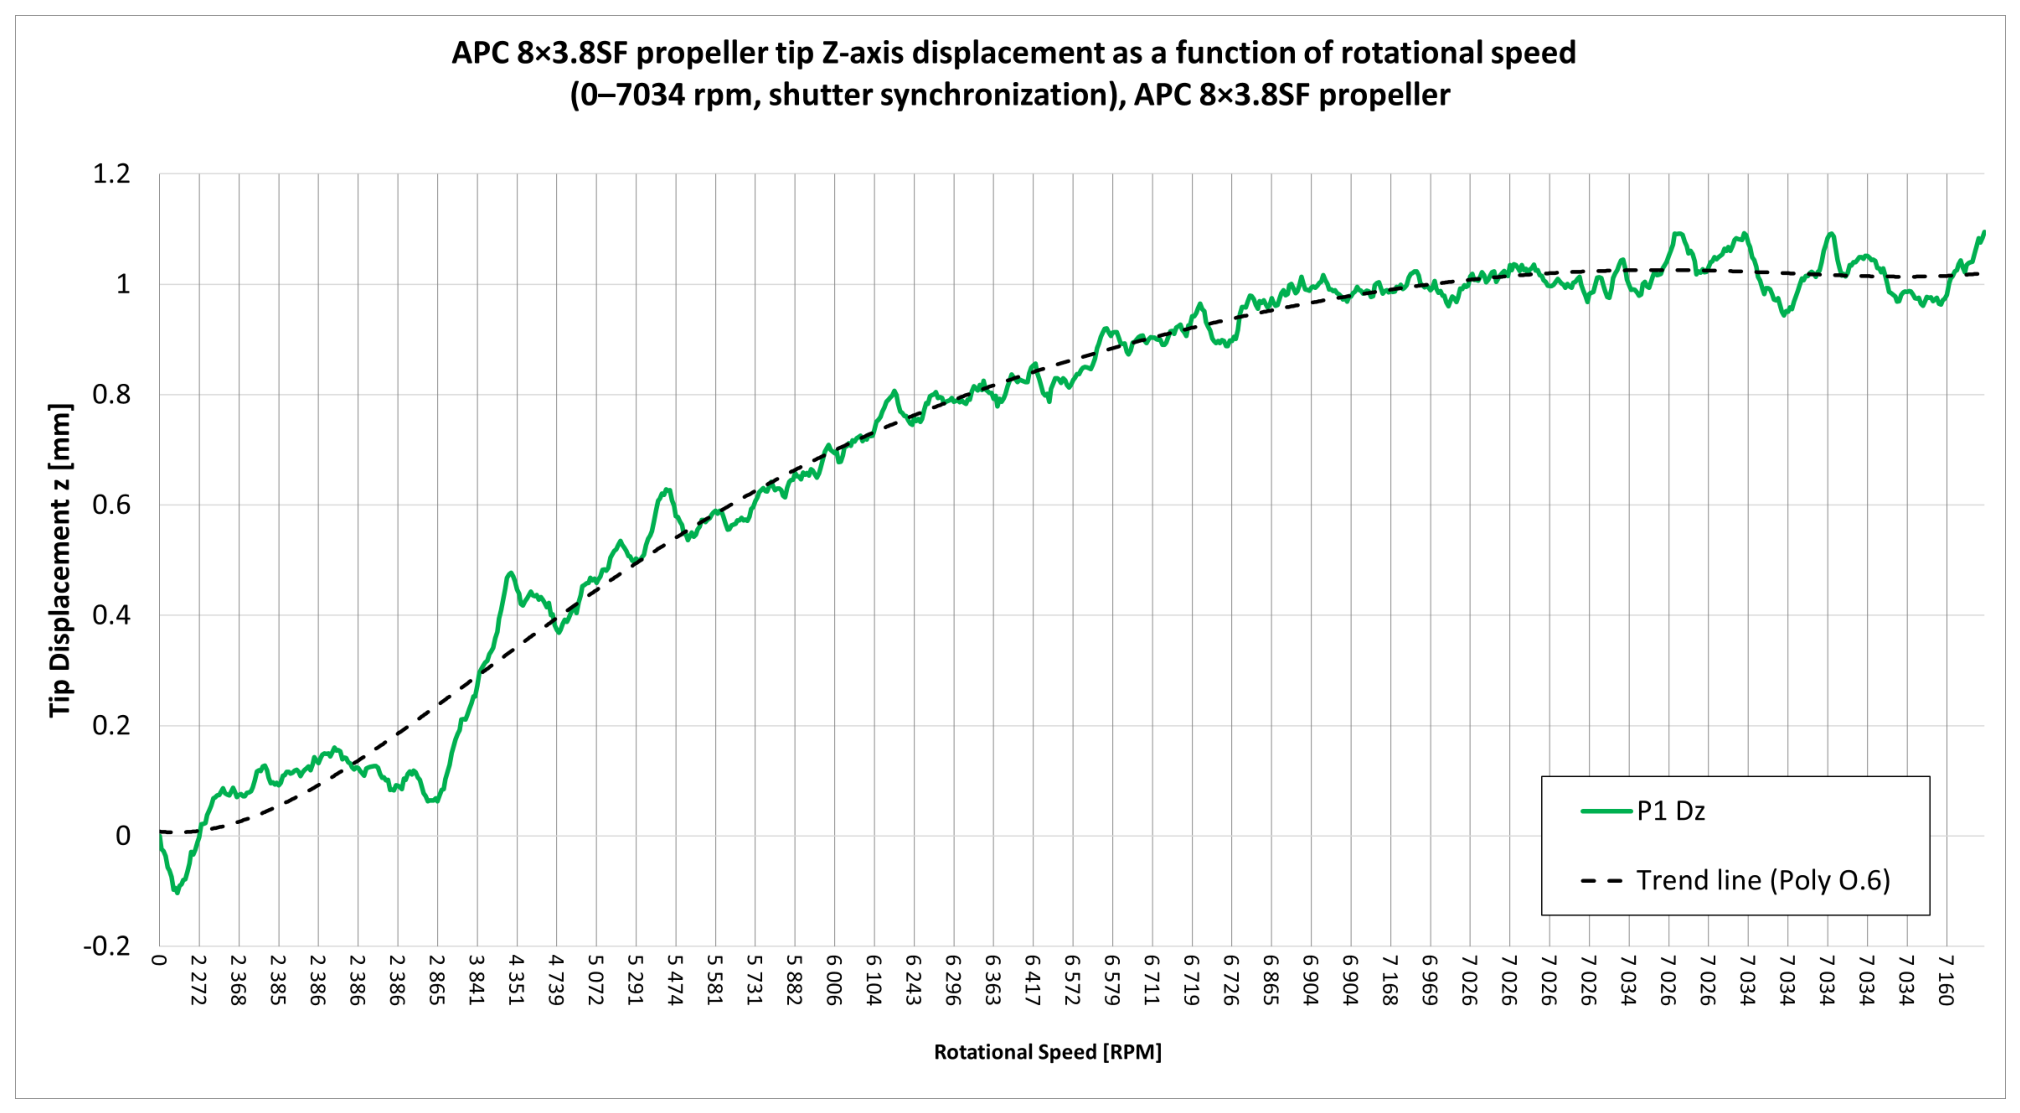

Table 1.
3D DIC system configuration parameters.
| Left image | Right image | |
|---|---|---|
| High-speed camera | Phantom T4040 | Phantom T4040 |
| Lens | Nikon Nikkor 50mm f/11 | Nikon Nikkor 50mm f/11 |
| Sensor type | CMOS BSI (color) | CMOS BSI (color) |
| Sensor dimensions | 23.7 mm × 15.4 mm | 23.7 mm × 15.4 mm |
| Pixel size | 9.27 m | 9.27 m |
| Frame Rate | Trigger synchronized with the rotation. Frequency consistent with the rotational speed. | |
| Exposure time (global shutter) | 5 s | 5 s |
| Set resolution | 1024 × 1664 | 1024 × 1664 |
| Stereo angle | 24.6 | |
| Image scale factor | ≈0.0852001 mm/pixel (measured on the left camera in the measurement plane) | |
| Illumination | 2× GsVitec Multiled MX 60,000 lm; distance between lamp and propeller: 0.6 m | |
| Calibration target | CP40-200 (Manufacturer: GOM Correlate GmbH) | |
| Calibration deviation | 0.069 pixel | |
| Measurement volume | 85/140/125 mm | |
| Subset parameters | Size = 32 pixels; Step = 12 pixels | |
Table 2.
Parameters of displacement measurement error analysis using the 3D DIC method (4 MPx color cameras).
Table 2.
Parameters of displacement measurement error analysis using the 3D DIC method (4 MPx color cameras).
| Imposed value | Mean value | Systematic error | Random error | Total error |
|---|---|---|---|---|
| [mm] | [mm] | b [mm] | [mm] | RMSE [mm] |
| 0 | 0.00061 | +0.00061 | 0.00417 | 0.00421 |
| 1 | 0.99826 | 0.00452 | 0.00485 | |
| 2 | 1.99985 | 0.00463 | 0.00463 | |
| 3 | 2.99910 | 0.00486 | 0.00494 | |
| 4 | 4.00155 | +0.00155 | 0.00491 | 0.00515 |
| 5 | 5.00117 | +0.00117 | 0.00458 | 0.00473 |
Table 3.
Parameters of strain measurement error analysis using the 3D DIC method with respect to strain gauge 2 measurements (SG2) for five beam deflections (4 MPx cameras).
Table 3.
Parameters of strain measurement error analysis using the 3D DIC method with respect to strain gauge 2 measurements (SG2) for five beam deflections (4 MPx cameras).
| Beam deflection w [mm] |
Mean strain (strain gauge) [m/m] |
Mean strain (3D DIC) [m/m] |
Systematic error b [m/m] |
Random error [m/m] |
Relative error [%] |
|---|---|---|---|---|---|
| 1 | -349 | -373 | 23 | 15 | -6.7 |
| 2 | -707 | -772 | 64 | 16 | -9.1 |
| 3 | -1057 | -1153 | 96 | 18 | -9.1 |
| 4 | -1411 | -1540 | 128 | 16 | -9.1 |
| 5 | -1734 | -1891 | 158 | 22 | -9.1 |
Table 4.
Comparison of displacement values obtained from FEM simulations and 3D DIC measurements at characteristic points P1–P2.
Table 4.
Comparison of displacement values obtained from FEM simulations and 3D DIC measurements at characteristic points P1–P2.
| Speed | 4110 RPM | 6040 RPM | 6945 RPM | |||
|---|---|---|---|---|---|---|
| Point | P1 | P2 | P1 | P2 | P1 | P2 |
| FEM Displacement Z [mm] | 0.3467 | 0.0044926 | 0.71888 | 0.014885 | 0.91997 | 0.02322 |
| DIC Displacement Z [mm] | 0.469 | -0.007 | 0.599 | -0.003 | 0.841 | -0.083 |
| Absolute Difference Z [mm] | 0.1223 | 0.0115 | 0.1199 | 0.0179 | 0.0790 | 0.1062 |
| Relative Difference Z [%] | 35.3 | -255.8 | -16.7 | -120.2 | -8.6 | -457.5 |
| FEM Total Displacement [mm] | 0.383 | 0.005 | 0.799 | 0.017 | 1.016 | 0.026 |
| DIC Total Displacement [mm] | 0.544 | 0.017 | 0.629 | 0.077 | 0.863 | -0.064 |
| Absolute Difference Total [mm] | 0.161 | 0.012 | 0.170 | 0.060 | 0.153 | 0.090 |
| Relative Difference Total [%] | 42.0 | 240.0 | -21.3 | 352.9 | -15.1 | -346.2 |
Table 5.
Comparison of strain values obtained from FEM simulations and 3D DIC measurements at characteristic points P2–P3.
Table 5.
Comparison of strain values obtained from FEM simulations and 3D DIC measurements at characteristic points P2–P3.
| Speed | 4110 RPM | 6040 RPM | 6945 RPM | |||
|---|---|---|---|---|---|---|
| Point | P2 | P3 | P2 | P3 | P2 | P3 |
| FEM Strain X [m/m] | 28 | -116 | 50 | -244 | 58 | -318 |
| DIC Strain X [AVG] [m/m] | -148 | -247 | -76 | -102 | -623 | -688 |
| Absolute Difference X [m/m] | 176 | 131 | 126 | 142 | 681 | 370 |
| Relative Difference X [%] | -628.6 | 112.9 | -252.0 | -58.2 | -1174.1 | 116.4 |
| FEM Strain Y [m/m] | -55 | 245 | -101 | 515 | -118 | 671 |
| DIC Strain Y [AVG] [m/m] | 192 | -279 | 654 | -86 | -197 | 660 |
| Absolute Difference Y [m/m] | 247 | 524 | 755 | 601 | 79 | 11 |
| Relative Difference Y [%] | -449.1 | -213.9 | -747.5 | -116.7 | 66.9 | -1.6 |
Disclaimer/Publisher’s Note: The statements, opinions and data contained in all publications are solely those of the individual author(s) and contributor(s) and not of MDPI and/or the editor(s). MDPI and/or the editor(s) disclaim responsibility for any injury to people or property resulting from any ideas, methods, instructions or products referred to in the content. |
© 2026 by the authors. Licensee MDPI, Basel, Switzerland. This article is an open access article distributed under the terms and conditions of the Creative Commons Attribution (CC BY) license (http://creativecommons.org/licenses/by/4.0/).
Copyright: This open access article is published under a Creative Commons CC BY 4.0 license, which permit the free download, distribution, and reuse, provided that the author and preprint are cited in any reuse.


