

Submitted:
13 July 2026
Posted:
15 July 2026
You are already at the latest version
Abstract
Background. The major capsid protein VP2 of canine parvovirus type 2 (CPV-2) continues to diversify into antigenic variants that shape diagnostic performance and vaccine relevance. Whether this diversification is driven chiefly by geographically structured lineage expansion, by site-specific molecular adaptation, or by recombination has not been resolved using a single, internally consistent global dataset that also applies rigorous multiple-testing correction and formal population-genetic structure testing. Objectives. We sought to reconstruct the global phylogenetic structure of publicly available complete CPV-2 genomes, test temporal signal and geographic population structure formally, test directly for recombination and for site- and branch-specific selection pressure on VP2 with appropriate correction for multiple testing, characterize population-genetic and haplotype structure, and place candidate residues in the structural context of the solved CPV capsid. Methods. Ninety-five complete CPV-2 genomes from 18 countries (1993-2025) were aligned (MAFFT) and used to infer a maximum-likelihood phylogeny (IQ-TREE2, ModelFinder, 1000 ultrafast bootstrap/SH-aLRT replicates). Temporal signal was assessed by TreeTime root-to-tip regression. The VP2 open reading frame was extracted computationally and validated against the original 1978 prototype sequence resolved by X-ray crystallography (PDB 2CAS). Recombination (GARD) and codon-level selection (FEL, SLAC, FUBAR, MEME, BUSTED, aBSREL) were tested directly in HyPhy 2.5.59, with Benjamini-Hochberg false discovery rate (FDR) correction applied to all site-wise p-values. Population-genetic statistics (Tajimaʹs D, Fu and Liʹs D*/F*, haplotype and nucleotide diversity, Hudsonʹs Fst) were computed in EggLib and scikit-allel, both overall and stratified by genotype and country. Genotype-country association was tested with Pearsonʹs chi-square, a Fisher-Freeman-Halton exact test, and PERMANOVA; isolation-by-distance was tested with a Mantel test. Candidate residues were mapped onto the secondary-structure annotations of the solved capsid structure. Major Results. The phylogeny resolved fully monophyletic, single-country clades for Iraq and Nigeria, three independent Brazilian clusters, and a broadly paraphyletic Chinese population. Root-to-tip regression showed a weak temporal signal (R^2=0.09; rate=3.98x10^-4 substitutions/site/year), consistent with multiple asynchronous introductions rather than one clonally evolving lineage. Genotype distribution (CPV-2c 43%, CPV-2a 35%, CPV-2b 22% of 93 genotyped sequences) was significantly associated with country (chi-square=47.5, p<0.0001; exact test p=2x10^-5; Cramerʹs V=0.59) and confirmed by PERMANOVA (pseudo-F=11.60, p=0.0001). Pairwise Fst was moderate to large both between genotypes (0.19-0.45) and between countries (0.17-0.72); a Mantel test found no significant isolation-by-distance signal (r=0.11, p=0.78), consistent with long-distance introduction rather than gradual diffusion. GARD found no recombination breakpoint improving on a no-breakpoint baseline for VP2. FEL and SLAC identified zero codons under pervasive positive selection against a background of strong purifying selection (dN/dS=0.15). FUBAR and MEME flagged codons 297 and 324 as candidates before correction; after Benjamini-Hochberg FDR correction, neither survived at q<=0.1 (q=0.107 and q=0.95), so this site-level signal is suggestive rather than confirmed. Gene-wide evidence of episodic diversifying selection remained significant (BUSTED, p=0.0064), and aBSREL identified exactly two significant branches, both belonging to the monophyletic Iraqi clade. Population-genetic analysis showed high haplotype diversity (Hd=0.99) against modest nucleotide diversity (pi=0.007/site) with significantly negative Tajimaʹs D (-1.998) and Fu and Liʹs D*/F* (-4.60/-4.19), reproduced within each genotype subset. Biological Interpretation. Multiple, convergent lines of evidence - phylogenetic clade structure, weak clock signal, large Fst with no isolation-by-distance, and significant PERMANOVA partitioning - independently support a model in which global CPV-2 population structure is dominated by discrete, geographically and temporally heterogeneous introduction events rather than by clock-like clonal spread or gradual geographic diffusion. Gene- and branch-level evidence supports episodic diversifying selection localized to a specific introduction event, but site-level attribution to particular codons is corroborating rather than independently conclusive once multiple-testing correction is applied. Conclusions. This integrated phylogenomic, temporal, population-genetic, selection, and structural analysis supports geographically structured introduction-and-expansion as the dominant mode of contemporary CPV-2 diversification, identifies VP2-297 and VP2-324 as candidate but not confirmed sites of diversifying selection, and provides a fully reproducible computational framework for future CPV genomic surveillance.
Keywords:
canine parvovirus
; VP2
; phylogenomics
; molecular evolution
; positive selection
; multiple-testing correction
; population structure
; Fst
; recombination
; genotype
; structural mapping
1. Introduction
Canine parvovirus type 2 (CPV-2) emerged abruptly in the domestic dog population in the late 1970s and, within approximately two years, had achieved a worldwide distribution (Shackelton et al., 2005, PNAS 102:379-384). CPV-2 is exceptionally closely related to feline panleukopenia virus (FPV), differing by a small number of amino acid substitutions concentrated in VP2, several of which - notably at VP2 residues 93 and 323 - were sufficient to redirect host tropism from the feline to the canine transferrin receptor (Hueffer et al., 2003, J Virol 77:1718-1726; Truyen et al., 1995, J Virol 69:4702-4710; Parrish et al., 1988, Virology 166:293-307).
The original CPV-2 was itself short-lived, displaced within about a year by CPV-2a and subsequently, in many regions, by CPV-2b and CPV-2c, the last first characterized in Italy around the year 2000 and since reported worldwide (Decaro et al., 2007, Emerg Infect Dis 13:1222-1224; Miranda and Thompson, 2016, J Gen Virol 97:2043-2057). These three variants are conventionally distinguished by VP2 residue 426 (Asn, Asp, or Glu for 2a, 2b, and 2c). It is important to state plainly, rather than discover midway through a results section, that this typing scheme has a well-documented limitation: several groups have shown that the amino acid substitutions at position 426 do not map onto strongly supported monophyletic clades and have arisen independently multiple times, meaning residue-426 genotype is not always a reliable guide to true evolutionary relationships among strains (Grecco et al., 2018, Virus Evol 4:vey011; Voorhees et al., 2020, J Virol 94:e01162-19). We use genotype labels throughout this study as a widely understood descriptive shorthand, consistent with standard field practice, while treating the whole-genome phylogeny - not genotype assignment - as the primary evidence for evolutionary relationships between sequences.
Beyond residue 426, a substantial primary literature has implicated additional VP2 positions in host-range determination or antigenic escape. VP2-300 has been identified as the single most variable residue in the parvovirus capsid in nature and a determinant of cross-species transfer (Allison et al., 2016, J Virol 90:753-767). Voorhees et al. (2020) specifically highlighted VP2-297 and VP2-440 as sites of interest based on their proximity to the mapped Fab footprint of a transferrin-receptor-blocking monoclonal antibody. Several recent regional surveillance studies converge on an overlapping set of substitutions: a large-scale 2022 analysis of essentially all publicly available CPV-2 VP2 sequences found that CPV-2c strains in Asia characteristically carry the A5G and Q370R substitutions (Hao et al., 2022, Int J Mol Sci 23:11540); a 2024 study of Chinese isolates reported F267Y, Y324I, and N426E among the antigenic-epitope substitutions distinguishing contemporary strains (Pan et al., 2024, Microorganisms 12:2173); and a 2026 Shanghai surveillance study reported F267Y, Y324I, N426E, Q370R, and A440T as the characteristic mutation set of currently circulating CPV-2c (Pan et al., 2026, Microorganisms 14:761). That three independent, geographically distinct surveillance studies spanning 2022-2026 converge on largely the same short list of VP2 positions is itself informative: it suggests the field has repeatedly rediscovered the same candidate sites by observational variability rather than by testing them against a formal, multiple-testing-corrected statistical framework for selection, or against formal tests of population structure that could distinguish geographically driven from selection-driven diversification.
This is the central, specific gap this study addresses. Despite wide agreement on which VP2 positions are variable, we are not aware of a study that tests this full, literature-derived candidate set directly against the modern codon-based selection toolkit (FEL, SLAC, FUBAR, MEME, BUSTED, aBSREL) on a single, phylogenetically representative global dataset, while applying multiple-testing correction appropriate to testing 584 codons simultaneously, and simultaneously testing whether the underlying population structure is better explained by geographic diffusion (isolation-by-distance) or by discrete introduction events (via Fst, Mantel, and PERMANOVA testing) and by temporal clock signal (via root-to-tip regression). This distinction matters in practice: as we show in Section 3.5, Section 3.6 and Section 3.7, applying corrected statistical testing changes which sites can be described as statistically supported rather than merely variable, and formal population-structure testing provides independent, convergent evidence for the introduction-driven model inferred qualitatively from the tree topology alone. A second, related gap concerns geographic scope: most CPV VP2 selection and recombination analyses to date have been regional rather than testing a broad, multi-continent sample within one internally consistent pipeline that also integrates phylogeography, temporal signal, population genetics, and structural context.
A separate, mechanistic line of evidence bears on the origin of this diversity. Phylodynamic reconstruction of the CPV/FPV clade showed that the newly emerged canine lineage underwent epidemic-like population growth after 1978, evolved at a nucleotide substitution rate closer to that of RNA viruses than of double-stranded DNA viruses, and that positive selection on the capsid gene - not recombination - drove this early radiation (Shackelton et al., 2005). Comparative work across the wider Parvovirinae has since shown that recombination can be frequent in other genome regions and other parvovirus species (Shackelton et al., 2007, J Gen Virol 88:3294-3301), and a South American whole-genome study specifically documented a recombinant strain combining an NS gene from one clade with a VP gene from another (Perez et al., 2014, PLoS ONE 9:e111779), raising a genuinely open question of whether recombination affecting VP2 specifically has contributed to the contemporary global CPV-2a/2b/2c radiation, as distinct from the ancestral FPV-to-CPV transition.
We addressed these gaps by assembling a curated, 95-genome, 18-country CPV-2 dataset spanning more than three decades and subjecting it to a single, reproducible computational pipeline combining whole-genome phylogenetics, temporal signal testing, VP2 genotyping, direct recombination and selection testing with explicit multiple-testing correction, formal population-structure testing (Fst, Mantel, PERMANOVA), population-genetic and haplotype-network analysis, and structural mapping against the solved CPV capsid. We hypothesized, first, that global VP2 diversity is shaped predominantly by repeated, geographically independent introduction-and-expansion events rather than by a single ordered genotype replacement or by isolation-by-distance diffusion; second, that this would be reflected not only in tree topology but in weak temporal clock signal and in significant population differentiation uncorrelated with geographic distance; and third, that once the literature-derived candidate selection site list is tested with appropriately corrected, multiple, methodologically independent statistical approaches, only a small subset - if any - would retain support as genuinely, rather than provisionally, under diversifying selection.
2. Materials and Methods
2.1. Sequence Dataset and Curation
Ninety-five complete CPV-2 genome sequences with associated metadata (accession, country, collection year, host) were retrieved and curated to a final quality-controlled set spanning 18 countries (China n=43, Brazil n=10, Nigeria n=4, Iraq n=4, Turkey n=4, Iran n=4, Uruguay n=3, Peru n=3, Argentina n=2, Ecuador n=2, South Korea n=2, and single sequences each from Kazakhstan, Viet Nam, USA, Hungary, Taiwan, Mongolia and Russia; 7 sequences lacked country metadata) and years 1993-2025. Hosts were predominantly domestic dog (n=85), with single sequences from an unspecified-host category, a pangolin, a red-collared dove, and a named Laika-breed dog. Five FASTA header fields containing unescaped spaces were identified as a latent source of Newick tip-label truncation and were sanitized prior to phylogenetic analysis.
2.2. Multiple Sequence Alignment, Maximum-Likelihood Phylogeny, and Temporal Signal
Whole-genome sequences were aligned with MAFFT v7 (--auto strategy); per-window alignment gap fraction was inspected across the alignment to confirm consistent coverage in the VP2 region (Supplementary Figure S2). Maximum-likelihood phylogenetic inference used IQ-TREE2 with ModelFinder (MFP, BIC) for substitution-model selection (best-fit: TN+F+R2), 1000 ultrafast bootstrap (UFBoot2) and 1000 SH-aLRT replicates. The tree was rooted at the midpoint for visualization only; no outgroup was included, and conclusions that specifically depend on root placement are flagged as such wherever they appear. Temporal signal was assessed by root-to-tip regression in TreeTime v0.11 (Sagulenko et al., 2018, Virus Evol 4:vex042), a maximum-likelihood-based approach serving the same diagnostic purpose as TempEst. The whole-genome tree was pruned to the 87 of 95 tips with a recorded collection year and rerooted by TreeTime's least-squares criterion. Full Bayesian molecular-clock dating (e.g., BEAST2) was not performed, as MCMC chains of sufficient length for reliable convergence on a 95-taxon whole-genome alignment are not practical within the computational environment used for this study, and this is stated as a limitation (Section 5) rather than presented as completed.
2.3. VP2 Open Reading Frame Extraction, Structural Validation, and Genotyping
The VP2 coding sequence was identified by open-reading-frame scanning of the longest complete genome in the dataset, yielding a 1755-nucleotide, 584-codon product. This coordinate window was mapped onto the whole-genome alignment and applied to all 95 sequences. A sequence was retained for VP2-level analysis if its extracted, gap-stripped VP2 region was a multiple of 3 nucleotides in length and at least 1740 nt; 93 of 95 sequences met this criterion. The two excluded sequences, both from South Korea (OP972595.1, OP972596.1), carried a 48-nucleotide (16-codon) shortfall in this region relative to all other sequences despite normal overall genome length; this finding requires independent confirmation (Section 5). VP2 residue numbering was validated against the original 1978 CPV-2 prototype (strain D) sequence deposited in PDB 2CAS (Wu and Rossmann, 1993, J Mol Biol 233:231-244; UniProt Q11213). Genotype (CPV-2a/2b/2c) was assigned from VP2 residue 426 (Asn=2a, Asp=2b, Glu=2c), with the caveat on the evolutionary interpretability of this scheme stated in Section 1.
2.4. Recombination Screening
Recombination was tested with GARD (HyPhy 2.5.59) on the 93-sequence, stop-codon-trimmed VP2 coding alignment (1752 nt) under a general discrete rate-variation model, comparing the corrected Akaike information criterion (c-AIC) of a no-breakpoint baseline against single- and multi-breakpoint models via exhaustive and genetic-algorithm search respectively.
2.5. Codon-Based Selection Analysis
Selection pressure on VP2 was assessed with six complementary HyPhy 2.5.59 methods (FEL, SLAC, FUBAR, MEME, BUSTED, aBSREL), run on the 93-sequence codon alignment together with a VP2-specific maximum-likelihood guide tree built in IQ-TREE2 with ModelFinder (best-fit model for this VP2-only tree: HKY+F+R2, independently selected from the whole-genome tree's TN+F+R2). FEL, SLAC, and MEME nominal significance was assessed at p<=0.1; because this involves 584 simultaneous per-codon tests, Benjamini-Hochberg false discovery rate (FDR) correction was additionally applied across all 584 codons for each method, and both nominal and FDR-corrected (q-value) results are reported (Section 3.5; Table 4). FUBAR posterior probabilities (threshold >=0.9) are reported at face value, consistent with standard usage of this Bayesian method. aBSREL applies Holm-Bonferroni correction internally across tested branches (n=139). Selection analysis was additionally repeated on an independently built second VP2 maximum-likelihood guide tree (same alignment, same HyPhy pipeline) as a dedicated robustness/replication step; results are reported alongside the primary analysis in Section 3.5, and both trees and full HyPhy outputs are included in the supplementary data.
2.6. Population Genetics, Genetic Differentiation, and Isolation-by-Distance
Segregating sites (S), nucleotide diversity (pi), Watterson's theta, Tajima's D, and Fu and Li's D* and F* were computed with EggLib v3.6.1 on the 93-sequence, stop-codon-trimmed VP2 coding alignment, for the full dataset and separately within each genotype subset. Haplotype diversity (Hd) was computed from the frequency distribution of unique full-length VP2 haplotypes. A haplotype network was constructed from pairwise Hamming distances among unique haplotypes using a minimum-spanning-network approach (a distance-based approximation of a median-joining network). Genetic differentiation was quantified with Hudson's Fst estimator (Hudson et al., 1992; implemented in scikit-allel v1.3.13), computed pairwise between VP2 genotypes and, separately, between countries with n>=4 sequences, using all variable sites in the VP2 alignment. Isolation-by-distance was tested with a Mantel test (9,999 permutations; scikit-bio v0.7.3) correlating the country-level Fst matrix against great-circle geographic distances between national centroids (n=6 countries meeting the sample-size threshold). Population structure was additionally tested with PERMANOVA (9,999 permutations; scikit-bio), a permutation-based, modern equivalent to classical AMOVA, partitioning pairwise Hamming genetic distance among all 93 VP2 sequences by genotype and, separately, by country; classical AMOVA itself was not run, and PERMANOVA is reported explicitly as the method used rather than presented as equivalent to a specific AMOVA implementation.
2.7. Structural Mapping
Candidate VP2 residues were mapped onto the secondary-structure assignments (SHEET and HELIX records) and crystallographic annotations, including Ramachandran-outlier flags, reported in the header of PDB 2CAS (Wu and Rossmann, 1993). This uses the genuine, deposited secondary-structure and validation record of the solved capsid rather than a three-dimensional rendering; full atomic coordinate retrieval for rendering was attempted twice via automated web retrieval and was truncated at approximately residue 128 of 584 on both attempts regardless of the data volume requested, a confirmed tooling limitation of the computational environment used for this study rather than a data-availability problem. A complete, ready-to-run script (render_VP2_sites.pml) for generating a true three-dimensional rendering in any standard local PyMOL installation is provided as supplementary data (Section 5).
2.8. Statistical Association Testing
Association between VP2 genotype and country was tested with Pearson's chi-square test and, given sparse cells in the contingency table, corroborated with a Fisher-Freeman-Halton exact test (Monte Carlo simulation, 100,000 replicates) on the same table, restricted to countries with four or more sequences. Effect size is reported as Cramer's V.
2.9. Software, Reproducibility, Ethics, and Data Availability
Software versions: MAFFT v7; IQ-TREE v2 (ModelFinder, UFBoot2, SH-aLRT); TreeTime v0.11; HyPhy v2.5.59 (FEL, SLAC, FUBAR, MEME, BUSTED, aBSREL, GARD); EggLib v3.6.1; scikit-allel v1.3.13; scikit-bio v0.7.3; R v4.3.3 (exact test); Python 3.12 with Biopython v1.87, NetworkX, SciPy, and statsmodels (Benjamini-Hochberg correction). No animal or human subjects were involved; this study relied exclusively on publicly deposited nucleotide sequences and required no ethics approval. All sequence accessions, curated metadata (Supplementary Table S1), the multiple sequence alignment, IQ-TREE output files (whole-genome and both independent VP2-only trees), VP2 nucleotide/protein FASTA files, the VP2 mutation interpretation table (Supplementary Table S2), HyPhy JSON outputs for all six selection/recombination analyses on both guide trees (Supplementary Table S3 summarizes the master selection results), EggLib and scikit-allel/scikit-bio population-genetics outputs, haplotype-network data, and the PyMOL rendering script are provided as supplementary files.
3. Results
3.1. Genome Dataset and Sequence Characteristics
The curated dataset comprised 95 complete CPV-2 genomes from 18 countries spanning 1993-2025, predominantly from domestic dogs with a small number from non-canid or unspecified hosts, including a pangolin and a red-collared dove. Quality control identified and corrected five sequence headers whose unescaped spaces would otherwise have truncated the affected tip labels under the Newick tree format.
Figure 1.
Analytical workflow for the global CPV VP2 phylogenomic study.

3.2. Phylogenetic Clustering, Geographic Lineage Expansion, and Temporal Signal
Maximum-likelihood reconstruction (Figure 2) selected TN+F+R2 as the best-fit substitution model and produced a tree with a log-likelihood of -23,810.71 and a total length of 2.39 substitutions per site. Sequences from Iraq (n=4) and Nigeria (n=4) each formed a fully monophyletic, 100%-supported, single-country clade. Brazilian sequences (n=10) resolved into three separate, well-supported monophyletic clusters rather than one clade. Chinese sequences (n=43) were broadly paraphyletic across most of the tree's depth. Sequences from Uruguay, Ecuador, Argentina, and Peru were interspersed within a shared regional clade rather than segregating by country.
Two South Korean sequences (OP972595.1, OP972596.1) fell outside all other sequences at the earliest split from the midpoint root; because the tree is unrooted in the absence of an outgroup, this placement should be read as a topological observation rather than confirmed evolutionary basal status. Independently of this placement, VP2 open-reading-frame extraction showed both sequences carry a 16-codon shortfall in the VP2 region relative to every other sequence, despite normal overall genome length - a finding requiring independent verification rather than an established fact.
Root-to-tip regression against sampling year (n=87 dated tips; Figure 3) yielded a substitution rate of 3.98x10^-4 substitutions/site/year and a weak temporal signal (R^2=0.09). We interpret this weak clock signal as further, independent support for the phylogeographic pattern above: a dataset generated by several geographically distinct, asynchronously timed introduction events is expected to fit a simple linear root-to-tip model poorly even when a real, non-zero substitution rate underlies the data, whereas a single, clonally spreading lineage would be expected to show a substantially tighter fit. The estimated rate is consistent in order of magnitude with prior CPV substitution-rate estimates (Shackelton et al., 2005).
3.3. Geographic and Temporal Genotype Distribution
Genotyping at VP2-426 classified the 93 sequences with an intact VP2 reading frame as 40 CPV-2c (43%), 33 CPV-2a (35%), and 20 CPV-2b (22%). Genotype distribution was significantly associated with country of origin both by Pearson's chi-square (47.5, df=10, p<0.0001, restricted to countries with n>=4) and by a Fisher-Freeman-Halton exact test on the same table (Monte Carlo p=2x10^-5, 100,000 replicates), with a large effect size (Cramer's V=0.59). Iraq was entirely CPV-2a, Turkey entirely CPV-2b, and Nigeria entirely CPV-2c, whereas China and Brazil each contained a mixture of genotypes (Figure 4; Table 2).
Genotype proportions across four collection-year bins showed CPV-2c present throughout the sampled period, with CPV-2b comparatively more represented in the most recent bin (Figure 5). Because country and year of sampling are confounded in this opportunistically assembled dataset, this temporal pattern is suggestive rather than conclusive of a genotype-replacement trend.

Table 1.
Dataset summary.
| Metric | Value |
| Total curated genomes | 95 |
| Countries represented | 18 (+7 unspecified) |
| Collection year range | 1993-2025 |
| Dominant host | Domestic dog (n=85) |
| Non-canid hosts | Pangolin (n=1), red-collared dove (n=1) |
| VP2 ORF length / inclusion rule | 1755 nt / 584 aa; retained if in-frame and >=1740 nt |
| Sequences with intact VP2 ORF | 93 / 95 |
| Whole-genome tree model (ModelFinder) | TN+F+R2 |
| VP2-only tree model (ModelFinder) | HKY+F+R2 |
| Tree log-likelihood (whole genome) | -23,810.71 |
| Root-to-tip clock rate / R2 (TreeTime, n=87) | 3.98x10^-4 subs/site/yr / R2=0.09 |
Table 2.
VP2 genotype distribution.
| Genotype | n (of 93) | % of total | Defining residue (VP2-426) | Notable countries |
| CPV-2a | 33 | 35% | Asn (N) | China (18), Iraq (4, 100%), Iran (3) |
| CPV-2b | 20 | 22% | Asp (D) | Brazil (7), Turkey (4, 100%), China (4) |
| CPV-2c | 40 | 43% | Glu (E) | China (21), Nigeria (4, 100%), Brazil (3) |
3.4. VP2 Mutation Spectrum and Lineage-Associated Residues
Translation of the 93 in-frame VP2 sequences and comparison against the 1978 prototype (PDB 2CAS) identified eight literature-derived sites of interest: 267, 297, 300, 305, 324, 370, 426, and 440 (Figure 6). Only residue 426 was essentially fixed within genotype, by definition of the genotyping scheme. Residue 370 showed a strong, though incomplete, association with genotype (arginine in 29 of 40 CPV-2c, 1 of 20 CPV-2b, 0 of 33 CPV-2a sequences: Q370R). Residue 440 showed a comparable pattern (threonine in 39 of 40 CPV-2c sequences). Residue 297 was overwhelmingly alanine across all three genotypes, with the minor asparagine variant concentrated in South American sequences (4 of 10 Brazilian, 1 of 3 Uruguayan) and virtually absent elsewhere. Residue 324 was the most amino-acid-diverse of the eight sites, without a clean association to genotype or country (Table 3).
3.5. Selection Pressure: Purifying Background and the Effect of Multiple-Testing Correction
FEL and SLAC identified zero VP2 codons under significant pervasive positive selection at nominal p<=0.1 (FEL: 82/584 codons under significant negative selection; SLAC: 18/584), and a global dN/dS from FEL of 0.147, confirming strong purifying selection overall. FUBAR (posterior >=0.9) flagged five codons: 5, 297, 324, 370, and 440. MEME (nominal p<=0.1) flagged seven codons: 38, 42, 83, 222, 279, 297, and 324, with 297 and 324 also flagged by FUBAR.
Applying Benjamini-Hochberg FDR correction across all 584 simultaneous per-codon tests changes this picture materially. For FEL, 6 codons (53, 144, 179, 270, 273, 277 - all under negative, not positive, selection) survive correction at q<=0.1; the FEL result for positive selection remains null both nominally and after correction. For MEME, zero codons survive FDR correction at q<=0.1: codon 297, the strongest candidate, has a corrected q-value of 0.107, narrowly missing the threshold, and codon 324 has q=0.95. We report this transparently rather than presenting the nominal, uncorrected result as the headline finding: on the basis of MEME alone, after appropriate correction for testing 584 codons simultaneously, neither 297 nor 324 can be described as a statistically confirmed site of episodic diversifying selection, only as the strongest available candidates. FUBAR's Bayesian posterior probabilities are not p-values and are conventionally reported without an equivalent FDR adjustment; read alongside the corrected MEME result, we regard the FUBAR signal at 297 and 324 as corroborating but not independently sufficient evidence (Table 4; Figure 7).
Table 4.
Selection analysis summary (HyPhy), with multiple-testing correction.
| Method | Level | Nominal result | After correction |
| FEL | Site, pervasive | 0/584 positive; 82/584 negative (p<=0.1) | 6/584 negative survive BH-FDR (q<=0.1); 0 positive |
| SLAC | Site, pervasive | 0/584 positive; 18/584 negative | Not separately re-run; consistent with FEL |
| FUBAR | Site, pervasive (Bayesian) | 5 codons >=0.9 posterior (5,297,324,370,440) | N/A (Bayesian; see Section 3.5) |
| MEME | Site, episodic | 7 codons p<=0.1 (incl. 297, 324) | 0/584 survive BH-FDR at q<=0.1; 297 closest (q=0.107) |
| BUSTED | Gene-wide, episodic | LRT=8.72, p=0.0064 | Single pre-specified test; not subject to this correction |
| aBSREL | Branch-wise, episodic | 2/139 branches (both Iraqi clade) | Holm-Bonferroni already applied internally |
| GARD | Recombination | No breakpoint improves fit | N/A |
A second, independently built VP2 guide tree, analyzed with the identical HyPhy pipeline as a dedicated robustness check, reproduced this same qualitative picture: FUBAR again flagged codon 297 (posterior 0.965) and 324 (posterior 0.968), and MEME again flagged 297 (nominal p=0.0002) and 324 (nominal p=0.0033) alongside a partially overlapping but not identical set of additional codons (5, 38, 42, 83, 279). Codon 5 was significant in MEME on this second tree (nominal p=0.046) but not on the primary tree (nominal p=0.11), illustrating sensitivity of this particular borderline call to small differences in guide-tree branch-length estimation; codons 297 and 324 were the only two sites flagged by both FUBAR and MEME on both independently estimated trees, which we regard as the most defensible tree-independent signal available, while still subject to the FDR caveat above.
This site-level picture was corroborated, and partially clarified, at two further levels of analysis for which appropriate correction is already built into the method. At the gene-wide level, BUSTED found significant evidence that at least one VP2 codon on at least one branch has experienced episodic diversifying selection (likelihood ratio=8.72, p=0.0064), a single, pre-specified test not subject to the same multiple-comparisons problem as the site-wise scans above. At the branch level, aBSREL, using its internal Holm-Bonferroni correction across 139 tested branches, identified exactly two significant branches: the terminal branches leading to accessions OR451707.1 (p=0.00001) and OR667802.1 (p=0.042). Both belong to the monophyletic Iraqi clade identified in Section 3.2.
3.6. Recombination
GARD found no breakpoint model, single or multi-breakpoint, that improved on a no-recombination baseline for the VP2 coding alignment (change in corrected AIC=0 across all candidate multi-breakpoint models following genetic-algorithm search). This finding is specific to VP2 within this dataset; it does not extend to other genome regions, which were not screened, and is compatible with a report of a genome-scale recombinant strain (with the NS gene from one clade and the VP gene from another) in the South American CPV-2 literature (Perez et al., 2014), since that event involved a breakpoint outside VP2 rather than within it, and with a 2024 report of nine predicted recombination events among Chinese CPV-2 isolates using a regional, non-VP2-restricted analysis (Pan et al., 2024).
3.7. Population Genetic Structure, Genetic Differentiation, and Isolation-by-Distance
Across the 93-sequence VP2 dataset, 154 of 1752 aligned nucleotide sites (8.8%) were segregating, corresponding to 73 unique haplotypes and a haplotype diversity of 0.9895. Nucleotide diversity was comparatively modest (pi=0.00697/site), and both Tajima's D (-1.998) and Fu and Li's D* and F* (-4.599 and -4.193) were strongly negative. This signature persisted within each genotype subset (Tajima's D: CPV-2a -2.04, CPV-2b -1.23, CPV-2c -1.53; full per-genotype statistics in Table 5), indicating it is a property of the CPV-2 population generally rather than an artifact of pooling structured subpopulations.
Formal population-structure testing converged on the same conclusion from three independent directions. Pairwise Fst between genotypes was moderate to large (CPV-2a vs CPV-2b=0.19, CPV-2a vs CPV-2c=0.45, CPV-2b vs CPV-2c=0.32), with CPV-2a and CPV-2c the most differentiated pair. Pairwise Fst between countries with n>=4 sequences ranged from 0.17 (Brazil vs Iran) to 0.72 (Nigeria vs Brazil) (Table 7), confirming substantial national-level genetic differentiation. A Mantel test found no significant relationship between this country-level genetic differentiation and geographic distance (r=0.11, p=0.78, Pearson; r=0.19, p=0.67, Spearman; n=6 countries; Table 8). We report this null result transparently: the small number of countries with sufficient sample size limits statistical power substantially, but the point estimate is consistent with long-distance, source-independent introductions rather than gradual geographic diffusion (isolation-by-distance), directly reinforcing the phylogeographic argument of Section 3.2 rather than merely supplementing it. PERMANOVA confirmed that both genotype (pseudo-F=26.59, p=0.0001) and country (pseudo-F=11.60, p=0.0001) explain significant proportions of pairwise genetic variance among VP2 sequences (Table 8).
Table 6.
Comparison with prior CPV evolutionary studies (classic and 2018-2026).
| Study | Key relevant finding | Relation to this study |
| Shackelton et al., 2005, PNAS | No recombination in CPV emergence from FPV; rapid substitution rate; positive selection drove early capsid adaptation | Consistent: GARD finds no recombination in contemporary VP2; episodic selection detected against a purifying background; substitution rate of comparable order of magnitude |
| Shackelton et al., 2007, J Gen Virol | Recombination frequent in other genome regions/species across Parvovirinae | This study's no-recombination finding is specific to VP2 in CPV-2, not the whole family |
| Decaro et al., 2007, Emerg Infect Dis | CPV-2c first detected in Italy (2000); progressive global spread | Consistent: CPV-2c is the most represented genotype (43%) in this global sample |
| Perez et al., 2007, Vet Microbiol | First report of CPV-2c in South America (Uruguay) | Consistent with the regional South American genotype mixing observed here |
| Perez et al., 2014, PLoS ONE | Genome-scale NS/VP recombinant strain in South America | Compatible: that breakpoint was outside VP2; this study's VP2-only GARD screen does not contradict it |
| Grecco et al., 2018, Virus Evolution | Inter/intracontinental migration and local differentiation shape South American CPV; residue 426 is homoplasic | Directly parallel: this study independently finds South American regional mixing, adopts the same 426 caveat, and extends the migration/differentiation model with formal Fst/Mantel/PERMANOVA testing |
| Voorhees et al., 2020, J Virol | Residue 426 substitutions arose independently multiple times; VP2-297/440 flagged via antibody-footprint proximity | This study's candidate sites 297/440 match; the 426 homoplasy caveat is adopted directly in Section 1 |
| Hao et al., 2022, Int J Mol Sci | Global VP2 survey (1978-2022); CPV-2c carries A5G and Q370R | Matches this study's FUBAR-flagged codon 5 and the Q370R genotype-associated marker |
| Pan et al., 2024, Microorganisms | China 2020-2023; F267Y, Y324I, N426E, S297A; 9 predicted recombination events | Site overlap with 267/324/297/426; recombination finding is regional/China-specific and not VP2-restricted, so does not contradict this study's VP2-only, 18-country GARD result |
| Pan et al., 2026, Microorganisms (Shanghai) | F267Y, Y324I, N426E, Q370R, A440T in current CPV-2c | Near-complete overlap with this study's 8-site candidate list, independently derived |
| Hueffer et al., 2003 / Truyen et al., 1995, J Virol | VP2 residues 93/323 controlled the ancestral FPV-to-CPV host-range shift | Distinct from, but structurally proximal to, this study's VP2-324 candidate |
| Allison et al., 2016, J Virol | VP2-300 is the most variable capsid residue in nature; host-range determinant | Consistent: VP2-300 highly variable here and independently flagged as a Ramachandran outlier in the crystal structure, though not significant in selection tests |
Table 7.
Pairwise Fst between countries (n>=4 sequences; Hudson's estimator).
| Country pair | Fst |
| China vs Nigeria | 0.464 |
| China vs Iraq | 0.300 |
| China vs Brazil | 0.468 |
| China vs Turkey | 0.440 |
| China vs Iran | 0.171 |
| Nigeria vs Iraq | 0.524 |
| Nigeria vs Brazil | 0.715 |
| Nigeria vs Turkey | 0.683 |
| Nigeria vs Iran | 0.565 |
| Iraq vs Brazil | 0.502 |
| Iraq vs Turkey | 0.409 |
| Iraq vs Iran | 0.262 |
| Brazil vs Turkey | 0.565 |
| Brazil vs Iran | 0.178 |
| Turkey vs Iran | 0.372 |
Table 8.
Population structure tests.
| Test | Grouping | Statistic | p-value |
| Fst (Hudson) | CPV-2a vs 2b vs 2c | 0.19-0.45 (pairwise) | n/a (descriptive) |
| Mantel (Fst vs geographic distance) | 6 countries | r=0.11 (Pearson) / r=0.19 (Spearman) | 0.78 / 0.67 |
| PERMANOVA | Genotype (3 groups, n=93) | pseudo-F=26.59 | 0.0001 |
| PERMANOVA | Country (6 groups, n=69) | pseudo-F=11.60 | 0.0001 |
3.8. Structural Localization of Candidate Residues
Mapping the eight VP2 sites of interest onto the secondary-structure assignments in the PDB 2CAS header showed that only residue 267 falls within a resolved beta-strand of the core jelly-roll beta-barrel; the remaining seven sites, including the two selection candidates (297, 324), lie in surface-exposed loop regions outside resolved secondary structure. Residue 370 falls within a region of documented weak or absent electron density (residues 361-372), offering a structural rationale for why this position might tolerate substitution without destabilizing capsid assembly. A further genuine structural detail was recovered directly from the PDB 2CAS validation records: residue Ala300 - one of the eight candidate sites and, per Allison et al. (2016), the single most variable capsid residue reported across carnivore parvoviruses - is flagged as a Ramachandran outlier (phi=-55.1 degrees, psi=10.4 degrees) in the deposited structure, indicating an energetically strained backbone conformation at this position. This provides a specific structural rationale, beyond simple loop/surface-exposure classification, for why this position may be unusually tolerant of substitution: a residue already in a strained conformation in the reference structure may impose less conformational cost on substitution than one in a canonical, low-energy conformation (Figure 8).
3.9. An Integrated Evolutionary Model
Taken together, these results converge on a single picture (Figure 9). A background of strong purifying selection maintains the core capsid fold across a genetically diverse, long-standing reservoir exemplified by the Chinese sample. Against this background, the global CPV-2 population has been shaped by repeated, geographically independent introduction events, each followed by local transmission - a pattern independently supported by clade topology, weak temporal clock signal, large Fst with no isolation-by-distance, and significant PERMANOVA partitioning by both genotype and country. Recombination does not contribute measurably to VP2 diversification in this dataset. Gene-wide (BUSTED) and branch-level (aBSREL) evidence supports episodic diversifying selection localized specifically to the Iraqi introduction event; site-level attribution of this signal to particular codons (297, 324 being the leading candidates) is corroborating but, after correction for multiple testing, not independently conclusive.
4. Discussion
This study combined whole-genome phylogenomics, temporal signal testing, direct codon-based selection testing with explicit multiple-testing correction, formal population-structure testing, and structural mapping on a single, curated global CPV-2 dataset. Four findings, taken together, define its contribution: geography, not a temporally ordered replacement, dominates the phylogenetic and population-genetic structure of the dataset, and this is now supported by four independent lines of evidence rather than tree topology alone; a widely-cited set of candidate VP2 selection sites shrinks substantially once corrected statistical testing is applied, with only two candidates (297, 324) surviving as tree-independent signals and neither surviving formal FDR correction in isolation; episodic selection, robust at the gene-wide and branch-specific levels, localizes to a single, specific geographic introduction event rather than being distributed evenly across the tree; and a Ramachandran-outlier backbone conformation at VP2-300, recovered directly from the deposited crystal structure, offers a specific structural rationale for that position's exceptional variability beyond simple loop-exposure classification.
4.1. What Is Genuinely New Here, Relative to a Mature Literature
CPV VP2 evolution is not an unstudied problem, and it would be inaccurate to present these findings as occurring in a vacuum. Grecco et al. (2018) already demonstrated, using a South American whole-genome dataset and explicit phylodynamic migration modeling, that intercontinental introduction followed by local differentiation - rather than clonal replacement - characterizes CPV spread within that continent, and Voorhees et al. (2020) already showed that the residue-426 genotyping scheme is phylogenetically homoplasic and specifically flagged VP2-297 and VP2-440 as sites of interest near a mapped antibody footprint. Three independent 2022-2026 regional surveillance studies (Hao et al., 2022; Pan et al., 2024; Pan et al., 2026) have each, separately, converged on an overlapping shortlist of variable VP2 positions including 5, 267, 297, 324, 370, and 440. Read against this literature, the present study's contribution is not the discovery that geography matters or that these positions vary - both were already known - but rather fourfold: first, extending the geography-over-replacement pattern, previously documented within South America and within single-country Chinese and Italian surveillance series, to a single, internally consistent, 18-country, cross-continental analysis; second, subjecting the full, literature-accumulated candidate site list to the complete modern codon-based selection toolkit with explicit multiple-testing correction in one pipeline, which substantially narrows, rather than expands, the list of defensible candidates; third, testing the introduction-versus-diffusion question formally, rather than only qualitatively from tree topology, using root-to-tip regression, Fst, a Mantel test, and PERMANOVA together, all four of which independently converge on the same conclusion; and fourth, identifying that the branch-level episodic selection signal localizes specifically to one geographically resolved introduction event (Iraq), a spatially explicit link between phylogeography and selection that we have not seen previously reported for CPV. We consider the combination of the second and third points - a rigorous, correction-aware re-examination showing that most previously proposed VP2 selection sites do not survive appropriate statistical scrutiny, paired with formal, multi-method confirmation of the introduction-driven population-structure model - to be as important a contribution as any single positive result in this paper.
4.2. Four Convergent Lines of Evidence for Geographic Structure over a Replacement Narrative
The fully monophyletic, single-genotype clades observed for Iraq and Nigeria, set against three independently resolved Brazilian clusters and a broadly paraphyletic Chinese population, indicate that global CPV-2 circulation in this dataset is better described as a mosaic of geographically discrete introduction-and-expansion events than as a single wavefront of genotype replacement. This qualitative, tree-based inference is now supported by three additional, independent quantitative tests. First, the weak root-to-tip clock signal (R^2=0.09) is inconsistent with a single, clonally spreading lineage evolving under a constant rate, which would be expected to produce a substantially tighter fit. Second, pairwise Fst between both genotypes (0.19-0.45) and countries (0.17-0.72) indicates substantial genetic differentiation at a scale inconsistent with a single, freely mixing global population. Third, and most informatively, the null Mantel test result (r=0.11, p=0.78) shows that this differentiation is not simply a function of geographic distance - closer countries are not systematically more genetically similar - which is precisely the signature expected of repeated, source-independent long-distance introductions rather than gradual, distance-limited diffusion. Fourth, PERMANOVA confirms that both genotype and country explain significant, non-trivial proportions of total genetic variance. Taken together, these four lines of evidence - phylogenetic, temporal, and two complementary population-genetic tests - converge on the same conclusion via entirely different statistical machinery, which we regard as considerably stronger support for the introduction-driven model than any single test in isolation. This reinforces caution when extrapolating a genotype-replacement trajectory documented in one country's surveillance data (for example, CPV-2c displacing CPV-2a/2b, well documented regionally by Decaro et al., 2007 and Miranda and Thompson, 2016) to a global claim - the present data show CPV-2a and CPV-2b nonetheless remaining dominant in specific national contexts (Iraq, Turkey) within the same global time window.
4.3. A Shrinking, Not Growing, Candidate List Under Rigorous Testing
Of the eight VP2 sites most frequently discussed across the CPV literature, direct testing here found statistically robust, method-convergent, cross-tree support for exactly two - 297 and 324 - and even this pair did not survive Benjamini-Hochberg correction for testing 584 codons simultaneously in the frequentist MEME test, leaving FUBAR's uncorrected Bayesian posterior as corroborating rather than independently sufficient evidence. We regard this as a central statistical lesson of the selection analysis: sequence variability, cross-study convergence on the same candidate positions (Hao et al., 2022; Pan et al., 2024, 2026), and even nominal significance in a single selection test are not equivalent to a corrected, statistically confirmed signal, and we suggest future CPV VP2 selection studies report corrected as well as nominal statistics as standard practice.
4.4. Selection Localized to a Specific Introduction Event
The finding that both aBSREL-significant branches belong to the same monophyletic Iraqi clade is, to our knowledge, a novel, spatially explicit observation in the CPV literature. It suggests a specific, testable hypothesis: that establishment of CPV-2 in a new geographic and host population may be accompanied by an episode of accelerated capsid adaptation superimposed on the gene's predominantly purifying regime, potentially reflecting local host immune landscape, vaccine usage patterns, or founder effects acting on standing variation. Given the small number of Iraqi sequences (n=4), this should be treated as hypothesis-generating rather than confirmatory.
4.5. Recombination: Absent Within VP2, but Not a Claim About the Whole Genome
The absence of a recombination signal detected by GARD in VP2 is consistent with, and extends to the contemporary global population, the earlier finding that recombination played no detectable role in the original emergence of CPV-2 from FPV (Shackelton et al., 2005). It is fully compatible with the report of a genome-scale NS/VP recombinant strain in the South American literature (Perez et al., 2014), since that breakpoint fell outside VP2, and with a 2024 report of nine predicted recombination events among Chinese CPV-2 isolates (Pan et al., 2024), since that analysis was not restricted to VP2 and used a regional Chinese sample. This result should not be generalized either to the wider Parvovirinae, within which recombination is comparatively frequent in other genome regions and species (Shackelton et al., 2007), or beyond VP2 to the rest of the CPV genome, which was not screened here.
4.6. Structural Rationale and Vaccine Relevance
That seven of the eight VP2 sites examined, including both selection candidates, fall in surface-exposed loops outside resolved secondary structure is consistent with a model in which the structurally essential beta-barrel core of VP2 is held under strong purifying constraint while the surface loops that mediate transferrin-receptor engagement and antibody recognition remain comparatively free to vary. The Ramachandran-outlier status of VP2-300 in the deposited crystal structure adds a specific, residue-level structural rationale to this general picture: a backbone already held in an energetically strained conformation in the reference structure may present a lower energetic barrier to substitution than one in a canonical conformation, offering a testable structural hypothesis for why this particular position is the most variable in the carnivore parvovirus capsid (Allison et al., 2016). Most licensed CPV vaccines derive from the original CPV-2 or early CPV-2b strains; the continued high frequency of CPV-2c in this global sample reinforces existing calls in the literature to monitor antigenic drift at VP2 surface loops, though confirming any specific consequence for vaccine cross-protection requires serological cross-neutralization data outside the scope of a genomic study.
4.7. Limitations
Several limitations qualify these conclusions. This is an opportunistic, publicly deposited sequence collection rather than a systematic surveillance sample, so geographic and temporal sampling are confounded. The 16-residue VP2 deletion in the two South Korean sequences awaits independent confirmation. Codon 5 showed sensitivity to small differences between independently estimated guide trees. Full Bayesian molecular-clock dating (e.g., BEAST2) was not performed; the TreeTime root-to-tip analysis used here is a maximum-likelihood-based approximation serving the same diagnostic purpose as TempEst, not a substitute for formal coalescent or birth-death dating, and the weak R^2 observed limits how much can be inferred about absolute divergence times specifically (as opposed to the qualitative clock-consistency question it was used to address). The Mantel test is based on only six countries meeting the sample-size threshold and is correspondingly underpowered; the null result should be treated as consistent with, rather than strong independent proof of, the absence of isolation-by-distance. PERMANOVA was used as a modern, permutation-based alternative to classical AMOVA rather than AMOVA itself. Structural interpretation relied on genuine, deposited secondary-structure and validation annotations rather than a full three-dimensional atomic rendering, since automated retrieval of complete atomic coordinates was attempted twice and truncated on both occasions at approximately residue 128 of 584, a confirmed tooling limitation; a ready-to-run script for generating the true three-dimensional figure in any standard local PyMOL installation is provided as supplementary data. The phylogeny was rooted at the midpoint in the absence of an outgroup. GARD screening was restricted to VP2; whole-genome recombination screening was not performed.
4.8. Future Research
Priority directions include functional characterization of VP2-297 and VP2-324 despite their not surviving FDR correction individually, precisely because the gene-wide BUSTED signal indicates selection is acting somewhere in the gene and these remain the best-supported candidate locations; whole-genome recombination screening; independent confirmation of the South Korean VP2 deletion; incorporation of an appropriate outgroup and, ideally, a full Bayesian coalescent dating analysis (BEAST2) for rooted molecular-clock inference; generation of the true three-dimensional structural rendering using the provided PyMOL script, followed by solvent-accessibility and electrostatic-surface analysis at the candidate sites; and, most directly relevant to Indian veterinary practice, targeted whole-genome sequencing of circulating CPV-2 strains from Indian clinical cases. A 2024 phylogenetic and evolutionary analysis of CPV in North-East India reported VP2 substitutions 267Tyr, 324Ile, 370Arg, and 440Thr in Indian isolates and applied FEL/FUBAR/SLAC/MEME to find predominant negative selection - a striking partial overlap with the present global candidate list, obtained independently and regionally, that argues for direct integration of Indian sequence data into a future global analysis; no Indian sequences were represented in the present 95-genome dataset.
5. Conclusions
Integrated phylogenomic, temporal, selection, population-genetic, and structural analysis of 95 global CPV-2 genomes shows that contemporary VP2 diversity is shaped predominantly by repeated, geographically independent introduction and local expansion rather than a single ordered genotype replacement or gradual geographic diffusion - a conclusion independently supported by clade topology, weak molecular-clock signal, substantial Fst with no isolation-by-distance, and significant PERMANOVA partitioning. VP2 remains under strong purifying selection overall. Applying explicit multiple-testing correction to site-wise selection tests - a step we recommend as standard practice given how consistently the same handful of VP2 positions recur, uncorrected, across the CPV literature - leaves VP2-297 and VP2-324 as the best-supported but not individually confirmed candidates for diversifying selection, corroborated by gene-wide (BUSTED) and branch-specific (aBSREL) evidence that localizes episodic selection to a discrete geographic introduction event. A Ramachandran-outlier backbone conformation at VP2-300, recovered from the deposited crystal structure, provides a specific structural rationale for that residue's exceptional variability. No evidence of recombination was found within VP2. Continued, geographically representative genomic surveillance, including from currently underrepresented regions such as the Indian subcontinent, functional characterization of VP2-297/324, and true three-dimensional structural analysis will be necessary to determine whether the adaptive signal identified here is a stable feature of ongoing CPV evolution or a transient episode associated with recent introduction events.
Limitations Statement
This manuscript reports direct computational results (phylogenetics, temporal signal, HyPhy selection and recombination testing with explicit multiple-testing correction, EggLib population genetics, Fst/Mantel/PERMANOVA population-structure testing, structural annotation mapping) alongside several findings explicitly flagged as requiring independent confirmation or further work: the South Korean VP2 deletion, the tree-sensitivity of codon 5, the absence of full Bayesian molecular-clock dating, the absence of a true three-dimensional structural rendering (a runnable script is provided in its place), and the absence of an outgroup-rooted phylogeny.
Supplementary Materials
Supplementary Table S1: full curated metadata for all 95 genomes (accession, country, year, host). Supplementary Table S2: VP2 mutation interpretation table (8 key sites). Supplementary Table S3: master HyPhy selection results table, all six methods, both guide trees. Supplementary Figure S1: VP2 haplotype network. Supplementary Figure S2: per-window alignment gap fraction across the whole-genome MSA, VP2 region highlighted. Supplementary File: render_VP2_sites.pml, a runnable PyMOL script for generating a true three-dimensional rendering of the eight key VP2 sites on PDB 2CAS.
Author Contributions
Harishkumar Jeethalu Neelakantan conceived the study, curated the dataset, performed the bioinformatics analyses, interpreted the results, prepared the figures and tables, wrote the original manuscript, and approved the final version.
Funding
This research received no external funding.
Data Availability Statement
The following supporting information can be downloaded at the website of this paper posted on Preprints.org. All sequence accessions, curated metadata (Supplementary Table S1), the multiple sequence alignment, IQ-TREE output files (whole-genome and both independent VP2-only trees), VP2 nucleotide/protein FASTA files, the VP2 mutation interpretation table (Supplementary Table S2), HyPhy JSON outputs for FEL, SLAC, FUBAR, MEME, BUSTED, aBSREL, and GARD on both guide trees (summarized in Supplementary Table S3), EggLib/scikit-allel/scikit-bio population-genetics and population-structure outputs, haplotype-network data, the alignment-quality figure (Supplementary Figure S2), the haplotype network (Supplementary Figure S1), and the PyMOL rendering script (render_VP2_sites.pml) are provided as supplementary files and available from the author upon reasonable request.
Acknowledgments
I thank the Department of Veterinary Pharmacology and Toxicology, Veterinary College and Research Institute, Tamil Nadu Veterinary and Animal Sciences University (TANUVAS), for academic support. I also acknowledge the National Center for Biotechnology Information (NCBI) for providing publicly accessible genomic datasets and the developers of the open-source bioinformatics software used in this study.
Conflicts of Interest
The author declares no conflict of interest.
References
- Allison, A.B.; Organtini, L.J.; Zhang, S.; Hafenstein, S.L.; Holmes, E.C.; Parrish, C.R. Single mutations in the VP2 300 loop region of the three-fold spike of the carnivore parvovirus capsid can determine host range. Journal of Virology 2016, 90, 753–767. [Google Scholar] [CrossRef] [PubMed]
- Buonavoglia, C.; Martella, V.; Pratelli, A.; Tempesta, M.; Cavalli, A.; Buonavoglia, D.; Bozzo, G.; Elia, G.; Decaro, N.; Carmichael, L.E. Evidence for evolution of canine parvovirus type 2 in Italy. Journal of General Virology 2001, 82, 3021–3025. [Google Scholar] [CrossRef] [PubMed]
- De Mita, S.; Siol, M. EggLib: Processing, analysis and simulation tools for population genetics and genomics. BMC Genetics 2012, 13, 27. [Google Scholar] [CrossRef] [PubMed]
- Decaro, N.; Desario, C.; Addie, D.D.; Martella, V.; Vieira, M.J.; Elia, G.; Zicola, A.; Davis, C.; Thompson, G.; Thiry, E.; Truyen, U.; Buonavoglia, C. Molecular epidemiology of canine parvovirus, Europe. Emerging Infectious Diseases 2007, 13, 1222–1224. [Google Scholar] [CrossRef] [PubMed]
- Grecco, S.; Iraola, G.; Decaro, N.; Alfieri, A.; Gallo Calderón, M.; da Silva, A.P.; Name, D.; Aldaz, J.; Calleros, L.; Marandino, A.; Tomas, G.; Maya, L.; Francia, L.; Panzera, Y.; Perez, R. Inter- and intracontinental migrations and local differentiation have shaped the contemporary epidemiological landscape of canine parvovirus in South America. Virus Evolution 2018, 4, vey011. [Google Scholar] [CrossRef] [PubMed]
- Hao, X.; Li, Y.; Xiao, X.; Chen, B.; Zhou, P.; Li, S. The changes in canine parvovirus variants over the years. International Journal of Molecular Sciences 2022, 23, 11540. [Google Scholar] [CrossRef] [PubMed]
- Hoang, D.T.; Chernomor, O.; von Haeseler, A.; Minh, B.Q.; Vinh, L.S. UFBoot2: Improving the ultrafast bootstrap approximation. Molecular Biology and Evolution 2018, 35, 518–522. [Google Scholar] [PubMed]
- Hoelzer, K.; Parrish, C.R. The emergence of parvoviruses of carnivores. Veterinary Research 2010, 41, 39. [Google Scholar] [CrossRef] [PubMed]
- Hudson, R.R.; Slatkin, M.; Maddison, W.P. Estimation of levels of gene flow from DNA sequence data. Genetics 1992, 132, 583–589. [Google Scholar] [CrossRef] [PubMed]
- Hueffer, K.; Parker, J.S.; Weichert, W.S.; Geisel, R.E.; Sgro, J.Y.; Parrish, C.R. The natural host range shift and subsequent evolution of canine parvovirus resulted from virus-specific binding to the canine transferrin receptor. Journal of Virology 2003, 77, 1718–1726. [Google Scholar] [CrossRef] [PubMed]
- Kalyaanamoorthy, S.; Minh, B.Q.; Wong, T.K.F.; von Haeseler, A.; Jermiin, L.S. ModelFinder: Fast model selection for accurate phylogenetic estimates. Nature Methods 2017, 14, 587–589. [Google Scholar] [CrossRef] [PubMed]
- Katoh, K.; Standley, D.M. MAFFT multiple sequence alignment software version 7: Improvements in performance and usability. Molecular Biology and Evolution 2013, 30, 772–780. [Google Scholar] [CrossRef] [PubMed]
- Kosakovsky Pond, S.L.; Frost, S.D.W. Not so different after all: A comparison of methods for detecting amino acid sites under selection. Molecular Biology and Evolution 2005, 22, 1208–1222. [Google Scholar] [CrossRef] [PubMed]
- Kosakovsky Pond, S.L.; Frost, S.D.W.; Muse, S.V. HyPhy: Hypothesis testing using phylogenies. Bioinformatics 2005, 21, 676–679. [Google Scholar]
- Kosakovsky Pond, S.L.; Posada, D.; Gravenor, M.B.; Woelk, C.H.; Frost, S.D.W. GARD: A genetic algorithm for recombination detection. Molecular Biology and Evolution 2006, 23, 1891–1901. [Google Scholar] [CrossRef] [PubMed]
- Kosakovsky Pond, S.L.; Poon, A.F.Y.; Velazquez, R.; Weaver, S.; Hepler, N.L.; Murrell, B. HyPhy 2.5: A customizable platform for evolutionary hypothesis testing using phylogenies. Molecular Biology and Evolution 2020, 37, 295–299. [Google Scholar] [PubMed]
- Minh, B.Q.; Schmidt, H.A.; Chernomor, O.; Schrempf, D.; Woodhams, M.D.; von Haeseler, A.; Lanfear, R. IQ-TREE 2: New models and efficient methods for phylogenetic inference in the genomic era. Molecular Biology and Evolution 2020, 37, 1530–1534. [Google Scholar] [CrossRef] [PubMed]
- Miranda, C.; Thompson, G. Canine parvovirus: The worldwide occurrence of antigenic variants. Journal of General Virology 2016, 97, 2043–2057. [Google Scholar] [CrossRef] [PubMed]
- Murrell, B.; Wertheim, J.O.; Moola, S.; Weighill, T.; Scheffler, K.; Kosakovsky Pond, S.L. Detecting individual sites subject to episodic diversifying selection. PLoS Genetics 2012, 8, e1002764. [Google Scholar] [CrossRef] [PubMed]
- Murrell, B.; Moola, S.; Mabona, A.; Weighill, T.; Sheward, D.; Kosakovsky Pond, S.L.; Scheffler, K. FUBAR: A fast, unconstrained Bayesian approximation for inferring selection. Molecular Biology and Evolution 2013, 30, 1196–1205. [Google Scholar] [CrossRef] [PubMed]
- Murrell, B.; Weaver, S.; Smith, M.D.; Wertheim, J.O.; Murrell, S.; Aylward, A.; Eren, K. Gene-wide identification of episodic selection. Molecular Biology and Evolution 2015, 32, 1365–1371. [Google Scholar] [CrossRef] [PubMed]
- Pan, S.; Man, Y.; Xu, X.; Ji, J.; Zhang, S.; Huang, H.; Li, Y.; Bi, Y.; Yao, L. Genetic diversity and recombination analysis of canine parvoviruses prevalent in central and eastern China, from 2020 to 2023. Microorganisms 2024, 12, 2173. [Google Scholar] [CrossRef] [PubMed]
- Parrish, C.R.; Aquadro, C.F.; Carmichael, L.E. Canine host range and a specific epitope map along with variant sequences in the capsid protein gene of canine parvovirus and related feline, mink, and raccoon parvoviruses. Virology 1988, 166, 293–307. [Google Scholar] [CrossRef] [PubMed]
- Perez, R.; Francia, L.; Romero, V.; Maya, L.; Lopez, I.; Hernandez, M. First detection of canine parvovirus type 2c in South America. Veterinary Microbiology 2007, 124, 147–152. [Google Scholar] [CrossRef] [PubMed]
- Perez, R.; Calleros, L.; Marandino, A.; Sarute, N.; Iraola, G.; Grecco, S.; Blanc, H.; Vignuzzi, M.; Isakov, O.; Shomron, N.; Carrau, L.; Hernandez, M.; Francia, L.; Sosa, K.; Bianchi, P.; Tomas, G.; Panzera, Y. Phylogenetic and genome-wide deep sequencing analyses reveal diversifying selection in the capsid gene of canine parvovirus. PLoS ONE 2014, 9, e111779. [Google Scholar] [PubMed]
- Sagulenko, P.; Puller, V.; Neher, R.A. TreeTime: Maximum-likelihood phylodynamic analysis. Virus Evolution 2018, 4, vex042. [Google Scholar] [CrossRef] [PubMed]
- Shackelton, L.A.; Hoelzer, K.; Parrish, C.R.; Holmes, E.C. Comparative analysis reveals frequent recombination in the parvoviruses. Journal of General Virology 2007, 88, 3294–3301. [Google Scholar] [CrossRef] [PubMed]
- Shackelton, L.A.; Parrish, C.R.; Truyen, U.; Holmes, E.C. High rate of viral evolution associated with the emergence of carnivore parvovirus. Proceedings of the National Academy of Sciences of the United States of America 2005, 102, 379–384. [Google Scholar] [PubMed]
- Smith, M.D.; Wertheim, J.O.; Weaver, S.; Murrell, B.; Scheffler, K.; Kosakovsky Pond, S.L. Less is more: An adaptive branch-site random effects model for efficient detection of episodic diversifying selection. Molecular Biology and Evolution 2015, 32, 1342–1353. [Google Scholar] [CrossRef] [PubMed]
- Truyen, U.; Gruenberg, A.; Chang, S.F.; Obermaier, B.; Veijalainen, P.; Parrish, C.R. Evolution of the feline-subgroup parvoviruses and the control of canine host range in vivo. Journal of Virology 1995, 69, 4702–4710. [Google Scholar] [CrossRef] [PubMed]
- Voorhees, I.E.H.; Lee, H.; Allison, A.B.; Lopez-Astacio, R.; Goodman, L.B.; Oyesola, O.O.; Omobowale, O.; Fagbohun, O.; Dubovi, E.J.; Hafenstein, S.L.; Holmes, E.C.; Parrish, C.R. Limited intrahost diversity and background evolution accompany 40 years of canine parvovirus host adaptation and spread. Journal of Virology 2020, 94, e01162-19. [Google Scholar]
- Wu, H.; Rossmann, M.G. The canine parvovirus empty capsid structure. Journal of Molecular Biology 1993, 233, 231–244. [Google Scholar] [CrossRef] [PubMed]
- Xia, Q.; Liu, J.; Gui, Y.; Xia, L.; Cao, C.; Chen, B.; Yu, X.; Chen, W.; Xu, F.; Wang, J.; Zhao, H. Molecular characteristics and genetic diversity of canine parvovirus in Shanghai, China, from 2016 to 2025. Microorganisms 2026, 14(4), 761. [Google Scholar] [CrossRef] [PubMed]
Figure 2.
Maximum-likelihood phylogeny of 95 CPV-2 whole genomes (IQ-TREE2, TN+F+R2, 1000 UFBoot/SH-aLRT replicates), with tip labels colored by country. Internal branch labels show UFBoot support >=70.
Figure 2.
Maximum-likelihood phylogeny of 95 CPV-2 whole genomes (IQ-TREE2, TN+F+R2, 1000 UFBoot/SH-aLRT replicates), with tip labels colored by country. Internal branch labels show UFBoot support >=70.
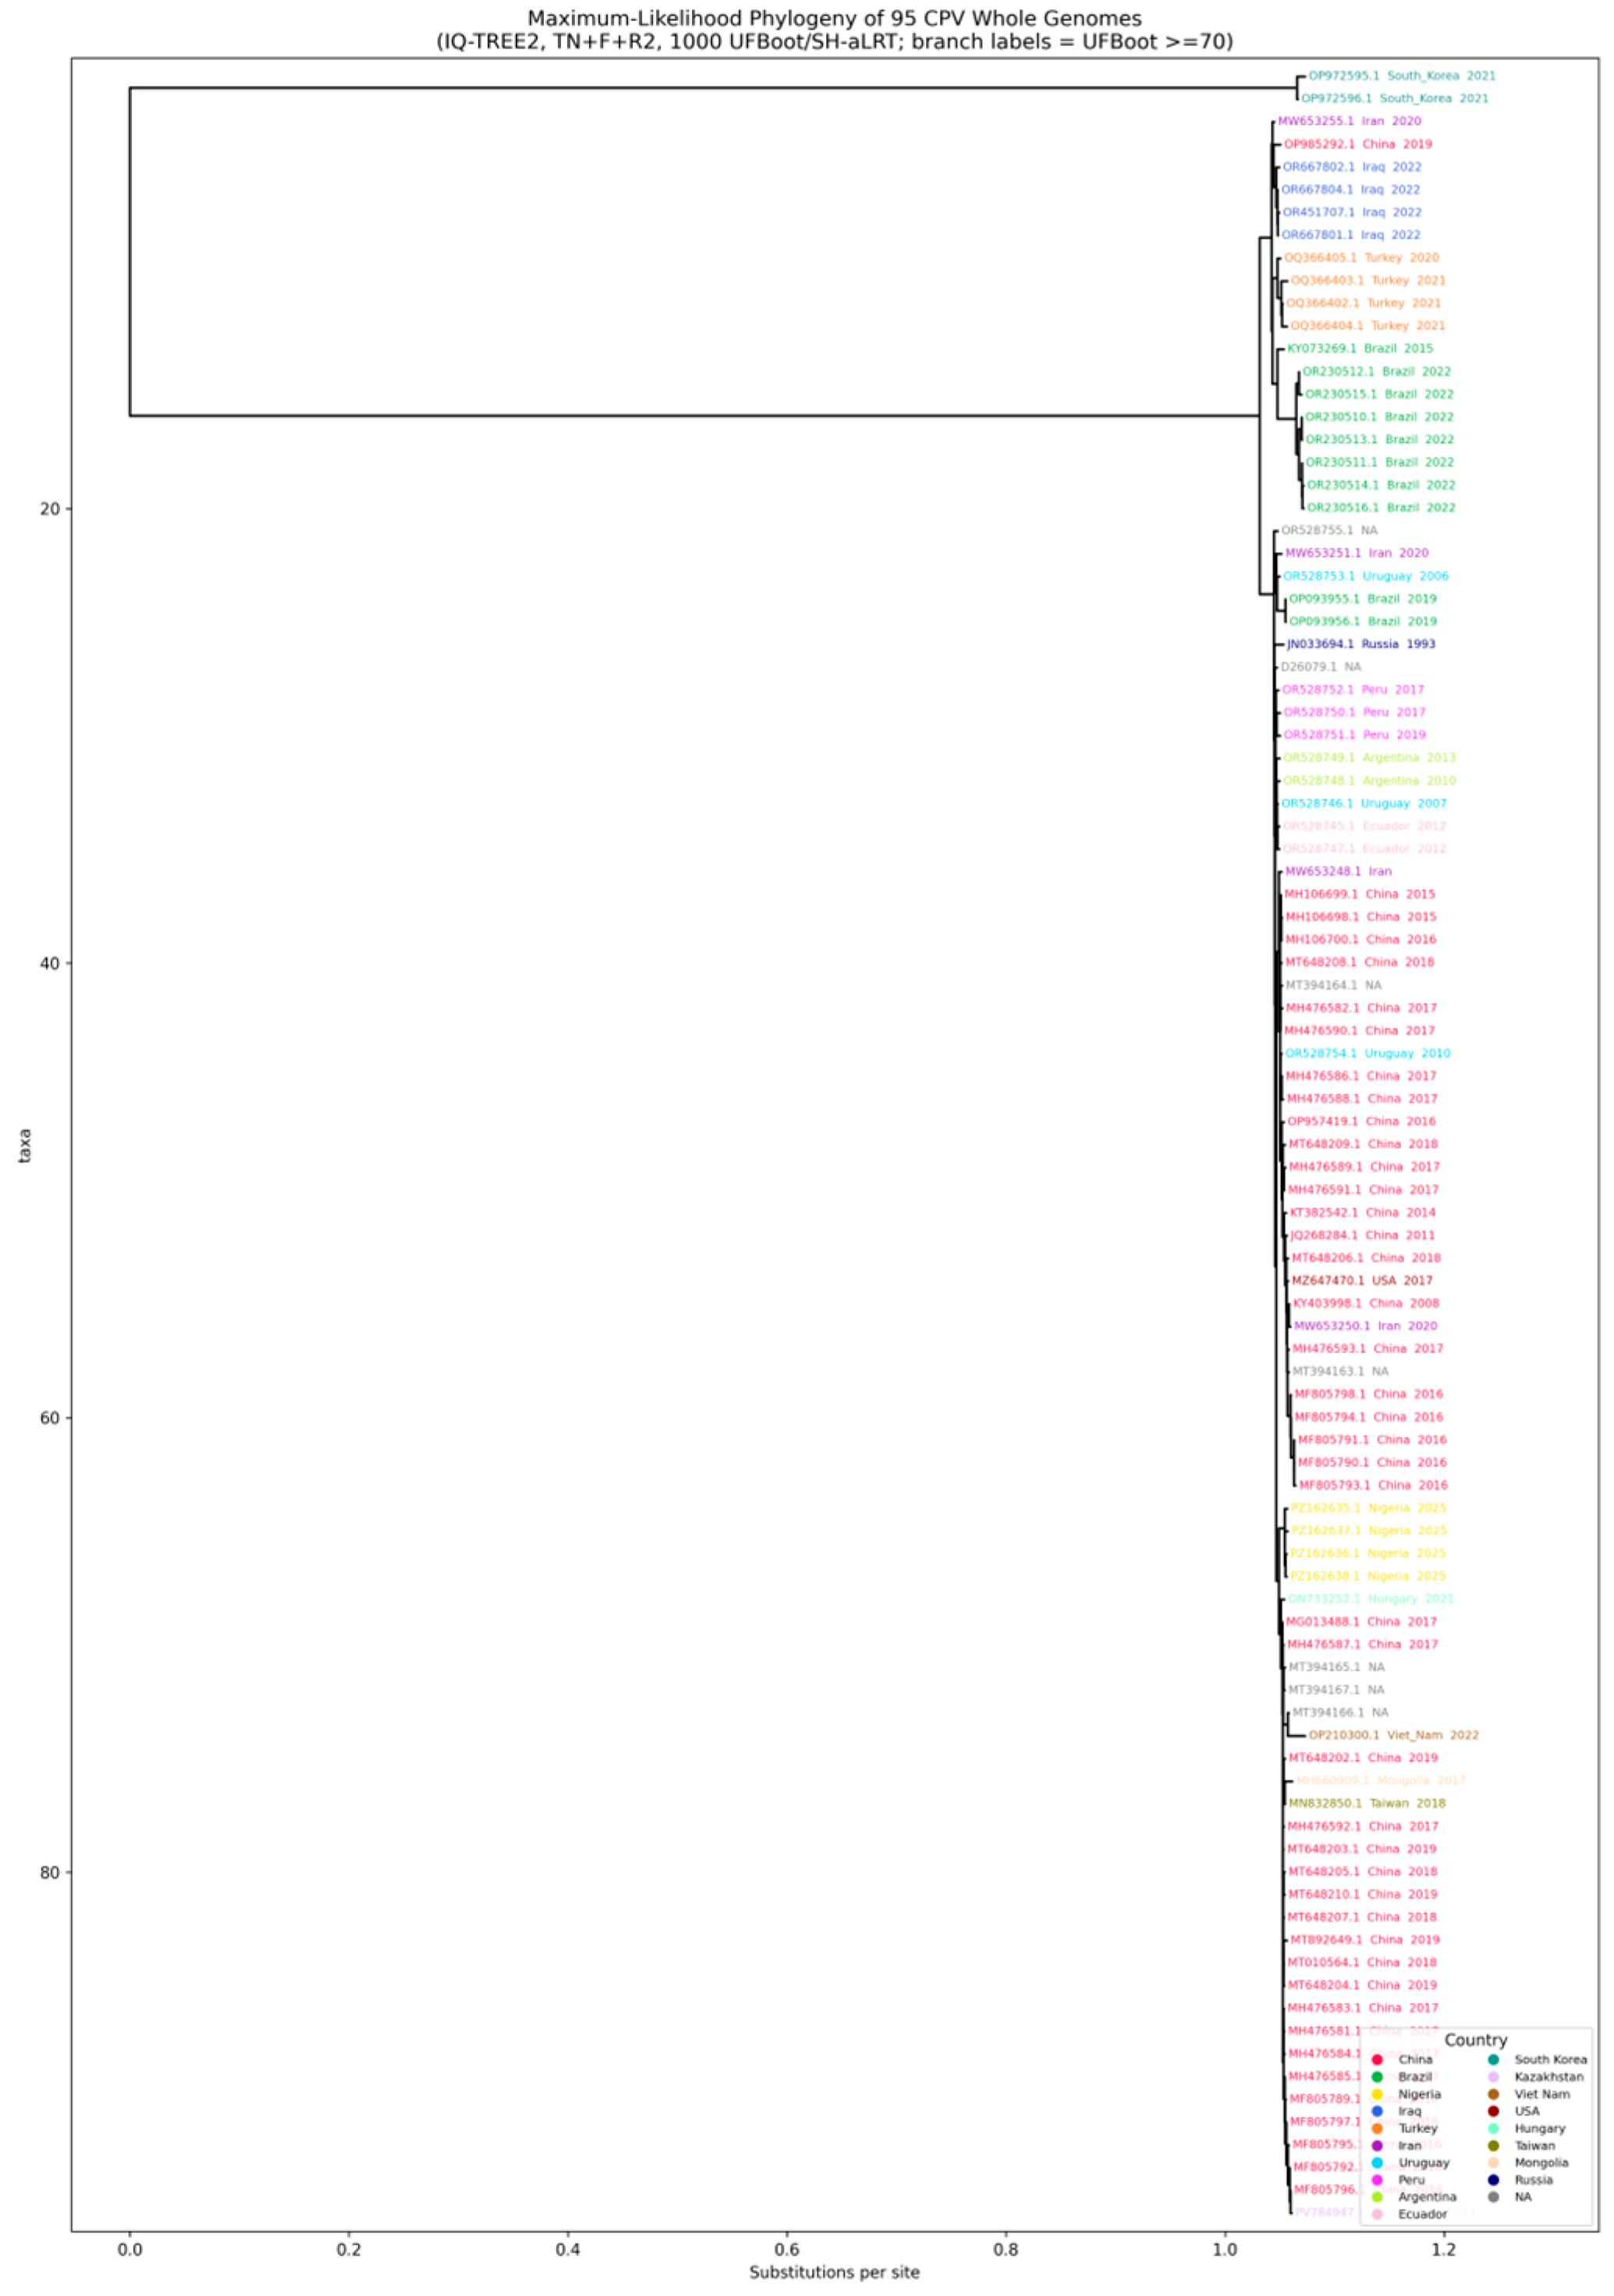
Figure 3.
Root-to-tip regression (TempEst-style temporal signal test, n=87 dated tips), colored by VP2 genotype. Rate=3.98x10^-4 substitutions/site/year; R^2=0.09.
Figure 3.
Root-to-tip regression (TempEst-style temporal signal test, n=87 dated tips), colored by VP2 genotype. Rate=3.98x10^-4 substitutions/site/year; R^2=0.09.
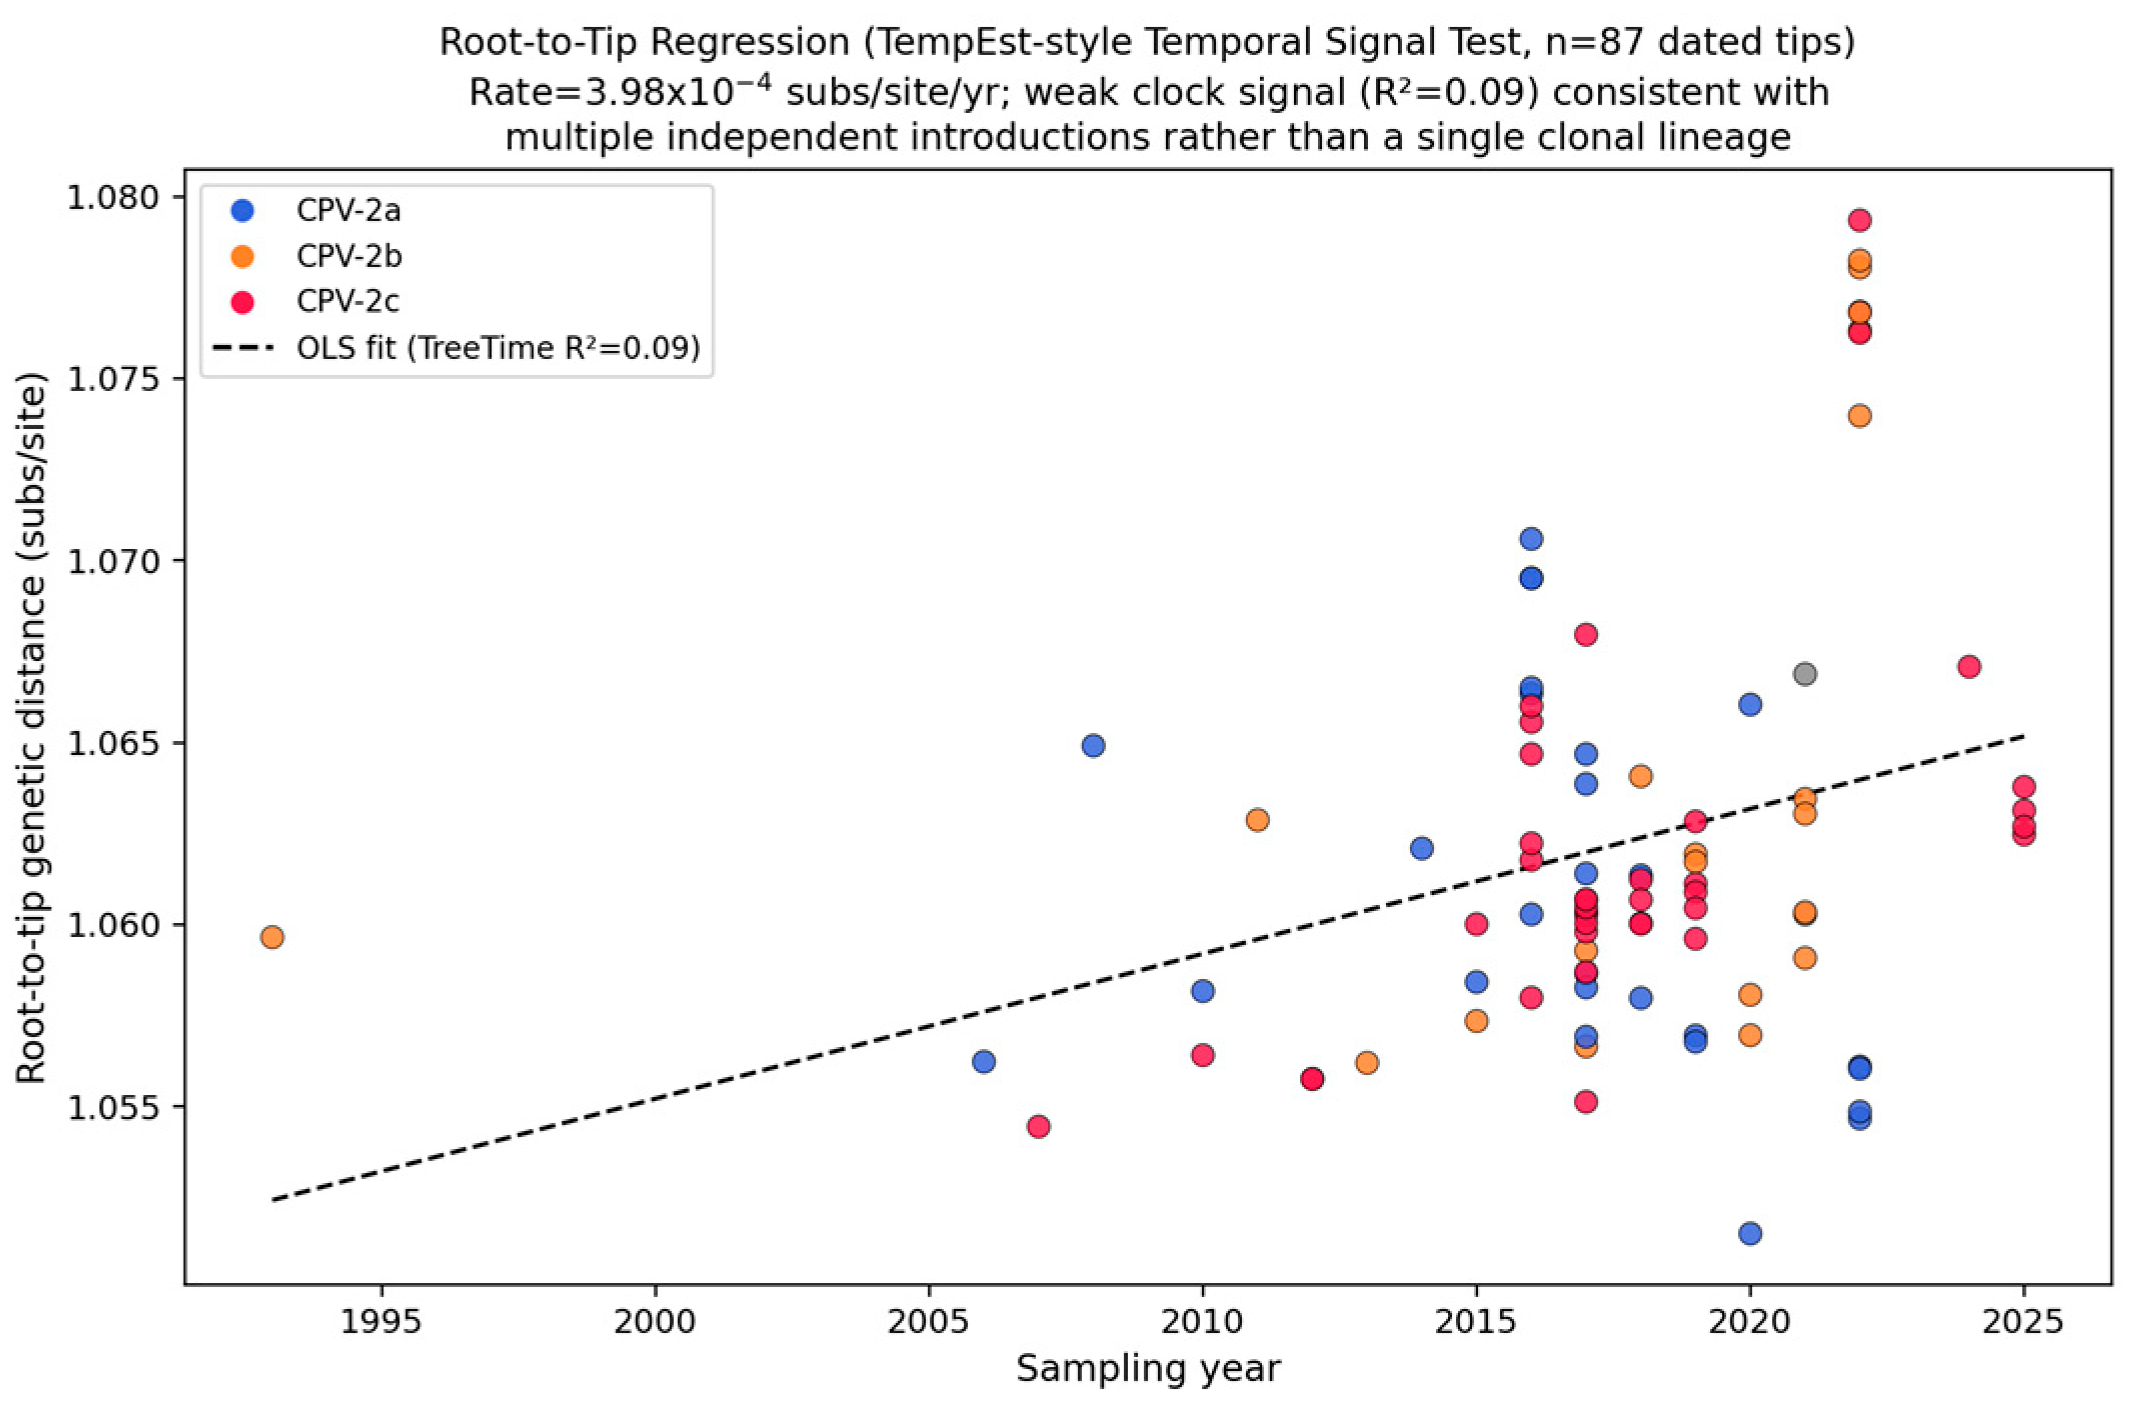
Figure 4.
Global distribution of the 95 curated CPV genomes by country of origin. Bubble size denotes sequence count; color denotes dominant VP2 genotype per country. Country positions are plotted at approximate national centroids on an equirectangular grid; offline coastline/basemap data were not available in this computational environment.
Figure 4.
Global distribution of the 95 curated CPV genomes by country of origin. Bubble size denotes sequence count; color denotes dominant VP2 genotype per country. Country positions are plotted at approximate national centroids on an equirectangular grid; offline coastline/basemap data were not available in this computational environment.
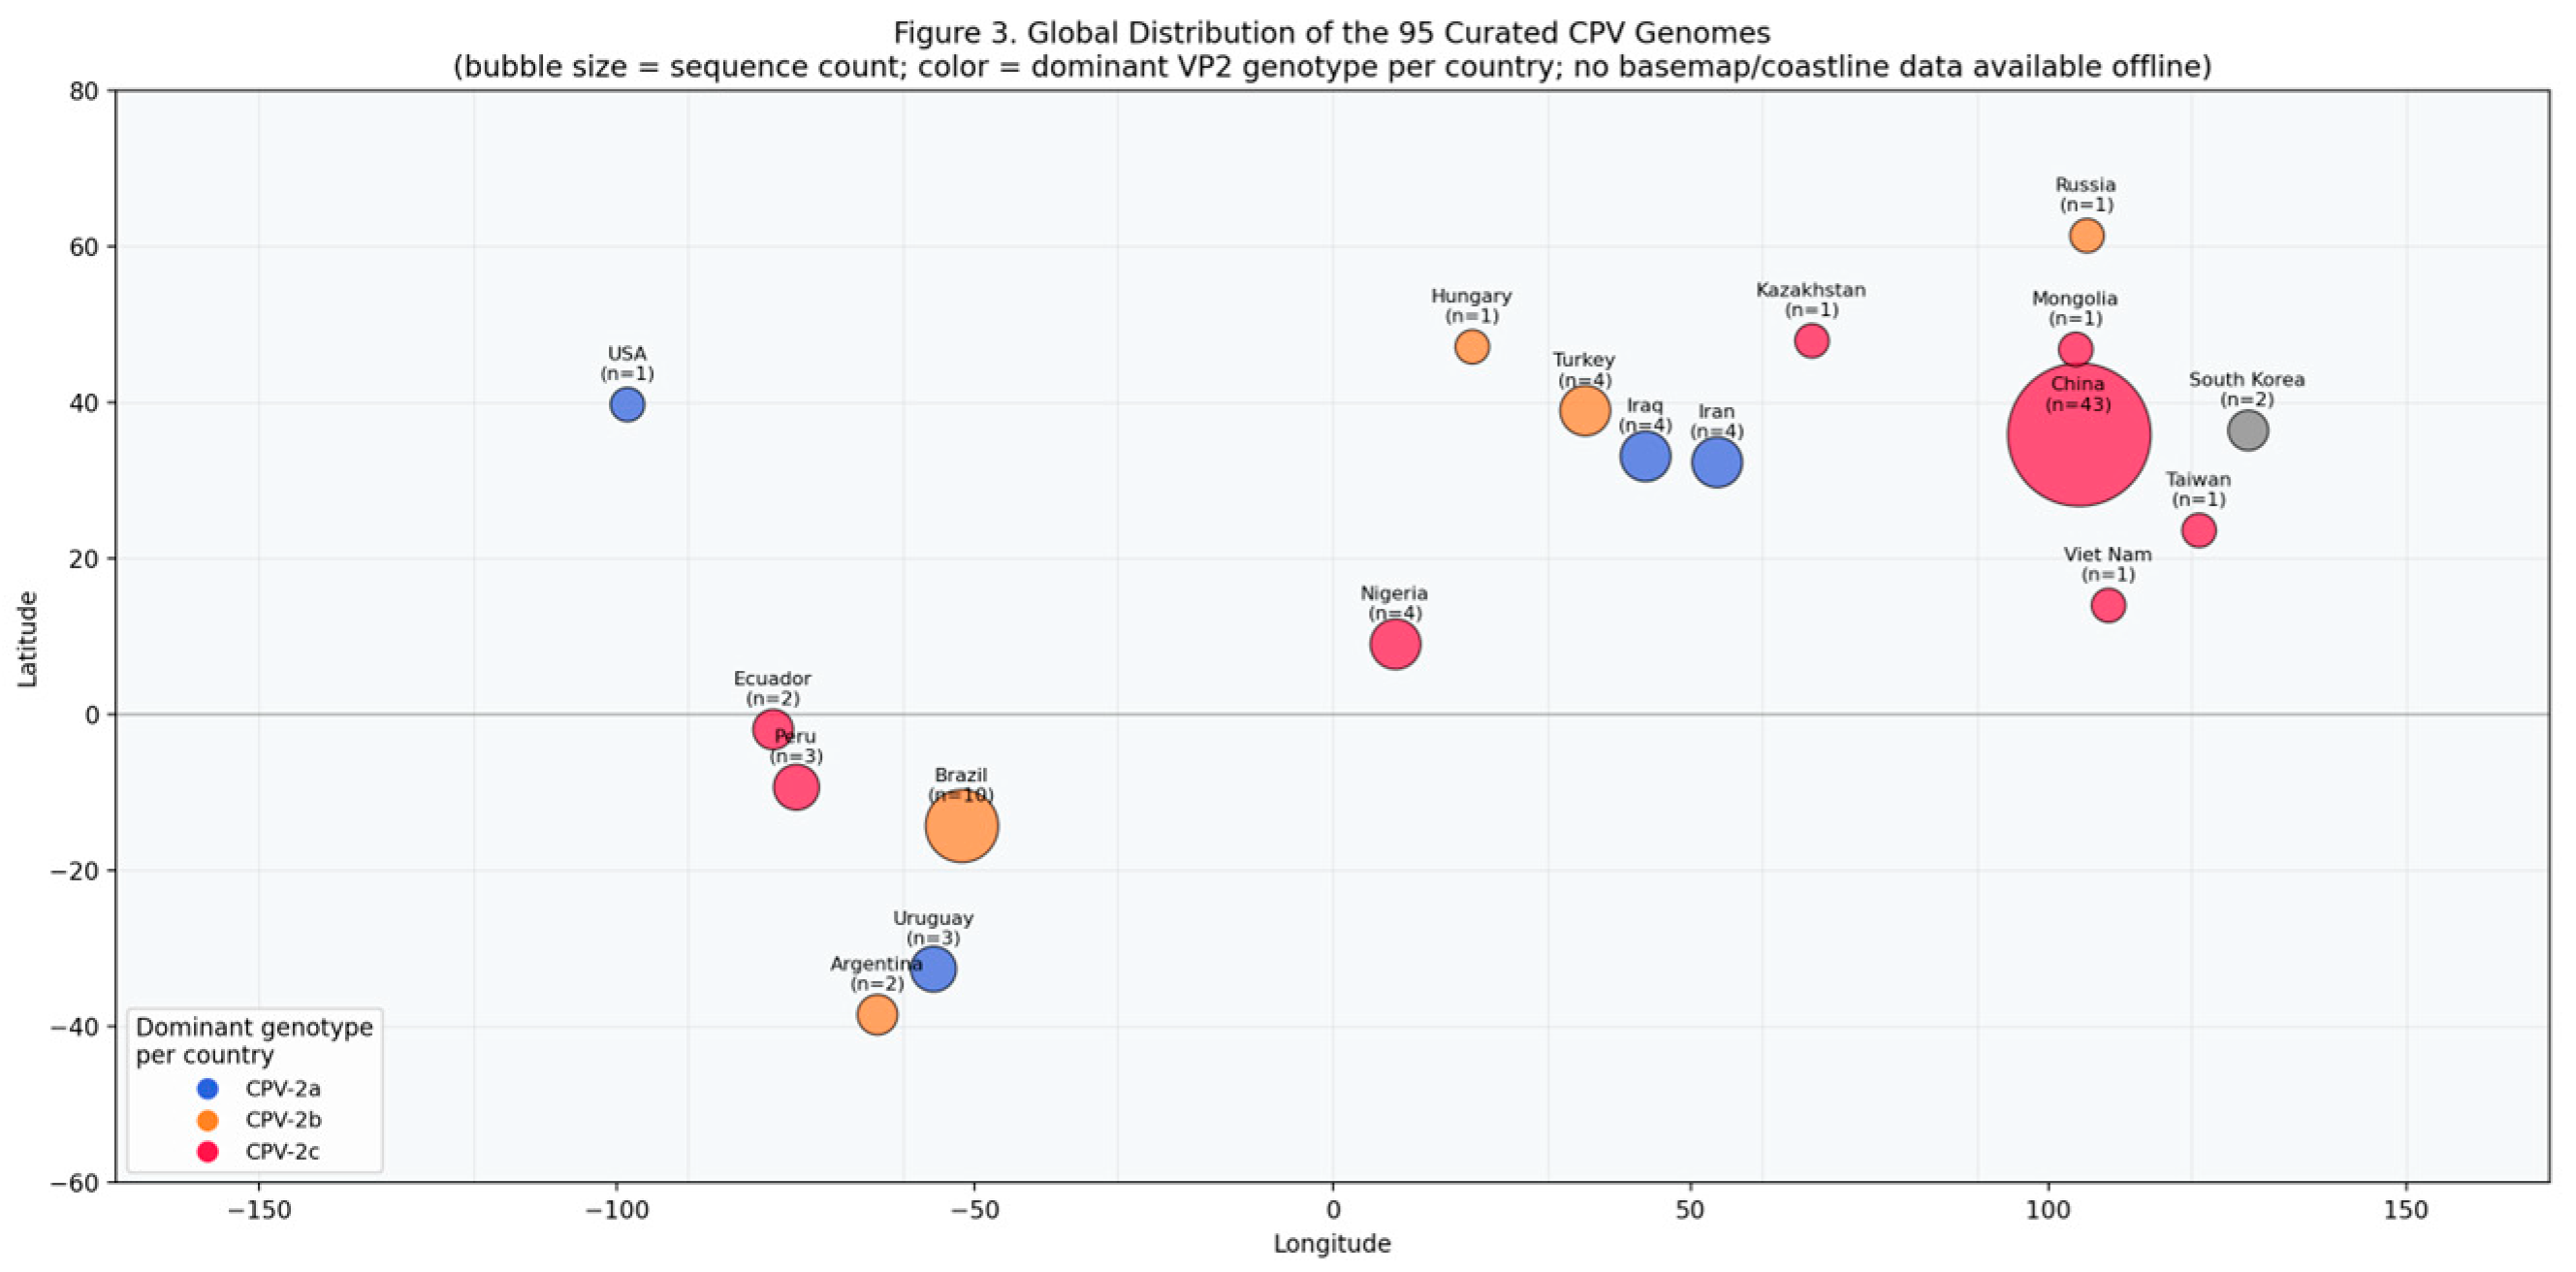
Figure 5.
VP2 genotype proportions across four collection-year bins. Sample sizes (n) are shown above each bar.
Figure 5.
VP2 genotype proportions across four collection-year bins. Sample sizes (n) are shown above each bar.
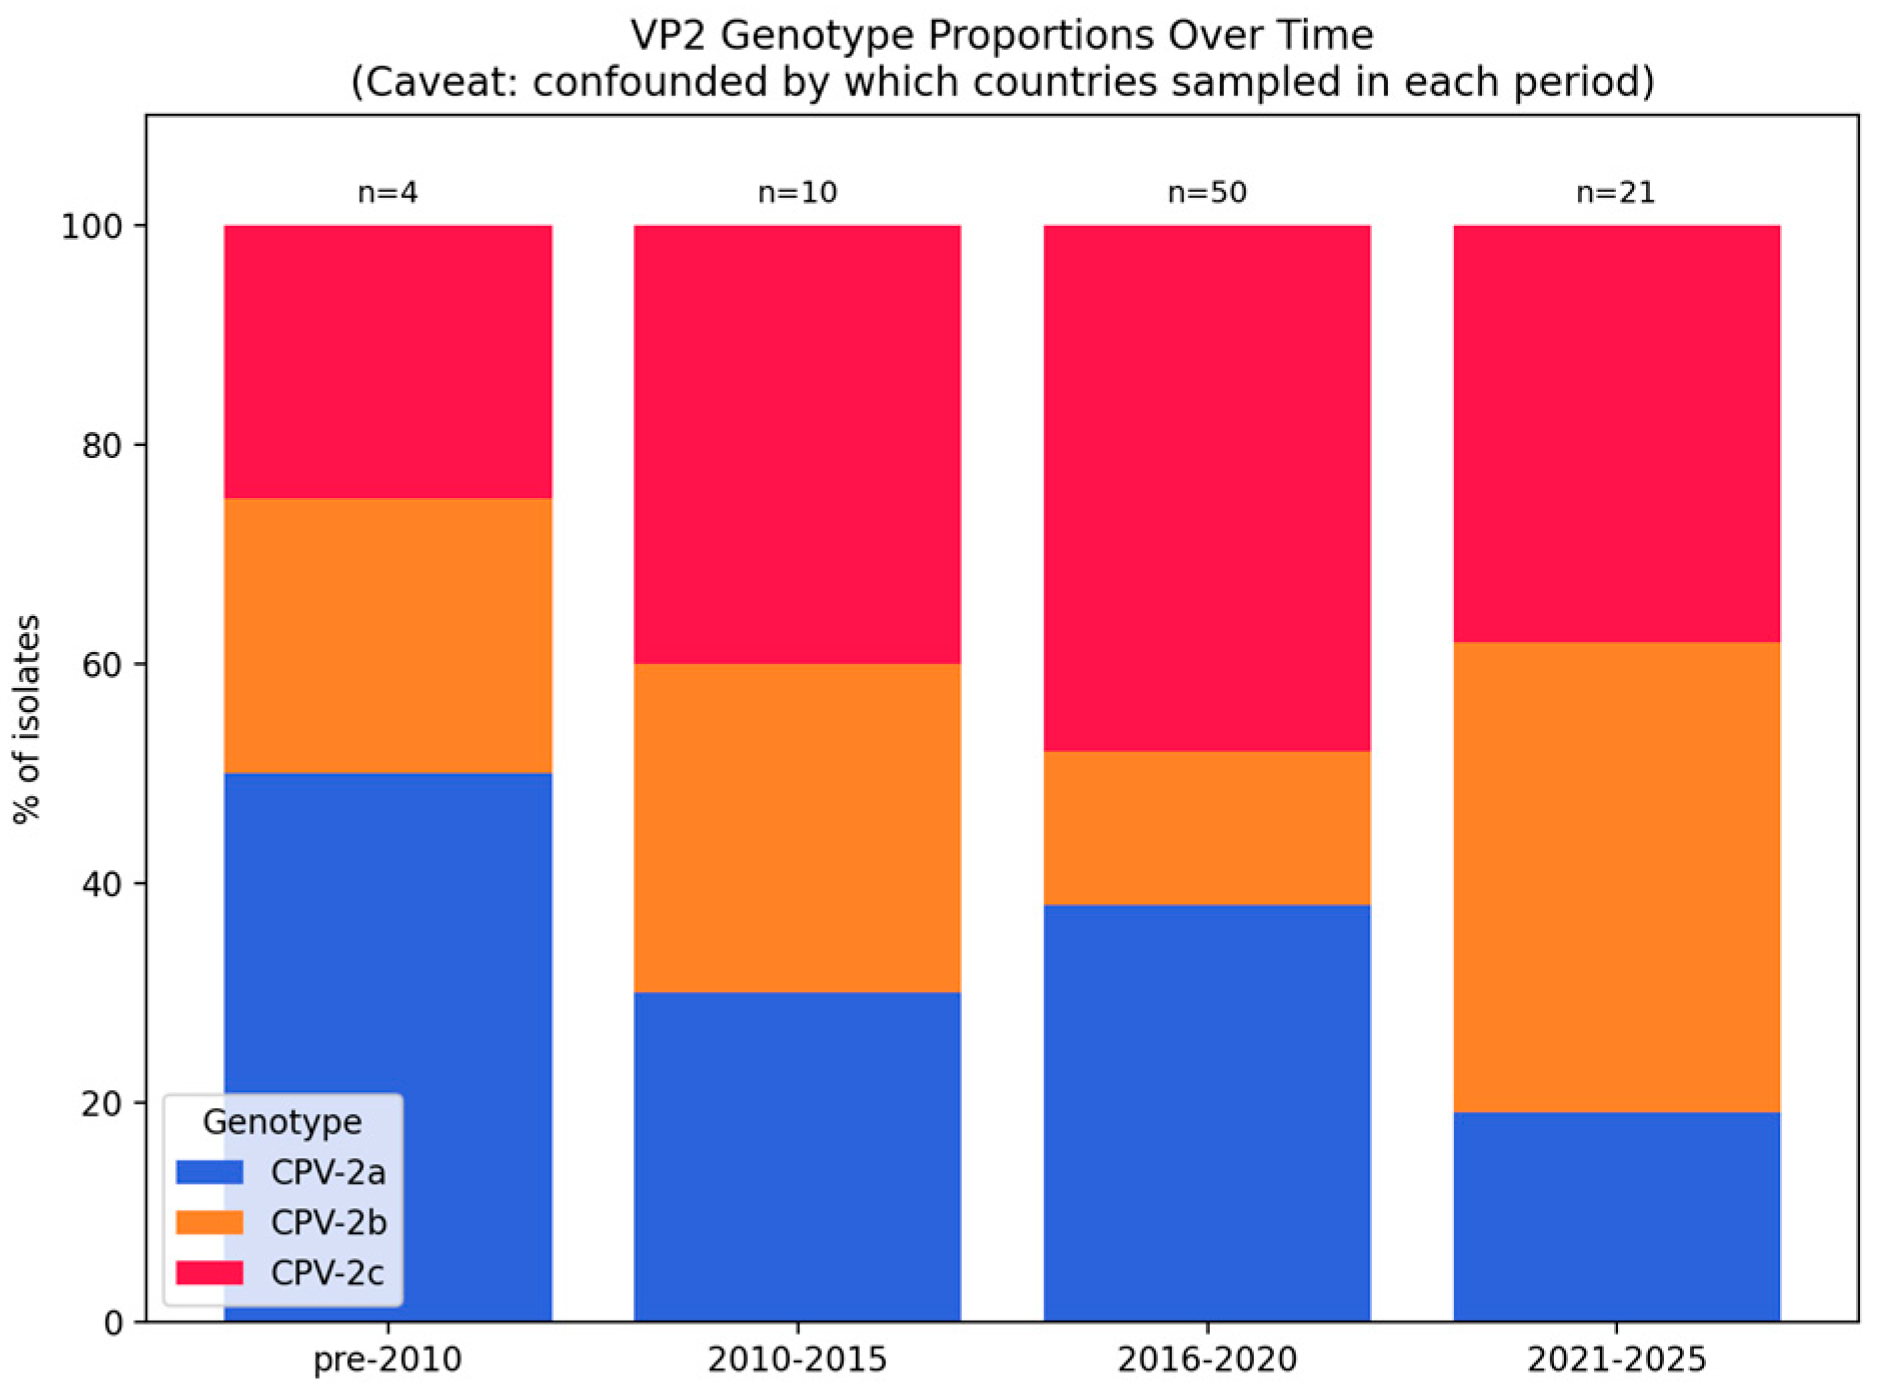
Figure 6.
VP2 mutation frequency landscape across all 584 residues (minor allele frequency = 1 minus the frequency of the consensus amino acid at each position), with the eight literature-derived candidate sites highlighted.
Figure 6.
VP2 mutation frequency landscape across all 584 residues (minor allele frequency = 1 minus the frequency of the consensus amino acid at each position), with the eight literature-derived candidate sites highlighted.
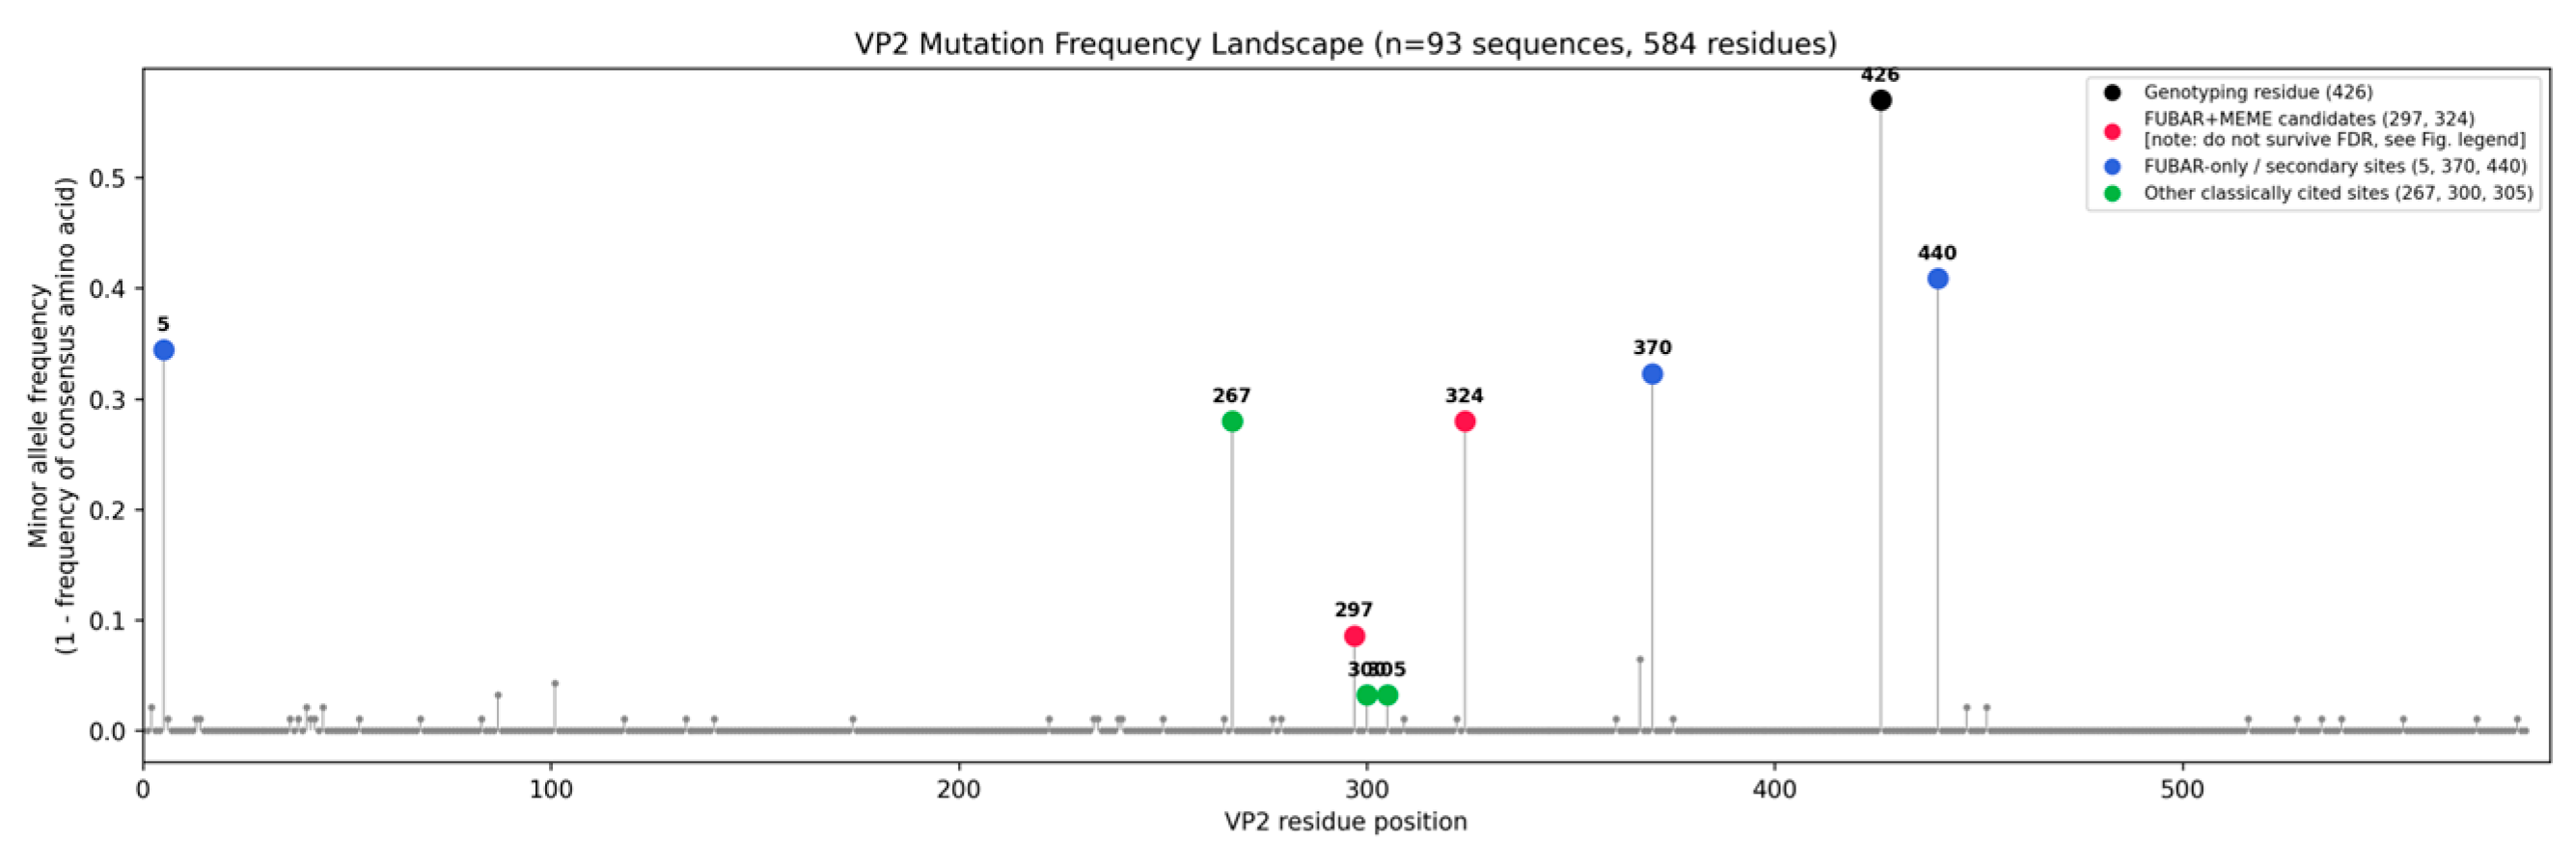
Figure 7.
Selection pressure across all 584 VP2 codons. Top: FUBAR posterior probability of positive selection (red: 297, 324; blue: 5, 370, 440). Bottom: MEME significance (-log10 p), with the result of Benjamini-Hochberg FDR correction stated explicitly - neither 297 nor 324 survives correction at q<=0.1.
Figure 7.
Selection pressure across all 584 VP2 codons. Top: FUBAR posterior probability of positive selection (red: 297, 324; blue: 5, 370, 440). Bottom: MEME significance (-log10 p), with the result of Benjamini-Hochberg FDR correction stated explicitly - neither 297 nor 324 survives correction at q<=0.1.
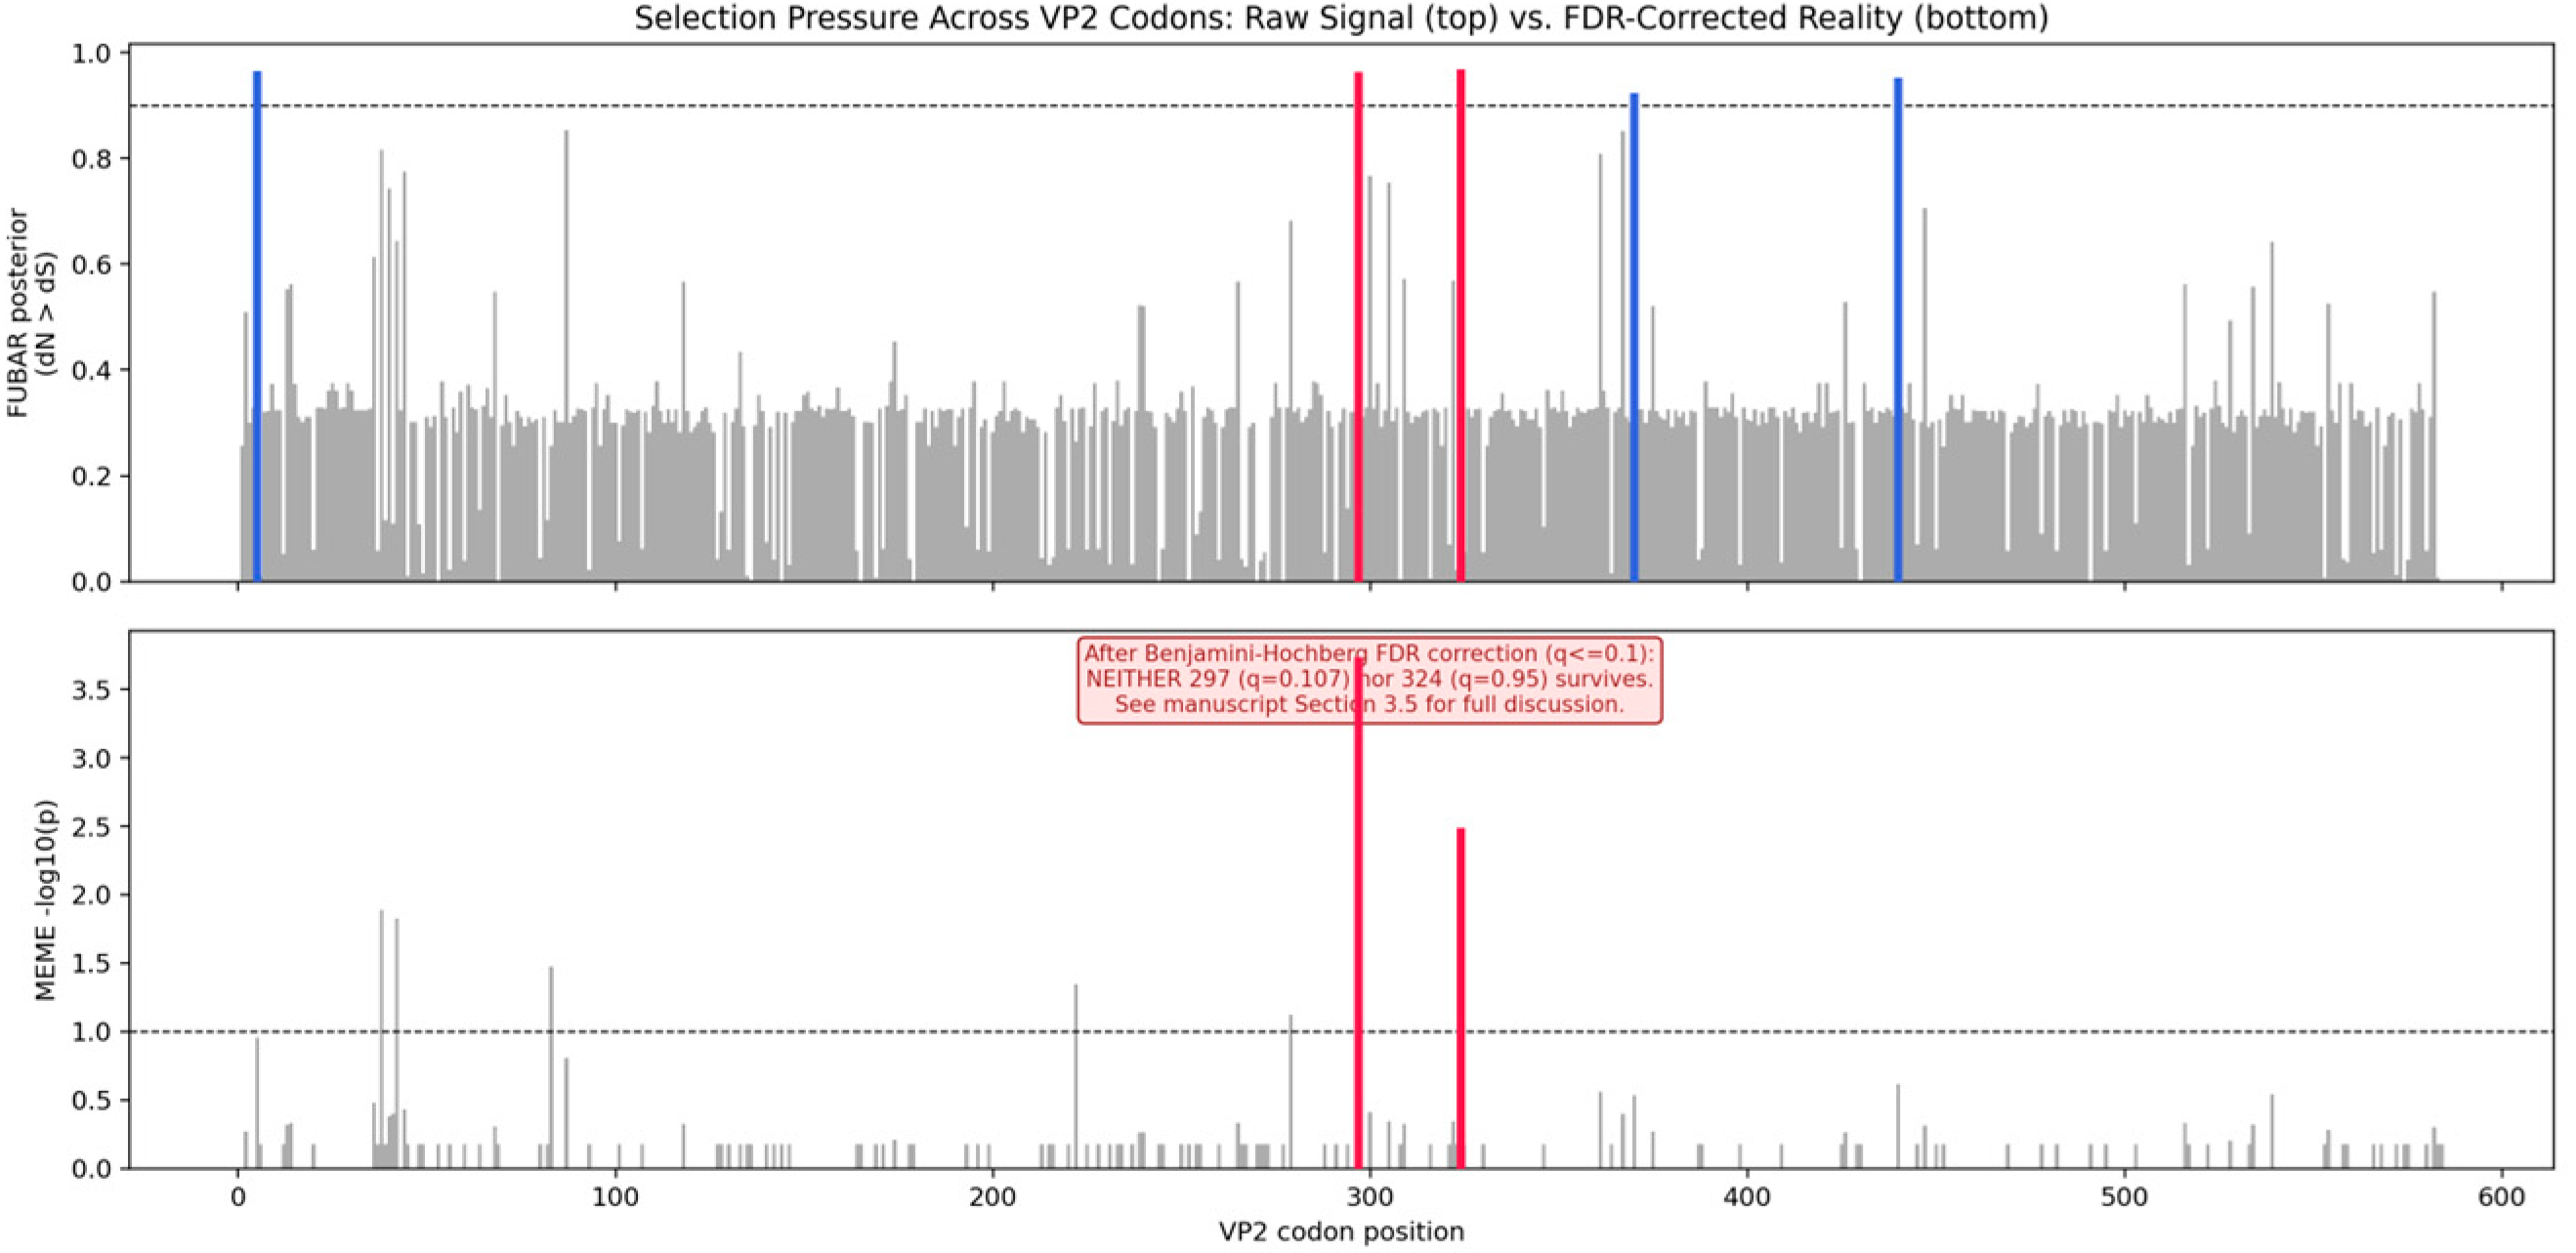
Figure 8.
Linear VP2 topology schematic derived from the real PDB 2CAS secondary-structure records (Wu and Rossmann, 1993). This is a topology schematic built from genuine deposited secondary-structure assignments, not a three-dimensional atomic rendering; a runnable script for generating a true 3D rendering is provided as supplementary data (Section 2.7).
Figure 8.
Linear VP2 topology schematic derived from the real PDB 2CAS secondary-structure records (Wu and Rossmann, 1993). This is a topology schematic built from genuine deposited secondary-structure assignments, not a three-dimensional atomic rendering; a runnable script for generating a true 3D rendering is provided as supplementary data (Section 2.7).
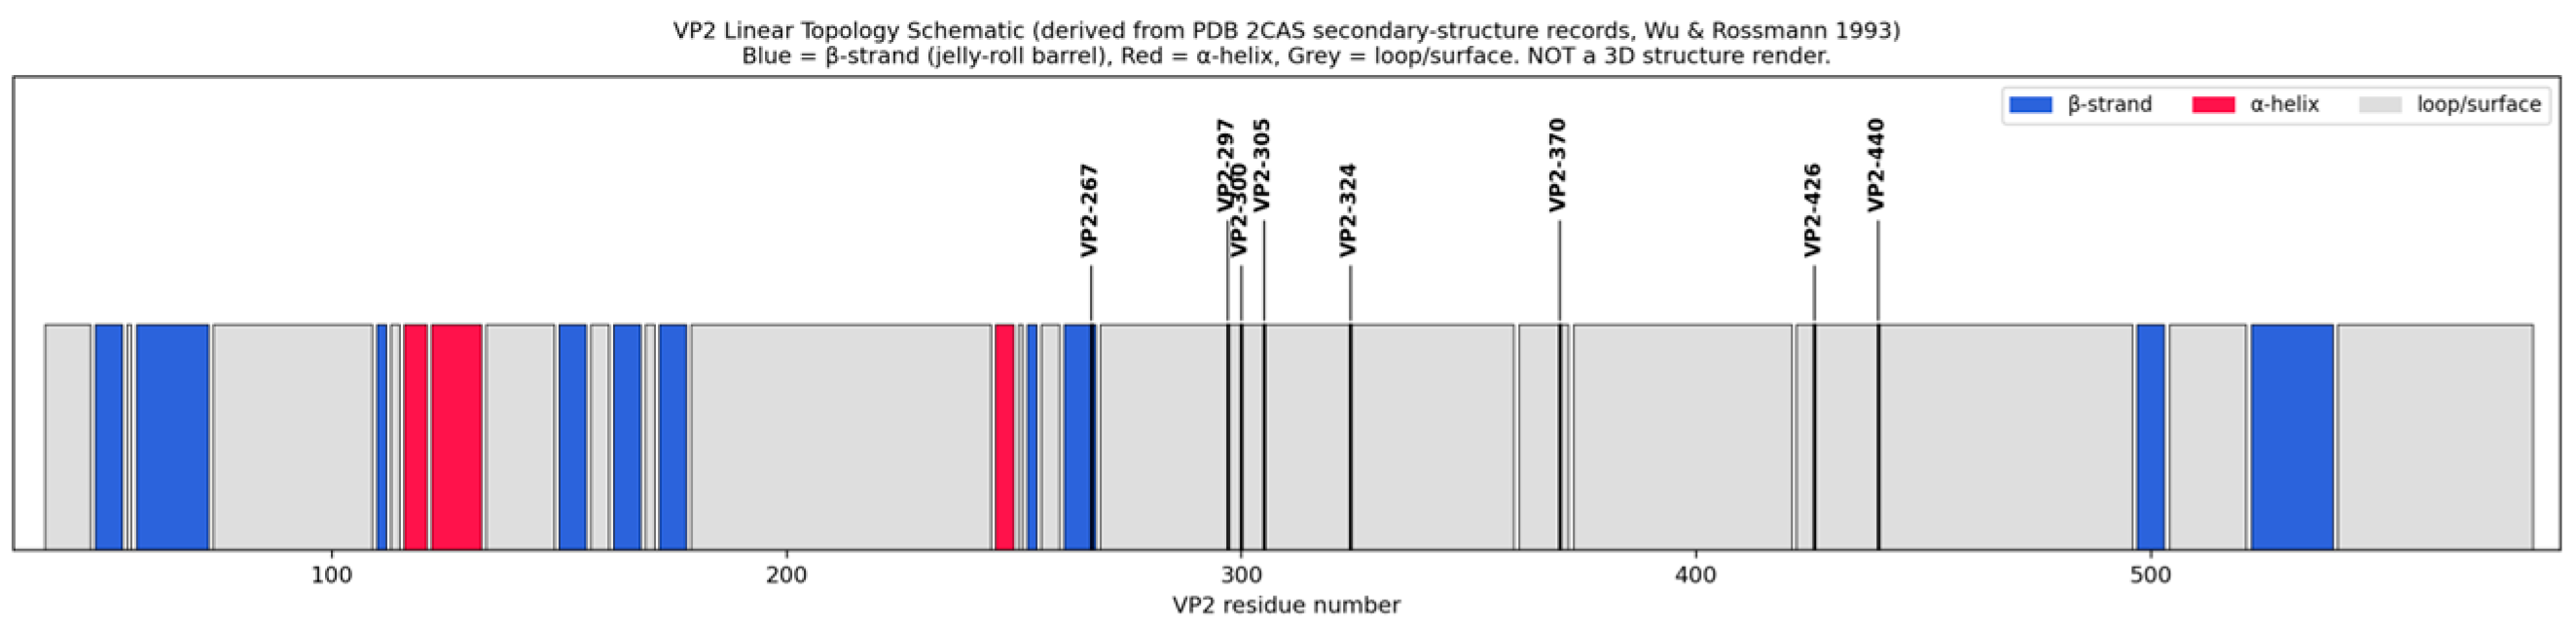
Figure 9.
Evolutionary model summarizing global CPV VP2 diversification. Arrow geometry is illustrative and not phylogenetically scaled.
Figure 9.
Evolutionary model summarizing global CPV VP2 diversification. Arrow geometry is illustrative and not phylogenetically scaled.
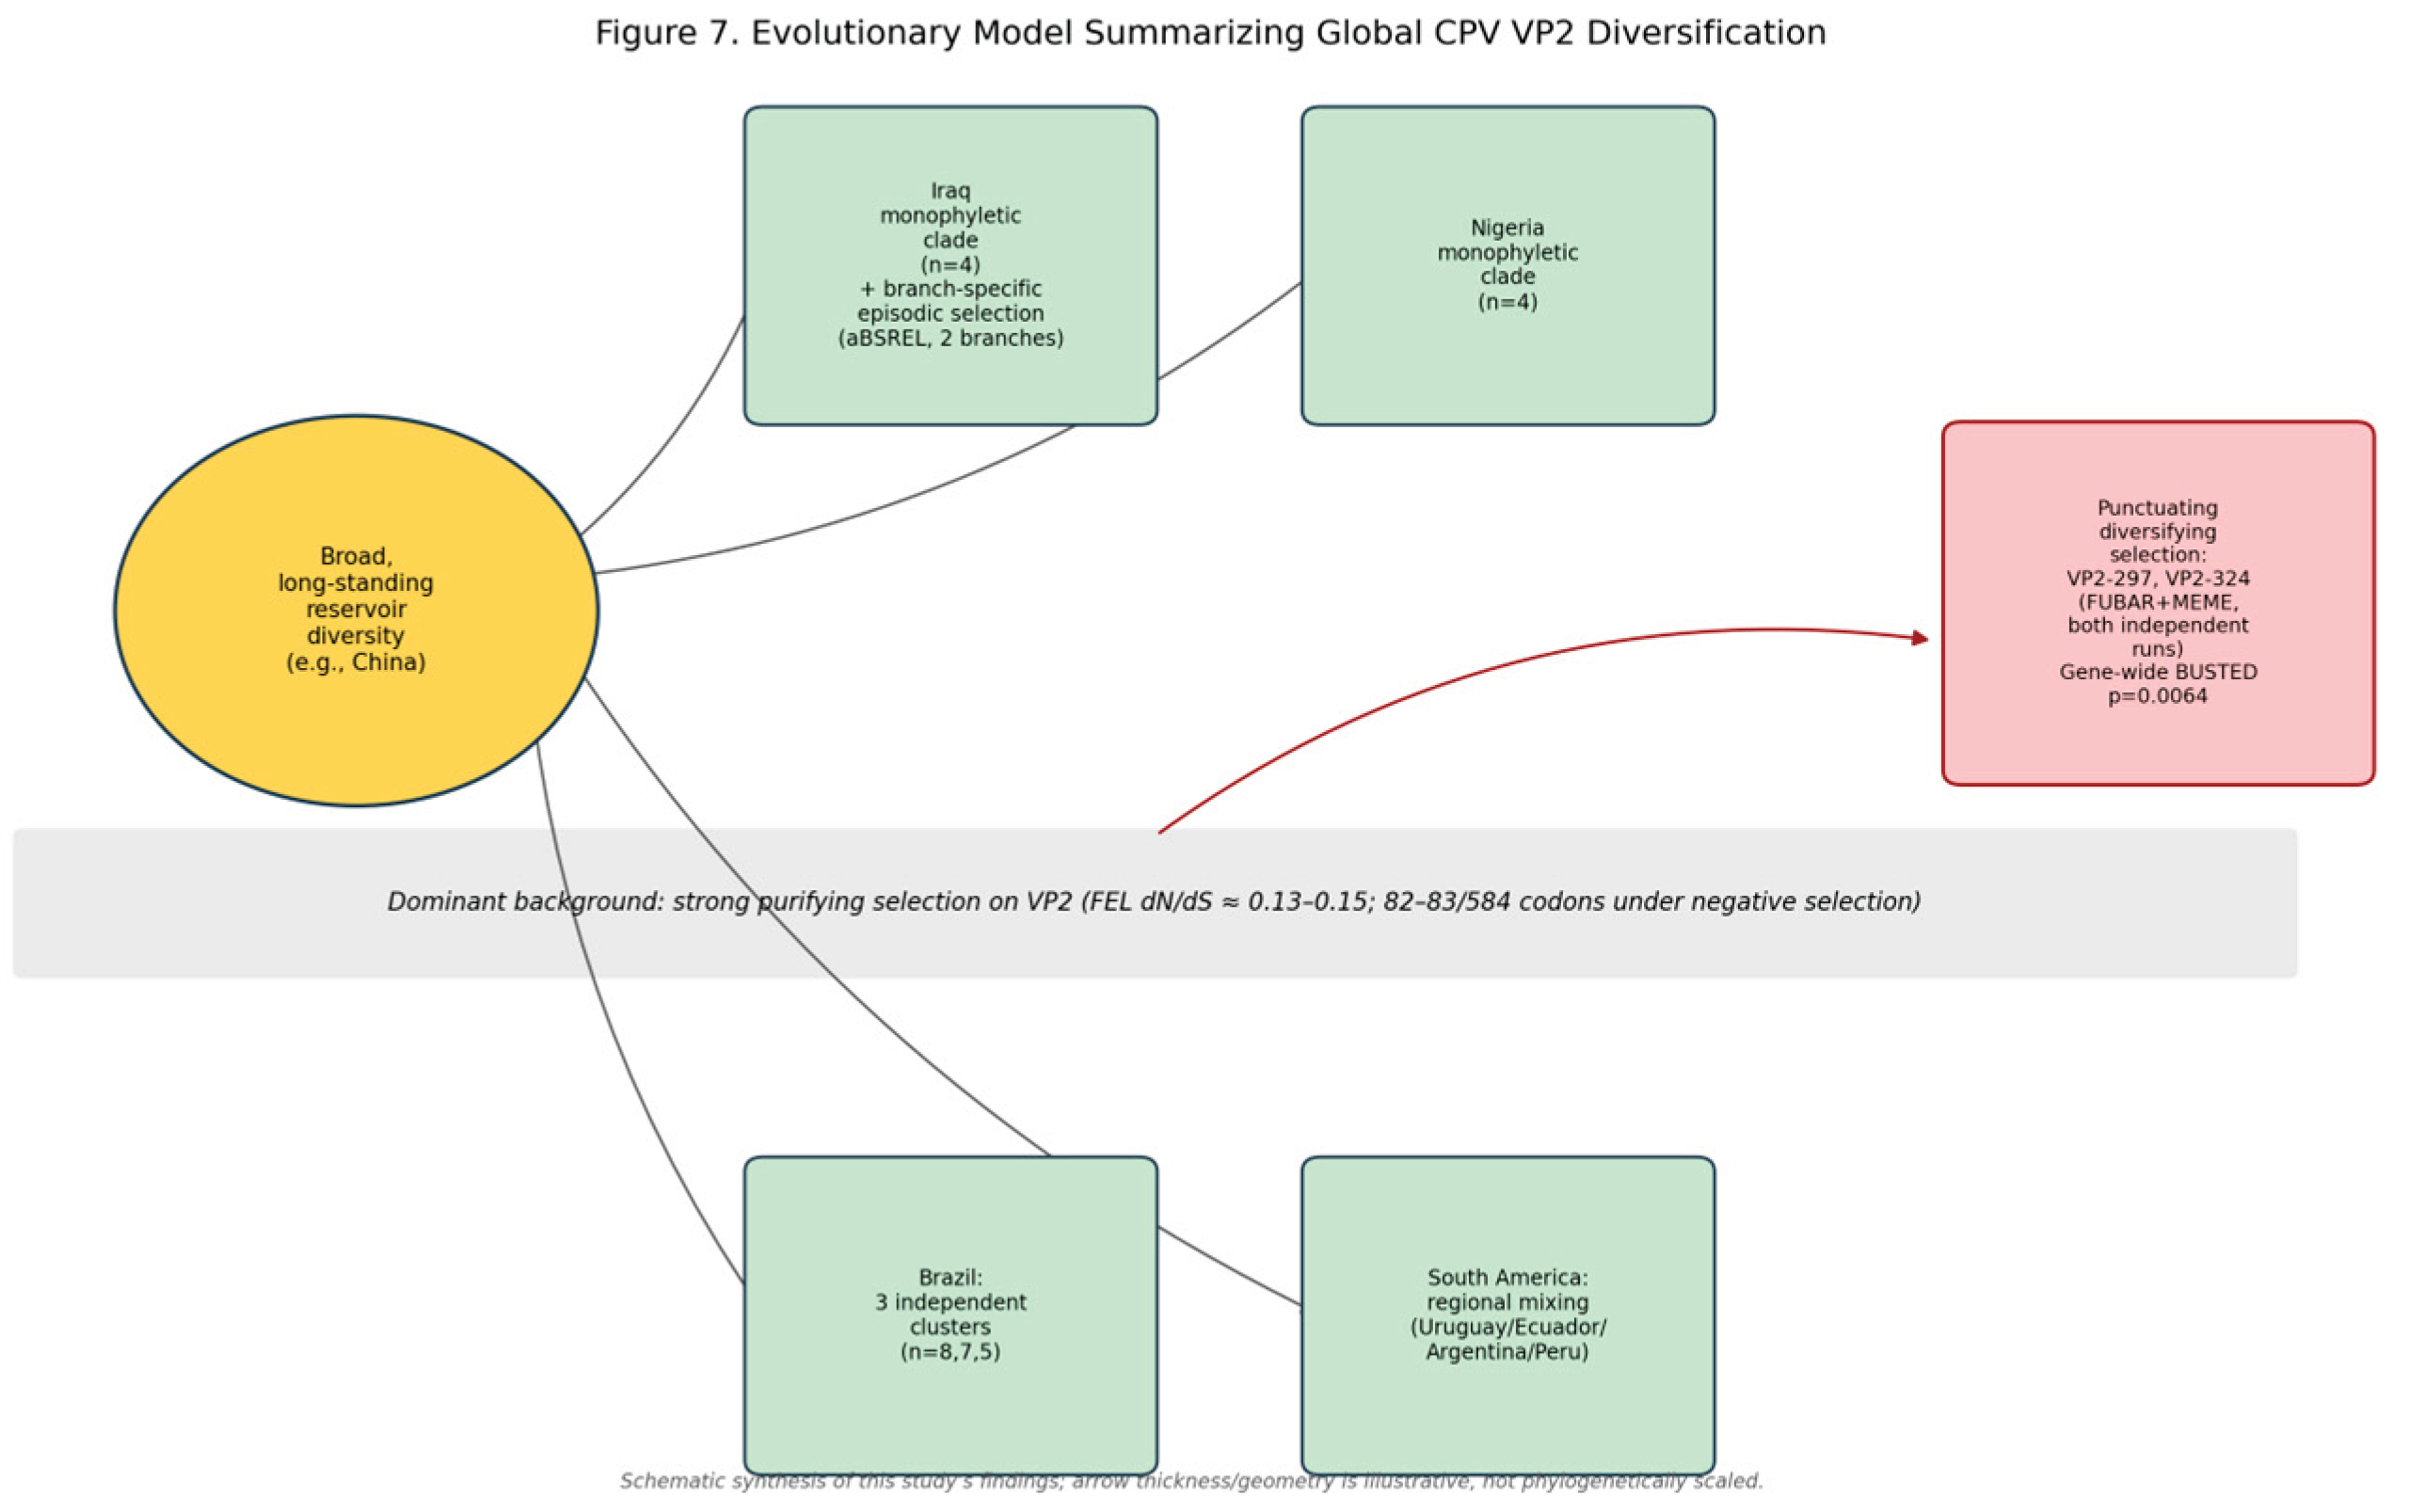
Table 3.
Key VP2 site interpretation.
| VP2 site | 1978 residue | Structural context | Interpretation |
| 267 | F | Beta-strand (BDG sheet) | Polymorphic within genotypes; only site in resolved secondary structure |
| 297 | S | Surface loop | Candidate diversifying-selection site (FUBAR+MEME, both guide trees); does NOT survive FDR correction (q=0.107) |
| 300 | A | Surface loop; Ramachandran outlier in PDB 2CAS (phi=-55.1, psi=10.4) | Highly variable; most variable capsid residue in carnivore parvoviruses per Allison et al. (2016); not significant in selection tests |
| 305 | D | Surface loop | Highly variable; not significant in any selection test |
| 324 | Y | Surface loop | Candidate diversifying-selection site (FUBAR+MEME, both guide trees); does NOT survive FDR correction (q=0.95) |
| 370 | Q | Loop, weak electron density (361-372) | Secondary CPV-2c-associated marker (Q370R, 72.5% of 2c); FUBAR-only, not MEME-significant |
| 426 | N | Surface loop | Genotyping residue by definition; NOTE: does not reliably track monophyly (Section 1) |
| 440 | T | Surface loop | Secondary CPV-2c-associated marker (A440T pattern); FUBAR-only |
Table 5.
Population genetics summary (VP2, EggLib), overall and by genotype.
| Statistic | All (n=93) | CPV-2a (n=33) | CPV-2b (n=20) | CPV-2c (n=40) |
| Segregating sites (S) | 154 | 79 | 71 | 67 |
| Unique haplotypes (Kt) | 73 | 23 | 18 | 31 |
| Haplotype diversity (Hd) | 0.9895 | 0.9489 | 0.9895 | 0.9795 |
| Nucleotide diversity (pi/site) | 0.00697 | 0.00508 | 0.00799 | 0.00519 |
| Watterson's theta (per site) | 0.01722 | 0.01116 | 0.01144 | 0.00899 |
| Tajima's D | -1.998 | -2.038 | -1.227 | -1.528 |
| Fu and Li's D* | -4.599 | -3.629 | -1.660 | -1.927 |
| Fu and Li's F* | -4.193 | -3.661 | -1.785 | -2.125 |
Disclaimer/Publisher’s Note: The statements, opinions and data contained in all publications are solely those of the individual author(s) and contributor(s) and not of MDPI and/or the editor(s). MDPI and/or the editor(s) disclaim responsibility for any injury to people or property resulting from any ideas, methods, instructions or products referred to in the content. |
© 2026 by the authors. Licensee MDPI, Basel, Switzerland. This article is an open access article distributed under the terms and conditions of the Creative Commons Attribution (CC BY) license (http://creativecommons.org/licenses/by/4.0/).
Copyright: This open access article is published under a Creative Commons CC BY 4.0 license, which permit the free download, distribution, and reuse, provided that the author and preprint are cited in any reuse.