
Submitted:
14 July 2026
Posted:
15 July 2026
You are already at the latest version
Abstract
In this work, the adsorption of a dye from aqueous solutions onto a waste chicken eggshell biosorbent is under consideration. The aim of this work is to assess the possibility of removing the textile dye, i.e., direct blue BR 200, from water by adsorption on eggshells and to generate the process data such as effective internal and external diffusion coefficients. The results of our experimental studies on adsorption equilibrium and kinetics are presented in this paper. The experiments are conducted for both eggshells and activated carbon in order to compare their adsorption efficiency. As a result of the equilibrium studies, the experimental adsorption isotherms are obtained. Moreover, the parameters of the Henry, Freundlich, Langmuir, Langmuir-Freundlich (Sips) and modified BET isotherms are determined based on the experimental data. In the kinetic studies the aqueous solution of a dye flows through the fixed-bed laboratory column. The adsorbent grains constitute the packing of the column. Based on the results of the kinetic studies, the external and internal diffusion coefficients for different process conditions i.e., different flow rates of the liquid phase in the adsorber, are determined. The internal diffusion coefficient, which describes the transfer from the external surface of an adsorbent grain to its interior, is calculated on the basis of the solution to Fick’s unsteady-state diffusion equation. The results of the experiments and calculations presented in this work can be used to determine the efficiency of eggshells as a biosorbent in water purification systems. It was obtained that the eggshells have very good sorption properties with respect to the dye under investigation. Both equilibrium and kinetic studies revealed that the dye uptakes for eggshells are greater than the uptakes for the activated carbon which is a conventional reference adsorbent. Moreover, the Langmuir-Freundlich (Sips) isotherm provides the best fit for the experimental data for both the eggshells and activated carbon. The external diffusion coefficient of the dye in water is DAB = 2.21·10−10 m2/s. The kinetic calculations revealed that the effective internal diffusion coefficient Ds for both adsorbents is lower than the external coefficient DAB and it increases with the liquid flow rate. It was also found that Ds for the eggshells is greater than for activated carbon. The obtained values of the internal diffusion coefficient Ds for the eggshells were 2.55·10−11 m2/s, 4.59·10−11 m2/s, 1.92·10−10 m2/s, for the flow rates 1.72 cm3/s, 2.31 cm3/s and 2.90 cm3/s, respectively. The Ds values refer to the equivalent radius of the eggshells grains Rp = 0.00146 m. The isotherms parameters and diffusion coefficients presented in this work can be used as data for process calculations.
Keywords:
adsorption
; water purification
; dye removal
; diffusion coefficient
; mass transfer coefficient
1. Introduction
Contamination of the aquatic environment with synthetic dyes constitutes a significant problem in contemporary environmental engineering. The principal source of groundwater contamination by dyes is the intensive development of the textile industry. Approximately 80% of the dyes produced are consumed within this industrial sector [1]. Nevertheless, they may also originate from the cosmetics, food, paper, pharmaceutical, or tannery industries. It is estimated that more than 10,000 different dyes are used in industrial applications, with global annual production reaching approximately 0.7 million tons [2,3]. Dyes are considered one of the most hazardous pollutants of the natural environment [4]. This is due to their toxic effects on living organisms, including potential mutagenicity and carcinogenicity. Even low concentrations can lead to a significant deterioration in water quality, reduced light penetration, and adverse impacts on aquatic organisms [5,6]. For this reason, over the years an exponential increase in the number of scientific publications devoted to dye removal methods has been observed [7].
Among the available methods for removing dyes from industrial wastewater, biological, chemical, and physicochemical processes can be distinguished [2,8]. Preliminary physical treatment technologies for the removal of dyes include screening, filtration, gravity settling chambers, coagulation, and flocculation [4,6]. Of particular importance are ultrafiltration and nanofiltration, which enable the effective removal of many types of dyes. However, the limitations of these methods include high capital costs and frequent membrane fouling [4]. However, the use of coagulation or flocculation, however, requires appropriate waste management. The advantages of biological treatment methods include low operating costs and the possibility of transforming pollutants into non-toxic products. Despite numerous advantages, biological methods also have significant limitations, such as incomplete degradation of certain dyes, long process times, large spatial requirements, and limited efficiency under continuous-flow conditions. Chemical methods also constitute an important group of technologies used for dye removal from wastewater, employing strong oxidizing agents such as chlorine, ozone, hydrogen peroxide, or the Fenton reagent. These methods are characterized by relatively short reaction times and high decolorization efficiency. However, their effectiveness depends on process conditions such as pH and the presence of catalysts. These methods also have significant limitations, including high costs, the formation of reaction by-products (including halogenated organic compounds), and sludge generation, which restricts their widespread application and requires further optimization [3].
In general, adsorption can be considered a favorable method for treating dye-containing wastewater compared with other methods [7,9,10,11]. This is due to its operational simplicity, relatively low cost, high removal efficiency, potential for adsorbent regeneration, and effectiveness in eliminating persistent dye compounds across a wide range of applications [10,12]. The efficiency of the method depends on both the properties of the adsorbate and the adsorbent.
The most commonly used adsorbent in water purification processes is activated carbon, which, owing to its well-developed porous structure and large specific surface area, exhibits very high sorption capacity [7,13]. Its properties can be modified through the selection of the raw material and activation conditions, which allows it to be tailored to specific applications. For this reason, the use of both commercial activated carbon and activated carbon derived from waste materials (e.g., lemongrass leaf, rise husks, orange peel, spent tea leaves, or coconut leaves) for the removal of dyes from aqueous solutions has been the subject of numerous scientific studies [7,14]. Despite its numerous advantages, the use of activated carbon is still associated with relatively high production and regeneration costs, which encourages the search for cost savings through the use of alternative materials such as agricultural and industrial waste products [11].
In recent years, there has been growing interest in so-called biosorbents, i.e., materials of natural or waste origin that may constitute an effective and low-cost alternative to conventional adsorbents. This group includes, among others, agricultural and industrial wastes such as raw maize cob [10], exhaused coffee ground powder [15], waste tea leaves [16], sawdust [17], nut shells [12,18,19], tree bark [20], pinapple leaf powder [9], pine tree leaves [21]. Their utilization aligns with the concept of a circular economy and sustainable development. Unfortunately, despite the very low costs of these waste-derived adsorbents, they exhibit relatively low adsorption efficiency [8,11]. For this reason, the search for new biosorbents and the optimization of their operating conditions constitute a key research direction, essential for increasing the efficiency of adsorption processes and for the development of sustainable water treatment technologies.
The aim of this study is to evaluate the efficiency of removing the textile dye direct blue BR 200 from aqueous solutions via adsorption onto waste chicken eggshells, treated as an alternative to conventional adsorbents such as activated carbon. Within the scope of the study, equilibrium investigations were conducted using a static method, as well as adsorption kinetics in a continuous-flow fixed-bed system. An additional objective of the study is the determination of key mass transfer parameters, including effective internal and external diffusion coefficients, as a function of process operating conditions, in particular the flow rate of the liquid phase. The results obtained are intended to enable a comparison of the adsorption properties of eggshell biosorbent and activated carbon, as well as to provide data necessary for the design and modelling of water treatment processes.
2. Materials and Methods
2.1. Characteristics of the Adsorbate and Adsorbent
The dye investigated in this study was direct blue BR 200 supplied by Argus (Poland). This compound is commonly applied in the dyeing of textiles. It exhibits good solubility in aqueous media. The chemical structure of the dye is shown in Figure 1.
Chicken eggshells were used as the biosorbent in this study. The raw material was a waste product from a local pastry shop (Southern Poland). The eggshells were chosen for the studies since they are reported in literature to be potential biosorbent for dye removal [22,23,24,25,26]. The chicken eggshell consists of three layers: outer mineral shell and two inner protein membranes [22,25,27]. It contains mainly calcium carbonate (94-97% by weight) but also magnesium carbonate (1%), calcium phosphate (1%) and organic matter (4% - protein membrane). One eggshell contains up to 17,000 pores [25]. The pore diameters are reported to vary from 13 nm to 1000 nm [25,29]. The BET specific surface area of boiled eggshells is about 1-3 m2/g [22,27,28,29]. The relatively low specific surface area is the reason why it has been postulated that sorption capacities of eggshells result from their functional groups rather than from diffusion through their pores [29].
The waste eggshells used in the studies were boiled for 5 minutes, washed with distilled water, crushed into small pieces, divided into samples, placed in weighing bottles and then dried overnight to the constant mass in a laboratory dryer at a temperature of 50 °C.
The commercial activated carbon Sorbotech LGCO 100 (Poland) was used in the studies for the comparison purposes. This activated carbon is dedicated for the removal of color, smell and taste from liquids. It is produced from coconut shells by carbonization and activation processes. Its specific surface area is 1000 m2/g. The grains have irregular shapes. Their size is between 0.6 mm and 2.36 mm.
2.2. Adsorption Equilibrium: Measurements and Equations
The adsorption isotherm was determined experimentally using the static method. For liquid solutions, this method involves measuring the amount of substance adsorbed on the surface of a solid at constant temperature, after equilibrium has been established between the adsorbed phase and the bulk phase. The difference between the dye solution concentrations before the onset of the adsorption process and after the establishment of adsorption equilibrium was measured. Dye solutions of volume 100 cm3 with concentrations of 10 mg/dm3, 20 mg/dm3 30 mg/dm3, 40 mg/dm3, 50 mg/dm3, 60 mg/dm3, 70 mg/dm3 and 80 mg/dm3 were prepared. To each of the prepared solutions, 5 g of adsorbent was added. Prior to introducing the adsorbent into the samples, it was degassed and rinsed with distilled water to eliminate any residual dust. The samples consisting of the solution and adsorbent grains were agitated using a laboratory shaker and thermostated at a temperature of 21 °C. The absorbance of the solutions was then monitored using a spectrophotometer over several days. Measurements were repeated until three consecutive readings showed no significant change, indicating that equilibrium between the adsorbate and the adsorbent had been reached. The equilibrium measurements were repeated three times and the results were averaged.
To analyze the adsorption equilibrium results, several different adsorption isotherms were applied. An adsorption isotherm is understood as the relationship between the amount of adsorbate retained in the solid phase and its equilibrium concentration in the solution, determined at constant temperature. The equations used are presented in Table 1. Based on the literature analysis [1,7,17] the isotherms most commonly used to describe adsorption equilibrium for aqueous dye solutions were selected. According to adsorption theory, for the low adsorbate concentration range, the linear Henry isotherm should provide the best fit. The Langmuir isotherm describes monolayer adsorption on an ideal flat adsorbent surface. Surface heterogeneity is accounted for in the Freundlich isotherm, which has been proposed based on numerous experimental studies. It is a multilayer adsorption isotherm [30] and does not have a finite saturation limit. A combination of the Langmuir and Freundlich isotherm characteristics leads to the Sips isotherm, which is most commonly referred to as the Langmuir–Freundlich isotherm. The Sips isotherm [30] is a modification of the Freundlich equation and is aimed to provide the right finite limits for high liquid-phase concentrations. The BET equation describes the multilayer adsorption. In this work the modified form of the BET equation [31,32] proposed for the liquid phase adsorption is used.
The isotherms equations are presented in Table 1. In the case of Henry’s equation the linear regression was used to obtain the equilibrium constant K. For the rest of the isotherms the nonlinear regression was applied to obtain their constants. The code in Matlab was prepared for that purpose. Based on the values of the sum of squared deviations SSD (Sum of Squares), the quality of fit of the adsorption isotherm models to the experimental data was assessed.
2.3. Adsorption Kinetics: Measurements and Equations
The adsorption experiments were conducted in a recirculating system consisting of a 100 cm³ of solution placed in a beaker positioned on a magnetic stirrer. The initial dye concentration in the solution was 30 mg/dm³. The temperature during all experiments was maintained at 21 °C. Using a peristaltic pump, the solution was continuously transported from the beaker to a glass adsorption column packed with different adsorbents, namely waste chicken eggshells and activated carbon. The column had an internal diameter of d = 12.5 mm. The masses of each adsorbent samples used as the packing in the experimental column were 2.58 g. After passing through the adsorbent bed, the liquid returned to the beaker, forming a closed-loop circulation system.
The main operating parameter varied during the experiments was the volumetric flow rate through the adsorption column (Qv), investigated at: 1.72 cm3/s, 2.31 cm3/s and 2.9 cm³/s. To monitor adsorption progress, solution samples were analyzed spectrophotometrically. The total experiment duration was 60 min with the final measurement taken at the end of this period. Dye concentrations were determined from absorbance values with the use of a previously established calibration curve.
A schematic representation of the experimental setup is presented in Figure 2.
Adsorption kinetics was analyzed based on time-dependent changes in adsorbate concentration in both the liquid and solid phases. The adsorbate concentration in the grains q was calculated on the basis of its concentration in the liquid phase C. The following mass balance equation was used:
where V—solution volume [dm3]; C0—initial concentration of adsorbate in the liquid phase [mg/dm3]; C—current concentration of adsorbate in the liquid phase [mg/dm3]; ma— mass of an adsorbent sample [g].
2.3.1. External and Internal Diffusion
In this work adsorption of an adsorbate in a porous adsorbent grains from a mixture with an inert solvent is considered. The stages of such a process are as follows [33]:
- 1)
- transport of adsorbate molecules from the bulk of the liquid to the external surface of the adsorbent grain including transport through the film of molecules around the grain (external diffusion),
- 2)
- transport of the adsorbate into the interior of the adsorbent grain (internal diffusion in adsorbent pores),
- 3)
- the actual adsorption of the adsorbate on adsorbent surface.
The rate of adsorption is limited by the slowest stage of this complex process. The rate of the adsorption step (step 3) itself is typically high. Therefore, the overall process rate is primarily determined by the mass transfer during the transport of the component to adsorption sites i.e., the external and/or internal diffusion rates [34]. However, the finite rate of adsorption is primarily due to the diffusional resistance in the adsorbent grain [30].
The molecular diffusion coefficient in the liquid phase (external diffusion) can be calculated using the Wilke–Chang correlation, commonly applied for dilute aqueous systems [35]:
where DAB—external diffusion coefficient [cm2/s]; MB—molecular mass of solvent B [g/mol]; ηB—dynamic viscosity coefficient of solvent B [cP]; T—temperature [K]; ϕ—association coefficient of solvent B [-]; VA—molar volume of substance A [cm3/mol].
Internal transport phenomena may be evaluated using the diffusion model for spherical grains [36]. The diffusion equation for a sphere can be used to provide an approximate description of diffusion in irregularly shaped grains. The radius of a sphere having the same volume as the grain is adopted as the characteristic dimension of the grain. The following relationship applies [36,37]:
where: q— concentration of adsorbate in the grain after time t [mg/g], qb—concentration of adsorbate on the grain surface [mg/g], Ds— internal diffusion coefficient based on the component concentration in the grain [m²/s], Rp—equivalent grain radius [m].
Equation (8) is the solution to Fick’s unsteady-state diffusion equation. It applies to the case where the grain initially does not contain the diffusing component, and the concentration of the adsorbed component at the grain surface remains constant throughout the process.
The equivalent radius Rp is defined as the radius of a sphere with the same volume as the grain:
Vj is the volume of the grain:
where: ma—mass of grains sample [g], N—number of grains in the sample [-], ρp—apparent density of grains [kg/m3].
Equation (8) contains an infinite sum, which complicates calculations. Some simplifications are known for specific cases. When q/qb < 0.25, Formula (8) transforms to the form [36]:
However, when q/qb > 0.7, it is sufficient to consider only the first term of the sum (n = 1) in the exact equation (8), which yields:
A simplified solution to the diffusion equation based on the so-called Linear Driving Force (LDF) is also known [36]. For a sphere, the LDF relationship takes the form:
It is convenient to introduce some dimensionless variables. The dimensionless concentration in the grain Y:
The dimensionless adsorption time:
After these variables are introduced, Equations (8), (11), (12), and (13) take simpler forms, respectively:
- -
- exact solution
- -
- approximate solution for low concentrations (Y < 0.25)
- -
- approximate solution for high concentrations (Y > 0.7)
- -
- approximate LDF relationship
Using formulas (8)-(19), one can calculate the internal diffusion coefficient Ds in adsorbent pores.
4. Results and Discussion
4.1. Adsorption Equilibrium: Results of Measurements and Calculations
Figure 3 presents the experimental equilibrium data i.e., adsorption isotherms for the tested systems at a temperature of 21 °C. The horizontal axis shows the equilibrium concentration of the dye in the liquid phase Ceq, and the vertical axis shows its concentration in the solid phase qeq. The blue points refer to the results for eggshells, while the yellow points refer to activated carbon. For both eggshells and activated carbon, an increase in the amount of adsorbed substance qeq is observed with increasing concentration in the liquid phase Ceq. Eggshells exhibit a markedly higher adsorption capacity than activated carbon across the entire analyzed concentration range. This is manifested by a steeper rising function qeq = f(Ceq) for the eggshells than for the activated carbon.
Figure 4 and Table 2 show the results of fitting the adsorption isotherm models to the experimental data. The basis for assessing model fit is the sum of squared deviations (SSD) value. The lower the SSD value, the better the agreement between the model and the data.
For eggshells it can be concluded on the basis of Figure 4a and Table 2 that the Henry model does not fit the data . The R2 was also calculated for the Henry isotherm. It was obtained that R2 = 0.371. The poor fit of the Henry equation indicates that the adsorption equilibrium of the dye-eggshells system is not linear. The Langmuir model also does not correctly describe the data. This indicates that adsorption of the dye onto the eggshells is not monolayer in nature. It is characteristic for physical adsorption. It can be supposed that a multilayer of adsorbate molecules is formed on the adsorbent surface. This conclusion can be confirmed by the good fit of the BET model and the very good fit of the Freundlich model. However, the fit of the Langmuir-Freundlich (Sips) model is much better than the BET and Freundlich models, which indicates the limited sorption capacity of the investigated sorbent. In the considered case the Sips isotherm has a sigmoidal shape (S-shape form).
In the case of activated carbon, it can be concluded from Figure 4b and Table 2 that all the considered isotherm models fit the experimental data. However, the quality of the fit differs among the models. The R2 value obtained for the Henry equation was 0.996. This indicates the very good mathematical fit of the model predictions and experimental data. However, the SSD value for the Henry model is the highest when compared with other models presented in Table 2. It should be recommended to describe the considered dye-activated carbon equilibrium by equations which take the isotherm nonlinearity into account. The Langmuir, Freundlich and BET models have similar SSD values i.e., comparable agreement with the experimental data. Similarly to the case of eggshells the Langmuir-Freundlich (Sips) model provides the best fit to the data for activated carbon. The parameter qeq∞ in Langmuir, BET and Sips model is interpreted as the monolayer adsorbate concentration [mg/g]. The values of qeq∞ obtained from the BET (qeq∞ = 3.33 mg/g) and Sips models (qeq∞ = 2.61 mg/g) are consistent with each other. However, the value given by the Langmuir model qeq∞ = 46.4 mg/g is much greater. The SSD for the Langmuir model is relatively low but higher than those for the BET and Sips models. This indicates that the predictions of the BET and Sips models should be preferred over the estimates of the Langmuir model.
4.2. Adsorption Kinetics: Results of Measurements
Figure 5 and Figure 6 present kinetic curves for adsorption of the direct blue BR 200 dye on eggshells and activated carbon for three different flow rates of the dye solution through the adsorber: 1.72 cm3/s, 2.31 cm3/s and 2.90 cm3/s. The figures show the temporal changes of dye concentration in the liquid phase.
Analyzing the curves in Figure 5, one can observe that concentration of the dye in water solution decreases with time for both eggshells and activated carbon. The curves for eggshells are less smooth than for activated carbon. This can be the result of the natural origin of this sorbent and some aberrations of the absorbance measurements resulting from the occurrence of eggshell dust in the solution samples.
The kinetic curves for activated carbon (Figure 5b) show the typical course of adsorption in liquid-solid systems. Initially, a rapid decrease in the dye concentration in the solution is observed. Subsequently, the rate of the process slows down, and the system asymptotically approaches a state of equilibrium. This is a consequence of the change in the process’s driving force. The driving force is the difference between the actual adsorbate concentration in liquid phase and the equilibrium liquid concentration in relation to the actual solid phase concentration. This difference is high at the beginning of the process and decreases with time, as a result of the decrease in dye concentration in the bulk of the liquid and the increase in saturation of the adsorbent surface.
The shape of the kinetic curves for eggshells presented in Figure 5a is different than for the reference activated carbon. It may result from the fact that the system is far from equilibrium. Hence, only the beginning of the kinetic curve possible to obtain in a broader time interval is presented. This conclusion can be confirmed by analyzing Figure 6. It can be seen that for a constant flow rate of the solution in the adsorber the kinetic curves for eggshells and activated carbon intersect. For initial times the concentrations for eggshells are higher than for activated carbon but then the curves intersect and the reverse relation can be seen. The activated carbon is close to being saturated while the eggshells still have high adsorption potential which leads to further decrease in dye concentration. The above interpretation is consistent with the equilibrium data presented in this work. For a certain initial dye concertation in the solution (C0 = 30 mg/dm3 in the kinetic studies), the equilibrium dye concentration in liquid phase is lower for eggshells than for activated carbon.
Analyzing Figure 5, one can also consider the effect of flow rate on the course of the kinetic curves and the adsorption rate. It can be observed for both eggshells and activated carbon that the higher the flow rate, the lower the dye concentration in the liquid phase for a certain moment of time. The increase in the flow rate, increases the process rate. The reason is that an increase in flow rate leads to the intensified turbulence, the reduction in the liquid film thickness at the grain surface and, as a consequence, to the decrease in external diffusion resistance.
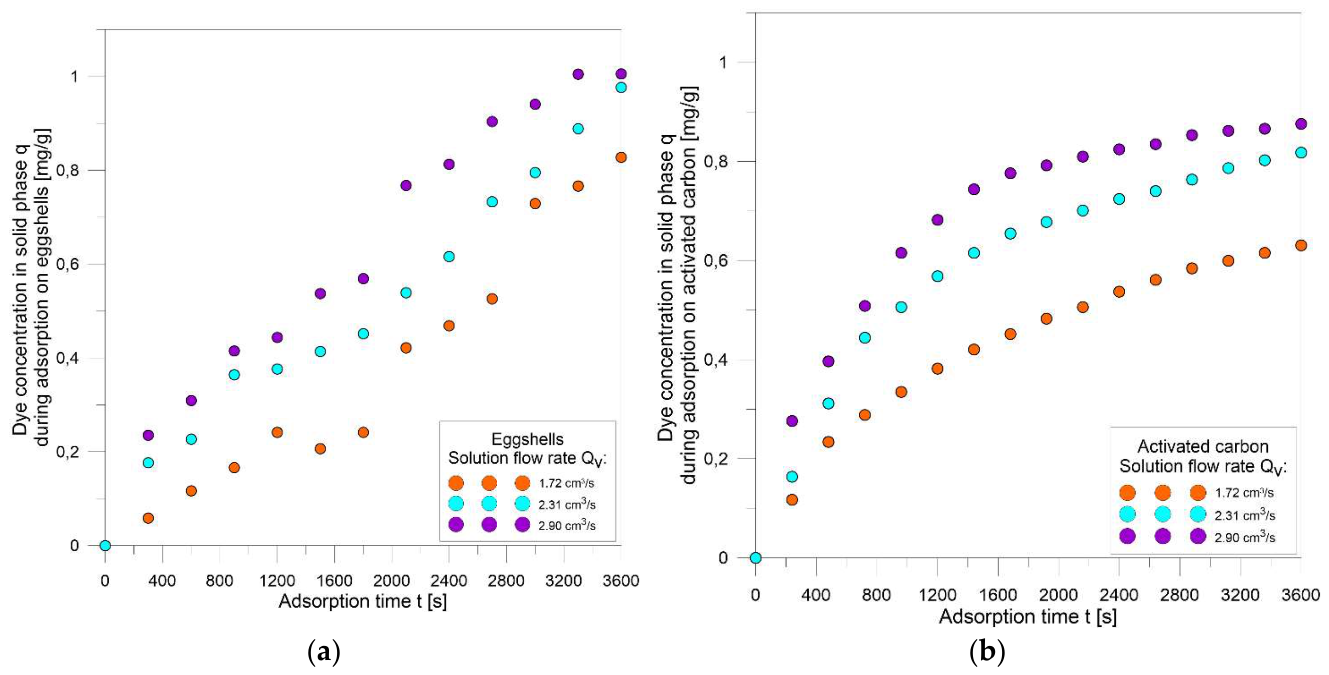
Figure 7 shows the temporal changes in dye concentration in adsorbent grains q for the eggshells and activated carbon. The values of adsorbed amount q were calculated from the balance equation (6). The solution flow rate is used as the parameter in Figure 7. It can be seen that for both adsorbents considered the amount of dye adsorbed in the grains q increases with adsorption time t. Moreover, the analysis of Figure 7 indicates that the higher the solution flow rate, the greater the q value at a given adsorption time t (for example for 2000 s).
A distinct flattening of the curves for activated carbon (Figure 7b) can be observed—that is, the curves clearly tend toward the equilibrium concentration value. From the equilibrium data presented in this work it may be concluded that the equilibrium concentration qeq for the activated is lower then the respective value for the eggshells. The curves for the eggshells (Figure 7a) exhibit a steep profile, indicating a rapid change in concentration within the grains over the entire adsorption time range. This is caused by the system being far from the equilibrium and results from the eggshells’ excellent sorption properties toward the dye under investigation.
It seems interesting to compare the values of q for eggshells and activated carbon at the end i.e., after 60 min, of the process. These concentrations are indicated by the points for 3600 s in Figure 7a and Figure 7b, respectively. These values represent the final uptakes obtained in the kinetic studies. It may be concluded, that the application of the eggshells resulted in a higher final uptake of the dye than the reference activated carbon. This conclusion is valid for all the considered solution flow rates. This fact confirms the very good sorption properties of the eggshells.
Figure 6.
Concentration of direct blue BR 200 dye (Argus, Poland) in adsorbent grains vs. adsorption time for different flow rates of liquid in the adsorber for: (a) waste chicken eggshells (Poland), (b) activated carbon LGCO 100 (Sorbotech, Poland).
Figure 6.
Concentration of direct blue BR 200 dye (Argus, Poland) in adsorbent grains vs. adsorption time for different flow rates of liquid in the adsorber for: (a) waste chicken eggshells (Poland), (b) activated carbon LGCO 100 (Sorbotech, Poland).
4.3. Calculations for External and Internal Diffusion
4.3.1. External Diffusion Coefficient for Dye in Water Solution
The Wilke and Chang equation (7) was applied in order to calculate the diffusion coefficient DAB for the direct blue BR 200 dye in water. The details of the calculations are available in a previous publication by the authors [38]. The following values were substituted into Formula (7): MB = 18 g/mol, ηB = 1024 cP, T = 294.15 K, = 2.6, VA = 1.106·10-3 m3/mol. It was obtained that DAB = 2.21·10−10 m2/s.
4.3.2. Internal Diffusion Coefficient for Dye in Eggshells and Activated Carbon
The results of equilibrium and kinetic studies were used to calculate the effective internal diffusion coefficient Ds for dye transport in pores of the waste chicken eggshells grains as well activated carbon Sorbotech LGCO 100 grains.
The following calculation scheme was applied to determine the Ds coefficient:
- Calculate the average volume of the cylindrical grains using Equation (10) and then their equivalent radius Rp using Equation (9).
- For the dye concentration in solution C at a given adsorption time t, calculate the concentration of the adsorbate in the adsorbent grains q using the mass balance relationship (6) and the equilibrium concentration qeq using the appropriate equilibrium relationship from Table 1. Equilibrium concentrations in the solid phase should be treated as concentrations on the outer surface of the grain qeq = qb.
- Calculate Y using Equation (14).
- Determine the value of τ from the rearranged Equation (17), (18) or (19) depending on the value of Y.
- Calculate Ds from Equation (15).
The results of calculations for the internal diffusion coefficient Ds are presented in Table 3 and Table 4. To calculate the equilibrium concentrations in the solid phase qeq = qb, the Sips isotherm was used for eggshells and activated carbon. It was selected based on its very good agreement with the experimental results. The symbol u in Table 4 denotes the apparent velocity of the solution in the adsorber [m/s]:
where Qv—volumetric flow rate of the liquid in the adsorber [m3/s]; S = πd2/4—cross-sectional area of the adsorber [m2] which diameter is d = 12.5·10-3 [m].
The values of Ds in Table 4 are the average values for the consecutive adsorption times during the kinetics measurements. However, the equilibrium concentrations qeq for consecutive C values were used in the calculation procedure for Ds estimation. At short adsorption times, the actual concentrations C during the kinetic measurements were outside the range of equilibrium data presented in Figure 3. Therefore, the diffusion coefficients presented in Table 4 refer only to relatively long times of adsorption process. In the future studies, broader equilibrium measurements may be considered. This would allow one to extend the diffusion coefficients calculations.
Comparing the values of the external mass transfer coefficient DAB (see: Section 4.3.1) for the considered dye in water with the values of the effective internal mass transfer coefficients Ds presented in Table 4 for both sorbents, one may conclude that all the internal coefficients Ds are smaller the external coefficient DAB. This is consistent with theoretical expectations . The internal diffusion coefficient Ds for porous materials is smaller than the “regular” coefficient DAB in the liquid phase, which results from the facts that:
(1) in porous materials the diffusion occurs only in pores i.e., only in some fraction of the grains volume;
(2) due to pore tortuosity, the actual diffusion path is longer than the grain geometry would suggest.
On the basis of Table 4 one may also conclude that the internal diffusion coefficient depends on the flow rate of solution flowing around the grains. The greater the flow rate, the greater the Ds value. Moreover, for all the flow rate values the coefficients Ds for eggshells are greater than for activated carbon. This fact is connected with the very good sorption properties of the eggshells toward the considered textile dye.
It may be seen in Table 3 that the equivalent radius for activated carbon is much smaller than for eggshells. Taking into account the fact that the smaller grains, the smaller the internal diffusion resistance, one may conclude that there is a possibility of further enhancing the sorption capacity of the eggshells by the fragmentation of their grains. This would make the value of Ds for the eggshells even greater than those presented in Table 4.
5. Conclusions
This paper presents the results of the experimental studies on the equilibrium and kinetics of adsorption of a textile dye onto waste chicken. The experimental investigations conducted in this study demonstrate that waste chicken eggshells constitute an efficient and technically promising biosorbent for the removal of the textile dye direct blue BR 200 from aqueous solutions. The equilibrium measurements show that eggshells exhibit substantially higher adsorption capacity than activated carbon across the entire concentration range analyzed. This conclusion is based on the steeper course of the experimental isotherm for eggshells than for activated carbon. It confirms the suitability of eggshells for applications in liquid–solid separation processes involving dye-contaminated water.
The analysis of adsorption equilibrium for eggshells revealed that the linear Henry isotherm does not adequately describe the dye–eggshell system, indicating a nonlinear adsorption behavior. The Langmuir model also fails to represent the equilibrium data for eggshells, which suggests that adsorption is not monolayer in nature. In contrast, both the Freundlich and BET models provide a satisfactory description indicating the multilayer adsorption. The best agreement with the experimental data was obtained using the Langmuir–Freundlich (Sips) isotherm, which captures both the heterogeneity of the adsorbent surface and the finite sorption capacity. For activated carbon, all considered isotherm models fitted the data, but the Sips equation again provides the most accurate representation of the equilibrium data.
The kinetic studies conducted in a fixed-bed recirculating system enabled the determination of key mass transfer parameters. The external diffusion coefficient calculated using the Wilke–Chang correlation (DAB = 2.21·10⁻¹⁰ m²/s) provides a reference for evaluating transport resistance in the liquid phase. The internal diffusion coefficients obtained from the solution of Fick’s unsteady-state diffusion equation show that internal diffusion coefficient is smaller than the external diffusion coefficient. Therefore, the internal diffusion constitutes the dominant resistance controlling the overall adsorption rate. Importantly, the internal diffusion coefficient increases with the liquid flow rate, reflecting enhanced mass transfer under intensified hydrodynamic conditions. For all investigated flow rates, the internal diffusion coefficient for eggshells is higher than that for activated carbon. It confirms the favorable transport properties of the biosorbent.
The obtained values of the internal diffusion coefficient Ds for the eggshells were 2.55·10−11 m2/s, 4.59·10−11 m2/s, 1.92·10−10 m2/s, for the flow rates 1.72 cm3/s, 2.31 cm3/s and 2.90 cm3/s, respectively. These Ds values refer to the equivalent radius of the eggshells grains Rp = 0.00146 m. The Ds value can by made higher by lowering the Rp value i.e., by the further fragmentation of eggshells grains. This opens up possibilities for further improvement of the sorption properties of eggshells.
Overall, the results of equilibrium and kinetic studies indicate that waste chicken eggshells exhibit very good sorption properties toward direct blue BR 200 dye. Their adsorption capacity exceeds that of activated carbon. The isotherm parameters and diffusion coefficients obtained in this work may constitute a valuable dataset for the design, modeling, and optimization of adsorption-based water treatment processes employing biosorbents.
Author Contributions
Conceptualization, M.G.; methodology, M.G., D.B.; validation, M.G., D.B.; formal analysis, M.G., D.B.; investigation, A.M., M.R.; calculations, M.G., A.M., M.R.; resources, M.G., D.B., A.M., M.R.; data curation, M.G., A.M., M.R.; writing—original draft preparation, M.G., D.B.; writing—review and editing, M.G., D.B., A.M., M.R.; visualization, M.G., D.B.; supervision, M.G. All authors have read and agreed to the published version of the manuscript.
Funding
This research received no external funding.
Institutional Review Board Statement
Not applicable.
Informed Consent Statement
Not applicable.
Data Availability Statement
The original data presented in the study are openly available in Zenodo.org at https://doi.org/10.5281/zenodo.21084073.
Conflicts of Interest
The authors declare no conflicts of interest.
References
- Pai, S.; Kini, M.S.; Selvaraj, R. A review on adsorptive removal of dyes from wastewater by hydroxyapatite nanocomposites. Environ. Sci. Pollut. Res. 2021, 28, 11835–11849. [Google Scholar] [CrossRef]
- Crini, G. Non-conventional low-cost adsorbents for dye removal: A review. Bioresour. Technol. 2006, 97, 1061–1085. [Google Scholar] [CrossRef] [PubMed]
- Zhou, Y.; Lu, J.; Zhou, Y.; Liu, Y. Recent advances for dyes removal using novel adsorbents: A review. Environ. Pollut. 2019, 252(A), 352–365. [Google Scholar] [CrossRef]
- Kumar, P.S.; Joshiba, G.J.; Femina, C.C.; Varshini, P.; Priyadharshini, S.; Karthick, M.S.; Jothirani, R. A critical review on recent developments in the low-cost adsorption of dyes from wastewater. Desalin. Water Treat. 2019, 172, 395–416. [Google Scholar] [CrossRef]
- Alsukaibi, A.K.D. Various approaches for the detoxification of toxic dyes in wastewater. Processes 2022, 10, 1968. [Google Scholar] [CrossRef]
- Valli Nachiyar, C.; Rakshi, A.D.; Sandhya, S.; Britlin Deva Jebasta, N.; Nellore, J. Developments in treatment technologies of dye-containing effluent: A review. Case Stud. Chem. Environ. Eng. 2023, 7, 100339. [Google Scholar] [CrossRef]
- Dutta, S.; Gupta, B.; Srivastava, S.K.; Gupta, A.K. Recent advances on the removal of dyes from wastewater using various adsorbents: a critical review. Mater. Adv. 2021, 2, 4497. [Google Scholar] [CrossRef]
- Gupta, V.K.; Suhas. Application of low-cost adsorbents for dye removal – A review. J. Environ. Manag. 2009, 90, 2313–2342. [Google Scholar] [CrossRef]
- Weng, C.-H.; Lin, Y.-T.; Tzeng, T.-W. Removal of methylene blue from aqueous solution by adsorption onto pineapple leaf powder. J. Hazard. Mater. 2009, 170, 417–424. [Google Scholar] [CrossRef] [PubMed]
- Farnane, M.; Tounsadi, H.; Machrouhi, A.; Elhalil, A.; Mahjoubi, F. Z.; Sadiq, M.; Abdennouri, M.; Qourzal, S.; Barka, N. Dye removal from aqueous solution by raw maize corncob and H3PO4 activated maize corncob. J. Water Reuse Desalin. 2018, 8(2), 214–224. [Google Scholar]
- Gkika, D.A.; Kyzas, G.Z. Reusability of spent adsorbents for a circular materials economy in the sustainable chemical industry. RSC Sustain. 2026, 4, 1023. [Google Scholar] [CrossRef]
- Shkliarenko, Y.; Halysh, V.; Nesterenko, A. Adsorptive performance of walnut shells modified with urea and surfactant for cationic dye removal. Water 2023, 15, 1536. [Google Scholar] [CrossRef]
- Mezohegyi, G.; van der Zee, F.P.; Font, J.; Fortuny, A.; Fabregat, A. Towards advanced aqueous dye removal processes: A short review on the versatile role of activated carbon. J. Environ. Manag. 2012, 102, 148–164. [Google Scholar] [CrossRef]
- Gayathiri, M.; Pulingam, T.; Lee, K.T.; Sudesh, K. Activated carbon from biomass waste precursors: Factors affecting production and adsorption mechanism. Chemosphere 2022, 294, 133764. [Google Scholar] [CrossRef] [PubMed]
- Shen, K.; Gondal, M.A. Removal of hazardous Rhodamine dye from water by adsorption onto exhausted coffee ground. J. Saudi Chem. Soc. 2017, 21, S120–S127. [Google Scholar] [CrossRef]
- Khosla, E.; Kaur, S.; Dave, P.N. Tea waste as adsorbent for ionic dyes. Desalin. Water Treat. 2013, 51, 6552–6561. [Google Scholar] [CrossRef]
- Sahmoune, M.N.; Yeddou, A.R. Potential of sawdust materials for the removal of dyes and heavy metals: examination of isotherms and kinetics. Desalin. Water Treat. 2016, 57, 24019–24034. [Google Scholar] [CrossRef]
- Doulati Ardejani, F.; Badii, Kh.; Yousefi Limaee, N.; Shafaei, S.Z.; Mirhabibi, A.R. Adsorption of Direct Red 80 dye from aqueous solution onto almond shells: Effect of pH, initial concentration and shell type. J. Hazard. Mater. 2008, 151, 730–737. [Google Scholar] [CrossRef] [PubMed]
- do Nascimento, G.E.; Duarte, M.M.; Campos, N.F.; da Rocha, O.R.; da Silva, V.L. Adsorption of azo dyes using peanut hull and orange peel: a comparative study. Environ. Technol. 2014, 35(11), 1436–1453. [Google Scholar] [CrossRef] [PubMed]
- Srivastava, R.; Rupainwar, D.C. Eucalyptus bark powder as an effective adsorbent: Evaluation of adsorptive characteristics for various dyes. Desalin. Water Treat. 2009, 11, 302–313. [Google Scholar] [CrossRef]
- Sen, T.K. Adsorptive removal of dye (methylene blue) organic pollutant from water by pine tree leaf biomass adsorbent. Processes 2023, 11, 1877. [Google Scholar] [CrossRef]
- Tsai, W.T.; Yang, J.M.; Lai, C.W.; Cheng, Y.H.; Lin, C.C.; Yeh, C.W. Characterization and adsorption properties of eggshells and eggshell membrane. Bioresour. Technol. 2006, 97, 488–493. [Google Scholar] [CrossRef] [PubMed]
- Podstawczyk, D.; Witek-Krowiak, A.; Chojnacka, K.W.; Sadowski, Z. Biosorption of malachite green by eggshells mechanism identification and process optimization. Bioresour. Technol. 2014, 160, 161–165. [Google Scholar] [CrossRef] [PubMed]
- Kinayturk, N.K.; Tunali, B.; Altug, D.T. Eggshell as a biomaterial can have a sorption capability on its surface: A spectroscopic research. R Soc. Open. Sci. 2021, 8, 210100. [Google Scholar] [CrossRef] [PubMed]
- Kalayci, T.; Altug, D.T.; Kinayturk, N.K.; Tunali, B. Characterization and potential usage of selected eggshell species. Sci. Rep. 2025, 15, 6241. [Google Scholar] [CrossRef] [PubMed]
- Azeem, A.A.; Khalek, M.A.A.; Hamid, E.M.A. A novel approach to modifying eggshell-based adsorbent for the removal of acid red 1 and crystal violet dyes: kinetics, isotherm, and thermodynamics study. Sci. Rep. 2026, 16, 8721. [Google Scholar] [CrossRef] [PubMed]
- Hamid, S.H.A. Preparation and characterization of waste eggshell as potential new biosorbent. Final year dissertation, Universiti Teknologi Petronas, Malaysia, 2014. [Google Scholar]
- Awogbemi, O.; Inambao, F.; Onuh, E.I. Modification and characterization of chicken eggshell for possible catalytic applications. Heliyon 2020, 6(10), e05283. [Google Scholar] [CrossRef] [PubMed]
- Harripersadth, Ch.; Musonge, P.; Isa, Y.M.; Morales, M.G.; Sayago, A. The application of eggshells and sugarcane bagasse as potential biomaterials in the removal of heavy metals from aqueous solutions. S. Afr. J. Chem. Eng. 2020, 34, 142–150. [Google Scholar] [CrossRef]
- Do, D.D. Adsorption Analysis: Equilibria and Kinetics, 1st ed.; Imperial College Press: London, United Kingdom, 1998. [Google Scholar]
- Wang, J.; Huang, C.P.; Allen, H.E.; Cha, D.K.; Kim, D.-W. Adsorption characteristics of dye onto sludge particulates. J. Colloid Interface Sci. 1998, 208(2), 518–528. [Google Scholar] [CrossRef] [PubMed]
- de Vargas Briao, G.; da Silva, M.G.C.; Vieira, M.G.A.; Chu, K.H. Correlation of type II adsorption isotherms of water contaminants using modified BET equations. Colloids Interface Sci. Commun. 2022, 46, 100557. [Google Scholar] [CrossRef]
- Paderewski, M.L. Adsorption Processes in Chemical Engineering (in Polish), 1st ed.; WNT: Warsaw, Poland, 1999. [Google Scholar]
- Ruthven, D.M. Principles of Adsorption and Adsorption Processes, 1st ed.; John Wiley & Sons, Inc., 1984. [Google Scholar]
- Poling, B.; Prausnitz, J.; O’Connell, J. The Properties of Gases and Liquids, 5th ed.; McGraw Hill, 2004. [Google Scholar]
- Kupiec, K. Kinetic Problems in Adsorber Modeling, 1st ed.; Cracow University of Technology Press: Krakow, Poland, 1998. [Google Scholar]
- Tanaka, S.; Fujita, K.; Miyake, Y.; Miyamoto, M.; Hasegawa, Y.; Makino, T.; Van der Perre, S.; Remi, J.C.S.; Van Assche, T.; Baron, G.V.; Denayer, J.F.M. Adsorption and Diffusion Phenomena in Crystal Size Engineered ZIF-8 MOF. J. Phys. Chem. C. 2015, 119(51). [Google Scholar] [CrossRef]
- Gwadera, M.; Brzoskwinia, P.; Hnatyk, Sz.; Kazberuk, G. Mass transfer resistance considerations for dye adsorption on activated carbon. Purification 2025, 1(1), 4. [Google Scholar] [CrossRef]
Figure 1.
Chemical structure of direct blue BR 200 dye (Poland).
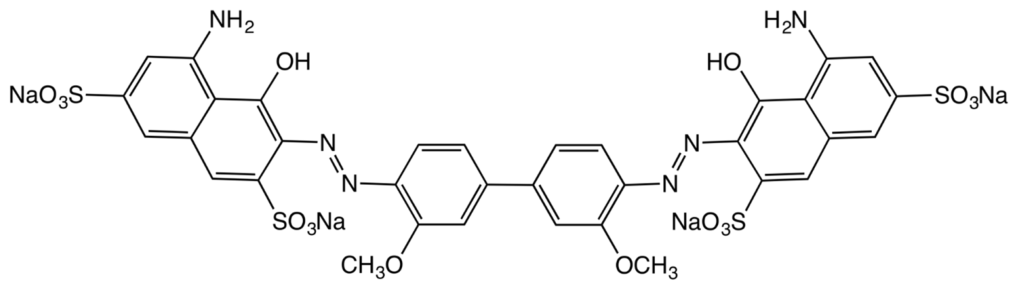
Figure 2.
Schematic representation of the experimental setup used for adsorption kinetics studies: 1 - adsorbent grains in an adsorber column, 2 - liquid solution containing the adsorbate, 3 - laboratory stirrer.
Figure 2.
Schematic representation of the experimental setup used for adsorption kinetics studies: 1 - adsorbent grains in an adsorber column, 2 - liquid solution containing the adsorbate, 3 - laboratory stirrer.
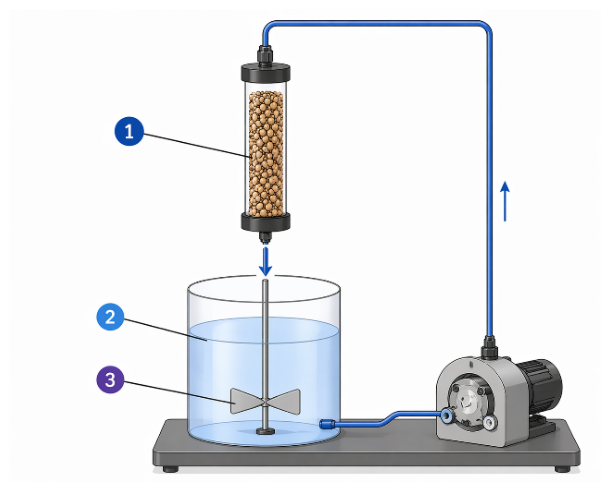
Figure 3.
Experimental isotherms at 21 °C for adsorption of direct blue BR 200 dye (Argus, Poland) on waste chicken eggshells (Poland) and activated carbon LGCO 100 (Sorbotech, Poland).
Figure 3.
Experimental isotherms at 21 °C for adsorption of direct blue BR 200 dye (Argus, Poland) on waste chicken eggshells (Poland) and activated carbon LGCO 100 (Sorbotech, Poland).
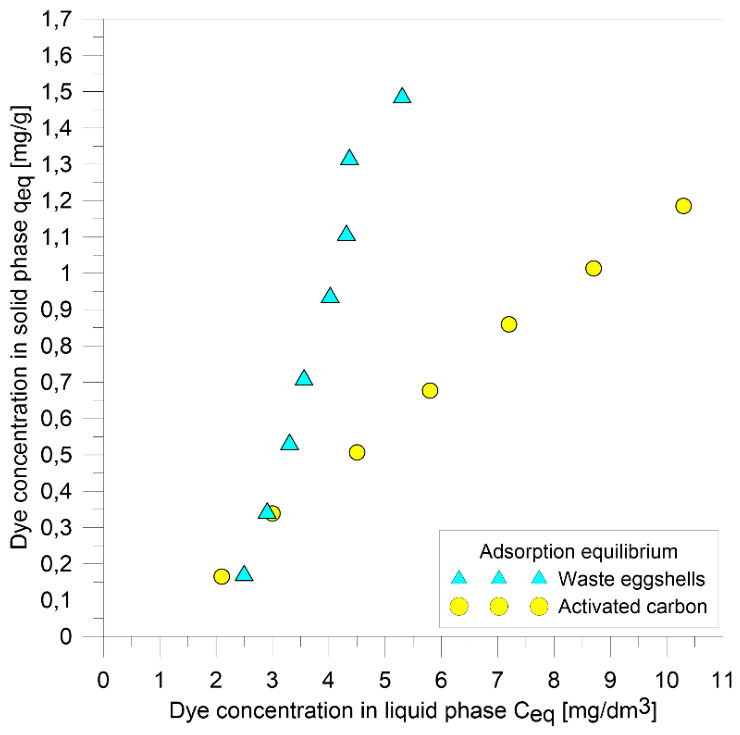
Figure 4.
Adsorption isotherm models fitting for: (a) waste chicken eggshells (Poland), (b) activated carbon LGCO 100 (Sorbotech, Poland).
Figure 4.
Adsorption isotherm models fitting for: (a) waste chicken eggshells (Poland), (b) activated carbon LGCO 100 (Sorbotech, Poland).
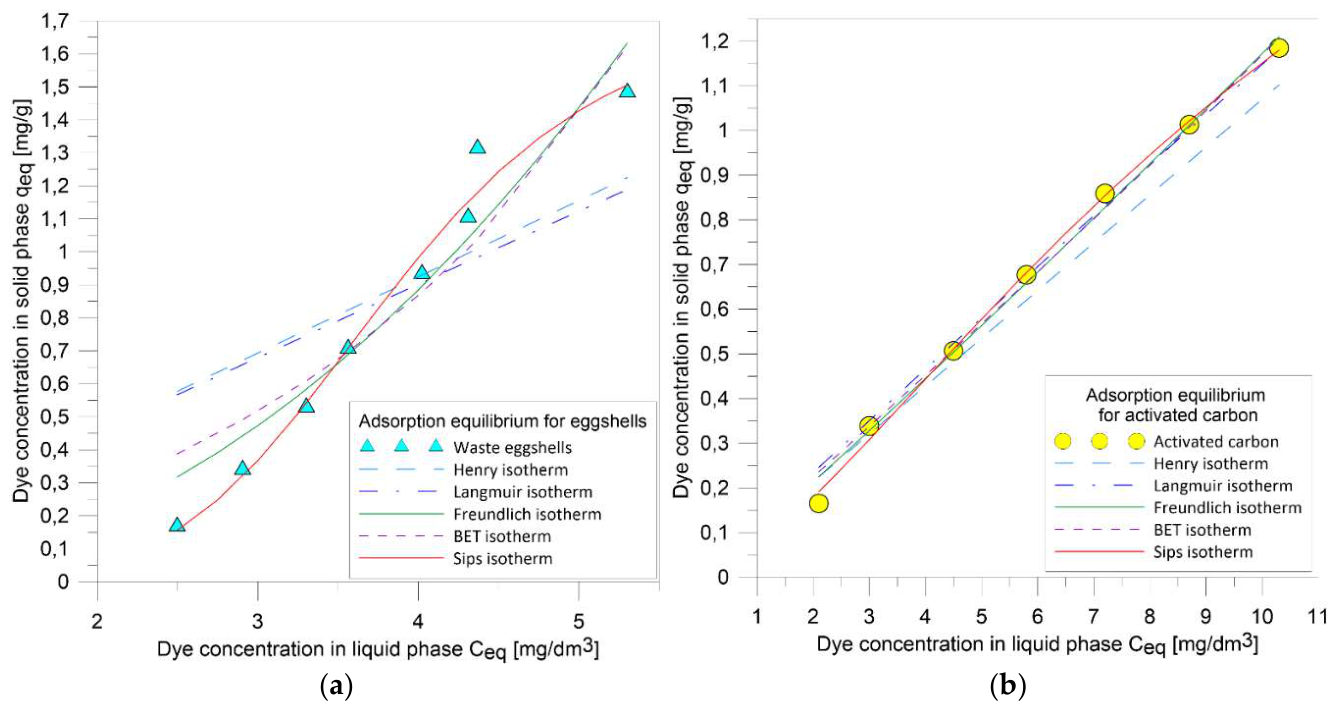
Figure 5.
Concentration of direct blue BR 200 dye (Argus, Poland) in water solutions vs. time for adsorption on: (a) waste chicken eggshells (Poland); (b) activated carbon LGCO 100 (Sorbotech, Poland).
Figure 5.
Concentration of direct blue BR 200 dye (Argus, Poland) in water solutions vs. time for adsorption on: (a) waste chicken eggshells (Poland); (b) activated carbon LGCO 100 (Sorbotech, Poland).
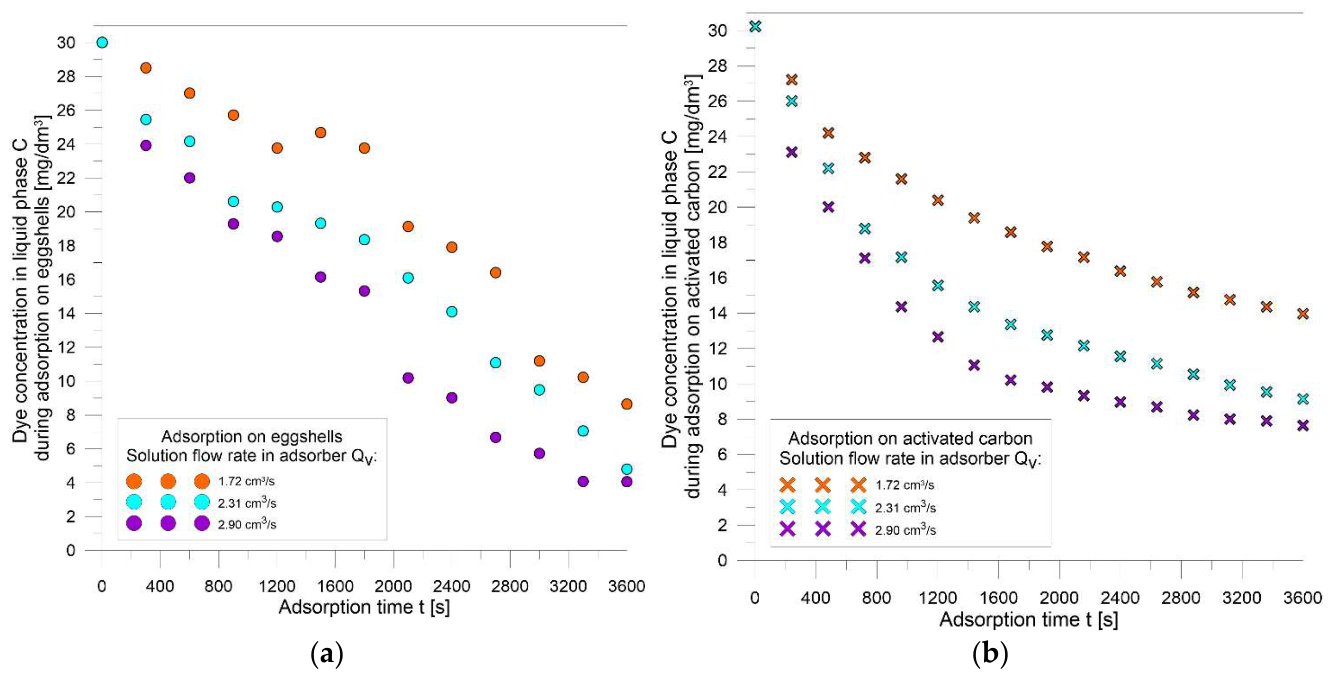
Figure 6.
Concentration of direct blue BR 200 dye (Argus, Poland) in water solutions vs. adsorption time for waste chicken eggshells (Poland) and activated carbon LGCO 100 (Sorbotech, Poland) for different flow rates of liquid in the adsorber: (a) Qv = 1.72 cm3/s, (b) Qv = 2.31 cm3/s, (c) Qv = 2.90 cm3/s.
Figure 6.
Concentration of direct blue BR 200 dye (Argus, Poland) in water solutions vs. adsorption time for waste chicken eggshells (Poland) and activated carbon LGCO 100 (Sorbotech, Poland) for different flow rates of liquid in the adsorber: (a) Qv = 1.72 cm3/s, (b) Qv = 2.31 cm3/s, (c) Qv = 2.90 cm3/s.
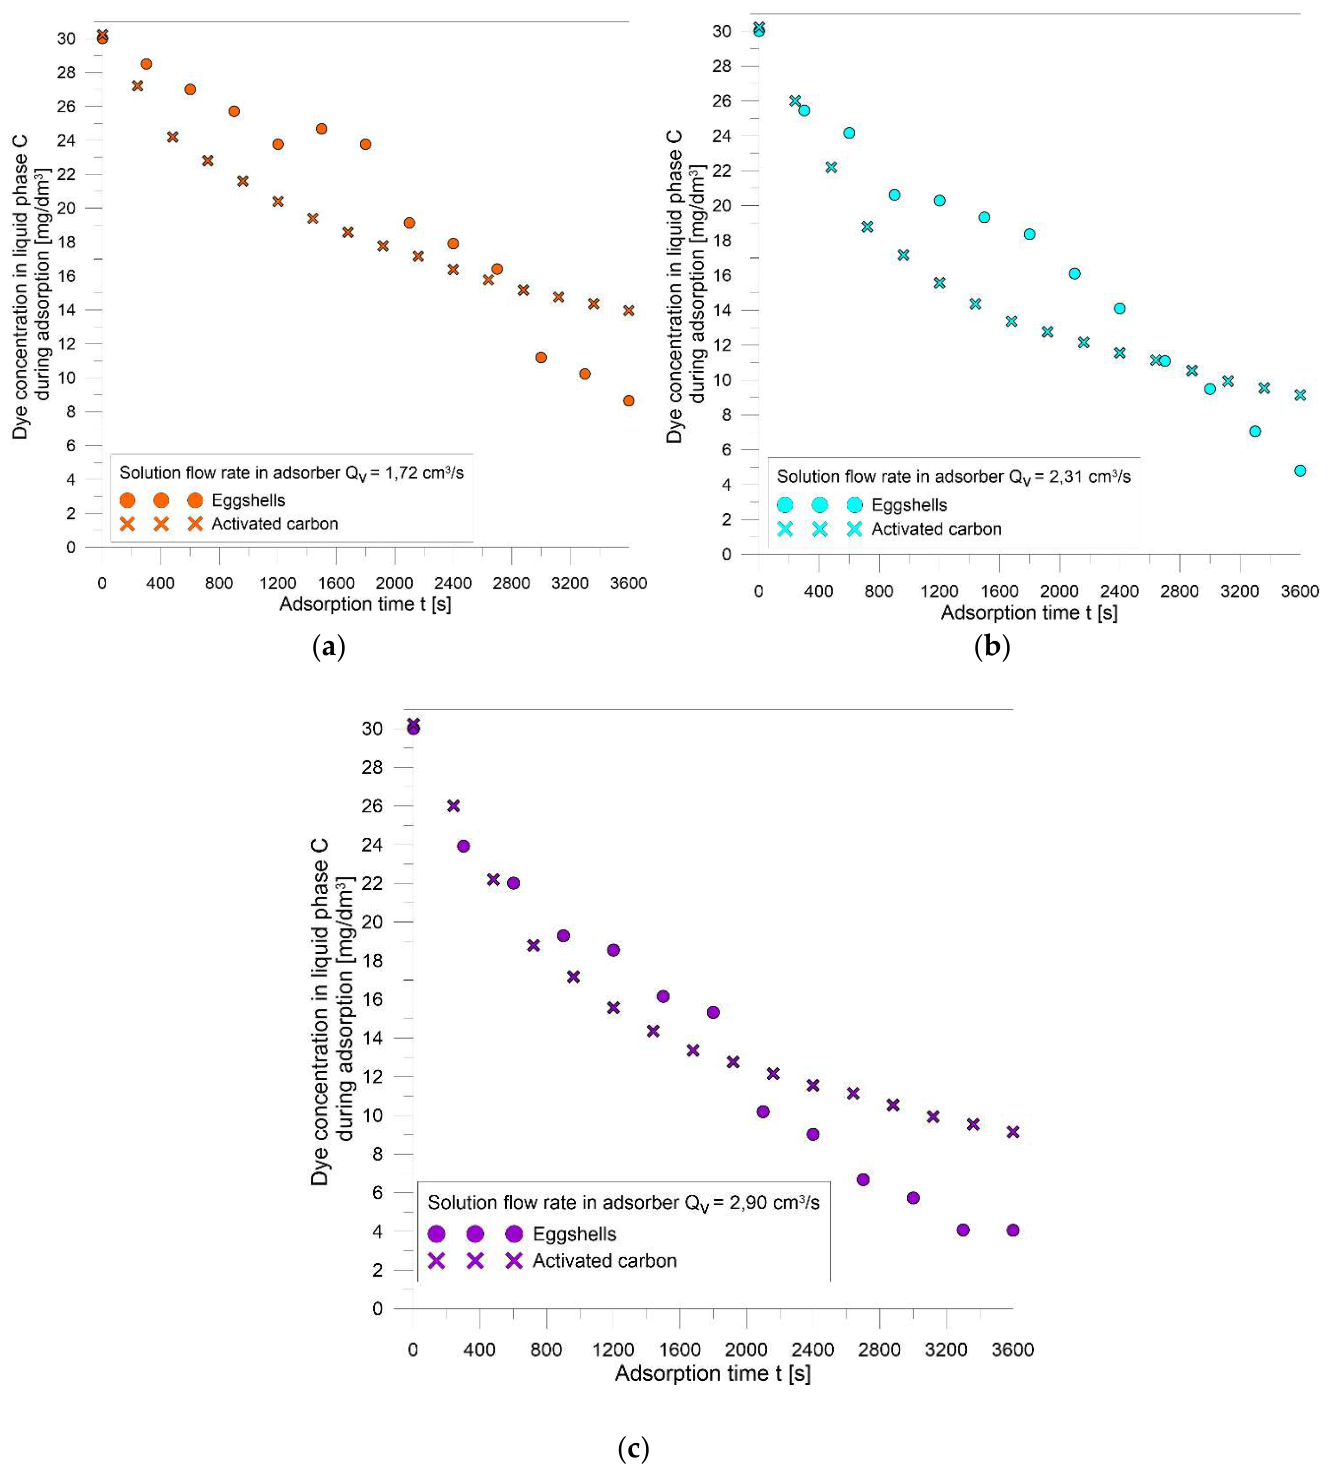

Table 1.
Adsorption isotherm equations and definitions of model parameters. – adsorbate concentration in adsorbent grains at equilibrium [mg/g]; – adsorbate concentration in the liquid phase at equilibrium [mg/dm3].
Table 1.
Adsorption isotherm equations and definitions of model parameters. – adsorbate concentration in adsorbent grains at equilibrium [mg/g]; – adsorbate concentration in the liquid phase at equilibrium [mg/dm3].
| Name of isotherm | Isotherm Equation | Symbols Description |
|---|---|---|
| Henry isotherm |
(1) | K – linear equilibrium constant [dm3/ mg] |
| Langmuir isotherm | (2) |
– monolayer adsorbate concentration [mg/g] B – adsorption affinity [dm3/ mg] |
| Freundlich isotherm | (3) | KF – Freundlich equilibrium constant νF – surface heterogeneity constant |
| Langmuir- Freundlich (Sips) isotherm |
(4) |
– monolayer adsorbate concentration [mg/g] BS – adsorption affinity in L-F isotherm [dm3/ mg] νS – L-F isotherm surface heterogeneity constant |
| BET isotherm |
(5) |
– monolayer adsorbate concentration [mg/g] B1, B2 – BET isotherm constants [dm3/ mg] |
Table 2.
Isotherm constants and Sum of Squared Deviations SSD for adsorption of direct blue BR 200 dye (Argus, Poland) on waste chicken eggshells (Poland) and activated carbon LGCO 100 (Sorbotech, Poland).
Table 2.
Isotherm constants and Sum of Squared Deviations SSD for adsorption of direct blue BR 200 dye (Argus, Poland) on waste chicken eggshells (Poland) and activated carbon LGCO 100 (Sorbotech, Poland).
|
Name of isotherm |
Adsorbent | |||
|---|---|---|---|---|
| Chicken eggshells | Activated Carbon | |||
| Isotherm Constants |
Sum of Squares SSD |
Isotherm Constants |
Sum of Squares SSD | |
| Henry isotherm |
K = 0.231 | 0.449 | K = 0.107 | 0.0292 |
| Langmuir isotherm | qeq∞ = 56.0 B = 0.00410 |
0.444 | qeq∞ = 46.4 B = 0.00254 |
0.00781 |
| Freundlich isotherm | KF = 2.18 νF = 0.0434 |
0.099 | KF = 1.06 νF = 0.103 |
0.00561 |
| Langmuir- Freundlich (Sips) isotherm |
= 1.76 BS = 0.261 νS = 5.43 |
0.0242 |
= 2.61 BS = 0.0853 νS = 1.47 |
0.00181 |
| BET isotherm |
= 23.2 B1 = 0.00423 B2 = 0.0838 |
0.165 |
= 3.33 B1 = 0.0336 B2 = 0.0175 |
0.00687 |
Table 3.
Equivalent grain radius Rp calculations.
| Eggshells | Activated carbon | |
|---|---|---|
| Sample mass ma [g] | 2.58 | 2.58 |
| Average number of grains in a sample N [-] | 85 | 1004 |
| Apparent density of grains [kg/m3] | 2314 | 2310 |
| Equivalent radius Rp [m] | 0.00146 | 0.000643 |
Table 4.
Internal diffusion coefficient Ds calculations.
| Qv [cm3/s] | u [m/s] |
Eggshells | Activated carbon | |||
|---|---|---|---|---|---|---|
| Ds [m2/s] | Applicability time range [s] |
Ds [m2/s] | Applicability time range [s] |
|||
| 1.72 | 0.138 | 2.55·10−11 | > 3300 | 4.29·10−12 | > 3360 | |
| 2.31 | 0.185 | 4.59·10−11 | > 3300 | 1.02·10−11 | > 2880 | |
| 2.90 | 0.236 | 1.92·10−10 | > 3000 | 2.18·10−11 | > 1680 | |
Disclaimer/Publisher’s Note: The statements, opinions and data contained in all publications are solely those of the individual author(s) and contributor(s) and not of MDPI and/or the editor(s). MDPI and/or the editor(s) disclaim responsibility for any injury to people or property resulting from any ideas, methods, instructions or products referred to in the content. |
© 2026 by the authors. Licensee MDPI, Basel, Switzerland. This article is an open access article distributed under the terms and conditions of the Creative Commons Attribution (CC BY) license (http://creativecommons.org/licenses/by/4.0/).
Copyright: This open access article is published under a Creative Commons CC BY 4.0 license, which permit the free download, distribution, and reuse, provided that the author and preprint are cited in any reuse.


