

Submitted:
15 July 2026
Posted:
15 July 2026
You are already at the latest version
Abstract
Background/Objectives: Heat stress compromises cattle production, health, and welfare, but bovine transcriptomic studies span tissues and experimental settings. We sought gene-level effects and biological programs that recur across in vivo studies while preserving each study design. Methods: We uniformly reprocessed 107 bulk RNA-seq libraries from five Bos taurus studies, estimated heat-versus-control effects within study, and integrated log2 fold changes using restricted maximum-likelihood random-effects models. Modified Knapp–Hartung inference, prediction intervals, and Benjamini–Hochberg correction calibrated small-study uncertainty. A six-component heat-stress transcriptomic stability index (HSTSI), ten score definitions, five complete leave-one-study-out analyses, and directional enrichment assessed recurrence. Results: Among 16,756 genes, normal-approximation inference identified 19 at false-discovery rate (FDR) < 0.05, whereas none met FDR < 0.10 under modified Knapp–Hartung inference. IL1R2 ranked first by HSTSI (meta log2 fold change =0.82; 95% prediction interval, 0.31–1.33). Study deletion retained 68–117 of the top 200, and every estimable member preserved direction. IL1R2, SDCBP2, and GZMK were retained under all ten definitions and CD8A under nine. Proteostasis, translation, oxidative phosphorylation, and heat-response programs shifted positively; T-cell signaling, antigen presentation, cytotoxicity, cell-cycle, and small-GTPase programs shifted negatively. Of 266 full-data FDR-significant pathways, 259 retained direction in all five deletions and 21 remained FDR-significant throughout. Conclusions: Recurrence was strongest for coordinated biological programs. The graded candidate set supports tissue-matched validation without treating ranking as statistical significance.
Keywords:
cattle
; heat stress
; RNA sequencing
; random-effects meta-analysis
; modified Knapp–Hartung
; transcriptomics
; gene-set enrichment
; leave-one-study-out analysis
1. Introduction
Heat stress is a recurring constraint on cattle production because the physiological work required to dissipate heat competes with lactation, growth, reproduction, and immune function. Across dairy-cow experiments, heat exposure reduces dry-matter intake, milk yield, and feed efficiency, while consequences extend beyond production to inflammatory control, disease susceptibility, and animal welfare [1,2,3]. Genetic selection and molecular phenotyping may complement environmental cooling and nutritional management, but thermotolerance is polygenic and biologically distributed. Molecular candidates intended for later thermotolerance studies therefore need heat-response evidence that extends beyond one tissue, one exposure protocol, or one processing strategy [4,5].
Bulk RNA sequencing has revealed several parts of the bovine heat-stress response. Mammary studies have described heat-shock, involution, metabolic, and milk-synthesis programs [6,7,8]. Liver studies have implicated mitochondrial energy metabolism, protein folding, inflammation, and nutrient partitioning [9,10]. Skin transcriptomics has linked thermal status to local metabolic, antioxidant, and immune responses [11], while recent blood and multi-omics work has extended the response to systemic immunity, metabolism, and intergenerational exposure [12,13,14]. These studies are complementary, but reported differentially expressed gene lists do not preserve a common effect scale or its uncertainty. Differences in reference annotation, preprocessing, filtering, tissue composition, exposure definition, and statistical power can therefore masquerade as biological disagreement. The unresolved question is not whether cattle respond transcriptionally to heat, but which effects recur on a common scale after study design and small-sample uncertainty are preserved.
Cross-study synthesis introduces a second problem: only a few eligible in vivo studies are available. Standard random-effects meta-analysis estimates an average effect and between-study variance, but normal-approximation intervals can be too narrow when the number of studies is small and study precisions differ. Modified Knapp–Hartung inference uses a distribution and prevents the adjusted standard error from becoming smaller than its conventional counterpart, yielding more reliable error control in small- settings [15]. Prediction intervals add a different piece of information by estimating the range of true effects expected in a comparable future context rather than only the uncertainty around the mean effect [16]. These distinctions are especially relevant for transcriptome-wide meta-analysis, where thousands of genes are tested and the number of contributing studies varies by gene.
Here, we asked at which level of biological organization the bovine heat response remains reproducible across heterogeneous in vivo studies. Five public datasets were reprocessed against one bovine reference, while heat-versus-control effects were estimated within each original study design. REML random-effects models and modified Knapp–Hartung inference quantified gene-level evidence. HSTSI then combined inferential support, effect magnitude, study coverage, direction consistency, heterogeneity, and gene-level jackknife stability to prioritize candidates. Weight perturbation, alternative score definitions, and five complete study deletions tested that ranking. Directional enrichment and pathway-level study deletion evaluated whether coordinated biological programs were more recurrent than individual gene ranks. This design separates formal gene-level inference, graded candidate stability, and pathway recurrence, thereby defining both the shared response and its context dependence.
2. Materials and Methods
2.1. Dataset Search, Eligibility, and Contrast Definition
NCBI GEO/DataSets, NCBI SRA, and EBI BioStudies were searched through 11 June 2026. Search terms combined heat stress, thermal stress, heat load, high temperature, or hyperthermia with Bos taurus, cattle, bovine, or dairy cow, together with RNA-seq or transcriptome terms. After title and metadata de-duplication, 23 plausible GEO series underwent eligibility assessment; five were included and 18 were excluded. Primary-analysis eligibility required an in vivo Bos taurus bulk RNA-seq experiment, contemporaneous heat-stress and non-heat comparison groups, at least three biological units per group, and publicly accessible raw reads. In vitro, organoid, single-cell or single-nucleus, developmental-only, technical library-preparation, and longitudinal before–after studies without a concurrent non-heat group were excluded. Complete search strings, candidate records, evidence links, and final decisions are provided in Supplementary Table S1.
Five studies met these criteria: GSE108840, GSE226351, GSE227323, GSE244620, and GSE289946 (Table 1). Contrasts were defined from GEO SOFT records, SRA run metadata, and the corresponding articles before differential-expression analysis [6,9,10,11,12]. GSE108840 contributed 48 post-dry-off mammary libraries from 12 cows and retained time in the model. GSE226351 contributed the thermoneutral and heat-stressed liver groups; its pair-fed group was excluded from the primary contrast. GSE227323 contributed postnatally cooled and heat-stressed calf liver samples. GSE244620 contributed control and heat-stress case skin samples. GSE289946 contributed dam whole-blood samples; offspring and samples without heat-stress information were excluded. The resulting primary dataset contained 107 libraries (Supplementary Tables S2 and S3).
2.2. Read Processing and Transcript Quantification
FASTQ files were checked against the provider-supplied integrity information and evaluated with FastQC 0.12.1 and MultiQC 1.35. Adapter and quality trimming used Trim Galore 2.2.0 with a Phred threshold of 20 and a minimum retained length of 36 nucleotides. All studies were quantified against the Ensembl release 110 Bos taurus ARS-UCD1.2 cDNA reference. Salmon quantification used automatic library-type detection, selective alignment validation, sequence-bias correction, and GC-bias correction [17]. Both single-end and paired-end libraries were handled according to their run metadata.
2.3. Gene-Level Import and Study-Specific Differential Expression
Transcript estimates were summarized to Ensembl gene identifiers with tximport 1.38.2 using type = salmon, ignoreTxVersion = TRUE, and countsFromAbundance = no [18]. This passes estimated counts and effective lengths to DESeq2 so that gene-level offsets retain transcript-length information. Concordance with a parallel transcript-to-gene aggregation was evaluated using library-level Pearson correlations and median absolute log-scale differences (Supplementary Figure S1; Supplementary Tables S4 and S16).
Differential expression was estimated separately for each study with DESeq2 1.50.2 [19]. Genes were retained when counts were at least 10 in at least 20% of the included libraries for that study. GSE108840 used the design ~time + analysis_group; the other four studies used ~analysis_group. Unshrunken maximum-likelihood log2 fold changes and their Wald standard errors were used as the meta-analysis inputs. In every model, the reported coefficient was heat relative to control, so a positive log2 fold change denotes higher expression in the heat-stress group. No pooled all-library differential-expression model was used.
2.4. Random-Effects Meta-Analysis and Small-Sample Inference
For gene in study , the DESeq2 log2 fold change and its standard error were entered into a univariate random-effects model,
where is the mean cross-study effect and is the between-study variance. Models were fitted by REML with metafor 5.0-1 [20]. A gene required finite effects and positive standard errors in at least two studies. Conventional REML standard errors and normal-approximation tests were retained for calibration comparisons.
Primary inference used a modified Knapp–Hartung standard error. For each gene, the standard error was
and two-sided tests and 95% confidence intervals used a distribution with degrees of freedom [15]. The primary plug-in 95% prediction interval was
Because prediction-interval conventions are unstable when is small, classification was also repeated for genes with using the more conservative critical value. Benjamini–Hochberg correction was applied across all genes with estimable meta-analytic effects [21]. , , and the Cochran test were recorded as heterogeneity descriptors. Models that did not converge under default Fisher scoring were refitted with a step adjustment of 0.5, a maximum of 10,000 iterations, and a convergence threshold of . Persistent non-convergence was prespecified as an exclusion criterion. Fisher and signed Stouffer combinations of study-level values were secondary diagnostics, while inferential conclusions were based on the effect-size model (Supplementary Table S18).
2.5. HSTSI Construction and Sensitivity Analysis
HSTSI was calculated for every gene with an estimable random-effects model. Six components were scaled to : modified Knapp–Hartung FDR support, ; effect magnitude, ; study coverage, ; direction consistency, ; low heterogeneity, after bounding to ; and jackknife support, . Missing was assigned 0.5, and unavailable jackknife support was assigned zero. The score was
HSTSI is a prioritization score and was not used as a statistical test.
For genes represented in at least three studies, the gene-level jackknife removed each available study effect in turn and contributed only to . Weight sensitivity used 500 perturbations with random seed 20260710; each base weight was multiplied by an independent value from a uniform 0.75–1.25 distribution and then renormalized. We recorded top-200 frequency and the rank distribution for each gene. Definition sensitivity compared the base score with nine alternatives: equal component weights, six leave-one-component-out scores, a hyperbolic-tangent transformation of effect magnitude, and an effect cap of two rather than one. Rank correlation and overlap across the top 100 to top 500 genes were calculated for each alternative (Supplementary Tables S6–S8 and S19).
Separately, five complete leave-one-study-out analyses removed each study from the entire analysis and repeated random-effects fitting, modified Knapp–Hartung inference, multiple-testing correction, the nested gene-level jackknife component, and HSTSI ranking. Stability was summarized by top-200 overlap and Jaccard index, Spearman rank correlations for all genes and the full-data top 200, direction agreement, and candidate-specific rank distributions. Tier A required effects from all five studies, direction consistency at least 0.80, and complete jackknife direction agreement. It also required weight-perturbation and leave-one-study-out top-200 frequencies of at least 0.80. Tier B required effects from at least four studies, direction consistency at least 0.75, jackknife direction agreement at least 0.80, weight frequency at least 0.50, and leave-one-study-out frequency at least 0.60. Remaining genes in the top 200 were assigned Tier C. The tiers describe ranking stability; they do not define statistical significance or low heterogeneity (Supplementary Figure S3; Supplementary Tables S9 and S10).
2.6. Directional Functional Enrichment
Ensembl identifiers were mapped to bovine Entrez identifiers with org.Bt.eg.db 3.22.0. For genes with a finite meta-analytic estimate, the directional ranking statistic was . When more than one Ensembl identifier mapped to the same Entrez identifier, the entry with the largest absolute statistic was retained; exact ties were resolved by a deterministic infinitesimal Entrez-ID offset. Gene-set enrichment analysis (GSEA) used the complete ranked list, gene-set sizes from 10 to 500, and the fgsea implementation through clusterProfiler 4.18.4 [22,23]. Gene Ontology biological processes and bovine KEGG pathway–gene mappings were tested separately with seeds 20260710 and 20260720, respectively. Over-representation analysis (ORA) was performed for mapped up- and down-prioritized genes in the top 200, using all tested genes with bovine Entrez mappings as the explicit universe. All enrichment families used Benjamini–Hochberg correction. Finally, each study was deleted in turn, the modified Knapp–Hartung ranking statistic was rebuilt, and GO and KEGG GSEA were repeated with fixed deletion-specific seeds. For every full-data FDR-significant term, we recorded direction agreement and FDR recurrence across the five deletions (Supplementary Table S15).
2.7. Independent Numerical Validation
An independent implementation refitted all 16,756 gene-level random-effects models directly from the study-effect table. Estimates, heterogeneity statistics, confidence and prediction intervals, and adjusted probabilities were compared with the primary analysis. HSTSI values, prediction-interval classifications, study-deletion summaries, enrichment directions, and pathway recurrence were also reconstructed from their component tables. Software session information and the validation criteria accompany the derived results (Supplementary Tables S17 and S22).
3. Results
3.1. Five Studies Provided Complementary Contrasts Across Tissues and Life Stages
The primary analysis combined 107 libraries from mammary gland, liver, skin, and whole blood, spanning adult cows, pre-weaning calves, Holstein populations, and Brangus cattle (Figure 1). Standard tximport produced 22,372 gene rows for each study before study-specific expression filtering. Concordance with the parallel aggregation was nearly complete: the minimum library-level Pearson correlation for loge was 0.999973, and the median absolute log-scale difference was zero. The numbers of tested genes were 16,401 for GSE108840, 14,421 for GSE226351, 15,525 for GSE227323, 16,760 for GSE244620, and 13,853 for GSE289946. At within-study FDR , the corresponding differential-expression counts were 58, 161, 4, 12,116, and 284. Because these counts also reflect tissue, contrast definition, biological response, and precision, integration used the effect and standard error from each study rather than the count of differentially expressed genes.
The merged effect table contained 18,255 gene identifiers, of which 16,756 had finite effects from at least two studies and were eligible for random-effects synthesis. Of these, 15,396 were represented in at least three studies and could be evaluated by the gene-level jackknife used in HSTSI. Thus, most meta-analyzed genes supported both an average-effect estimate and repeated deletion of their contributing study effects (Supplementary Table S5).
3.2. Small-Sample Calibration Separated Average-Effect Signals from Transcriptome-Wide Evidence
Conventional REML analysis with normal-approximation tests yielded 19 genes at FDR (Figure 2A). The same mean effects yielded no gene at FDR or FDR when evaluated with modified Knapp–Hartung standard errors and critical values. The inferential contrast was largest for genes supported by few studies or unequal precision (Figure 2B). Thirty-four genes had primary 95% plug-in prediction intervals that excluded zero. With the alternative critical value, 15 retained an interval excluding zero, and 23 of the 34 primary exclusions had an estimated of zero. Point estimates were unchanged, but the strength assigned to them depended on small- calibration and the prediction-interval convention (Supplementary Figure S2).
An independent refit of all 16,756 gene models reproduced every primary estimate, heterogeneity statistic, interval, and adjusted probability within . The inferential contrast therefore reflected the specified small-sample method rather than numerical implementation.
IL1R2 illustrates a stable positive effect. All five study estimates were positive, and the pooled log2 fold change was 0.820 (modified Knapp–Hartung 95% confidence interval, 0.379 to 1.261; prediction interval, 0.315 to 1.326; ; Figure 2C). Its unadjusted modified Knapp–Hartung value was 0.00668, but its transcriptome-wide FDR was 0.802. GZMK showed a pooled negative effect (log2 fold change, ; 95% confidence and prediction interval, to ; ), with one imprecise positive study estimate and four non-positive estimates (Figure 2D).
values for the same genes; highlighted points are the 19 genes with conventional REML-z FDR
3.3. HSTSI Prioritized Candidates with Complementary Stability Profiles
HSTSI ranked all 16,756 estimable genes by combining six predefined evidence components (Figure 3A). The top 200 contained 67 genes with positive meta-analytic effects and 133 with negative effects. Based on study coverage, direction, jackknife behavior, weight perturbation, and complete leave-one-study-out performance, 43 candidates met Tier A criteria, 31 met Tier B criteria, and 126 met Tier C criteria. Tier assignment did not require low , so heterogeneity remained a separate attribute of each candidate.
IL1R2 ranked first (HSTSI 71.04, Tier A). It remained in the top 200 in all 500 weight perturbations and all five leave-one-study-out analyses; its worst deletion rank was 4. SDCBP2 ranked second (HSTSI 70.37, Tier B) and had a positive effect in each of four contributing studies. It remained among the top 200 in every perturbation and deletion analysis (worst rank, 12). GZMK ranked third (HSTSI 69.79, Tier B) and remained directionally negative in every estimable deletion, but its top-200 frequency across study deletions was 0.60 and its worst rank was 628. CD8A ranked sixth (HSTSI 67.23, Tier A), with a pooled log2 fold change of , , weight-perturbation top-200 frequency of 1.00, and deletion top-200 frequency of 0.80. The per-study heatmap and sensitivity panel distinguish candidates with similar full-data ranks but different dependence on study composition (Figure 3B,C) (Supplementary Table S20).
The broader top 200 was more sensitive to the HSTSI definition than these leading candidates. Across nine alternative definitions, all-gene Spearman correlation with the base ranking ranged from 0.505 to 1.000, and top-200 overlap ranged from 24 to 200 (Supplementary Figure S4). Removing the FDR-support component left the top 200 unchanged because modified Knapp–Hartung FDR values provided little discrimination. Removing effect magnitude produced the largest change (top-200 overlap, 24), and equal component weights retained 51 genes. IL1R2, SDCBP2, and GZMK nevertheless remained in the top 200 under all ten definitions, while CD8A remained in nine.
Canonical heat-shock genes provided a biological benchmark rather than dominating the stability ranking. HSPA1A had a positive mean effect of 0.581 but ranked 935th with ; HSPB1 ranked 1,883rd with , and HSP90AA1 ranked 4,442nd with . HSTSI therefore favored effects that recurred with stable magnitude and direction across the included contexts, rather than genes selected solely for established heat-shock biology (Supplementary Table S21).
3.4. Complete Study Deletion Preserved Direction More Strongly than Rank
Removing one study and recomputing every meta-analytic and HSTSI component changed exact top-200 membership but not the direction of the estimable genes in the full-data top 200 (Figure 4). Top-200 overlap was 117 after removing GSE108840, 106 after removing GSE226351, 83 after removing GSE227323, 68 after removing GSE244620, and 101 after removing GSE289946. The corresponding Jaccard indices were 0.413, 0.361, 0.262, 0.205, and 0.338. Across all ranked genes, Spearman correlations with the full-data ranking ranged from 0.449 to 0.858. Direction agreement for the full-data top 200 was 1.00 in every deletion, whereas median deletion ranks ranged from 169.5 to 461.5.
The difference between directional and rank stability was also visible at candidate level. IL1R2 and SDCBP2 remained near the top under all deletions. GZMK and CD8A preserved their negative direction but moved outside the top 200 in some deletions. Among stress-response candidates, MT1E and GPX3 had high weight and deletion frequencies despite high , showing that a stable composite rank can coexist with variable effect magnitude. The deletion analysis therefore supports a graded candidate resource rather than an invariant list.
3.5. Pathway Direction Recurred Across All Five Study Deletions
The full meta-analytic ranking mapped to 14,408 unique bovine Entrez identifiers. GO biological-process GSEA returned 215 terms at FDR , and KEGG GSEA returned 51 (Figure 5). Positive GO shifts included electron transport chain (normalized enrichment score [NES] 3.28, FDR ), oxidative phosphorylation (NES 3.13, FDR ), and translation (NES 2.96, FDR ). Protein folding (NES 2.56, FDR ) and response to heat (NES 2.53, FDR ) also shifted positively. KEGG confirmed the same axis through ribosome, oxidative phosphorylation, proteasome, endoplasmic-reticulum protein processing, and thermogenesis (all FDR ).
Negative GO shifts included regulation of small-GTPase signaling (NES , FDR ), T-cell receptor signaling (NES , FDR 0.0190), and antigen processing and presentation (NES , FDR 0.00471). Regulation of leukocyte-mediated cytotoxicity (NES , FDR 0.0148) and cell-cycle process (NES , FDR ) also shifted negatively. KEGG similarly identified Th1/Th2 differentiation (NES , FDR ) and cell-adhesion molecule interactions (NES , FDR 0.00121). Disease-named KEGG labels reflected shared stress modules and were not interpreted as disease evidence.
With 128 genes from the top 200 mapped to Entrez identifiers, ORA provided a focused complement to GSEA. Up-prioritized genes were enriched for zinc-ion homeostasis, detoxification, and antimicrobial or humoral responses; gluconeogenesis and hormone biosynthesis were also represented. The down-prioritized set was enriched for lymphocyte and natural-killer-cell immunity, leukocyte cytotoxicity, antigen presentation, adhesion, and cell-cycle terms. Positive humoral stress-defense terms therefore contrasted with negative lymphocyte, cytotoxic, and antigen-presentation programs.
Pathway-level recurrence was high under study deletion. Of the 266 full-data FDR-significant pathways, 259 retained the same direction in all five deletions and the remaining seven did so in four. Full-data NES and median deletion-specific NES had a Spearman correlation of 0.972 (Supplementary Figure S5; Supplementary Tables S23 and S24). Twenty-one pathways remained FDR in every deletion. Endoplasmic-reticulum protein processing retained positive significance in all five, while small-GTPase regulation, T-cell receptor signaling, cell-cycle process, and Th1/Th2 differentiation retained negative significance in all five. Translation, oxidative phosphorylation, protein folding, proteasome, response to heat, antigen presentation, and leukocyte cytotoxicity preserved direction in every deletion but crossed the FDR threshold in one or two deletions.
4. Discussion
Cross-study reproducibility in bovine heat stress was strongly scale dependent. Modified Knapp–Hartung inference yielded no transcriptome-wide FDR-significant genes. At the same time, a small group of candidates retained direction and showed recurrent prioritization across sensitivity analyses, and 259 of 266 FDR-significant pathways preserved direction in every study deletion. The evidence therefore forms a hierarchy: coordinated programs were the most portable signal, a smaller candidate set supported targeted follow-up, and the wider gene ranking remained context dependent. This scale-dependent recurrence is the principal finding.
The difference between 19 normal-approximation findings and no modified Knapp–Hartung findings reflects uncertainty calibration rather than a reversal of the estimated effects. Both analyses used the same study effects and REML heterogeneity estimates, but only two to five studies informed each average. Modified Knapp–Hartung inference is particularly useful when few studies have unequal precision [15]. Prediction intervals address whether a comparable future true effect could change direction [16]. Thirty-four primary plug-in intervals excluded zero, 15 did so with the alternative critical value, and 23 of the primary exclusions had . Together, these analyses define the gene-level resolution supported by the current evidence.
The study design extends conventional livestock meta-analysis, which typically combines phenotypic outcomes such as milk yield, feed intake, fertility, or physiological indicators across experiments [1]. Here, thousands of genes were treated as outcomes, their effects and precision were re-estimated from uniformly processed raw reads, and each original study design was preserved before integration. Heat effects were defined within study, and cross-study synthesis used their effect sizes and precision. The analysis also differs from candidate-gene and GWAS reviews, which catalogue reported loci without recomputing transcriptomic effects [3,5]. Repeating enrichment after each study deletion further tested whether the biological interpretation itself depended on a single dataset. The resulting effect-size evidence layer is reusable for targeted expression assays, tissue-matched challenge studies, and future integration with physiological phenotypes or thermotolerance GWAS.
The positive pathway axis connected protein quality control with cellular energy demand. Heat exposure increases protein-folding and repair requirements, which is consistent with positive shifts in chaperone activity, endoplasmic-reticulum processing, proteasome function, translation, and heat-response genes. Mammary and cell-culture studies have independently reported heat-shock and proteostasis programs [8,24], while bovine myocyte transcriptomic and proteomic data show temperature-dependent remodeling of heat-shock, muscle, and metabolic pathways [25]. In the present analysis, endoplasmic-reticulum protein processing remained positively enriched at FDR in all five study deletions. Translation, oxidative phosphorylation, protein folding, proteasome, and response-to-heat terms preserved their positive direction throughout. Tissue-specific liver work has also reported suppressed oxidative phosphorylation under particular heat and intake contexts [9]. The combined evidence is compatible with context-dependent mitochondrial remodeling in which individual metabolic genes vary, while energy metabolism remains a recurrent component of the heat response.
The negative pathway axis comprised T-cell signaling, antigen presentation, leukocyte-mediated cytotoxicity, adhesion, and selected cell-cycle and small-GTPase programs. These directions were preserved in every study deletion, and several remained FDR-significant throughout. Conversely, up-prioritized candidates recovered antimicrobial and humoral responses. Heat stress can combine inflammatory signaling with impaired cellular immune competence, depending on tissue, duration, endocrine state, and the compartment measured [2,4,26]. Longitudinal work in dairy-cow blood and peripheral blood mononuclear cells has reported transient inflammatory activation alongside reduced T-cell signaling during chronic heat exposure [13]. Multi-omics analysis has also linked immune regulation to metabolic heat adaptation through CIITA-dependent programs [14]. The present bulk, multi-tissue result is consistent with a selective negative shift in lymphocyte and cytotoxic signaling within broader immune reprogramming.
The pathway results provide context for the leading genes. IL1R2 was positive in all five studies, had low heterogeneity, retained a prediction interval above zero, and ranked within the top four in every study deletion. IL1R2 is a non-signaling decoy receptor that restrains IL-1 activity, so its induction is consistent with feedback regulation of IL-1 signaling [27]. In contrast, CD8A and GZMK were negatively prioritized alongside reductions in T-cell and cytotoxic programs. GZMK marks cytotoxic and inflammatory lymphocyte states in several systems [28]; lower GZMK and CD8A in bulk bovine data may reflect altered immune-cell activity, abundance, trafficking, or a mixture of these processes. SDCBP2 was positive and stable across four contributing studies but remains less developed in bovine heat-stress literature. Its recurrent ranking supports mechanistic follow-up.
Study deletion and HSTSI definition sensitivity determine how the candidate resource should be used. All five deletions preserved the direction of estimable genes in the full-data top 200, but top-200 overlap fell as low as 68 and the median Jaccard index was 0.338. Alternative HSTSI definitions produced top-200 overlaps of 24–200, with effect magnitude exerting the greatest influence. Exact membership is therefore less portable than direction. IL1R2, SDCBP2, and GZMK nevertheless remained in the top 200 under all ten score definitions, while canonical heat-shock genes ranked lower because their magnitudes varied sharply across studies. These profiles support validation panels that combine broadly recurrent candidates such as IL1R2 with context-sensitive candidates such as GZMK, MT1E, or GPX3.
The breadth of the analysis defines its scope. Average effects describe recurrence across the included tissues, breeds, life stages, and exposure designs, while tissue-specific mechanisms and cell-composition effects remain questions for focused studies. Functional annotation covered 128 genes from the top 200, and the five-study evidence base provided greater resolution for pathway direction than for gene-specific heterogeneity or prediction intervals. These properties support the intended use of the resource: pathway maps for shared biology and graded candidates for follow-up. Prospective cohorts, thermotolerance phenotypes, genetic evidence, and functional experiments can now test which candidates generalize within specific biological contexts.
5. Conclusions
Study-aware integration of 107 bovine heat-stress RNA-seq libraries showed that cross-study recurrence was strongest at the level of coordinated biological programs. Translation, protein quality control, mitochondrial energy, and heat-response programs shifted positively, whereas lymphocyte signaling, cytotoxicity, antigen presentation, adhesion, and selected cell-cycle and small-GTPase programs shifted negatively. A graded candidate set led by IL1R2, SDCBP2, GZMK, and CD8A showed greater directional than rank stability. By separating formal significance, candidate stability, and pathway recurrence, the study provides a calibrated route from heterogeneous public transcriptomes to tissue-matched validation of the bovine heat response.
Supplementary Materials
The following supporting information can be downloaded at the website of this paper posted on Preprints.org. Figures S1–S5; Tables S1–S24; seven companion CSV files containing the complete per-study, jackknife, HSTSI-sensitivity, independent-refit, and pathway-deletion results; and Supplementary File S1 containing the analysis scripts, software-session records, and numerical validation reports. Figure S1: Matrix concordance and study-level differential-expression yield; Figure S2: Gene-level heterogeneity, interval width, and top-200 composition; Figure S3: HSTSI perturbation and study-deletion sensitivity; Figure S4: Sensitivity to the HSTSI definition; Figure S5: Pathway leave-one-study-out sensitivity.
Author Contributions
Conceptualization, X.Z. and X.X.; methodology, X.Z. and H.C.; software, X.Z.; validation, H.C., Q.Z. and Z.Z.; formal analysis, X.Z. and H.C.; investigation, Q.Z., Z.Z., S.H. and Z.L.; resources, Q.Z. and X.X.; data curation, X.Z., Z.Z., S.H. and Z.L.; writing—original draft preparation, X.Z. and H.C.; writing—review and editing, Q.Z., Z.Z., S.H., Z.L. and X.X.; visualization, X.Z.; supervision, X.X.; project administration, X.X.; funding acquisition, X.X. All authors have read and agreed to the published version of the manuscript.
Funding
This research was funded by the Yunnan Major Science and Technology Special Project, project “Breeding of High-Yield Dairy Goat Hybrid Lines and Research & Application of Efficient Breeding Technologies”, grant number 202602AE090078.
Institutional Review Board Statement
Not applicable.
Informed Consent Statement
Not applicable.
Data Availability Statement
The data presented in this study are available in the article and supplementary materials.
Conflicts of Interest
The authors declare no conflicts of interest.
Abbreviations
| FDR | false-discovery rate |
| GEO | Gene Expression Omnibus |
| GO | Gene Ontology |
| GSEA | gene-set enrichment analysis |
| HSTSI | heat-stress transcriptomic stability index |
| KEGG | Kyoto Encyclopedia of Genes and Genomes |
| mKH | modified Knapp–Hartung |
| NES | normalized enrichment score |
| ORA | over-representation analysis |
| REML | restricted maximum likelihood |
| RNA-seq | RNA sequencing |
| SRA | Sequence Read Archive |
References
- Chen, L.; Thorup, V.M.; Kudahl, A.B.; Østergaard, S. Effects of Heat Stress on Feed Intake, Milk Yield, Milk Composition, and Feed Efficiency in Dairy Cows: A Meta-Analysis. J. Dairy Sci. 2024, 107, 3207–3218. [Google Scholar] [CrossRef] [PubMed]
- Dahl, G.E.; Tao, S.; Laporta, J. Heat Stress Impacts Immune Status in Cows Across the Life Cycle. Front. Vet. Sci. 2020, 7, 116. [Google Scholar] [CrossRef] [PubMed]
- Cartwright, S.L.; Schmied, J.; Karrow, N.; Mallard, B.A. Impact of Heat Stress on Dairy Cattle and Selection Strategies for Thermotolerance: A Review. Front. Vet. Sci. 2023, 10, 1198697. [Google Scholar] [CrossRef] [PubMed]
- Lemal, P.; May, K.; König, S.; Schroyen, M.; Gengler, N. Invited Review: From Heat Stress to Disease—Immune Response and Candidate Genes Involved in Cattle Thermotolerance. J. Dairy Sci. 2023, 106, 4471–4488. [Google Scholar] [CrossRef] [PubMed]
- Worku, D.; Hussen, J.; De Matteis, G.; Schusser, B.; Alhussien, M.N. Candidate Genes Associated with Heat Stress and Breeding Strategies to Relieve Its Effects in Dairy Cattle: A Deeper Insight into the Genetic Architecture and Immune Response to Heat Stress. Front. Vet. Sci. 2023, 10, 1151241. [Google Scholar] [CrossRef] [PubMed]
- Dado-Senn, B.; Skibiel, A.L.; Fabris, T.F.; Zhang, Y.; Dahl, G.E.; Peñagaricano, F.; Laporta, J. RNA-Seq Reveals Novel Genes and Pathways Involved in Bovine Mammary Involution During the Dry Period and Under Environmental Heat Stress. Sci. Rep. 2018, 8, 11096. [Google Scholar] [CrossRef] [PubMed]
- Gao, S.T.; Ma, L.; Zhou, Z.; Zhou, Z.K.; Baumgard, L.H.; Jiang, D.; Bionaz, M.; Bu, D.P. Heat Stress Negatively Affects the Transcriptome Related to Overall Metabolism and Milk Protein Synthesis in Mammary Tissue of Midlactating Dairy Cows. Physiol. Genom. 2019, 51, 400–409. [Google Scholar] [CrossRef] [PubMed]
- Perez-Hernandez, G.; Ellett, M.D.; Pokhrel, B.; Parsons, C.L.M.; Corl, B.A.; Daniels, K.M. Transcriptomic Changes Induced by Controlled Cyclical Heat Stress in the Bovine Mammary Gland During Lactation. JDS Commun. 2025, 6, 604–609. [Google Scholar] [CrossRef] [PubMed]
- Li, G.; Yu, X.; Portela Fontoura, A.B.; Javaid, A.; Sáinz de la Maza-Escolà, V.; Salandy, N.S.; Fubini, S.L.; Grilli, E.; McFadden, J.W.; Duan, J.E. Transcriptomic Regulations of Heat Stress Response in the Liver of Lactating Dairy Cows. BMC Genom. 2023, 24, 410. [Google Scholar] [CrossRef] [PubMed]
- Laporta, J.; Dado-Senn, B.; Guadagnin, A.R.; Liu, L.; Peñagaricano, F. Preweaning Heat Stress Alters Liver Transcriptome and DNA Methylation in Dairy Calves. J. Dairy Sci. 2025, 108, 4390–4402. [Google Scholar] [CrossRef] [PubMed]
- Álvarez Cecco, P.; Balbi, M.; Bonamy, M.; Rogberg Muñoz, A.; Olivera, H.; Giovambattista, G.; Fernández, M.E. Skin Transcriptome Analysis in Brangus Cattle Under Heat Stress. J. Therm. Biol. 2024, 121, 103852. [Google Scholar] [CrossRef] [PubMed]
- Halli, K.; Yin, T.; Koch, C.; Krebs, S.; König, S. Heat Stress Induces Specific Methylation, Transcriptomic and Metabolic Pattern in Dairy Cows and Their Female Progeny. Sci. Rep. 2025, 15, 17021. [Google Scholar] [CrossRef] [PubMed]
- Koch, F.; Viergutz, T.; Kühn, C.; Kuhla, B. Dynamic Immune and Molecular Responses to Chronic Heat Stress in Blood and Peripheral Blood Mononuclear Cells of Dairy Cows. Front. Immunol. 2025, 16, 1633453. [Google Scholar] [CrossRef] [PubMed]
- Liu, C.; Ruan, P.; Wang, Z.; Huang, Y.; Zhang, L.; Yu, D.; Huang, D.; Ceccobelli, S.; Gao, H.; E, G. Multi-Omics Dissection of Heat Stress Reveals CIITA as a Central Regulator of Metabolic Thermotolerance in Cattle (Bos taurus). Commun. Biol. 2026, 9, 915. [Google Scholar] [CrossRef] [PubMed]
- Röver, C.; Knapp, G.; Friede, T. Hartung–Knapp–Sidik–Jonkman Approach and Its Modification for Random-Effects Meta-Analysis with Few Studies. BMC Med. Res. Methodol. 2015, 15, 99. [Google Scholar] [CrossRef] [PubMed]
- IntHout, J.; Ioannidis, J.P.A.; Rovers, M.M.; Goeman, J.J. Plea for Routinely Presenting Prediction Intervals in Meta-Analysis. BMJ Open 2016, 6, e010247. [Google Scholar] [CrossRef] [PubMed]
- Patro, R.; Duggal, G.; Love, M.I.; Irizarry, R.A.; Kingsford, C. Salmon Provides Fast and Bias-Aware Quantification of Transcript Expression. Nat. Methods 2017, 14, 417–419. [Google Scholar] [CrossRef] [PubMed]
- Soneson, C.; Love, M.I.; Robinson, M.D. Differential Analyses for RNA-Seq: Transcript-Level Estimates Improve Gene-Level Inferences [version 2; peer review: 2 approved]. F1000Research 2016, 4, 1521. [Google Scholar] [CrossRef] [PubMed]
- Love, M.I.; Huber, W.; Anders, S. Moderated Estimation of Fold Change and Dispersion for RNA-Seq Data with DESeq2. Genome Biol. 2014, 15, 550. [Google Scholar] [CrossRef] [PubMed]
- Viechtbauer, W. Conducting Meta-Analyses in R with the metafor Package. J. Stat. Softw. 2010, 36, 1–48. [Google Scholar] [CrossRef]
- Benjamini, Y.; Hochberg, Y. Controlling the False Discovery Rate: A Practical and Powerful Approach to Multiple Testing. J. R. Stat. Soc. Ser. B Methodol. 1995, 57, 289–300. [Google Scholar] [CrossRef]
- Subramanian, A.; Tamayo, P.; Mootha, V.K.; Mukherjee, S.; Ebert, B.L.; Gillette, M.A.; Paulovich, A.; Pomeroy, S.L.; Golub, T.R.; Lander, E.S.; et al. Gene Set Enrichment Analysis: A Knowledge-Based Approach for Interpreting Genome-Wide Expression Profiles. Proc. Natl. Acad. Sci. USA 2005, 102, 15545–15550. [Google Scholar] [CrossRef] [PubMed]
- Wu, T.; Hu, E.; Xu, S.; Chen, M.; Guo, P.; Dai, Z.; Feng, T.; Zhou, L.; Tang, W.; Zhan, L.; et al. clusterProfiler 4.0: A Universal Enrichment Tool for Interpreting Omics Data. Innovation 2021, 2, 100141. [Google Scholar] [CrossRef] [PubMed]
- Yu, X.; Harman, R.M.; Danev, N.; Li, G.; Fang, Y.; Van de Walle, G.R.; Duan, J.E. Heat Stress and Recovery Induce Transcriptomic Changes in Lactogenic-Like Bovine Mammary Epithelial (MAC-t) Cells. Physiol. Genom. 2025, 57, 551–565. [Google Scholar] [CrossRef] [PubMed]
- Eckhardt, E.; Luttman, A.; Daddam, J.R.; Keng, B.H.; Kim, W.; Gondro, C.; Kim, J. Characterization of Transcriptomic and Proteomic Changes in Bovine Myocytes Subject to Temporal Heat Stress. J. Therm. Biol. 2025, 132, 104246. [Google Scholar] [CrossRef] [PubMed]
- Kim, H.; Jo, J.-H.; Lee, H.-G.; Park, W.; Lee, H.-K.; Park, J.-E.; Shin, D. Inflammatory Response in Dairy Cows Caused by Heat Stress and Biological Mechanisms for Maintaining Homeostasis. PLoS ONE 2024, 19, e0300719. [Google Scholar] [CrossRef] [PubMed]
- Supino, D.; Minute, L.; Mariancini, A.; Riva, F.; Magrini, E.; Garlanda, C. Negative Regulation of the IL-1 System by IL-1R2 and IL-1R8: Relevance in Pathophysiology and Disease. Front. Immunol. 2022, 13, 804641. [Google Scholar] [CrossRef] [PubMed]
- Xin, C.; Liu, P.; Zhan, Q.; Cao, W. GZMK+ CD8 T Cells in Inflammatory Diseases. Front. Immunol. 2025, 16, 1661755. [Google Scholar] [CrossRef] [PubMed]
Figure 1.
Study overview for the five-study analysis. (A) Control and heat-stress libraries within each study; every point is one RNA-seq library and labels give the library count. (B) Tissue and life-stage coverage; each symbol represents one included study. (C) SRA spot counts per library; violins show study-level distributions and points show all individual libraries. Differential-expression models were fitted within study before cross-study integration.
Figure 1.
Study overview for the five-study analysis. (A) Control and heat-stress libraries within each study; every point is one RNA-seq library and labels give the library count. (B) Tissue and life-stage coverage; each symbol represents one included study. (C) SRA spot counts per library; violins show study-level distributions and points show all individual libraries. Differential-expression models were fitted within study before cross-study integration.
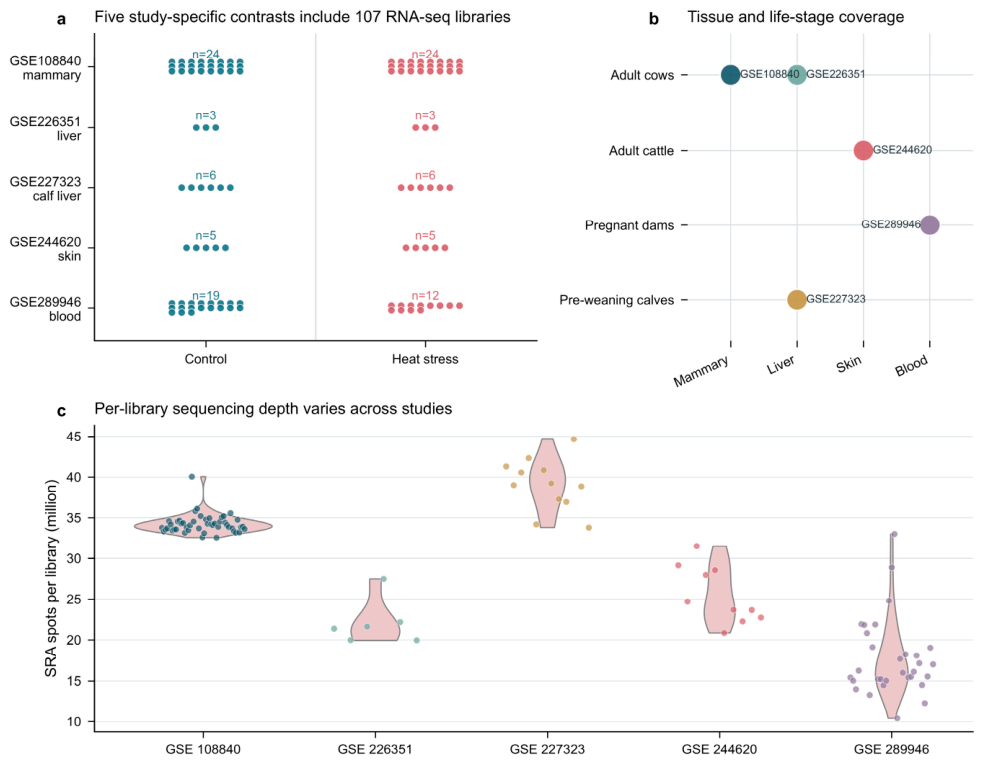
Figure 2.
Gene-level inference under conventional and small-sample random-effects models. (A) Random-effects log2 fold change versus unadjusted modified Knapp–Hartung value for 16,756 genes. Open circles mark genes whose primary 95% prediction interval excludes zero; filled labels identify the four candidates discussed in the text. The horizontal dashed line denotes , not an FDR threshold. (B) Conventional REML-z and modified Knapp–Hartung
Figure 2.
Gene-level inference under conventional and small-sample random-effects models. (A) Random-effects log2 fold change versus unadjusted modified Knapp–Hartung value for 16,756 genes. Open circles mark genes whose primary 95% prediction interval excludes zero; filled labels identify the four candidates discussed in the text. The horizontal dashed line denotes , not an FDR threshold. (B) Conventional REML-z and modified Knapp–Hartung
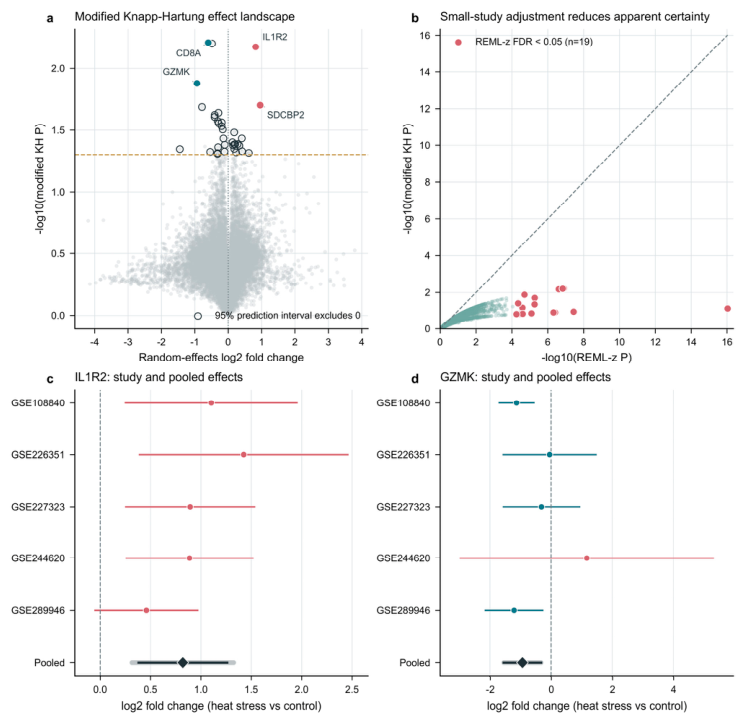
Figure 3.
HSTSI candidate prioritization and sensitivity. (A) The 25 highest-ranked candidates. Line endpoints show HSTSI values, adjacent numbers give ranks, color denotes effect direction, and circles, diamonds, and squares denote Tiers A, B, and C. (B) Study-specific log2 fold changes for the same candidates. Black dots mark nominal within-study ; crosses indicate unavailable effects. (C) Top-200 frequency across 500 weight perturbations versus five complete leave-one-study-out analyses for all genes in the full-data top 200. Triangles point up or down according to meta-analytic direction, color denotes stability tier, and point size reflects the number of contributing studies. Dashed lines mark frequencies of 0.50 and 0.60. HSTSI is a prioritization score, not a significance test.
Figure 3.
HSTSI candidate prioritization and sensitivity. (A) The 25 highest-ranked candidates. Line endpoints show HSTSI values, adjacent numbers give ranks, color denotes effect direction, and circles, diamonds, and squares denote Tiers A, B, and C. (B) Study-specific log2 fold changes for the same candidates. Black dots mark nominal within-study ; crosses indicate unavailable effects. (C) Top-200 frequency across 500 weight perturbations versus five complete leave-one-study-out analyses for all genes in the full-data top 200. Triangles point up or down according to meta-analytic direction, color denotes stability tier, and point size reflects the number of contributing studies. Dashed lines mark frequencies of 0.50 and 0.60. HSTSI is a prioritization score, not a significance test.
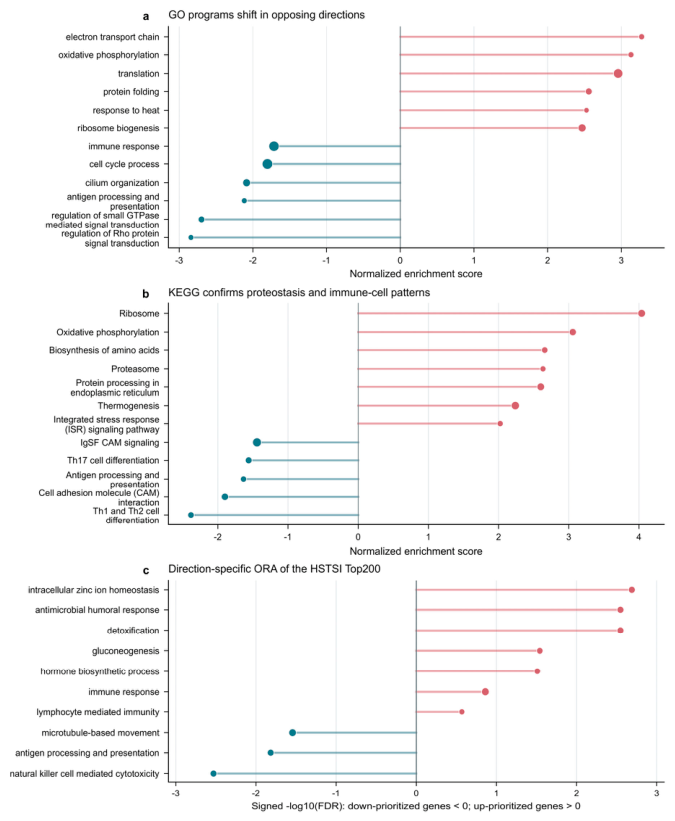
Figure 4.
Five complete leave-one-study-out analyses. (A) Number of genes shared by each deletion-specific and full-data top 200. (B) Similarity to the full analysis: gold diamonds show the top-200 Jaccard index and green circles show the all-gene Spearman rank correlation. (C) Full-data and deletion-specific ranks for selected candidates on a logarithmic axis. Red stars show full-data ranks; outlined study-specific symbols show all five deletion ranks; horizontal lines span the interquartile range and black diamonds mark the deletion median. Every deletion repeated REML fitting, modified Knapp–Hartung inference, multiple-testing correction, nested jackknife scoring, and HSTSI ranking.
Figure 4.
Five complete leave-one-study-out analyses. (A) Number of genes shared by each deletion-specific and full-data top 200. (B) Similarity to the full analysis: gold diamonds show the top-200 Jaccard index and green circles show the all-gene Spearman rank correlation. (C) Full-data and deletion-specific ranks for selected candidates on a logarithmic axis. Red stars show full-data ranks; outlined study-specific symbols show all five deletion ranks; horizontal lines span the interquartile range and black diamonds mark the deletion median. Every deletion repeated REML fitting, modified Knapp–Hartung inference, multiple-testing correction, nested jackknife scoring, and HSTSI ranking.
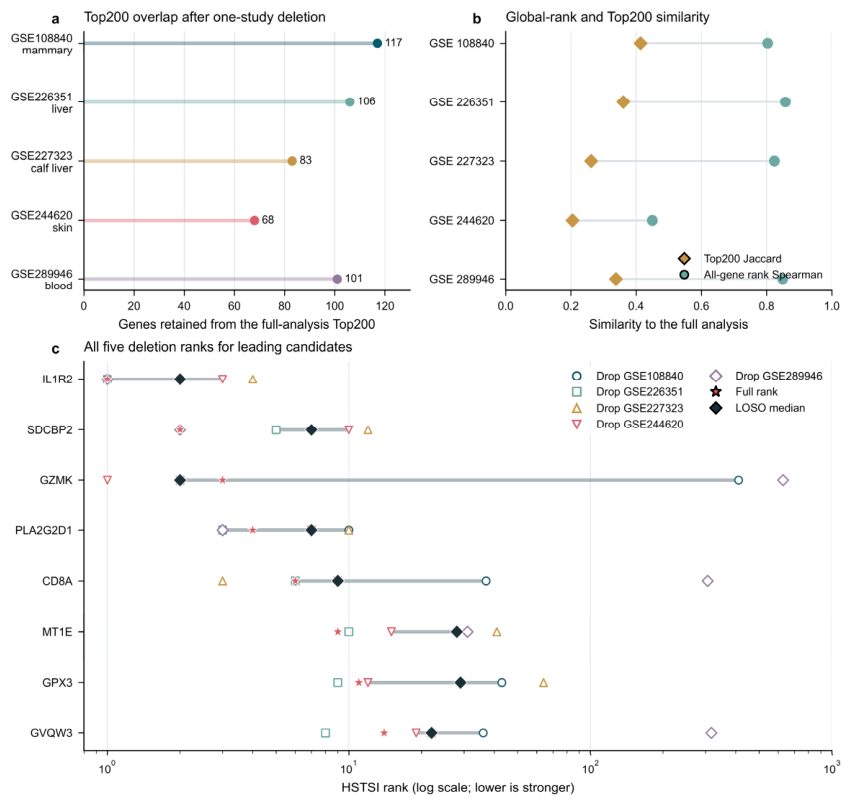
Figure 5.
Directional functional programs in the small-sample-calibrated meta-analytic ranking. (A) Representative GO biological processes and (B) bovine KEGG pathways selected to cover the principal positive and negative programs; these panels are a display subset rather than a formal redundancy reduction. Lines extend from zero to the normalized enrichment score, color denotes direction, and point size reflects gene-set size. (C) Representative direction-stratified GO ORA terms for the mapped HSTSI top 200. Position is signed , with down-prioritized terms to the left and up-prioritized terms to the right; point size reflects the number of mapped candidate genes. Complete results are provided in Supplementary Tables S11–S14.
Figure 5.
Directional functional programs in the small-sample-calibrated meta-analytic ranking. (A) Representative GO biological processes and (B) bovine KEGG pathways selected to cover the principal positive and negative programs; these panels are a display subset rather than a formal redundancy reduction. Lines extend from zero to the normalized enrichment score, color denotes direction, and point size reflects gene-set size. (C) Representative direction-stratified GO ORA terms for the mapped HSTSI top 200. Position is signed , with down-prioritized terms to the left and up-prioritized terms to the right; point size reflects the number of mapped candidate genes. Complete results are provided in Supplementary Tables S11–S14.

Table 1.
Public bovine heat-stress RNA-seq studies included in the primary meta-analysis. Biological-unit and library counts are shown separately.
Table 1.
Public bovine heat-stress RNA-seq studies included in the primary meta-analysis. Biological-unit and library counts are shown separately.
| Dataset | Tissue and context | Effect definition | Biological units | Libraries | Study model |
|---|---|---|---|---|---|
| GSE108840 | Mammary gland; dry-period Holstein cows | Heat-stressed minus cooled control at post-dry-off days 3, 7, 14, and 25 | 6 vs. 6 cows | 24 vs. 24 | ~ time + group |
| GSE226351 | Liver; lactating dairy cows | Heat stress minus thermoneutral control; pair-fed animals excluded | 3 vs. 3 cows | 3 vs. 3 | ~ group |
| GSE227323 | Liver; pre-weaning Holstein calves | Postnatal heat stress minus postnatal cooling | 6 vs. 6 calves | 6 vs. 6 | ~ group |
| GSE244620 | Skin; adult Brangus cattle | Heat-stress cases minus controls | 5 vs. 5 cattle | 5 vs. 5 | ~ group |
| GSE289946 | Whole blood; pregnant German Holstein dams | Heat-stressed dams minus dams without heat stress; offspring excluded | 19 vs. 12 dams | 19 vs. 12 | ~ group |
Disclaimer/Publisher’s Note: The statements, opinions and data contained in all publications are solely those of the individual author(s) and contributor(s) and not of MDPI and/or the editor(s). MDPI and/or the editor(s) disclaim responsibility for any injury to people or property resulting from any ideas, methods, instructions or products referred to in the content. |
© 2026 by the authors. Licensee MDPI, Basel, Switzerland. This article is an open access article distributed under the terms and conditions of the Creative Commons Attribution (CC BY) license (http://creativecommons.org/licenses/by/4.0/).
Copyright: This open access article is published under a Creative Commons CC BY 4.0 license, which permit the free download, distribution, and reuse, provided that the author and preprint are cited in any reuse.


