
Submitted:
10 July 2026
Posted:
14 July 2026
You are already at the latest version
Abstract
Morocco’s National Green Hydrogen Roadmap targets large-scale hydrogen exports, yet the offshore wind and tidal resources of the Atlantic Sahara coast remain underexplored, and single-resource electrolysis plants suffer from low, variable electrolyser utilisation. This study presents a reproducible techno-economic model of a 560 MW hybrid offshore wind–tidal hub at Dakhla producing hydrogen via proton-exchange-membrane (PEM) electrolysis and exporting it as liquid hydrogen (LH₂) to Jorf Lasfar (1,241 km). The regional wind, current and sea-surface-temperature resource is characterised from Copernicus Marine Service (CMEMS) reanalysis and satellite products (2002–2016), complemented by ERA5 hourly wind for the Weibull fit; the framework then integrates harmonic (M₂+S₂) tidal modelling, Jensen wake losses, hourly dispatch, liquefaction, shipping, and discounted levelised-cost-of-hydrogen (LCOH) analysis. For a 510/50 MW wind/tidal configuration feeding a 350 MW electrolyser, capacity factors reach 49.1 % (wind), 8.8 % (tidal) and 45.5 % (hybrid), yielding ≈36,800 t H₂/yr at 60 % utilisation with 15.1 % curtailment. The 2025 base-case production LCOH is 7.53 USD/kg (10.04 USD/kg delivered); a 2030 learning scenario reduces this to 4.45 USD/kg, approaching the 2–4 USD/kg roadmap band. Hybridisation provides firming value through near-zero wind–tidal correlation, reducing output variance and electrolyser cycling rather than adding energy. Sensitivity analysis identifies capacity factor and electrolyser specific energy consumption as the dominant cost drivers, ahead of wind capital cost and the cost of capital. This work offers the first integrated wind–tidal hydrogen assessment for the Moroccan Atlantic coast and a transparent modelling platform for future multi-objective optimisation.
Keywords:
green hydrogen
; offshore wind energy
; tidal current energy
; hybrid renewable systems
; PEM electrolysis
; levelised cost of hydrogen
; liquid hydrogen shipping
; Morocco
1. Introduction
The transition away from fossil fuels has positioned green hydrogen produced by electrolysis using renewable electricity as a central pillar of decarbonisation strategies for hard-to-abate sectors, including heavy industry, long-haul transport and seasonal energy storage [1]. Hydrogen is particularly attractive where direct electrification is technically or economically constrained, such as ammonia and fertiliser synthesis, steelmaking, refining, and international energy trade. For countries with abundant renewable resources but limited domestic demand, green hydrogen represents a strategic export commodity capable of converting natural endowments in solar, wind and coastline into traded economic value [2].
Morocco occupies a distinctive position in this emerging market. The National Green Hydrogen Roadmap, published in 2021, targets large-scale production capacity for both domestic industrial use and export to European markets, underpinned by the country’s solar and wind resources and its existing port and chemical infrastructure [3]. Because Morocco imports the majority of its primary energy, substituting imported ammonia and fossil fuels with domestically produced hydrogen offers a dual benefit of decarbonisation and enhanced energy sovereignty [4]. The Atlantic Sahara coast, and the area around Dakhla in particular, is consistently identified as one of the most favourable wind sites on the African continent, combining persistent north-easterly trade winds, a shallow continental shelf, and proximity to European markets [5]. Recent techno-economic work confirms that Dakhla offers the lowest LCOH among Moroccan sites assessed for renewable-hydrogen production, even when only onshore wind and solar resources are considered [6].
Despite this potential, most published assessments of Morocco’s hydrogen capacity address onshore photovoltaics and onshore wind only [6,7]. Offshore resources and specifically the synergy between offshore wind and tidal current energy have received almost no quantitative attention in the North African context, notwithstanding broader reviews of Morocco’s offshore wind, tidal and wave potential [8,9]. This represents a meaningful research gap for two reasons. First, single-resource hydrogen plants typically suffer from low and highly variable electrolyser utilisation, and the electrolyser stack is the most capital-intensive and operationally sensitive asset in the production chain. Second, hybridising two resources with complementary temporal signatures for example wind, governed by synoptic meteorology, and tidal currents, which follow a deterministic astronomical clock can raise and smooth the power delivered to the electrolyser, improving its capacity factor and reducing the frequency of damaging on/off cycling. Combined offshore wind and marine-energy systems have been studied extensively for European waters [10,11], but their technical feasibility and economic logic have not previously been evaluated against the specific resource mix, financing environment and export geography of the Moroccan Atlantic coast.
This paper addresses that gap through an integrated, reproducible techno-economic model. The specific contributions are fourfold: (1) resource characterisation of the offshore wind and tidal current resources at Dakhla from Copernicus Marine Service (CMEMS) reanalysis and satellite products together with ERA5 hourly wind, converted to electrical output using validated turbine and wake models; (2) hourly hybrid-dispatch modelling to a PEM electrolyser, quantifying hydrogen yield, water demand, curtailment and utilisation; (3) an export-logistics analysis of conditioning and shipping hydrogen as LH₂ along the 1,241 km route to Jorf Lasfar, benchmarked against compressed-gas and ammonia carriers; and (4) an economic assessment computing LCOH for a 2025 base case and a 2030 technology-learning scenario, with the dominant cost drivers identified through one-at-a-time sensitivity analysis.
The system boundary and process chain analysed in this study are summarised in Figure 1, and the geographical layout in Figure 2. The remainder of the paper is organised as follows. Section 2 characterises the site and its resources. Section 3 presents the five-stage methodology and governing equations. Section 4 reports the energy, hydrogen and cost results. Section 5 discusses the findings in relation to the literature and to Moroccan and European policy. Section 6 concludes and identifies priorities for future work.
2. Site Characterisation
2.1. Location and Wind Regime
The proposed generation hub is located offshore of the Dakhla peninsula in southern Morocco, centred approximately at 23.7° N, 15.9° W, in Atlantic waters characterised by a comparatively narrow continental shelf. The site sits under the influence of the semi-permanent Azores High, which drives persistent north-easterly trade winds along this stretch of coast and limits strong seasonal variability in the wind regime [12,13]. The regional wind, surface-current and sea-surface-temperature climatology of the Dakhla domain is established from Copernicus Marine Environment Monitoring Service (CMEMS) reanalysis and satellite products, following the acquisition and processing approach detailed in Section 2.5 [29,30,31,32,33]. For the energy-yield modelling, hub-height (100 m) wind speeds were additionally derived from the ERA5 reanalysis for 2010–2023 [12] and fitted to a two-parameter Weibull distribution by maximum-likelihood estimation, yielding a shape parameter and scale parameter m/s. This corresponds to a mean wind speed of 9.5 m/s and a mean wind power density of approximately 918 W/m² at hub height, consistent with the strong, seasonally modulated wind regime evidenced by the CMEMS monthly statistics (Section 2.5). The shape parameter above 2 indicates a comparatively narrow, persistent wind regime that is favourable for stable turbine output and high capacity factors [14].
2.2. Bathymetry and Grid Connection
From a marine engineering standpoint, the Dakhla offshore zone is relatively favourable for fixed-bottom foundations: an extended shallow shelf makes monopile and jacket structures technically viable across much of the near-shore area, with floating foundations becoming relevant further offshore as water depth increases [15,16]. A 560 MW generation hub of this scale would require a dedicated offshore substation and either a subsea high-voltage export cable to a shore-based grid connection point, or, as assumed in the export-focused configuration analysed here, direct onsite consumption by the electrolyser with only a modest grid interconnection for auxiliary and backup loads. Site-specific cable-routing, landing-point and grid-reinforcement studies were outside the scope of the present model and are flagged in Section 5.4 as a required input for a bankable feasibility study.
2.3. Tidal Regime
The tidal regime along this section of coast is mesotidal and predominantly semi-diurnal, governed principally by the M₂ and S₂ harmonic constituents [17]. Peak spring currents in the constricted channels of Dakhla Bay are assumed here to reach up to 2.2 m/s; this figure should be interpreted as an upper-bound, low-confidence estimate, since dedicated in-situ current-meter or high-resolution regional-model data for this specific embayment are not available. The corresponding modelled mean tidal power density is only about 0.3–0.4 kW/m², roughly a quarter to a fifth of the ≈1.6 kW/m² reported for Morocco’s strongest characterised tidal-stream site in the Strait of Gibraltar / Tangier area, where current speeds up to ≈1.9 m/s have been measured [9,18]. The Dakhla tidal resource is therefore treated conservatively throughout, its uncertainty is carried into a dedicated low-resource sensitivity case (Section 4.6), and it is revisited as a priority limitation in Section 5.4. This conservative stance is reinforced by the CMEMS reanalysis: the monthly-mean geostrophic surface current retrieved for the Dakhla domain (Section 2.5) is only ≈0.06–0.11 m/s, confirming that the large-scale monthly circulation is weak and that any exploitable resource is confined to the sub-monthly tidal-stream signal, which the reanalysis does not resolve and which is therefore represented by the harmonic model of Section 3.3.
2.4. Export Destination and Environmental Context
The hydrogen export destination is the industrial port of Jorf Lasfar, approximately 1,241 km north of Dakhla along Morocco’s central Atlantic coast. Jorf Lasfar is a major deep-water port with extensive fertiliser and energy infrastructure, making it a plausible off-take point for hydrogen supply chains linked to ammonia synthesis, derivative chemicals, or further export [19]. Environmental and marine-spatial-planning considerations including potential interaction with fishing grounds, shipping lanes, and protected coastal habitats near Dakhla Bay are acknowledged but not quantitatively assessed here; a strategic environmental assessment would be a prerequisite for any project of this scale.
2.5. Data Acquisition and Processing
The regional met-ocean resource is characterised from the Copernicus Marine Environment Monitoring Service (CMEMS), the European operational-oceanography programme funded by the European Commission and implemented by Mercator Océan International, which distributes open-access reanalysis and satellite-observation products in Network Common Data Form (NetCDF) [29]. Three catalogues were used, selected to provide consistent, quality-controlled coverage of the surface-current, wind and temperature fields required for offshore renewable resource assessment:
Analysis was localised to the southern-Atlantic (Dakhla) domain, 22° W–13° W, 21° N–26° N, which encloses the Dakhla peninsula and its adjacent shelf, on the native ≈0.125° latitude–longitude grid; only surface-layer fields were retained. The current speed was reconstructed as the vector magnitude of its eastward () and northward () components the true velocities eastward/northward_sea_water_velocity in the northern domain, and the monthly geostrophic components geostrophic_eastward/northward_sea_water_velocity in the southern domain while the scalar wind_speed and sea_water_temperature fields were taken directly. Because the only monthly-resolution current available for the Dakhla domain is geostrophic, it omits the wind-driven and tidal components and is therefore treated as a conservative lower bound on the surface current (Section 2.3). Monthly-mean fields were adopted to maximise the multi-year span: surface currents and sea-surface temperature over 2002–2014, and surface wind over 2007–2016. All NetCDF files were read and processed in MATLAB using its native NetCDF interface, and the georeferenced fields were visualised and quality-checked in Panoply (NASA GISS); for each variable, domain and month the minimum, mean, standard deviation and maximum were computed and aggregated into annual series. The resulting Dakhla-domain climatology is summarised in Table 1; the hourly wind and tidal series used for dispatch (Section 3.1, Section 3.2 and Section 3.3) are downscaled/modelled separately, since the monthly reanalysis does not resolve the sub-monthly variability that governs turbine cycling.
3. Methodology
This study adopts an integrated techno-economic workflow to evaluate the feasibility of a hybrid offshore wind–tidal generation hub supplying green hydrogen from Dakhla to Jorf Lasfar. The workflow couples resource assessment, energy-conversion modelling, hourly dispatch simulation, hydrogen liquefaction and maritime transport, and a discounted-cash-flow cost analysis (Figure 1). The regional resource is grounded in CMEMS reanalysis and satellite products, acquired and processed as described in Section 2.5 (NetCDF handling and monthly statistics in MATLAB, visualisation in Panoply); the resulting climatology informs and validates the hourly energy-conversion and dispatch model, which is implemented in Python using standard scientific libraries (numpy, scipy.stats, pandas) for transparency and rapid scenario testing. All dispatch and cost calculations use an hourly resolution over a representative simulation year (8,760 h); the wind and tidal resource inputs are hourly series consistent with the fitted Weibull distribution and the harmonic tidal model respectively (Section 3.10), since the monthly CMEMS fields do not resolve the sub-monthly variability required for dispatch.
3.1. Wind Resource Modelling
The hub-height wind-speed frequency distribution is described by the two-parameter Weibull probability density function (Equation 1), whose shape () and scale () parameters are estimated from the ERA5 hourly series by maximum-likelihood estimation [5]; the fitted mean is cross-checked against the CMEMS monthly wind climatology of Section 2.5, which spans 4.9–9.7 m/s and confirms the same strong, seasonally modulated regime:
The mean available wind power density follows from the Weibull parameters and the air density , using the Gamma function (Equation 2):
3.2. Turbine Power Conversion, Energy Yield and Array Losses
Below rated wind speed the turbine extracts power according to the cubic law (Equation 3), bounded by the cut-in (), rated () and cut-out () speeds. The simulation uses the discrete power curve of a reference 15 MW-class offshore turbine (, , m/s) with linear interpolation, retaining Equation (3) as the closed-form cross-check:
The single-turbine annual energy production integrates the power curve against the wind-speed probability density (Equation 4):
Array interaction is represented with the Jensen wake model (Equation 5), in which the velocity deficit behind an upstream rotor depends on the axial induction factor , the wake decay coefficient (0.04 for offshore conditions), the downstream spacing and the rotor radius . The array-averaged wake loss is 9.0 %, applied as a uniform derate to obtain net farm output:
3.3. Tidal Current Resource and Conversion
The tidal current is represented as the superposition of its dominant harmonic constituents; this harmonic approach is adopted because the CMEMS reanalysis provides only a monthly-mean geostrophic current for the Dakhla domain (Section 2.5), which cannot resolve the sub-monthly semi-diurnal signal that drives tidal-energy conversion. The canonical single-constituent form (Equation 6) uses the M₂ period h, and the full simulation adds the S₂ term to reproduce the spring–neap modulation:
The hydrokinetic turbine power follows the same cubic form as the wind turbine but with seawater density kg/m³ and power coefficient [21]:
Because power scales with the cube of current speed, output is concentrated near peak spring tide.
3.4. Hybrid Integration and Capacity Factor
The instantaneous hybrid power delivered to the common DC bus is the sum of the wind and tidal contributions (Equation 8), and the overall conversion efficiency to the electrolyser terminals is the product of the turbine, transmission and electrolyser efficiencies (Equation 9):
The capacity factor relates the realised annual energy to the theoretical maximum at the installed rating over 8,760 h (Equation 10), evaluated separately for the wind-only, tidal-only and hybrid configurations:
3.5. Electrolysis and Hydrogen Production
At each hour the power admitted to the electrolyser is the lesser of the available hybrid power (after a 3 % bus/transmission loss) and the electrolyser rating; any surplus is curtailed. Below a minimum part-load of 10 % of rated power the stack is held offline; no explicit ramp-rate or minimum up/down-time constraint is imposed, since the hourly resolution and the PEM technology’s fast dynamic response make such constraints non-binding at this timescale. The instantaneous hydrogen mass flow follows from the electrical input, the electrolyser efficiency and the lower heating value (Equation 11, kWh/kg):
Cumulative annual production is written in terms of the delivered energy and the specific energy consumption (SEC), the practical figure of merit for a PEM stack (Equation 12) [22]:
The electrochemical (Faraday) efficiency relates the actual to the theoretical hydrogen yield for a given stack current , with the Faraday constant (96,485 C/mol), the electrons transferred per H₂ molecule and the molar mass (Equation 13); it is reported for completeness, while the aggregate simulation uses the SEC formulation calibrated to 50 kWh/kg:
3.6. Hydrogen Conditioning for Export
Two export-conditioning routes are evaluated, with ammonia carried as a benchmark comparator. For compressed gas the ideal isothermal compression work per unit mass scales with the logarithm of the pressure ratio (Equation 14), where is the compressibility factor, the universal gas constant and the gas temperature; the practical figure for 350–700 bar service is ≈2 kWh/kg [23]:
For liquefaction, the thermodynamic (Carnot) minimum specific work is given by Equation (15), where is the total heat load the sum of the sensible cooling and the latent condensation enthalpy that must be removed per unit mass of hydrogen to bring it from ambient temperature to the liquefaction temperature K. Real plants achieve only 20–30 % of the Carnot limit and consume 10–13 kWh/kg; a base-case value of 11 kWh/kg is adopted [24]:
Liquid hydrogen incurs continuous boil-off during storage and transit, modelled as an exponential decay of the stored mass at a constant daily fractional rate (Equation 16); for the 1.7-day voyage at 0.3 %/day the in-transit loss is only 0.52 %:
3.7. Transport Cost
The delivered transport cost per kilogram, or levelised cost of transport (LCOT, Equation 17), aggregates the annualised capital cost of carriers and tanks (via the capital-recovery factor ), voyage and port operating cost, the energy cost of conditioning, and the monetised value of in-transit losses, divided by the mass actually delivered:
The same structure, with route-specific parameters, is applied to compressed gas, liquid hydrogen and ammonia to obtain the break-even distances of Section 4.4.
3.8. Techno-Economic Analysis
The levelised cost of hydrogen is the ratio of discounted lifetime costs to discounted lifetime production over the -year project life (Equation 18), where , , and are the investment, operating, feedstock and salvage cash flows in year , and is the discount rate:
The discount rate is the weighted average cost of capital (Equation 19), where and are the equity and debt components of total project value , and their respective costs, and the corporate tax rate:
A base-case WACC of 7 % (range 5–8 %) is adopted for 2025, reflecting Morocco’s sovereign and project-risk profile [25]; the 2030 scenario assumes 5 %.
3.9. Sensitivity Analysis
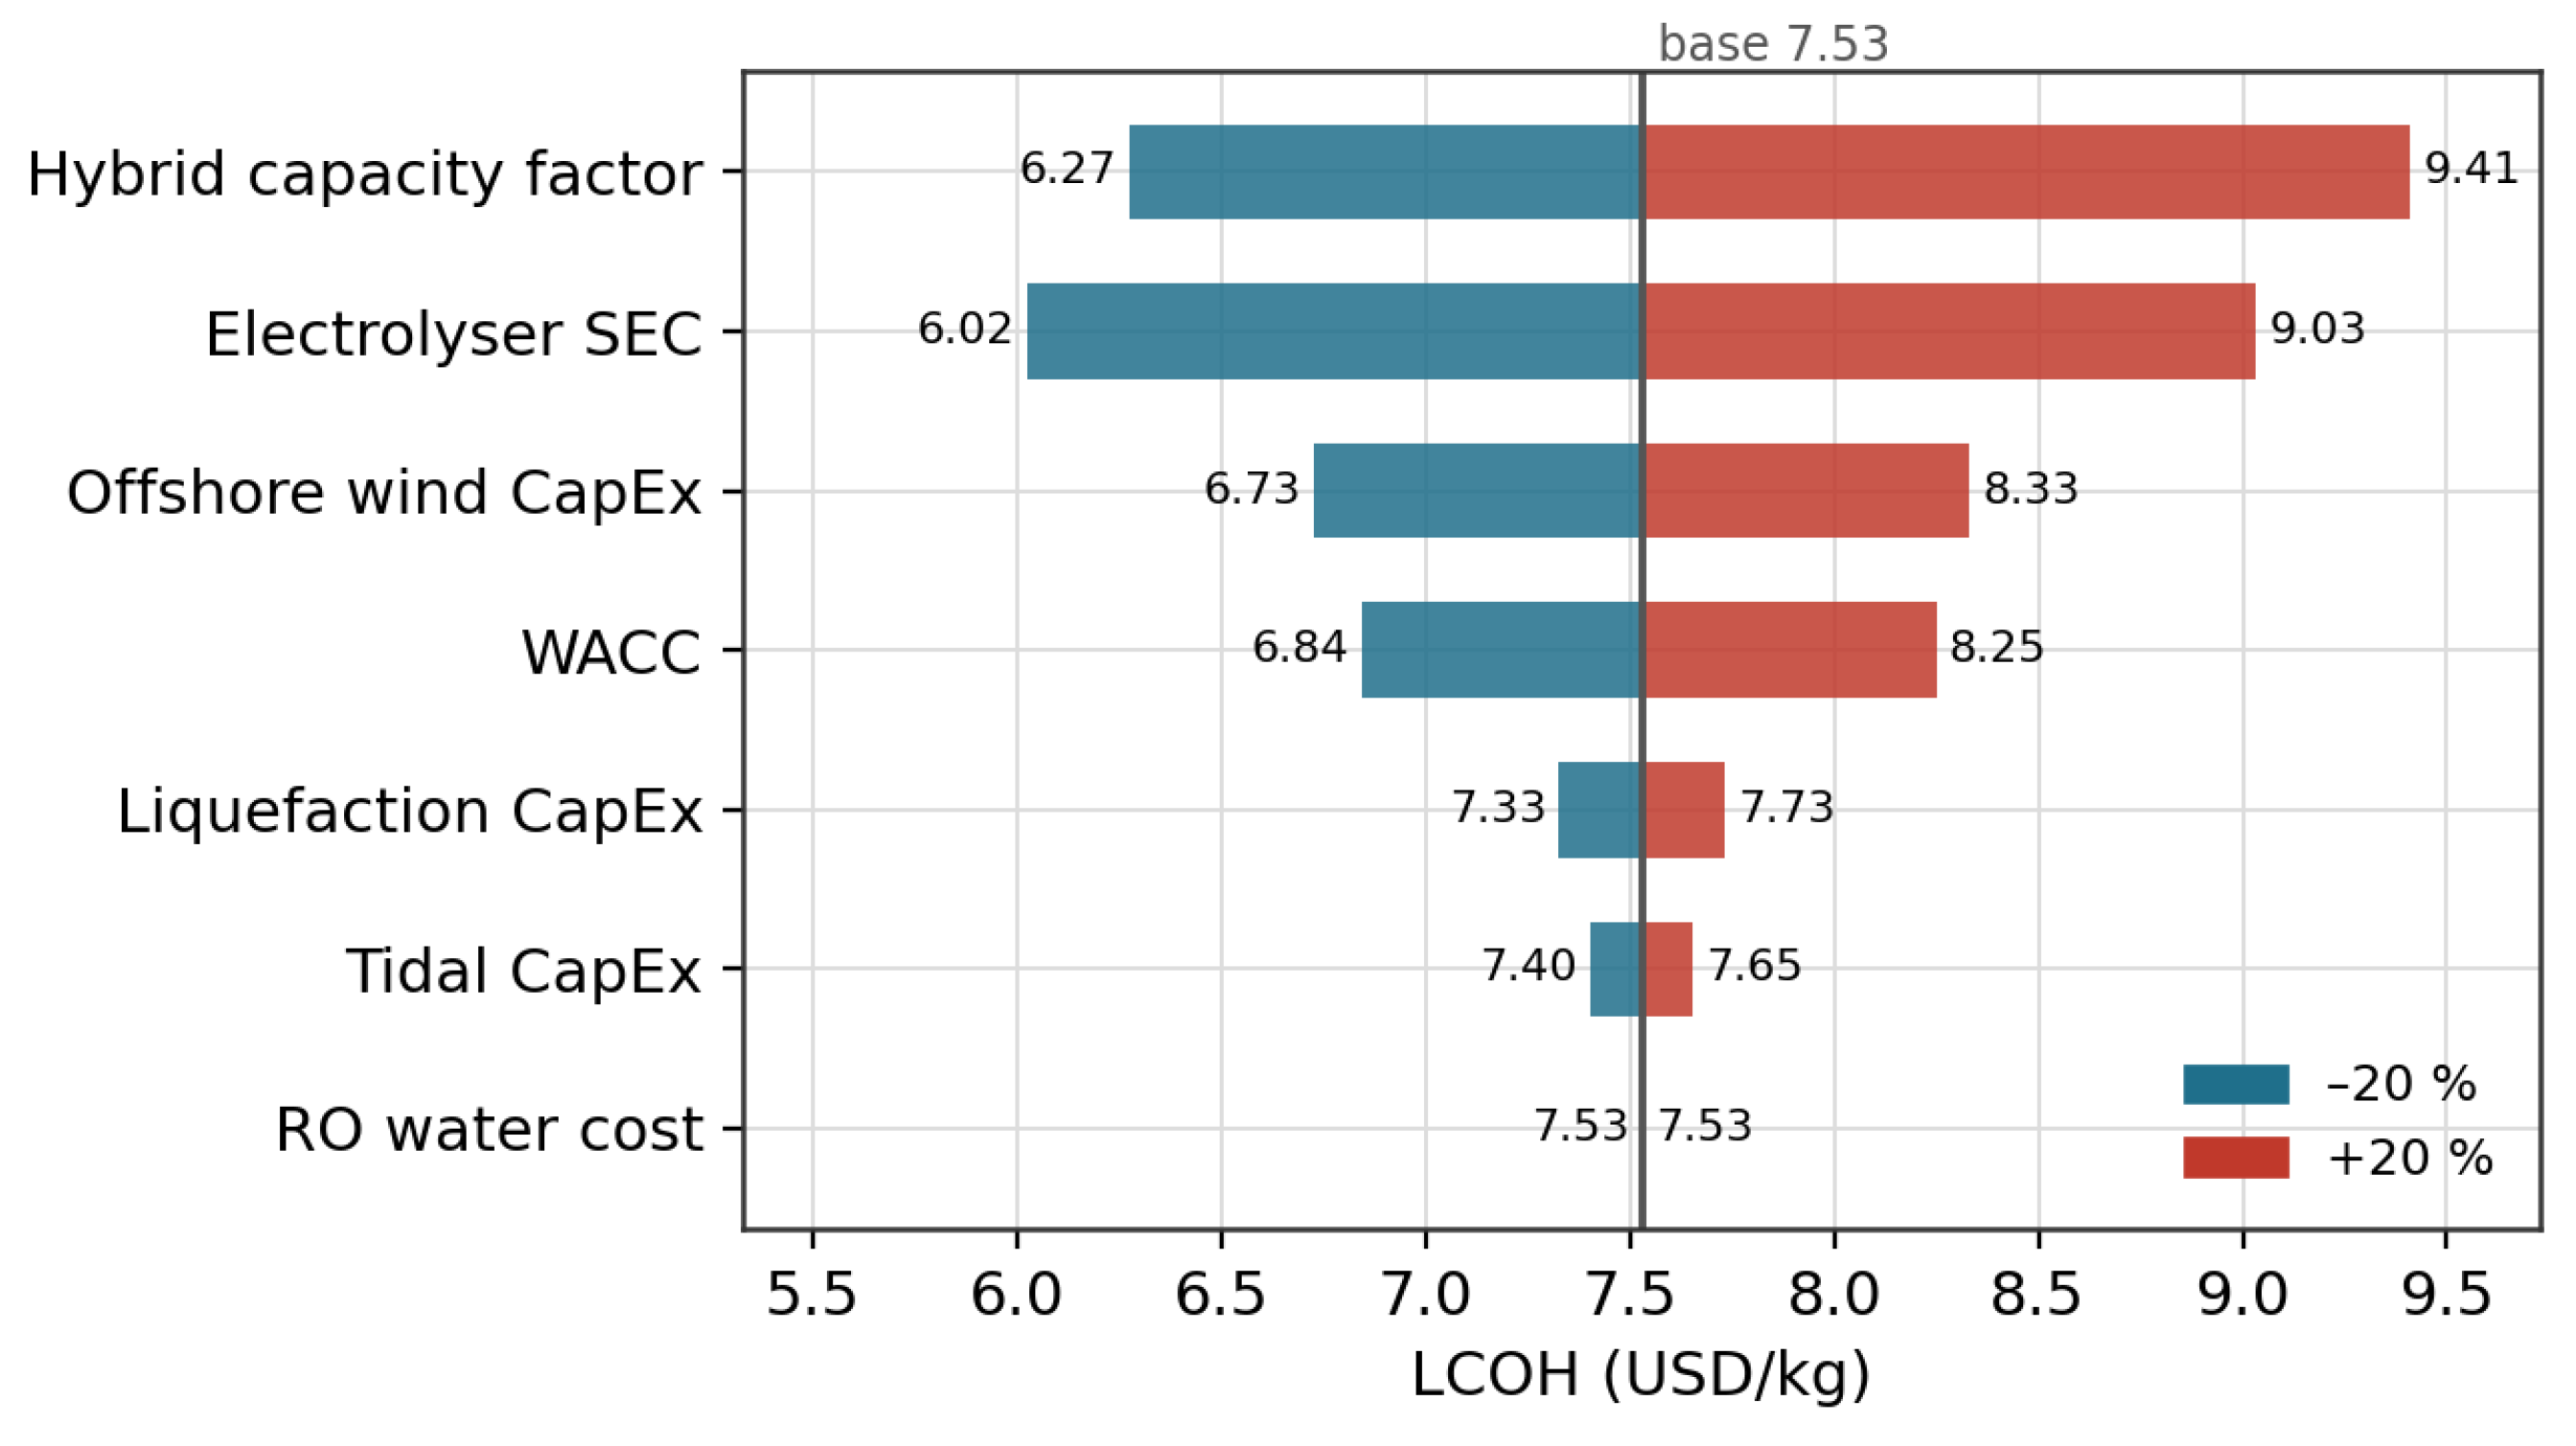
A one-at-a-time (OAT) local sensitivity analysis perturbs each input by ±20 % about its base-case value while holding all others fixed, and records the change in LCOH (Equation 20):
The seven parameters tested are the hybrid capacity factor, electrolyser SEC, offshore-wind CapEx, tidal CapEx, WACC, RO water cost and liquefaction CapEx, ranked by and presented as a tornado diagram (Figure 10). As a local method, OAT does not capture parameter interactions; a global variance-based analysis is identified as a priority extension.
3.10. Model Implementation and Reproducibility
The model is implemented as a modular Python codebase, with independent functions for resource loading and statistical fitting, wind and tidal power conversion, hourly dispatch, hydrogen production, liquefaction and transport, and LCOH computation, so that each stage can be audited, replaced or extended in isolation. The wind series is generated by an AR(1) latent process mapped through the probability-integral transform onto the fitted Weibull marginal, which preserves the correct long-run wind-speed distribution while reproducing realistic hour-to-hour persistence (lag-1 autocorrelation ≈ 0.96); the tidal series is fully deterministic. Fitting uses scipy.stats; time-series dispatch is vectorised in numpy/pandas; and the discounted-cash-flow and sensitivity routines are custom functions. Wake losses are represented at the analytical Jensen level only. The base case includes no battery or hydrogen-buffer storage, and surplus generation above the 350 MW rating is curtailed. Table 2 lists the principal technical and economic parameters, their sensitivity ranges, 2030 learning-scenario values and sources.
4. Results
4.1. Wind and Tidal Resource
Figure 3 shows that the fitted Weibull distribution (, m/s) reproduces the empirical hub-height wind distribution closely. The mean wind speed of 9.5 m/s places Dakhla among the strongest offshore wind sites reported in the regional literature, and the relatively high shape parameter indicates a steady regime with few calm periods: the resource sits predominantly between cut-in and rated speed, where the power curve is steepest and most productive.
The modelled tidal current (Figure 4) displays the expected semi-diurnal rhythm with a clear spring–neap envelope produced by M₂–S₂ interference. Peak velocities reach the assumed 2.2 m/s at spring tide, but the time-averaged speed is only 1.1 m/s, and the current spends a substantial fraction of each cycle below the assumed turbine cut-in speed. Because power scales with the cube of velocity, these low-speed intervals contribute almost nothing to annual output, foreshadowing the modest tidal capacity factor.
4.2. Hybrid Power Output
Figure 5 shows one representative week of dispatch. Wind dominates the energy supply, with the tidal contribution appearing as a regular, low-amplitude ripple on top of the wind signal. The two resources are essentially uncorrelated (Pearson correlation ≈ 0.00): the tide follows an astronomical clock independent of synoptic wind variability, so the combined signal is smoother than wind alone. During high-wind intervals hybrid output exceeds the 350 MW electrolyser rating and the surplus is curtailed; over the simulation year this curtailment amounts to 15.1 % of the energy available at the electrolyser terminals the price of sizing the electrolyser below the generation peak to keep its own utilisation high.
Capacity factors are compared in Figure 6 and Table 3. The wind sub-system achieves 49.1 %, an excellent figure reflecting the quality of the Dakhla resource. The tidal sub-system reaches only 8.8 %, consistent with its low mean current speed and the conservative resource assumption of Section 2.3. The hybrid plant, weighted heavily toward wind capacity, settles at 45.5 %. The primary value of the tidal sub-system is therefore not added capacity but reduced variability: it raises the firm floor of supply and lessens electrolyser cycling benefits not captured by a capacity-factor figure alone.
4.3. Hydrogen Yield and Resource Demand
Feeding the dispatched power into the PEM electrolyser at a base-case SEC of 50 kWh/kg yields an estimated 36,800 t H₂/yr. The electrolyser operates at an annual utilisation of 60.0 %, markedly higher than a wind-only plant of equivalent nameplate capacity would allow the central economic rationale for hybridisation. Production requires approximately 441,000 m³ of purified water per year, supplied by seawater reverse osmosis; at 12 L/kg this is a minor direct cost but a non-trivial operational dependency. Table 3 summarises the resource-to-product chain, whose figures reconcile on an energy-balance basis: hybrid generation (2,234 GWh) minus the 3 % transmission loss and 15.1 % curtailment equals the 1,839 GWh delivered to the electrolyser.

Table 3.
Resource, energy and hydrogen-production summary for the base-case configuration.
| Quantity | Wind | Tidal | Hybrid |
|---|---|---|---|
| Installed capacity (MW) | 510 | 50 | 560 |
| Capacity factor (%) | 49.1 | 8.8 | 45.5 |
| Annual energy (GWh) | 2,195 | 39 | 2,234 |
| Electrolyser rating (MW) | — | — | 350 |
| Energy to electrolyser (GWh) | — | — | 1,839 |
| Electrolyser utilisation (%) | — | — | 60.0 |
| Curtailment (% of available) | — | — | 15.1 |
| Hydrogen output (t/yr) | — | — | 36,781 |
| Water demand (m³/yr) | — | — | 441,375 |
4.4. Export Pathway
Figure 7 compares the distance-dependent transport cost of the three carriers. Compressed gas has the lowest fixed cost but the steepest distance penalty; liquid hydrogen and ammonia have higher fixed costs dominated by liquefaction, and by synthesis-plus-reconversion respectively but scale more gently with distance. The compressed-gas and liquid-hydrogen curves cross at approximately 231 km, well below the 1,241 km route, so compressed gas is uncompetitive over this corridor. Over the full distance the LH₂ transport adder is approximately 2.51 USD/kg. The short 1.7-day voyage keeps boil-off negligible (0.52 %), which favours LH₂ over ammonia on this relatively short route, where ammonia’s reconversion penalty is not offset by lower shipping losses as it would be on intercontinental routes.
4.5. Levelised Cost of Hydrogen
The base-case capital cost totals 2,391 M$, dominated by the offshore wind array (1,275 M$, 53 %); the tidal array, electrolyser, liquefaction plant and balance-of-plant account for the remainder (Figure 8, Table 4). Discounting lifetime costs and production at a 7 % WACC over 25 years gives a 2025 production LCOH of 7.53 USD/kg. Adding liquefaction and shipping raises the delivered cost at Jorf Lasfar to 10.04 USD/kg. These figures lie above the 2–4 USD/kg roadmap ambition but are consistent with independent 2025 estimates for green hydrogen at remote, capital-intensive sites, including Morocco-specific studies reporting 7–16 USD/kg for onshore configurations [6,7].
Projecting to 2030 with widely cited learning trajectories (Table 2) PEM electrolyser CapEx falling to ≈350 $/kW, offshore wind to ≈1.8 M$/MW, SEC improving to 45 kWh/kg, and WACC easing to 5 % the production LCOH falls to 4.45 USD/kg, approaching the target band (Figure 9, Table 5). The 2030 hydrogen output rises to 40,868 t/yr, consistent with the improved SEC applied to the same delivered energy (the curtailment and utilisation being unchanged). The delivered cost falls proportionally less because liquefaction and shipping are comparatively mature and do not benefit from the same steep learning a separation between production and delivered cost that is one of the more policy-relevant findings of the study.
4.6. Sensitivity Analysis
The tornado diagram (Figure 10) ranks the cost drivers. The hybrid capacity factor is by far the most influential: a ±20 % variation moves the LCOH from 6.27 to 9.41 USD/kg around the 7.53 USD/kg base case. Electrolyser SEC is second, acting directly on the efficiency term. Offshore-wind CapEx and WACC form the next tier, reflecting the capital intensity of the project. Tidal CapEx, water cost and liquefaction CapEx have only marginal influence, confirming that the tidal sub-system is not a material cost risk despite its high per-MW cost. As a dedicated robustness check on the most uncertain input, halving the tidal resource (a 50 % reduction in tidal capacity factor, from 8.8 % to ≈4.4 %) lowers hybrid annual energy by only ≈0.9 % and raises the production LCOH by less than 0.10 USD/kg, confirming that the headline economics are insensitive to the poorly-constrained tidal resource. The practical implication is that development effort should concentrate on de-risking the wind-resource estimate and on electrolyser efficiency and financing, rather than on the marine-energy hardware.
Figure 10.
Sensitivity of production LCOH to ±20 % variation in each parameter, ranked by impact (base case 7.53 USD/kg).
Figure 10.
Sensitivity of production LCOH to ±20 % variation in each parameter, ranked by impact (base case 7.53 USD/kg).
5. Discussion
The modelled costs sit within the broad envelope reported internationally for green hydrogen in 2025. Production costs of roughly 4–9 USD/kg are typical of first-generation projects, with the lower end reserved for the cheapest solar-plus-wind sites with mature supply chains and the upper end for capital-intensive or logistically remote configurations [26,27]. The Dakhla base case of 7.53 USD/kg is credible rather than optimistic when benchmarked against comparable Moroccan studies reporting 7–16 USD/kg for onshore systems depending on site quality, storage and financing [6,7]. The wind capacity factor of 49.1 % is consistent with the upper range of assessments identifying Dakhla as the country’s best wind site [5,6], while the tidal capacity factor and power density fall well below the values reported for Morocco’s strongest tidal-stream sites at Gibraltar/Tangier [9,18], reinforcing that the Atlantic Sahara tidal resource is a firming rather than a bulk-energy contributor. The 2030 figure of 4.45 USD/kg indicates the roadmap target is reachable, but only if progress in electrolyser CapEx, efficiency and cost of capital occurs simultaneously; the sensitivity analysis shows that a shortfall in any single one is sufficient to keep the project above the target band.
On a pure energy or capacity-factor basis, tidal energy is a poor investment at this site: its 8.8 % capacity factor and 4.0 M$/MW capital cost make it uncompetitive with wind on a levelised-cost-of-electricity basis alone, and a cost-minimising planner working from those metrics only would omit it. Its value lies instead in the temporal structure of supply. Because the tide is essentially uncorrelated with the wind, it reduces the variance of the combined signal, raises the firm floor of power available to the electrolyser, and in principle reduces the frequency of low-load and shutdown events understood to degrade PEM stack lifetime under repeated cycling. This study does not model stack degradation explicitly; it should be read as identifying a plausible operational benefit whose economic value has not yet been quantified. A complete valuation would require an explicit stack-degradation model linking cycling frequency to replacement cost and lifetime, together with a value-of-firmness framework both identified as priority extensions in Section 5.4.
For Morocco, a Dakhla hydrogen hub aligns the country’s best offshore wind resource with an Atlantic export geography and an existing off-take point at Jorf Lasfar, supporting the roadmap’s twin goals of decarbonisation and energy sovereignty [3,4]. For European buyers subject to renewable-fuel and carbon-border rules, hydrogen produced from additional offshore renewables with transparent provenance is attractive [1,28]. The clear separation between a near-target-compliant production cost and a materially higher delivered cost implies, however, that conditioning and transport not generation may become the binding constraint on export competitiveness, and that policy support should not stop at the electrolyser gate.
The principal limitations, and the future work each motivates, are ranked below in order of priority:
- Resource measurement. The resource characterisation rests on CMEMS reanalysis/satellite products and an ERA5-derived hourly wind series (Section 2.5 and Section 3.1) rather than co-located in-situ measurements, and the Dakhla tidal resource is especially uncertain: the reanalysis provides only a weak monthly geostrophic current, and the sub-monthly tidal stream is modelled harmonically rather than measured. A bankable study requires at least one year of on-site met-ocean data, including ADCP current profiling in Dakhla Bay.
- Storage and electrolyser cycling. The base case omits storage and does not model stack degradation. Adding batteries or a hydrogen buffer, together with an explicit degradation-versus-cycling model, would allow the firming value of tidal hybridisation to be monetised.
- System-sizing optimisation. This is a single-configuration study. A multi-objective optimisation of the wind/tidal/electrolyser/storage sizing for example using mixed-integer programming (Pyomo) or metaheuristics such as genetic algorithms or particle-swarm optimisation, as applied elsewhere to Moroccan hydrogen systems [6] together with a global variance-based sensitivity analysis, is the natural next step.
- Conditioning, transport and grid. Liquefaction and shipping are parametric rather than engineering-level and should be validated against vendor quotations, and site-specific grid-connection and cable-routing studies are required.
- Environmental and social factors. These are not monetised; a strategic environmental assessment and stakeholder engagement would be prerequisites for development.
6. Conclusions
This study has presented an integrated, self-consistent techno-economic assessment of a hybrid offshore wind and tidal current system producing green hydrogen for maritime export on the Moroccan Atlantic coast. The Dakhla wind resource is exceptional, supporting a wind capacity factor of 49.1 % and a hybrid capacity factor of 45.5 % for a 560 MW plant, which is estimated to produce approximately 36,800 t of hydrogen per year at 60.0 % electrolyser utilisation. The tidal resource is modest in energy terms and its magnitude carries substantial uncertainty given the lack of site-specific data but, being uncorrelated with wind, it smooths supply and is expected to improve electrolyser utilisation and reduce cycling, an effect shown to be robust to a 50 % reduction in the assumed resource. The 2025 base-case production LCOH is 7.53 USD/kg (10.04 USD/kg delivered to Jorf Lasfar); under 2030 learning assumptions it falls to 4.45 USD/kg, approaching the 2–4 USD/kg roadmap band. Liquid hydrogen is the preferred export vector for the 1,241 km corridor, with compressed gas uncompetitive beyond ≈231 km and ammonia disadvantaged over this short route by its reconversion penalty. Capacity factor and electrolyser SEC are the dominant cost levers, ahead of wind capital cost and the cost of capital, while the tidal sub-system is not a material cost risk. Reaching the national roadmap target is therefore feasible in principle but contingent on simultaneous progress across several technology and financing dimensions, and future work should prioritise on-site resource measurement, an explicit treatment of storage and electrolyser cycling, and a multi-objective optimisation of system sizing.
Author Contributions
Conceptualization, O.E.F. and M.T.; methodology, O.E.F.; software, O.E.F.; validation, O.E.F. and M.T.; formal analysis, O.E.F.; investigation, O.E.F.; data curation, O.E.F.; writing—original draft preparation, O.E.F.; writing—review and editing, M.T.; supervision, M.T. All authors have read and agreed to the published version of the manuscript.
Funding
This research received no external funding.
Data Availability Statement
The oceanographic and atmospheric datasets analysed in this study are openly available from the Copernicus Marine Service (CMEMS) and the ECMWF ERA5 reanalysis. Model implementation details are provided in Section 3.10.
Conflicts of Interest
The authors declare no conflicts of interest.
Nomenclature
| Symbol | Definition | Units |
| , | Weibull shape / scale parameter | –, m/s |
| ; | Wind speed; cut-in, rated, cut-out speed | m/s |
| Turbine rated power | MW | |
| Mean wind power density | W/m² | |
| Air / seawater density | kg/m³ | |
| ; | Rotor swept area; power coefficient | m²; – |
| ; ; ; | Induction factor; wake decay; rotor radius; spacing | –; –; m; m |
| Gamma function | – | |
| ; ; ; | Tidal current; M₂ amplitude; M₂ period; phase | m/s; m/s; h; rad |
| , ; ; | Eastward, northward current components; current magnitude; direction | m/s; m/s; rad |
| CF | Capacity factor | – |
| Component / system / Faraday efficiencies | – | |
| ; LHV | H₂ mass-flow rate; lower heating value (33.33) | kg/s; kWh/kg |
| SEC | Specific energy consumption | kWh/kg |
| ; ; ; | Faraday constant; electrons; molar mass; current | C/mol; –; g/mol; A |
| Compression / minimum liquefaction work | kWh/kg | |
| ; ; | Compressibility; gas constant; pressures | –; J/mol·K; bar |
| Total heat load removed per unit mass in liquefaction | kWh/kg | |
| Ambient / liquefaction temperature | K | |
| ; | Daily boil-off fraction; initial stored mass | 1/day; kg |
| LCOT; CRF | Levelised transport cost; capital-recovery factor | USD/kg; – |
| CAPEX, OPEX | Capital / operating expenditure | USD |
| ; | Electricity price; value of lost H₂ | $/kWh; $/kg |
| LCOH | Levelised cost of hydrogen | USD/kg |
| Investment, O&M, feedstock, salvage cash flows | USD | |
| ; ; WACC | Discount rate; project life; weighted avg cost of capital | –; yr; – |
| ; ; | Equity, debt, value; costs of equity/debt; tax rate | USD; –; – |
References
- IRENA. (2022). Geopolitics of the Energy Transformation: The Hydrogen Factor. Abu Dhabi: IRENA.
- He, G., et al. (2020). Global potential and cost of green hydrogen from solar and wind energy. Energy & Environmental Science, 13, 3993–4008.
- Ministère de l’Énergie, des Mines et de l’Environnement (MEM). (2021). Feuille de Route Nationale de l’Hydrogène Vert. Rabat: Royaume du Maroc.
- Caillard, A., et al. (2024). A critical analysis of Morocco’s Green Hydrogen Roadmap. Climate, 12(5), 61. [CrossRef]
- Berrada, A., & Loudiyi, K. (2023). Green hydrogen production potential in Morocco. International Journal of Hydrogen Energy, 48.
- [Authors to verify]. (2025). Techno-economic analysis of green hydrogen production from onshore wind for Morocco. International Journal of Hydrogen Energy, 133, 101–111.
- [Authors to verify]. (2023). Assessment of green hydrogen production in Morocco using hybrid renewable sources (PV and wind). International Journal of Hydrogen Energy, 48.
- Pérez-Collazo, C., Greaves, D., & Iglesias, G. (2015). A review of combined wave and offshore wind energy. Renewable and Sustainable Energy Reviews, 42, 141–153. [CrossRef]
- [Author to verify]. (2019). Review and assessment of offshore renewable energy resources in Morocco’s coastline. Cogent Engineering, 6(1).
- Nachtane, M., et al. (2018). Assessment of energy production potential from tidal stream currents in Morocco. Energies, 11(5), 1065. [CrossRef]
- [Authors to verify]. (2024). Assessment of hydrogen-based solutions associated with offshore wind farms: the Iberian Peninsula. Renewable and Sustainable Energy Reviews, 192, 114268.
- Hersbach, H., et al. (2020). The ERA5 global reanalysis. Quarterly Journal of the Royal Meteorological Society, 146(730), 1999–2049. [CrossRef]
- IPCC. (2021). Climate Change 2021: The Physical Science Basis. Cambridge University Press.
- Manwell, J. F., McGowan, J. G., & Rogers, A. L. (2010). Wind Energy Explained (2nd ed.). Wiley. [CrossRef]
- Musial, W., et al. (2019). 2020 Offshore Wind Market Report. NREL.
- IEA. (2023). Offshore Wind Outlook 2023. Paris: IEA.
- Pugh, D. T., & Woodworth, P. L. (2014). Sea-Level Science. Cambridge University Press.
- Bahaj, A. S., et al. (2007). Power and thrust measurements of marine current turbines. Renewable Energy, 32(3), 407–426. [CrossRef]
- OCP Group. (2024). Jorf Lasfar Industrial and Port Complex. El Jadida.
- Jensen, N. O. (1983). A Note on Wind Generator Interaction (Risø-M-2411). Risø National Laboratory.
- Pugh, D. T. (1987). Tides, Surges and Mean Sea-Level. Wiley.
- Carmo, M., et al. (2013). A comprehensive review on PEM water electrolysis. International Journal of Hydrogen Energy, 38(12), 4901–4934. [CrossRef]
- Sdanghi, G., et al. (2019). Review of hydrogen compression technologies. Renewable and Sustainable Energy Reviews, 102, 150–170.
- Valenti, G. (2016). Hydrogen liquefaction and liquid hydrogen storage. In Compendium of Hydrogen Energy (Vol. 2, pp. 27–51). Woodhead.
- IEA. (2023). Global Hydrogen Review 2023. Paris: IEA.
- IRENA. (2022). Green Hydrogen Cost Reduction. Abu Dhabi: IRENA.
- Hsieh, L. (2024). The cost of green: hydrogen from offshore wind power. Energy Conversion and Management: X, 24, 100770.
- Ishimoto, Y., et al. (2020). Large-scale production and transport of hydrogen from Norway to Europe and Japan. International Journal of Hydrogen Energy, 45(58), 32865–32883. [CrossRef]
- Copernicus Marine Environment Monitoring Service (CMEMS), implemented by Mercator Océan International. Available at: https://marine.copernicus.eu/ (accessed 2025).
- Atlantic-Iberian Biscay Irish Ocean Physics Reanalysis, product IBI_REANALYSIS_PHYS_005_002. Copernicus Marine Service.
- CMEMS. Global Ocean Physics Reanalysis, product GLOBAL_REP_PHY_001_021. Copernicus Marine Service.
- CMEMS. Global Ocean Wind L4 Reprocessed Observations, product WIND_GLO_WIND_L4_REP_OBSERVATIONS_012_003. Copernicus Marine Service.
- Institut National de Recherche Halieutique (INRH). (2017). Met-ocean resource characterisation of the Moroccan Atlantic and Mediterranean coasts: currents, wind and sea-surface temperature (2002–2016) [Master’s thesis / technical report]. Casablanca, Morocco. [full author and title to be completed by the authors].
Figure 1.
System chain: hybrid wind–tidal generation.
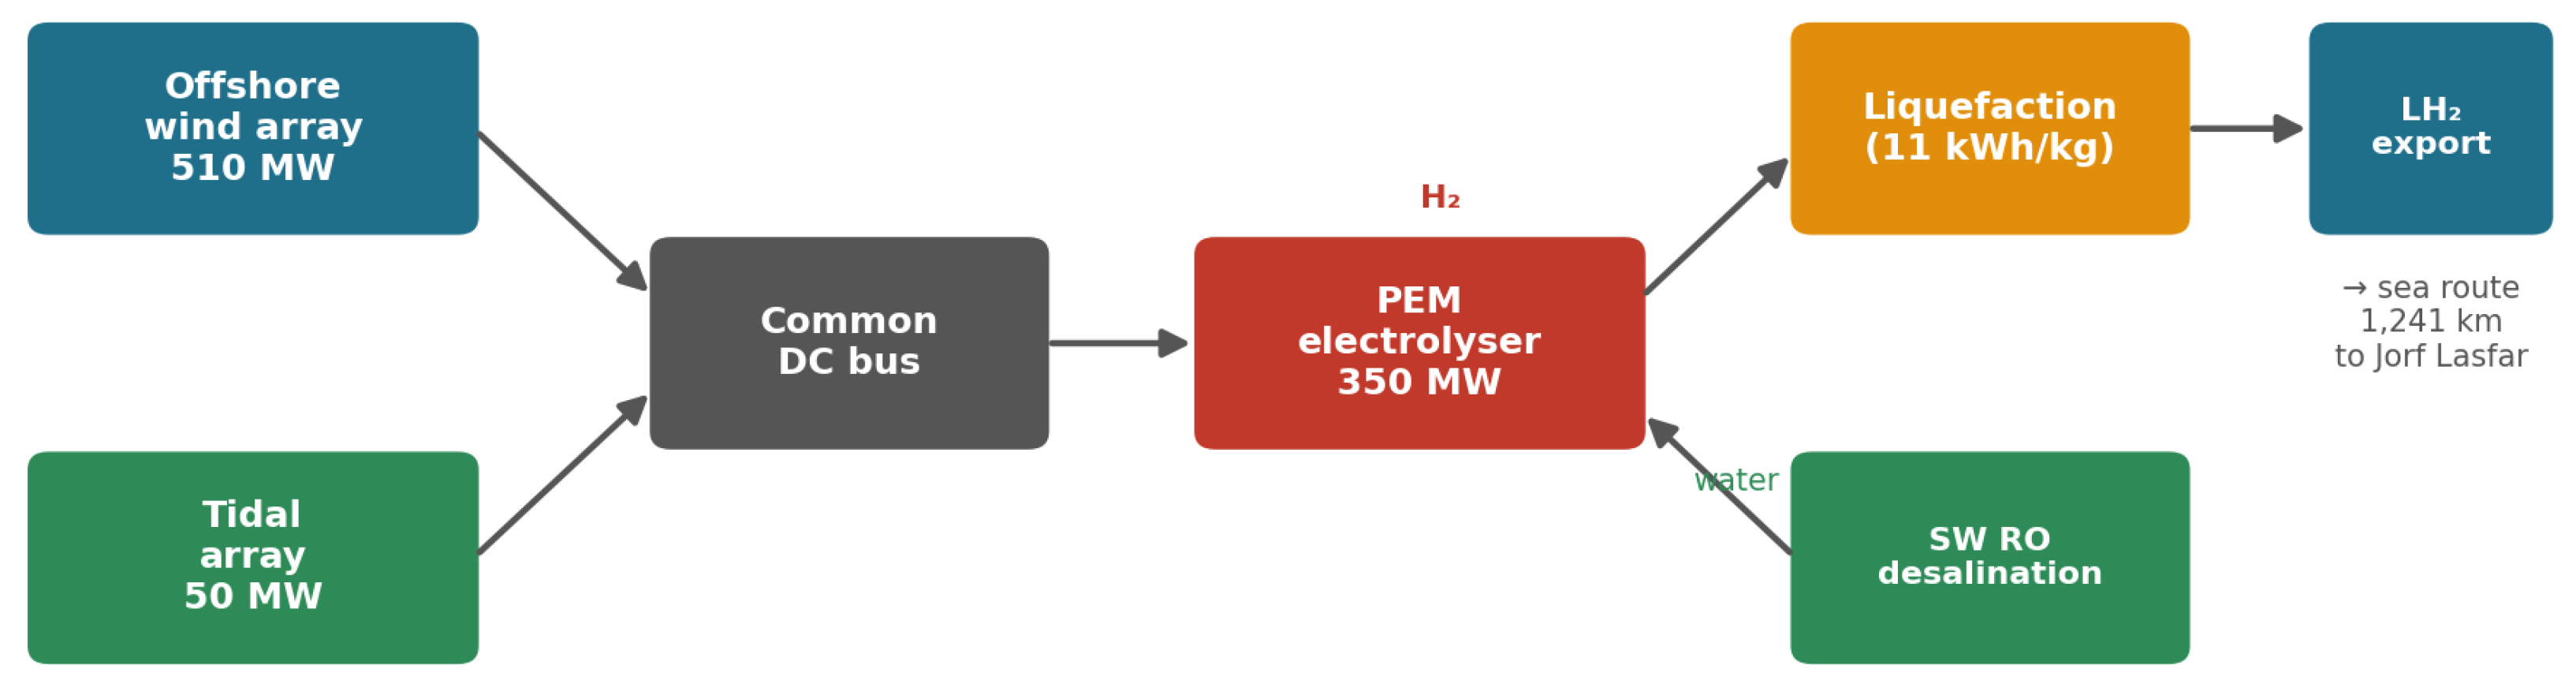
Figure 2.
Project layout: the Dakhla offshore generation hub (offshore wind and tidal arrays) and the ≈1,241 km maritime liquid-hydrogen export route to the industrial port of Jorf Lasfar.
Figure 2.
Project layout: the Dakhla offshore generation hub (offshore wind and tidal arrays) and the ≈1,241 km maritime liquid-hydrogen export route to the industrial port of Jorf Lasfar.
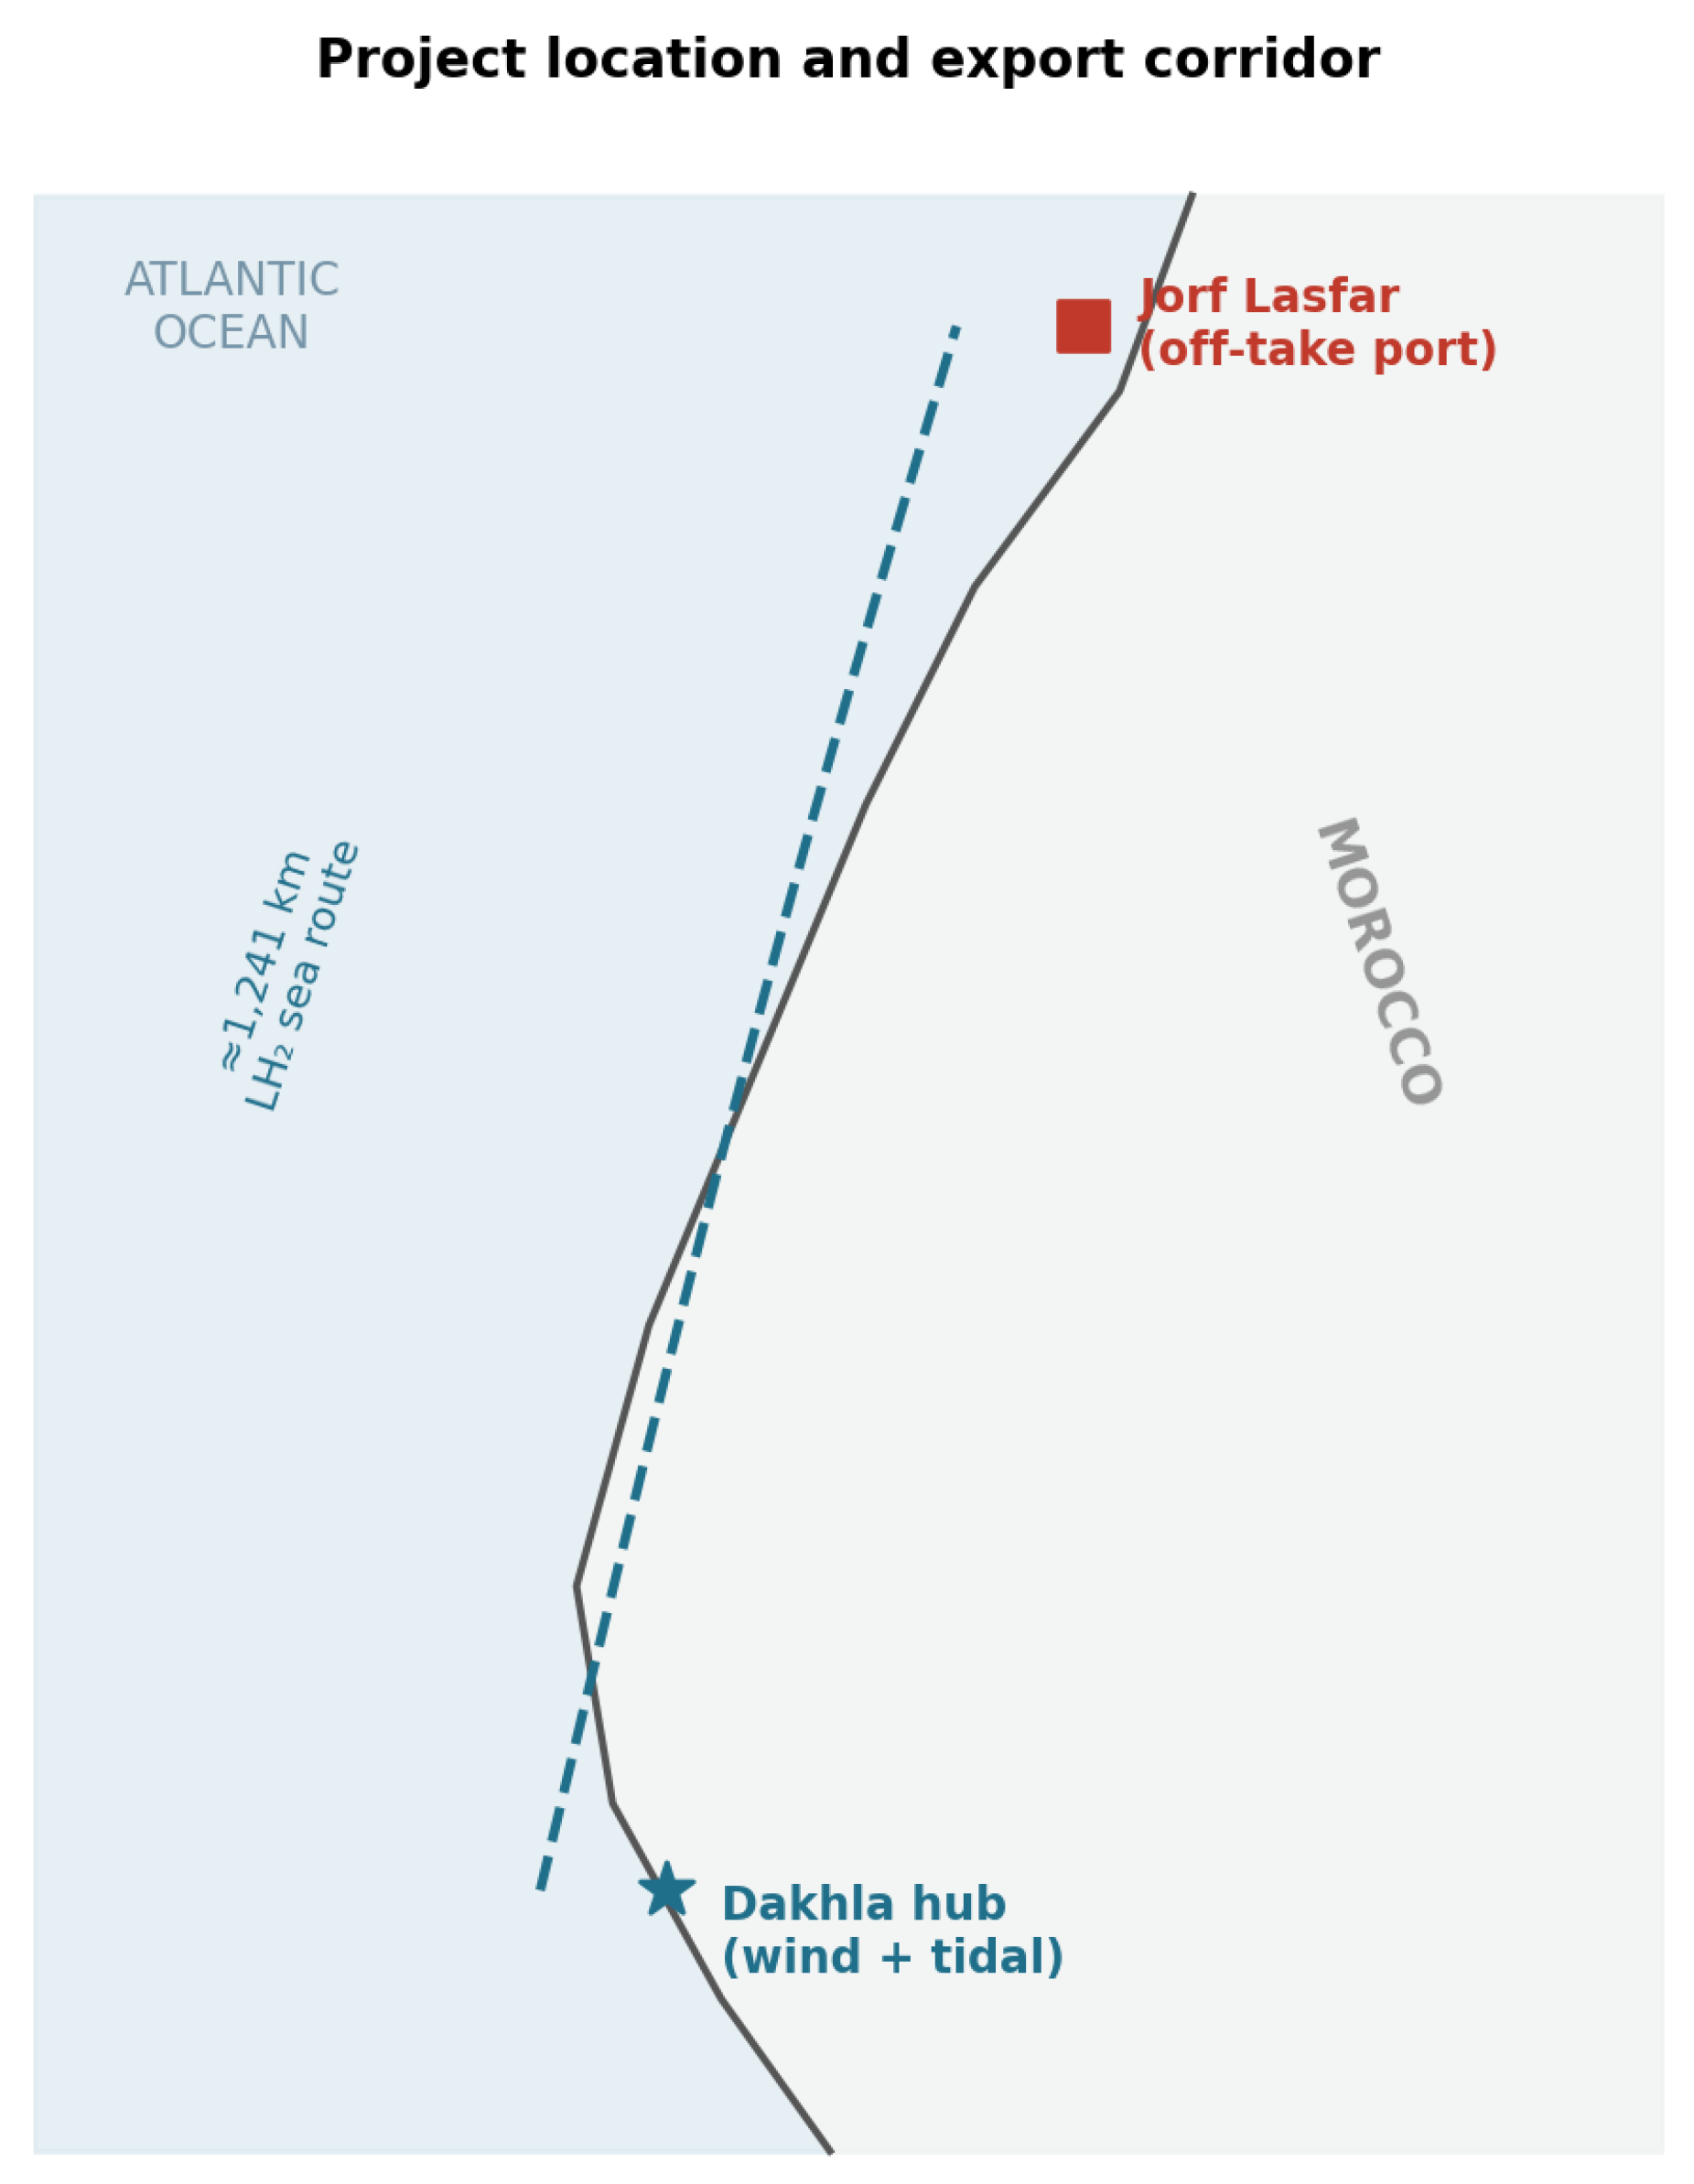
Figure 3.
Empirical hub-height wind-speed histogram and fitted Weibull probability density at 100 m for the Dakhla offshore zone (, m/s; mean 9.5 m/s).
Figure 3.
Empirical hub-height wind-speed histogram and fitted Weibull probability density at 100 m for the Dakhla offshore zone (, m/s; mean 9.5 m/s).
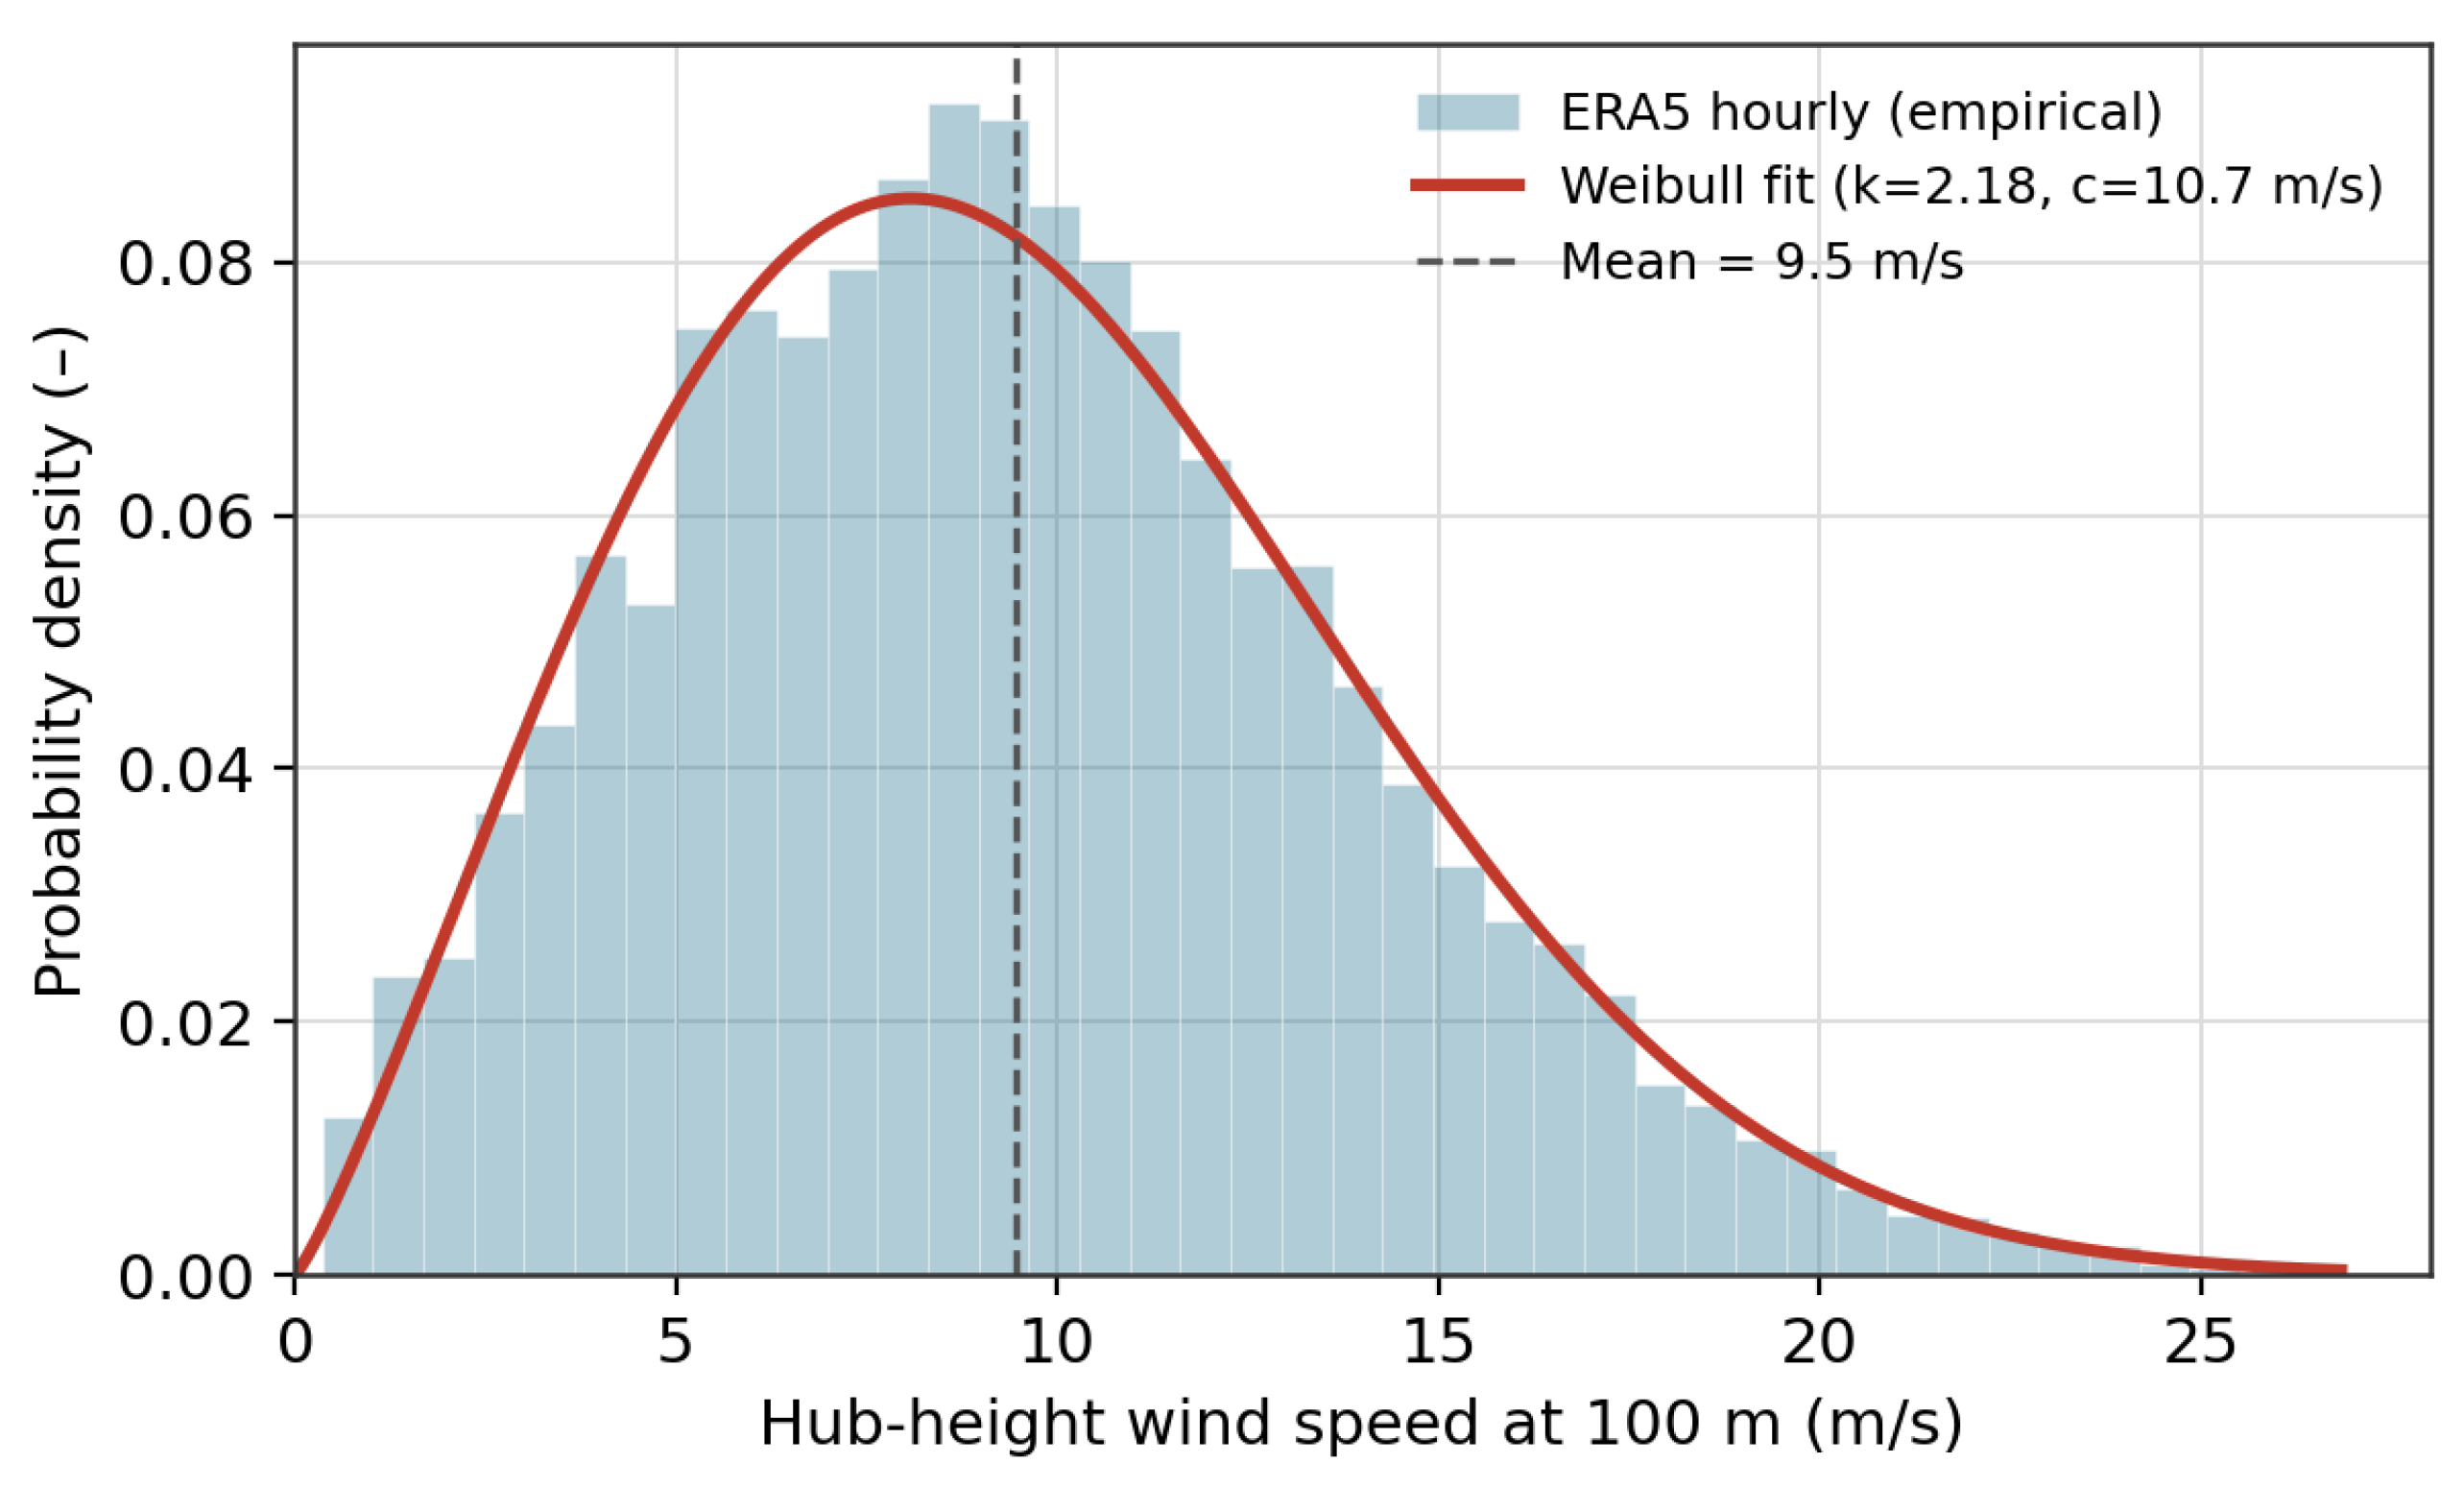
Figure 4.
Modelled tidal current velocity over a representative seven-day window, showing the semi-diurnal cycle and spring–neap modulation; the dotted line marks the assumed turbine cut-in speed.
Figure 4.
Modelled tidal current velocity over a representative seven-day window, showing the semi-diurnal cycle and spring–neap modulation; the dotted line marks the assumed turbine cut-in speed.
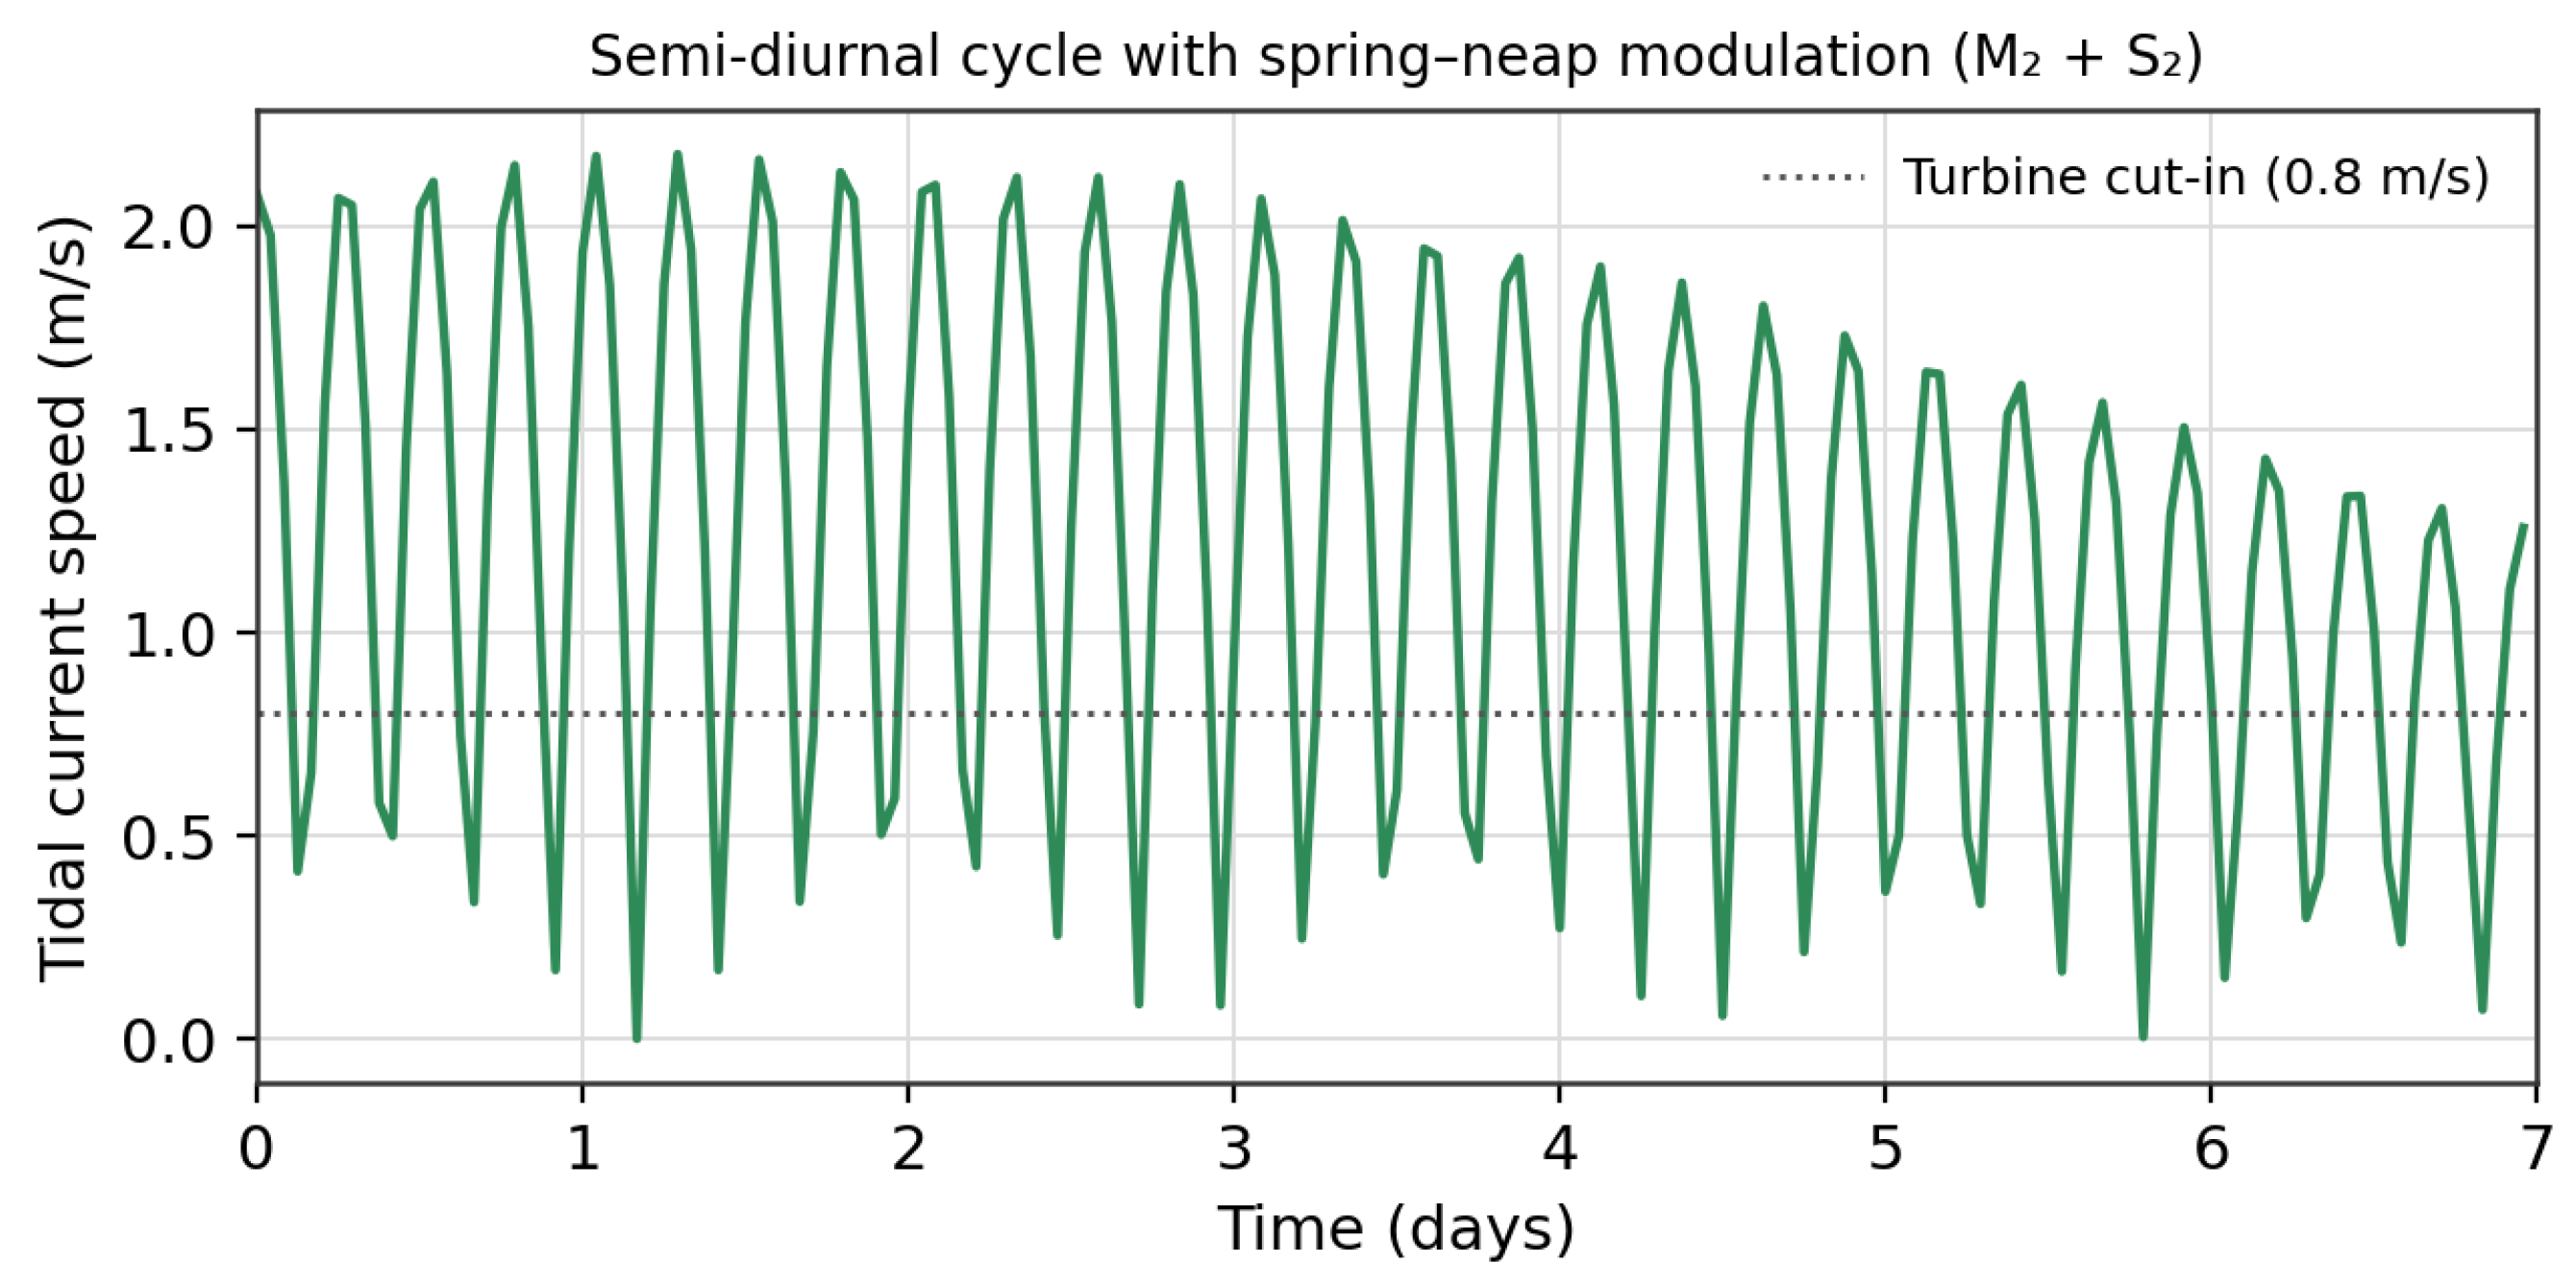
Figure 5.
Hourly hybrid power over a representative week, decomposed into wind (blue) and tidal (green) components, with the 350 MW electrolyser rating shown for reference. High-wind days 0–4 are curtailed above the rating; days 5–7 show a synoptic lull.
Figure 5.
Hourly hybrid power over a representative week, decomposed into wind (blue) and tidal (green) components, with the 350 MW electrolyser rating shown for reference. High-wind days 0–4 are curtailed above the rating; days 5–7 show a synoptic lull.
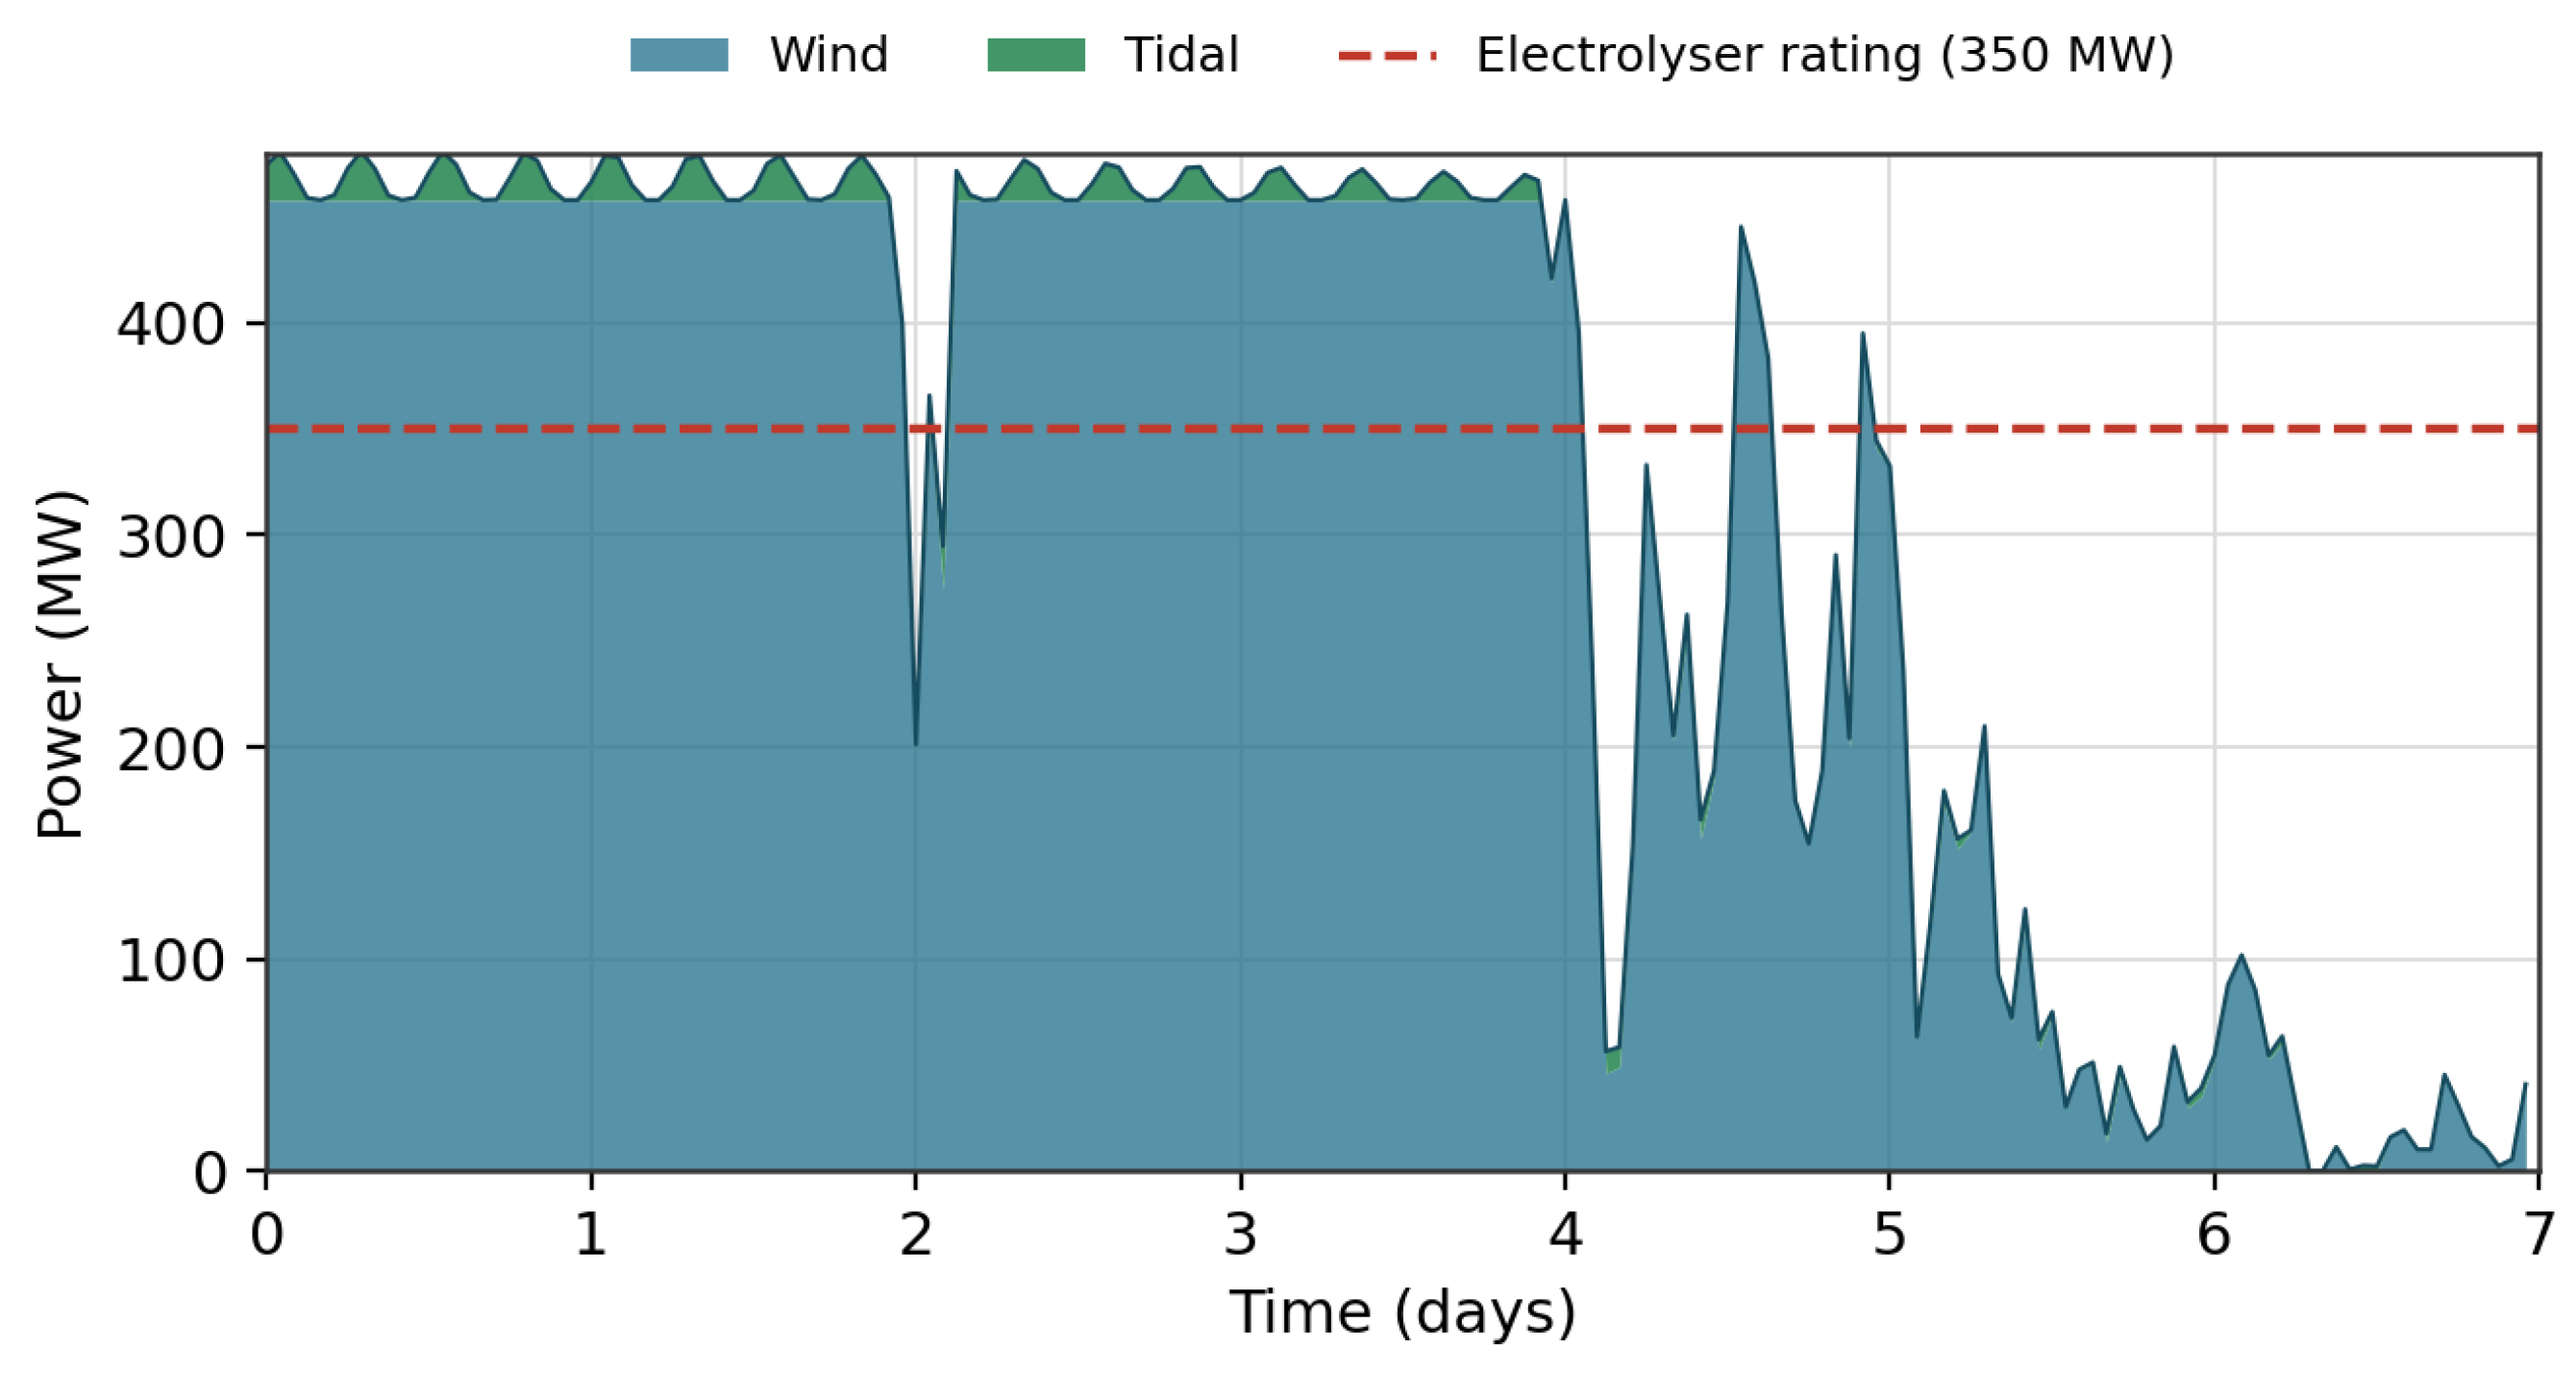
Figure 6.
Capacity factor by configuration: wind-only, tidal-only and hybrid.
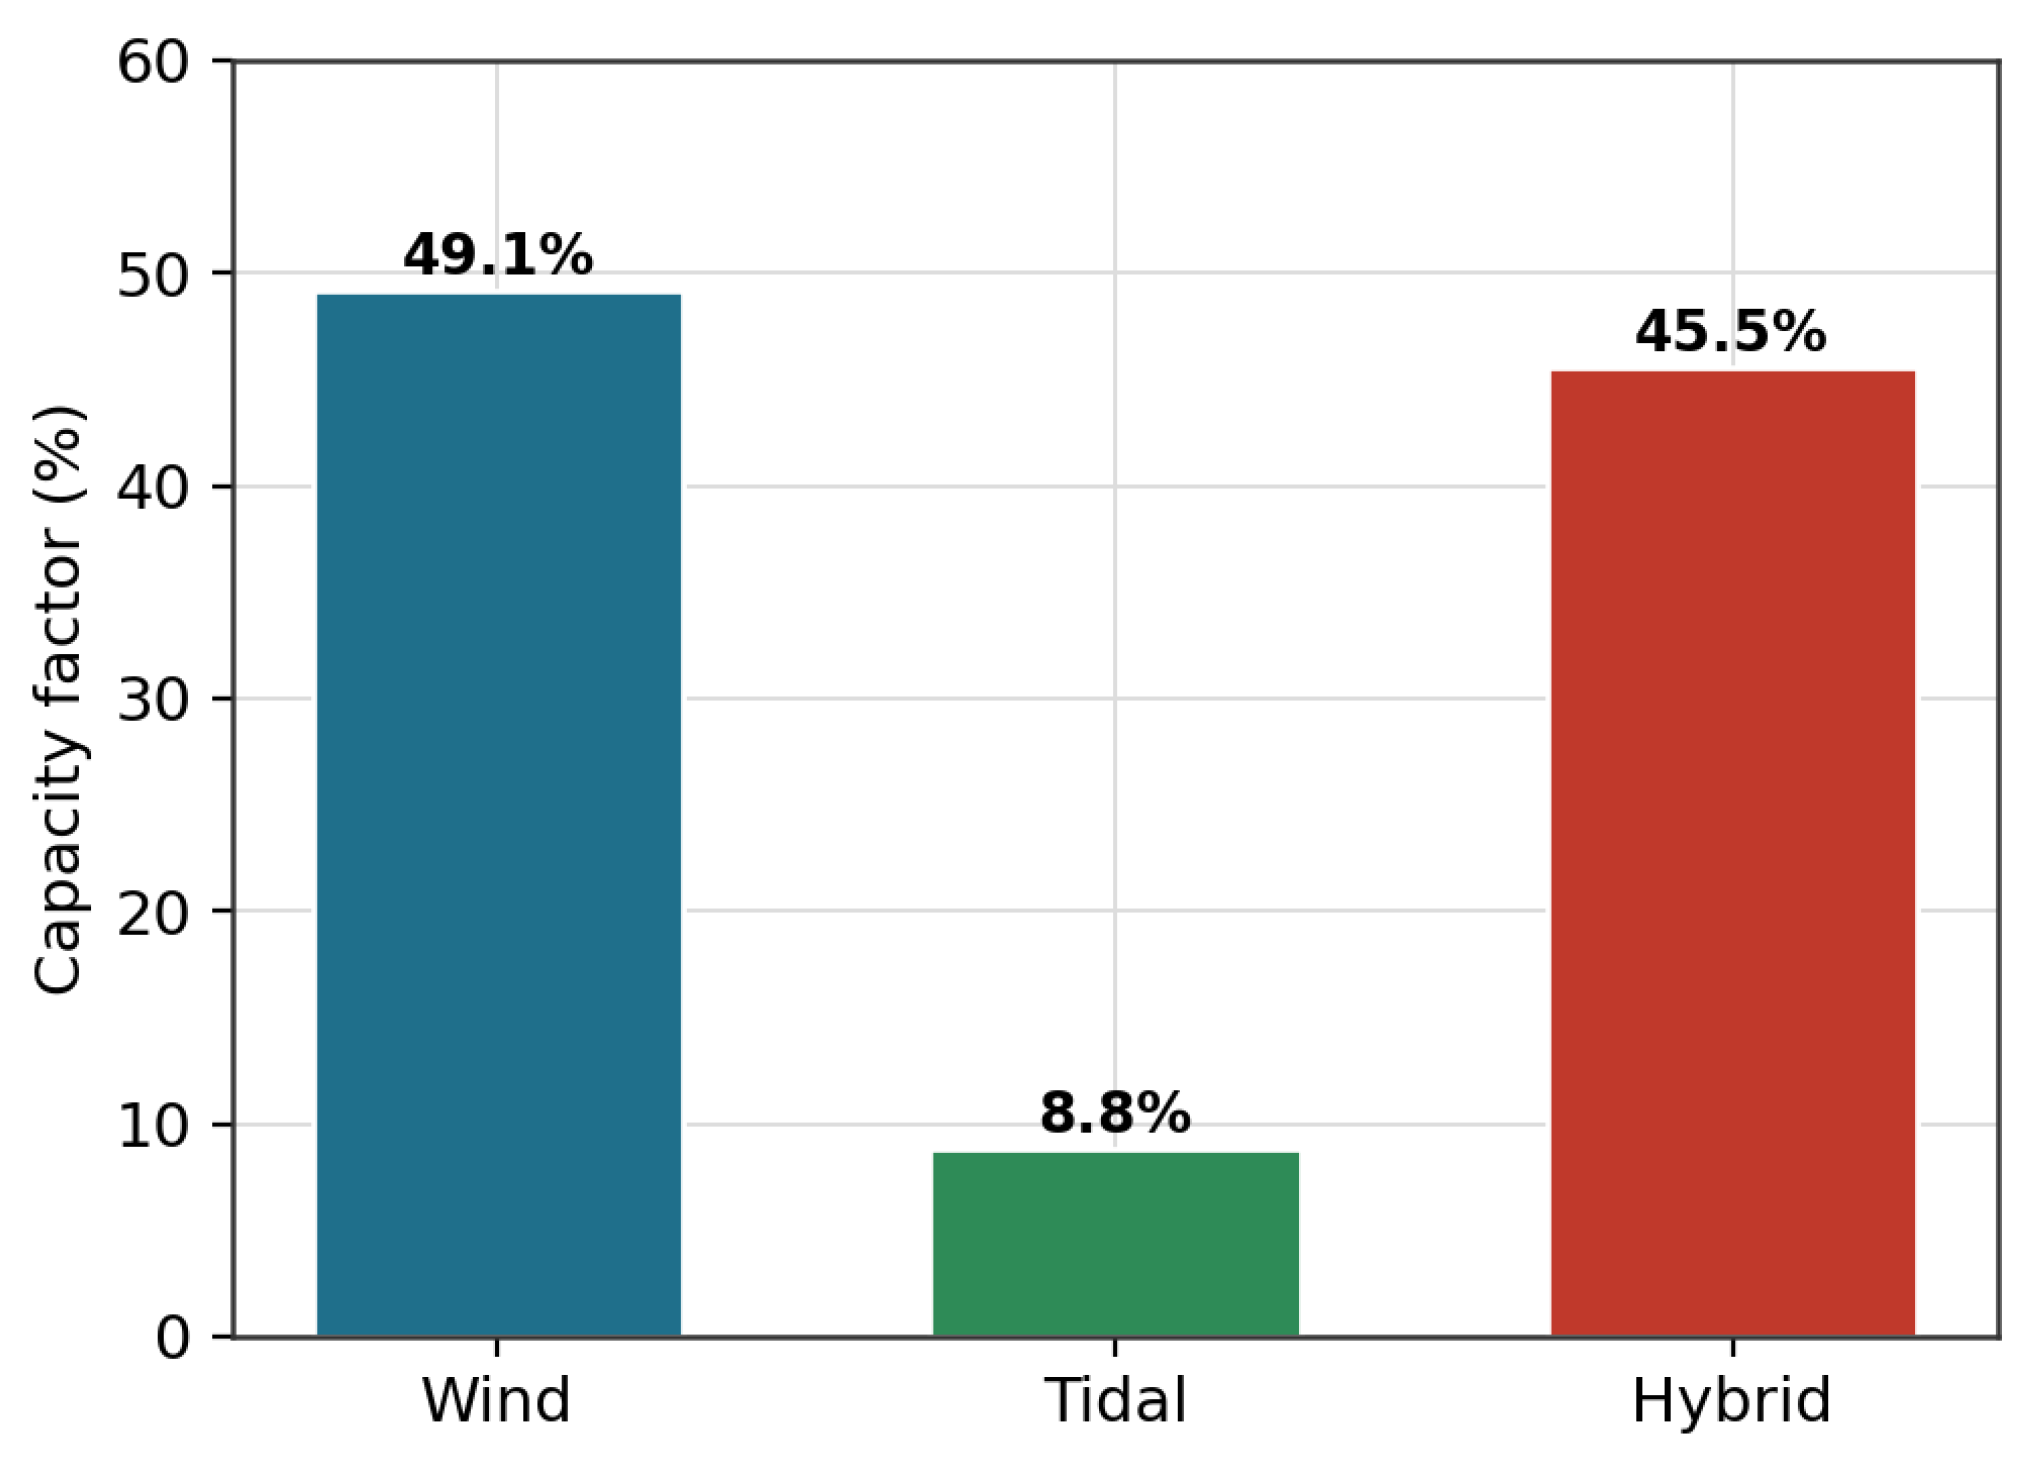
Figure 7.
Transport cost adder versus distance for compressed gas, liquid hydrogen and ammonia carriers; the dotted vertical line marks the Dakhla–Jorf Lasfar distance (1,241 km) and the marker the CGH₂–LH₂ break-even (≈231 km).
Figure 7.
Transport cost adder versus distance for compressed gas, liquid hydrogen and ammonia carriers; the dotted vertical line marks the Dakhla–Jorf Lasfar distance (1,241 km) and the marker the CGH₂–LH₂ break-even (≈231 km).
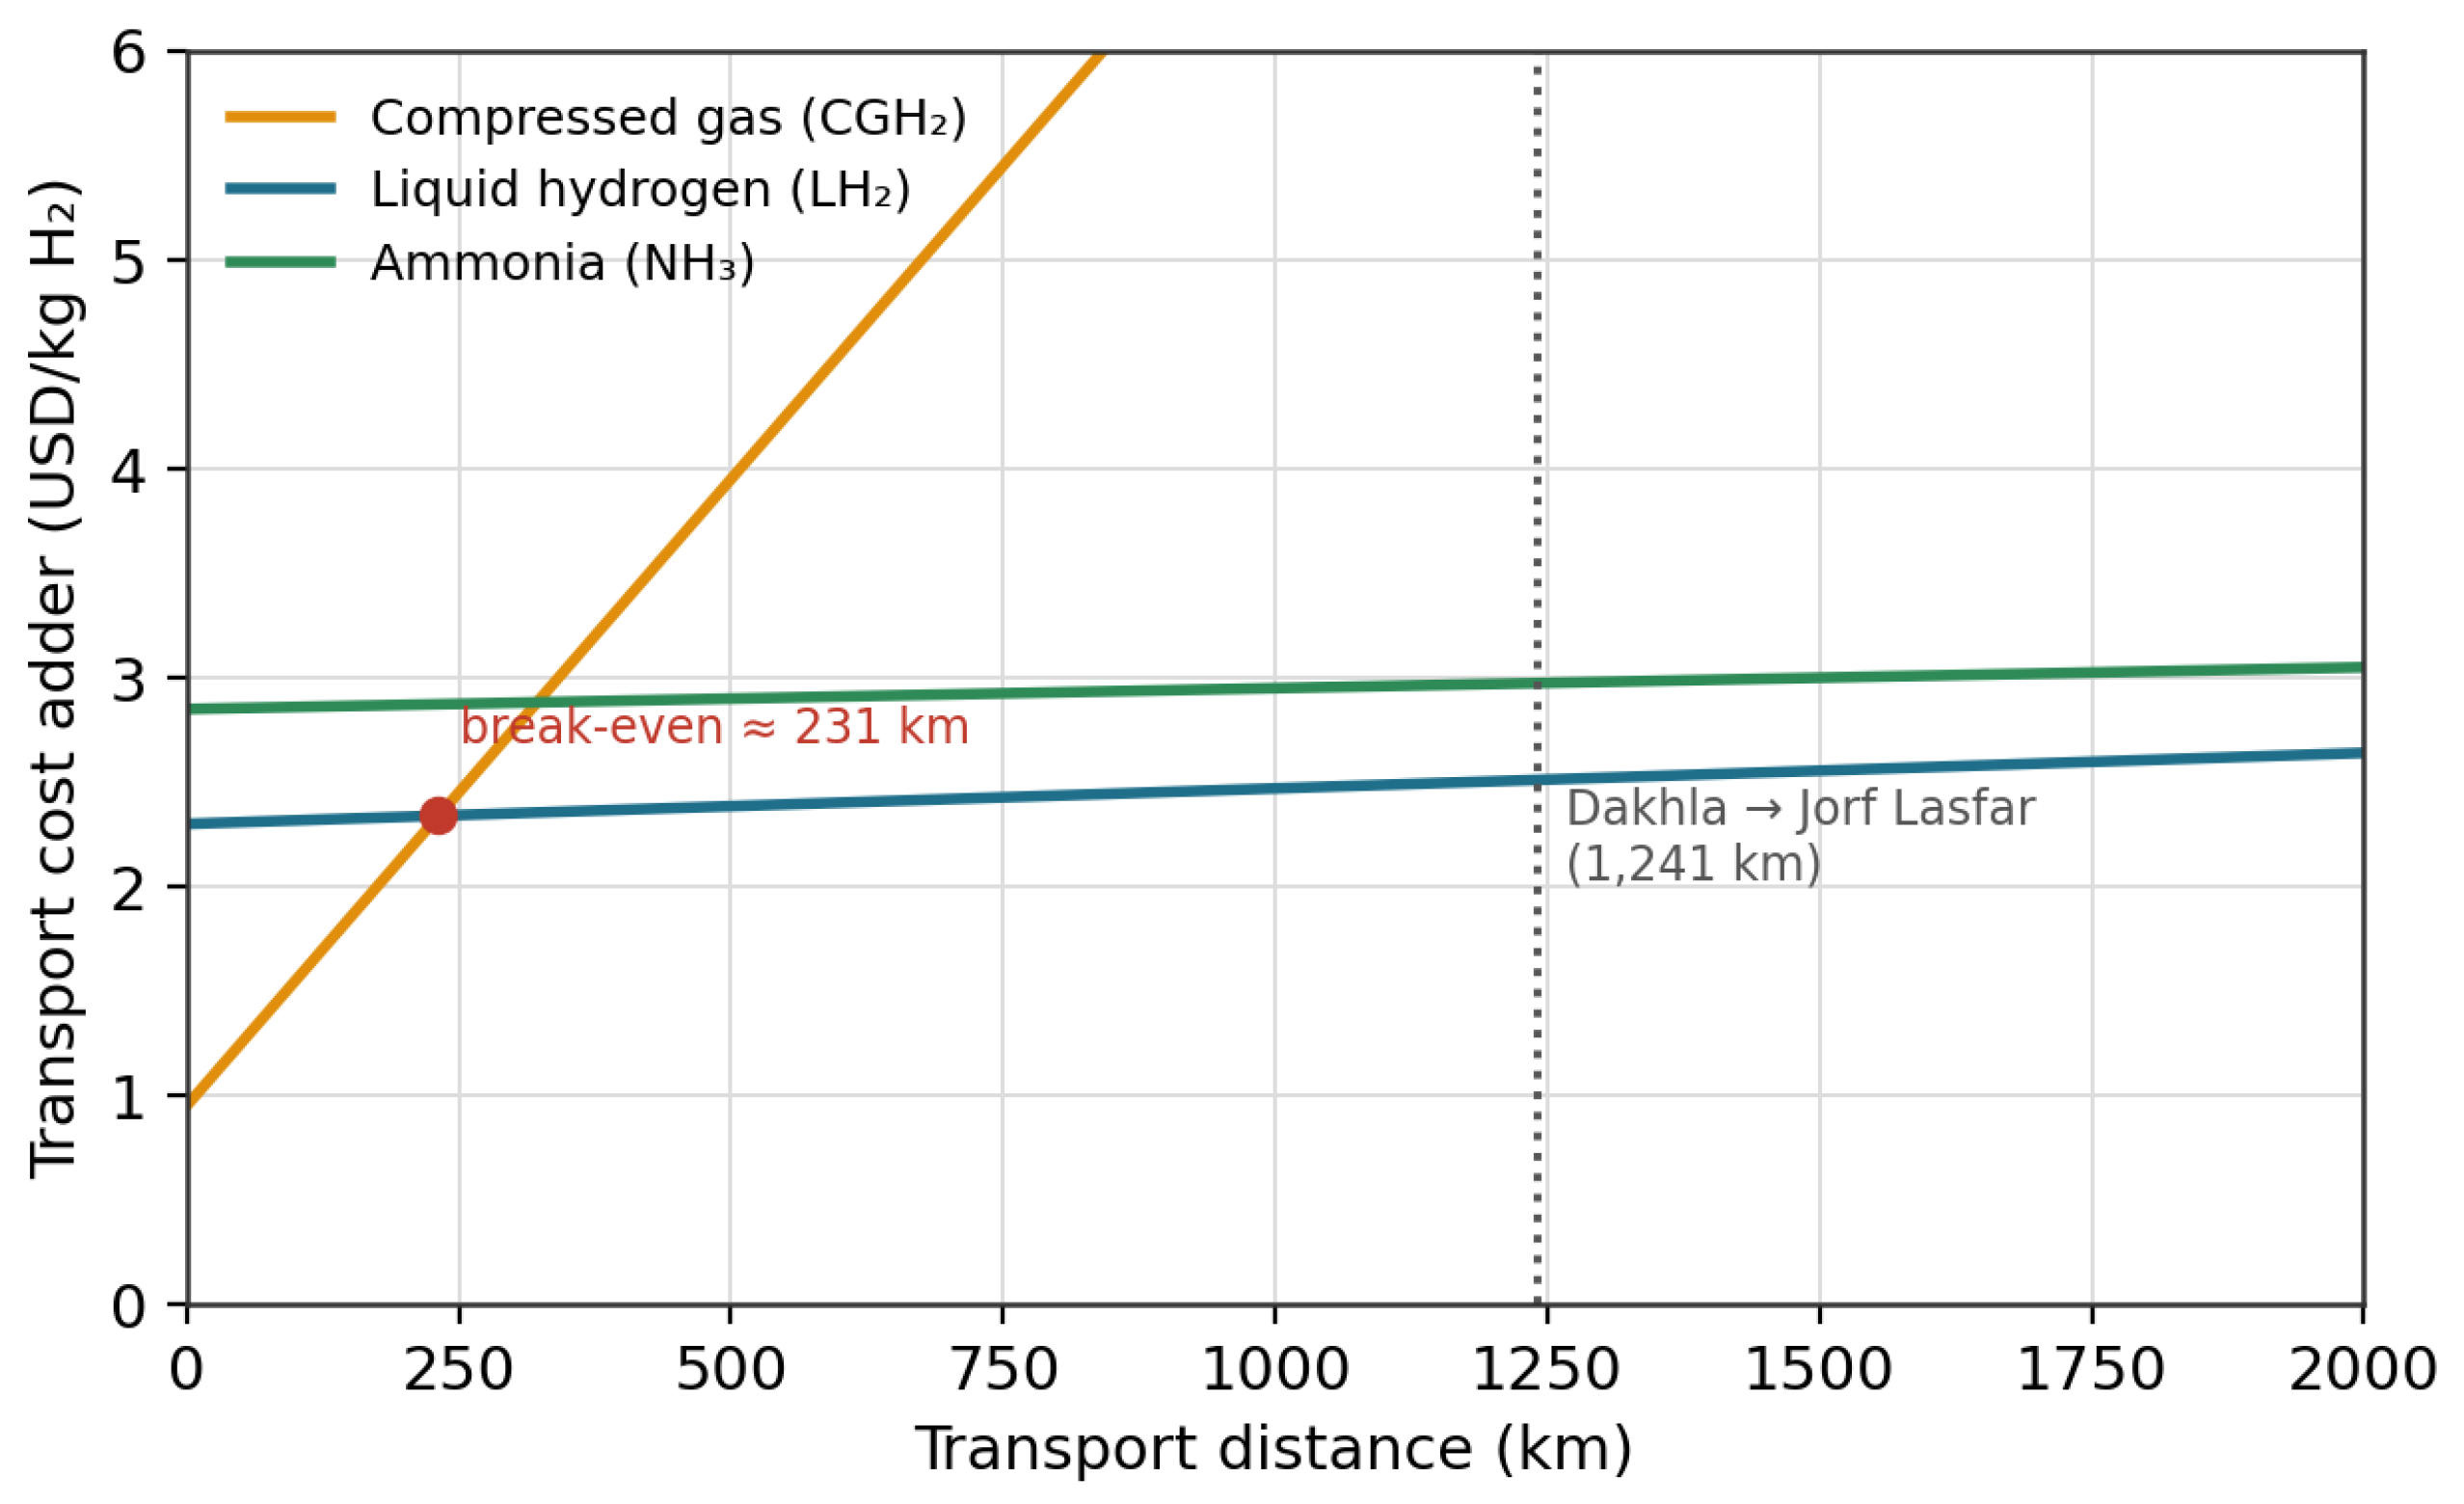
Figure 8.
Base-case capital-cost breakdown (total 2,391 M$).
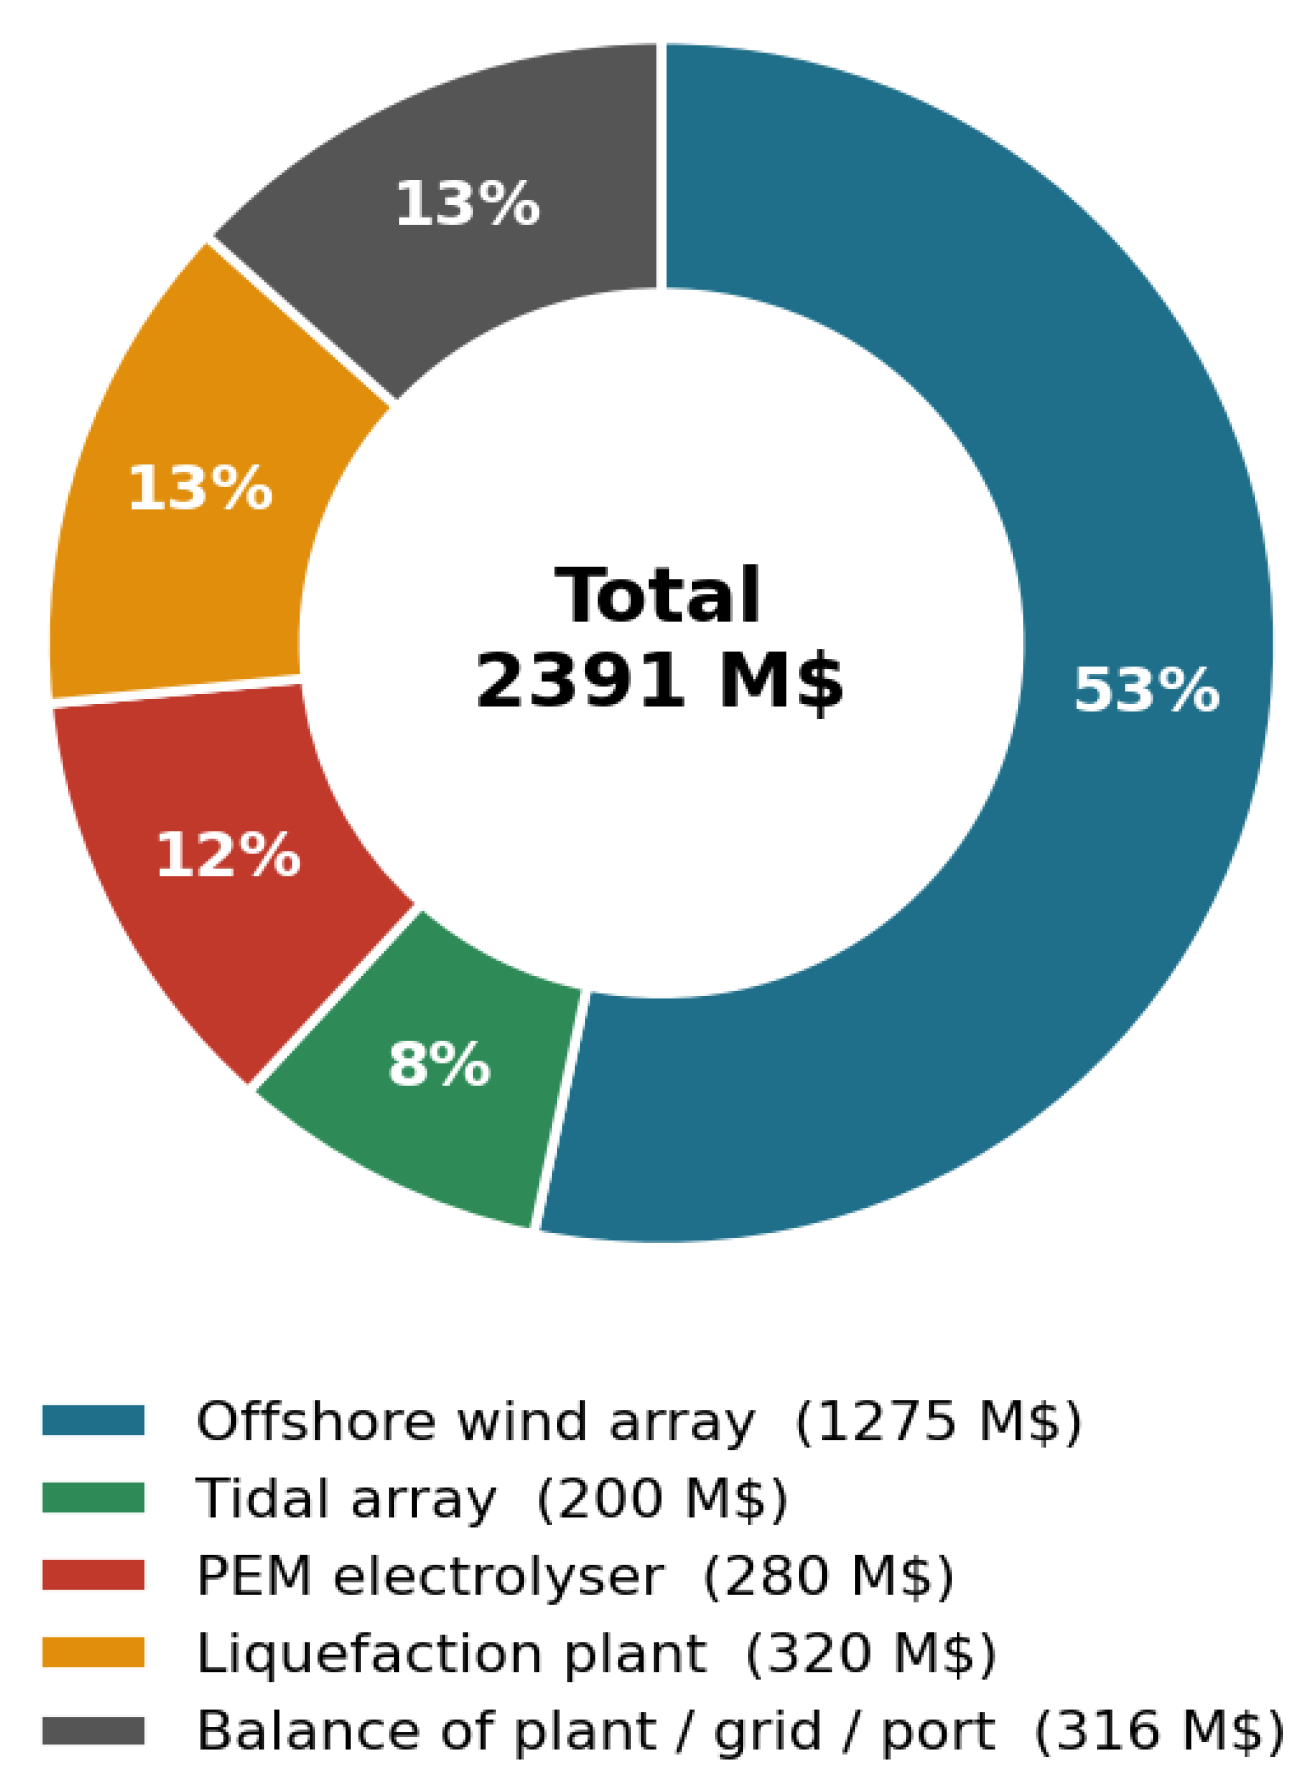
Figure 9.
LCOH by scenario (production and delivered, 2025 and 2030) against the 2–4 USD/kg national roadmap target band (shaded).
Figure 9.
LCOH by scenario (production and delivered, 2025 and 2030) against the 2–4 USD/kg national roadmap target band (shaded).
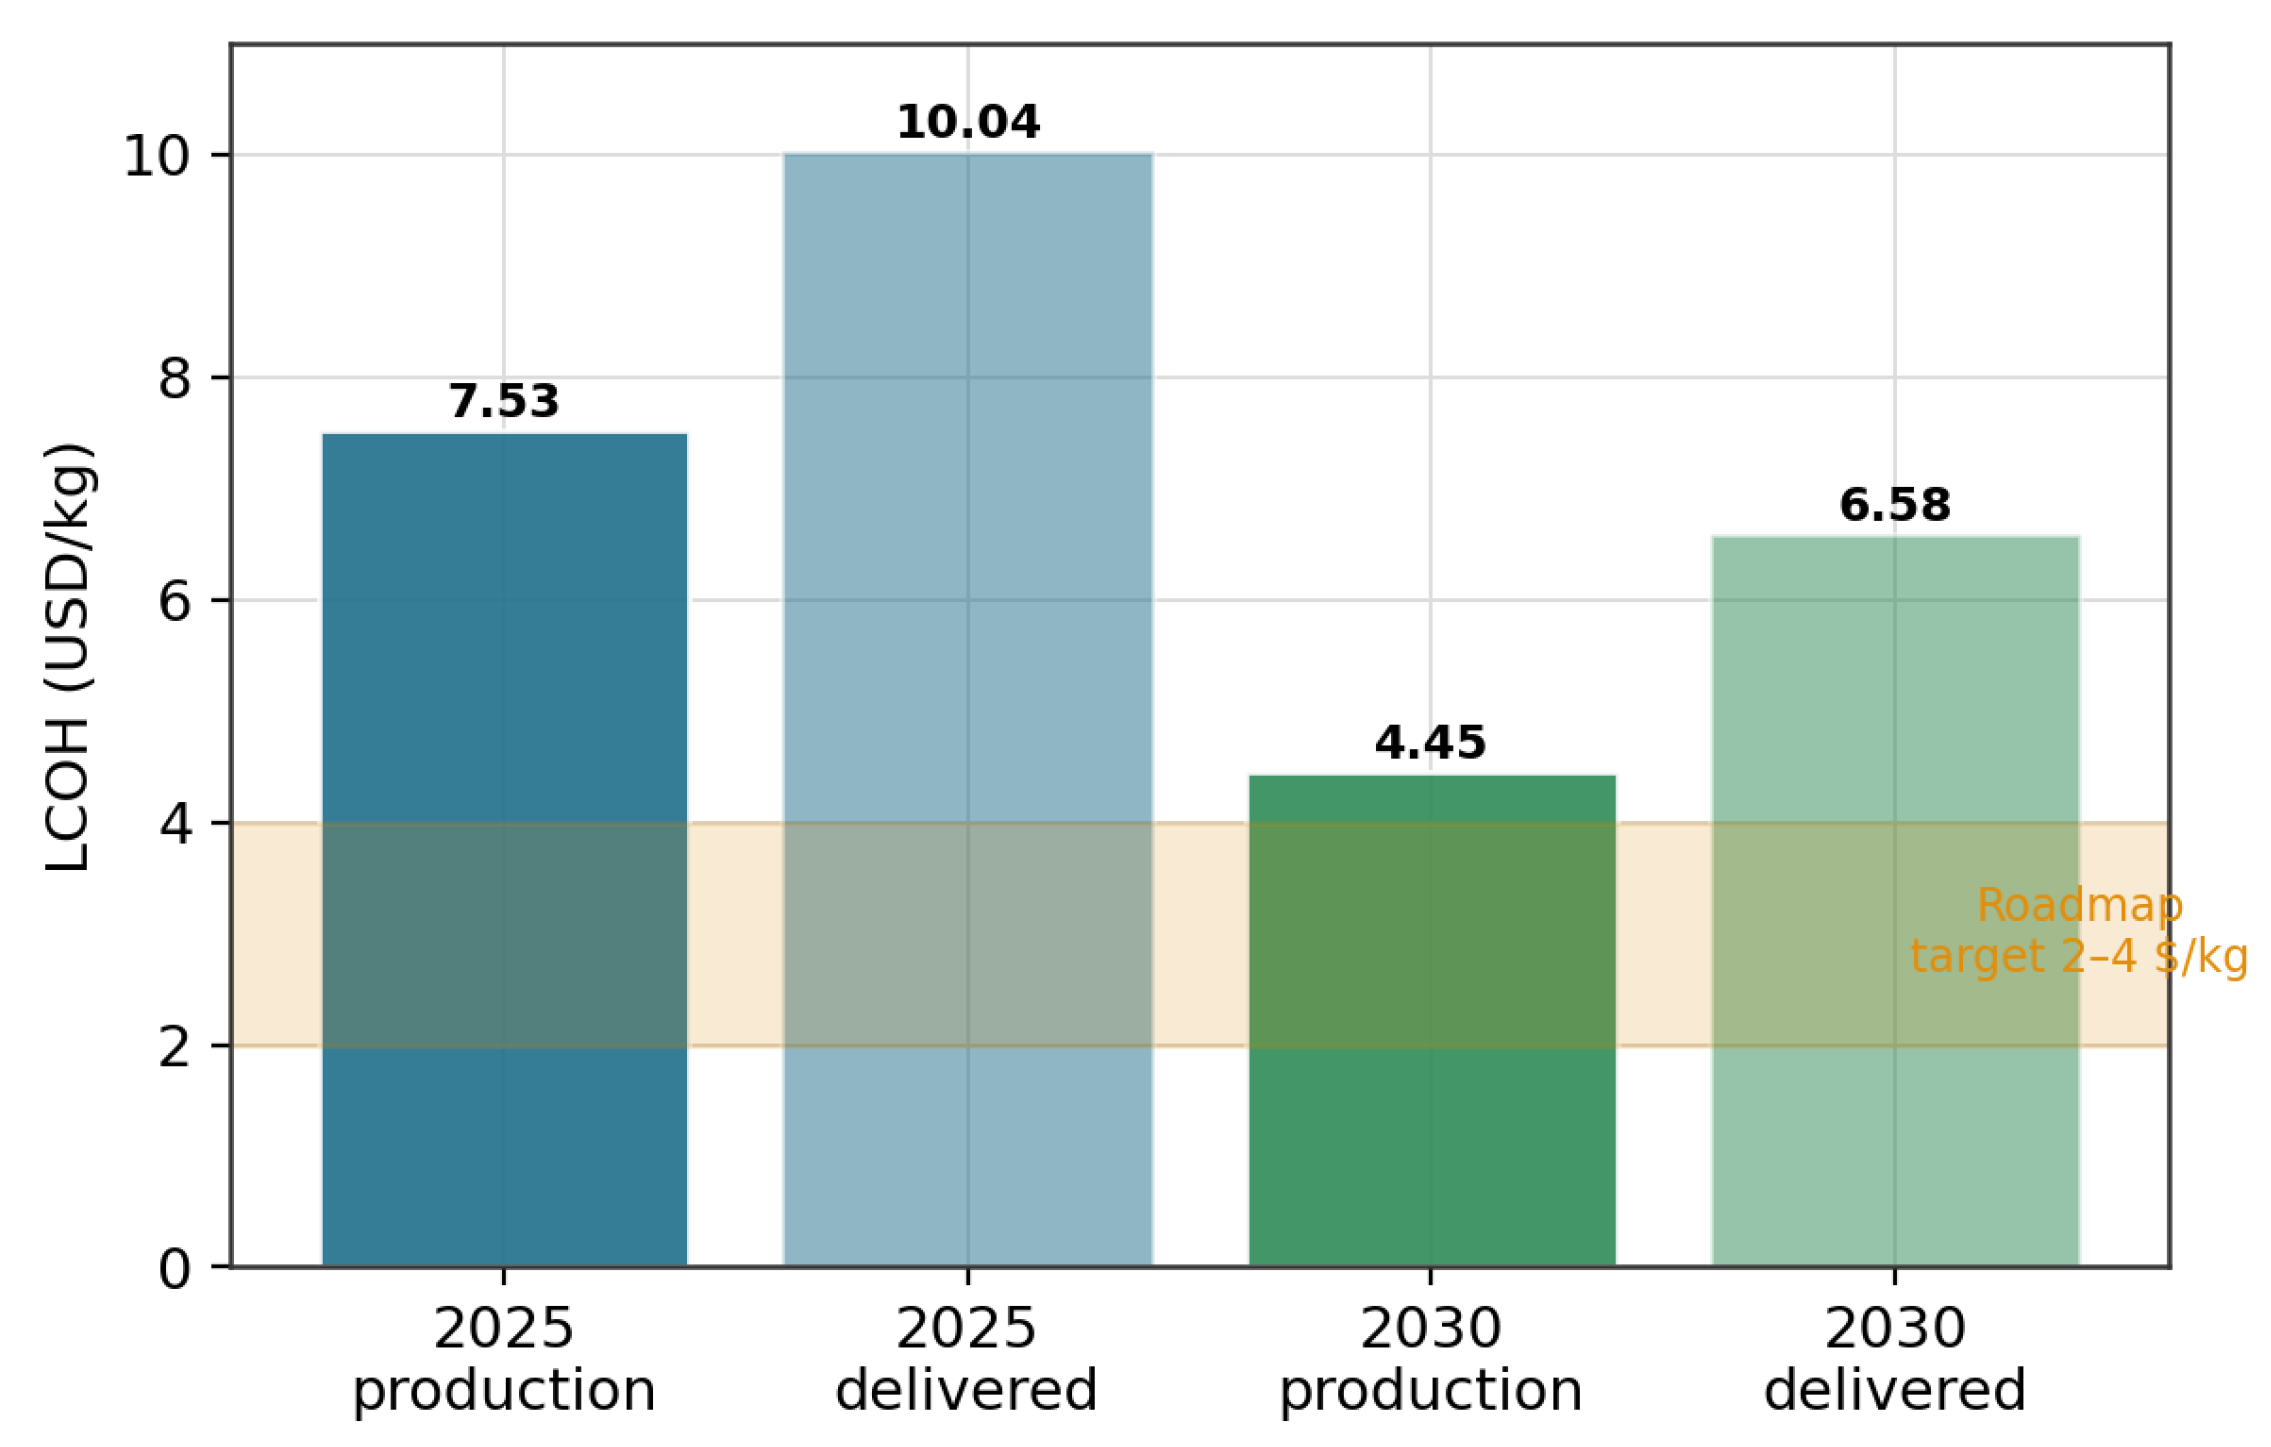
Table 1.
CMEMS-derived monthly climatology for the Dakhla domain (22° W–13° W, 21° N–26° N), from the resource study [33]. Ranges span the monthly-mean values across the record.
Table 1.
CMEMS-derived monthly climatology for the Dakhla domain (22° W–13° W, 21° N–26° N), from the resource study [33]. Ranges span the monthly-mean values across the record.
| Variable | CMEMS product | Period | Monthly-mean range | Typical monthly max |
|---|---|---|---|---|
| Surface wind speed | WIND_GLO L4 [32] | 2007–2016 | 4.9–9.7 m/s | 10.5–10.8 m/s |
| Geostrophic surface current | GLOBAL_REP_021 [31] | 2002–2014 | 0.06–0.11 m/s | 0.30–0.45 m/s |
| Sea-surface temperature | GLOBAL_REP_021 [31] | 2002–2014 | 19–24 °C | 26–27 °C |
Table 2.
Principal technical and economic assumptions. Base-case values are used unless stated; ranges define the sensitivity bounds; the final column gives the 2030 learning-scenario values.
Table 2.
Principal technical and economic assumptions. Base-case values are used unless stated; ranges define the sensitivity bounds; the final column gives the 2030 learning-scenario values.
| Parameter | Base (range) | 2030 value | Source |
|---|---|---|---|
| Offshore wind CapEx | 2.5 (1.0–3.0) M$/MW | 1.8 M$/MW | IRENA [26] |
| Tidal turbine CapEx | 4.0 (2.0–5.0) M$/MW | 3.2 M$/MW | EMEC / Carbon Trust |
| PEM electrolyser CapEx | 800 (500–1,500) $/kW | 350 $/kW | IEA [25] |
| Project lifetime | 25 years | 25 years | Standard offshore |
| WACC | 7 % (5–8 %) | 5 % | Morocco risk profile [25] |
| Annual O&M | 3 % (2–4 %) of CapEx | 3 % | Literature |
| SEC (electrolysis) | 50 (45–55) kWh/kg | 45 kWh/kg | IEA [25]; Carmo [22] |
| Water consumption | 12 (9–15) L/kg H₂ | 12 L/kg | IRENA [26] |
| RO desalination cost | 1.0 (0.5–1.5) $/m³ | 1.0 $/m³ | Industry |
| LH₂ boil-off rate | 0.3 (0.2–1.0) %/day | 0.3 %/day | Literature [24] |
| Export distance | 1,241 km | 1,241 km | Roadmap [3] |
Table 4.
Base-case capital-cost breakdown.
| Cost . | Value (M$) | Share (%) |
|---|---|---|
| Offshore wind array | 1,275 | 53.3 |
| Tidal array | 200 | 8.4 |
| PEM electrolyser | 280 | 11.7 |
| Liquefaction plant | 320 | 13.4 |
| Balance of plant / grid / port | 316 | 13.2 |
| Total CapEx | 2,391 | 100.0 |
Table 5.
LCOH by scenario against the national roadmap target.
| Scenario | Production LCOH | Delivered LCOH | Annual H₂ |
|---|---|---|---|
| 2025 base case | 7.53 $/kg | 10.04 $/kg | 36,781 t/yr |
| 2030 learning curve | 4.45 $/kg | 6.58 $/kg | 40,868 t/yr |
| Roadmap target [3] | 2–4 $/kg | — | — |
Disclaimer/Publisher’s Note: The statements, opinions and data contained in all publications are solely those of the individual author(s) and contributor(s) and not of MDPI and/or the editor(s). MDPI and/or the editor(s) disclaim responsibility for any injury to people or property resulting from any ideas, methods, instructions or products referred to in the content. |
© 2026 by the authors. Licensee MDPI, Basel, Switzerland. This article is an open access article distributed under the terms and conditions of the Creative Commons Attribution (CC BY) license (http://creativecommons.org/licenses/by/4.0/).
Copyright: This open access article is published under a Creative Commons CC BY 4.0 license, which permit the free download, distribution, and reuse, provided that the author and preprint are cited in any reuse.


