

Submitted:
04 July 2026
Posted:
13 July 2026
You are already at the latest version
Abstract
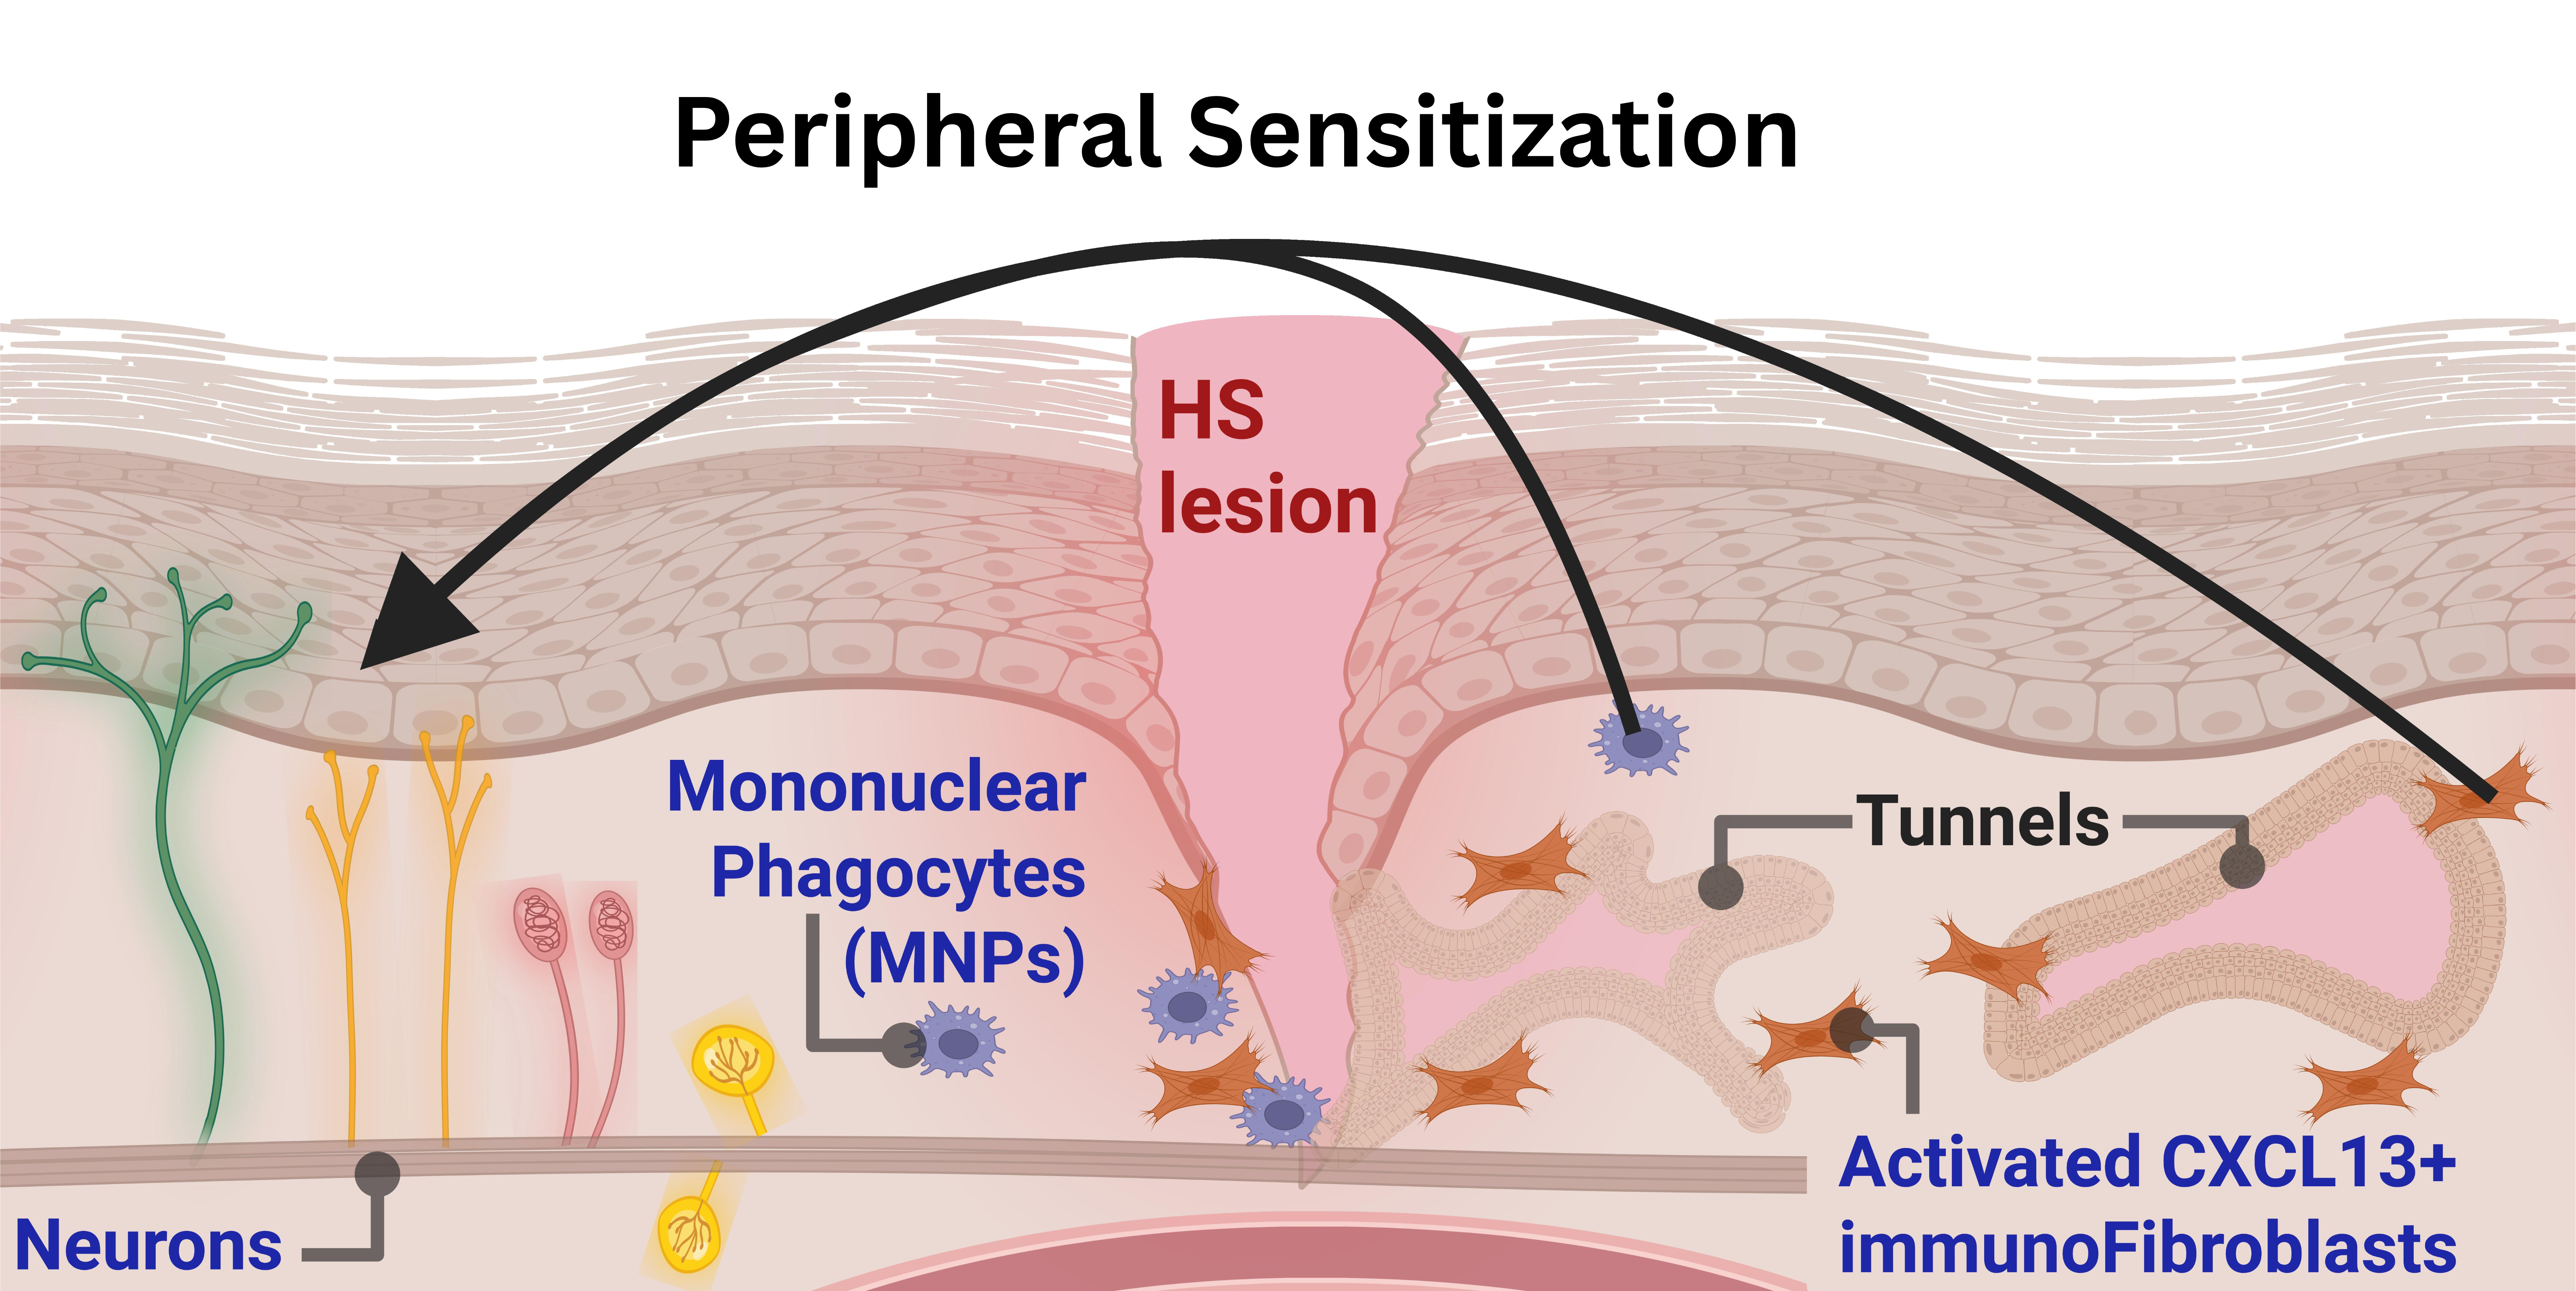
Pain is a key symptom in hidradenitis suppurativa (HS) and up to one-third of patients use cannabis. Despite this clinical signal, the endocannabinoid system (ECS) and molecular nociceptive networks remain essentially uncharacterized. Transcriptomic comparisons between HS patients and healthy controls were conducted utilizing bulk RNA-seq (blood and skin) alongside cutaneous scRNA-seq. A curated 134-gene panel mapped the peripheral nociceptive network, encompassing neurotrophic and immune signaling, extracellular matrix remodeling, and bioactive lipid mediators. Compared with healthy controls, bulk transcriptomic profiling of HS patients revealed nine ECS-related genes differentially expressed in lesional skin and eight in the blood. Additionally, seven distinct bioactive lipid mediator genes were dysregulated within HS lesions, suggesting a lesion-level shift in prostaglandin, thromboxane, and leukotriene biosynthesis. At single-cell resolution, of the five major cell populations analyzed, keratinocytes and T cells played a relatively minor role in the broader pain signature. In contrast, mononuclear phagocytes (MNPs) and fibroblasts emerged as central cellular amplifiers of peripheral nociception. MNPs significantly dysregulated 48 panel genes, including the biosynthetic machinery for nociceptive lipid mediators across the endocannabinoid, prostaglandin, leukotriene, and thromboxane axes. Moreover, MNPs amplify pain networks by inducing pronociceptive chemokines, cytokines, alarmins, neuropeptides, mechanotransducers, and matrix-remodeling proteases, a shift potentiated by substantial hypoxic and oxidative adaptations. Fibroblasts exhibited a broad transcriptomic shift altering 46 pain-network genes, dysregulating matrix-remodeling, inflammatory, and lipid mediator pathways. Critically, the alteration of neurotrophic factors, plasminogen activators, and axon guidance molecules suggest a permissive environment for disorganized hyperinnervation. Furthermore, the sensory ion channel TRPA1 emerged as a significantly upregulated stromal sensor, with this entire nociceptive signature correlating with CXCL13-positive immunofibroblasts. Additionally, leveraging the high B cell density in HS lesions enabled a novel intratissue trajectory analysis, revealing constitutive lipid mediator expression without significant transcriptomic shifts across memory, plasmablast, and plasma cell maturation stages. Finally, in silico intersection of this pathogenic profile with the druggable proteome identified precision therapeutic candidates, encompassing targetable GPCRs, FDA-approved monoclonal antibodies against inflammatory nodes, and experimental sphingolipid and leukotriene cascade inhibitors. Collectively, this study establishes the first systematic transcriptomic map of the peripheral nociceptive network and endocannabinoidome in hidradenitis suppurativa, providing both a mechanistic framework for disease-associated nociception and a biological rationale for targeted therapeutic intervention.
Keywords:
hidradenitis suppurativa
; single-cell transcriptomics
; endocannabinoid system
; bioactive lipid mediators
; neuroimmune crosstalk
; fibroblast activation
; mononuclear phagocytes
; nociception
1. Introduction
A defining hallmark of hidradenitis suppurativa (HS) is debilitating pain (Montero-Vilchez et al. 2021; Ring et al. 2016; Szepietowska et al. 2026). This pain encompasses nociceptive, inflammatory, and neuropathic components (Scholz and Woolf 2002; Montero-Vilchez et al. 2021). However, patient surveys indicate that up to 75.9% of HS patients report never receiving formal pain management recommendations from their healthcare providers (Fernandez et al. 2022). This clinical gap in patient guidance is particularly notable given that current European guidelines explicitly define the relief of pain as a primary objective of treating hidradenitis suppurativa, a challenge further compounded by the fact that no randomized controlled trials evaluating analgesic therapies for the disease have been published to date (Zouboulis et al. 2025). In parallel, patients attempt to manage symptoms with over-the-counter medications, and as disease severity progresses, reliance on cannabis for pain management increases (Metko et al. 2024; Huang et al. 2025). The prevalence of cannabis use among HS patients is 34.0%, approximately three-fold higher than the 12% reported in psoriasis (Lesort et al. 2019). Interestingly smoking cannabis and also cannabis edibles receive the highest effectiveness ratings for pain management among HS patients, matching the perceived relief provided by opioids (Fernandez et al. 2022). Alongside this high prevalence of cannabis use, epidemiological data demonstrates significantly elevated rates of clinical substance use disorders in this population. Specifically, a US population-based analysis of 32,625 HS patients revealed a cannabis use disorder prevalence of 1.2% compared to 0.4% in disease-free controls (Garg et al. 2018).
The cutaneous endocannabinoid system (ECS) participates in tissue homeostasis, keratinocyte differentiation, immune cell proliferation, and neuroimmune signaling (Tóth et al. 2019; Martins et al. 2022; Río et al. 2018). The patient-reported effectiveness of cannabinoids for HS pain management may therefore be rooted in the distribution and pleiotropic function of this system within the cutaneous microenvironment. The ECS is a lipid-mediated signaling network in which cells synthesize endocannabinoids (ECs) de novo from membrane diacylglycerol and N-acyl-phosphatidylethanolamine precursors. It is classically defined by the ligands anandamide (AEA) and 2-arachidonoylglycerol (2-AG), their rate-limiting hydrolytic enzymes FAAH and MAGL, and the cannabinoid receptors CB1 and CB2. To regulate localized lipid signaling, this system relies on several key enzymes. NAPE-PLD synthesizes AEA, which is subsequently hydrolyzed by FAAH, whereas DAGL synthesizes 2-AG, which is hydrolyzed by MAGL, ABHD6/12, and CES1/2 (Tóth et al. 2019). This classical ECS system operates within a broader interconnected network, collectively termed the endocannabinoidome (Tóth et al. 2019). This expanded lipid signaling network incorporates a broader array of related bioactive lipids, such as alternative N-acylethanolamines and monoacylglycerols, alongside the atypical G-protein-coupled receptors GPR18, GPR55, and GPR119, the nuclear receptors PPAR-α, PPAR-β, and PPAR-γ, and a set of sensory ion channels including several members of the transient receptor potential (TRP) family (TRPV1-4, TRPA1, TRPM8) (Tóth et al. 2019; Iannotti and Di Marzo 2025).
Despite the central role of this pain burden in patient morbidity, the involvement of the cutaneous endocannabinoid system and the cellular and molecular basis of HS-associated pain have not been characterized in detail. Only two published studies have systematically addressed pain at a molecular dimension directly. Importantly for the context of ECS, one of these nociception-focused studies also harbors the limited targeted data available regarding EC dysregulation in HS. Investigating the localized lesional microenvironment, Kashyap et al. (2026) reported significant reductions of endocannabinoid-related metabolites, specifically N-palmitoyl serine, N-stearoyl serine, and N-oleoyl serine, in HS skin (Kashyap et al. 2026). Alongside these lipidomic shifts, this same study identified nociceptive epigenetic changes, demonstrating increased chromatin accessibility at the gene loci for the sensory ion channels TRPV1, TRPV2, and TRPV4 in HS epithelial cells (Kashyap et al. 2026). Furthermore, they established a functional link between localized metabolism and nociception, demonstrating that the disease-associated accumulation of the polyamine cadaverine directly induces the mRNA expression of pain-sensing genes, such as PTGS2, in keratinocytes and may sensitize peripheral afferent nerve terminals (Kashyap et al. 2026). The second study utilized peripheral blood DNA methylome analysis to identify systemic epigenetic alterations, specifically detailing 253 differentially methylated CpG sites annotated to genes with established roles in nociception (Radhakrishna et al. 2025). This included methylation variations in dopamine and serotonin pathway genes, TRP channels, and the endocannabinoid hydrolase FAAH (Radhakrishna et al. 2025).
To address these gaps in both the ECS and the molecular mechanisms of pain in HS, we integrated four publicly available transcriptomic resources. First, to establish an independent map of how ECS genes are expressed across distinct cell populations in healthy human skin and blood, we utilized the Tabula Sapiens reference atlases (The Tabula Sapiens Consortium et al. 2022). HS-associated transcriptional shifts at the whole-tissue level were evaluated using bulk RNA-seq of paired lesional skin and whole blood samples from 22 HS patients and 10 healthy donors (GSE154773) (Gudjonsson et al. 2020). At single-cell resolution, the keratinocyte, T cell, mononuclear phagocyte, and B cell compartments were isolated and interrogated using a scRNA-seq atlas from HS, psoriatic, and healthy donor skin (GSE220116) (J. Kim et al. 2023). For the fibroblast compartment specifically, two independent scRNA-seq cohorts (GSE154775 (Gudjonsson et al. 2020) and GSE173706 (Merleev et al. 2022) were integrated.
To systematically analyze these datasets, we assembled a curated 134-gene panel covering specific enzyme groups that are involved in the physiology of pain through various mechanisms. Specifically, the panel encompasses genes associated with extracellular matrix remodeling, hypoxia and acidosis, reactive oxygen and nitrogen species, cytokines and chemokines, alarmins and damage-associated molecular patterns, mechanotransducers, cytotoxic proteases, neurotrophic factors, axon guidance molecules, neuropeptides, and bioactive lipid networks (including the endocannabinoidome, prostanoids, and leukotrienes), as well as sphingosine-1-phosphate (S1P) and autotaxin.
At the bulk transcriptomic level, lipid signaling networks were analyzed in both skin and whole blood. Applying this framework, we demonstrate that the endocannabinoid system is broadly dysregulated in HS. Specifically, nine ECS-related genes are differentially expressed in HS lesions compared to healthy skin, while eight are altered in whole blood. Furthermore, among other genes related to bioactive lipid signaling, seven are dysregulated in the skin and two in the blood.
At single-cell resolution, we evaluated the full 134-gene panel built to probe peripheral pain perception in HS lesions compared to healthy donor skin. Fibroblasts undergo a substantial pro-nociceptive shift (46 genes significantly altered, 37 upregulated) characterized by the acquisition of a potential TRPA1-mediated sensory-nociceptive state. Applying the HS fibroblast classification system described by van Straalen et al. (2024), we demonstrate that subtype-resolved correlation analysis identifies the CXCL13-positive immunofibroblast (rather than the SFRP4-positive myofibroblast or the Hippo pathway target program) as the population whose activation most strongly covaries with nociceptive gene expression at the patient level. Alongside fibroblasts, mononuclear phagocytes emerged as major cellular amplifiers of peripheral nociception (48 genes significantly altered, 42 upregulated). Specifically, these cells function as key modulators of nociceptive lipid signaling through the broad transcriptomic activation of the prostaglandin, leukotriene, and thromboxane biosynthetic cascades. Keratinocytes show a comparatively modest response, with 10 genes significantly altered (6 upregulated and 4 downregulated). T cells express a strong IL17A/F cytokine transcript signal, with a total of 5 panel genes upregulated and 15 suppressed. Because healthy skin lacks sufficient B cell infiltration to establish a baseline, the B cell compartment could not be compared between healthy and HS tissue. Instead, the B cell maturation trajectory (progressing from memory B cells to plasmablasts and plasma cells) was analyzed exclusively within HS lesions.
Together, these analyses provide the first compartment-resolved transcriptional map of the endocannabinoidome and the broader nociceptive network in HS lesions. To explore the translational potential of this architectural map, we intersected the pathogenic fibroblast signature with the FDA-approved druggable proteome and the Drug-Gene Interaction Database. This unbiased in silico pharmacological screen nominates precision therapeutic candidates across distinct mechanistic classes: repurposable small-molecule inhibitors targeting fibroblast-selective lipid mediator enzymes (such as SPHK1, ALOX5AP, and PTGES) and monoclonal antibodies directed against upregulated fibroblast surface and cytokine targets (including IL-1β, IL-6, C5AR1, and MME). Ultimately, this silico framework provides a computational rationale for precision analgesia in hidradenitis suppurativa by systematically linking FDA-approved and experimental therapeutics directly to these dysregulated nociceptive cascades, while establishing a translational methodology applicable to other complex symptoms and inflammatory dermatoses.
2. Results
2.1. The Endocannabinoid System in Circulating and Cutaneous Cells
To establish the homeostatic baseline of the endocannabinoid system across compartments, we evaluated the expression of 18 canonical and atypical pathway genes in human blood and skin using the Tabula Sapiens reference atlases (Figure 1). Following power gating, the analysis retained 13 circulating and 14 cutaneous cell populations. The resulting transcriptional architecture demonstrated high compartmentalization, with distinct regulatory, metabolic, and receptor profiles segregating by cell lineage and tissue origin.
2.2. Compartmentalization of Endocannabinoid System Genes in Healthy Skin
Pseudobulk evaluation of the cutaneous microenvironment highlights the distribution of endocannabinoid system transcripts across the five master lineages (T-Lymphocyte, Myeloid and Antigen-Presenting, Granulocyte, Stroma and Vasculature, and Epithelial and Barrier), representing 17,546 cells across 14 cell types. Aggregating pseudobulk transcripts across these lineages and ranking each gene by its contribution to the cutaneous immune transcriptional pool, the burden was dominated by the metabolic and nuclear receptor machinery (Figure 2a).
Comparing each receptor gene's immune contribution against its total skin transcript burden distributed the panel along a spectrum from immune to structural in origin (Figure 2b). Three genes carried near-exclusively immune transcripts: GPR55 (97.17% immune) and GPR18 (89.87%). A second group was predominantly immune-derived in the 66-75% range: CNR2 (71.50%) and PPARD (69.28%). CNR1 (7.23%) carried the majority of their transcripts in structural cell types. Broad lineage distribution refined this picture (Figure 2c). MGLL split nearly equally between the stromal and vasculature (43.69%) and myeloid and antigen-presenting (43.00%) compartments. CNR1 was concentrated in the stromal and vasculature lineage (79.88%). GPR55 was the most T-lymphocyte-concentrated gene of the panel (66.17%), and NAPEPLD the most epithelial-concentrated (61.24%).
The dual-metric butterfly plot in Figure 2d resolves the canonical receptors CNR1 and CNR2 against both their cell-type transcript contribution and their per-cell-type detection frequency, showing that CNR1 transcripts originate from a small number of structural cell types at moderate detection frequency, whereas CNR2 transcripts distribute across multiple immune lineages but at uniformly low detection. Figure 2e applies the same dual-metric view to the atypical receptors GPR55 and GPR18 and shows that GPR55 is carried disproportionately by regulatory T cells, while GPR18 distributes more evenly across immune lineages with low detection in each.
2.3. Bulk Transcriptome Shifts in Endocannabinoid and Lipid Mediator System in HS Lesions and Matched Whole Blood
Bulk transcriptomic profiling of HS lesional skin against healthy donor skin showed broad reorganization of both the endocannabinoid and lipid mediator panels (Figure 3a). In lesional skin, nine of the 18 endocannabinoid panel genes reached significance. The cannabinoid receptor CNR2 was elevated 16.5-fold, the atypical receptor GPR18 6.95-fold, and the atypical receptor GPR55 4.81-fold. The sensory ion channel TRPA1 was elevated 2.18-fold, and the cannabinoid receptor CNR1 1.60-fold. The nuclear receptors PPARG and PPARA were suppressed 3.80-fold and 2.17-fold respectively. Among the endocannabinoid hydrolases, ABHD6 was reduced 1.82-fold and FAAH 1.57-fold. PPARD, DAGLA, DAGLB, ABHD12, MGLL, NAPEPLD, TRPV1, CES1, and CES2 did not reach significance.
In matched whole blood from the same cohort, eight endocannabinoid panel genes reached significance, with effect sizes uniformly compressed relative to skin (Figure 3b). The endocannabinoid hydrolases FAAH, MGLL, and ABHD6 were reduced 1.67-, 1.44-, and 1.18-fold respectively, and the 2-AG biosynthetic enzyme DAGLA was reduced 1.25-fold. The receptors CNR2, GPR55, GPR18, and the nuclear receptor PPARD were elevated between 1.10- and 1.22-fold. The five endocannabinoid genes significant in both compartments, CNR2, GPR55, GPR18, FAAH, and ABHD6, moved in the same direction in skin and blood, suggesting a coupled circulating signature at lower amplitude.
In the HS lesion, the 15-gene lipid mediator panel showed changes in leukotriene, thromboxane and prostaglandin axes (Figure 3c). The thromboxane synthase TBXAS1 was elevated 3.00-fold, the 5-lipoxygenase ALOX5 2.66-fold, the lysophosphatidic acid biosynthetic enzyme ENPP2 (autotaxin) 2.16-fold, the ALOX5-activating co-factor ALOX5AP 1.83-fold, and the leukotriene A4 hydrolase LTA4H 1.64-fold. Within the prostaglandin synthesis arm, the cyclooxygenase PTGS2 was reduced 1.99-fold, while the prostaglandin E synthase PTGES was elevated 1.40-fold. PTGS1, PTGES2, PTGES3, PTGIS, PTGDS, ALOX15, LTC4S, and the sphingosine kinase SPHK1 did not reach significance.
In matched whole blood, the prostaglandin synthases PTGDS and PTGES were reduced to 1.46-fold and 1.08-fold respectively (Figure 3d). PTGES therefore trended in opposite directions in blood compared to skin, while maintaining significance in both compartments.
2.4. Mononuclear Phagocytes Orchestrate Endocannabinoid and Lipid Mediator Dysregulation in Hidradenitis Suppurativa Lesions
To map the transcriptomic shifts of the cutaneous pain network in hidradenitis suppurativa at single-cell resolution, gene expression from the neuro-immune and matrix remodeling groups (101 genes from the 134-gene panel) was analyzed across three cutaneous compartments: keratinocytes, T cells, and mononuclear phagocytes. The spatial distribution of each lineage across the global atlas is shown in Figure 4a, c, and e.
The keratinocyte compartment (Figure 4b) showed 8 significantly regulated targets within the neuro-immune and matrix remodeling networks in hidradenitis suppurativa relative to healthy skin. The dominant signal was a chemokine and matrix activation program: CCL18 and CCL3 were elevated 26-fold and 18-fold respectively, accompanied by induction of the matrix regulators FN1 (9-fold) and TGFB1 (7-fold) and the protease MMP1 (6-fold). Against this activation, two pain-relevant cytokines were suppressed at approximately 4-fold magnitude: the pruritogenic TSLP and the pronociceptive TNF (both Q < 0.05). The EMT regulator SNAI2 was suppressed at similar magnitude (4-fold, Q < 0.05). The psoriasis-versus-healthy comparison yielded a different signature concentrated on alarmins, hypoxia, and barrier remodeling. CCL3, the alarmins S100A8, IL36G, and S100A9, the hypoxia markers VEGFA and SLC2A1, and TGFB1 were all elevated (2- to 16-fold, Q < 0.05). Suppressed in psoriasis were POSTN (84-fold), the alarmin IL33 (10-fold), the matrix gene SLC39A14 (5-fold), SNAI2 (3-fold), and the mechanotransducer PIEZO1 (2-fold).
The T cell compartment (Figure 4d) showed 11 significantly regulated targets within the neuro-immune and matrix remodeling networks in hidradenitis suppurativa relative to healthy skin. The disease-defining signal was a focused induction of the IL-17 axis, with IL17F elevated 208-fold and IL17A 60-fold (both Q < 0.001). All other elevated transcripts were small-magnitude: LDHB 1.4-fold and HMGB1 1.2-fold (both Q < 0.05). The remainder of the signature was suppressive: the alarmin IL18 fell 15-fold (Q < 0.001), the kallikreins KLK5 and KLK7 fell 10-fold and 7-fold, the neurotrophic factor MDK fell 8-fold, the cytokine OSM fell 4-fold, the matrix regulator TGFB1 fell 1.6-fold, and the lactate dehydrogenase LDHA fell 1.4-fold (all Q < 0.05). The psoriasis-versus-healthy comparison in T cells was minimal and identified 4 significantly regulated targets: OSM and TIMP1 were reduced (4-fold and 1.6-fold), HMGB1 was reduced 1.2-fold, and LDHB was elevated 1.5-fold (all Q < 0.05). The hidradenitis-versus-psoriasis contrast separated the two diseases on 16 panel genes. Higher in hidradenitis suppurativa were the IL17 ligands IL17F (30-fold) and IL17A (5-fold), the nociceptive sensitizer IL1B (29-fold), the chemokine CCL18 (4-fold), the matrix regulator COL3A1 (17-fold), and HMGB1 (1.5-fold). Higher in psoriasis were the alarmin IL36G (28-fold), the chemokine CX3CL1 (9-fold), the alarmins S100A8 (8-fold) and S100A9 (3-fold), the neuropeptide precursor VGF (8-fold), IL18 (5-fold), the kallikreins KLK5 and KLK7 (4-fold each), and the matrix and metabolic regulators TYMP and TGFB1 (1.6- to 1.8-fold; all contrasts Q < 0.05).
The mononuclear phagocyte compartment (Figure 4f) showed the largest pro-nociceptive transcriptional shift of the three cell lineages analysed, with 35 significantly regulated targets within the neuro-immune and matrix remodeling networks in hidradenitis suppurativa relative to healthy skin. A coordinated chemokine, alarmin, and matrix activation program dominated this compartment. The chemokine and cytokine output was led by CCL18 (826-fold), CCL2 (51-fold), CCL3 (29-fold), CCL4 (23-fold), and IL6 (21-fold), with secondary induction of CXCL1 (14-fold), OSM (10-fold), CXCL8 (5-fold), and the endothelin EDN1 (3-fold). The alarmin program was uniformly elevated, with IL1B and IL1A induced 45-fold and 23-fold, the complement alarmin C3 elevated 21-fold, S100A9 elevated 4-fold, and HMGB1 elevated 1.5-fold. The hypoxia and acidosis axis showed CA12 elevated 109-fold and VEGFA 12-fold, against suppression of the lactate dehydrogenase LDHA (1.8-fold). The phagocyte NADPH oxidase catalytic subunit CYBB was elevated 21-fold, identifying mononuclear phagocytes as a major oxidative stress source in the lesion. The matrix remodeling program was broad: MMP1 was induced 113-fold, WNT5A 43-fold, MMP2 30-fold, MMP3 21-fold, the fibrillar collagen COL3A1 20-fold, FN1 17-fold, MMP9 14-fold, THBS1 14-fold, and TIMP1 6-fold, with smaller increases in COL1A2 and TGFB1 (4-fold each). The thymidine phosphorylase TYMP was the only matrix gene suppressed (1.9-fold). The ion channel TRPV4 was induced 16-fold. The cathepsin CTSS was elevated 6-fold and the plasminogen activator PLAU 4-fold, while the kallikreins KLK5 and KLK7 were suppressed 9-fold and 7-fold respectively.
The psoriasis-versus-healthy contrast in mononuclear phagocytes isolated 10 significantly regulated targets, all elevated: CCL18 (97-fold), MMP1 (37-fold), THBS1 (19-fold), CCL2 (11-fold), CYBB (6-fold), the alarmins S100A8 and S100A9 (5- and 3-fold), the cytotoxic effector GNLY (5-fold), LDHB (3-fold), and TGFB1 (3-fold; all Q < 0.05). The hidradenitis-versus-psoriasis contrast in mononuclear phagocytes was the most extensive of any inter-disease comparison in the panel, separating the two conditions on 25 neuro-immune and matrix remodeling genes (Figure 4g, h). Higher in hidradenitis suppurativa were a coordinated nociceptive cytokine block (IL1B 31-fold, IL6 28-fold, IL1A 18-fold), the hypoxia and complement axis (CA12 24-fold, C3 11-fold, VEGFA 4-fold), the chemokine network (CXCL1 19-fold, CCL3 15-fold, CCL4 14-fold, CXCL8 9-fold, CCL18 9-fold), a matrix activation block led by COL3A1 (33-fold), FN1 (19-fold), WNT5A (17-fold), MMP2 (11-fold), COL1A1 (8-fold), and TIMP1 (4-fold), the ion channel TRPV4 (7-fold), the endothelin EDN1 (4-fold), the oxidative generator CYBB (4-fold), the cathepsin CTSS (3-fold), the plasminogen activator PLAU (2-fold), and HMGB1 (1.7-fold). Higher in psoriasis were only the cytotoxic effector GNLY (5-fold) and the thymidine phosphorylase TYMP (1.7-fold).
2.5. Mononuclear Phagocytes Lineages Mediates an Lipid Mediator and Endocannabinoid Response in Hidradenitis Suppurativa
To identify the cutaneous cell populations driving inflammatory lipid signaling in hidradenitis suppurativa, differential expression of a targeted 33-gene lipid mediator panel was evaluated across the keratinocyte, T cell, mononuclear phagocyte compartments and B cells (Figure 5a). The keratinocyte compartment showed two significantly regulated lipid targets in HS relative to healthy skin: CES2 was elevated 3.4-fold and ABHD12 was reduced to 2.1-fold. The T cell compartment showed six significantly regulated targets, all suppressed: PTGDS fell 33.9-fold, SPHK1 4.2-fold, CNR2 3.2-fold, MGLL 3.2-fold, GPR55 3.1-fold, and PPARD 1.8-fold. Two additional lipid panel transcripts (NAPEPLD up, ALOX5AP down) reached significance under the panel-restricted model used for Figure 4 but did not retain significance under the genome-wide model used for the Figure 5 volcanoes (NAPEPLD padj 0.053, ALOX5AP padj 0.051). PTGIS reached significance under the panel-restricted model but was filtered from the genome-wide FDR adjustment by PyDESeq2.
The mononuclear phagocyte compartment showed the largest transcriptional shift of the three, with 13 significantly regulated lipid targets in hidradenitis suppurativa relative to healthy skin. The cyclooxygenase and prostaglandin E synthase axis was elevated: PTGS2 (also known as COX-2) was increased 60-fold and PTGES 18.8-fold. The leukotriene synthesis axis was elevated across its entire cascade, with ALOX5 up 3.9-fold, ALOX5AP up 3.5-fold, and LTA4H up 3.1-fold. The thromboxane synthase TBXAS1 was elevated 7.0-fold. The endocannabinoid hydrolases CES1 and CES2 were elevated 10.1-fold and 4.1-fold respectively. The nuclear receptors PPARG and PPARA were elevated 3.8-fold and 2.1-fold, and the sphingosine kinase SPHK1 was elevated 2.6-fold. Reduced transcripts were limited to two targets: the alternative prostaglandin E synthase PTGES2 (2.0-fold down, Q < 0.001) and the atypical receptor GPR55 (6.4-fold down, Q < 0.05). All 13 MNP lipid targets retained significance under both the panel-restricted model used for Figure 4 and the genome-wide model used for the Figure 5 volcanoes.
Whether B lymphocyte humoral maturation within the HS lesion contributes to this lipid signaling output was then evaluated. Direct disease-state differential expression in the B cell compartment was not feasible: both the healthy control and psoriatic skin cohorts contained too few B cells to support statistical power. The analysis was therefore restricted to the internal maturation trajectory within hidradenitis suppurativa-derived B cells, where cellular density was sufficient to compare memory B cells (n = 7 patients), plasmablasts (n = 6 patients), and plasma cells (n = 8 patients) (Figure 5b, c). Pseudobulk differential expression testing across the 33 lipid panel genes yielded no statistically significant alterations between sequential maturation states (plasmablast versus memory B cell, plasma versus plasmablast; all Q values at or near 1.0) (Figure 5d). The prostaglandin E synthase PTGES3 was the most strongly expressed lipid panel gene, found in 72 to 77% of cells across the trajectory. The leukotriene synthesis axis was similarly constitutive, with ALOX5AP expressed in 28 to 35% of cells, LTA4H in 28 to 33%, and ALOX5 in 21 to 24%. The cannabinoid receptor CNR2 (11 to 16%) and the atypical receptor GPR18 (9 to 11%) were detected at modest penetrance.
2.6. Hidradenitis Suppurativa Fibroblasts Exhibit a Synchronized Inflammatory and Nociceptive Transcriptomic Shift
To characterize the fibroblast transcriptome in the hidradenitis suppurativa lesional microenvironment, the stromal continuum was extracted from the global cutaneous atlas and pooled into a unified fibroblast compartment, segregated from pericyte, smooth muscle, and endothelial lineages. A total of 2,546 purified fibroblasts were isolated across 7 hidradenitis suppurativa patients and 7 healthy controls, with spatial distribution shown in Figure 6a. Patient-level pseudobulk differential expression testing against healthy controls returned 46 significantly regulated targets within the full 134-gene pain panel, overlaid on the genome-wide transcriptome volcano in Figure 6b.
To determine which fibroblast subtype was most strongly associated with the nociceptive transcriptional program, three transcriptomically defined fibroblast subtype modules were scored in parallel and correlated against a data-driven pain module, guided by the canonical marker expression profiles of these subtypes (Figure 6c). The subtype modules and their specific gene sets were derived directly from the top marker panels identified by van Straalen and colleagues (2024). These modules included the CXCL13-positive immunofibroblast module (CXCL13, MMP1, MMP3), the SFRP2-positive fibroblast module (SFRP2, APCDD1, ID1), and the SFRP4-positive myofibroblast module (SFRP4, PLA2G2A, ASPN). The nociceptive pain module was constructed from the significantly upregulated neuro-immune and lipid mediator targets identified in the hidradenitis suppurativa fibroblast compartment. To strictly prevent circular inference, the analysis utilized symmetric overlap exclusion; any gene shared between a specific subtype module and the nociceptive pain module was programmatically removed from both lists prior to single-cell scoring.
To visualize these relationships at single-cell resolution, the module scores were projected across the purified fibroblast UMAP manifold. The CXCL13-positive immunofibroblast score (Figure 6d) and the 24-gene nociceptive pain score (Figure 6e) demonstrated striking spatial co-localization. The element-wise product of these two min-max-scaled scores defined a distinct region of transcriptomic co-activation within the manifold (Figure 6f). When quantifying this spatial overlap, the patient-level percentage of fibroblasts simultaneously scoring above the global median for both modules was significantly higher in the hidradenitis suppurativa cohort (median 61.8%) than in healthy controls (median 16.0%; Mann-Whitney U p < 0.01). Furthermore, single-cell mapping revealed that TRPA1-expressing fibroblasts localized preferentially within this co-activated immunofibroblast niche (Figure 6g). Statistically, TRPA1-expressing fibroblasts were enriched in the hidradenitis suppurativa compartment relative to healthy controls (Fisher's exact odds ratio 58.4, p < 0.001). Specifically, of the 36 TRPA1-expressing fibroblasts detected across the cohort, 75.0% localized within the top quartile of the CXCL13-positive immunofibroblast score, representing a highly significant spatial concentration within this inflammatory niche (one-sided Fisher's exact odds ratio 9.34, p < 0.001).
Correlation analysis identified the CXCL13-positive immunofibroblast module as the dominant predictor of nociceptive gene expression across the 14 patient-level pseudobulk profiles (Pearson r = +0.92, p < 0.001; Figure 6h). Within the hidradenitis suppurativa cohort alone (N = 7), the CXCL13-positive immunofibroblast module maintained a significant positive correlation with the pain module (r = +0.95, p < 0.01). Conversely, the homeostatic SFRP2-positive fibroblast module demonstrated a strong negative correlation with the nociceptive pain module across the full cohort (r = -0.86, p < 0.001) and within the hidradenitis suppurativa subset (r = -0.81, p < 0.05; Figure 6j), reflecting the depletion of this population during fibrotic and inflammatory transition. The SFRP4-positive myofibroblast module did not reach significance in predicting pain module expression in either the full cohort (r = +0.10, not significant) or the hidradenitis suppurativa subset (r = -0.72, not significant; Figure 6i).
A total of 46 panel-restricted targets were significantly regulated within the hidradenitis suppurativa fibroblast compartment; the top 44 of these are presented as pseudobulk boxplots in Figure 6k and Figure 6l. Notably, several key mediators directly linked to nociceptive signaling and sensitization were strongly induced, including the sensory ion channel TRPA1 (21.9-fold), nerve growth factor NGF (6.0-fold), and the pain-associated inflammatory cytokine IL1B (7.1-fold). The endocannabinoid and lipid mediator axis also exhibited marked upregulation, led by the sphingosine kinase SPHK1 (75-fold), alongside the leukotriene accessory protein ALOX5AP (9.6-fold) and the prostaglandin E synthases PTGES (2.4-fold) and PTGES2 (2.3-fold). The broader inflammatory state was characterized by substantial inductions of the chemokines CCL5 (831-fold), CCL3 (428-fold), CXCL1 (52.7-fold), CCL4 (28.2-fold), CXCL9 (13.1-fold), and CX3CL1 (3.0-fold), as well as the cytokine IL6 (5.9-fold). Concurrently, the alarmins S100A9 and S100A8 were elevated 724-fold and 492-fold respectively.
The matrix remodeling network was dominated by the metalloproteinases, with MMP3 rising 2,472-fold, MMP9 1,029-fold, and MMP1 994-fold. Further structural and activation markers included the smooth muscle actin gene ACTA2 (6.7-fold), the Wnt-signaling ligand WNT5A (6.6-fold), the epithelial-to-mesenchymal transition factor SNAI2 (4.7-fold), the fibrillar collagens COL1A1 (4.6-fold), COL3A1 (3.1-fold), and COL1A2 (2.8-fold), the fibroblast activation marker FAP (3.3-fold), the zinc transporter SLC39A14 (3.6-fold), the thymidine phosphorylase TYMP (2.9-fold), and the matrix inhibitor TIMP1 (2.8-fold). The plasminogen activators PLAU (34.6-fold) and PLAT (7.3-fold) were similarly elevated. Within the hypoxia and metabolic axis, the carbonic anhydrase CA12 was induced 27.3-fold, the NADPH oxidase NOX4 rose 10.7-fold, and the lactate dehydrogenases LDHB and LDHA rose 2.5-fold and 2.4-fold respectively. Additional neurotrophic factors included midkine (MDK, 6.2-fold) and MANF (2.7-fold).
Conversely, the downregulated targets were led by the type 2 cytokine TSLP (10.9-fold down), the cytotoxic protease ELANE (6.1-fold down), and the cytokine IL18 (3.8-fold down). Suppressions were also observed in the axon guidance molecules SLIT2 (3.2-fold down) and NTN1 (2.6-fold down), the carboxylesterase CES1 (2.8-fold down), and the anti-inflammatory nuclear receptor PPARA (2.2-fold down). Finally, the cyclooxygenase PTGS1 (2.1-fold down) and the alarmin HMGB1 (1.5-fold down) were significantly suppressed, though they fall outside the 44-gene threshold visualized in the plotted panels.
2.7. Genome wide Transcriptome to Pharmacological Targets in HS Fibroblasts
To identify the biological networks associated with the pathogenic fibroblast state in hidradenitis suppurativa, unbiased pathway enrichment was performed on the significantly upregulated fibroblast transcriptome. Gene Ontology Biological Process mapping identified the top-enriched processes as neutrophil chemotaxis, granulocyte chemotaxis, type II interferon signaling, and intracellular and extracellular matrix remodeling (Figure 7a).
Cross-referencing the KEGG pathway database identified overlap with systemic inflammatory and neurodegenerative ontologies including rheumatoid arthritis, amyotrophic lateral sclerosis, Parkinson disease, and Huntington disease (Figure 7b). The transcripts driving these pathway matches were concentrated within mitochondrial oxidative phosphorylation, proteasomal degradation machinery, and pro-inflammatory cytokine expression modules. The KEGG IL-17 signaling pathway also reached significance in this analysis and was selected for downstream gene-level examination.
To characterize the transcriptional footprint of the IL-17 signaling pathway within the fibroblast compartment, the KEGG IL-17 pathway gene set was intersected with the fibroblast differential expression matrix (Figure 7c). The intersection identified five significantly upregulated signal transduction and downstream effector transcripts in hidradenitis suppurativa fibroblasts relative to healthy controls (Figure 7d). The NF-κB and MAPK pathway relays IKBKG, IKBKE, and TRAF4 were elevated 92-fold, 32-fold, and 3.3-fold respectively. The transcription factor CEBPB was elevated 2.4-fold (Q < 0.05). The downstream granulocyte chemoattractant CSF3, encoding granulocyte colony-stimulating factor, was elevated 978-fold (Q < 0.001).
To complement the pathway-level intersection, the IL-17 ligand and receptor family transcripts were audited directly against the fibroblast differential expression matrix. The inflammatory ligands IL17A, IL17C, and IL17F were absent from the testable transcriptome after the per-gene sparsity filter. The atypical ligand IL17D was suppressed 4.3-fold (Q < 0.01; baseMean 12.5). The canonical receptors IL17RA (baseMean 11.3) and IL17RC (baseMean 20.1) were detected at low basal expression levels but did not reach significance for differential expression between hidradenitis suppurativa and healthy fibroblasts. The IL-17 signaling inhibitor IL17RD, also known as SEF, was suppressed 6.9-fold (Q < 0.001; baseMean 13.4).
To identify pharmacologically tractable targets within the dysregulated fibroblast transcriptome, the genome-wide differential expression matrix was intersected with the FDA-approved druggable proteome from the Human Protein Atlas (Figure 7e). Among upregulated druggable targets, the sensory ion channel TRPA1 was elevated 21.9-fold (Q < 0.01), the plasminogen activator inhibitor SERPINE1 was elevated 12.4-fold (Q < 0.001), and the carbonic anhydrase CA12 was elevated 27.3-fold (Q < 0.001). Among downregulated druggable targets, the mineralocorticoid receptor NR3C2 was suppressed 14.6-fold (Q < 0.001) and the leptin receptor LEPR was suppressed 12.8-fold (Q < 0.001).
Restricting the druggable intersection to G-protein-coupled receptors (GPCRs) isolated 41 cell-surface targets with detectable fibroblast expression (Figure 7f). Among upregulated GPCRs, the adenosine A1 receptor ADORA1 was elevated 12.8-fold (Q < 0.05), the alpha-2 adrenergic receptor ADRA2A was elevated 8.9-fold (Q < 0.01), and the sphingosine-1-phosphate receptor S1PR3 was elevated 6.9-fold (Q < 0.01). Among downregulated GPCRs, the vasopressin receptor AVPR1A was suppressed 19.9-fold (Q < 0.001) and the prostaglandin E2 receptor PTGER4 was suppressed 4.5-fold (Q < 0.001).
2.8. In Silico Pharmacological Screening Identifies Candidate Agents Targeting the Pathogenic Fibroblast Network
To map the pathogenic fibroblast transcriptional profile onto existing pharmacological agents, a five-step computational screening pipeline was applied (Figure 8a, b). First, the fibroblast genome-wide differential expression matrix was gated at false discovery rate-corrected Q-value < 0.05 and |log2 fold change| > 0.5, yielding 165 high-confidence precision targets. Second, these targets were intersected with the Drug Gene Interaction Database (DGIdb), which contained 18,853 unique compounds. Antineoplastic agents and pre-clinical CHEMBL compounds were excluded, retaining 16,264 compounds. Third, 3,334 of these compounds matched at least one precision target and had a curated DGIdb interaction confidence score; the promiscuous-compound exclusion list was subsequently applied. Fourth, each retained compound-target interaction was scored as an Edge Precision Score defined as |log2 fold change| × −log10(Q) × DGIdb interaction confidence score, and drug-level Total Precision Scores were computed by summing across each compound's retained interactions. Of the 3,334 scored compounds, 1,119 were FDA-approved. Fifth, the top-scoring candidates were routed into three mechanism classes for inspection: systemic biologics, steroid receptor modulators, and lipid pathway enzymatic inhibitors (Figure 8c–e).
The top monoclonal antibody candidates by Total Precision Score are presented in Figure 8c. Candidates directed against upregulated hidradenitis suppurativa fibroblast targets included the anti-MME (neprilysin) antibody pepinemab matching a 7.8-fold upregulation of MME, the anti-C5AR1 antibody avdoralimab matching a 5.3-fold upregulation of the complement receptor C5AR1, the anti-IL1B antibody gevokizumab matching a 7.1-fold upregulation of IL1B, and the anti-IL6 antibodies olokizumab and siltuximab matching a 5.9-fold upregulation of IL6. Candidates directed against downregulated fibroblast targets included the LEPR agonist antibody mibavademab matching a 12.8-fold suppression of LEPR, the anti-TSLP antibody tezepelumab matching a 10.9-fold suppression of TSLP, the anti-FGFR2 antibody bemarituzumab matching a 6.5-fold suppression of FGFR2, and the anti-IL6R antibodies sarilumab, satralizumab, sirukumab, vobarilizumab, and levilimab matching a 3.8-fold suppression of IL6R.
The top FDA-approved modulators targeting the three significantly suppressed steroid hormone receptors are presented in Figure 8d. The glucocorticoid receptor NR3C1 was suppressed 2.6-fold (Q < 0.001) and intersected with the glucocorticoid agonists fluticasone furoate, methylprednisolone acetate, betamethasone benzoate, and hydrocortamate. The mineralocorticoid receptor NR3C2 was suppressed 14.6-fold (Q < 0.001) and intersected with the mineralocorticoid agonists fludrocortisone and desoxycorticosterone pivalate and the mineralocorticoid antagonists finerenone and eplerenone. The androgen receptor AR was suppressed 3.4-fold (Q < 0.001) and intersected with the androgen receptor agonists methandrostenolone, oxandrolone, and nandrolone decanoate and the androgen receptor antagonist clascoterone.
The significantly upregulated enzymes within the leukotriene and sphingolipid biosynthetic cascades are reconstructed as a targetable metabolic network in Figure 8e. The sphingosine kinase SPHK1 was elevated 75-fold (Q < 0.001). The leukotriene accessory protein ALOX5AP was elevated 9.6-fold (Q < 0.05) in fibroblasts, and the same enzyme is independently induced 3.5-fold in mononuclear phagocytes alongside the upstream 5-lipoxygenase ALOX5 (3.9-fold) and the downstream leukotriene A4 hydrolase LTA4H (3.1-fold), placing the 5-LO leukotriene cascade under disease-state induction across two cell compartments. DGIdb was queried for enzymatic inhibitors of SPHK1, ALOX5AP, and PTGES, and the top-ranked inhibitor candidates for each node were annotated onto the pathway schematic, which included chembl554130, dimethylsphingosine, and opaganib for SPHK1; veliflapon, fiboflapon sodium, and fiboflapon for ALOX5AP; and zaloglanstat, vipoglanstat, and cpd44 for PTGES. The prostaglandin E synthases PTGES and PTGES2 were elevated 2.4-fold (Q < 0.05) and 2.3-fold (Q < 0.001) at smaller magnitude in the fibroblast compartment and are shown as a secondary branch on the schematic; the upstream cyclooxygenases PTGS1 (suppressed 2.1-fold, Q < 0.05) and PTGS2 (non-significant directional change, log2 fold change −1.74, Q = 0.16) are displayed alongside to contextualize the prostaglandin arm relative to the dominant leukotriene and sphingolipid axes.
3. Discussion
3.1. Mononuclear Phagocytes as Multi-Mechanism Amplifiers of Peripheral Nociception
Overall, the mononuclear phagocyte compartment exhibits a distinct pronociceptive transcriptomic shift, characterized by the induction of 8 cytokines and chemokines, 5 alarmins, and the significant dysregulation of 12 core matrix remodeling genes. The encoded alarmins and interleukins are established modulators of peripheral nociceptor sensitivity. Concurrently, the upregulation of enzymatic matrix degradation pathways suggests a localized structural reorganization, which may generate a permissive physical microenvironment for aberrant neurite outgrowth and persistent nociceptive signaling.
Beyond classical cytokines and matrix remodeling, the hidradenitis suppurativa mononuclear phagocyte utilizes multiple concurrent sensitizing mechanisms. The induction of the endothelin EDN1 (3-fold) provides a direct nociceptive ligand (Hans et al. 2008). Moreover, the sensitization is augmented by oxidative stress. The 21-fold upregulation of CYBB, the catalytic subunit of the NADPH oxidase NOX2, identifies the lesional macrophage as source of reactive oxygen species. Macrophage-derived NOX2 is a critical driver of neuropathic pain hypersensitivity, generating localized reactive oxygen species that directly gate nociceptive ion channels on adjacent nerve terminals (Kallenborn-Gerhardt et al. 2014). This oxidative activity is complemented by the 16-fold induction of the mechanosensitive ion channel TRPV4, an established transducer of macrophage-mediated inflammation and mechanical allodynia (Lan et al. 2021; Zhang et al. 2020). Furthermore, the proteolytic landscape shifts toward pronociceptive receptor cleavage. The macrophage-specific elevation of cathepsin S (CTSS, 6-fold) drives the extracellular cleavage of protease-activated receptors on sensory nerves, a specific mechanism of neuropathic pain (Zhao et al. 2014), while the concurrent induction of urokinase (PLAU, 4-fold) further amplifies localized nociceptive proteolytic remodeling. Conversely, the suppression of the kallikreins KLK5 (9-fold down) and KLK7 (7-fold down), which are proteases traditionally associated with pruritus, reinforces the selective, pain-dominant nature of this transcriptomic program.
This inflammatory activation is accompanied by the induction of the carbonic anhydrase CA12, alongside VEGFA and HIF1A, indicating a critical metabolic adaptation to localized tissue hypoxia and acidification. Crucially, this localized tissue acidosis functions as a direct algogenic stimulus, as extracellular protons actively lower the activation threshold of peripheral nociceptors by gating acid-sensing ion channels and transient receptor potential receptors. In oncology, CA12 sustains macrophage survival in lactate-rich microenvironments, and its targeted inhibition effectively depletes these populations in vivo (Ning et al. 2022). While the macrophages in hidradenitis suppurativa may be functionally distinct from immunosuppressive (M2-like) tumor macrophages (Murray 2017), they appear to share this fundamental metabolic dependency on CA12 for survival in acidified tissue. Consequently, CA12 inhibition represents a candidate intervention to selectively deplete this nociceptive macrophage population. Read together, these observations identify the mononuclear phagocyte as a key nociceptive amplifier of the lesional architecture in hidradenitis suppurativa.
3.2. The CXCL13-Positive Immunofibroblasts as Amplifiers of Peripheral Nociceptors
Overall, hidradenitis suppurativa fibroblasts exhibit a broad induction of pronociceptive targets, characterized by the significant dysregulation of 8 cytokines and chemokines, 5 alarmins, and 13 core matrix remodeling genes. These activated fibroblasts transcribe a repertoire of neuro-immune mediators with established capacities to sensitize peripheral sensory neurons. Furthermore, the extensive shift in matrix metalloproteinases and collagens indicates a dynamic architectural turnover of the extracellular matrix. This targeted stromal reorganization likely compromises homeostatic tissue barriers, providing the physical pathways necessary for pathological neurite extension and sustained sensory activation.
Within the fibroblast population in HS lesions CXCL13-positive immunofibroblast subtype seems to play a key role in amplification of nociception. Intriguingly a small but TRPA1-expressing fibroblast fraction is overwhelmingly concentrated in the top quartile of CXCL13-positive immunofibroblast activation. TRPA1 is a polymodal sensor gated both by cyclopentenone prostaglandins downstream of cyclooxygenase activity and by reactive oxygen species (Materazzi et al. 2008). In the HS lesion we also observe changes in the prostaglandin synthesis program in both mononuclear phagocytes and fibroblasts. Whether the TRPA1-positive fibroblasts within the CXCL13-positive niche respond to these locally generated algogens and contribute to nociception, requires further investigation.
Suppressions were also observed in the axon guidance molecules SLIT2 (3.2-fold down) and NTN1 (2.6-fold down). Under homeostatic conditions, SLIT2 and NTN1 provide critical spatial coordinates for cutaneous innervation, with their specific attractive or repulsive effects dictated by the respective Robo and DCC or Unc5 receptor profiles on infiltrating sensory neurons (Masuda et al. 2008; Carr et al. 2017). The concurrent suppression of these spatial patterning cues, combined with the induction of the growth factor NGF, is consistent with a loss of localized structural constraint. This transcriptional shift establishes a permissive environment for disorganized hyperinnervation. This permissive stromal state is further actively remodeled by the induction of the plasminogen activators PLAU (34.6-fold) and PLAT (7.3-fold). Both proteases are established mediators of dorsal horn excitability and pain hypersensitivity following peripheral injury, providing a direct proteolytic mechanism for nociceptive amplification (Yamanaka et al. 2004; Liu et al. 2018). Furthermore, this structural reorganization of neurons is amplified by the induction of midkine (MDK, 6.2-fold), a neurotrophic factor that drives peripheral nerve remodeling by actively recruiting macrophages to clear myelin debris at sites of nerve injury (Sakakima et al. 2009). Conversely, the simultaneous upregulation of mesencephalic astrocyte-derived neurotrophic factor (MANF), which restricts perineural macrophage infiltration to mitigate mechanical hypersensitivity (Dai et al. 2025), suggests the parallel activation of a compensatory, protective tissue-repair program to modulate this localized neuron reorganization. Similarly, the gene encoding leukocyte elastase (ELANE) is strongly suppressed. While the leukocyte elastase enzyme is a potent driver of neuropathic mechanical allodynia (Muley et al. 2016), the targeted downregulation of ELANE in this compartment indicates that stromal nociception in HS is not the result of a non-specific induction of destructive proteases. Rather, the nociceptive microenvironment is shaped by a selective, plasminogen-driven proteolytic cascade.
TSLP, the principal cytokine driver of pruritic signaling on cutaneous sensory neurons (Wilson et al. 2013), is suppressed in line with the clinical observation that HS is dominated by pain rather than pruritus (Orenstein et al. 2023). Moreover, we observe robust induction of the non-canonical Wnt ligand WNT5A provides a direct mechanism for nociceptive amplification. During peripheral sensitization, WNT5A mediates calcium release in dorsal root ganglion neurons, thereby enhancing neuronal excitability and inducing nerve growth and ectopic discharges (Hu and Chen 2026). Furthermore, the lesional extracellular matrix undergoes targeted proteolytic remodeling that favors nociception.
3.3. Cannabinoid-Based Analgesia in Hidradenitis Suppurativa: Therapeutic Potential and Clinical Risks
The transcriptional architecture established in this study demonstrates a compartment-specific dysregulation of the endocannabinoidome in hidradenitis suppurativa across both systemic and local cutaneous environments. In the bulk lesional microenvironment, this dysregulation is driven by a concerted induction of canonical and atypical cannabinoid receptors (CNR1, CNR2, GPR18, GPR55, TRPA1), coupled with the suppression of primary endocannabinoid hydrolases (FAAH, ABHD6) and nuclear receptors (PPARA, PPARG). This cutaneous signature is closely mirrored systemically in whole blood, which exhibits parallel receptor upregulation (CNR2, GPR18, GPR55, PPARD) and a broader suppression of the metabolic machinery (FAAH, ABHD6, MGLL, DAGLA). At single-cell resolution in the lesion environment, this architecture fragments into distinct cellular programs. The T cell compartment actively suppresses cannabinoid sensitivity, downregulating both receptors (CNR2, GPR55, PPARD) and hydrolases (MGLL). In contrast, mononuclear phagocytes undergo targeted metabolic and sensory reprogramming, upregulating TRPV4, the hydrolases CES1 and CES2, and the nuclear receptors PPARA and PPARG, while suppressing GPR55. Simultaneously, the stromal and epidermal compartments undergo selective shifts with fibroblasts inducing the TRPA1 while suppressing CES1 and PPARA, and keratinocytes upregulate CES2 against a downregulation of ABHD12. Notably, the functional expression of CES1 as a primary 2-AG-hydrolyzing enzyme in the skin has only recently been established in the context of cutaneous pathology (Morozova et al. 2025).
When evaluated collectively, these highly coordinated cellular shifts indicate that the net endogenous endocannabinoid tone within the lesional microenvironment undergoes a fundamental transition. The data reveals a spatially integrated network where the biosynthetic output and hydrolytic degradation of both classical endocannabinoids and related endocannabinoid-like lipid mediators are altered. This multi-lineage transcriptional signature suggests a substantial shift in endocannabinoid tone, an effect driven prominently by the changing catabolism of monoacylglycerols via the cell-type-specific dysregulation of MGLL, ABHD6, ABHD12, and the carboxylesterases CES1 and CES2.
While this multi-compartment transcriptomic dysregulation is extensive, the corresponding metabolomic profiling of the endocannabinoidome in hidradenitis suppurativa remains mostly incomplete. Recent targeted lipidomics reported in a preprint study by Kashyap et al. (2026) demonstrated a significant reduction in endocannabinoid-related signaling molecules, specifically N-oleoyl serine, N-stearoyl serine, and N-palmitoylserine, within lesional skin. Alongside this lipid depletion, the same study identified elevated concentrations of proinflammatory lysophosphatidylcholines, including LPC 16:0 and LPC 18:1, which act as direct mediators of neuropathic pain, as well as elevated levels of structural lipids such as phosphatidylcholine, sphingomyelin, and ceramides. Crucially, the classical endocannabinoid ligands, anandamide and 2-arachidonoylglycerol, and related lipids involved in the extended ECS have not yet been directly quantified in either the systemic circulation or the cutaneous lesions of hidradenitis suppurativa patients. This absence of direct metabolite measurement represents a key open question regarding the exact metabolite level changes in the endocannabinoid tone in this disease.
The extensive, multi-compartment transcriptional dysregulation of the endocannabinoidome identified here provides a direct biological rationale for the patient-reported effectiveness of cannabinoids as antinociceptive medication in hidradenitis suppurativa. In patient surveys, HS patients rate cannabinoids among the most effective options they have tried for pain management, at effectiveness ratings matching those reported for opioids, and cannabis use in HS populations is approximately three times higher than in comparable psoriasis cohorts (Fernandez et al. 2022; Metko et al. 2024; Lesort et al. 2019). The concurrent engagement of multiple dysregulated cutaneous targets by exogenous phytocannabinoids provides a localized mechanism for this broad symptom relief, functioning in tandem with the well-established classical central modulation of pain perception by tetrahydrocannabinol at thalamocortical and limbic sites (Weizman et al. 2018).
The therapeutic potential of cannabinoid modulation is highly dependent on both the pharmacological composition of the agent and the route of delivery. Clinical interventions range from isolated phytocannabinoids to whole-plant botanical extracts (Pagano et al. 2022; Bonn-Miller et al. 2018). Botanical extracts deliver a complex of phytocannabinoids, terpenes, and flavonoids that generate an entourage effect, wherein synergistic molecular interactions modify the biological activity of individual compounds compared to purified preparations (Koltai and Namdar 2020; Ben-Shabat et al. 1998; Russo 2011). However, utilizing whole-plant material introduces significant pharmacological variability due to the extensive chemotypic diversity of Cannabis sativa (Welling et al. 2016). The exact ratios of therapeutic phytocannabinoids and entourage compounds differ strongly between distinct chemotypes. Furthermore, the metabolic output of identical genotypes can fluctuate significantly in response to environmental and cultivation conditions, resulting in distinct pharmacological profiles. Beyond composition, the route of administration fundamentally alters pharmacokinetics. Oral ingestion undergoes hepatic first-pass metabolism, which shifts the active metabolite ratio, whereas inhalation via vaporization or combustion provides rapid systemic distribution while introducing distinct toxicological variables. Finally, the localized dysregulation of the cutaneous endocannabinoidome observed in hidradenitis suppurativa lesions provides a theoretical rationale for topical cannabinoid formulations, which could directly engage peripheral nociceptive receptors and modulate dysregulated immune cells while mitigating systemic central nervous system exposure.
Despite their analgesic potential, cannabinoid interventions in hidradenitis suppurativa carry specific clinical and physiological risks that require careful evaluation. First, cannabis use disorder as well as combustion smoking are associated with modestly increased perioperative morbidity (Goel et al. 2020; Yoshikawa and Katada 2019). This is highly relevant for hidradenitis suppurativa patients due to their heavy surgical burden, which frequently involves excisional and drainage procedures. Second, the patient population exhibits elevated baseline rates of cannabis use disorder, depression, anxiety, and suicidality (Machado et al. 2019; Thorlacius et al. 2018; Patel et al. 2020; Szepietowska et al. 2026), creating a clinical vulnerability where cannabinoid use risks exacerbating psychiatric comorbidities rather than alleviating them. Third, the prevalent smoked route of administration introduces direct harm as hidradenitis suppurativa is strongly associated with smoking, can exacerbate disease specific pathophysiology (Acharya and Mathur 2020; Sabat et al. 2025), and sustained smoking cessation progressively reduces disease risk (S. R. Kim et al. 2024). Because cannabis smoke independently induces cutaneous inflammation, combustion-derived disease progression proceeds despite the analgesic properties of the cannabinoids. Consequently, non-smoked delivery routes represent a pharmacologically preferable choice when cannabinoid therapy is pursued. Finally, while phytocannabinoids engage multiple nociceptive nodes to provide broad symptom relief, they act entirely downstream of the primary disease drivers. Because they offer no targeted intervention against the upstream causes of the disease, cannabinoids use functions strictly as a symptom management tool rather than a mechanism to halt underlying disease progression.
3.4. Precision Lipid-Mediator Pharmacology as an Alternative to Conventional Analgesia in Hidradenitis Suppurativa
The compartmentalized transcriptional architecture of lipid mediator synthesis in hidradenitis suppurativa reveals a broad reorganization of bioactive lipid metabolism. In the bulk lesional microenvironment, the 5-lipoxygenase leukotriene pathway is distinctly upregulated, evidenced by the targeted induction of ALOX5, ALOX5AP, and LTA4H. Alongside this leukotriene activation, the lesional tissue exhibits a concurrent induction of alternative inflammatory lipid mediators, specifically the thromboxane synthase TBXAS1, the lysophosphatidic acid enzyme ENPP2, and the prostaglandin E synthase PTGES. Conversely, the classical cyclooxygenase PTGS2 is suppressed at the bulk tissue level. In matched whole blood, systemic alterations are restricted to the suppression of PTGDS and PTGES. At single-cell resolution, changes in the lipid mediator network are highly specific to the cell lineage.
Mononuclear phagocytes demonstrate broad induction across multiple lipid cascades. Within the prostaglandin and thromboxane arms, this includes the marked upregulation of the cyclooxygenase PTGS2, its downstream synthase PTGES, and the thromboxane synthase TBXAS1, contrasted against the active suppression of the alternative prostaglandin E synthase PTGES2. Concurrently, these cells induce the complete 5-lipoxygenase leukotriene axis (ALOX5, ALOX5AP, and LTA4H) alongside the sphingosine kinase SPHK1. The fibroblast compartment exhibits a parallel, yet distinct, metabolic reprogramming. Within the prostaglandin synthesis arm, fibroblasts demonstrate a targeted shift, upregulating the prostaglandin E synthases PTGES and PTGES2 while simultaneously suppressing the baseline cyclooxygenase PTGS1. Alongside this, the fibroblast compartment exhibits an overlapping activation of the leukotriene and sphingolipid networks, characterized by the upregulation of the leukotriene accessory protein ALOX5AP and an extensive induction of the sphingosine kinase SPHK1. In contrast, the T cell compartment exhibits a strongly suppressive lipid mediator profile. Rather than adopting an activated synthetic state, T cells comprehensively downregulate the prostaglandin synthase PTGDS, the sphingosine kinase SPHK1. Finally, across the B cell maturation trajectory, the synthetic machinery for both prostaglandins and leukotrienes (PTGES3, ALOX5AP, LTA4H, ALOX5), alongside the receptors CNR2 and GPR18, remain constitutively expressed without significant maturation-associated shifts.
The transcriptomic divergence away from the cyclooxygenase pathway provides a clear molecular explanation for the clinical limitations of conventional painkillers in hidradenitis suppurativa. The European S2k guidelines note that there is no proof of efficacy for systemic non-steroidal anti-inflammatory drugs, even though patients regularly use them for symptom management (Zouboulis et al. 2025). Because evidence is lacking, and these medications carry known cardiovascular and infectious risks in the presence of lesional bacteria, the guidelines advise restricted and individualized use. A similar paradigm exists for topical non-steroidal anti-inflammatory options. The guidelines evaluate preparations such as diclofenac sodium gels, solutions, and patches applied for one to two weeks, but ultimately the consensus does not recommend the application of topical analgesics for general pain relief. Instead, acetaminophen is suggested as the first-line option. The lack of broad clinical efficacy for non-steroidal anti-inflammatory drugs aligns with the transcriptomic data reported here, which show that classical cyclooxygenase targets are not the dominant drivers of the nociceptive lipid network.
Our transcriptomic analysis establishes that hidradenitis suppurativa does not present a systemic, cyclooxygenase-driven pathology. In matched whole blood, the systemic lipid mediator profile is strictly suppressive, defined by the downregulation of the prostaglandin synthases PTGDS and PTGES. Within the bulk lesional microenvironment, the classical cyclooxygenase PTGS2 is actively suppressed. At single-cell resolution, while mononuclear phagocytes exhibit localized PTGS2 induction, this is counterbalanced by fibroblasts actively suppressing PTGS1 and T cells downregulating PTGDS. Instead of the cyclooxygenase pathway, our transcriptomic data identifies a highly compartmentalized hyperactivation of alternative lipid cascades. Specifically, the 5-lipoxygenase pathway (ALOX5, ALOX5AP, LTA4H) and sphingosine kinase (SPHK1) are strongly upregulated within the lesional macrophage and fibroblast compartments. This foundational transcriptomic shift translates directly to the metabolite level. Lipidomic profiling of the lesional microenvironment corroborates our findings, revealing a significant accumulation of 5-lipoxygenase-derived proinflammatory metabolites, particularly leukotriene B4, 5-hydroxyeicosatetraenoic acid, and 5-oxo-eicosatetraenoic acid, which are synthesized primarily by lesional macrophages (Penno et al. 2020). Lipidomic profiling of the lesional microenvironment corroborates our findings, revealing a significant accumulation of 5-lipoxygenase-derived proinflammatory metabolites, particularly leukotriene B4, 5(S)-hydroxyeicosatetraenoic acid, and 5-oxo-eicosatetraenoic acid (Penno et al. 2020). Crucially, immunohistochemical analysis confirms that 5-lipoxygenase actively localizes to the nuclear envelope of lesional macrophages, structurally validating our transcriptomic identification of these cells as the primary biosynthetic engines of this cascade (Penno et al. 2020). Concurrently, anti-inflammatory 15-lipoxygenase metabolites and omega-3 fatty acid precursors are depleted (Penno et al. 2020). By anchoring the lipidomic reality to our compartment-resolved transcriptomic map, it becomes evident that precision therapeutics may show nociceptive efficacy by targeting localized 5-lipoxygenase and sphingolipid cascades rather than relying on systemic, broad-spectrum cyclooxygenase inhibition.
To translate this pathogenic network into actionable therapeutics, we performed an in silico pharmacological screen targeting the most prominently dysregulated nodes within the leukotriene and sphingolipid cascades. The sphingosine kinase SPHK1 is elevated 75-fold specifically within the lesional fibroblast compartment, representing the largest-magnitude lipid mediator induction observed in this study. While its terminal metabolite, sphingosine-1-phosphate, has not yet been directly quantified in hidradenitis suppurativa lesions, this significant stromal induction marks a possible candidate for both targeted lipidomics and pharmacological inhibition. Crucially, the ceramide-to-sphingosine 1-phosphate signaling axis, driven by enzymes such as SPHK1, is an established mediator of peripheral sensitization that directly lowers the activation thresholds of nociceptive neurons (Salvemini et al. 2013). In parallel, we applied our in silico precision pharmacology framework to the leukotriene accessory protein ALOX5AP, which exhibited a 9.6-fold upregulation specifically within the fibroblast compartment. Querying the Drug-Gene Interaction Database for these specific nodes yields precise repurposing candidates. Top-ranked inhibitors include opaganib, dimethylsphingosine, and chembl554130 for SPHK1, as well as veliflapon and fiboflapon for ALOX5AP. Furthermore, while the upstream cyclooxygenases remain suppressed or statistically unchanged in fibroblasts (PTGS1 suppressed 2.1-fold; PTGS2 unchanged), the downstream prostaglandin E synthases PTGES and PTGES2 are moderately induced. Consequently, specific PTGES inhibitors such as zaloglanstat, vipoglanstat and Cpd44 (Pmid: 19748780) emerge as secondary precision candidates, offering a targeted pharmacological alternative to broad-spectrum cyclooxygenase blockade.
3.5. Limitations
Droplet-based single-cell RNA sequencing does not efficiently capture peripheral nerve fibers or other fragile populations. The nociceptive interpretations in this work are inferred from non-neuronal cells surrounding nerves rather than measured in nociceptors themselves. All findings are transcriptional. RNA-level changes do not establish protein expression, post-translational regulation, or functional activity, and the mechanistic interpretations proposed require protein, metabolite, and functional confirmation. Moreover, the single-cell atlases analyzed here do not capture every cutaneous cell type, so this work does not offer a complete picture of the HS lesional microenvironment. Neutrophils, mast cells, Langerhans cells, sebocytes, and endothelial cells were not profiled in sufficient density to enter the compartment-level analysis and may contribute additional dimensions not resolved here.
4. Methods
4.1. Healthy Cutaneous and Systemic Baseline from the Tabula Sapiens Atlas
Reference single-cell RNA-sequencing matrices for the human blood and skin compartments were obtained from the Tabula Sapiens consortium, hosted on CZ CELLxGENE. To ensure rigorous feature matching, all target genes were mapped exclusively using stable Ensembl identifiers. Counts were recovered from the raw data layer. Each matrix was filtered independently using tissue-specific quality control thresholds. Cells were retained if they expressed at least 200 unique genes and carried a mitochondrial transcript fraction below 5.0% for blood and below 10.0% for skin, reflecting the higher baseline mitochondrial load typical of enzymatically dissociated solid tissue. Mitochondrial genes were identified by the prefix MT-. Counts were subsequently normalized to 10,000 counts per cell (CP10k) and log1p-transformed.
A targeted 18-gene panel was extracted to survey the cutaneous and systemic endocannabinoid system, alongside four housekeeping reference genes (ACTB, B2M, GAPDH, RPL13A) included to benchmark detection sensitivity. To ensure robust statistical power, a strict demographic gate was applied: a cell type was only retained for downstream analysis if it was represented by at least three independent donors, with each donor contributing a minimum of ten cells.
For each retained cell type, we computed the percentage of cells with any detected expression of each panel gene, along with the arithmetic mean, median, and standard deviation of the log-normalized expression. These per-cell-type statistics formed the substrate for Figure 1.
To resolve the macro-architectural distribution of each transcript within the skin compartment, the 28 cell-type annotations were aggregated into seven functional master lineages: T lymphocytes, B lymphocytes, innate lymphoid cells, myeloid and antigen-presenting cells, granulocytes, stroma and vasculature, and epithelial and barrier cells. To estimate the pseudobulk transcript contribution of each lineage on a comparable scale, per-cell-type log-normalized means were reverted to a linear scale (using the mathematical transformation ) and multiplied by the corresponding cell count to yield an aggregate expression estimate in arbitrary units. Contributions were then summed across the constituent cell types of each master lineage. Due to the strict demographic power gate, the B lymphocyte and innate lymphoid lineages lacked sufficient cell density in the healthy skin cohort and were excluded from the lineage-level aggregations. Lineage expression penetrance was computed as the sum of expressing cells across constituent cell types divided by the total cell count of the master lineage, expressed as a percentage.
4.2. Bulk RNA-Sequencing of HS Lesional Skin and Matched Whole Blood
Raw integer count data and clinical metadata were obtained from the Gene Expression Omnibus under accession GSE154773 (Gudjonsson et al. 2020), yielding four clinical groups: healthy donor skin (n = 10), HS lesional skin (n = 22), healthy donor whole blood (n = 10), and HS patient whole blood (n = 21). Sample identity (patient and tissue) was parsed directly from the count matrix column headers. Differential expression was computed using PyDESeq2 (v0.5.4) separately for the skin and whole blood compartments, applying a standard pre-filter to exclude genes whose total count summed across samples within a compartment was below 10. Each compartment-level model was fit using a negative binomial Wald test with default median-of-ratios size-factor normalization, contrasting HS against healthy donors. Log2 fold changes were subsequently moderated using apeglm-style shrinkage to reduce noise in lowly expressed and high-leverage genes while preserving direction and significance estimates.
Two parallel statistical analyses were derived from the fitted models. First, the methodology was independently validated against 17 transcripts with directions and fold changes explicitly reported in the source publication (Gudjonsson et al. 2020). Second, for the curated 33-gene panel (comprising the 18-gene endocannabinoidome panel and the 15-gene lipid mediator panel), a single unified Benjamini-Hochberg false discovery rate correction was applied across all N = 66 panel-by-tissue tests rather than within each compartment separately. This ensured the false discovery rate was controlled across the full set of hypotheses. Statistical significance was defined as an adjusted p-value (FDR) of less than or equal to 0.10.
4.3. Assembly and Integration of Immune and Epidermal Single-Cell Cohort (GSE220116)
Raw 10x Genomics count matrices (matrix, barcodes, and features triplets) for GSE220116 were obtained from the Gene Expression Omnibus together with series matrix files containing clinical metadata. Matrices were ingested per sample and concatenated with an outer join, zero-filling missing genes to preserve the full feature space across the three sequencing platforms represented in the cohort. Per-cell quality control was applied in several stages. A library-complexity filter removed cells expressing fewer than 200 genes, and algorithmic doublet detection was performed per sample using Scrublet (Wolock et al. 2019) at an expected doublet rate of 5%. Median absolute deviation (MAD)-based outlier filtering was then applied to both total counts and gene counts, with cells flagged and removed if they fell more than 5 MADs above or below the median of either metric. A hard mitochondrial threshold excluded cells exceeding 10.0% mitochondrial transcripts. Finally, ribosomal (RPS*, RPL*) and MALAT1 transcripts were removed from the feature space to limit their disproportionate variance contribution during downstream integration.
Of the resulting post-QC cells, samples annotated as after treatment or Nonlesional were excluded to restrict analysis to the primary lesional-versus-healthy comparison, yielding a global cohort of 33,705 cells across 33,433 genes, spanning hidradenitis suppurativa lesional skin, psoriasis lesional skin, and healthy donor skin. A raw integer count layer was retained for probabilistic modeling, and the display matrix was separately normalized to 10,000 counts per cell and log1p-transformed. Three thousand highly variable genes were selected using a batch-aware Seurat dispersion algorithm, with patient identifier assigned as the batch key to prevent variance selection from being driven by sample-specific technical effects.
Batch-aware integration was performed using the single-cell variational inference framework (scVI) (Lopez et al. 2018). The model was trained on the raw integer counts of the 3,000 highly variable genes with two hidden layers, 30 latent dimensions, and a negative binomial gene likelihood. Patient identifier was assigned as the primary categorical batch covariate. Skin anatomical site was included as a secondary categorical covariate to regress out site-specific technical variation, and total counts and mitochondrial transcript fraction were included as continuous covariates to adjust for per-cell library size and quality. Training ran for up to 400 epochs with early stopping (patience = 20 epochs) monitored on the evidence lower bound validation loss. A k-nearest-neighbors graph (k = 15) was constructed on the resulting latent representation, and a UMAP embedding (minimum distance 0.3) and Leiden clustering (resolution 0.8) were computed on this graph.
Global cluster identity was assigned by cross-referencing cluster-level mean expression of ten canonical lineage markers against the top-ranked Wilcoxon rank-sum marker genes per cluster. The markers used were KRT14 and KRT1 (epithelial basal and suprabasal), COL1A1 (stromal fibroblast), PECAM1 (endothelial), LYZ and HLA-DRA (macrophage/monocyte and dendritic cell), CD3E (T lymphocyte), MS4A1 (B lymphocyte), TPSAB1 (mast cell), and PMEL (melanocyte). Manifold integration quality was assessed by cross-tabulating Leiden cluster assignments against patient identifier, disease state, skin anatomical site, and sequencing platform to confirm batch mixing, and by computing cluster-level medians of cell-cycle phase scores, mitochondrial fraction, doublet score, and sex-linked (XIST, RPS4Y1), viability (GAPDH), and stress (HSP90AA1) expression to identify clusters driven by technical rather than biological variation.
4.4. Lineage Purification and Construction of the Integrated Immune-Epidermal Atlas
To resolve each major lineage at higher resolution and remove residual cross-lineage contamination, seven lineage compartments were extracted from the global atlas based on their canonical marker profile: keratinocytes, T lymphocytes, mononuclear phagocytes, B lymphocytes, mast cells, melanocytes, and the stromal compartment. The keratinocyte, T lymphocyte, mononuclear phagocyte, and B lymphocyte compartments formed the substrate for the single-cell analyses of the immune and epidermal lesional architecture reported in Figure 4 and Figure 5. The stromal compartment was processed as part of atlas assembly for completeness but was not used for the fibroblast-centered analyses in Figure 6 through 8, which draw on a separately constructed, expanded fibroblast cohort. Each extracted lineage was subjected to an independent three-step refinement.
First, highly variable genes were recalculated within the isolated lineage (up to 2,000 genes per compartment). For dense compartments (keratinocytes, mononuclear phagocytes, T cells, B cells, and the stromal compartment) the Seurat v3 algorithm was applied to the raw integer counts layer. For sparse compartments (mast cells and melanocytes) the standard Seurat algorithm was applied to log-normalized expression instead, as the LOESS regression underlying the Seurat v3 dispersion estimator is unstable on low-density sequencing batches. A new scVI model was then trained on the lineage-specific feature set with two hidden layers and a negative binomial gene likelihood, using patient identifier as the sole batch covariate. Latent dimensionality was adaptively scaled to cohort size to limit overfitting in rare populations: 30 dimensions for compartments exceeding 5,000 cells, 20 dimensions for 500 to 5,000 cells, and 10 dimensions for fewer than 500 cells. Training ran for up to 400 epochs with early stopping. A lineage-specific k-nearest-neighbors graph, UMAP embedding (minimum distance 0.3), and Leiden clustering (resolution 0.8) were then computed on the new latent space, with the neighbor parameter bounded to the lesser of 15 or the total lineage cell count minus one to accommodate sparse populations.
Second, each lineage was evaluated against a structured diagnostic panel comprising positive lineage markers (for example, CD68 for mononuclear phagocytes, CD3E for T cells, MS4A1 for B cells, KRT14 and KRT1 for keratinocytes, TPSAB1 for mast cells, PMEL for melanocytes, and COL1A1 with PECAM1 for the stromal compartment), negative cross-lineage markers drawn from all other major lineages, viability markers (GAPDH, ACTB), and cellular stress markers (HSPA1A, HSP90AB1, UBC). Cluster-level mean expression and per-cell penetrance were computed for each marker and visualized as dot plots and UMAP feature plots.
Third, cluster identities were assigned and contaminating clusters excluded based on a review of the diagnostic output. Clusters exhibiting cross-lineage marker expression (heterotypic doublets) or a combination of low viability with elevated stress transcripts were excluded. Remaining clusters were assigned subtype labels where internal structure permitted: the mononuclear phagocyte compartment resolved into macrophage and a combined dendritic-cell/monocyte subset; the T cell compartment into CD4-positive, CD8-positive, regulatory, and natural killer subsets; the B cell compartment into B cells and plasma cells; the keratinocyte compartment into basal and differentiating subsets; and the stromal compartment into core fibroblast and endothelial subsets. Mast cells and melanocytes were retained as single compartments without internal subtype resolution, with outlier clusters excluded.
The seven purified lineage matrices were concatenated via outer join into a unified super-matrix. A parity check confirmed that the concatenated cell count equaled the sum of contributing lineage cell counts, verifying no cell loss during concatenation. Legacy cell-type annotations inherited from the source dataset were cross-tabulated against the refined lineage assignments to verify concordance between the two labeling schemes, after which the legacy annotation columns were dropped to prevent their accidental use in downstream differential expression modeling.
A final global integration was performed on the purified super-matrix. Two thousand highly variable genes were selected using the Seurat algorithm on log-normalized expression, without subsetting the feature space, so that all approximately 33,000 genes remained available for downstream pseudobulk aggregation. A new scVI model was trained on the raw integer counts of these highly variable genes with two hidden layers, 30 latent dimensions, a zero-inflated negative binomial gene likelihood, and patient identifier as the batch covariate, running for up to 200 epochs with early stopping. The latent representation was mapped back to the full feature space, and a new k-nearest-neighbors graph (k = 15) and UMAP embedding (minimum distance 0.3) were computed. This integrated, purified global atlas formed the substrate for all downstream single-cell analyses of the keratinocyte, T cell, mononuclear phagocyte, and B cell compartments.
4.5. Patient-Level Pseudobulk Differential Expression of the Immune and Epidermal Compartments
To accommodate the dropout sparsity and overdispersion characteristic of droplet-based single-cell data, differential expression analysis was performed at pseudobulk resolution. A manually curated 134-gene panel organized into a two-tier ontology was assembled prior to aggregation, spanning three biological pillars (neuro-immune signaling, matrix remodeling, and lipid mediators) with internal sub-categories (cytokines and chemokines, alarmins and damage-associated molecular patterns, mechanotransducers, proteases, neurotrophic factors, neuropeptides, axon guidance molecules, matrix components, eicosanoid biosynthetic enzymes, endocannabinoid enzymes, and others). Within the integrated purified atlas, cells were grouped by patient identifier, compartment, and disease state, and raw integer transcript counts for the 134 panel genes were summed across all cells of a given patient-compartment combination to yield one pseudobulk biological replicate per patient per compartment.
A minimum-cells threshold was imposed to prevent low-depth replicates from distorting variance estimates: patient-compartment combinations with fewer than 10 cells were excluded. A second power gate required a minimum of three valid biological replicates per disease condition per compartment for that compartment to enter statistical modeling. Due to the inherent sparsity of droplet-based capture for rare cutaneous populations, the mast cell and melanocyte compartments failed to meet this demographic threshold and were excluded from patient-level differential expression analysis. Similarly, the stromal compartment from this specific atlas was set aside in favor of a dedicated, expanded fibroblast cohort (detailed in Section 2.7). Consequently, the final cohort passing the power gate for 3-way differential expression comprised the keratinocyte compartment (8 HS, 10 healthy controls, 10 psoriasis), the T lymphocyte compartment (8 HS, 7 healthy controls, 10 psoriasis), and the mononuclear phagocyte compartment (7 HS, 7 healthy controls, 10 psoriasis).
Differential expression was computed using PyDESeq2, which fits a negative binomial generalized linear model to raw integer counts with default median-of-ratios size-factor normalization. Three pairwise contrasts were extracted from each lineage's fitted model: hidradenitis suppurativa versus healthy control, hidradenitis suppurativa versus psoriasis, and psoriasis versus healthy control. A per-lineage gene-level sparsity filter was applied before model fitting, removing any panel gene whose cumulative count sum across retained samples fell below 10. Raw p-values from the Wald tests were adjusted for multiple testing using the Benjamini-Hochberg false discovery rate procedure within each contrast.
To provide transcriptome-wide context for the volcano plots in Figure 4g and Figure 5a, separate PyDESeq2 models were fit on the full gene space (rather than exclusively on the curated 134-gene panel) for the mononuclear phagocyte, keratinocyte, and T lymphocyte compartments. These genome-wide models used the same patient-compartment pseudobulk aggregation, the same 10-cells-per-replicate power gate, and the same gene-level 10-count sparsity filter, but drew from the complete transcriptome of each compartment rather than the targeted panel. The mononuclear phagocyte genome-wide model was fit with the same three pairwise contrasts as the targeted analysis; the keratinocyte and T lymphocyte genome-wide models were fit only for the hidradenitis suppurativa versus control contrast used in the Figure 5a volcanoes.
Figure 4 and Figure 5 draw on different pillars of the two-tier ontology. The neuro-immune signaling and matrix remodeling pillars together contain 101 genes, which are displayed as the targeted boxplot networks in Figure 4 and highlighted over the genome-wide volcano background in Figure 4g. The lipid mediator pillar contains 33 genes, displayed as the targeted boxplots in Figure 5 and highlighted over the genome-wide volcano backgrounds in Figure 5a.
4.6. B lymphocyte Maturation Trajectory in HS Lesions
The B lymphocyte compartment was isolated from the integrated atlas for trajectory analysis. This analysis was restricted to cells from hidradenitis suppurativa patients because the low B cell density in the healthy donor and psoriatic cohorts precluded a disease-state comparison at sufficient statistical power. Raw integer counts for the retained HS B lymphocytes were normalized to 1,000,000 counts per cell (counts per million, CPM) and log1p-transformed before module scoring.
Maturation state was assigned by module scoring against two canonical B lineage signatures. A memory B cell module comprised MS4A1, CD19, PAX5, and BANK1. A plasma cell module comprised PRDM1, XBP1, IRF4, and MZB1. Per-cell module scores were computed with scanpy's score_genes function, which subtracts the mean expression of a randomly sampled reference gene set from the mean expression of the target set. To prevent expression-level bias, the reference transcriptome was partitioned into 25 equal expression bins, and for each target gene, 50 control genes were sampled from the corresponding bin. Cells were then assigned to discrete maturation states based on the sign of each score: memory B cells (memory score > 0 and plasma score 0), plasmablasts (memory score > 0 and plasma score > 0), and plasma cells (memory score 0 and plasma score > 0). Cells with scores at or below zero on both modules were classified as undefined and excluded from the trajectory.
Sequential differential expression between maturation states was then evaluated at pseudobulk resolution. A demographic power gate required a minimum of 10 B cells per patient per maturation state for a patient-state combination to constitute a valid pseudobulk replicate. For patient-state combinations clearing this threshold, raw integer counts were summed across cells to produce pseudobulk replicates, and a gene-level sparsity filter excluded genes with a cumulative count sum below 10 across the retained replicates.
PyDESeq2 fitted a negative binomial generalized linear model with maturation state as the sole design factor. Patient identifier was excluded from the design matrix: because the 10-cell threshold caused certain patients to contribute replicates for some maturation states but not others (particularly the transient plasmablast state), a patient-corrected design would have been rank-deficient and would have failed to fit. Two sequential maturation-state contrasts were extracted from the fitted model: plasmablast versus memory B cell, and plasma cell versus plasmablast. Raw p-values were adjusted using the Benjamini-Hochberg false discovery rate procedure.
Pseudobulk differential expression results were filtered to the 33-gene lipid mediator pillar of the two-tier ontology (Section 2.5), matching the gene set analyzed for the other compartments in Figure 5. In parallel, per-maturation-state mean expression and per-cell penetrance (percent of cells with detected expression of each gene) were computed on the log1p-CPM single-cell matrix for the same 33-gene set, forming the substrate for the Figure 5d heatmap that tracks lipid mediator expression across the maturation trajectory.
4.7. Assembly and Integration of Fibroblast Single-Cell Cohort (GSE154775 + GSE173706)
A second, independent single-cell cohort was assembled to support the fibroblast-centered analyses in Figure 6 through 8. Two publicly deposited datasets were used: GSE154775, which contributed full-thickness lesional skin from hidradenitis suppurativa patients in 10x Genomics triplet format (.mtx, barcodes, features), and GSE173706, which contributed dense count matrices from healthy donor skin in .csv format. The GSE173706 cohort included both healthy donors and a psoriasis arm; the psoriasis samples were dropped at the metadata parsing stage, retaining only samples annotated as healthy donors, so that the integrated atlas carries a single unconfounded healthy baseline rather than a mixed inflammatory-disease reference. Per-sample .csv files from GSE173706 were subjected to a structural integer parity check on up to 1,000 randomly sampled non-zero values: fractional values (indicating TPM or CPM pre-normalization rather than raw counts) would have aborted ingestion. All matrices cleared the check. Samples were concatenated with an outer-join strategy that zero-fills missing genes across source datasets, preserving the universal feature space. A cellular parity check verified that the total cell count after concatenation equaled the sum of per-sample cell counts. Raw integer counts were stored in a dedicated counts layer and retained unmodified through all subsequent transformations.
Quality control and integration then proceeded on the merged object. Mitochondrial content was computed from genes with an MT- symbol prefix. Per-cell filters excluded cells with fewer than 200 detected genes, more than 6,000 detected genes, or more than 10.0% mitochondrial reads. Per-batch doublet detection was applied via Scrublet at the patient identifier level with an expected doublet rate of 5%; batches with fewer than 50 cells were exempted from Scrublet and passed through as singlets by default. Predicted doublets were excluded. A gene-level filter removed genes detected in fewer than three cells, followed by the exclusion of ribosomal (RPS* and RPL*) and MALAT1 transcripts based on gene symbol prefix.
The filtered matrix was normalized to 10,000 counts per cell and log1p-transformed for display; the raw counts layer was retained separately for scVI training. Prior to feature selection, a micro-batch gate excluded any patient contributing fewer than 30 cells to prevent LOESS dispersion-estimator failure during batch-aware highly variable gene identification. Three thousand highly variable genes were then selected via the Seurat algorithm on log-normalized expression with the patient identifier assigned as the batch key. An scVI generative model was trained on the raw integer counts of the selected highly variable genes with two hidden layers, 30 latent dimensions, a negative binomial gene likelihood, a gene-specific dispersion parameter, and the patient identifier as the sole batch covariate. Training ran for up to 400 epochs with early stopping (patience = 20). A k-nearest-neighbors graph (k = 15) was computed on the scVI latent representation, after which a UMAP embedding (minimum distance 0.3) and Leiden clustering (resolution 0.8) were applied. Random seeds were fixed at 123 to enable reproducible integration.
Gene identifiers were then harmonized to a common HGNC symbol namespace. For cells originating from GSE154775, the source features.tsv file provided a dictionary mapping Ensembl gene IDs to gene symbols. Unmapped or blank-symbol entries retained their original Ensembl identifier; namespace collisions arising from one-to-many Ensembl-to-symbol mappings were resolved by appending unique suffixes, with the unmodified counts layer verified to remain dimensionally aligned after renaming. Fragmented disease metadata columns from the two cohorts were then unified into a single clinical condition axis with values of HS or Healthy. To validate the integrated manifold, mean log-normalized expression of ten canonical lineage markers (KRT14, KRT1, COL1A1, PECAM1, LYZ, HLA-DRA, CD3E, MS4A1, TPSAB1, PMEL) was computed per Leiden cluster. A multi-panel UMAP diagnostic grid visualized cluster identity, clinical condition, patient identifier, source dataset, cell cycle phase (scored against standard S-phase and G2/M-phase reference gene lists), log-transformed transcript counts and detected gene counts, percent mitochondrial reads, Scrublet doublet score, and specific sex-chromosome, viability, and stress expression to identify clusters driven by technical rather than biological variation. Categorical cross-tabulations of cluster identity against patient, dataset, clinical condition, and cell cycle phase verified batch mixing and biological signal preservation. The top ten marker genes per cluster were extracted by Wilcoxon rank-sum testing.
The stromal compartment was then extracted for lineage-specific refinement. Leiden clusters exhibiting canonical stromal marker expression (high COL1A1 and PECAM1, absent or low KRT14, LYZ, and CD3E) were retained, and prior global clustering metadata was dropped to prevent downstream bias. The micro-batch gate was lowered from 30 to 15 cells per patient. Up to 2,000 highly variable genes were selected by the Seurat algorithm with the patient identifier as the batch key. A new scVI model was trained on the raw integer counts of these genes with two hidden layers, adaptive latent dimensionality (20 dimensions when the lineage cohort contained fewer than 3,000 cells, otherwise 30), a negative binomial gene likelihood, gene-specific dispersion, and the patient identifier as the sole batch covariate, for up to 400 epochs with early stopping. A k-nearest-neighbors graph (k = 15), UMAP embedding (minimum distance 0.3), and Leiden clustering at a reduced resolution of 0.6 were then computed on the refined latent space.
A diagnostic panel then characterized the resulting stromal clusters against an expanded marker dictionary spanning core fibroblast, myofibroblast, mural, and endothelial identities. To expose the true magnitude of highly expressed genes, cluster means were computed by reverting the log1p-transformed expression matrix to a linear scale prior to averaging. Based on this diagnostic output, clusters were assigned to three phenotypic compartments by manual curation: a fibroblast continuum pooling core COL1A1-positive fibroblasts together with HS-activated myofibroblasts (to capture the full disease-state continuum in downstream pseudobulk differential expression); a pericyte and smooth muscle compartment defined by ACTA2, TAGLN, MYL9, and RGS5; and a vascular and lymphatic endothelial compartment defined by PECAM1, VWF, PLVAP, and LYVE1. A single cluster exhibiting high KRT14 expression, indicative of epithelial-stromal heterotypic doublets, was excluded. A final demographic power audit enumerated per-patient cell counts against the same 10-cells-per-patient and 3-valid-replicates-per-condition power gate applied elsewhere in the pipeline. The resulting purified matrix formed the substrate for all single-cell fibroblast analyses in Figure 6 through 8.
4.8. Fibroblast differential expression and subtype-resolved module analysis
Pseudobulk differential expression was performed on the purified integrated atlas described in Section 2.7. Cells were stratified into three phenotypic compartments (fibroblast continuum, pericyte and smooth muscle, and vascular and lymphatic endothelial). Within each compartment, cells were grouped by patient identifier, and raw integer counts were summed across cells to produce one pseudobulk replicate per patient. A minimum-cells threshold of 10 cells per patient was imposed for a patient to contribute a valid replicate. Genes with a cumulative count sum of zero across all retained replicates were excluded. PyDESeq2 fitted a negative binomial generalized linear model to the retained matrix with clinical condition as the sole design factor and Cook's distance outlier refitting enabled. A single pairwise contrast was extracted per compartment (hidradenitis suppurativa versus healthy). Raw p-values were adjusted for multiple testing using the Benjamini-Hochberg false discovery rate procedure. Genome-wide differential expression results were written to disk per compartment and form the statistical substrate for Figure 6.
Three fibroblast-subtype-specific gene modules were then assembled to interrogate the internal heterogeneity of the fibroblast continuum, drawing on the subtype framework established by van Straalen and colleagues (2024). A CXCL13-positive immunofibroblast module comprising CXCL13, ASPN, and MMP13 was taken directly from the immunofibroblast top-marker panel. A Hippo pathway target module comprising CTGF, CYR61, and COL8A1 was taken directly from the direct YAP/TAZ-TEAD transcriptional targets panel. A SFRP4-positive myofibroblast module comprising SFRP4, COL1A1, COL1A2, COL3A1, and ACTA2 was assembled to capture SFRP4-positive myofibroblast functional identity. A fourth, pain-associated module was constructed in a data-driven manner from the results of the fibroblast compartment differential expression: all genes with an adjusted p-value below 0.05 and a positive log2 fold change that also belonged to the neuro-immune signaling or lipid mediator pillars of the two-tier ontology were included. Because the pain module is derived from the same differential expression statistics that the fibroblast compartment analyses compare against, subtype-to-pain correlations used symmetrically overlap-excluded versions of both modules: for each subtype, any gene shared between that subtype's module and the pain module was removed from both sides of the pairwise correlation. The full pain module (without overlap removal) was retained separately for disease-state tests and for visualization.
Module scoring was performed on the fibroblast continuum only. Raw integer counts were normalized to 10,000 counts per cell and log1p-transformed. Per-cell module scores were then computed with Scanpy's score_genes function using its default parameters (25 expression bins, 50 control genes sampled per bin). Single-cell TRPA1 expression was extracted directly from the log1p-normalized matrix and stored as a per-cell covariate. Three continuous cell-level variables (the CXCL13-positive immunofibroblast score, the full pain module score, and TRPA1 expression) were min-max scaled into the unit interval, and two composite co-activation metrics were computed as the element-wise product of the scaled variables: a general co-activation index (CXCL13-positive score full pain score) and a TRPA1 co-activation index (CXCL13-positive score TRPA1 expression).
A patient-level statistical battery was then executed to quantify the disease-state and subtype-resolved patterns. First, single-cell scores were aggregated to patient-level means to correct for pseudoreplication, and Pearson and Spearman correlations between each overlap-excluded subtype module and the pain module were computed across all patients and within the HS subset alone. A sensitivity analysis repeated these correlations excluding patients contributing fewer than 15 fibroblasts. Second, patient-level module scores for each of the three subtype modules were compared between HS and healthy donors using two-sided Mann-Whitney U tests, with rank-biserial correlation reported as the effect size. Third, cell-level enrichment of TRPA1-expressing fibroblasts in HS versus healthy cohorts was tested by a two-sided Fisher's exact test. Fourth, to test whether TRPA1-expressing cells preferentially occupied the CXCL13-positive immunofibroblast niche, the enrichment of TRPA1-positive cells in the top quartile of the CXCL13-positive immunofibroblast score distribution was evaluated by a one-sided Fisher's exact test. Fifth, per-patient TRPA1-positive cell penetrance was compared between HS and healthy donors via Mann-Whitney U testing.
For targeted visualizations in Figure 6, the fibroblast compartment differential expression results were ranked by the absolute value of the log2 fold change among genes passing an adjusted p-value threshold of 0.05, and the top 44 ranked genes were retained. Pseudobulk counts for these genes were aggregated per patient, normalized to one million counts per cell (CPM) with log1p transformation, and exported for plotting. In a parallel visualization workflow, the full 134-gene curated panel was overlaid on the genome-wide fibroblast, pericyte and smooth muscle, and endothelial volcano plots, identifying significantly regulated targets defined by an adjusted p-value below 0.05 and an absolute log2 fold change greater than 1.
4.9. Pathway Enrichment, Druggable Proteome Intersection, and Precision Pharmacology
To map the biological pathways dysregulated in HS fibroblasts and translate them into actionable therapeutic targets, the fibroblast compartment differential expression results were submitted to a multiple-step translational analysis.
Pathway enrichment was performed on significantly upregulated genes in HS fibroblasts, defined as those with a Benjamini-Hochberg adjusted p-value below 0.05 and a log2 fold change above 0.5. The resulting gene list was submitted to the Enrichr web service via its REST API (Xie et al. 2021; Kuleshov et al. 2016; Chen et al. 2013) and queried against two annotation databases: GO Biological Process 2023 and KEGG 2021 Human. Enriched terms with a Benjamini-Hochberg adjusted p-value below 0.1, as returned by the Enrichr service, were retained. For Figure 7a and Figure 7b, the top fifteen GO Biological Process terms and the top fifteen KEGG terms were selected by ascending adjusted p-value. For Figure 7c and Figure 7d, the genes overlapping with the IL-17 signaling pathway KEGG term were extracted from the Enrichr output and matched against the fibroblast PyDESeq2 results by uppercase gene symbol to anchor each pathway gene with its log2 fold change, base mean, and Benjamini-Hochberg adjusted p-value, sorted in descending order of log2 fold change.
The full fibroblast PyDESeq2 result matrix was then intersected with two target lists from the Human Protein Atlas (Wishart et al. 2006; Uhlén et al. 2015): the complete FDA-druggable proteome and its G-protein-coupled receptor (GPCR) subset. Gene symbols in both matrices were harmonized to uppercase form prior to intersection to prevent case-sensitive join failures. The intersected datasets formed the substrate for Figure 7e (all FDA-druggable targets) and Figure 7f (GPCR targets).
Precision pharmacology analysis was then executed on the intersected FDA-druggable and GPCR target sets. Targets passing a Benjamini-Hochberg adjusted p-value below 0.05 and an absolute log2 fold change above 0.5 were retained from both datasets and pooled into a single target pool (GPCR targets retained first, with any remaining non-GPCR FDA targets added next, deduplicated on gene symbol).
The target pool was then intersected with the Drug-Gene Interaction Database (Freshour et al. 2021). Two safety-oriented filters were applied to the DGIdb interaction table before merging: interactions annotated as antineoplastic (the anti_neoplastic flag set to True) were removed, and drugs whose names contained 'CHEMBL' (an identifier for pre-clinical compounds without assigned proprietary names) were excluded. The filtered DGIdb table was inner-joined against the target pool on gene symbol, and any interaction lacking a DGIdb interaction confidence score was dropped.
To rank the candidate therapeutics, a composite edge precision score was computed for each retained drug-target interaction. This score integrates the magnitude of the disease-state expression shift, its statistical significance, and the curated confidence of the pharmacological interaction:
The resulting edges were further filtered against a curated promiscuous compound exclusion list of small molecules and ions known to produce nuisance hits in drug-gene interaction databases: resveratrol, curcumin, quercetin, genistein, rutin, epigallocatechin gallate, zinc, copper, calcium, magnesium, and ascorbic acid. The cleaned edge set was used to compute drug-level summary scores by summing the edge precision scores across all target interactions for each drug, with FDA approval status attached from the DGIdb approved flag.
A pipeline attrition funnel was computed to document candidate drop-off across successive stages, reporting the unique drug count at each step: the total drug count in the raw DGIdb interaction table; the count remaining after the antineoplastic and CHEMBL safety filter; the count matching a differentially expressed HS fibroblast target after the pre-specified compound exclusion; the count retaining at least one DGIdb-scored interaction; and finally the count restricted to FDA-approved drugs.
The ranked candidate drugs were then stratified into three therapeutic categories for Figure 8. Monoclonal antibody therapeutics (Figure 8c) were identified by the International Nonproprietary Name suffix. Edges passing this filter and an adjusted p-value significance threshold below 0.05 on the underlying fibroblast differential expression were ranked by their edge precision score, and the top twelve unique drugs were retained. Steroid and hormone receptor modulators (Figure 8d) were identified as FDA-approved drugs targeting any of NR3C1 (glucocorticoid receptor), NR3C2 (mineralocorticoid receptor), or AR (androgen receptor). Edges passing all three criteria (FDA approval, one of the three receptor targets, and an adjusted p-value below 0.05) were ranked by edge precision score, with the top four drugs per receptor target retained.
Lipid pathway enzymatic inhibitors (Figure 8e) were identified for a pre-specified set of lipid mediator enzymes: SPHK1 (sphingosine kinase 1), ALOX5AP (5-lipoxygenase activating protein), and PTGES (prostaglandin E synthase). Because pharmacological inhibitors for these specific targets are predominantly investigational, this panel required a separate lookup against the raw DGIdb interaction table. By applying only the antineoplastic safety filter and bypassing the strict FDA approval requirements of the main edge vault, we were able to successfully retrieve these experimental compounds. For each enzyme, interactions annotated as an inhibitor, antagonist, blocker, or suppressor were prioritized. If no such annotations were present, the search defaulted to all available interactions. The surviving interactions were ranked first by their DGIdb interaction score and then by FDA approval status, retaining the top three unique drugs per enzyme.
Funding
This research received no external funding.
Data availability Statement
All raw integer count data and clinical metadata utilized in this study are publicly accessible. The Tabula Sapiens reference atlases for human blood and skin are available through the CZ CELLXGENE portal. Disease cohort data are available from the National Center for Biotechnology Information (NCBI) Gene Expression Omnibus (GEO) under the following accession numbers: GSE154773 (bulk RNA-seq of lesional skin and whole blood), GSE220116 (single-cell RNA-seq of immune and epidermal compartments), GSE154775 (single-cell RNA-seq of full-thickness lesional skin), and GSE173706 (single-cell RNA-seq of healthy donor skin). The full computational scripts and single-cell analysis pipelines used in this manuscript are available from the author upon request.
Conflicts of Interest
The author declares no conflicts of interest.
Ethics Statement
This study utilizes entirely publicly available, de-identified transcriptomic data. No new human subjects were recruited, and no new primary clinical samples were collected for this analysis. Consequently, secondary ethical approval and informed consent were not required.
Abbreviations
| 2-AG | 2-arachidonoylglycerol |
| AEA | Anandamide |
| CP10k | Counts per 10,000 |
| CPM | Counts per million |
| DGIdb | Drug Gene Interaction Database |
| ECs | Endocannabinoids |
| ECS | Endocannabinoid system |
| EMT | Epithelial-to-mesenchymal transition |
| FDA | Food and Drug Administration |
| FDR | False discovery rate |
| GEO | Gene Expression Omnibus |
| GO | Gene Ontology |
| GPCRs | G-protein-coupled receptors |
| HS | Hidradenitis suppurativa |
| KEGG | Kyoto Encyclopedia of Genes and Genomes |
| mAbs | Monoclonal antibodies |
| MAD | Median absolute deviation |
| MNPs | Mononuclear phagocytes |
| scRNA-seq | Single-cell RNA-sequencing |
| scVI | Single-cell variational inference |
| TRP | Transient receptor potential |
| UMAP | Uniform manifold approximation and projection |
References
- Acharya, Prakash, and Mahesh Mathur. 2020. ‘Hidradenitis Suppurativa and Smoking: A Systematic Review and Meta-Analysis’. Journal of the American Academy of Dermatology 82 (4): 1006–11. [CrossRef]
- Ben-Shabat, S., E. Fride, T. Sheskin, et al. 1998. ‘An Entourage Effect: Inactive Endogenous Fatty Acid Glycerol Esters Enhance 2-Arachidonoyl-Glycerol Cannabinoid Activity’. European Journal of Pharmacology 353 (1): 23–31. [CrossRef]
- Bonn-Miller, Marcel O., Mahmoud ElSohly, Mallory J. E. Loflin, Suman Chandra, and Ryan Vandrey. 2018. ‘Cannabis and Cannabinoid Drug Development: Evaluating Botanical Versus Single Molecule Approaches’. International Review of Psychiatry (Abingdon, England) 30 (3): 277–84. [CrossRef]
- Carr, Lauren, David B. Parkinson, and Xin-peng Dun. 2017. ‘Expression Patterns of Slit and Robo Family Members in Adult Mouse Spinal Cord and Peripheral Nervous System’. PLOS ONE 12 (2): e0172736. [CrossRef]
- Chen, Edward Y., Christopher M. Tan, Yan Kou, et al. 2013. ‘Enrichr: Interactive and Collaborative HTML5 Gene List Enrichment Analysis Tool’. BMC Bioinformatics 14 (April): 128. [CrossRef]
- Dai, Peng, Peng Wang, Xin Chen, et al. 2025. ‘Mesencephalic Astrocyte-Derived Neurotrophic Factor (MANF) Restricts Inflammatory Progression through Limiting Macrophage Infiltration in DRG and Sciatic Nerve during Diabetic Peripheral Neuropathy’. ACS Chemical Neuroscience 16 (5): 945–59. [CrossRef]
- Fernandez, Jennifer M., Alyssa M. Thompson, Mark Borgstrom, Lauren A. V. Orenstein, Jennifer L. Hsiao, and Vivian Y. Shi. 2022. ‘Pain Management Modalities for Hidradenitis Suppurativa: A Patient Survey’. The Journal of Dermatological Treatment 33 (3): 1742–45. [CrossRef]
- Garg, Amit, Vassiliki Papagermanos, Margaretta Midura, Andrew Strunk, and Jonathan Merson. 2018. ‘Opioid, Alcohol, and Cannabis Misuse among Patients with Hidradenitis Suppurativa: A Population-Based Analysis in the United States’. Journal of the American Academy of Dermatology 79 (3): 495-500.e1. [CrossRef]
- Goel, Akash, Brandon McGuinness, Naheed K. Jivraj, et al. 2020. ‘Cannabis Use Disorder and Perioperative Outcomes in Major Elective Surgeries: A Retrospective Cohort Analysis’. Anesthesiology 132 (4): 625–35. [CrossRef]
- Gudjonsson, Johann E., Lam C. Tsoi, Feiyang Ma, et al. 2020. ‘Contribution of Plasma Cells and B Cells to Hidradenitis Suppurativa Pathogenesis’. JCI Insight 5 (19): e139930. [CrossRef]
- Hans, Guy, Kristof Deseure, and Hugo Adriaensen. 2008. ‘Endothelin-1-Induced Pain and Hyperalgesia: A Review of Pathophysiology, Clinical Manifestations and Future Therapeutic Options’. Neuropeptides 42 (2): 119–32. [CrossRef]
- Hu, Limin, and Junjie Chen. 2026. ‘Sez6l Promotes Neuropathic Pain via Wnt5a/Ca2+ Pathways in Dorsal Root Ganglion’. Frontiers in Genetics 17 (April). [CrossRef]
- Huang, Christina, Matthew Keller, and Sherry Yang. 2025. ‘Pain Self-Management Strategies for Hidradenitis Suppurativa Patients: An In-Person Survey Study’. Journal of Cutaneous Medicine and Surgery 29 (3): 259–62. [CrossRef]
- Iannotti, Fabio A., and Vincenzo Di Marzo. 2025. ‘The Endocannabinoidomes: Pharmacological Redundancy and Promiscuity, and Multi-Kingdom Variety of Sources and Molecular Targets’. Pharmacological Reviews 77 (4): 100070. [CrossRef]
- Kallenborn-Gerhardt, Wiebke, Stephan W. Hohmann, Katharina M. J. Syhr, et al. 2014. ‘Nox2-Dependent Signaling between Macrophages and Sensory Neurons Contributes to Neuropathic Pain Hypersensitivity’. Pain 155 (10): 2161–70. [CrossRef]
- Kashyap, Mahendra P., Rajesh Sinha, Safiya Haque, et al. 2026. ‘Metabolic Repression of Autophagy Drives Inflammation, Pain, and Malodor in Hidradenitis Suppurativa’. Preprint, bioRxiv, January 29. [CrossRef]
- Kim, Jaehwan, Jongmi Lee, Xuan Li, et al. 2023. ‘Single-Cell Transcriptomics Suggest Distinct Upstream Drivers of IL-17A/F in Hidradenitis versus Psoriasis’. The Journal of Allergy and Clinical Immunology 152 (3): 656–66. [CrossRef]
- Kim, Seong Rae, Young-Geun Choi, and Seong Jin Jo. 2024. ‘Smoking Cessation and Risk of Hidradenitis Suppurativa Development’. JAMA Dermatology 160 (10): 1056–65. [CrossRef]
- Koltai, Hinanit, and Dvora Namdar. 2020. ‘Cannabis Phytomolecule “Entourage”: From Domestication to Medical Use’. Trends in Plant Science 25 (10): 976–84. [CrossRef]
- Kuleshov, Maxim V., Matthew R. Jones, Andrew D. Rouillard, et al. 2016. ‘Enrichr: A Comprehensive Gene Set Enrichment Analysis Web Server 2016 Update’. Nucleic Acids Research 44 (W1): W90–97. [CrossRef]
- Lan, Zhou, Lvyi Chen, Jing Feng, et al. 2021. ‘Mechanosensitive TRPV4 Is Required for Crystal-Induced Inflammation’. Annals of the Rheumatic Diseases 80 (12): 1604–14. [CrossRef]
- Lesort, C., A. P. Villani, J. Giai, et al. 2019. ‘High Prevalence of Cannabis Use among Patients with Hidradenitis Suppurativa: Results from the VERADDICT Survey’. British Journal of Dermatology 181 (4): 839–41. [CrossRef]
- Liu, Huan, Tianjiao Xia, Fangxia Xu, Zhengliang Ma, and Xiaoping Gu. 2018. ‘Identification of the Key Genes Associated with Neuropathic Pain’. Molecular Medicine Reports 17 (5): 6371–78. [CrossRef]
- Lopez, Romain, Jeffrey Regier, Michael B. Cole, Michael I. Jordan, and Nir Yosef. 2018. ‘Deep Generative Modeling for Single-Cell Transcriptomics’. Nature Methods 15 (12): 1053–58. [CrossRef]
- Machado, Myrela O., Vicky Stergiopoulos, Michael Maes, et al. 2019. ‘Depression and Anxiety in Adults With Hidradenitis Suppurativa: A Systematic Review and Meta-Analysis’. JAMA Dermatology 155 (8): 939–45. [CrossRef]
- Martins, Ana M., Ana L. Gomes, Inês Vilas Boas, Joana Marto, and Helena M. Ribeiro. 2022. ‘Cannabis-Based Products for the Treatment of Skin Inflammatory Diseases: A Timely Review’. Pharmaceuticals 15 (2): 210. [CrossRef]
- Masuda, Tomoyuki, Keisuke Watanabe, Chie Sakuma, Kazuhiro Ikenaka, Katsuhiko Ono, and Hiroyuki Yaginuma. 2008. ‘Netrin-1 Acts as a Repulsive Guidance Cue for Sensory Axonal Projections toward the Spinal Cord’. Brief Communications. Journal of Neuroscience 28 (41): 10380–85. [CrossRef]
- Materazzi, Serena, Romina Nassini, Eunice Andrè, et al. 2008. ‘Cox-Dependent Fatty Acid Metabolites Cause Pain through Activation of the Irritant Receptor TRPA1’. Proceedings of the National Academy of Sciences 105 (33): 12045–50. [CrossRef]
- Merleev, Alexander, Antonio Ji-Xu, Atrin Toussi, et al. 2022. ‘Proprotein Convertase Subtilisin/Kexin Type 9 Is a Psoriasis-Susceptibility Locus That Is Negatively Related to IL36G’. JCI Insight 7 (16): e141193. [CrossRef]
- Metko, Dea, Shanti Mehta, and Vincent Piguet. 2024. ‘Cannabis Usage Among Patients With Hidradenitis Suppurativa: A Scoping Review’. Journal of Cutaneous Medicine and Surgery 28 (3): 307–8. [CrossRef]
- Montero-Vilchez, Trinidad, Pablo Diaz-Calvillo, Juan-Angel Rodriguez-Pozo, et al. 2021. ‘The Burden of Hidradenitis Suppurativa Signs and Symptoms in Quality of Life: Systematic Review and Meta-Analysis’. International Journal of Environmental Research and Public Health 18 (13): 6709. [CrossRef]
- Morozova, Veronika, Daniele Pellegata, Roch-Philippe Charles, and Jürg Gertsch. 2025. ‘Carboxylesterase 1-Mediated Endocannabinoid Metabolism in Skin: Role in Melanoma Progression in BRafV600E/Pten-/- Mice’. Cancer & Metabolism 13 (1): 8. [CrossRef]
- Muley, Milind M., Allison R. Reid, Bálint Botz, Kata Bölcskei, Zsuzsanna Helyes, and Jason J. McDougall. 2016. ‘Neutrophil Elastase Induces Inflammation and Pain in Mouse Knee Joints via Activation of Proteinase-Activated Receptor-2’. British Journal of Pharmacology 173 (4): 766–77. [CrossRef]
- Murray, Peter J. 2017. ‘Macrophage Polarization’. Annual Review of Physiology 79 (February): 541–66. [CrossRef]
- Ning, Wan-Ru, Da Jiang, Xing-Chen Liu, et al. 2022. ‘Carbonic Anhydrase XII Mediates the Survival and Prometastatic Functions of Macrophages in Human Hepatocellular Carcinoma’. The Journal of Clinical Investigation 132 (7): e153110. [CrossRef]
- Orenstein, Lauren A. V., Nicole Salame, Meron R. Siira, et al. 2023. ‘Pain Experiences among Those Living with Hidradenitis Suppurativa: A Qualitative Study’. British Journal of Dermatology 188 (1): 41–51. [CrossRef]
- Pagano, Cristina, Giovanna Navarra, Laura Coppola, Giorgio Avilia, Maurizio Bifulco, and Chiara Laezza. 2022. ‘Cannabinoids: Therapeutic Use in Clinical Practice’. International Journal of Molecular Sciences 23 (6): 3344. [CrossRef]
- Patel, Kevin R., Harrison H. Lee, Supriya Rastogi, et al. 2020. ‘Association between Hidradenitis Suppurativa, Depression, Anxiety, and Suicidality: A Systematic Review and Meta-Analysis’. Journal of the American Academy of Dermatology 83 (3): 737–44. [CrossRef]
- Penno, Carlos A., Petra Jäger, Claire Laguerre, et al. 2020. ‘Lipidomics Profiling of Hidradenitis Suppurativa Skin Lesions Reveals Lipoxygenase Pathway Dysregulation and Accumulation of Proinflammatory Leukotriene B4’. Journal of Investigative Dermatology 140 (12): 2421-2432.e10. [CrossRef]
- Radhakrishna, Uppala, Murali R. Kuracha, Iltefat Hamzavi, et al. 2025. ‘Impaired Molecular Mechanisms Contributing to Chronic Pain in Patients with Hidradenitis Suppurativa: Exploring Potential Biomarkers and Therapeutic Targets’. International Journal of Molecular Sciences 26 (3): 1039. [CrossRef]
- Ring, Hans C., Henrik Sørensen, Iben M. Miller, Emil K. List, Ditte M. Saunte, and Gregor B. Jemec. 2016. ‘Pain in Hidradenitis Suppurativa: A Pilot Study’. Acta Dermato-Venereologica 96 (4): 554–56. [CrossRef]
- Río, Carmen del, Estrella Millán, Víctor García, Giovanni Appendino, Jim DeMesa, and Eduardo Muñoz. 2018. ‘The Endocannabinoid System of the Skin. A Potential Approach for the Treatment of Skin Disorders’. Biochemical Pharmacology, Cannabinoid Pharmacology and Therapeutics in Spain, vol. 157 (November): 122–33. [CrossRef]
- Russo, Ethan B. 2011. ‘Taming THC: Potential Cannabis Synergy and Phytocannabinoid-Terpenoid Entourage Effects’. British Journal of Pharmacology 163 (7): 1344–64. [CrossRef]
- Sabat, Robert, Afsaneh Alavi, Kerstin Wolk, et al. 2025. ‘Hidradenitis Suppurativa’. The Lancet 405 (10476): 420–38. [CrossRef]
- Sakakima, Harutoshi, Yoshihiro Yoshida, Yoshiki Yamazaki, et al. 2009. ‘Disruption of the Midkine Gene (Mdk) Delays Degeneration and Regeneration in Injured Peripheral Nerve’. Journal of Neuroscience Research 87 (13): 2908–15. [CrossRef]
- Salvemini, Daniela, Timothy Doyle, Michaela Kress, and Grant Nicol. 2013. ‘Therapeutic Targeting of the Ceramide-to-Sphingosine 1-Phosphate Pathway in Pain’. Trends in Pharmacological Sciences 34 (2): 110–18. [CrossRef]
- Scholz, Joachim, and Clifford J. Woolf. 2002. ‘Can We Conquer Pain?’ Nature Neuroscience 5 Suppl (November): 1062–67. [CrossRef]
- Straalen, Kelsey R. van, Feiyang Ma, Pei-Suen Tsou, et al. 2024. ‘Single-Cell Sequencing Reveals Hippo Signaling as a Driver of Fibrosis in Hidradenitis Suppurativa’. The Journal of Clinical Investigation 134 (3): e169225. [CrossRef]
- Szepietowska, Marta, Piotr K. Krajewski, Przemyslaw Pacan, Anna Wojas-Pelc, Lukasz Matusiak, and Andrzej K. Jaworek. 2026. ‘A Cross-Sectional Study on Relationships Between Depression and Anxiety in Hidradenitis Suppurativa Patients and Disease Severity, Subjective Symptoms and Quality of Life’. Journal of Clinical Medicine 15 (2): 700. [CrossRef]
- The Tabula Sapiens Consortium, Robert C. Jones, Jim Karkanias, et al. 2022. ‘The Tabula Sapiens: A Multiple-Organ, Single-Cell Transcriptomic Atlas of Humans’. Science 376 (6594): eabl4896. [CrossRef]
- Thorlacius, Linnea, Arnon D. Cohen, Gunnar H. Gislason, Gregor B. E. Jemec, and Alexander Egeberg. 2018. ‘Increased Suicide Risk in Patients with Hidradenitis Suppurativa’. The Journal of Investigative Dermatology 138 (1): 52–57. [CrossRef]
- Tóth, Kinga Fanni, Dorottya Ádám, Tamás Bíró, and Attila Oláh. 2019. ‘Cannabinoid Signaling in the Skin: Therapeutic Potential of the “C(Ut)Annabinoid” System’. Molecules 24 (5): 918. [CrossRef]
- Uhlén, Mathias, Linn Fagerberg, Björn M. Hallström, et al. 2015. ‘Tissue-Based Map of the Human Proteome’. Science 347 (6220): 1260419. [CrossRef]
- Weizman, Libat, Lior Dayan, Silviu Brill, et al. 2018. ‘Cannabis Analgesia in Chronic Neuropathic Pain Is Associated with Altered Brain Connectivity’. Neurology 91 (14): e1285–94. [CrossRef]
- Welling, Matthew T., Lei Liu, Tim Shapter, Carolyn A. Raymond, and Graham J. King. 2016. ‘Characterisation of Cannabinoid Composition in a Diverse Cannabis Sativa L. Germplasm Collection’. Euphytica 208 (3): 463–75. [CrossRef]
- Wilson, Sarah R., Lydia Thé, Lyn M. Batia, et al. 2013. ‘The Epithelial Cell-Derived Atopic Dermatitis Cytokine TSLP Activates Neurons to Induce Itch’. Cell 155 (2): 285–95. [CrossRef]
- Wishart, David S., Craig Knox, An Chi Guo, et al. 2006. ‘DrugBank: A Comprehensive Resource for in Silico Drug Discovery and Exploration’. Nucleic Acids Research 34 (suppl_1): D668–72. [CrossRef]
- Wolock, Samuel L., Romain Lopez, and Allon M. Klein. 2019. ‘Scrublet: Computational Identification of Cell Doublets in Single-Cell Transcriptomic Data’. Cell Systems 8 (4): 281-291.e9. [CrossRef]
- Xie, Zhuorui, Allison Bailey, Maxim V. Kuleshov, et al. 2021. ‘Gene Set Knowledge Discovery with Enrichr’. Current Protocols 1 (3): e90. [CrossRef]
- Yamanaka, Hiroki, Koichi Obata, Tetsuo Fukuoka, et al. 2004. ‘Tissue Plasminogen Activator in Primary Afferents Induces Dorsal Horn Excitability and Pain Response after Peripheral Nerve Injury’. The European Journal of Neuroscience 19 (1): 93–102. [CrossRef]
- Yoshikawa, Reiko, and Jun Katada. 2019. ‘Effects of Active Smoking on Postoperative Outcomes in Hospitalised Patients Undergoing Elective Surgery: A Retrospective Analysis of an Administrative Claims Database in Japan’. BMJ Open 9 (10): e029913. [CrossRef]
- Zhang, Wandong, Qing Yan Liu, Arsalan S. Haqqani, et al. 2020. ‘Differential Expression of Receptors Mediating Receptor-Mediated Transcytosis (RMT) in Brain Microvessels, Brain Parenchyma and Peripheral Tissues of the Mouse and the Human’. Fluids and Barriers of the CNS 17 (1): 47. [CrossRef]
- Zhao, Peishen, TinaMarie Lieu, Nicholas Barlow, et al. 2014. ‘Cathepsin S Causes Inflammatory Pain via Biased Agonism of PAR2 and TRPV4’. The Journal of Biological Chemistry 289 (39): 27215–34. [CrossRef]
- Zouboulis, C. C., F. G. Bechara, F. Benhadou, et al. 2025. ‘European S2k Guidelines for Hidradenitis Suppurativa/Acne Inversa Part 2: Treatment’. Journal of the European Academy of Dermatology and Venereology 39 (5): 899–941. [CrossRef]
Figure 1.
Endocannabinoid system expression in circulation and the cutaneous cells. Baseline transcription of the 18-gene cannabinoid and endocannabinoidome panel (canonical cannabinoid receptors CNR1 and CNR2, putative receptors GPR55 and GPR18, sensory ion channels TRPV1 and TRPA1, nuclear receptors PPARA, PPARD, and PPARG, and metabolic enzymes NAPEPLD, DAGLA, DAGLB, FAAH, MGLL, ABHD6, ABHD12, CES1, and CES2) across annotated cell types of (a) human blood and (b) human skin. Four housekeeping reference genes (ACTB, B2M, GAPDH, RPL13A). Data were derived from the Tabula Sapiens single-cell RNA sequencing reference atlases (The Tabula Sapiens Consortium et al. 2022), a standardized multi-organ human cohort of 15 healthy donors. Expression is reported from the log-normalized counts-per-10,000 layer (log1p(CP10k)). Cells with mitochondrial transcript fraction above 5% in blood or 10% in skin were excluded prior to display. Cell types were retained only when at least three donors each contributed at least ten cells. Under this gate, 13 of 16 annotated blood cell types (72,837 cells) and 14 of 23 annotated skin cell types (17,546 cells) were evaluable and are shown.
Figure 1.
Endocannabinoid system expression in circulation and the cutaneous cells. Baseline transcription of the 18-gene cannabinoid and endocannabinoidome panel (canonical cannabinoid receptors CNR1 and CNR2, putative receptors GPR55 and GPR18, sensory ion channels TRPV1 and TRPA1, nuclear receptors PPARA, PPARD, and PPARG, and metabolic enzymes NAPEPLD, DAGLA, DAGLB, FAAH, MGLL, ABHD6, ABHD12, CES1, and CES2) across annotated cell types of (a) human blood and (b) human skin. Four housekeeping reference genes (ACTB, B2M, GAPDH, RPL13A). Data were derived from the Tabula Sapiens single-cell RNA sequencing reference atlases (The Tabula Sapiens Consortium et al. 2022), a standardized multi-organ human cohort of 15 healthy donors. Expression is reported from the log-normalized counts-per-10,000 layer (log1p(CP10k)). Cells with mitochondrial transcript fraction above 5% in blood or 10% in skin were excluded prior to display. Cell types were retained only when at least three donors each contributed at least ten cells. Under this gate, 13 of 16 annotated blood cell types (72,837 cells) and 14 of 23 annotated skin cell types (17,546 cells) were evaluable and are shown.
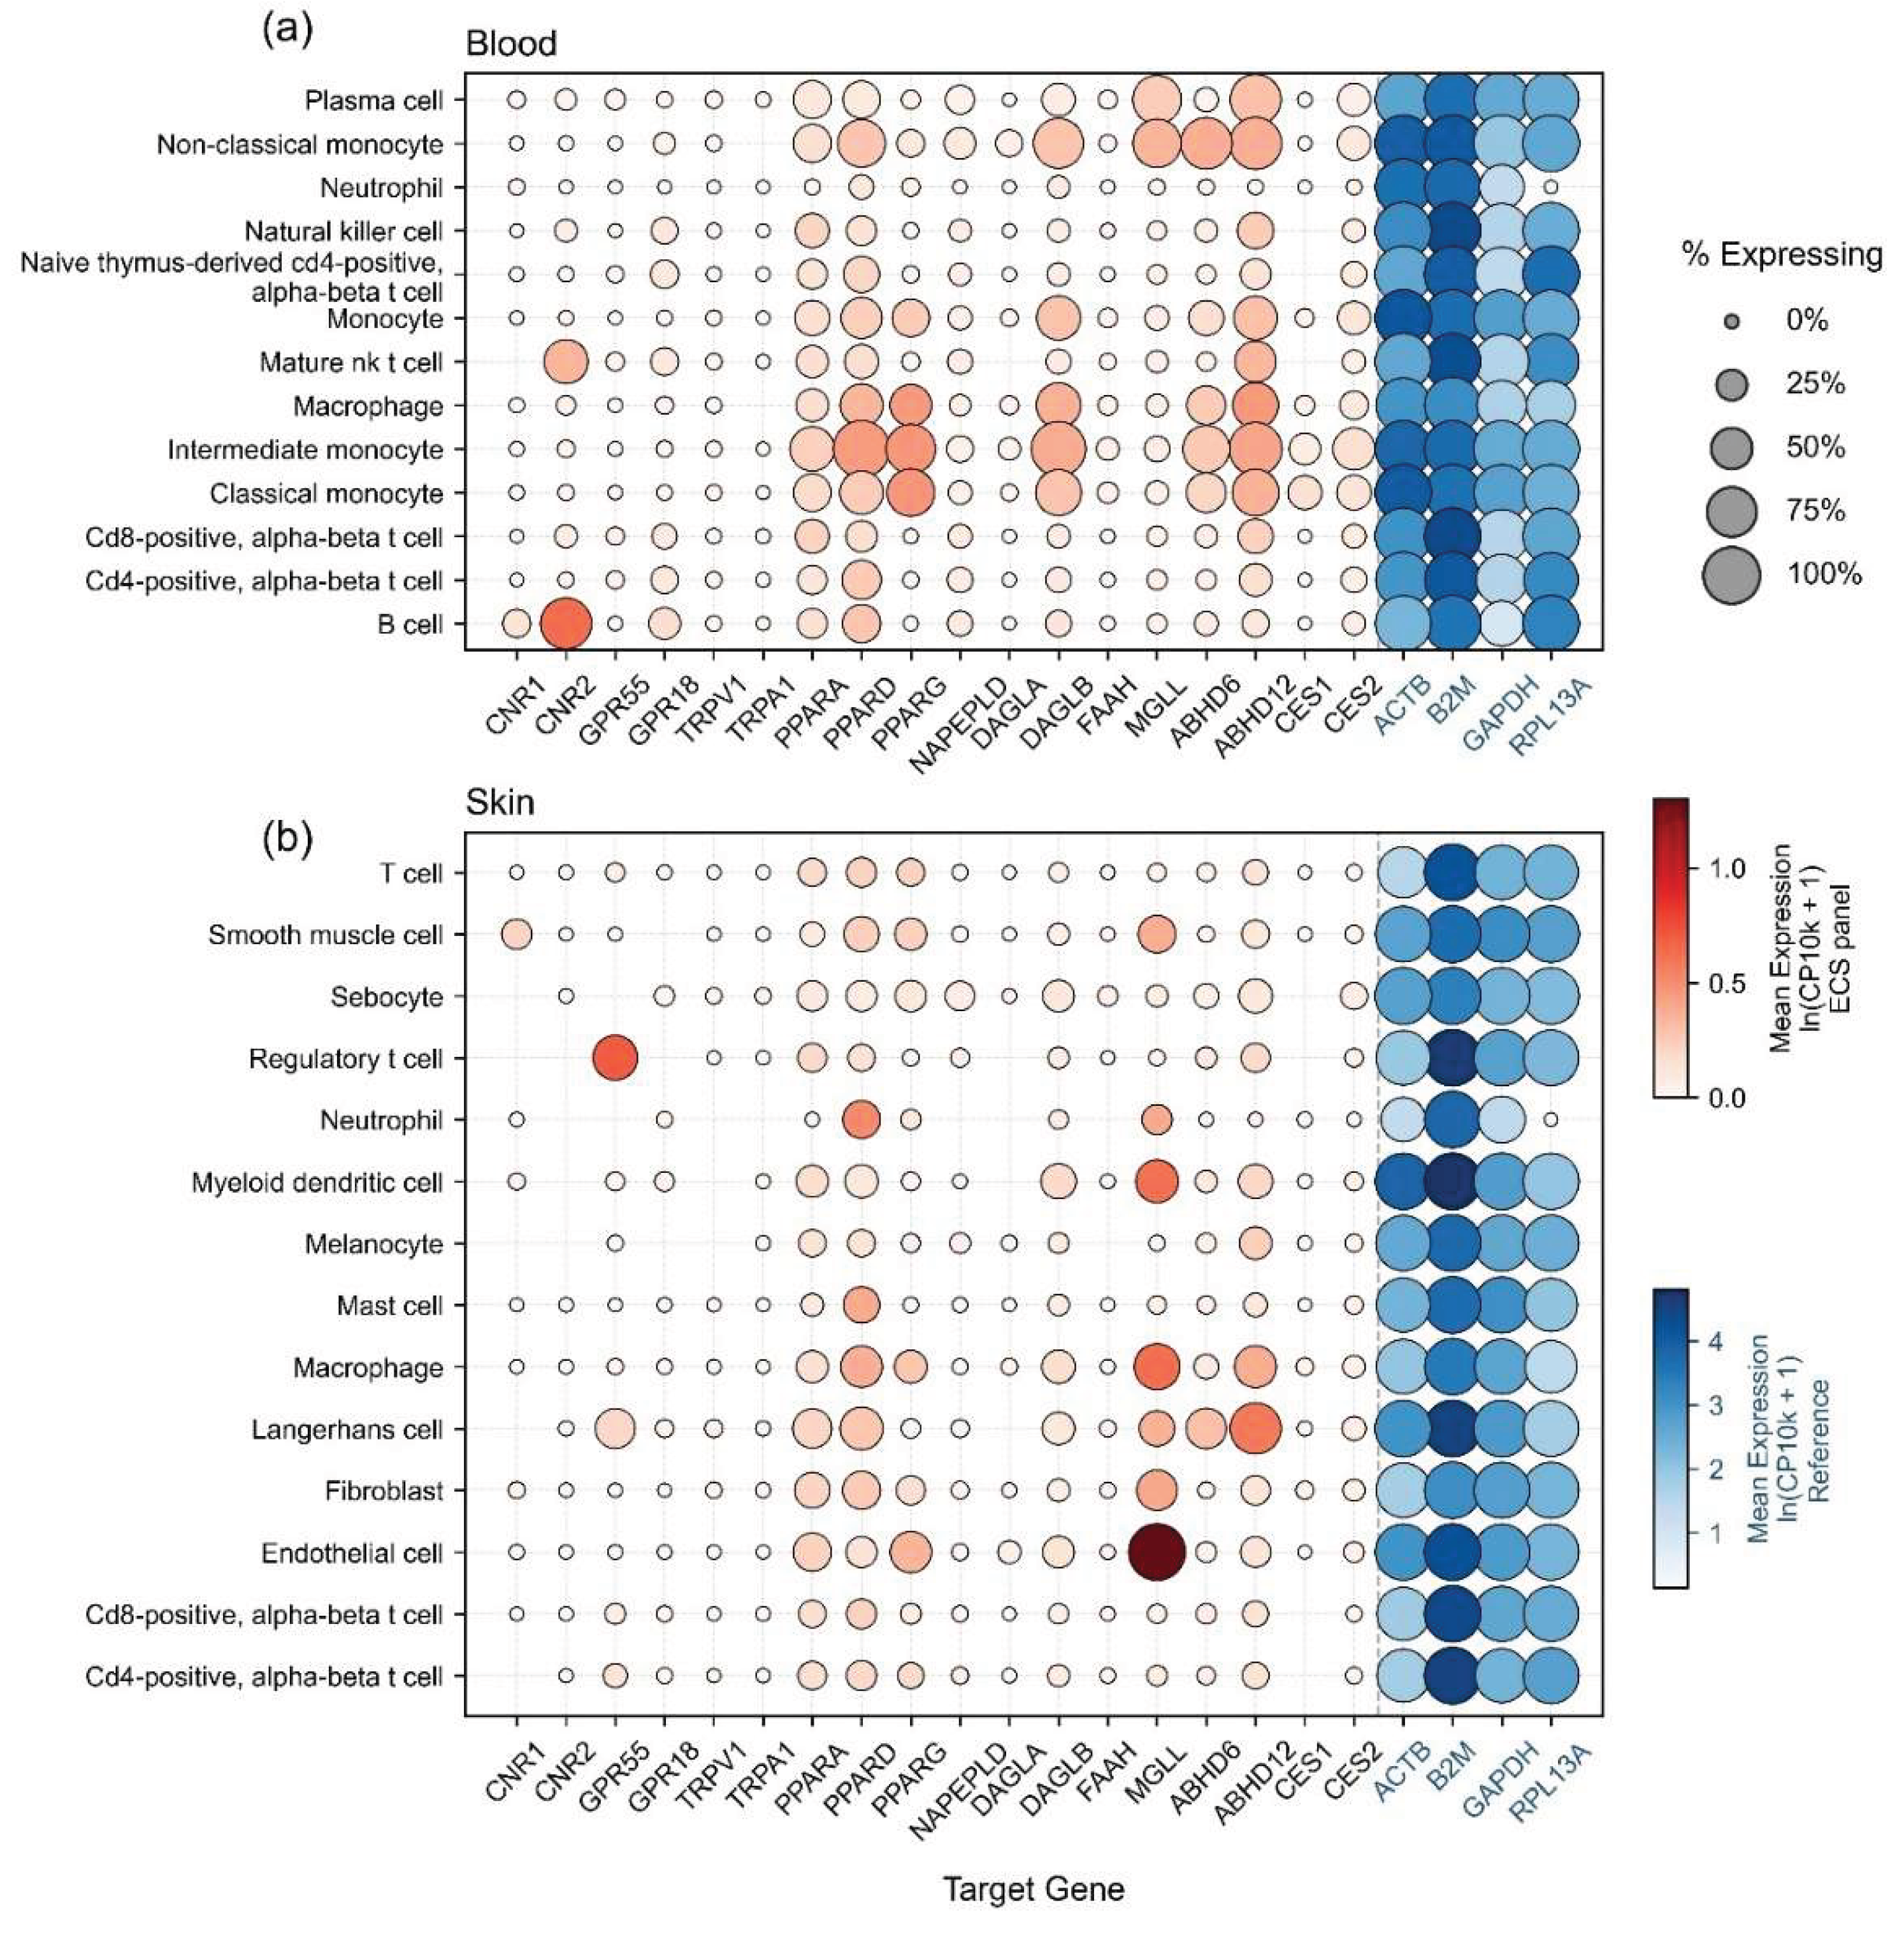
Figure 2.
Pseudobulk transcriptomic architecture in the cutaneous microenvironment. (a) Immune transcript burden per gene, quantified as the sum of pseudobulk transcripts (linear counts per 10,000, summed across donors and multiplied by cell count) across all power-gate-passing immune lineages in skin. (b) Scatter of each gene's total skin transcript burden (x-axis, log scale) against the proportion of that burden originating from immune lineages (y-axis, linear). (c) Stacked bar distribution showing, for each of the 18 endocannabinoid system panel genes, the relative apportionment of expression across the five power-gate-passing cutaneous master lineages. Lineages and their constituent cell types are: T-Lymphocyte (CD4-positive alpha-beta T cells, CD8-positive alpha-beta T cells, T cells, regulatory T cells); Myeloid and Antigen Presenting (Langerhans cells, macrophages, myeloid dendritic cells); Granulocyte (mast cells, neutrophils); Stroma and Vasculature (endothelial cells, fibroblasts, smooth muscle cells); and Epithelial and Barrier (melanocytes, sebocytes). The B-Lymphocyte (B cells, plasma cells) and Innate Lymphoid (natural killer cells, mature natural killer T cells) lineages failed the power gate in the Tabula Sapiens skin cohort (fewer than three donors contributed at least ten cells for any of their constituent cell types) and are not represented in this panel. (d, e) Dual-metric butterfly plots. Data were derived from the Tabula Sapiens v1 single-cell RNA sequencing reference atlas of human skin (The Tabula Sapiens Consortium et al. 2022), contributed by four healthy donors (TSP2, TSP10, TSP14, TSP21) from the broader Tabula Sapiens cohort.
Figure 2.
Pseudobulk transcriptomic architecture in the cutaneous microenvironment. (a) Immune transcript burden per gene, quantified as the sum of pseudobulk transcripts (linear counts per 10,000, summed across donors and multiplied by cell count) across all power-gate-passing immune lineages in skin. (b) Scatter of each gene's total skin transcript burden (x-axis, log scale) against the proportion of that burden originating from immune lineages (y-axis, linear). (c) Stacked bar distribution showing, for each of the 18 endocannabinoid system panel genes, the relative apportionment of expression across the five power-gate-passing cutaneous master lineages. Lineages and their constituent cell types are: T-Lymphocyte (CD4-positive alpha-beta T cells, CD8-positive alpha-beta T cells, T cells, regulatory T cells); Myeloid and Antigen Presenting (Langerhans cells, macrophages, myeloid dendritic cells); Granulocyte (mast cells, neutrophils); Stroma and Vasculature (endothelial cells, fibroblasts, smooth muscle cells); and Epithelial and Barrier (melanocytes, sebocytes). The B-Lymphocyte (B cells, plasma cells) and Innate Lymphoid (natural killer cells, mature natural killer T cells) lineages failed the power gate in the Tabula Sapiens skin cohort (fewer than three donors contributed at least ten cells for any of their constituent cell types) and are not represented in this panel. (d, e) Dual-metric butterfly plots. Data were derived from the Tabula Sapiens v1 single-cell RNA sequencing reference atlas of human skin (The Tabula Sapiens Consortium et al. 2022), contributed by four healthy donors (TSP2, TSP10, TSP14, TSP21) from the broader Tabula Sapiens cohort.
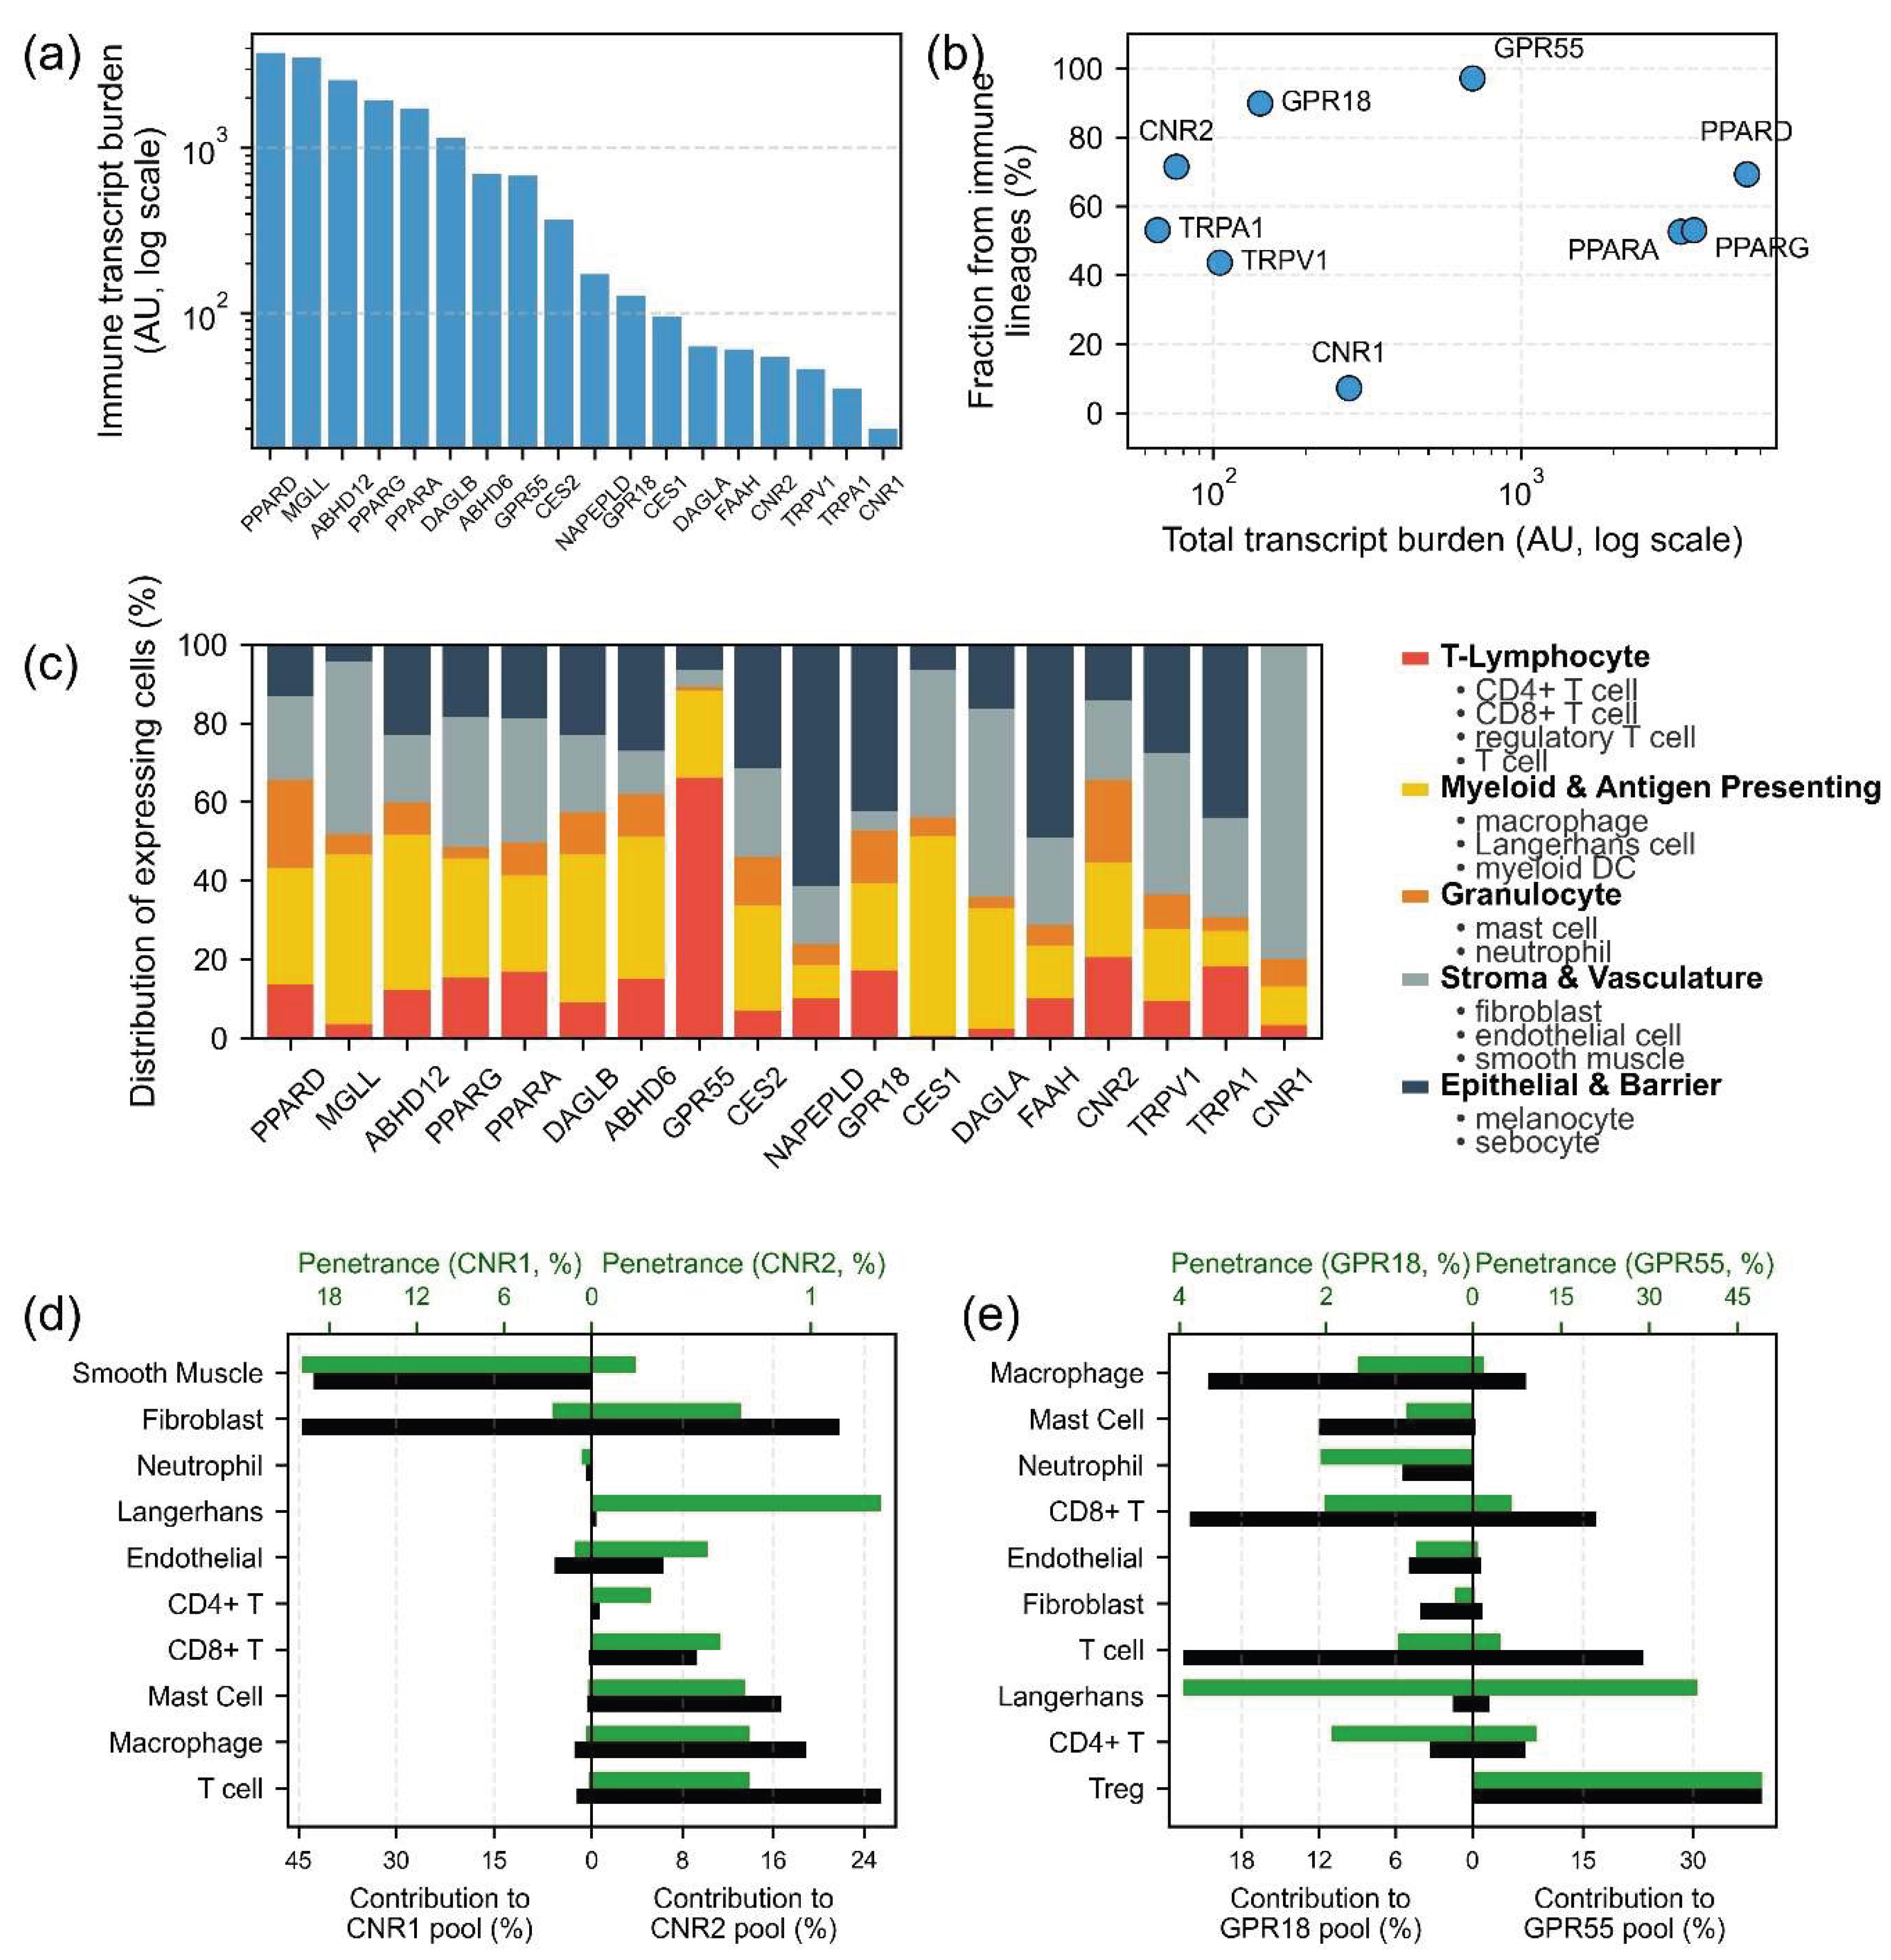
Figure 3.
Bulk transcriptional reorganization of the endocannabinoid system and lipid mediator panel in hidradenitis suppurativa lesional skin and matched whole blood. Expression profiles of the 18-gene endocannabinoid panel and the 15-gene lipid mediator panel across clinical compartments, derived from GSE154773. Panels display DESeq2 size-factor-normalized counts for the endocannabinoid panel in (a) lesional skin (22 hidradenitis suppurativa patients versus 10 healthy donors) and (b) matched whole blood (21 hidradenitis suppurativa patients versus 10 healthy donors). The lipid mediator panel is displayed correspondingly for (c) lesional skin and (d) matched whole blood. Boxplots indicate the median and interquartile range, with overlaid scatter points representing individual patient biological replicates. Differential expression was computed using PyDESeq2 v0.5.4 utilizing a negative-binomial Wald test with apeglm-style log fold-change shrinkage applied separately to each tissue. Statistical significance is reported at the panel level using a unified Benjamini-Hochberg false discovery rate across N = 66 panel by tissue tests, applied without an additional effect-size cutoff because each panel gene was selected a priori on biological grounds. Asterisks denote significance bins: *** panel padj < 0.001, ** panel padj < 0.01, * panel padj < 0.05, and the dot symbol (.) marks panel padj between 0.05 and 0.10. The pipeline was independently validated against 17 markers with directions and fold-changes explicitly reported by Gudjonsson et al. (2020), all of which reproduced the expected direction and magnitude.
Figure 3.
Bulk transcriptional reorganization of the endocannabinoid system and lipid mediator panel in hidradenitis suppurativa lesional skin and matched whole blood. Expression profiles of the 18-gene endocannabinoid panel and the 15-gene lipid mediator panel across clinical compartments, derived from GSE154773. Panels display DESeq2 size-factor-normalized counts for the endocannabinoid panel in (a) lesional skin (22 hidradenitis suppurativa patients versus 10 healthy donors) and (b) matched whole blood (21 hidradenitis suppurativa patients versus 10 healthy donors). The lipid mediator panel is displayed correspondingly for (c) lesional skin and (d) matched whole blood. Boxplots indicate the median and interquartile range, with overlaid scatter points representing individual patient biological replicates. Differential expression was computed using PyDESeq2 v0.5.4 utilizing a negative-binomial Wald test with apeglm-style log fold-change shrinkage applied separately to each tissue. Statistical significance is reported at the panel level using a unified Benjamini-Hochberg false discovery rate across N = 66 panel by tissue tests, applied without an additional effect-size cutoff because each panel gene was selected a priori on biological grounds. Asterisks denote significance bins: *** panel padj < 0.001, ** panel padj < 0.01, * panel padj < 0.05, and the dot symbol (.) marks panel padj between 0.05 and 0.10. The pipeline was independently validated against 17 markers with directions and fold-changes explicitly reported by Gudjonsson et al. (2020), all of which reproduced the expected direction and magnitude.
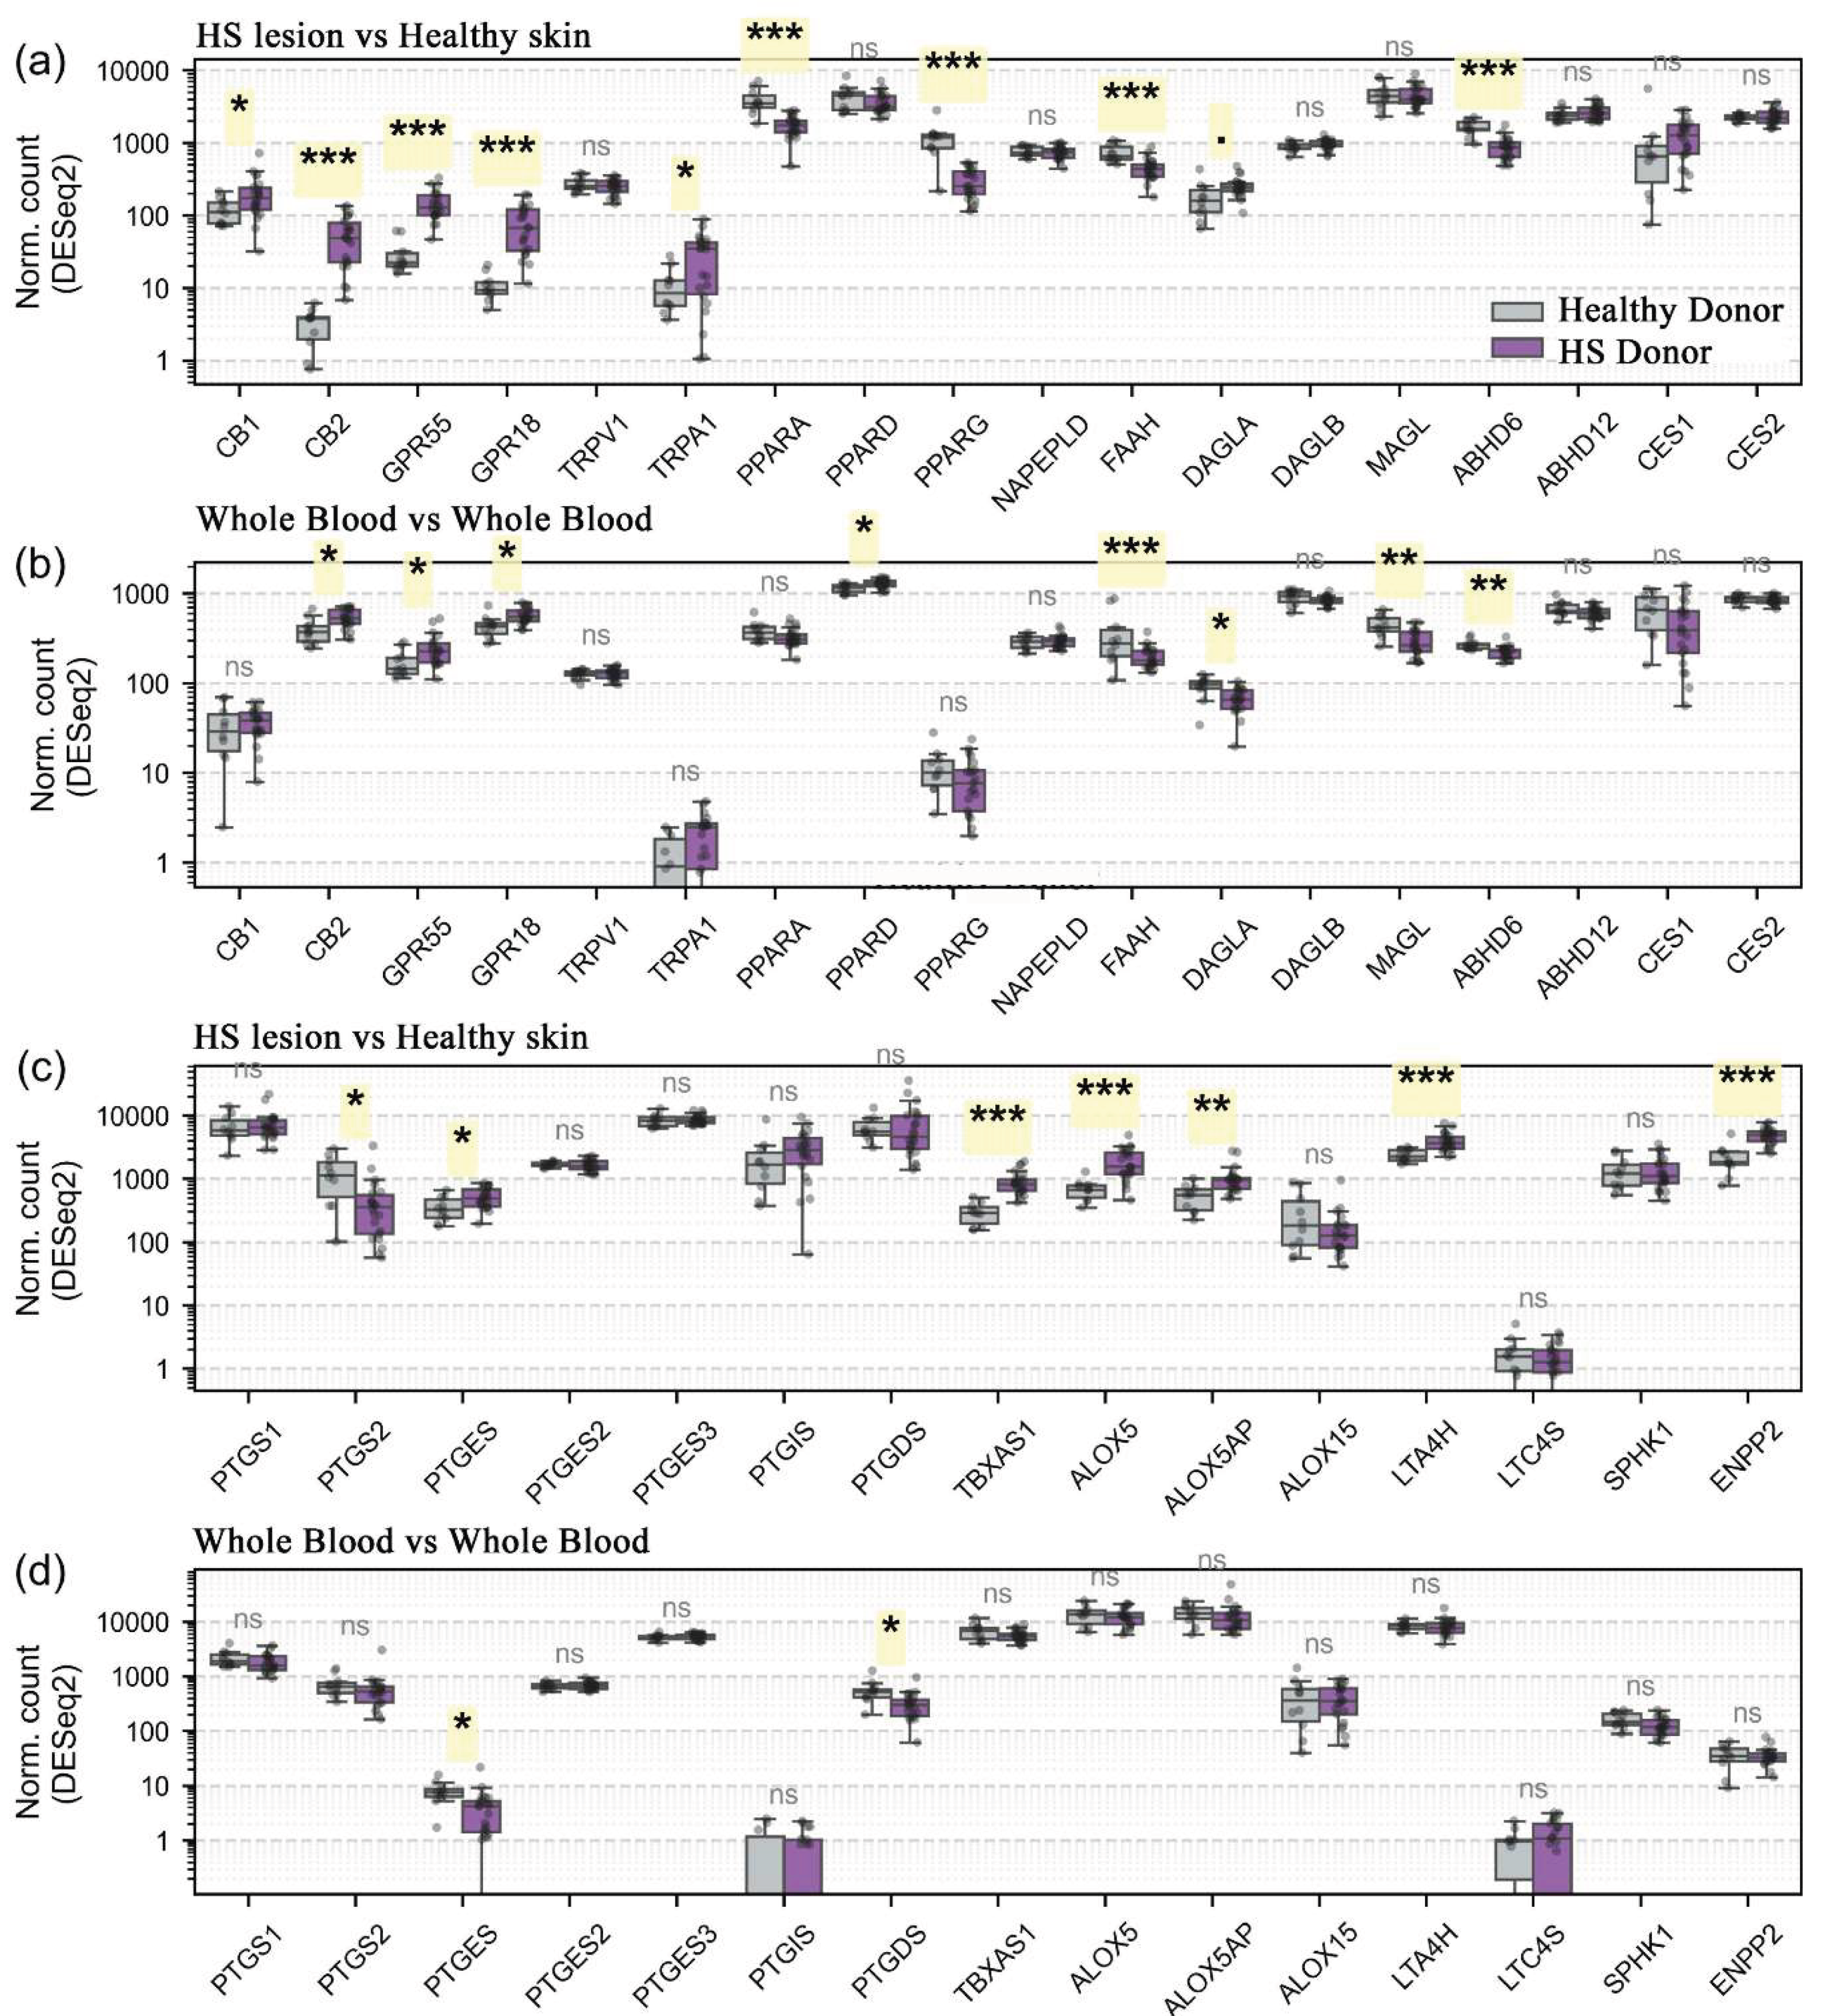
Figure 4.
Cell-type-specific differential expression of pain network genes in keratinocytes, T cells, and mononuclear phagocytes across hidradenitis suppurativa, psoriasis, and healthy skin. Single-cell transcriptomic data were restricted to a curated 101-gene panel of neuro-immune signaling and matrix remodeling targets. (a, c, e) Uniform manifold approximation and projection (UMAP) embeddings of the integrated global atlas. (b, d, f, h) Pseudobulk expression for significantly regulated pain-network genes across healthy, psoriasis, and hidradenitis suppurativa conditions, in the keratinocyte (b), T cell (d), and mononuclear phagocyte (f) compartments. Boxplots display the median and interquartile range; overlaid points represent individual patient pseudobulk values. (g) Genome-wide differential expression volcano plot for the mononuclear phagocyte compartment comparing hidradenitis suppurativa lesions to healthy controls. The 101 pain-network genes are highlighted in red and all other detected genes are shown in grey as the transcriptome-wide background. Data were derived from GSE220116 (J. Kim et al. 2023). Differential expression was computed at patient-level pseudobulk resolution using a negative binomial generalized linear model (PyDESeq2) with Benjamini-Hochberg false discovery rate correction applied within each contrast. A minimum-cells threshold of ≥ 10 cells per patient per compartment and a power gate of ≥ 3 valid replicates per condition were applied before statistical modeling. Patients per compartment (HS / healthy / psoriasis): keratinocytes 8/10/10, T cells 8/7/10, mononuclear phagocytes 7/7/10. Gene identifiers are HGNC-approved symbols. (#) hidradenitis suppurativa versus healthy contrast, (+) psoriasis versus healthy contrast, and (*) denote the hidradenitis suppurativa versus psoriasis contrast. A single symbol indicates Q < 0.05, two symbols indicate Q < 0.01, and three symbols indicate Q < 0.001.
Figure 4.
Cell-type-specific differential expression of pain network genes in keratinocytes, T cells, and mononuclear phagocytes across hidradenitis suppurativa, psoriasis, and healthy skin. Single-cell transcriptomic data were restricted to a curated 101-gene panel of neuro-immune signaling and matrix remodeling targets. (a, c, e) Uniform manifold approximation and projection (UMAP) embeddings of the integrated global atlas. (b, d, f, h) Pseudobulk expression for significantly regulated pain-network genes across healthy, psoriasis, and hidradenitis suppurativa conditions, in the keratinocyte (b), T cell (d), and mononuclear phagocyte (f) compartments. Boxplots display the median and interquartile range; overlaid points represent individual patient pseudobulk values. (g) Genome-wide differential expression volcano plot for the mononuclear phagocyte compartment comparing hidradenitis suppurativa lesions to healthy controls. The 101 pain-network genes are highlighted in red and all other detected genes are shown in grey as the transcriptome-wide background. Data were derived from GSE220116 (J. Kim et al. 2023). Differential expression was computed at patient-level pseudobulk resolution using a negative binomial generalized linear model (PyDESeq2) with Benjamini-Hochberg false discovery rate correction applied within each contrast. A minimum-cells threshold of ≥ 10 cells per patient per compartment and a power gate of ≥ 3 valid replicates per condition were applied before statistical modeling. Patients per compartment (HS / healthy / psoriasis): keratinocytes 8/10/10, T cells 8/7/10, mononuclear phagocytes 7/7/10. Gene identifiers are HGNC-approved symbols. (#) hidradenitis suppurativa versus healthy contrast, (+) psoriasis versus healthy contrast, and (*) denote the hidradenitis suppurativa versus psoriasis contrast. A single symbol indicates Q < 0.05, two symbols indicate Q < 0.01, and three symbols indicate Q < 0.001.
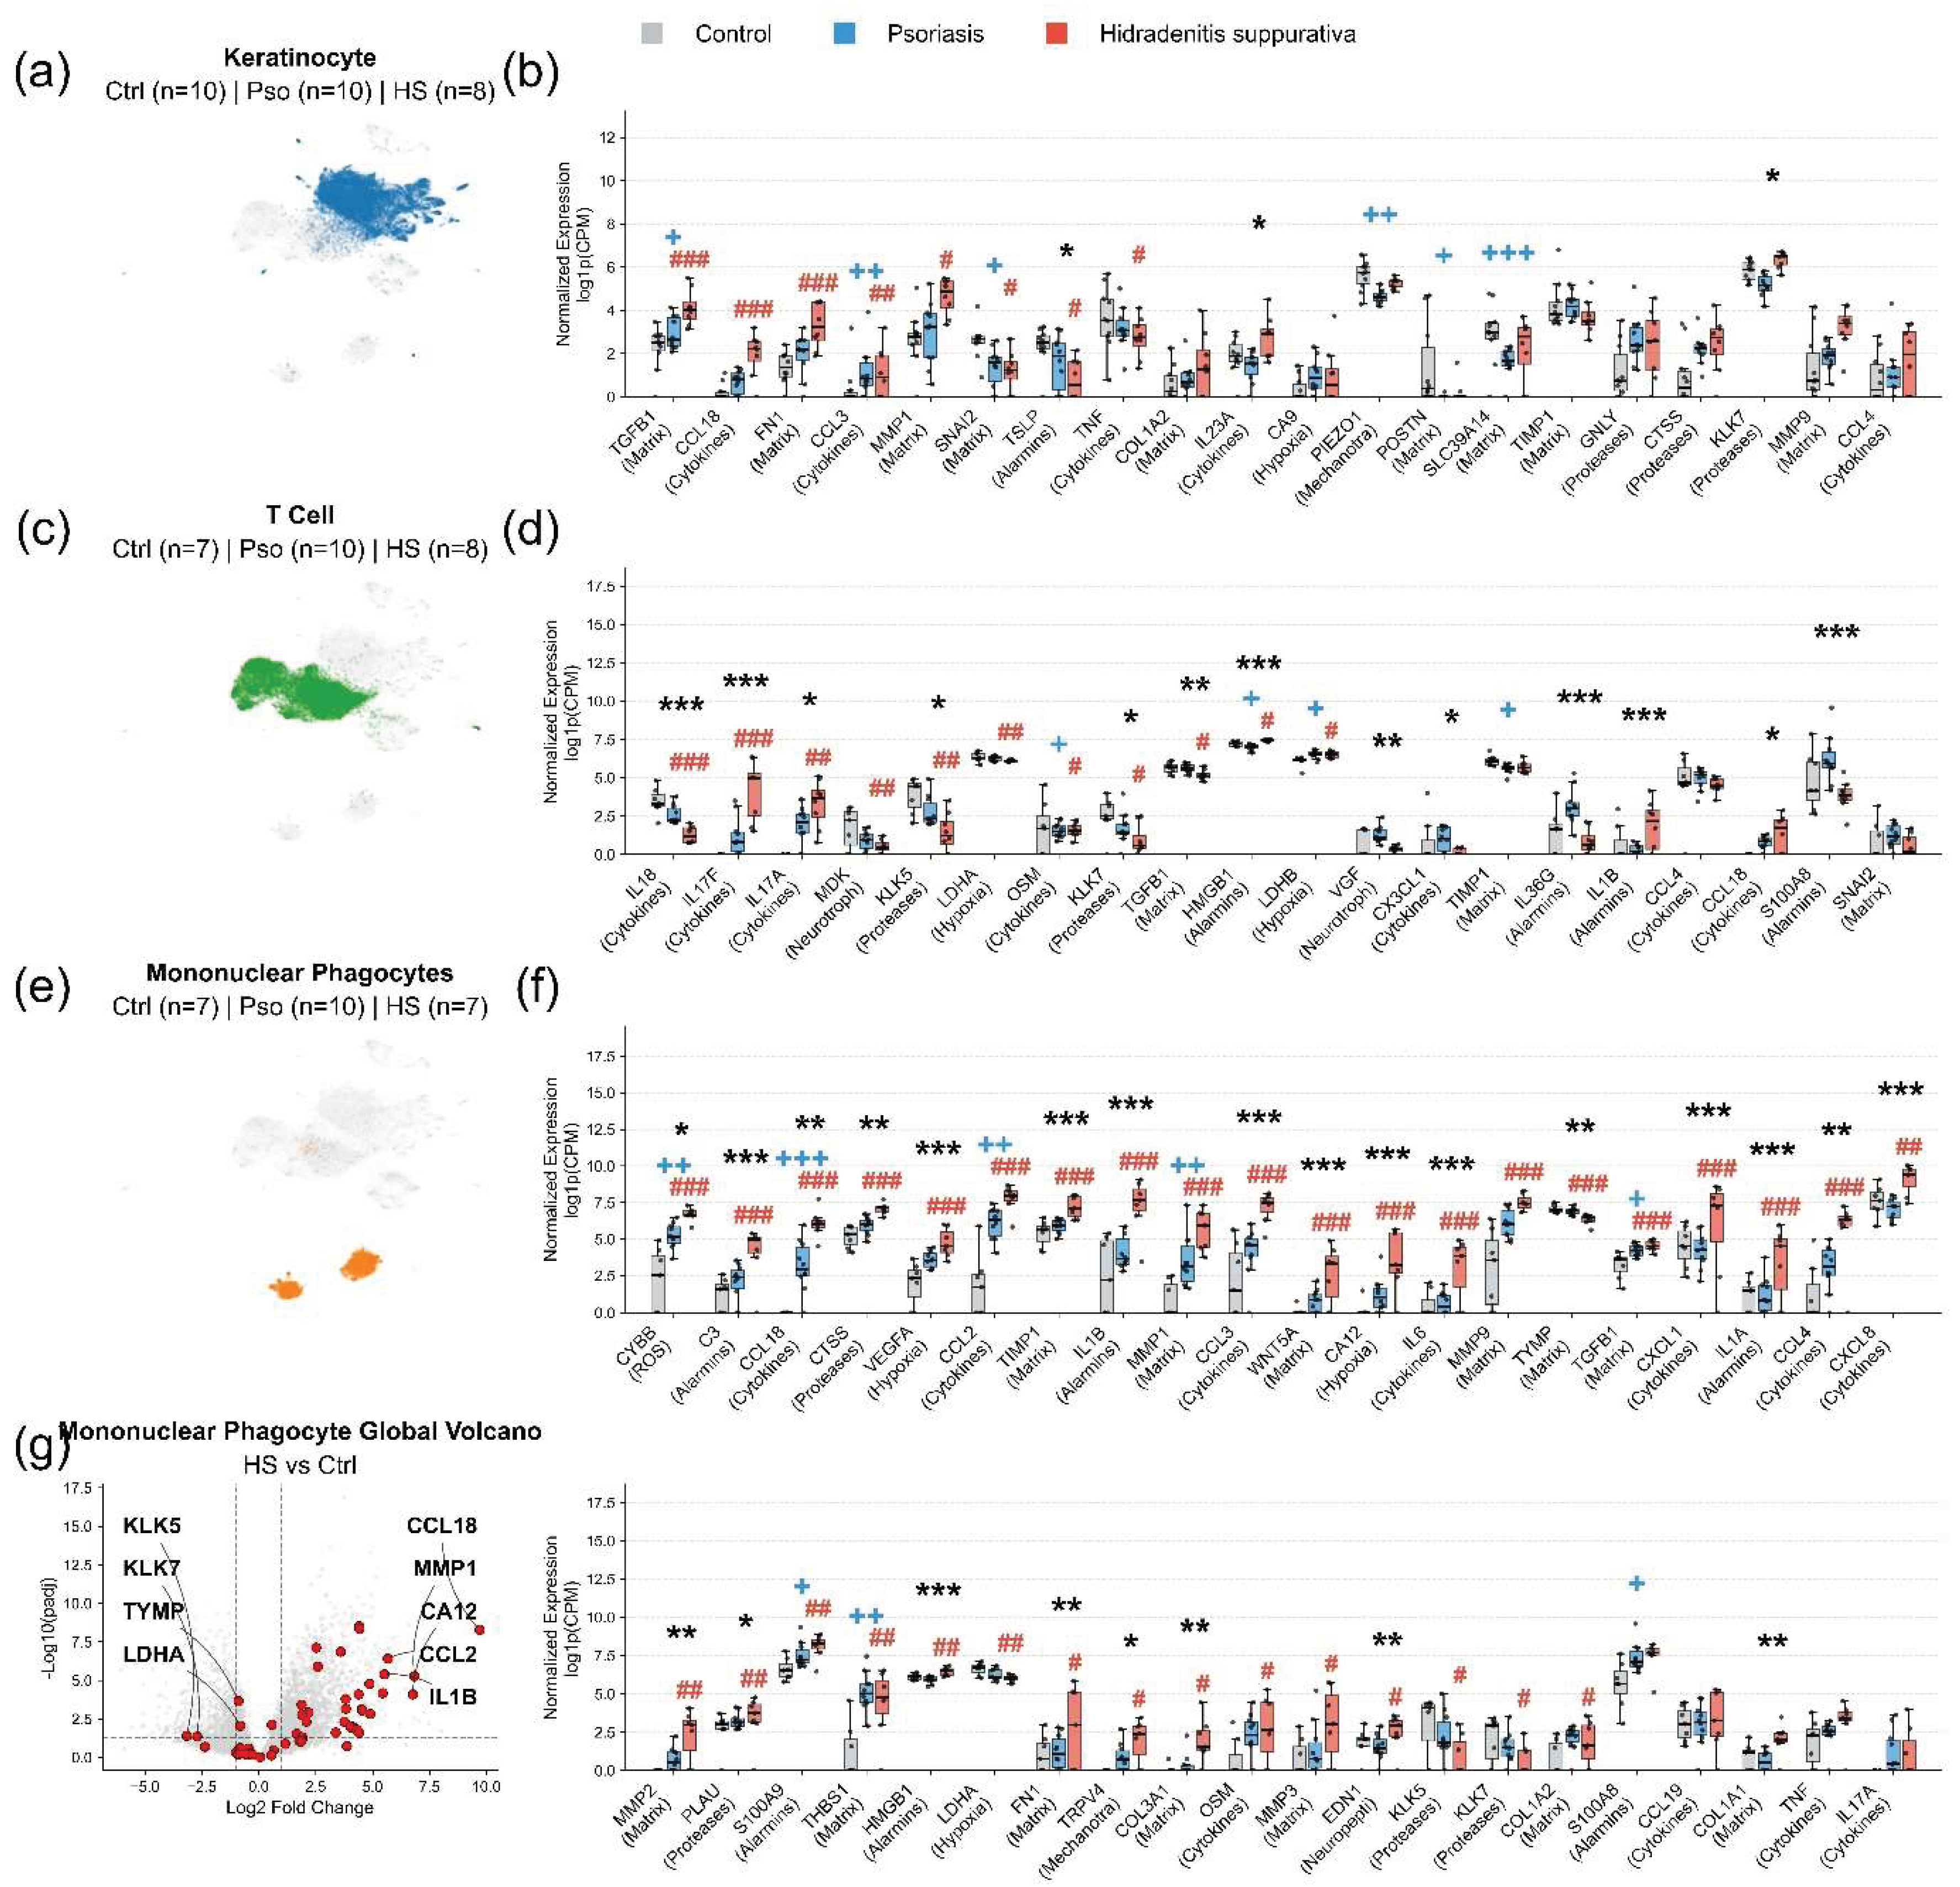
Figure 5.
Lipid mediator response and B cell maturation in the skin. Single-cell transcriptomic data were derived from GSE220116 (J. Kim et al. 2023). (a) Genome-wide differential expression volcano plots comparing hidradenitis suppurativa lesions to healthy control skin for the keratinocyte, T cell, and mononuclear phagocyte compartments. Patients per compartment (HS / healthy): keratinocytes 8/10, T cells 8/7, mononuclear phagocytes 7/7. The 33-gene lipid mediator panel (endocannabinoid biosynthetic and hydrolytic enzymes, cannabinoid receptors, prostaglandin and leukotriene synthases, thromboxane synthase, and sphingosine kinase) is highlighted in red. Statistical significance was determined with a patient-level pseudobulk negative binomial generalized linear model (PyDESeq2) and Benjamini-Hochberg false discovery rate correction. The horizontal dashed line marks Q < 0.05; vertical dashed lines mark log2 fold changes of −1 and +1. (b) UMAP embedding of the integrated cutaneous atlas, highlighting the spatial distribution of the B cell lineage within the global manifold. (c) Scatter plot of per-cell plasma module score against memory module score across the hidradenitis suppurativa B cell compartment. The memory module comprises the markers MS4A1, CD19, PAX5, and BANK1; the plasma module comprises PRDM1, XBP1, IRF4, and MZB1. Module scoring was performed with scanpy's score_genes function. (d) Heatmap of expression metrics for the 33-gene lipid mediator panel across the three maturation states. Retained pseudobulk replicates were 7 patients (memory B cell), 6 patients (plasmablast), and 8 patients (plasma cell). The color gradient encodes per-cell penetrance (percent of cells expressing each gene above detection threshold). Accompanying numerical annotations give mean expression as log-transformed counts per million (log1p(CPM)). Pseudobulk differential expression testing across the 33 lipid panel genes identified no statistically significant alterations in either the plasmablast-versus-memory-B-cell or the plasma-cell-versus-plasmablast group.
Figure 5.
Lipid mediator response and B cell maturation in the skin. Single-cell transcriptomic data were derived from GSE220116 (J. Kim et al. 2023). (a) Genome-wide differential expression volcano plots comparing hidradenitis suppurativa lesions to healthy control skin for the keratinocyte, T cell, and mononuclear phagocyte compartments. Patients per compartment (HS / healthy): keratinocytes 8/10, T cells 8/7, mononuclear phagocytes 7/7. The 33-gene lipid mediator panel (endocannabinoid biosynthetic and hydrolytic enzymes, cannabinoid receptors, prostaglandin and leukotriene synthases, thromboxane synthase, and sphingosine kinase) is highlighted in red. Statistical significance was determined with a patient-level pseudobulk negative binomial generalized linear model (PyDESeq2) and Benjamini-Hochberg false discovery rate correction. The horizontal dashed line marks Q < 0.05; vertical dashed lines mark log2 fold changes of −1 and +1. (b) UMAP embedding of the integrated cutaneous atlas, highlighting the spatial distribution of the B cell lineage within the global manifold. (c) Scatter plot of per-cell plasma module score against memory module score across the hidradenitis suppurativa B cell compartment. The memory module comprises the markers MS4A1, CD19, PAX5, and BANK1; the plasma module comprises PRDM1, XBP1, IRF4, and MZB1. Module scoring was performed with scanpy's score_genes function. (d) Heatmap of expression metrics for the 33-gene lipid mediator panel across the three maturation states. Retained pseudobulk replicates were 7 patients (memory B cell), 6 patients (plasmablast), and 8 patients (plasma cell). The color gradient encodes per-cell penetrance (percent of cells expressing each gene above detection threshold). Accompanying numerical annotations give mean expression as log-transformed counts per million (log1p(CPM)). Pseudobulk differential expression testing across the 33 lipid panel genes identified no statistically significant alterations in either the plasmablast-versus-memory-B-cell or the plasma-cell-versus-plasmablast group.
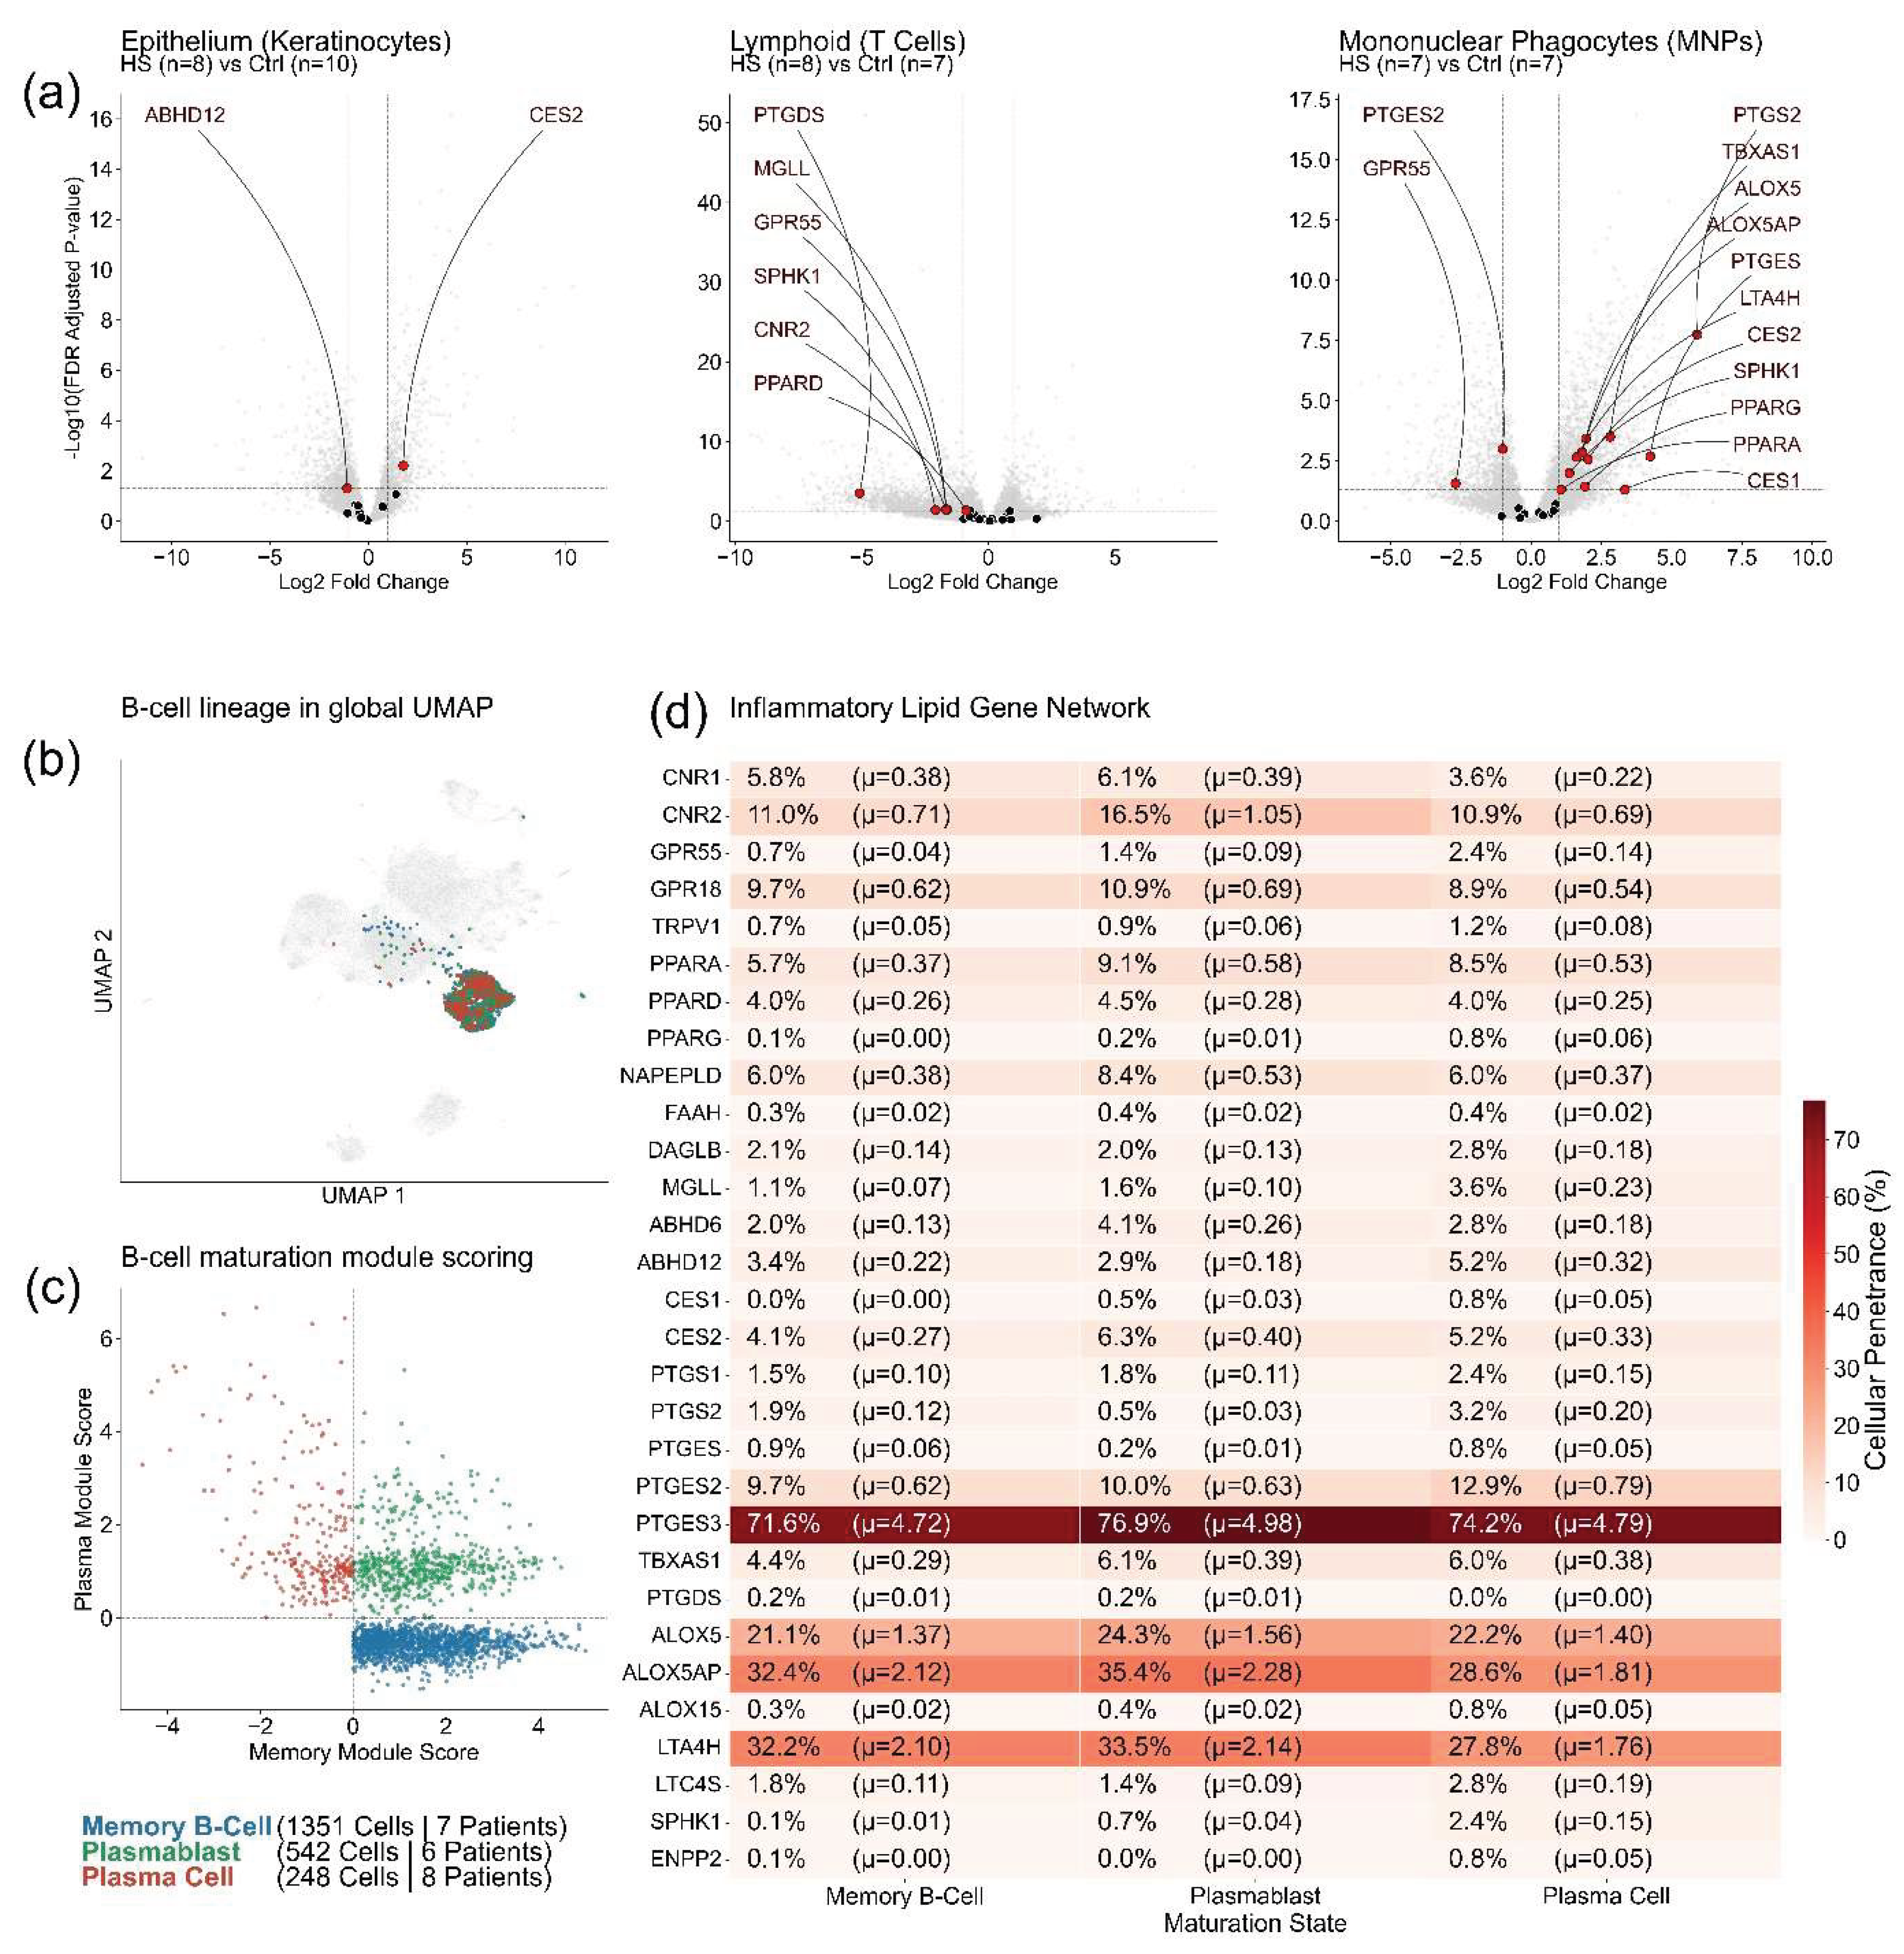
Figure 6.
Immunofibroblast activation as a predictor of nociceptive gene expression in hidradenitis suppurativa. Single-cell transcriptomic data from the integrated cutaneous atlas were subset to isolate 2,546 purified fibroblasts across 7 hidradenitis suppurativa patients and 7 healthy controls. (a) Uniform manifold approximation and projection (UMAP) embedding of the global cutaneous atlas, with the 2,546 purified fibroblasts highlighted in red. (b) Genome-wide differential expression volcano plot comparing hidradenitis suppurativa fibroblasts to healthy controls. The background transcriptome is shown in grey. Targeted pain-network genes are highlighted by thematic group: matrix remodeling (red), neuro-immune signaling (blue), and lipid mediators (green). The horizontal dashed line denotes Q < 0.05; vertical dashed lines denote log2 fold changes of -1 and +1. (c) Dot plot mapping the expression of 18 canonical fibroblast subtype markers across six transcriptomically defined fibroblast states (assigned via module scoring). Dot size represents the percentage of cells expressing the marker; color intensity reflects mean log-normalized expression (log1p(CP10k)). (d-g) Module scores projected across the purified fibroblast UMAP manifold. (d) The CXCL13-positive immunofibroblast module score. (e) The nociceptive pain module score. (f) The co-activation metric, defined as the element-wise product of the min-max-scaled immunofibroblast and nociceptive scores. (g) Single-cell TRPA1 expression. (h-j) Comparative patient-level correlations between the nociceptive pain module and three transcriptomically defined fibroblast subtype modules derived from van Straalen and colleagues: the CXCL13-positive immunofibroblast module (h), the SFRP4-positive myofibroblast module (i), and the SFRP2-positive fibroblast module (j). The formulation of the nociceptive pain module relied upon the significantly upregulated neuro-immune and lipid mediator targets characterized within the hidradenitis suppurativa fibroblast population. Within each panel, solid black lines with shaded 95% bootstrap confidence intervals denote regression across all 14 patients (blue dots indicate healthy patients, red dots indicate hidradenitis suppurativa patients); solid red lines denote regression within the hidradenitis suppurativa cohort alone (N = 7). To prevent circular inference, any gene shared between a subtype module and the nociceptive pain module was programmatically excluded before scoring. (k, l) Grouped boxplots of pseudobulk expression for 44 significant targets driving the matrix remodeling, neuro-immune, and lipid mediator networks. Expression is shown as log-transformed counts per million (log1p(CPM)). Boxplots display the median and interquartile range; overlaid points represent individual patient pseudobulk values. Data were derived from GSE154775 and GSE173706. Differential expressions were computed at patient-level pseudobulk resolution using a negative binomial generalized linear model (PyDESeq2) with Benjamini-Hochberg false discovery rate correction. Gene identifiers are HGNC-approved symbols. For boxplot significance annotations in (k, l), asterisks denote the hidradenitis suppurativa versus healthy contrast at Q < 0.05 (*), Q < 0.01 (**), and Q < 0.001 (***).
Figure 6.
Immunofibroblast activation as a predictor of nociceptive gene expression in hidradenitis suppurativa. Single-cell transcriptomic data from the integrated cutaneous atlas were subset to isolate 2,546 purified fibroblasts across 7 hidradenitis suppurativa patients and 7 healthy controls. (a) Uniform manifold approximation and projection (UMAP) embedding of the global cutaneous atlas, with the 2,546 purified fibroblasts highlighted in red. (b) Genome-wide differential expression volcano plot comparing hidradenitis suppurativa fibroblasts to healthy controls. The background transcriptome is shown in grey. Targeted pain-network genes are highlighted by thematic group: matrix remodeling (red), neuro-immune signaling (blue), and lipid mediators (green). The horizontal dashed line denotes Q < 0.05; vertical dashed lines denote log2 fold changes of -1 and +1. (c) Dot plot mapping the expression of 18 canonical fibroblast subtype markers across six transcriptomically defined fibroblast states (assigned via module scoring). Dot size represents the percentage of cells expressing the marker; color intensity reflects mean log-normalized expression (log1p(CP10k)). (d-g) Module scores projected across the purified fibroblast UMAP manifold. (d) The CXCL13-positive immunofibroblast module score. (e) The nociceptive pain module score. (f) The co-activation metric, defined as the element-wise product of the min-max-scaled immunofibroblast and nociceptive scores. (g) Single-cell TRPA1 expression. (h-j) Comparative patient-level correlations between the nociceptive pain module and three transcriptomically defined fibroblast subtype modules derived from van Straalen and colleagues: the CXCL13-positive immunofibroblast module (h), the SFRP4-positive myofibroblast module (i), and the SFRP2-positive fibroblast module (j). The formulation of the nociceptive pain module relied upon the significantly upregulated neuro-immune and lipid mediator targets characterized within the hidradenitis suppurativa fibroblast population. Within each panel, solid black lines with shaded 95% bootstrap confidence intervals denote regression across all 14 patients (blue dots indicate healthy patients, red dots indicate hidradenitis suppurativa patients); solid red lines denote regression within the hidradenitis suppurativa cohort alone (N = 7). To prevent circular inference, any gene shared between a subtype module and the nociceptive pain module was programmatically excluded before scoring. (k, l) Grouped boxplots of pseudobulk expression for 44 significant targets driving the matrix remodeling, neuro-immune, and lipid mediator networks. Expression is shown as log-transformed counts per million (log1p(CPM)). Boxplots display the median and interquartile range; overlaid points represent individual patient pseudobulk values. Data were derived from GSE154775 and GSE173706. Differential expressions were computed at patient-level pseudobulk resolution using a negative binomial generalized linear model (PyDESeq2) with Benjamini-Hochberg false discovery rate correction. Gene identifiers are HGNC-approved symbols. For boxplot significance annotations in (k, l), asterisks denote the hidradenitis suppurativa versus healthy contrast at Q < 0.05 (*), Q < 0.01 (**), and Q < 0.001 (***).
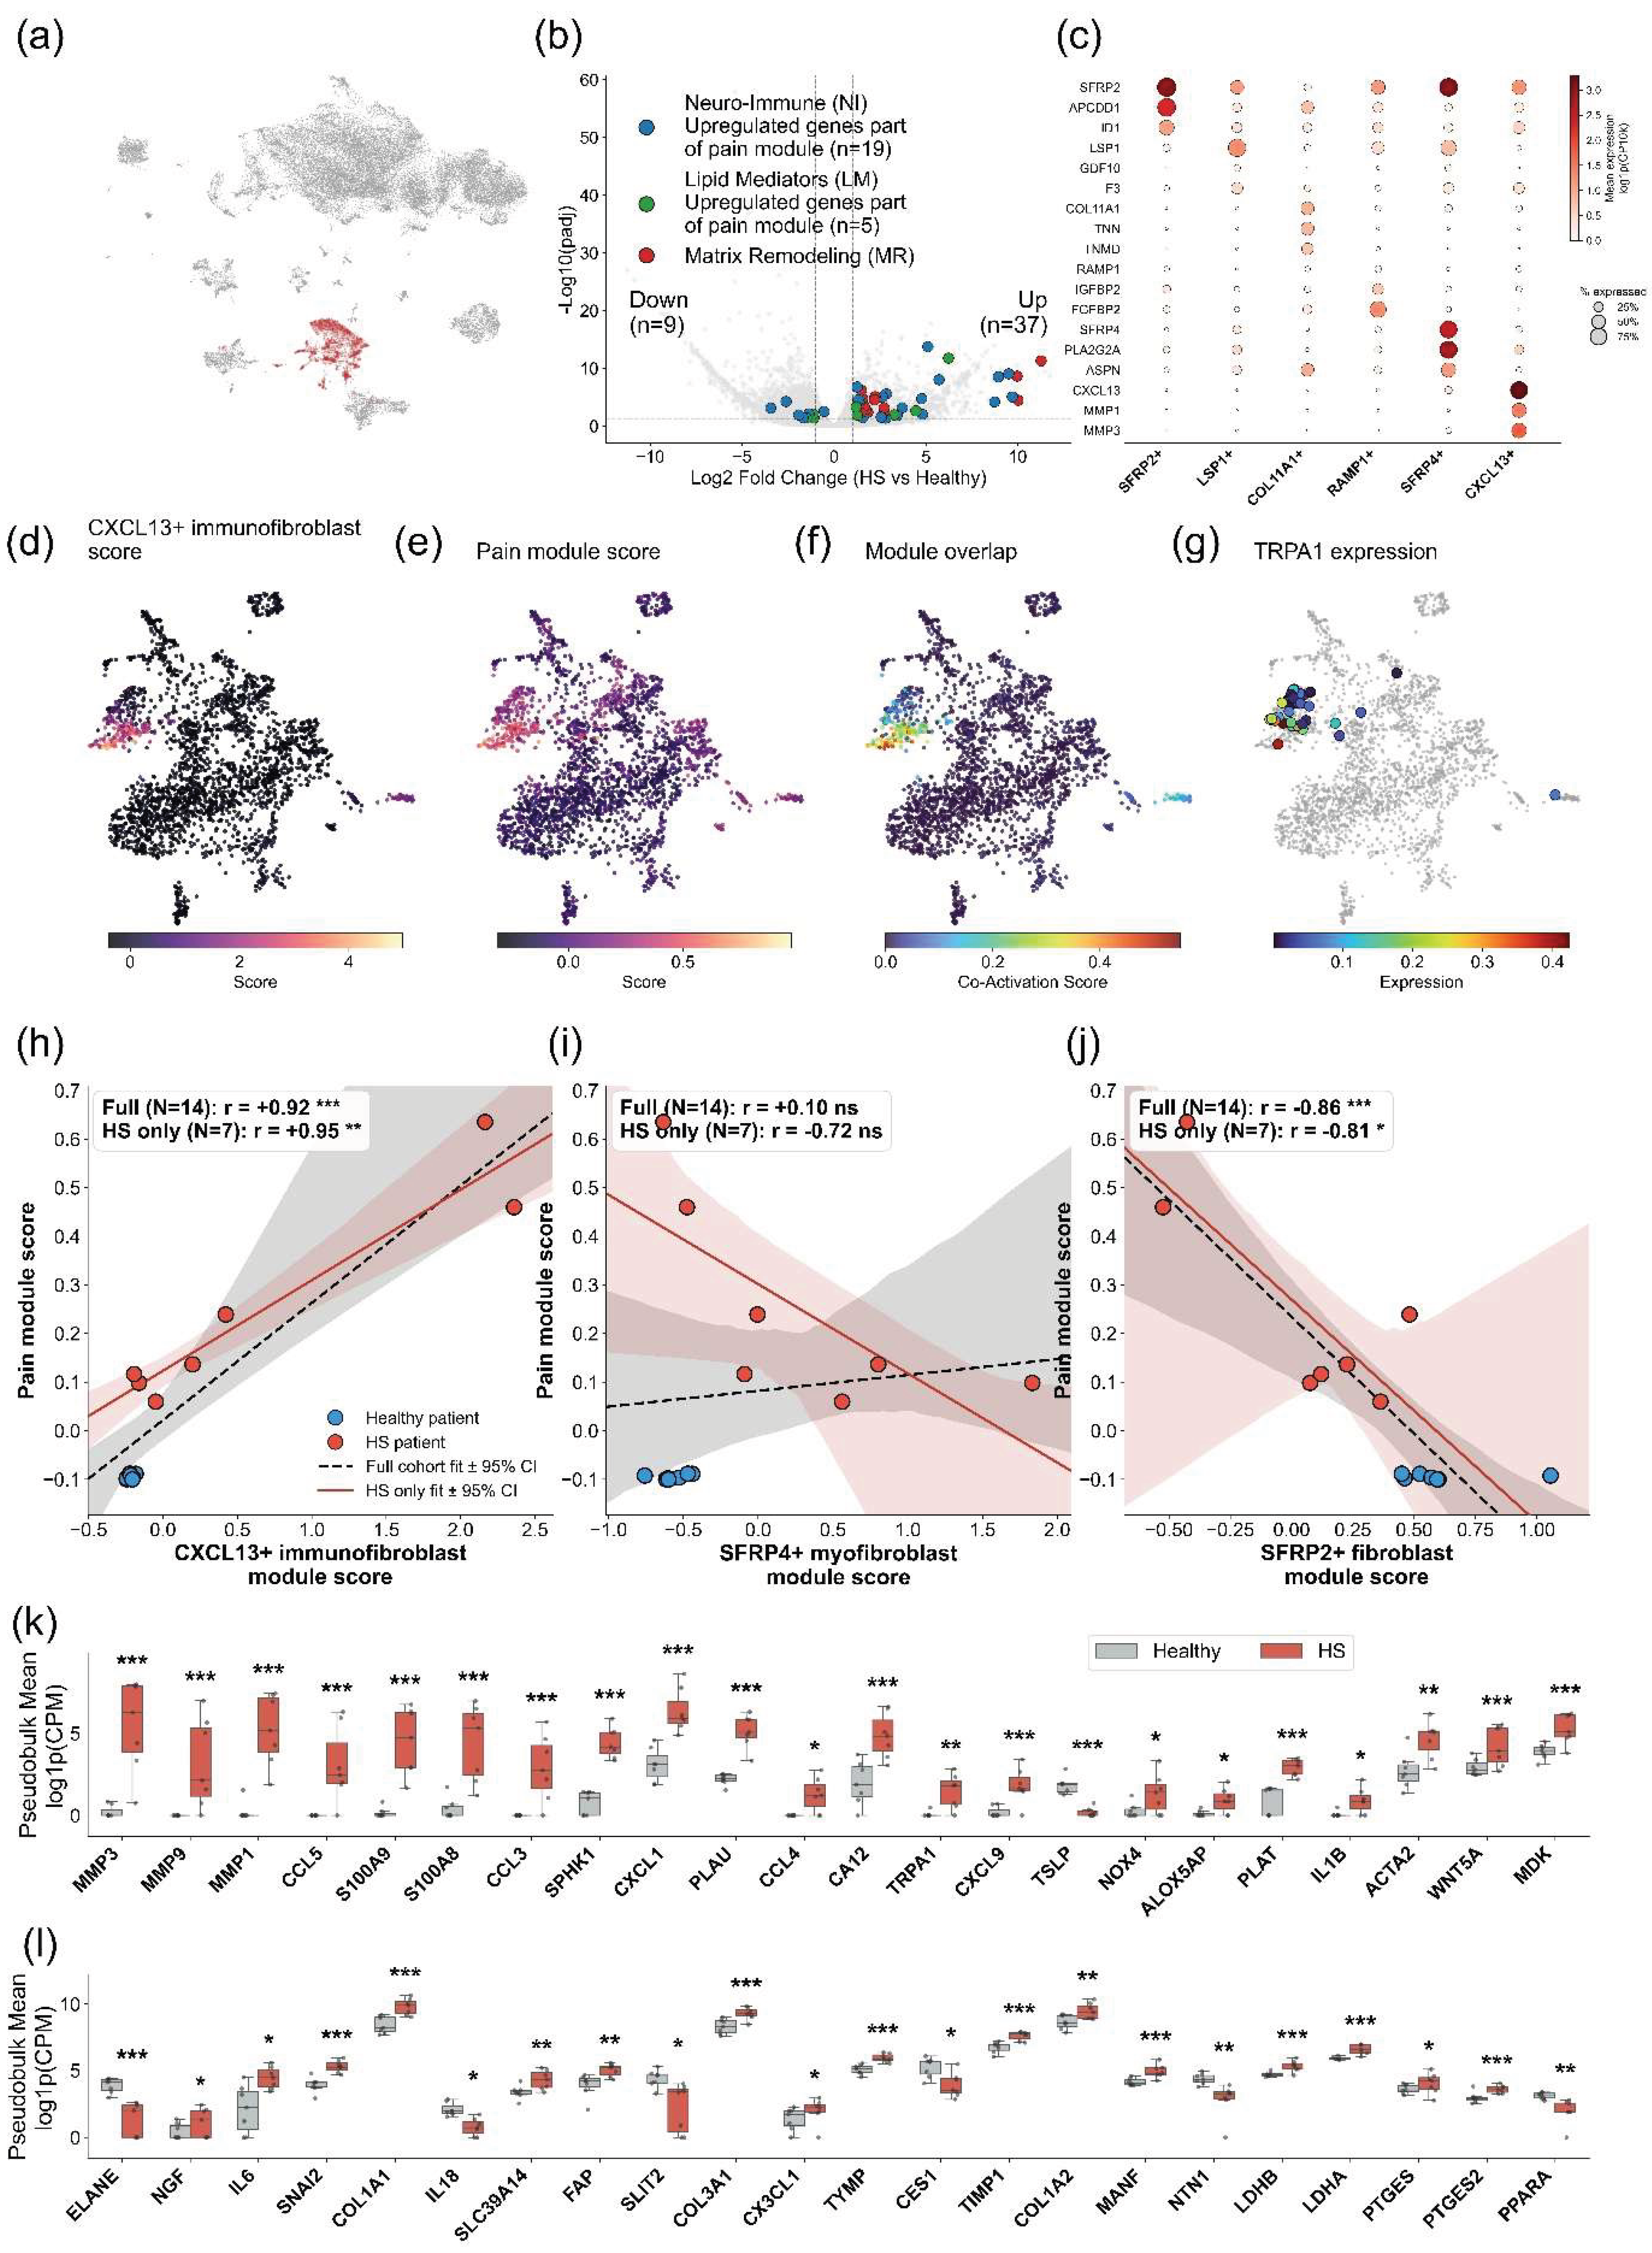
Figure 7.
Unbiased transcriptomic enrichment identifies IL-17 signaling and targetable receptors in hidradenitis suppurativa fibroblasts. Pathway enrichment and pharmacological target intersection analyses were performed on the genome-wide differential expression matrix from the purified fibroblast compartment (2,546 fibroblasts across 7 hidradenitis suppurativa patients and 7 healthy controls) introduced in Figure 6. (a) Top 15 Gene Ontology Biological Process terms enriched among the significantly upregulated fibroblast transcripts, ranked by adjusted P-value. (b) Top 15 KEGG pathways enriched among the significantly upregulated fibroblast transcripts, with the IL-17 signaling pathway highlighted in red. (c) Genome-wide differential expression volcano plot for the fibroblast compartment, with the KEGG IL-17 signaling pathway gene set highlighted in red against the grey background transcriptome. The horizontal dashed line denotes Q < 0.05; vertical dashed lines denote log2 fold changes of −0.5 and +0.5. (d) Log2 fold changes for the significantly upregulated IL-17 signal transduction and downstream effector genes identified in panel (c). (e) Genome-wide differential expression volcano plot intersected with the Human Protein Atlas FDA-approved druggable proteome. Significantly regulated druggable targets (Q < 0.05, |log2 fold change| > 0.5) are highlighted, with high-magnitude nodes annotated by HGNC symbol. (f) Targeted volcano plot restricting the druggable intersection of panel (e) to FDA-approved G-protein-coupled receptor targets (41 GPCRs with detectable fibroblast expression). Significantly regulated GPCRs (Q < 0.05, |log2 fold change| > 0.5) are highlighted and annotated. Data were derived from GSE154775 and GSE173706 [10,12], integrated as described in Methods §2.6. Differential expression was computed at patient-level pseudobulk resolution using a negative binomial generalized linear model (PyDESeq2) with Benjamini-Hochberg false discovery rate correction. A minimum-cells threshold of ≥ 10 fibroblasts per patient was applied before statistical modeling. Gene Ontology and KEGG enrichment were computed using the Enrichr web service. The FDA-approved druggable proteome was drawn from the Human Protein Atlas. Gene identifiers are HGNC-approved symbols. The top 6 upregulated and downregulated targets are highlighted in panels (e) and (f).
Figure 7.
Unbiased transcriptomic enrichment identifies IL-17 signaling and targetable receptors in hidradenitis suppurativa fibroblasts. Pathway enrichment and pharmacological target intersection analyses were performed on the genome-wide differential expression matrix from the purified fibroblast compartment (2,546 fibroblasts across 7 hidradenitis suppurativa patients and 7 healthy controls) introduced in Figure 6. (a) Top 15 Gene Ontology Biological Process terms enriched among the significantly upregulated fibroblast transcripts, ranked by adjusted P-value. (b) Top 15 KEGG pathways enriched among the significantly upregulated fibroblast transcripts, with the IL-17 signaling pathway highlighted in red. (c) Genome-wide differential expression volcano plot for the fibroblast compartment, with the KEGG IL-17 signaling pathway gene set highlighted in red against the grey background transcriptome. The horizontal dashed line denotes Q < 0.05; vertical dashed lines denote log2 fold changes of −0.5 and +0.5. (d) Log2 fold changes for the significantly upregulated IL-17 signal transduction and downstream effector genes identified in panel (c). (e) Genome-wide differential expression volcano plot intersected with the Human Protein Atlas FDA-approved druggable proteome. Significantly regulated druggable targets (Q < 0.05, |log2 fold change| > 0.5) are highlighted, with high-magnitude nodes annotated by HGNC symbol. (f) Targeted volcano plot restricting the druggable intersection of panel (e) to FDA-approved G-protein-coupled receptor targets (41 GPCRs with detectable fibroblast expression). Significantly regulated GPCRs (Q < 0.05, |log2 fold change| > 0.5) are highlighted and annotated. Data were derived from GSE154775 and GSE173706 [10,12], integrated as described in Methods §2.6. Differential expression was computed at patient-level pseudobulk resolution using a negative binomial generalized linear model (PyDESeq2) with Benjamini-Hochberg false discovery rate correction. A minimum-cells threshold of ≥ 10 fibroblasts per patient was applied before statistical modeling. Gene Ontology and KEGG enrichment were computed using the Enrichr web service. The FDA-approved druggable proteome was drawn from the Human Protein Atlas. Gene identifiers are HGNC-approved symbols. The top 6 upregulated and downregulated targets are highlighted in panels (e) and (f).
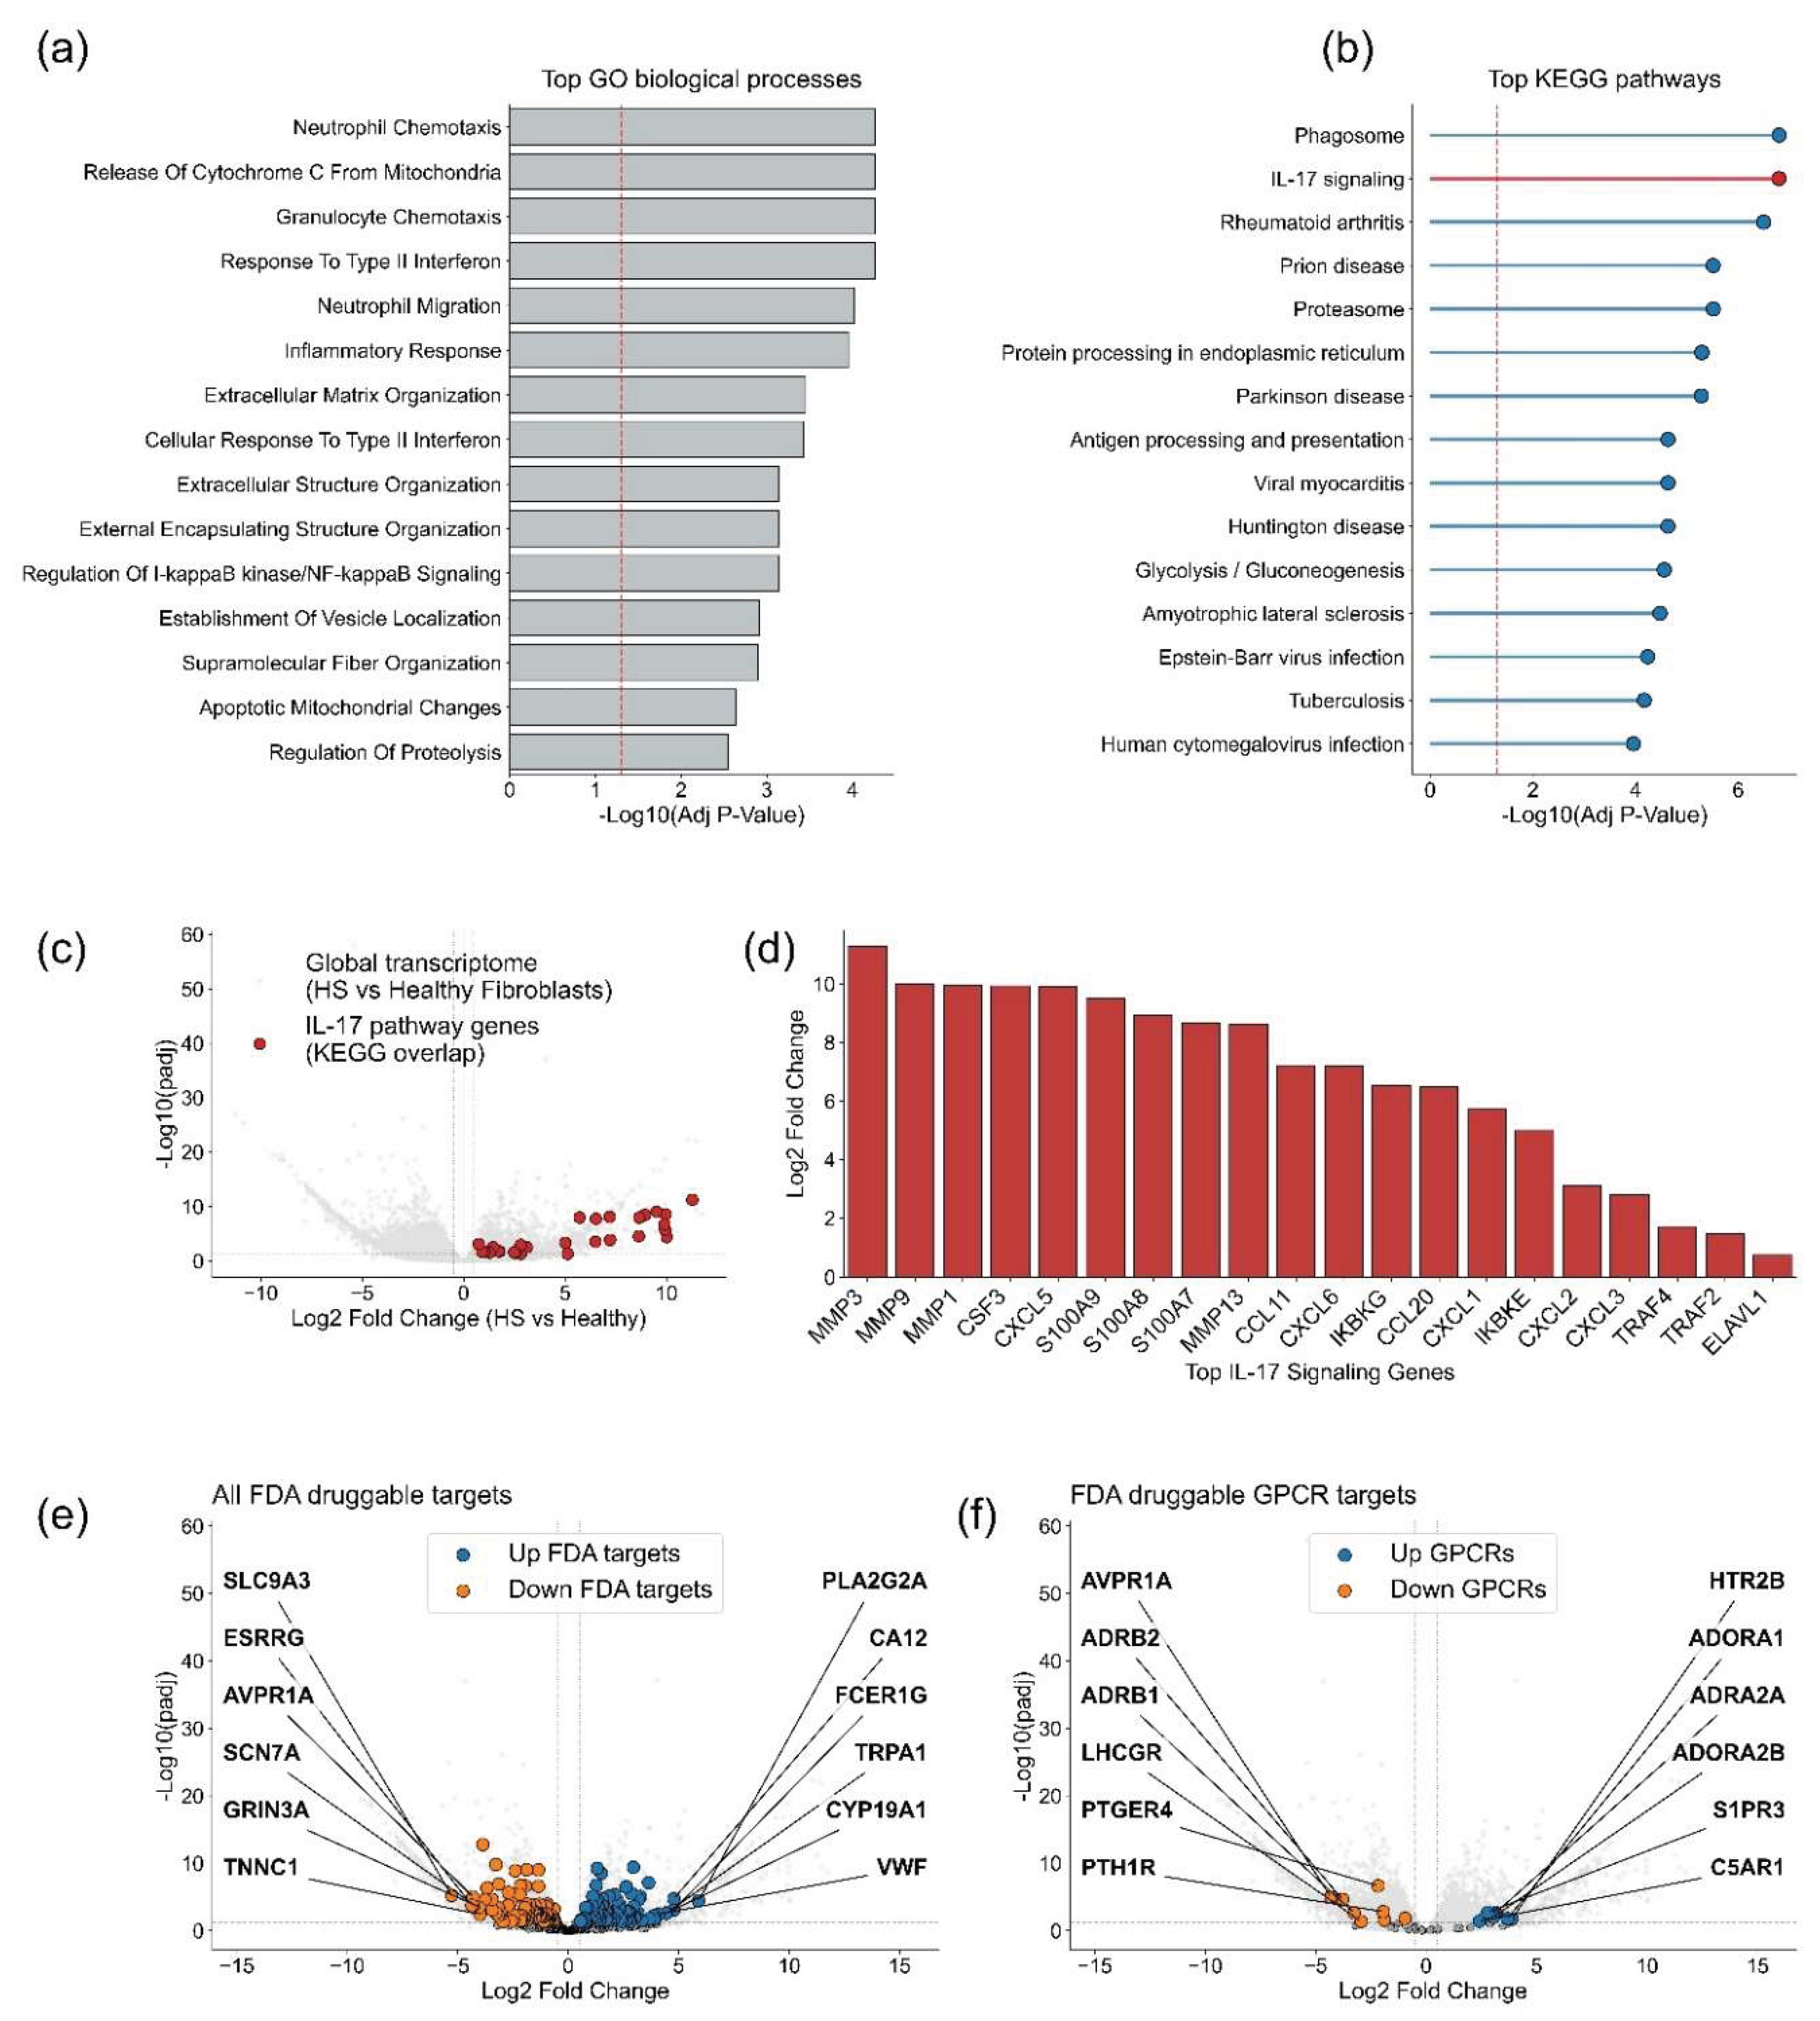
Figure 8.
In silico pharmacological screening maps the pathogenic fibroblast transcriptome onto existing drug-target interactions. A computational pipeline intersected the 165 high-confidence fibroblast precision targets (Q < 0.05, |log2 fold change| > 0.5; from Figure 6) with the Drug Gene Interaction Database (DGIdb). (a) Attrition funnel summarizing the screening pipeline: the complete DGIdb compound set (n = 18,853) was reduced to 16,264 compounds after exclusion of antineoplastic agents and pre-clinical CHEMBL compounds, to 3,334 compounds that matched at least one of the 165 fibroblast precision targets with a curated DGIdb interaction confidence score (promiscuous compounds excluded), and finally to 1,119 FDA-approved compounds within the scored candidate set. (b) The five-step computational framework for transcriptomic-guided drug curation. (c) Top 12 monoclonal antibody candidates ranked by Total Precision Score, colored by target gene. Legend entries display each target's log2 fold change and Benjamini-Hochberg Q-value significance in the hidradenitis suppurativa versus healthy fibroblast contrast. (d) Top FDA-approved pharmacological modulators for the three significantly suppressed steroid hormone receptors in hidradenitis suppurativa fibroblasts: the glucocorticoid receptor NR3C1 (top), the mineralocorticoid receptor NR3C2 (middle), and the androgen receptor AR (bottom). Within each sub-panel, the target gene's log2 fold change and Q-value are annotated. (e) Mechanistic pathway diagram of the eicosanoid and sphingolipid biosynthetic cascades in hidradenitis suppurativa fibroblasts. Enzyme nodes are colored by disease-state direction (green, significantly upregulated; red, downregulated). Terminal metabolite nodes (sphingosine-1-phosphate, leukotrienes, prostaglandin E2) and the upstream substrate nodes (sphingosine, arachidonic acid, membrane lipids) are shown in neutral fill. Blue boxes annotate the top-ranked DGIdb inhibitor candidates for each upregulated enzymatic node (SPHK1, ALOX5AP, PTGES) as dynamically retrieved from the DGIdb interaction table. Red T-bar arrows denote proposed pharmacological inhibition; black arrows denote metabolic flow. Data were derived from GSE154775 and GSE173706. Differential expression statistics were computed at patient-level pseudobulk resolution using a negative binomial generalized linear model (PyDESeq2) with Benjamini-Hochberg false discovery rate correction. The Human Protein Atlas FDA-approved druggable proteome was used to define the druggable intersection in Figure 7, which provided the target pool input to this analysis. Gene identifiers are HGNC-approved symbols. Log2 fold change and Q-value annotations throughout the figure reflect differential expression in hidradenitis suppurativa fibroblasts relative to healthy: * Q < 0.05, ** Q < 0.01, *** Q < 0.001.
Figure 8.
In silico pharmacological screening maps the pathogenic fibroblast transcriptome onto existing drug-target interactions. A computational pipeline intersected the 165 high-confidence fibroblast precision targets (Q < 0.05, |log2 fold change| > 0.5; from Figure 6) with the Drug Gene Interaction Database (DGIdb). (a) Attrition funnel summarizing the screening pipeline: the complete DGIdb compound set (n = 18,853) was reduced to 16,264 compounds after exclusion of antineoplastic agents and pre-clinical CHEMBL compounds, to 3,334 compounds that matched at least one of the 165 fibroblast precision targets with a curated DGIdb interaction confidence score (promiscuous compounds excluded), and finally to 1,119 FDA-approved compounds within the scored candidate set. (b) The five-step computational framework for transcriptomic-guided drug curation. (c) Top 12 monoclonal antibody candidates ranked by Total Precision Score, colored by target gene. Legend entries display each target's log2 fold change and Benjamini-Hochberg Q-value significance in the hidradenitis suppurativa versus healthy fibroblast contrast. (d) Top FDA-approved pharmacological modulators for the three significantly suppressed steroid hormone receptors in hidradenitis suppurativa fibroblasts: the glucocorticoid receptor NR3C1 (top), the mineralocorticoid receptor NR3C2 (middle), and the androgen receptor AR (bottom). Within each sub-panel, the target gene's log2 fold change and Q-value are annotated. (e) Mechanistic pathway diagram of the eicosanoid and sphingolipid biosynthetic cascades in hidradenitis suppurativa fibroblasts. Enzyme nodes are colored by disease-state direction (green, significantly upregulated; red, downregulated). Terminal metabolite nodes (sphingosine-1-phosphate, leukotrienes, prostaglandin E2) and the upstream substrate nodes (sphingosine, arachidonic acid, membrane lipids) are shown in neutral fill. Blue boxes annotate the top-ranked DGIdb inhibitor candidates for each upregulated enzymatic node (SPHK1, ALOX5AP, PTGES) as dynamically retrieved from the DGIdb interaction table. Red T-bar arrows denote proposed pharmacological inhibition; black arrows denote metabolic flow. Data were derived from GSE154775 and GSE173706. Differential expression statistics were computed at patient-level pseudobulk resolution using a negative binomial generalized linear model (PyDESeq2) with Benjamini-Hochberg false discovery rate correction. The Human Protein Atlas FDA-approved druggable proteome was used to define the druggable intersection in Figure 7, which provided the target pool input to this analysis. Gene identifiers are HGNC-approved symbols. Log2 fold change and Q-value annotations throughout the figure reflect differential expression in hidradenitis suppurativa fibroblasts relative to healthy: * Q < 0.05, ** Q < 0.01, *** Q < 0.001.
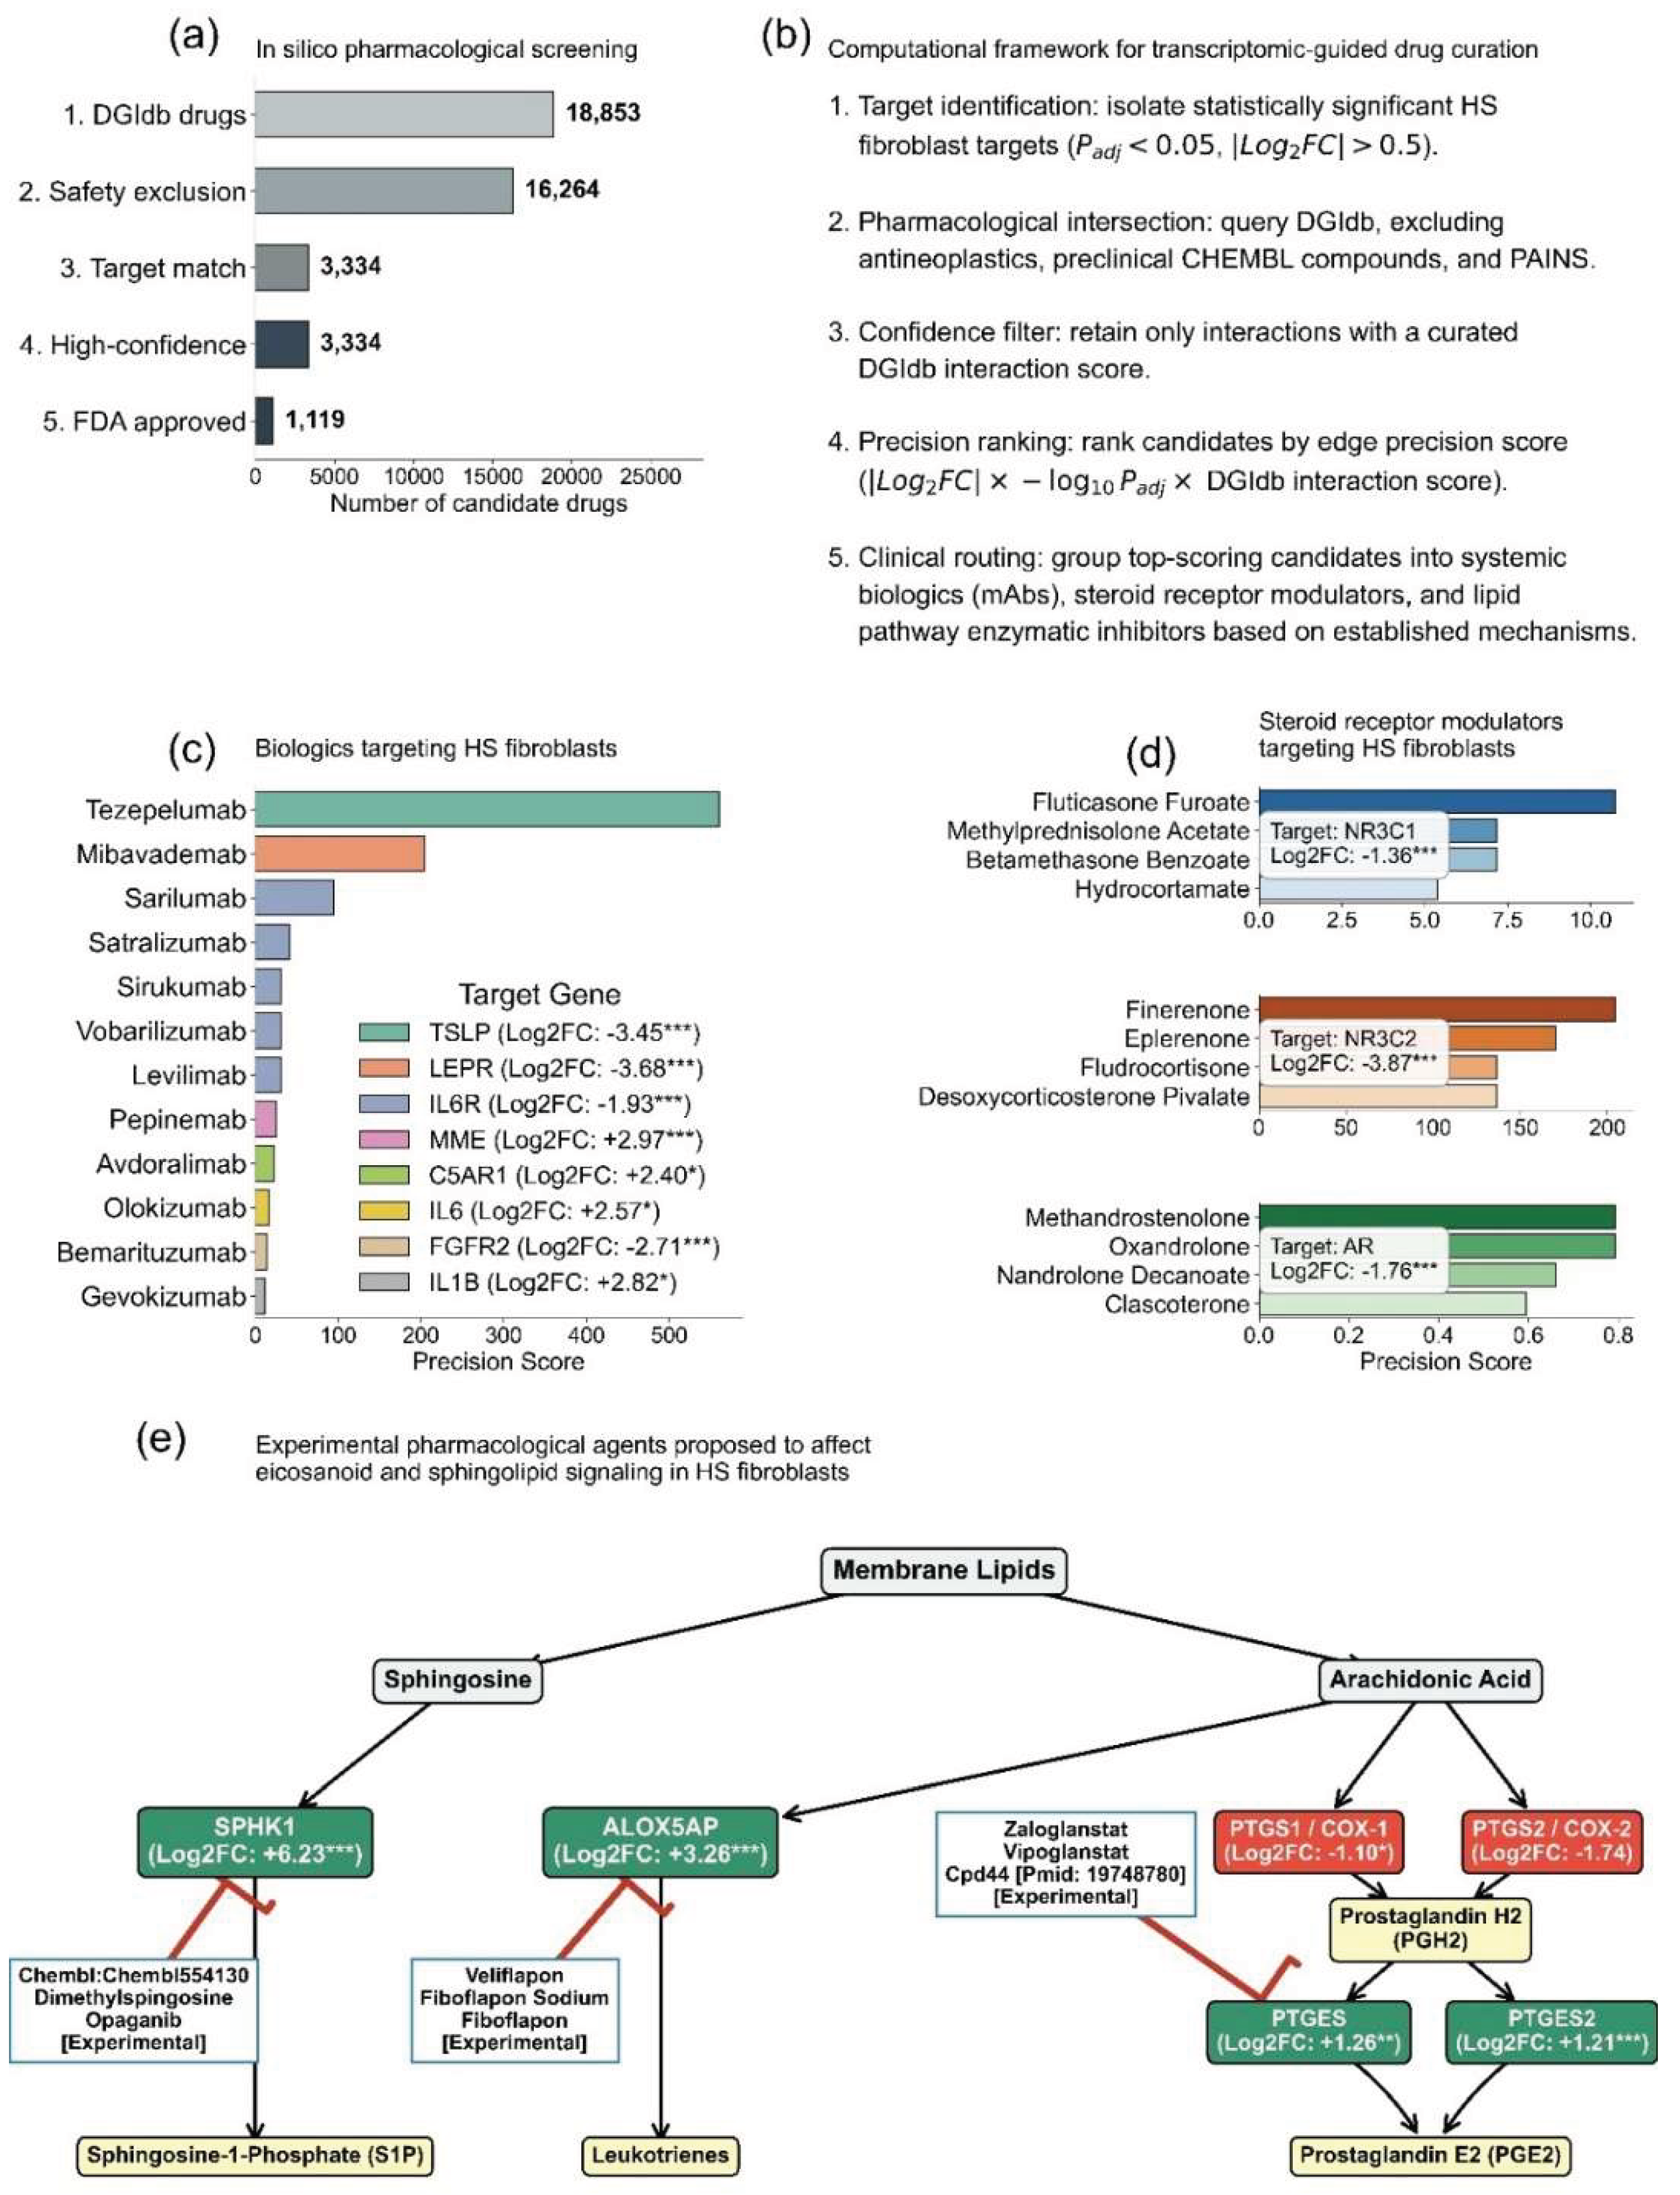
Disclaimer/Publisher’s Note: The statements, opinions and data contained in all publications are solely those of the individual author(s) and contributor(s) and not of MDPI and/or the editor(s). MDPI and/or the editor(s) disclaim responsibility for any injury to people or property resulting from any ideas, methods, instructions or products referred to in the content. |
© 2026 by the author. Licensee MDPI, Basel, Switzerland. This article is an open access article distributed under the terms and conditions of the Creative Commons Attribution (CC BY) license.
Copyright: This open access article is published under a Creative Commons CC BY 4.0 license, which permit the free download, distribution, and reuse, provided that the author and preprint are cited in any reuse.


