Preprint
Article

This version is not peer-reviewed.

Integrating Disease Severity and Growth Retention Reveals Distinct Resistance Responses to Spring Black Stem and Leaf Spot in Alfalfa

Submitted:

10 July 2026

Posted:

10 July 2026

You are already at the latest version

Abstract

Alfalfa spring black stem and leaf spot (ASBS), caused by Ascochyta medicaginicola, threatens alfalfa yield, quality, and stand persistence. Conventional resistance evaluations of alfalfa cultivars generally rely on disease incidence, disease severity, or the percentage of healthy plants, but these indices do not fully capture post-infection growth maintenance. In this study, 12 alfalfa cultivars were spray-inoculated with A. medicaginicola under greenhouse conditions, and disease responses and relative growth performance were assessed 14 days post-inoculation. Disease incidence was positively correlated with disease severity index and negatively correlated with relative fresh weight, relative dry weight, and relative root length. These five indicators were integrated using a membership-function-based standard-deviation coefficient weighting method to calculate a comprehensive resistance score (D value). D values ranged from 0.0340 to 0.9611. Magnum 2 showed the strongest comprehensive resistance, followed by Gannong No. 3, Adrenalin, and Dryland, whereas Thunder, Zhongmu No. 1, and Aohan were the weakest. Compared with the National Alfalfa and Forage Alliance healthy-plant classification, the D-value ranking improved discrimination among cultivars within the same resistance class. Principal component analysis explained 89.24% of the total variation in the first two components and separated resistant, intermediate, and susceptible response types. These results indicate that integrating disease suppression with growth retention provides a quantitative and agronomically interpretable framework for identifying ASBS-resistant alfalfa germplasm.

Keywords: 
;  ;  ;  ;  ;  

1. Introduction

Alfalfa (Medicago sativa L.) is one of the most important perennial legume forage crops worldwide and is widely cultivated because of its high nutritional value, broad ecological adaptability, and important role in ruminant livestock production [1,2]. Stable production and long-term persistence of alfalfa stands are essential for forage supply, soil improvement, and sustainable agricultural development. However, alfalfa production is frequently constrained by fungal diseases, particularly aboveground diseases that damage leaves and stems, reduce photosynthetic capacity, accelerate defoliation, and ultimately decrease forage yield and quality [3,4,5,6,7]. Among these diseases, alfalfa spring black stem and leaf spot (ASBS), caused by Ascochyta medicaginicola, is considered a major foliar and stem disease affecting alfalfa production in many regions [8].
ASBS was historically associated with Phoma medicaginis and has recently been reclassified as Ascochyta medicaginicola based on morphological characteristics and multilocus phylogenetic evidence [9,10]. The disease commonly causes black lesions on stems, leaf spots, premature defoliation, seedling blight, crown rot, and root rot, thereby affecting both aboveground biomass accumulation and stand persistence [11,12,13,14,15,16,17]. The occurrence and development of ASBS are strongly influenced by environmental conditions, especially temperature and humidity. Warm and humid conditions in spring and autumn favor conidial germination, infection, disease expansion, and pathogen spread [8,18,19,20]. Previous studies have shown that ASBS can substantially reduce hay yield and forage quality, with greater disease severity associated with marked yield loss [11]. In addition, infection by A. medicaginicola may decrease crude protein content and promote the accumulation of coumestrol, a phytoestrogen that can negatively affect reproductive performance in grazing animals [21,22]. Therefore, effective control of ASBS is important for maintaining alfalfa yield and quality and for supporting sustainable forage-livestock systems.
The use of resistant or tolerant cultivars is widely regarded as one of the most economical, environmentally friendly, and effective strategies for managing alfalfa diseases [3,23]. Accurate evaluation of cultivar resistance is therefore a prerequisite for resistant germplasm utilization, cultivar deployment, and disease management. However, current evaluation systems for alfalfa disease resistance are still largely based on single disease-related indicators, such as disease incidence, disease severity index, or the percentage of healthy plants. For example, the National Alfalfa and Forage Alliance (NAFA) resistance classification mainly uses the percentage of healthy plants to assign resistance levels [24]. Although this approach is simple and useful for large-scale screening, it may not fully reflect the complex biological responses of alfalfa cultivars to pathogen infection. Disease incidence or healthy plant percentage primarily indicates whether plants are infected, whereas disease severity reflects lesion development and disease expansion. Neither indicator alone adequately describes post-infection growth maintenance, biomass retention, root growth, or the ability of plants to sustain forage production after infection. Consequently, cultivars with relatively low disease incidence but poor growth performance may be overestimated, whereas cultivars with moderate disease symptoms but strong post-infection growth maintenance may be underestimated.
Resistance to ASBS should therefore be considered a multidimensional trait involving both disease suppression and growth maintenance under pathogen pressure. Previous studies have evaluated alfalfa resistance to ASBS or related diseases using disease incidence and disease severity index under field or controlled conditions [25,26]. These studies have provided valuable information on cultivar differences, but disease-related traits and agronomic growth traits have rarely been integrated into a single quantitative framework. In plant stress-resistance studies, membership function analysis combined with objective weighting methods has been widely used to integrate multiple indicators and reduce the bias associated with single-trait evaluation [27,28]. This approach converts indicators with different units and directions into comparable membership values and then calculates a comprehensive evaluation score. However, to our knowledge, a membership-function-based multi-indicator evaluation framework has not been systematically applied to assess alfalfa resistance to spring black stem and leaf spot caused by A. medicaginicola.
Herein, 12 domestic and introduced alfalfa cultivars were inoculated with A. medicaginicola under controlled greenhouse conditions. Disease incidence, disease severity index, plant height, root length, fresh weight per plant, and dry weight per plant were measured after inoculation. We hypothesized that integrating disease development with post-infection growth retention relative to non-inoculated controls would provide a more comprehensive and biologically meaningful assessment of cultivar resistance than single-indicator evaluation. The objectives of this study were to: (1) quantify differences in ASBS response among 12 alfalfa cultivars under controlled inoculation; (2) identify disease-related and growth-related indicators associated with cultivar resistance; (3) establish a standard-deviation coefficient weighting method based on membership functions for comprehensive resistance evaluation; and (4) compare the integrated evaluation results with conventional healthy-plant-based classification to identify resistant cultivars and clarify their potential value for ASBS management and resistant germplasm utilization.

2. Materials and Methods

2.1. Plant Materials and Fungal Isolate

Twelve alfalfa (Medicago sativa L.) cultivars, including six cultivars bred in China and six introduced cultivars from other countries (Table 1), were used in this study. Seeds were obtained from the institutions or companies listed in Table 1.
The fungal isolate CS007 of Ascochyta medicaginicola was isolated from symptomatic alfalfa leaves collected from Lintao County, Dingxi City, Gansu Province, China. Before inoculation, the isolate was cultured on potato dextrose agar (PDA) plates at 25 °C for 14 days to induce abundant pycnidia and conidia. The identity of the isolate CS007 had been confirmed previously based on morphological characteristics and molecular evidence. The isolate was used as the inoculum source for greenhouse resistance evaluation.

2.2. Preparation of the Spore Suspension

After 14 days of incubation, mycelia and pycnidia were gently scraped from the surface of PDA cultures with a sterile blade. Sterile distilled water was added to each Petri dish, and the colony surface was gently rubbed to release conidia from pycnidia. The resulting suspension was filtered through two layers of sterile gauze to remove mycelial fragments. The conidial concentration was determined using a hemocytometer and adjusted to 1 × 10⁶ conidia mL⁻¹ with sterile distilled water.

2.3. Experimental Design and Inoculation

Healthy seeds of each cultivar were selected, rinsed three times with sterile distilled water, surface-disinfected with 75% ethanol for 30 s and 1% sodium hypochlorite for 1 min, and then rinsed three times with sterile distilled water. The seeds were dried on sterile filter paper and sown in 15-cm-diameter plastic pots containing sterilized soil. Five seeds were sown in each pot.
The experiment consisted of two treatments: inoculated and non-inoculated control. For each cultivar and treatment, five biological replicates were established, with one pot considered as one replicate. Plants were grown under greenhouse conditions at 25 ± 3 °C, 65% relative humidity, and a 12 h light/12 h dark photoperiod. Eight weeks after seedling emergence, plants in the inoculated treatment were uniformly sprayed with the conidial suspension until runoff. Control plants were sprayed with sterile distilled water using the same procedure. After inoculation, all plants were maintained at approximately 100% relative humidity for 24 h to facilitate infection and then transferred to normal greenhouse conditions. Plants were watered every three days, and all disease and growth indicators were measured 14 days after inoculation.

2.4. Disease Assessment

Disease symptoms on leaves and stems were observed and recorded 14 days after inoculation. Disease severity was classified into five grades according to Zhang et al. [25], with minor modifications: grade 0, no visible lesions; grade 1, lesions covering 1–5% of the leaf or stem surface; grade 2, lesions covering 6–20%; grade 3, lesions covering 21–50%; and grade 4, lesions covering more than 50%. Disease incidence and disease severity index were calculated as follows:
Disease   incidence   ( % ) = number   of   diseased   plants total   number   of   plants × 100
Disease   severity   index = number   of   plants   at   each   disease   grade   ×   corresponding   grade   value total   number   of   plants   investigated   ×   highest   grade   value × 100
According to the NAFA criteria [24], the preliminary resistance level of each cultivar was classified based on the percentage of healthy plants: highly resistant (HR), >50%; resistant (R), 31–50%; moderately resistant (MR), 15–30%; low resistant (LR), 6–14%; and susceptible (S), 0–5%.

2.5. Measurement of Growth Traits and Calculation of Relative Growth Performance

At 14 days after inoculation, plant height, root length, fresh weight per plant, and dry weight per plant were measured for both inoculated and non-inoculated control plants. Plant height and root length were measured using a ruler. Fresh weight per plant was determined immediately after harvest using an electronic balance. The harvested plants were then dried at 80 °C to constant weight, cooled to room temperature, and weighed to determine dry weight per plant.
To reduce the influence of inherent growth differences among cultivars, relative growth performance was calculated as the ratio of each growth trait in inoculated plants to that in the corresponding non-inoculated controls and expressed as a percentage. Relative growth performance was calculated as follows:
Relative   growth   performance   ( % ) = Trait   inoculated Trait   control × 100

2.6. Indicator Selection for Comprehensive Resistance Evaluation

Pearson correlation analysis was performed among disease incidence, disease severity index, and relative growth performances after inoculation. Indicators significantly associated with disease response or post-infection growth maintenance were selected for comprehensive resistance evaluation. Disease incidence and disease severity index were treated as negative indicators, whereas relative growth performances were treated as positive indicators.

2.7. Membership-Function-Based Comprehensive Evaluation

The resistance of the 12 alfalfa cultivars to ASBS was comprehensively evaluated using a standard-deviation coefficient weighting method based on membership functions. For positive indicators, the membership function value was calculated as follows:
μ ( X j ) = X j - X min X max - X min
For negative indicators, the inverse membership function was used:
μ ( X j ) = 1 - X j - X min X max - X min
where μ(Xj) represents the membership function value of the jth indicator, Xj is the observed value of the jth indicator, and Xmin and Xmax are the minimum and maximum values of the jth indicator, respectively.
The standard deviation coefficient Vj was calculated as follows:
V j = i = 1 n ( X ij - x - j ) 2 X - j
where Vj represents the standard deviation coefficient of the jth indicator, j represents the mean value of the jth indicator, and Xij represents the membership-function value of the jth indicator for the ith cultivar.
The weight of each indicator was calculated as follows:
W j = V j j = 1 m V j
The comprehensive resistance score, namely the D value, was calculated as follows:
D = j = 1 n [ μ ( X j ) * W j ]
where D represents the comprehensive resistance score of the ith cultivar. Higher D values indicate stronger comprehensive resistance to ASBS, whereas lower values indicate weaker resistance.

2.8. Comparison Between Conventional Classification and Integrated Evaluation

To evaluate whether the integrated D value provided additional information beyond conventional disease-incidence-based classification, the NAFA resistance level of each cultivar was compared with its D-value ranking. Cultivars showing inconsistent rankings between NAFA classification and D-value evaluation were further examined to determine whether the discrepancy was associated with post-infection growth retention.

2.9. Principal Component Analysis

Principal component analysis (PCA) was conducted using the selected resistance-related indicators, including disease incidence, disease severity index, relative fresh weight, relative dry weight, and relative root length. All variables were standardized before analysis to eliminate the effects of different units and scales. The first two principal components were used to visualize cultivar distribution, and loading values were used to identify the main traits contributing to resistance differentiation.

2.10. Statistical Analysis

All data were analyzed using IBM SPSS Statistics 24.0 and Origin 2024b. One-way analysis of variance (ANOVA) followed by Duncan’s multiple range test was used to compare differences among cultivars under inoculated conditions. Pearson correlation analysis was used to determine relationships among disease and growth-retention indicators. PCA was conducted using standardized values of selected indicators. Differences were considered significant at P < 0.05.

3. Results

3.1. Symptom Development and Disease Responses After Inoculation

At 14 days post-inoculation with A. medicaginicola, typical symptoms of spring black stem and leaf spot were observed in susceptible cultivars, such as Thunder. The adaxial surface of infected leaves showed chlorosis accompanied by multiple small, circular to subcircular black spots. Leaf abscission was also observed on diseased plants, whereas no obvious visible symptoms were observed on stems at this evaluation stage. No typical symptoms were observed in the non-inoculated control plants (Figure S1).
Disease incidence differed significantly among the 12 alfalfa cultivars after inoculation. Disease incidence ranged from 6.67% to 100.00% (Figure 1A). Thunder and Zhongmu No. 1 showed the highest disease incidence, reaching 100.00%, followed by Aohan, with a disease incidence of 93.33%. These cultivars were significantly more susceptible than most of the other cultivars. In contrast, Magnum 2 showed the lowest disease incidence (6.67%), followed by Gannong No. 3, Dryland, and Adrenalin, with disease incidences of 20.00%, 26.67%, and 26.67%, respectively.
Disease severity index also varied significantly among cultivars, ranging from 1.67 to 64.44 (Figure 1B). Thunder had the highest disease severity index (64.44), followed by Zhongmu No. 1 (48.33). Magnum 2, Gannong No. 3, Dryland, and Adrenalin showed relatively low disease severity indices, all below 10.00.
According to the NAFA classification based on healthy plant percentage, Magnum 2, Gannong No. 3, Dryland, and Adrenalin were classified as highly resistant. Aohan was classified as low resistant, whereas Thunder and Zhongmu No. 1 were classified as susceptible. These results indicated substantial variation in ASBS response among the tested cultivars.

3.2. Relative Growth Performance of Alfalfa Cultivars after Inoculation

Relative growth performance differed significantly among the 12 alfalfa cultivars after inoculation with A. medicaginicola (Table 2). Relative fresh weight ranged from 21.70% to 86.11%, with Adrenalin and Magnum 2 showing the highest values, whereas Zhongmu No. 1, Thunder, and Aohan showed relatively low values. Relative dry weight ranged from 42.93% to 93.22%; Vision, Gannong No. 6, and Longdong maintained the highest dry biomass, whereas Thunder had the lowest value.
Relative plant height ranged from 69.75% to 91.79%, with Vision showing the highest value and Thunder the lowest. However, the differences in relative plant height among cultivars were smaller than those observed for biomass and root traits. Relative root length ranged from 52.96% to 92.08%; Gannong No. 6 had the highest value, followed by Magnum 2 and Adrenalin, whereas Zhongmu No. 1 and Thunder showed the lowest values. Overall, Gannong No. 6, Magnum 2, Adrenalin, Vision, and Longdong maintained relatively high growth performance after infection, whereas Zhongmu No. 1 and Thunder showed marked growth suppression.

3.3. Correlation Analysis Between Disease Response and Relative Growth Performance

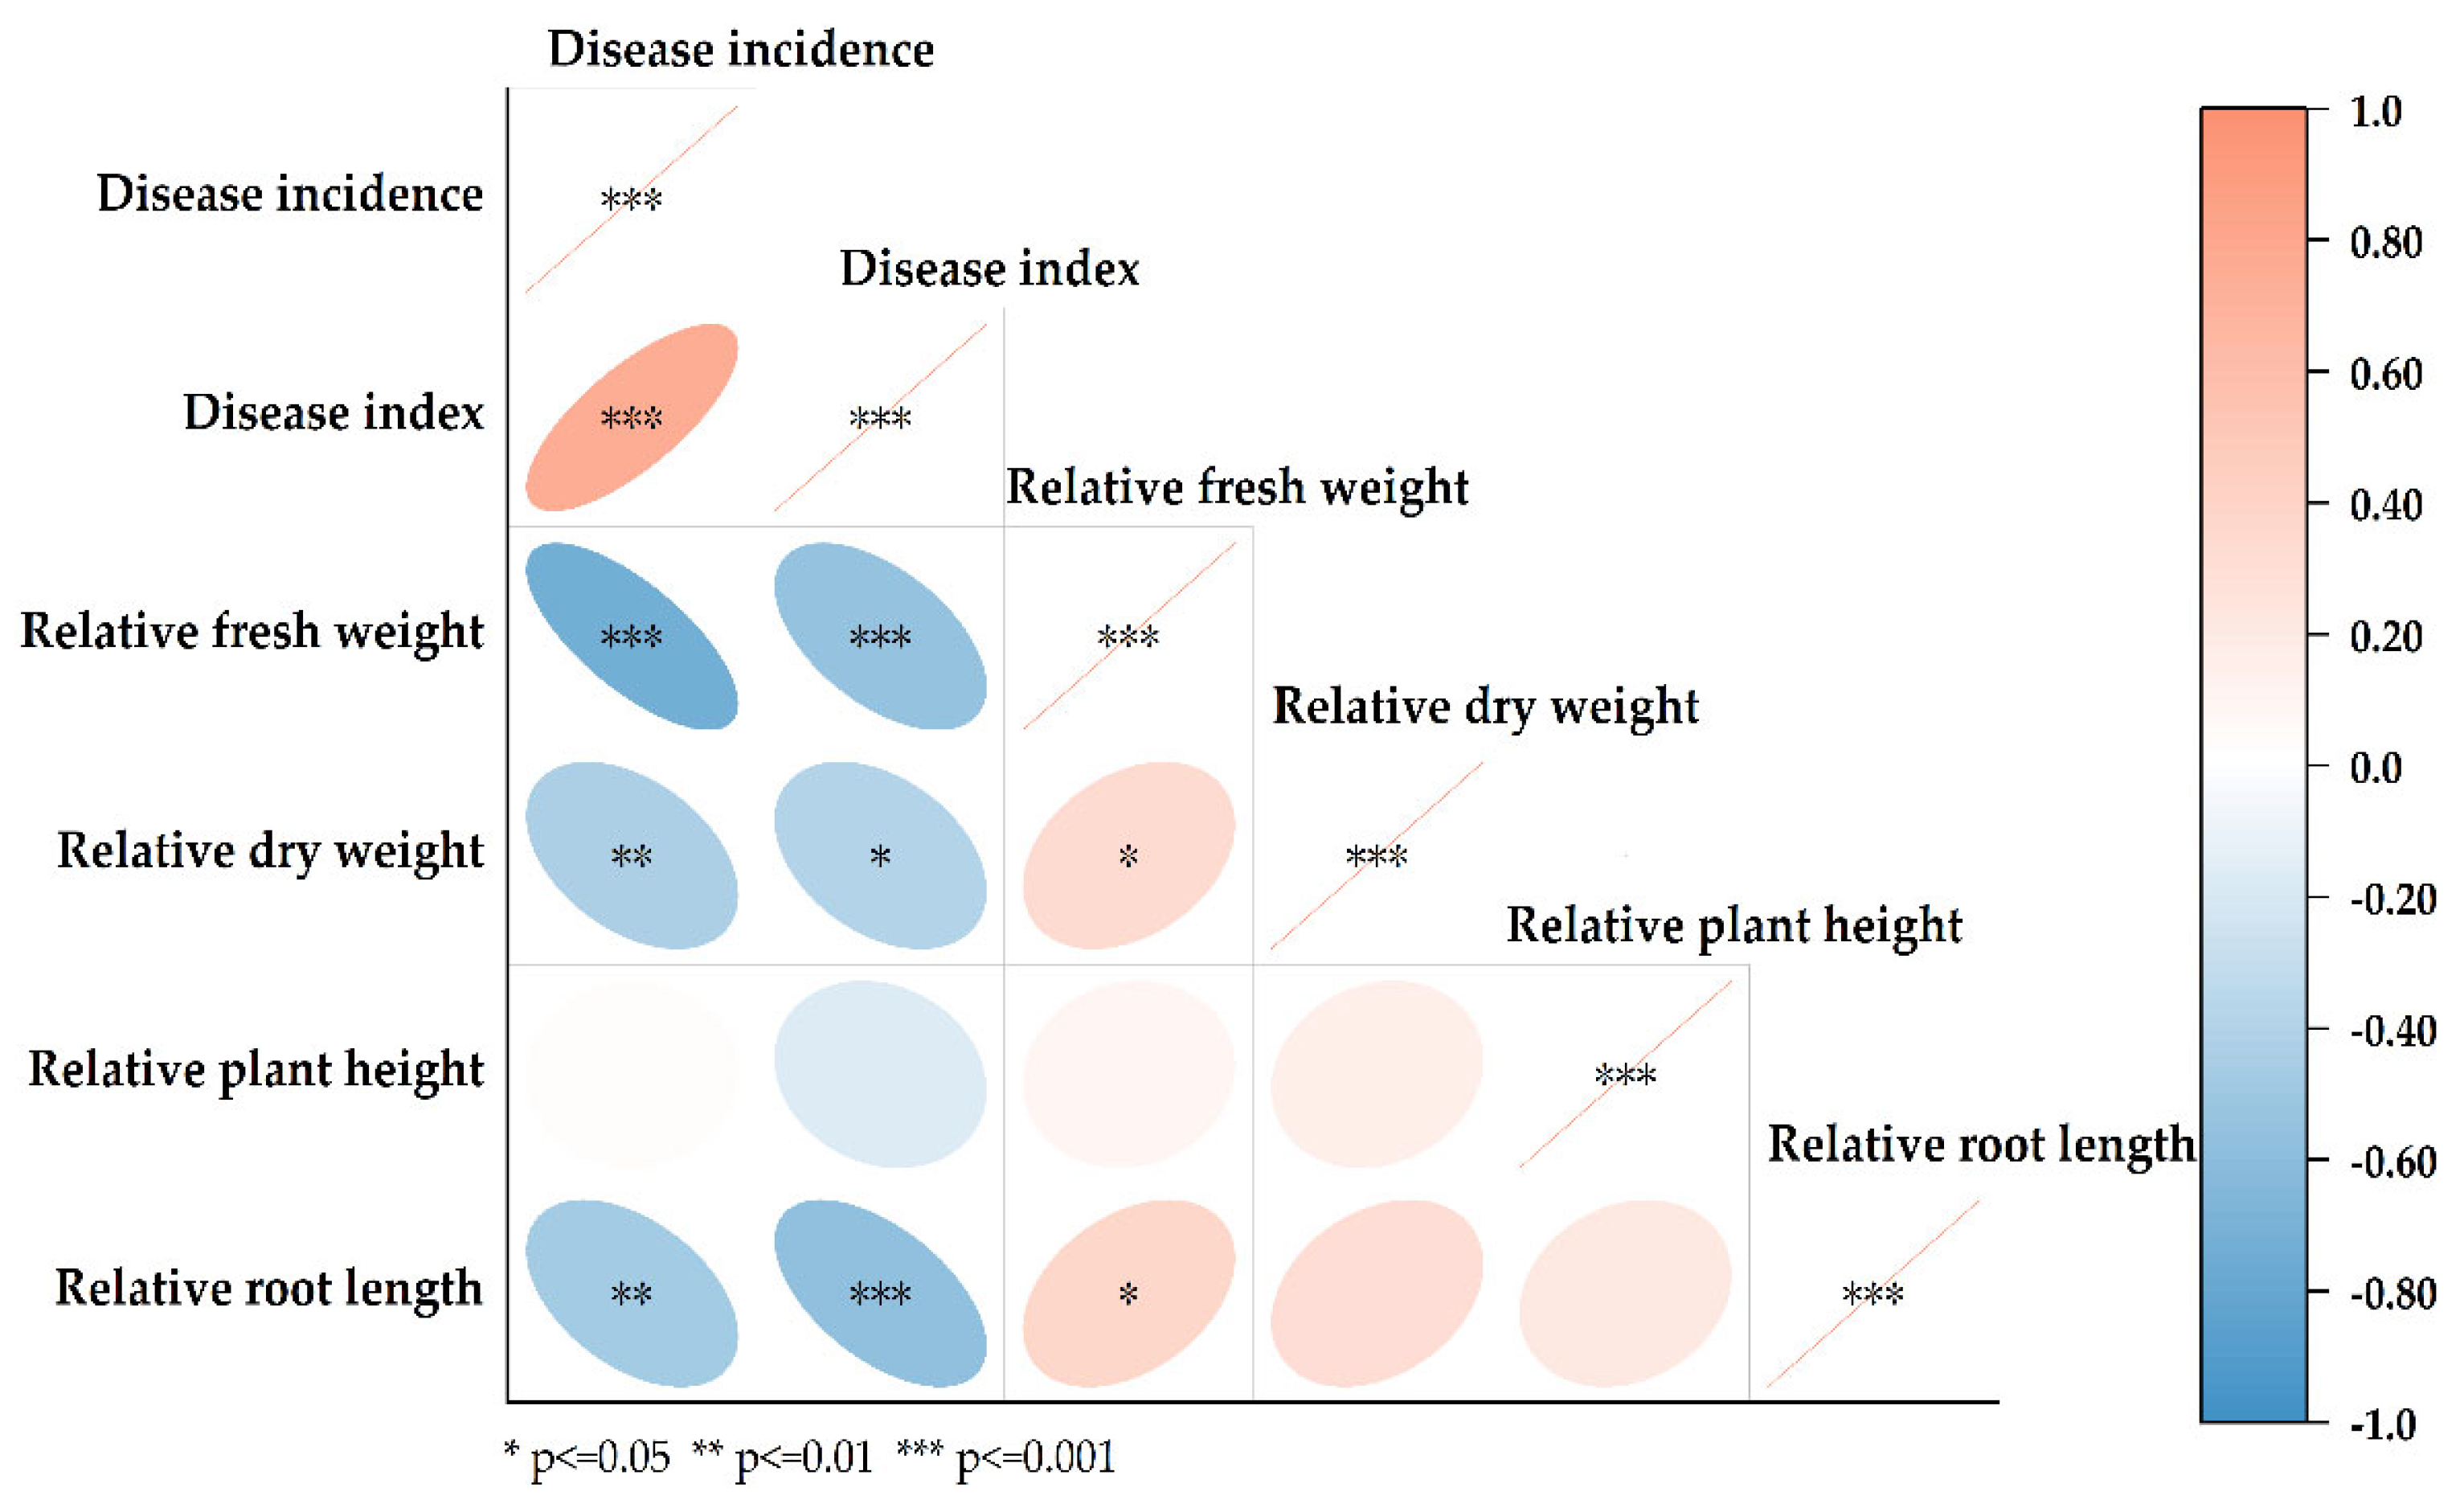
Pearson correlation analysis revealed significant associations between disease parameters and relative growth performance after inoculation with A. medicaginicola (Figure 2). Disease incidence was positively correlated with disease severity index (P≤0.001). Relative fresh weight was negatively correlated with both disease incidence and disease severity index (P≤0.001). Relative dry weight was also negatively correlated with disease incidence (P≤0.01) and disease index (P≤0.05). Similarly, relative root length showed significant negative correlations with disease incidence (P≤0.01) and disease severity index (P≤0.001). In contrast, relative plant height was not significantly correlated with either disease incidence or disease severity index.
Among relative growth traits, relative fresh weight was positively correlated with relative dry weight and relative root length (P≤0.05), whereas the other correlations among relative growth traits were not significant. Based on these results, disease incidence, disease severity index, relative fresh weight, relative dry weight, and relative root length were selected for comprehensive resistance evaluation, while relative plant height was excluded.

3.4. Comprehensive D-Value Ranking

Five indicators, namely disease incidence, disease severity index, relative fresh weight, relative dry weight, and relative root length, were used to calculate the comprehensive D value for each cultivar. The D values ranged from 0.0340 to 0.9611 (Table 3), indicating substantial differences in comprehensive resistance among the tested cultivars.
Magnum 2 had the highest D value (0.9611) and ranked first, followed by Gannong No. 3 (0.8548), Adrenalin (0.8410), and Dryland (0.7970). Vision (0.7241), Longdong (0.7075), and Gannong No. 6 (0.7068) showed intermediate-to-high comprehensive resistance, whereas Salt-tolerant star (0.5727) and Xinjiangdaye (0.4944) had intermediate D values. Aohan (0.3101), Zhongmu No. 1 (0.1484), and Thunder (0.0340) had the lowest D values, indicating weak comprehensive resistance to A. medicaginicola.

3.5. Comparison Between NAFA Classification and Integrated D-Value Evaluation

The NAFA classification based on healthy plant percentage was compared with the integrated D-value ranking (Table 4). The two methods showed consistent results for the most resistant and susceptible cultivars. Magnum 2 was classified as highly resistant by NAFA and ranked first according to the D value, whereas Thunder and Zhongmu No. 1 were classified as susceptible and had the lowest D values. Aohan was classified as low resistant and also ranked low in the integrated evaluation.
The integrated D-value evaluation further differentiated cultivars within the same NAFA class. Among the highly resistant cultivars, Magnum 2, Gannong No. 3, Adrenalin, and Dryland ranked higher than Vision and Longdong. Among the resistant cultivars, Gannong No. 6 showed a higher D value than Salt-tolerant star and Xinjiangdaye. These results suggest that the integrated D value provides additional resolution by combining disease response with relative growth performance after inoculation.

3.6. PCA-Based Differentiation of Resistance Responses Among Alfalfa Cultivars
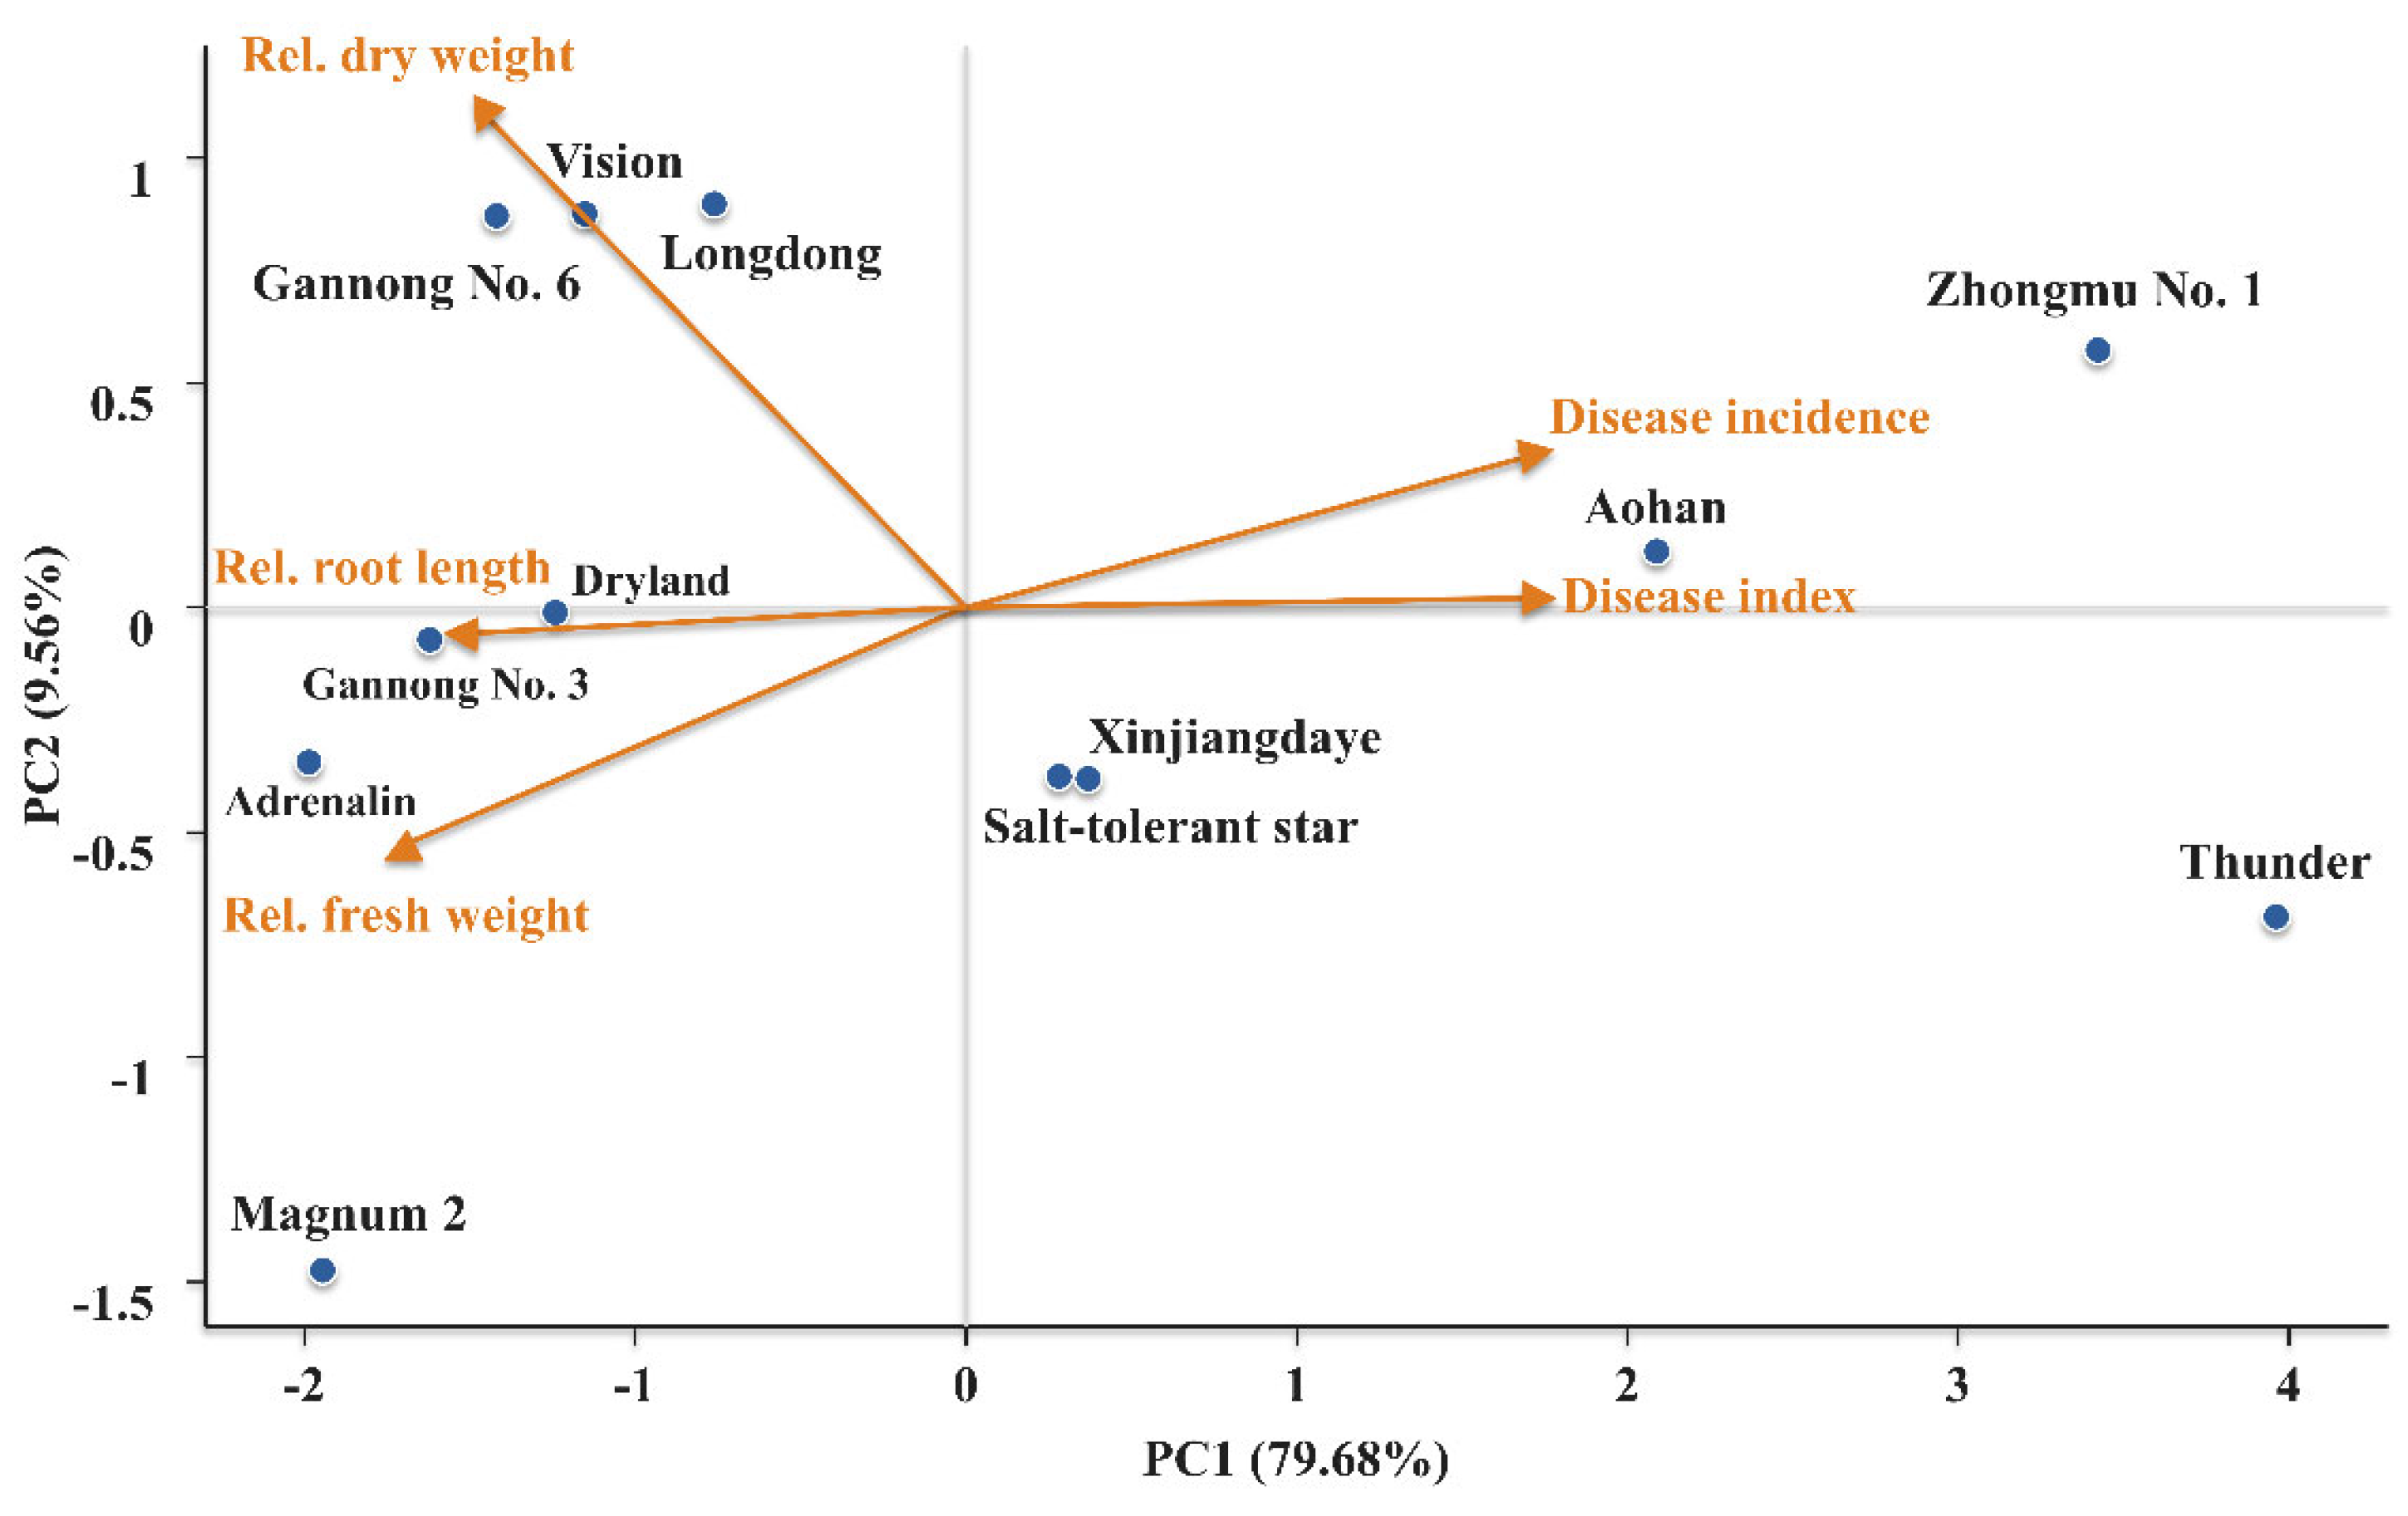
Principal component analysis (PCA) was performed using disease incidence, disease severity index, relative fresh weight, relative dry weight, and relative root length to further characterize resistance responses among the 12 alfalfa cultivars. The first two principal components explained 89.24% of the total variation, with PC1 and PC2 accounting for 79.68% and 9.56%, respectively.
PC1 was positively associated with disease incidence and disease severity index, but negatively associated with relative fresh weight, relative dry weight, and relative root length, indicating that this axis primarily represented the overall resistance–susceptibility gradient. Accordingly, Thunder, Zhongmu No. 1, and Aohan were located on the positive side of PC1, reflecting high disease levels and poor relative growth performance after inoculation. In contrast, Magnum 2, Gannong No. 3, Adrenalin, Dryland, Gannong No. 6, Longdong, and Vision were distributed on the negative side of PC1, indicating lower disease severity and better post-inoculation growth maintenance. Salt-tolerant star and Xinjiangdaye were positioned close to the origin, suggesting intermediate resistance responses.
PC2 was mainly influenced by relative dry weight and, to a lesser extent, relative fresh weight, and further separated cultivars with similar PC1 values. In particular, Gannong No. 6, Longdong, and Vision showed higher PC2 scores than Magnum 2, Gannong No. 3, Dryland, and Adrenalin, indicating differences in post-inoculation biomass performance among cultivars with relatively strong overall resistance. Overall, the PCA clearly differentiated resistant, intermediate, and susceptible cultivars, which was consistent with the integrated D-value ranking.
Figure 3. Principal component analysis (PCA) biplot of resistance-related traits among the 12 alfalfa cultivars after inoculation with A. medicaginicola. PCA was performed using disease incidence, disease severity index, relative fresh weight, relative dry weight, and relative root length. The first two principal components explained 89.24% of the total variation, with PC1 and PC2 accounting for 79.68% and 9.56%, respectively. Points represent alfalfa cultivars, and arrows indicate the contribution and direction of each variable. Disease incidence and disease severity index were positively associated with PC1, whereas relative fresh weight, relative dry weight, and relative root length were negatively associated with PC1. Cultivars located on the negative side of PC1 showed lower disease levels and better relative growth performance, whereas cultivars on the positive side of PC1 showed stronger disease responses and poorer post-inoculation growth performance.
Preprints 222542 g003

4. Discussion

ASBS is an important disease affecting alfalfa production, and accurate identification of resistant cultivars is essential for disease management and resistant germplasm utilization [29]. In this study, substantial variation in disease response was observed among the 12 alfalfa cultivars after inoculation with A. medicaginicola. At 14 days post-inoculation, typical foliar symptoms, including chlorosis, small circular to subcircular black spots, and leaf abscission, were observed on susceptible cultivars, whereas stem symptoms were not evident. This symptom pattern indicates that foliar symptoms were the main visible manifestation under the present greenhouse conditions and assessment time. Previous studies have shown that A. medicaginicola can infect multiple alfalfa organs, including leaves, stems, crowns, roots, and seeds, but disease expression is affected by host genotype, pathogen aggressiveness, environmental conditions, and evaluation stage [11,12,13,14,15,16,17]. Thus, the absence of obvious stem symptoms at 14 days after inoculation may reflect the relatively early evaluation period and controlled inoculation conditions rather than the full symptom spectrum of ASBS.
The tested cultivars differed markedly in disease incidence and disease severity index, indicating substantial genetic variation in resistance to A. medicaginicola. This finding agrees with previous observations that alfalfa cultivars differ significantly in their response to spring black stem and leaf spot [11,25]. Resistant cultivars are widely considered one of the most economical and environmentally sustainable approaches for managing alfalfa diseases [30]. Therefore, the resistant cultivars identified in this study may provide useful germplasm resources for cultivar deployment and resistance breeding.
A key feature of this study was the incorporation of relative growth performance into the evaluation of disease resistance. Disease incidence and disease severity index mainly reflect infection frequency and symptom development, whereas relative growth traits reflect the ability of cultivars to maintain biomass accumulation and root growth after infection. In plant–pathogen interactions, resistance and tolerance are conceptually distinct but complementary defense strategies: resistance reduces infection or pathogen development, whereas tolerance reduces the detrimental effect of infection on plant performance [31]. Therefore, evaluating disease symptoms alone may not comprehensively reflect the practical agronomic performance of cultivars exposed to pathogen stress. By adopting relative growth indicators, this study reduced the confounding effects of intrinsic vegetative differences among cultivars and provided a more biologically robust estimate of post-infection growth retention. Comparable relative biomass-related indices have previously been adopted for disease resistance screening in legume crops [32,33]. Similarly, an integrated assessment combining disease severity and relative biomass has been used to differentiate resistant and tolerant genotypes in pea root rot research [34].
The correlation analysis supported the biological relevance of relative growth performance for ASBS evaluation. Relative fresh weight, relative dry weight, and relative root length were negatively correlated with disease incidence and/or disease severity index, suggesting that severe disease development was associated with reduced post-infection growth performance. Relative plant height, however, was not significantly correlated with either disease incidence or disease severity index and was therefore excluded from the integrated evaluation. This result indicates that biomass- and root-related traits were more sensitive indicators of growth suppression caused by A. medicaginicola infection than plant height at the present evaluation stage.
The membership-function-based D value provided a quantitative framework for integrating disease response and relative growth performance. Based on the five selected indicators, Magnum 2, Gannong No. 3, Adrenalin, and Dryland showed the highest D values, indicating superior comprehensive resistance. In contrast, Thunder, Zhongmu No. 1, and Aohan had the lowest D values, indicating weak comprehensive resistance. The membership function approach converts traits with different units and directions into comparable values and integrates them into a single comprehensive score. This method has been widely used in plant stress-resistance evaluation because it reduces the bias associated with single-indicator assessment [35]. In the present study, the D value did not replace the conventional NAFA classification but provided additional resolution within the same NAFA category. For example, several cultivars were classified as highly resistant by NAFA, but their D values differed, indicating differences in relative growth performance and overall resistance. Thus, the integrated D-value approach may be particularly useful for distinguishing cultivars with similar disease-incidence-based classifications but different post-infection growth maintenance.
The PCA provided additional support for the integrated evaluation by showing that the selected disease and relative growth indicators jointly captured the major variation in cultivar responses. Rather than relying on a single disease-related trait, the PCA separated cultivars along a resistance–susceptibility gradient defined by opposite contributions of disease development and post-infection growth maintenance.
Taken together, the results suggest that alfalfa resistance to ASBS should not be interpreted solely as reduced disease incidence or lower disease severity index. Cultivars may differ in at least two important components: their ability to restrict disease development and their ability to maintain growth after infection. Magnum 2 represented a cultivar with both low disease levels and strong relative growth performance, whereas Thunder and Zhongmu No. 1 represented susceptible types with severe disease and poor growth maintenance. Gannong No. 6, Longdong, and Vision showed relatively strong post-infection biomass maintenance, suggesting that they may possess useful growth-retention characteristics even when their disease response was not the lowest. Such differentiation is important for breeding and cultivar selection because production value depends not only on symptom suppression but also on the maintenance of forage biomass under disease pressure.
Nevertheless, this study has several limitations. The evaluation was conducted under greenhouse conditions and performed at 14 days post-inoculation, when foliar symptoms were evident but stem symptoms were not yet obvious. Future studies should include multiple assessment times to capture disease progression and the full symptom spectrum of ASBS. In addition, this study focused on phenotypic resistance evaluation and did not examine the physiological, biochemical, or molecular mechanisms underlying cultivar differences. Future work should combine multi-year field trials with yield, forage-quality, and mechanistic analyses to confirm the stability and practical value of the resistant and growth-maintaining cultivars identified here.

5. Conclusions

In this study, a multi-indicator evaluation framework was established to quantify alfalfa resistance against spring black stem and leaf spot (ASBS) based on disease incidence, disease severity index and relative growth performance after inoculation with A. medicaginicola. Disease incidence and disease severity index were negatively correlated with relative fresh weight, relative dry weight, and relative root length, suggesting that disease progression was closely associated with post-infection growth inhibition. According to the comprehensive D-value ranking, Magnum 2 exhibited the highest comprehensive resistance, followed by Gannong No. 3, Adrenalin, and Dryland, whereas Thunder, Zhongmu No. 1, and Aohan showed weak resistance. Compared with the conventional NAFA classification, the D-value-based integrated evaluation provided higher discriminatory power and enabled finer differentiation of cultivars within the same resistance category. PCA further supported the categorization of tested cultivars into resistant, intermediate, and susceptible groups. Collectively, these findings show that combining disease severity with relative growth performance enables a more holistic and biologically plausible assessment of alfalfa ASBS resistance. The resistant cultivars screened here and the optimized evaluation framework may facilitate resistant germplasm screening, cultivar utilization, and integrated management of ASBS.

Supplementary Materials

The following supporting information can be downloaded at: https://www.mdpi.com/article/doi/s1, Figure S1: Symptom development on leaves of Thunder-inoculated and non-inoculated control plants at 14 days post-inoculation.

Author Contributions

Conceptualization, S.C.; methodology, S.C., X.L. and Z.Z.; software, S.C. and X.L.; formal analysis, S.C. and X.L.; investigation, S.C., X.L. and Z.Z.; data curation, S.C. and X.L.; writing—original draft preparation, S.C.; writing—review and editing, S.C.; visualization, S.C. and X.L.; supervision, S.C.; funding acquisition, S.C. All authors have read and agreed to the published version of the manuscript.

Funding

This research was funded by the Innovation Fund Project for University Teachers in Gansu Province, grant number 2026A-072.

Data Availability Statement

The original data supporting the findings of this study are included in the article and Supplementary Materials. Further inquiries can be directed to the corresponding author.

Acknowledgments

During the preparation of this manuscript, the authors used ChatGPT (OpenAI, San Francisco, CA, USA) for English language editing, grammar checking, and improvement of clarity. The authors reviewed and edited all AI-assisted output and take full responsibility for the content of this publication.

Conflicts of Interest

The authors declare no conflict of interest.

Abbreviations

The following abbreviations are used in this manuscript:
ASBS Alfalfa spring black stem and leaf spot
NAFA National Alfalfa and Forage Alliance
PDA Potato Dextrose Agar
PCA Principal component analysis

References

  1. Akber, M.A.; Fang, X. Research progress on diseases caused by the soil-borne fungal pathogen Rhizoctonia solani in alfalfa. Agronomy 2024, 14, 1483. [Google Scholar] [CrossRef]
  2. Mielmann, A. The utilisation of lucerne (Medicago sativa): A review. Br. Food J. 2013, 115, 590–600. [Google Scholar] [CrossRef]
  3. Nan, Z.B. Establish a sustainable management system for pasture diseases in China. Acta Prataculturae Sin. 2000, 9, 1–9. [Google Scholar]
  4. Zhang, L.; Li, Y. Occurrence and nutrition indicators of alfalfa with Leptosphaerulina in Chifeng, Inner Mongolia. Agriculture 2022, 12, 1465. [Google Scholar] [CrossRef]
  5. Zhou, W.; Lan, Y.; Matthew, C.; Nan, Z. A biological comparison of three Colletotrichum species associated with alfalfa anthracnose in northern China. Plants 2024, 13, 1780. [Google Scholar] [CrossRef] [PubMed]
  6. Liu, F.; Baisitan, Z.; Li, J.Q. First report of Colletotrichum liriopes causing anthracnose on alfalfa (Medicago sativa) in Xinjiang, China. Plant Dis. 2024, 108, 2234. [Google Scholar] [CrossRef]
  7. Willbur, J.; Undersander, D.; Blonde, G.; Lamb, J.F.S. Epidemiology and management of Pseudopeziza brown leaf spot of alfalfa in the north-central United States. Crop Sci. 2022, 62, 1123–1134. [Google Scholar] [CrossRef]
  8. Lan, Y.; Zhou, W.; Duan, T.; Li, Y.; Matthew, C.; Nan, Z. Alfalfa Spring Black Stem and Leaf Spot Disease Caused by Phoma medicaginis: Epidemic Occurrence and Impacts. Microorganisms 2024, 12, 1279. [Google Scholar] [CrossRef] [PubMed]
  9. Boerema, G.H.; Dorenbosch, M.M.J.; Leffring, L. A comparative study of the black stem fungi on lucerne and red clover and the footrot fungus on pea. Neth. J. Plant Pathol. 1965, 71, 79–89. [Google Scholar] [CrossRef]
  10. Chen, Q.; Jiang, J.R.; Zhang, G.Z.; Cai, L.; Crous, P.W. Resolving the Phoma enigma. Stud. Mycol. 2015, 82, 137–217. [Google Scholar] [CrossRef] [PubMed]
  11. Rhodes, L.H.; Myers, D.K. Severity of spring black stem on alfalfa cultivars in Ohio. Plant Dis. 1986, 70, 746–748. [Google Scholar] [CrossRef]
  12. Djebali, N. Aggressiveness and host range of Phoma medicaginis isolated from Medicago species growing in Tunisia. Phytopathol. Mediterr. 2013, 52, 3–15. [Google Scholar] [CrossRef]
  13. Castell-Miller, C.V.; Zeyen, R.J.; Samac, D.A. Infection and development of Phoma medicaginis on moderately resistant and susceptible alfalfa genotypes. Can. J. Plant Pathol. 2007, 29, 290–298. [Google Scholar] [CrossRef]
  14. Gray, F.A.; Fernandez, J.A.; Horton, J.L. Variation among isolates of Phoma medicaginis var. medicaginis in spore production in vitro and symptom expression on excised leaves of alfalfa. Plant Dis. 1990, 74, 668–670. [Google Scholar] [CrossRef]
  15. Rodríguez, R.D.P. Comparative variation of Phoma medicaginis Malbr. Roum. var. medicaginis Boerema for cultural characteristics and virulence to roots and crowns of alfalfa. J. Agric. Univ. P. R. 2005, 89, 229–242. [Google Scholar] [CrossRef]
  16. Rodriguez, R.; Leath, K.T.; Hill, R.R. Pathogenicity of Phoma medicaginis var. medicaginis to roots of alfalfa. Plant Dis. 1990, 74, 680–683. [Google Scholar] [CrossRef]
  17. Mead, H.W. Studies on Ascochyta imperfecta Peck. Differential utilization of nutrients by isolates from Canadian alfalfa seed. Can. J. Bot. 1961, 39, 1591–1594. [Google Scholar] [CrossRef]
  18. Barbetti, M.J. Effects of temperature and humidity on diseases caused by Phoma medicaginis and Leptosphaerulina trifolii in lucerne (Medicago sativa). Plant Pathol. 1991, 40, 296–301. [Google Scholar] [CrossRef]
  19. Rizvi, S.S.A.; Nutter, F.W., Jr. Seasonal dynamics of alfalfa foliar pathogens in Iowa. Plant Dis. 1993, 77, 1126–1135. [Google Scholar] [CrossRef]
  20. Zhang, L.; Pan, L.Q.; Wang, S.R.; Yuan, Q.H.; Wang, Y.; Miao, L.H. Study on the biological characteristics of the alfalfa Phoma leaf spot pathogen. J. China Agric. Univ. 2015, 20, 158–166. [Google Scholar]
  21. Hwang, S.F.; Wang, H.; Gossen, B.D.; Chang, K.F.; Turnbull, G.D.; Howard, R.J. Impact of foliar diseases on photosynthesis, protein content and seed yield of alfalfa and efficacy of fungicide application. Eur. J. Plant Pathol. 2006, 115, 389–399. [Google Scholar] [CrossRef]
  22. Fields, R.L.; Barrell, G.K.; Gash, A.; Zhao, J.; Moot, D.J. Alfalfa coumestrol content in response to development stage, fungi, aphids, and cultivar. Agron. J. 2018, 110, 910–921. [Google Scholar] [CrossRef]
  23. Irish, B.M.; Samac, D.; Porter, L.D.; Heineck, G.C. Evaluating Medicago spp. plant genetic resources for resistance to spring black stem and leaf spot pathogen. Crop Prot. 2026, 201, 107485. [Google Scholar] [CrossRef]
  24. National Alfalfa; Forage Alliance. Alfalfa Variety Ratings: Winter Survival, Fall Dormancy & Pest Resistance Ratings for Alfalfa Varieties. 2026. Available online: https://www.alfalfa.org/varietyLeaflet.php (accessed on 29 May 2026).
  25. Zhang, L.; Pan, L.Q.; Yuan, Q.H.; Wang, S.R.; Wang, Y.; Miao, L.H. Evaluation of resistance of different alfalfa germplasm materials to Phoma leaf spot. Acta Agrestia Sin. 2016, 24, 652–657. [Google Scholar]
  26. Zhang, Y.Y.; Li, F.; Liang, W.W.; Li, Y.Z. Field evaluation of disease resistance of 32 alfalfa (Medicago sativa) cultivars in Changji, Xinjiang. Acta Prataculturae Sin. 2022, 31, 133–146. [Google Scholar]
  27. Cao, S.; Li, H.X.; Cao, S.R. Evaluation of resistance of different alfalfa varieties to Paraphoma root rot. Acta Prataculturae Sin. 2024, 33, 123–134. [Google Scholar] [CrossRef]
  28. Niu, R.; Zhao, X.; Wang, C.; Wang, F. Physiochemical responses and ecological adaptations of peach to low-temperature stress: Assessing the cold resistance of local peach varieties from Gansu, China. Plants 2023, 12, 4183. [Google Scholar] [CrossRef] [PubMed]
  29. Akber, M.A.; Chu, S.; Fang, X. Development of an Assessment Method for Host Resistance of Alfalfa to Root Rot Caused by Rhizoctonia solani. Grass Forage Sci. 2025, 80, e12724. [Google Scholar] [CrossRef]
  30. Yang, B.; Zhao, Y.; Guo, Z. Research Progress and Prospect of Alfalfa Resistance to Pathogens and Pests. Plants 2022, 11, 2008. [Google Scholar] [CrossRef] [PubMed]
  31. Pagán, I.; García-Arenal, F. Tolerance to plant pathogens: Theory and experimental evidence. Int. J. Mol. Sci. 2018, 19, 810. [Google Scholar] [CrossRef] [PubMed]
  32. Heineck, G.C.; Altendorf, K.R.; Coyne, C.J.; Ma, Y.; McGee, R.; Porter, L.D. Phenotypic and Genetic Characterization of the Lentil Single Plant-Derived Core Collection for Resistance to Root Rot Caused by Fusarium avenaceum. Phytopathology 2022, 112, 1979–1987. [Google Scholar] [CrossRef] [PubMed]
  33. Irum, S.; Khalid, M.H.B.; Hussain, T.; Saeed, A.; Haider, I.; Ahmed, Z.; Iqbal, R.; AlKubaisi, N.; Elshikh, M.S. Comprehensive evaluation of agronomic traits, physiological responses, and gene expression in chickpea cultivars under fungal stress. Funct. Plant Biol. 2025, 52, 10. [Google Scholar] [CrossRef] [PubMed]
  34. Wille, L.; Messmer, M.M.; Bodenhausen, N.; Studer, B.; Hohmann, P. Heritable Variation in Pea for Resistance Against a Root Rot Complex and Its Characterization by Amplicon Sequencing. Front. Plant Sci. 2020, 11, 542153. [Google Scholar] [CrossRef] [PubMed]
  35. Hu, M.; Liu, H.; Zhang, F.; Yang, K.; Zhang, D.; Ding, S.; Tian, H. Screening of Salt Tolerance of Maize (Zea mays L.) Lines Using Membership Function Value and GGE Biplot Analysis. PeerJ 2024, 12, e16838. [Google Scholar] [CrossRef] [PubMed]
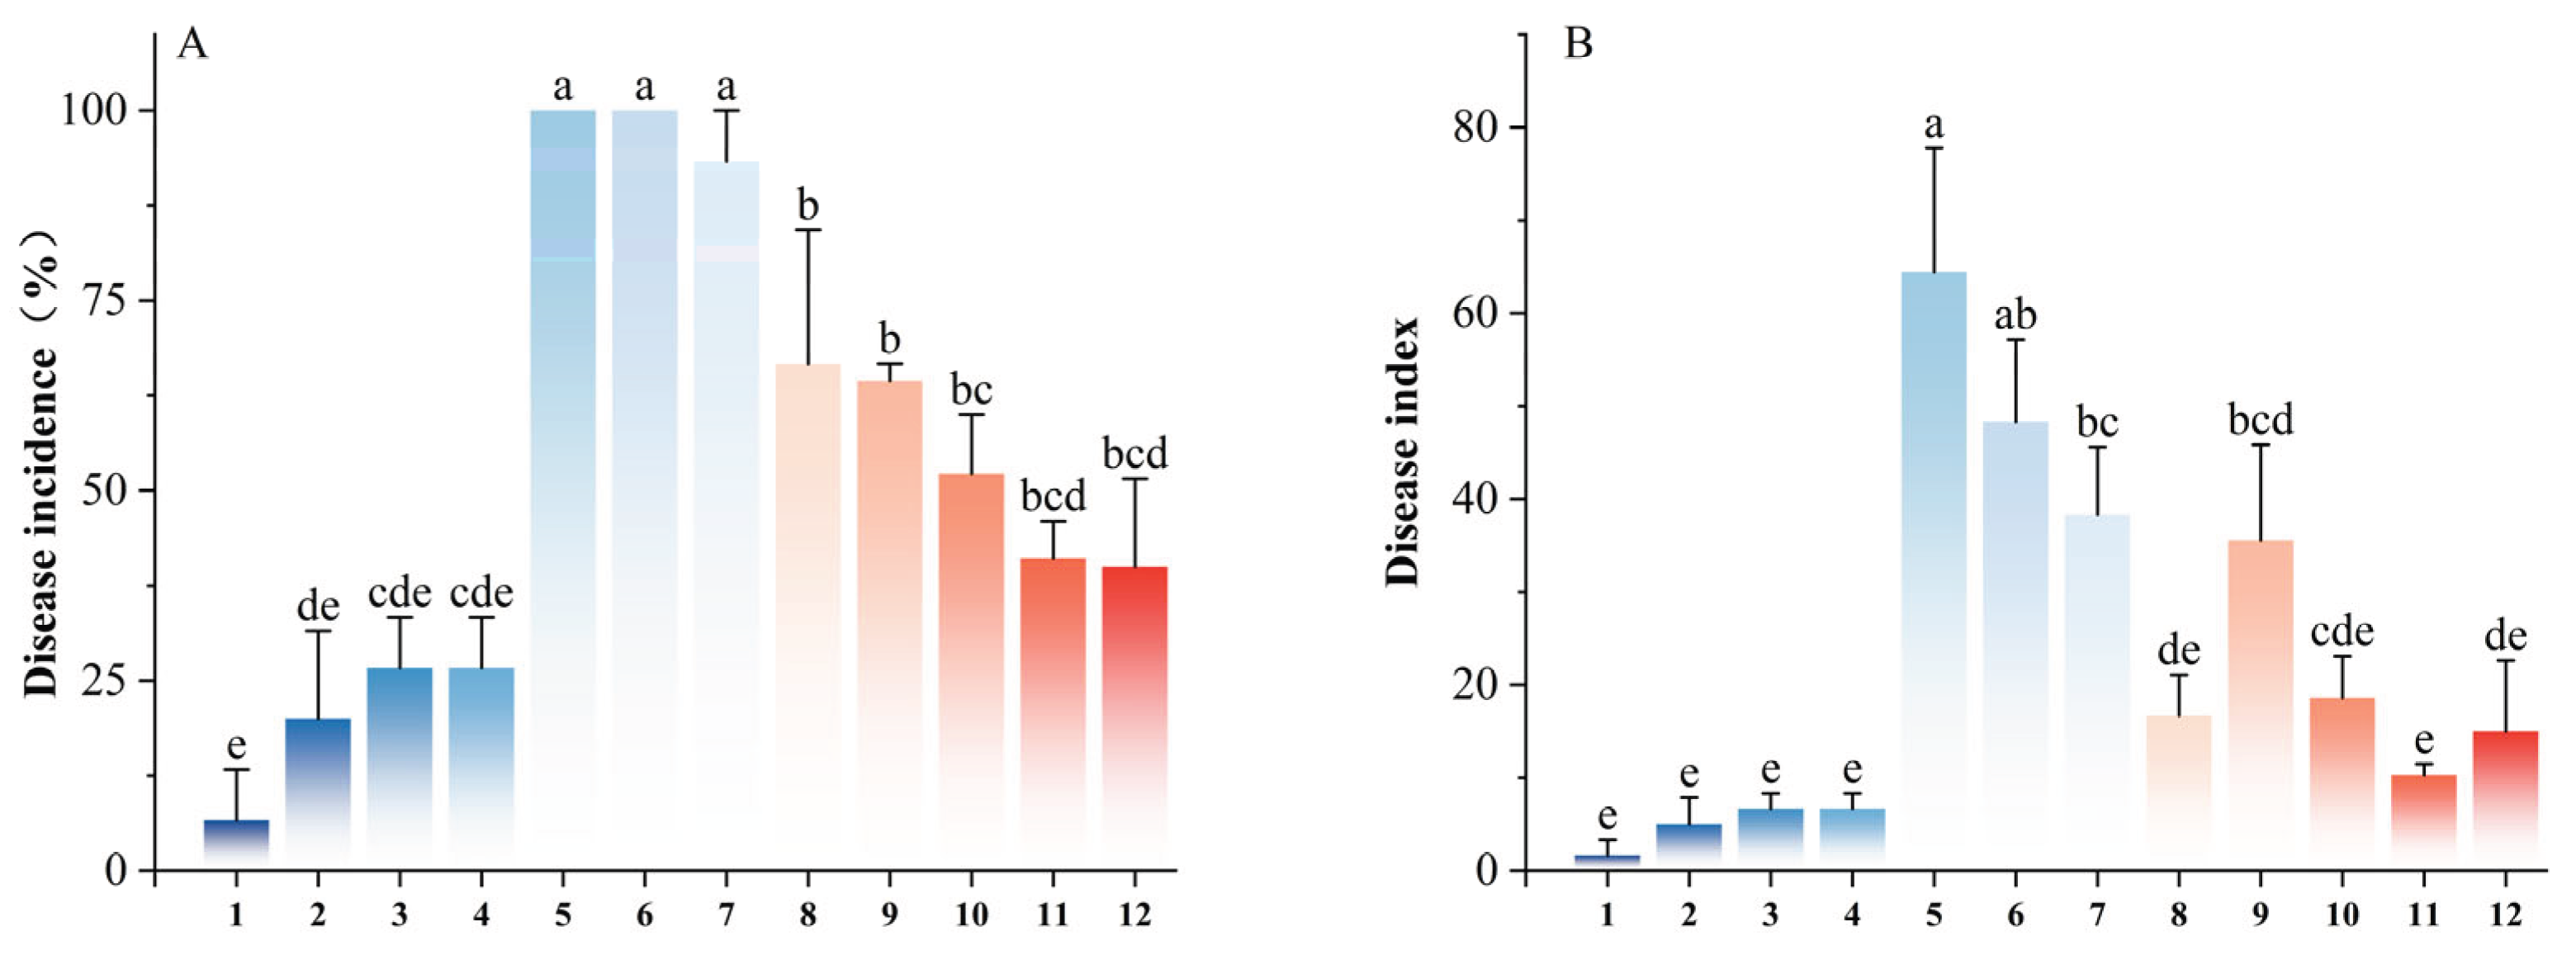
Figure 1. Disease incidence (A) and disease severity index (B) of the tested alfalfa cultivars. Note: The numbers on the x-axis correspond to the cultivar numbers listed in Table 1. Different lowercase letters indicate significant differences among cultivars at P<0.05, as determined by one-way ANOVA followed by Duncan’s test.
Preprints 222542 g001
Figure 2. Correlation heatmap of disease-related variables and relative growth performance traits after inoculation. Note: Color intensity is proportional to the magnitude of the Pearson correlation coefficient. Brown indicates positive correlations, whereas blue indicates negative correlations.
Preprints 222542 g002
Table 1. Alfalfa cultivars and seed sources.
Number Varieties Country Seed sources
1 Magnum 2 United States Beijing Clover Company
2 Gannong No. 3 China Gansu Academy of Agricultural Sciences
3 Dryland United States Beijing Clover Company
4 Adrenalin Canada Xinjiang Agricultural University
5 Thunder United States Beijing Clover Company
6 Zhongmu No. 1 China Chinese Academy of Agricultural Sciences
7 Aohan China Inner Mongolia Agricultural University
8 Salt-tolerant star United States Beijing Clover Company
9 Xinjiangdaye China Xinjiang Agricultural University
10 Gannong No. 6 China Gansu Academy of Agricultural Sciences
11 Longdong China Gansu Agricultural University
12 Vision United States Beijing Clover Company
Table 2. Relative growth performance of 12 alfalfa cultivars after inoculation with A. medicaginicola.
Number Varieties Relative fresh weight (%) Relative dry weight (%) Relative plant height (%) Relative root length (%)
1 Magnum 2 83.73±5.27a 65.49±6.83ab 79.97±7.49ab 85.29±2.90ab
2 Gannong No. 3 75.74±4.53ab 83.68±28.51ab 75.55±1.23ab 76.10±11.59abcd
3 Dryland 65.48±20.41abc 80.27±5.68ab 73.35±1.61ab 78.66±7.15abcd
4 Adrenalin 86.11±4.19a 82.30±14.29ab 90.13±2.72ab 84.29±1.76abc
5 Thunder 29.24±2.05cd 42.93±8.82b 69.75±1.89b 58.15±4.93de
6 Zhongmu No. 1 21.70±5.47d 61.43±13.44ab 74.99±8.59ab 52.96±3.53e
7 Aohan 37.57±9.42bcd 61.73±3.39ab 89.30±0.72ab 69.12±11.11bcde
8 Salt-tolerant star 74.69±15.80ab 70.14±4.86ab 82.18±8.09ab 62.77±1.75cde
9 Xinjiangdaye 61.86±15.57abc 67.00±3.49ab 79.75±8.59ab 82.42±6.47abc
10 Gannong No. 6 66.82±1.50abc 92.62±16.96a 78.40±10.57ab 92.08±5.66a
11 Longdong 56.12±18.39abcd 89.73±2.62a 83.62±6.57ab 73.07±2.43abcde
12 Vision 65.92±15.16abc 93.22±12.36a 91.79±4.59a 77.63±9.31abcd
Table 3. Membership function values and comprehensive D values of the 12 alfalfa cultivars.
Cultivar Membership function value D-value Rank
μ (1) μ (2) μ (3) μ (4) μ (5)
Magnum 2 1.000 1.000 0.963 0.449 0.826 0.9611 1
Gannong No. 3 0.857 0.947 0.839 0.810 0.592 0.8548 2
Dryland 0.786 0.920 0.680 0.742 0.657 0.7970 4
Adrenalin 0.786 0.920 1.000 0.783 0.801 0.8410 3
Thunder 0.000 0.000 0.117 0.000 0.133 0.0340 12
Zhongmu No. 1 0.000 0.257 0.000 0.368 0.000 0.1484 11
Aohan 0.071 0.416 0.246 0.374 0.413 0.3101 10
Salt-tolerant star 0.357 0.761 0.823 0.541 0.251 0.5727 8
Xinjiangdaye 0.381 0.460 0.623 0.478 0.753 0.4944 9
Gannong No. 6 0.512 0.730 0.701 0.988 1.000 0.7068 7
Longdong 0.631 0.863 0.534 0.931 0.514 0.7075 6
Vision 0.643 0.788 0.687 1.000 0.631 0.7241 5
Note: μ (1), μ (2), μ (3), μ (4), and μ (5) represent the membership function values for disease incidence, disease severity index, relative fresh weight, relative dry weight, and relative root length, respectively.
Table 4. Comparison between NAFA classification and integrated D-value ranking.
Cultivar NAFA class D-value Rank Comparative interpretation
Magnum 2 HR 0.9611 1 Concordant; highest comprehensive resistance
Gannong No. 3 HR 0.8548 2 HR; high D value within the same NAFA category
Adrenalin HR 0.8410 3 HR; high D value within the same NAFA category
Dryland HR 0.7970 4 HR; high D value within the same NAFA category
Vision HR 0.7241 5 HR; slightly lower D value than top HR cultivars
Longdong HR 0.7075 6 HR; slightly lower D value than top HR cultivars
Gannong No. 6 R 0.7068 7 R; higher D value among R cultivars
Salt-tolerant star R 0.5727 8 R; intermediate comprehensive resistance
Xinjiangdaye R 0.4944 9 R; intermediate comprehensive resistance
Aohan LR 0.3101 10 LR; low integrated resistance
Zhongmu No. 1 S 0.1484 11 S; consistently susceptible
Thunder S 0.0340 12 S; consistently susceptible
Disclaimer/Publisher’s Note: The statements, opinions and data contained in all publications are solely those of the individual author(s) and contributor(s) and not of MDPI and/or the editor(s). MDPI and/or the editor(s) disclaim responsibility for any injury to people or property resulting from any ideas, methods, instructions or products referred to in the content.
Copyright: This open access article is published under a Creative Commons CC BY 4.0 license, which permit the free download, distribution, and reuse, provided that the author and preprint are cited in any reuse.
Prerpints.org logo

Preprints.org is a free preprint server supported by MDPI in Basel, Switzerland.

Subscribe

© 2026 MDPI (Basel, Switzerland) unless otherwise stated

Accessibility

Disclaimer

Terms of Use

Privacy Policy

Privacy Settings