

Submitted:
09 July 2026
Posted:
10 July 2026
You are already at the latest version
Abstract
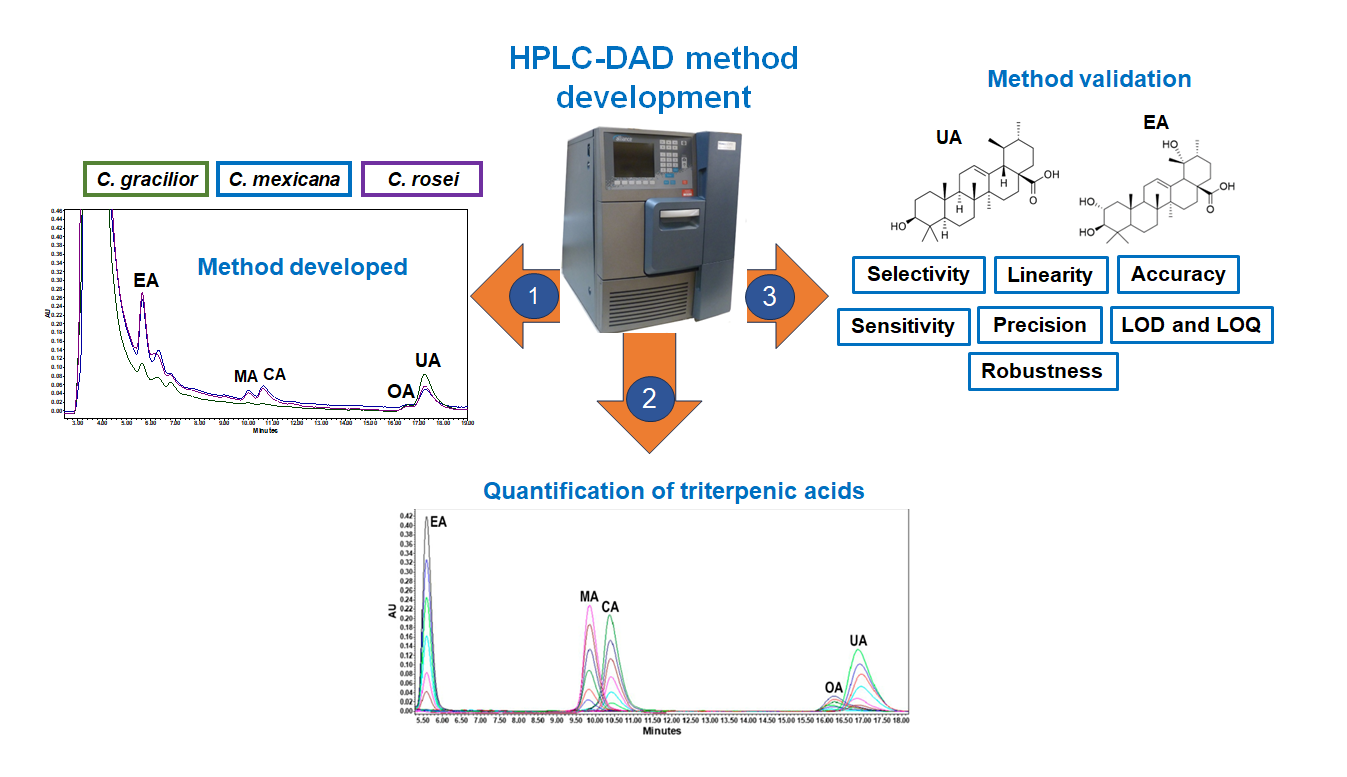
Plants of the genus Crataegus have been used in traditional medicine to treat different health conditions, mainly cardiovascular diseases. Standardized extracts from this genus are marketed in Europe and Asia for the treatment of heart failure. In recent years, our research group has demonstrated that Crataegus gracilior, C. rosei, and C. mexicana exert significant vasorelaxing effects and that their most abundant and vasorelaxant constituents are the triterpenic acids they contain. Therefore, an HPLC-DAD analytical method was developed to simultaneously identify and quantify euscaphic, maslinic, corosolic, oleanolic, and ursolic acids, the main chemical constituents of the leaves of these three Mexican Crataegus species. Euscaphic acid was found to be the main compound in both C. rosei and C. mexicana while ursolic acid in C. gracilior. Therefore, these two acids were selected as their most suitable chemical and pharmacological markers. Accordingly, the developed method was validated for the two acids following the ICH Q2(R1) and USP guidelines. This method can be used for quality control of any crude commercial drugs produced from these species in the future.
Keywords:
Mexican Crataegus
; HPLC-DAD
; method development
; validation
; triterpene acids
; markers
1. Introduction
The genus Crataegus (Rosaceae) encompasses approximately 1,000 species that are distributed across Asia, Europe [1], and North America. Fifteen of these species are found in Mexico, of which only nine or ten are endemic [2]. Of these, C. gracilior and C. mexicana are the most commercially significant due to their wide distribution, production and fruits marketing [3,4]. Pharmacological studies have shown that these two species, together with C. rosei, present vasodilatory [5,6,7,8] and antioxidant [9,10] effects. Furthermore, C. gracilior exerts cytotoxic and proapoptotic effects on breast cancer cells [11]. The compounds identified in these species include flavonoids, phenolic acids, sterols (β-sitosterol), tocopherol, and triterpenenic acids [5,11].
Triterpenes are the largest group of secondary metabolites, which can be isolated from various plant species, fungi, marine invertebrates, and algae. Approximately 30,000 triterpenes have been identified [12,13], with more than 100 structural subtypes such as lupane, hopane, ursane, and oleanane. These skeletons form the basis of the pentacyclic triterpenes, which are frequently identified in plants [12,14]. Oleanolic and ursolic acids are the most common triterpenic acids derived from these skeletons [12]. Some triterpenic acids derived from the ursane and oleanane skeletons have also been identified in Mexican Crataegus species [5,6,8].
In recent years, the study of triterpenic acids has gained importance [15] due to their reported multiple biological effects, including anti-inflammatory, antioxidant, antiviral, antidiabetic, antitumor, antiparasitic, cytotoxic, hepatoprotective, lipolytic, and cardioprotective activities, among others [15,16]. Moreover, some of these triterpenic acids have been proven to present high therapeutic potential [17], while others are marketed as dietary supplements [18]. Given the economical and pharmacological importance of there three Mexican Crataegus species, and triterpenic acids as specific agents with therapeutic potential, an analytical method using HPLC-DAD was developed to identify and quantify the five most abundant triterpenic acids found in these three species. Additionally, the present study validated the analytical method used to quantify euscaphic and ursolic acids, the overall major constituents, with the aim of proposing them as chemical and pharmacological markers. Their selection as markers will contribute to establishing identity criteria for the three species and, eventually, for other Mexican Crataegus species, thus guaranteeing the quality and efficacy of products or phytomedicines obtained from them.
2. Materials and Methods
2.1. Solvents and Standards
Solvents produced by J.T. Baker® were used for both the preparation of the methanolic extracts and the chromatographic analyses (HPLC-DAD) conducted by the present study. The standard ursolic and oleanolic acids were purchased from Sigma-Aldrich®, while the other three triterpenic acids were purified in the authors’ laboratory and identified through their Nuclear Magnetic Resonance (NMR) spectra [8].
2.2. Plant Material
The Crataegus gracilior leaves used by the present study were collected in Pinal de Amoles, Querétaro, Mexico, in November 2012, while the C. rosei leaves were collected in Mesa de Jesús, San Luis de la Paz, Guanajuato, Mexico, in September 2022, and the C. mexicana leaves in Comonfort, Guanajuato, Mexico, in September 2022. The specimens were then authenticated and deposited in the Ethnobotanical Collection of the Dr. Jerzy Rzedowski Herbarium of the Faculty of Natural Sciences at the Autonomous University of Querétaro, Mexico. The voucher numbers assigned to Crataegus gracilior, C. rosei, and C. mexicana were A. Cabrera 5667, QMEX00006853, and Mah-7228, respectively. All leaves were dried in a custom-designed oven at 40°C for five days.
2.3. Methanolic Extracts Preparation
Dry C. gracilior, C. mexicana, and C. rosei leaves (21.9, 18.1, and 1416 g, respectively) were ground and macerated first with hexane, followed by dichloromethane and, finally, methanol, with all extracts then brought to complete dryness. Based on previous findings obtained by our research group, solely the methanolic extracts were examined further by the present study, as they contain the highest levels of the triterpenic acids.
2.4. Chromatographic Conditions
2.4.1. Development of the Analytical Method
The triterpenic acids were analyzed and quantified, via HPLC-DAD, using an instrument obtained from the Chromatography Division of Waters Corporation, Milford, MA, USA, and comprising an e2695 quaternary pump and a 2998 diode array detector (DAD). A Zorbax XDB-C18 column (4.6 mm i.d. x 150 mm, 5 microns) (Agilent Technologies Inc., Santa Clara, CA, USA) was used as the stationary phase. Elution was performed isocratically with 90 % methanol and 10 % water acidulated with 0.05 % (v/v) acetic acid, at a flow rate of 0.4 mL/min, while corresponding injections of 10 μL each (10 mg/mL MeOH) were applied. Detection was performed at 204 nm, with the column temperature maintained at 30 °C.
2.4.2. Purification of Triterpenic Acids
The euscaphic, maslinic, and corosolic acids used for quantification were purified using the chromatographic system described above (Subheading 2.4.1) but scaled to the specifications corresponding to a semi-preparative column (Zorbax XDB-C18, 21.2 x 150 mm, 5 µm) at a flow rate of 1.2 mL/min.
2.5. Validation of the Analytical Method
The analytical method used by the present study for quantifying the euscaphic and ursolic acids was validated in accordance with the Validation of analytical procedures: text and methodology Q2(R1), the guidelines produced by the International Conference for Harmonization of Technical Requirements for Pharmaceuticals for Human Use (ICH). The parameters assessed were selectivity, linearity, limit of detection (LOD), limit of quantification (LOQ), sensitivity, precision, accuracy, and robustness [19].
2.6. Statistical Analysis
The results obtained were analyzed using a one-way ANOVA accompanied by a Tukey's test to determine significant differences (p < 0.05).
3. Results and Discussion
3.1. Development of the Analytical Method
To date, our research group has identified some of the triterpenic acids that exhibit isomerism, a phenomenon which posed a challenge for the development of reliable methods for identifying and quantifying the compounds of interest. The similar polarities presented by triterpenic acids result in a low chromatographic resolution, which corresponds to overlapping or close peaks [20,21]. The strategy chosen by the present study for the separation of the compounds of interest was to modify analytical conditions such as mobile phase composition and flow rate. The results obtained show that isocratic elution with methanol and acidulated water (90:10) at a flow rate of 0.4 mL/min obtains a better level of separation of ursolic acid (UA) [with a retention time (RT) of 17.7 minutes] and corosolic acid (CA) (RT = 10.88 min), both of which are ursane-type pentacyclic triterpenes, from oleanolic (OA) (RT = 16.90 min) and maslinic acids (MA) (RT = 10.30 min), their oleanane isomers. Furthermore, euscaphic acid (EA) (RT: 5.70 min) was separated from many other as-yet-unidentified compounds in a particularly overlapped region. Figure 1A shows the chromatogram generated during the coelution of the triterpenic acid standards which were run to obtain their RT and UV spectra. For the first time, the compounds were simultaneously identified in the methanolic extracts of the leaves of the three Crataegus species. The identification was achieved by comparing the RT and UV spectra of the standards with those corresponding to their respective peaks, as observed in the extracts (Figure 1B).
3.2. Quantification of Triterpenic Acids
The triterpenic acids were quantified by independently developing calibration curves for each compound studied (Figure 2). As seen in Fig. 1B, the methanolic C. mexicana (MECm) and C. rosei (MECr) extracts showed similar levels for all of the triterpenic acids of interest. In both extracts, the predominant compound was EA, followed by UA, CA, MA, and OA. In contrast, a higher UA content was observed for the methanolic C. gracilior (MECg) extract, while the MECr extract presented the highest EA and OA content and the MECm presented the highest MA and CA content (Figure 3, Table 1). The Crataegus extracts available commercially on the market are all standardized based on their flavonoid content. Previous studies have quantified some flavonoids in the three Mexican species of interest. The main compounds found for the MECg were (+)-catechin and rutin, with 717.9 ± 24.9 and 300.8 ± 5.9 µg/g leaf, respectively, while even lower rutin (≈ 20 µg/mL leaf) and (─)-epicatechin (≈ 10 µg/mL) levels were observed for the MECm and, for the MECr, (─)-epicatechin (9. 48 µg/kg) and rutin (2.72 µg/kg leaf) were detected. The results obtained by the present study demonstrate that triterpenic acids are by far the most abundant compounds in the extracts, with EA and UA found to be the main components present in the leaves of the three Mexican Crataegus species studied. Therefore, in contrast to the phenolic markers reported to date for other Crataegus extracts and in addition to their significant vasorelaxing effects, these compounds are proposed by the present study as the most suitable chemical and pharmacological markers for the three species. Moreover, the chromatographic profile obtained by the present study may be considered the chemical fingerprint of Mexican Crataegus species [22], a fingerprint which can be used to authenticate the extracts or products obtained from these species [23].
3.3. Validation of the Analytical Method Used to Quantify Ursolic and Euscaphic Acids
3.3.1. Specificity
One of the structural disadvantages of triterpenic acids is their lack of significant chromophores, causing these compounds to absorb at low wavelengths (λ). This characteristic may hinder the development of analytical methods for their identification and quantification. Some authors have measured these compounds at λ < 220 nm [24]. The specificity of the method developed by the present study was determined at different absorption wavelengths for both the standards and the peaks detected for the extracts. The results obtained showed that the analysis conducted at 204 nm achieved a greater selective level of sensitivity. The presence of EA and UA in the extracts was confirmed by analyzing mixtures of the extracts and standards. Peak specificity in the samples was determined by the identification of the absence of peak deformation or a contiguous peak. Additionally, blank (methanol) injections were performed to rule out interference caused by the retention times of the triterpenic acids.
3.3.2. Suitability
Suitability corresponds to the determination of whether the chromatographic system used presents optimal conditions for the validation of the analytical method developed by the present study. The determination of the capacity factor (K’), number of theoretical plates, and coefficient of variation (CV) parameters by the present study obtained a positive interaction between EA and UA and the mobile and stationary phases (K’ > 2) [24]. Additionally, the column displayed good resolution, with column efficiency values > 2000 for the number of theoretical plates (Table 2) [25]. These results confirmed that the data obtained by the analysis conducted are reproducible and reliable.
3.3.3. Linearity, LOD, and LOQ
The calibration curves for EA and UA were constructed based on six different concentrations ranging from 100 to 1000 µg/mL (Figure 4). The curves showed good linearity, presenting R² = 1 and 1, respectively. The data obtained demonstrated excellent correlation between variables and met the acceptance criteria (R² > 0.98) [25]. The minimum quantification concentrations for EA and UA were 20.43 and 19.55 µg/mL, respectively, while the minimum detection concentrations were 12.26 and 11.73 µg/mL, respectively (Table 3).
3.3.4. Precision
Intermediate precision was expressed as the percentage relative standard deviation (RSD %) of the independent analyses (n=3) conducted. The low, medium, and high concentrations obtained (100, 400, and 800 µg/mL) were analyzed on three different days. The highest concentration was analyzed by two analysts on two different days. The intraday RSD % for EA and UA, at the three concentrations analyzed, ranged from 0.03 to 1.8 and 0.15 to 1.69, respectively, while the interday RSD % ranged from 0.15 to 1.69 and 0.95 to 1.22, respectively. Additionally, the first-day RSD % for EA and UA performed by the two analysts was 0.08 and 0.09 and 0.02 and 0.01, respectively. On the second day, respective values of 0.09 and 0.08, and 1.24 and 0.19 were obtained. In contrast, the interday percentages obtained for each analyst were 0.09 and 0.09 for EA and 0.385 and 0.63 for UA (Table 4).
The results obtained for this parameter fall within the criteria described by the ICH, with an RSD % < 2 % in both the repeatability and intermediate precision analyses. These results, which show low variances, proved the method to be precise for the quantification of both triterpenic acids of interest [19,25].
The accuracy of the method proposed by the present study was calculated by determining the recovery % after the addition of three known concentrations of EA and UA (100, 400, and 800 µg/mL) to the extract (placebo). The % recovery obtained for the three EA concentrations ranged from 99 to 101.5 %, with a mean RSD of 0.26–1.18 %, while, for UA, the values ranged from 99.1 to 101.9 %, with a mean RSD of 0.26–1.18 %. Values below 102 % and an RSD <2 % for both standards suggest that the method developed presents accuracy and precision with low variance, a finding which falls within both the United States Pharmacopeia (USP) and ICH guidelines (Table 5).
3.3.6. Robustness
The robustness value determines the reproducibility of analysis conducted on the same sample when the analytical conditions of the method proposed are then modified. This parameter was slightly modified by the temperature, wavelength, and composition of mobile phase. Changing the mobile phase composition affected the quantification of EA, while increasing the temperature, detection wavelength, and methanol in the mobile phase also modified the quantification of UA (RSD > 2 %) (Table 6). It should be noted that, for both acids, the presentation of slight variations in the analytical conditions modified their concentration, indicating that this method is specific to these two triterpenic acids.
4. Conclusions
The HPLC-DAD method developed by the present study successfully achieved the simultaneous identification and quantification of the five most abundant triterpenic acids contained in the three Mexican Crataegus species of interest, making this the first report of such results. The present study showed that UA and EA were the main compounds present in the species, based on which result, they are proposed as the most suitable chemical and pharmacological markers for the three species. The method validated for the quantification of UA and EA demonstrated good linearity, precision, and accuracy, despite failing to present sufficient robustness under the conditions proposed. However, the method is reliable for assessing quality control parameters for potential phytomedicines developed from these Crataegus species. Furthermore, this method can be used to detect and quantify EA, MA, CA, OA, and UA in Crataegus and other medicinal plants.
Author Contributions
Conceptualization, M.B.; Methodology, D.L.-F and E.R-deL.; Validation, D.L.-F; Formal analysis, D.L.-F and E.R-deL.; Investigation, M.B. and D.L.-F; Writing – Original Draft Preparation, D.L.-F; Writing – Review & Editing, M.B.; Supervision, M.B.; Project Administration, M.B.; Funding Acquisition, M.B. All authors have read and agreed to the published version of the manuscript.
Funding
This research was funded by Universidad Autónoma de Querétaro, grant number FONFIVE_FQU202408 (UAQ)”.
Data Availability Statement
NMR data beside those presented in the paper can be obtained on request from the authors.
Acknowledgments
Universidad Autónoma de Querétaro for providing the financial resource.
Conflicts of Interest
The authors have no conflict of interest to declare.
Abbreviations
The following abbreviations are used in this manuscript:
| HPLC | High-Performance Liquid Chromatography |
| DAD | Diode array detector |
| NMR | Nuclear Magnetic Resonance |
| ICH | International Council for Harmonisation |
| LOD | Limit of detection |
| LOQ | Limit of quantification |
| UA | Ursolic acid |
| RT | Retention time |
| CA | Corosolic acid |
| OA | Oleanolic acid |
| MA | Maslinic acid |
| EA | Euscaphic acid |
| MECm | Methanolic Extract of Crataegus mexicana |
| MECr | Methanolic Extract of Crataegus rosei |
| MECg | Methanolic Extract of Crataegus glacilior |
| Λ | Wavelengths |
| K' | Capacity factor |
| CV | Coefficient of variation |
| R2 | Linear correlation coefficient |
| % RSD | Percentage relative standard deviation |
| R | Repetition |
| Q | Quantified |
References
- Alirezalu, A.; Ahmadi, N.; Salehi, P.; Sonboli, A.; Alirezalu, K.; Khaneghah, A.M.; Lorenzo, J. Physicochemical characterization, antioxidant activity, and phenolic compounds of hawthorn (Crataegus spp.) fruits species for potential use in food applications. Foods 2020, 9, 436. [Google Scholar] [CrossRef] [PubMed]
- Núñez-Colín, C.; Nieto-Ángel, R.; Barrientos-Priego, A.; Segura, S.; Sahagún-Castellanos, J.; González-Andrés, F. Distribución y caracterización eco-climática del género Crataegus L. (Rosaceae, Subfam. Maloideae) en México. Rev. Chapingo Ser. Hortic. 2008, 14, 177─184. [Google Scholar]
- López-Santiago, J.; Nieto-Ángel, R.; Barrientos-Priego, A.F.; Rodríguez-Pérez, E.; Colinas-Leon, M.T.; Borys, M.W. Selección de variables morfológicas para la caracterización del tejocote (Crataegus spp.). Rev. Chapingo Ser. Hortic. 2008, 14, 97─111. [Google Scholar]
- SADER (Secretaría de Agricultura y Desarrollo Rural). Tejocote, un tesoro de la biodiversidad. Gobierno de México. 2024. Available online: https://www.gob.mx/agricultura/articulos/tejocote-un-tesoro-de-la-biodiversidad-384052?idiom=es.
- Hernández-Pérez, A.; Bah, M.; Ibarra-Alvarado, C.; Rivero-Cruz, J.; Rojas-Molina, A.; Rojas-Molina, J.; Cabrera-Luna, J. Aortic relaxant activity of Crataegus gracilior Phipps and identification of some of its chemical constituents. Molecules 2014, 19, 20962–20974. [Google Scholar] [CrossRef] [PubMed]
- Torres-Ortiz, D.A.; Rodríguez-deLeón, E.; Bah, M.; Ibarra-Alvarado, C.; Mercado-Silva, E.; Castro-Ruiz, J.E.; Rivera-Pastrana, D.M. Vasorelaxing effect and chemical markers of the flowers of the Mexican Crataegus gracilior. Nat. Prod. Res. 2020, 34, 3522─3525. [Google Scholar] [CrossRef] [PubMed]
- Ornelas-Lim, C.; Luna-Vázquez, F.J.; Rojas-Molina, A.; Ibarra-Alvarado, C. Development of a quantified herbal extract of hawthorn Crataegus mexicana leaves with vasodilator effect. Saudi Pharm. J. 2021, 29, 1258─1266. [Google Scholar] [CrossRef] [PubMed]
- López-Fitz, D.; Rodríguez-Martínez, R.; Bah, M.; Ibarra-Alvarado, C.; Rodríguez-deLeón, E.; García-Aguilar, L. Vasodilator activity of methanol extract obtained from Crataegus rosei leaves and the chemical characterization of its main constituents. Nat. Prod. Res. 2025. [Google Scholar] [CrossRef] [PubMed]
- García-Mateos, R.; Ibarra-Estrada, E.; Nieto-Angel, R. Antioxidant compounds in hawthorn fruits (Crataegus spp.) of Mexico. Rev. Mex. Biodivers. 2013, 84, 1298–1304. [Google Scholar] [CrossRef]
- Reyes-Becerril, M.; Martínez-Preciado, A.; Guluarte, C.; Guerra, K.; Tovar-Ramirez, D.; Macias, M.E.; Angulo, C. Phytochemical composition and immunobiological activity of Hawthorn Crataegus mexicana nanoencapsulated in Longfin yellowtail Seriola rivoliana leukocytes. Fish. Shellfish Immunol. 2019, 92, 308─314. [Google Scholar] [CrossRef] [PubMed]
- Maldonado-Cubas, J.; Albores-Méndez, E.M.; Martín-Martínez, E.S.; Quiroz-Reyes, C.N.; González-Córdova, G.E.; Casañas-Pimentel, R.G. Mexican hawthorn (Crataegus gracilior J. B. Phipps) stems and leaves induce cell death on breast cancer cells. Nutr. Cancer 2020, 72, 1411─1421. [Google Scholar] [CrossRef] [PubMed]
- Luchnikova, N.A.; Grishko, V.V.; Ivshina, I.B. Biotransformation of Oleanane and Ursane Triterpenic Acids. Molecules 2020, 25, 5526. [Google Scholar] [CrossRef] [PubMed]
- Furtado, J.C.; Pirson, L.; Edelberg, H.; Miranda, M.; Loira-Pastoriza, C.; Preat, V.; Larondelle, Y.; André, C.M. Pentacyclic Triterpene Bioavailability: An Overview of In Vitro and In Vivo Studies. Molecules 2017, 22, 400. [Google Scholar] [CrossRef] [PubMed]
- Mioc, M.; Milan, A.; Malița, D.; Mioc, A.; Prodea, A.; Racoviceanu, R.; Ghiulai, R.; Cristea, A.; Căruntu, F.; Șoica, C. Recent Advances Regarding the Molecular Mechanisms of Triterpenic Acids: A Review (Part I). Int. J. Mol. Sci. 2022, 23, 7740. [Google Scholar] [CrossRef] [PubMed]
- Zhang, W.; Men, X.; Lei, P. Review on anti-tumor effect of triterpene acid compounds. J. Cancer. Res. Ther. 2014, 10, C14─C19. [Google Scholar] [CrossRef] [PubMed]
- Mioc, M.; Prodea, A.; Racoviceanu, R.; Mioc, A.; Ghiulai, R.; Milan, A.; Voicu, M.; Mardale, G.; Șoica, C. Recent Advances Regarding the Molecular Mechanisms of Triterpenic Acids: A Review (Part II). Int. J. Mol. Sci. 2022, 23, 8896. [Google Scholar] [CrossRef] [PubMed]
- Similie, D.; Minda, D.; Bora, L.; Kroškins, V.; Lugiņina, J.; Turks, M.; Dehelean, C.A.; Danciu, C. An Update on Pentacyclic Triterpenoids Ursolic and Oleanolic Acids and Related Derivatives as Anticancer Candidates. Antioxidants 2024, 13, 952. [Google Scholar] [CrossRef] [PubMed]
- Sesatty, A.L.; Ullevig, S.L. Investigation of the Purity of Ursolic Acid Dietary Supplements. Eur. J. Med. Plan. 2016, 17, 1–7. [Google Scholar] [CrossRef]
- International Council for Harmonisation (ICH) Validation of analytical procedures: text and methodology, Q2 (R1). Valid. Anal. Proced ICH Geneva. 2005; p. 13. Available online: https://www.ich.org/fileadmin/Public.
- Lu, W.; Chen, T.; Shen, C.; Feng, H.; Lin, C.; Song, Z.; Wang, S.; Luo, J.; Li, Y. Differential recognition and targeting isolation of HPLC co-efflux isomers using countercurrent chromatography based on LC–MS feature analysis. Microchem. J. 2024, 205, 111384. [Google Scholar] [CrossRef]
- Schuster, S.A.; Johnson, W.L. Methods for Changing Peak Resolution in HPLC: Advantages and Limitations. LCGC Suppl. 2013, 31, 10–18. [Google Scholar]
- Li, S.; Han, Q.; Qiao, C.; Song, J.; Lung, C.; Xu, H. Chemical markers for the quality control of herbal medicines: an overview. Chin. Med. 2008, 3, 1–6. [Google Scholar] [CrossRef] [PubMed]
- Mohammad, S.H.; Nor, M. Chemical fingerprint of Centella Asiatica’s bioactive compounds in the ethanolic and aqueous extracts. ABST 2020, 2, 35─44. [Google Scholar] [CrossRef]
- Sedbare; Raudone, R.; Zvikas, L.; Viskelis, V.; Liaudanskas, J.; Janulis, M.V. Development and Validation of the UPLC-DAD Methodology for the Detection of Triterpenoids and Phytosterols in Fruit Samples of Vaccinium macrocarpon Aiton and Vaccinium oxycoccos L. Molecules 2022, 27, 4403. [Google Scholar] [CrossRef] [PubMed]
- USP (United States Pharmacopeia). 1225 Validacion de procedimientos farmacopeicos; United States Pharmacopeia Convention Rockville USA, 2020. [Google Scholar] [CrossRef]
- Westgard, J. Basic Method Validation. 2nd Edition. 2003, 29─30, 87─99, 111─122. [Google Scholar]
Figure 1.
A) Chromatograms of the triterpenic acid standards and B) methanolic extracts.
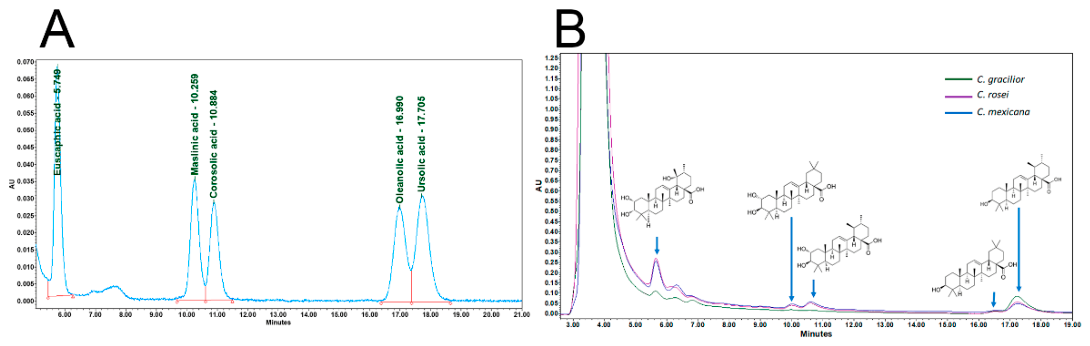
Figure 2.
Chromatograms obtained for the construction of the calibration curves used to quantify the triterpenic acids of interest.
Figure 2.
Chromatograms obtained for the construction of the calibration curves used to quantify the triterpenic acids of interest.
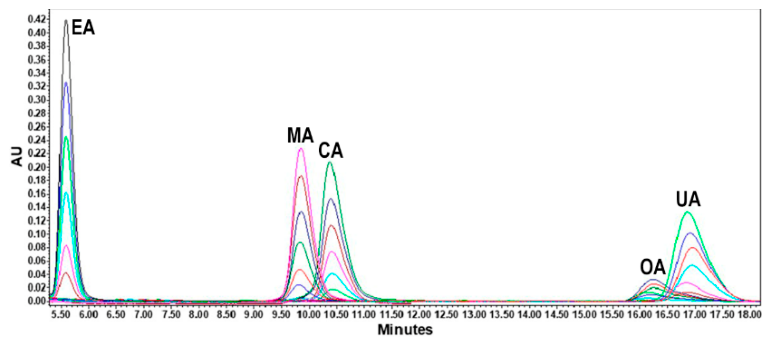
Figure 3.
Graphs derived from the quantification of the triterpenic acids.
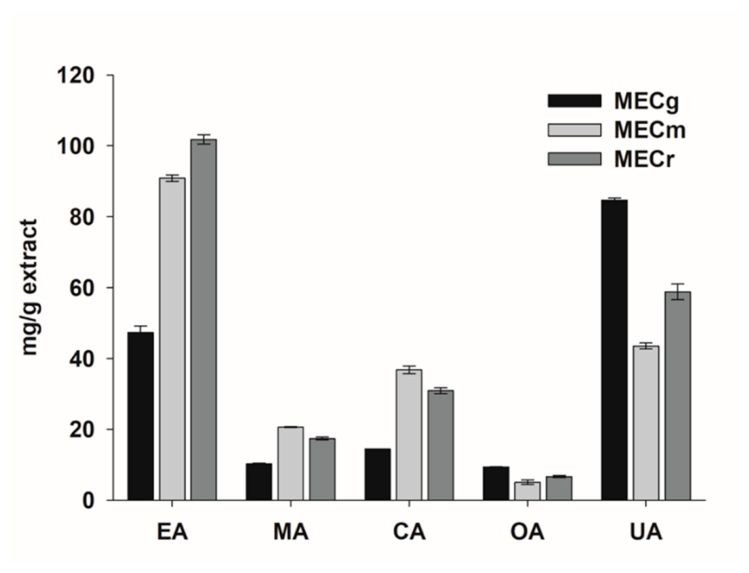
Figure 4.
Calibration curves for the quantification of triterpenic acids.
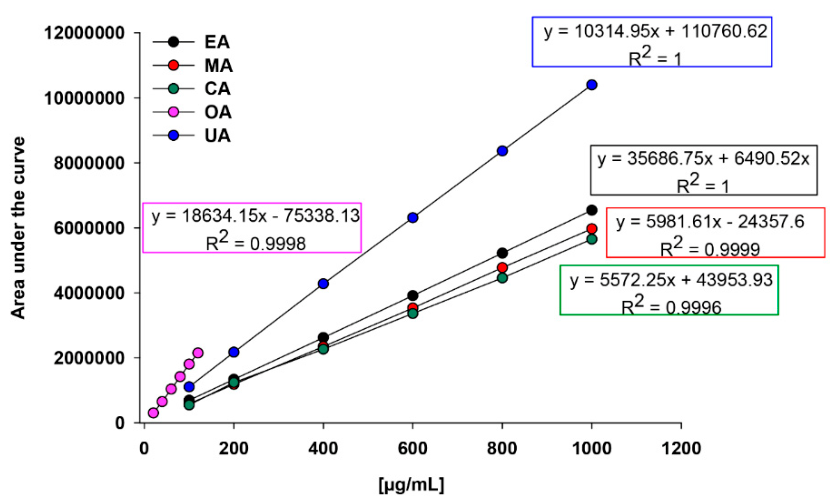

Table 1.
Triterpenic acid levels determined in the methanolic extracts of the three Crataegus species (mean ± SD).
Table 1.
Triterpenic acid levels determined in the methanolic extracts of the three Crataegus species (mean ± SD).
| Table . | MECg | MECm | MECr | |||
| mg/g extract | mg/g dry leaf | mg/g extract | mg/g dry leaf | mg/g extract | mg/g dry leaf | |
| EA | 47.3 ± 1.87 | 5.46 ± 0.22 | 90.9 ± 0.89 | 15.97 ± 0.16 | 101.8 ± 1.3 | 19.25 ± 0.24 |
| MA | 10.26 ± 0.19 | 1.21 ± 0.02 | 20.65 ± 0.1 | 3.66 ± 0.02 | 17.4 ± 0.4 | 3.32 ± 0.08 |
| CA | 14.45 ± 0.02 | 1.68 ± 0.002 | 36.8 ± 1.1 | 6.39 ± 0.19 | 30.9 ± 0.8 | 5.79 ± 0.15 |
| OA | 9.4 ± 0.1 | 1.08 ± 0.01 | 5.1 ± 0.63 | 0.89 ± 0.11 | 6.7 ± 0.3 | 1.27 ± 0.1 |
| UA | 84.68 ± 0.6 | 14.93 ± 0.11 | 43.5 ± 0.84 | 7.65 ± 0.15 | 58.8 ± 2.2 | 11.11 ± 0.41 |
Table 2.
Suitability parameters obtained from the analysis of EA and UA.
| Compound | Retention Time (min) | Coefficient of variation | Number of theoretical plates | Capacity factor |
| EA | 5.58 ± 0.003 | 0.31 % | 49871838 ± 63164 | 4.58 ± 0.004 |
| UA | 16.55 ± 0.013 | 0.41 % | 28338273 ± 47627 | 42.78 ± 0.002 |
| USP parameters | - | ≤ 2 % | > 2000 | > 2 |
Table 3.
Coefficients of determination (R2), LOD, and LOQ for the triterpenic acids.
| Compound | Concentration (µg/mL) |
Equation | R2 | LOD (µg/mL) |
LOQ (µg/mL) |
| EA | 100-1000 | y = 35686.7x + 6490.5 | 1 | 12.26 | 20.43 |
| MA | 100-1000 | y = 5981.6x -24357.6 | 0.9999 | 26.42 | 44.03 |
| CA | 100-1000 | y = 5572.2x + 43953.9 | 0.9996 | 53.67 | 89.46 |
| OA | 10-100 | y = 18634.1x -75338.1 | 0.9998 | 0.0007 | 4.2 |
| UA | 100-1000 | y = 10314.9x + 110760.6 |
1 |
9.72 | 16.17 |
Table 4.
Coe Inter-day precision results.
|
Concentration (µg/mL) |
RSD % | |||||||
| EA | UA | |||||||
| Day 1 | Day 2 | Day 3 | Interday | Day 1 | Day 2 | Day 3 | Interday | |
| Intraday | Intraday | |||||||
| 100 | 0.07 | 0.08 | 0.22 | 0.15 | 1.02 | 1.55 | 0.47 | 0.99 |
| 400 | 0.03 | 1.8 | 0.04 | 1.69 | 0.56 | 1 | 0.67 | 0.95 |
| 1000 | 0.04 | 0.82 | 0.11 | 0.76 | 0.21 | 0.56 | 1.79 | 1.22 |
| Analyst 1: 1000 | 0.08 | 0.09 | - | 0.09 | 0.02 | 1.24 | - | 0.385 |
| Analyst 2: 1000 | 0.09 | 0.08 | - | 0.09 | 0.01 | 0.19 | - | 0.63 |
Table 5.
Results for the recovery % with the different concentrations of EA and UA.
|
[µg/mL] |
R |
EA | UA | ||||
| Q (µg/mL) |
Recovery % | RSD % mean | Q (µg/mL) |
Recovery % | RSD % mean | ||
|
100 |
1 | 97.17 | 99.0 |
0.77 |
99.5 | 99.5 |
1.14 |
| 2 | 98.64 | 100.5 | 99.07 | 101.4 | |||
| 3 | 98.33 | 100.2 | 101 | 101.6 | |||
|
400 |
1 | 392.84 | 99.14 |
0.32 |
408 | 102.0 |
1.18 |
| 2 | 395.4 | 99.78 | 399.7 | 99.9 | |||
| 3 | 394 | 99.4 | 407 | 101.9 | |||
| 800 | 1 | 808 | 101.5 |
0.8 |
796.3 | 99.5 |
0.26 |
| 2 | 796.28 | 100 | 792.63 | 99.1 | |||
| 3 | 806 | 101.2 | 796.04 | 99.5 | |||
*R: Repetition, Q: Quantified. *Calculated according to the formula: recovery % = ((value obtained) / (reference value)) x 100 [26].
Table 6.
RSD % of the robustness parameters.
|
Triterpenic acids |
Analytical conditions of the method proposed | |||||
| Original method | Temper-ature (ºC) | Wavelength (nm) | Mobile phase | |||
| 32 | 202 | 206 | MeOH:H2O (92:08) |
MeOH:H2O (88:12) |
||
| EA (RSD %) | 0.22 | 0.54 | 1.14 | 1.92 | 11.72 | 2.03 |
| UA (RSD %) | 0.72 | 3.66 | 1.51 | 2.51 | 7.24 | 1.8 |
Disclaimer/Publisher’s Note: The statements, opinions and data contained in all publications are solely those of the individual author(s) and contributor(s) and not of MDPI and/or the editor(s). MDPI and/or the editor(s) disclaim responsibility for any injury to people or property resulting from any ideas, methods, instructions or products referred to in the content. |
© 2026 by the authors. Licensee MDPI, Basel, Switzerland. This article is an open access article distributed under the terms and conditions of the Creative Commons Attribution (CC BY) license.
Copyright: This open access article is published under a Creative Commons CC BY 4.0 license, which permit the free download, distribution, and reuse, provided that the author and preprint are cited in any reuse.