

Submitted:
07 July 2026
Posted:
09 July 2026
You are already at the latest version
Abstract
Biological invasions threaten tropical biodiversity, yet the molecular mechanisms underlying successful invaders remain poorly understood. Thunbergia alata (Black-eyed Susan) is an aggressive “genomic orphan” invader in Andean forests, causing significant ecological disruption. This study establishes the first high-quality de novo transcriptome assembly for T. alata, providing a foundational molecular resource. We performed differential expression analysis under varying light conditions, revealing a massive transcriptomic shift involving over 4,000 differentially expressed genes. Our findings demonstrate a robust “physiological priming” mechanism, characterized by the up-regulation of SnRK1 subunits for energy sensing and strategic management of Reactive Oxygen Species (ROS) within the thylakoid membrane. Furthermore, the fine-tuning of PIF/Auxin modules and the condition-specific induction of NAC and WRKY transcription factors facilitate shade avoidance and rapid vertical growth. The identification of a substantial reservoir of species-specific “not classified” genes suggests that novel genetic elements contribute to T. alata’s adaptive success. By elucidating these key regulatory networks, this research provides a vital genomic baseline for future studies on adaptive evolution and the development of molecularly informed strategies for managing and controlling this invasive species in new environments.
Keywords:
Thunbergia alata
; invasive species
; transcriptome
; light response
1. Introduction
Biological invasions represent a critical threat to global biodiversity and ecosystem stability, often resulting in significant economic impacts and human health risks (Meyerson and Mooney 2007). Among invasive plant species, Thunbergia alata, commonly known as the Black-eyed Susan, has emerged as a high-risk invader in tropical regions worldwide (Quijano-Abril et al. 2021). Native to East Africa, this climbing vine has adapted exceptionally well to the edges of Andean Forest fragments and anthropogenically disturbed areas in Colombia (CAR 2020). Its invasive success is facilitated by rapid growth, a vigorous climbing habit that affects native vegetation, and an efficient dehiscent seed dispersal mechanism (Quijano-Abril et al. 2021; Ruiz-Calero et al. 2025). Despite the clear ecological threat it poses, T. alata remains a “genomic orphan” species. Historically, research into invasive plants has prioritized ecological and physiological management strategies, often neglecting the underlying genetic components (Seebens et al. 2025). This gap is largely due to the historically high costs of sequencing, which limited molecular studies to model organisms or high-value crops. Consequently, the lack of genomic resources for T. alata has hindered efforts to identify the molecular mechanisms responsible for its successful establishment and environmental plasticity(Ruiz-Londoño, Pérez-Mesa, and Suárez-Baron 2026).
The recent democratization of Next-Generation Sequencing (NGS) technologies has fundamentally changed this landscape. As sequencing costs has been reduced, NGS has become an essential and accessible tool for tracking and managing invasive species in non-native ecosystems (Chown et al. 2015). These advancements now allow for the systematic identification of genetic factors such as functional modules and genes under positive selection that facilitate rapid adaptation and expansion in non-model species (Jiang et al. 2022). For an invader species like T. alata, understanding these mechanisms is critical, as climate change increasingly creates favorable conditions for species with high physiological tolerance and adaptive evolutionary potential (Hellmann et al. 2008). Studying the molecular drivers of invasiveness in T. alata represents an important contribution of ecological importance for developing targeted management strategies. Successful establishment in new environments often requires either high phenotypic plasticity or rapid adaptive evolution (Pyšek and Richardson 2010; Ruiz-Londoño et al. 2026). Recent transcriptomic studies suggests that T. alata exhibits signals of positive selection in genes related to reproduction, stress tolerance, and metabolism, such as POK and ANJ1 (Ruiz-Calero et al. 2025; Ruiz-Londoño et al. 2026). By providing a high-quality de novo transcriptome assembly and identifying key regulatory networks, such as the NAC and WRKY families, this study seeks to elucidate the genetic architecture that allows this species to dominate native Andean flora. This research contributes to a vital genomic foundation for future biosurveillance and the mitigation of ecological damage caused by this aggressive invader.
2. Results
2.1. Phenotypic Plasticity and Transcriptome Assembly
Morphological characterization of T. alata revealed significant phenotypic plasticity in response to light availability (Figure 1). While full light triggered rapid reproductive maturity and flower induction, shaded conditions promoted a distinct vegetative strategy prioritized toward vertical elongation. To elucidate the molecular basis of these shifts, a de novo transcriptome was generated. The assembly yielded 68,537 sequences with a total length of 55.02 Mb. The dataset exhibited high continuity and reliability, characterized by a contig N50 of 1,099 bp and a mean sequence length of 802.9 bp. The GC content was 43.29%, a value consistent with other members of the Acanthaceae family. Notably, the absence of ambiguous bases (N’s) reflects a high-quality consensus achieved during the assembly process. Detailed assembly statistics are summarized in Annexes Table A1 and Table A2.
2.2. Functional Annotation and Metabolic Profiling
Functional annotation of the T. alata proteome was conducted using the Mercator4 plant-specific classification system, successfully assigning biological roles to 20,384 proteins. The functional landscape is dominated by key regulatory and metabolic enzymes (Figure 2). Among the categorized transcripts, Phosphotransferases (EC 2-7) represented the most abundant class with 1,868 sequences, suggesting an extensive and highly active signaling network. The metabolic profile is further characterized by a high prevalence of Ester bond hydrolases (EC 3-1) (404 transcripts) and Glycosyltransferases (EC 2-4) (391 transcripts), underscoring a dynamic landscape of carbohydrate-mediated secondary metabolism and cell wall modification. Furthermore, the significant representation of Oxidoreductases (EC 1-14 and EC 1-1) and NAC transcription factors (101 transcripts) highlights a robust investment in cellular maintenance, stress response, and specialized biosynthetic pathways that likely drive the biochemical diversity and structural adaptations characteristic of this species.
2.3. Global Transcriptional Response and Differential Gene Expression.
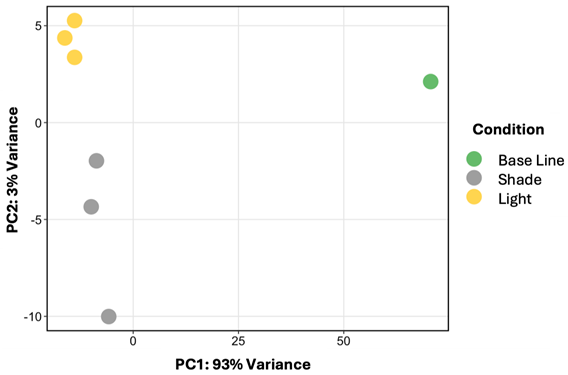
To evaluate the consistency of the biological replicates and the overall effect of light treatments on the T. alata transcriptome, a Principal Component Analysis (PCA) was performed (Appendix A.1). The PCA revealed that 93% of the total variance was captured by the first principal component (PC1), clearly separating the Base Line (BL) samples from the experimental light treatments. PC2 (3% variance) further distinguished the Light and Shade conditions. The magnitude and statistical significance of the transcriptomic shifts were visualized using volcano plots (Figure 3A, B). These plots served as critical internal controls for the analysis, demonstrating a symmetric distribution of fold changes and a high density of significantly regulated transcripts beyond the significance thresholds (FDR < 0.05). Differential Gene Expression analysis identified thousands of genes responsive to light intensity and quality (Figure 3). The comparison between experimental conditions and the base line showed the highest degree of transcriptomic reprogramming. Specifically, the Light vs. BS comparison yielded 7,155 Differentially Expressed Genes (DEGs), with 4,654 down-regulated and 2,501 up-regulated transcripts. Similarly, the Shadow vs. BS comparison identified 7,267 DEGs (4,767 down-regulated and 2,500 up-regulated). When comparing the two light treatments directly (Light vs. Shadow), we identified 384 DEGs, with 277 genes significantly up-regulated in shadow and 107 up-regulated in light (Figure 3). The volcano plots demonstrate a high magnitude of change, with many transcripts exhibiting a |Log2 Fold Change| > 5, reflecting a robust physiological adjustment to light quality transitions in T. alata.
2.4. Expression Profiling of Top Responsive Genes
To identify the most prominent transcriptional signatures in T. alata across light conditions, we analyzed the top 50 most expressed DEGs under two criteria: a global selection including uncharacterized sequences, and a targeted selection of genes with assigned functional annotations (Figure 4 A and B). Hierarchical clustering revealed a high degree of reproducibility among biological replicates, with samples grouping strictly by treatment (Base Line, Shade, and Light).
The global top 50 heatmap (Figure 4 A) reveals that a significant portion of the most highly regulated transcripts in T. alata currently lack functional assignment (“Not classified”). This highlights a substantial reservoir of species-specific or novel genes that are strongly responsive to light quality. Conversely, the heatmap focusing on genes with known functions (Figure 4, B) identifies clear regulatory modules. Notably, genes involved in signal transduction and energy sensing such as SnRK1 kinase subunits, ABC1K subgroup-9 kinases, and NAC transcription factors showed strong up-regulation under experimental conditions compared to the base line. Additionally, structural and metabolic components, including subunits of the peripheral CF1 subcomplex and chloroplast ATP synthase, exhibited peak expression during the Base Line phase but were significantly down-regulated in both Light and Shade treatments. A subset of specialized genes, including iron storage proteins (FER) and oxidoreductases, exhibited differential modulation between Light and Shade, showing higher relative expression under Light. These patterns indicate that while T. alata shares conserved plant light-response mechanisms, it also relies on a unique set of uncharacterized genes to navigate its light environment.
2.5. Functional Enrichment Analysis of DEGs
To identify the biological pathways and cellular components most affected by light quality transitions, a Gene Ontology (GO) enrichment analysis was performed (Figure 5). The analysis revealed a significant enrichment of terms associated with the photosynthetic machinery and protein synthesis across all experimental comparisons. In both Light vs. BS and Shadow vs. BS comparisons, the most significantly enriched cellular components were the thylakoid, chloroplast thylakoid, and photosynthetic membrane (Figure 5 A and B). This was accompanied by a strong enrichment of biological processes related to amide metabolic processes and translation, reflecting a high turnover of proteins required to maintain the photosynthetic apparatus under varying light intensities. Notably, the Light vs. Shadow comparison (Figure 5, C) showed a more specialized enrichment pattern. While thylakoid-related terms remained dominant, specific enrichment was observed for terms such as photosystem II, photosynthesis light reaction, and hydrogen peroxide metabolic process. This suggests that the transition between Light and Shade specifically triggers a fine-tuning of the light-harvesting complex and activates antioxidant mechanisms to manage potential photo-oxidative stress induced by light quality fluctuations. These findings underscore that T. alata responds to light changes by coordinately regulating its photosynthetic architecture and primary protein metabolism.
2.6. Targeted Analysis of Key Regulatory and Metabolic Gene Families
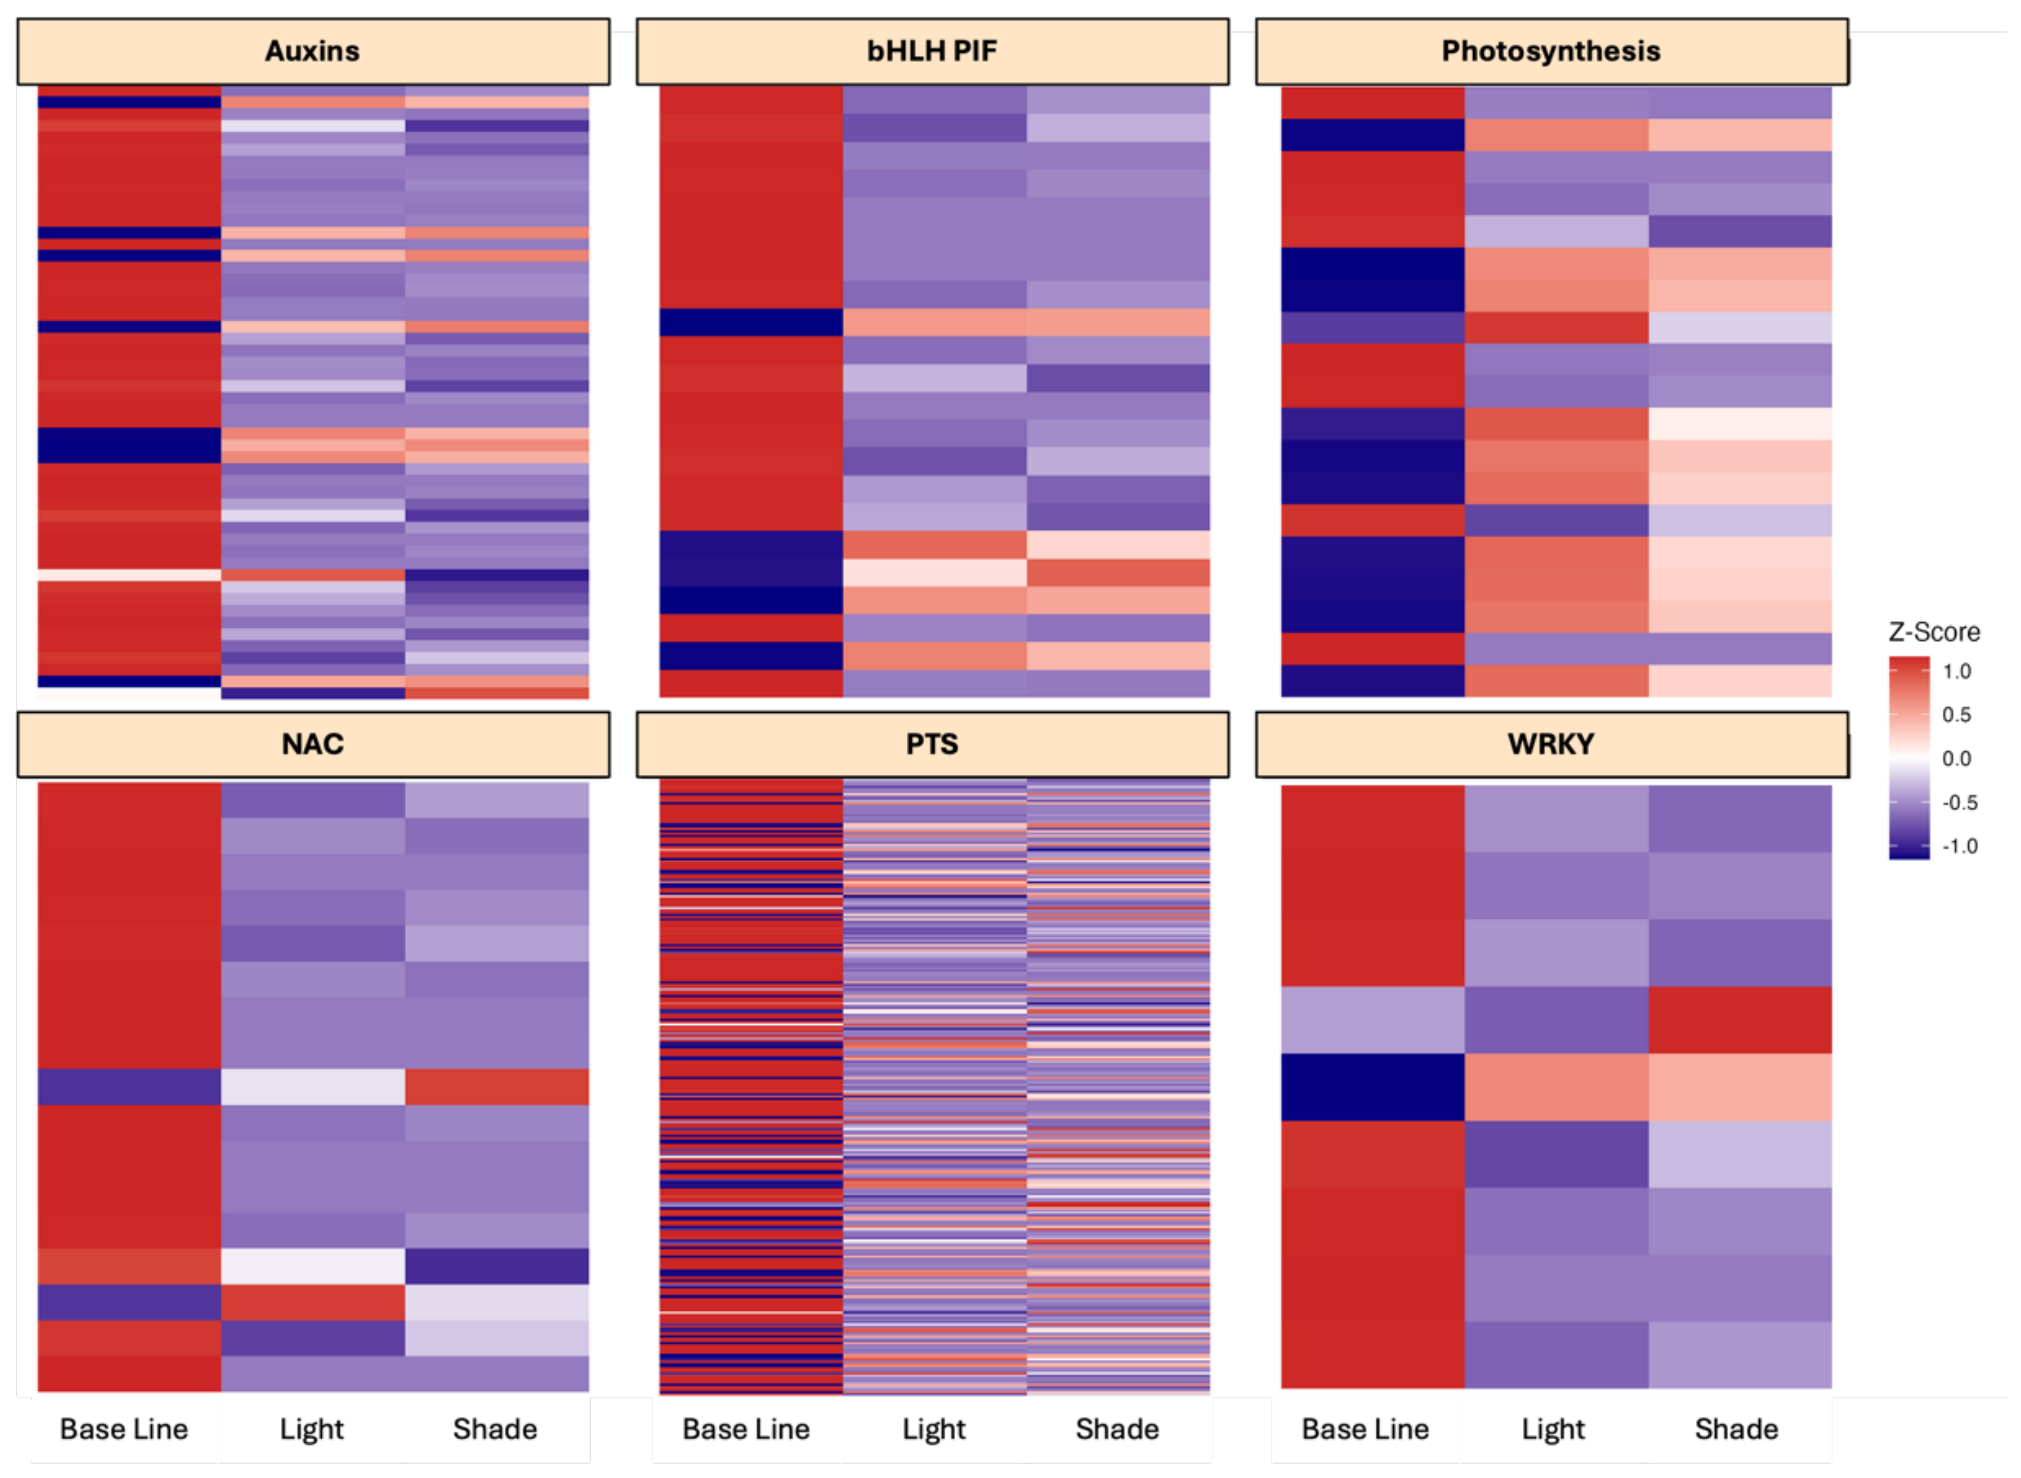
To further elucidate the molecular mechanisms governing light-quality responses in T. alata, we conducted a targeted expression analysis of six key gene families: Auxins, bHLH/PIF, Photosynthesis, NAC, WRKY, and Phosphotransferases (PTS) (Figure 6). The expression patterns reveal a distinct transcriptional shift where a large majority of genes within these families are highly active during the Base Line phase but undergo significant repression upon exposure to stabilized Light and Shade treatments. Notably, the bHLH/PIF and Auxin family’s primary regulators of the Shade Avoidance Syndrome (SAS) showed extensive downregulation in experimental conditions, suggesting that the initial light-quality signal induces a rapid physiological adjustment followed by a new transcriptional steady-state. Within the NAC and WRKY transcription factor families, while most members were repressed relative to the base line, a specific subset of genes exhibited contrasting induction under Shade, highlighting their potential role as specific mediators of shade-tolerance or avoidance.
The Photosynthesis and PTS (Phosphotransferases) panels demonstrate a broad reorganization of energy metabolism and signal transduction. The widespread repression of PTS members in experimental samples indicates a specialized pruning of signaling pathways as the plant matures from the base line state. However, the maintenance of expression in specific photosynthetic and signaling clusters under Light and Shade confirms that T. alata preserves a core set of highly responsive genes to fine-tune its primary metabolism according to the specific irradiance level of the environment.
3. Discussion
By establishing a high-quality de novo assembly, this study provides a critical foundational resource for T. alata, an aggressive invader and “genomic orphan” that significantly impacts tropical biodiversity. Alongside with the recently data published by Ruiz ((Ruiz-Londoño et al. 2026)), this work represents a systematic effort to elucidate the molecular mechanisms underlying the species environmental plasticity, suggesting that a rapid “physiological priming” driven by transitions to stabilized light environments facilitates its ability to outcompete native flora by optimizing metabolic and structural resources (Ballaré and Pierik 2017; Gundel et al. 2014). By identifying key molecular players including high-abundance phosphotransferases and PIF/Auxin regulatory modules this research establishes a vital genomic baseline for future studies on the adaptive evolution and management of T. alata in its invasive range.
The functional landscape of T.alata showed to be characterized by a significant dominance of phosphotransferases (EC 2-7) and glycosyltransferases (EC 2-4), underscoring a highly sophisticated and active regulatory architecture (Figure 2). The prevalence of these signaling and biosynthetic enzymes suggests that T.alata maintains an expansive “molecular toolkit” dedicated to environmental sensing and rapid physiological adjustment. This robust investment in signaling pathways and carbohydrate-mediated secondary metabolism is consistent with the adaptive strategies observed in aggressive invasive species, which leverage metabolic flexibility to navigate shifting ecological niches and outcompete native flora through specialized structural and chemical adaptations (Gundel et al. 2014). Furthermore, this regulatory complexity likely provides the metabolic framework necessary to support the positive selection signals recently identified in the species’ developmental and stress-response genes, facilitating its successful establishment and dominance in diverse tropical ecosystems (Ruiz-Calero et al. 2025).
The massive transcriptomic shift of over 4,000 DEGs per comparison highlights a profound “physiological priming” required to stabilize growth under specific irradiance levels (Figure 3), a hallmark of species that prioritize rapid resource reallocation to maintain competitive advantages (Ballaré and Pierik 2017). This reprogramming is characterized by the upregulation of SnRK1 subunits, which act as master metabolic regulators sensing energy deficits to trigger a shift from general growth to specialized resource acquisition (Hulsmans et al. 2016). This metabolic optimization is further supported by the downregulation of chloroplast ATP synthase as the plant transitions from a seedling state to a stabilized phase, alongside a substantial reservoir of species-specific “Not classified” genes that likely underpin the unique invasive success of T. alata (Figure 4).
The GO enrichment analysis (Figure 5) showed a significant enrichment of terms related to translation and amide metabolic processes reflects a high degree of protein turnover required to remodel the photosynthetic machinery, a strategy frequently observed in invasive plants to maintain efficient light-harvesting under shifting environmental conditions (Heberling and Fridley 2013). Specifically, the activation of hydrogen peroxide metabolic processes during light quality fluctuations suggests that T. alata effectively manages photo-oxidative stress by coordinating antioxidant defenses to neutralize Reactive Oxygen Species (ROS) (Foyer et al. 2016). This robust molecular plasticity in the photosynthetic apparatus, characterized by the rapid reorganization of cellular components, is a key transcriptomic signature that enhances the competitive fitness of invasive species in high-exposure or fluctuating light environments (Khan, Bano, and Babar 2019).
The targeted analysis of Auxins, bHLH/PIF, and WRKY families (Figure 6) elucidates the molecular drivers of SAS in T. alata. Phytochrome Interacting Factors (PIFs) are known to integrate light signals to activate auxin-mediated cell elongation (Leivar and Monte 2014). While the initial transition from the base line induces a general repression of these families in our dataset, the condition-specific induction of certain NAC and WRKY members under shade suggests they are key mediators of shade tolerance (Phukan, Jeena, and Shukla 2016).
Recent molecular evolutionary evidence indicates that the invasiveness of T. alata is further supported by positive selection in genes critical for cellular trafficking and protein stability (Ruiz-Calero et al. 2025). Specifically, the identification of sites under positive selection in the POKY POLLEN TUBE (POK) and DnaJ protein homolog (ANJ1) genes which are absent in the non-invasive T. grandiflora points to a specialized genetic toolkit for rapid development and stress tolerance in T. alata. The positive selection on ANJ1, a gene associated with protein folding and stress response, suggests that T. alata has evolved enhanced molecular chaperoning capabilities to maintain cellular homeostasis during the rapid growth phases characteristic of shade avoidance (Gundel et al. 2014).
In conclusion, this study provides the first comprehensive transcriptomic blueprint of light shade T. alata, a globally significant invasive species currently lacking a reference genome. Our findings suggest that the transition from an early developmental baseline to stabilized light environments acts as the fundamental driver of transcriptomic reprogramming. Finaly, when viewed alongside recent evolutionary analyses, it is evident that the invasive success of T. alata is driven by both high physiological plasticity and adaptive evolution through positive selection. By identifying these specific molecular players including high-abundance phosphotransferases and selective PIF/Auxin modules this work establishes a vital genomic foundation for understanding how invasive species utilize both broad-scale transcriptomic shifts and targeted genetic refinements to displace native biodiversity (Theoharides and Dukes 2007). This study provides critical molecular insights that can be directly used for the development of more effective management and control strategies for T. alata and this research enables the identification of potential molecular targets for biosurveillance and the refinement of ecological management practices aimed at mitigating its impact on native Andean biodiversity.
4. Materials and Methods
4.1. Plant Material and Experimental Design
Plants of T. alata were cultivated under controlled greenhouse conditions at the Universidad Católica de Oriente (UCO), Colombia. To evaluate the effect of light availability on plant development and gene expression, two contrasting light regimes were established using high-density polyethylene shade cloths: a Light condition (30% shading) (Mean lx = 5527,65 lm/m2) and a Shade condition (85% shading) (Mean lx = 1825,95 lm/m2). Three plants per condition were sampled (n = 3) Morphological traits, such as stem length, leaf number per plant, and floral induction, were monitored, while leaf area and internode distances were measured using a STANLEY digital caliper (precision ±0.05 mm). These phenotypic datasets served as the biological criteria for selecting the optimal developmental stages and time points for tissue collection. Finally, leaf samples from 4 months old representative individuals in each light, and shade condition were harvested, immediately frozen in liquid nitrogen, and stored at -80 °C for subsequent transcriptomic analysis.
4.2. Plant Material and RNA Extraction
Total RNA was extracted from T. alata leaves collected under different experimental conditions: Light and Shade (n = 3, per condition). Extraction was performed using the GeneJet® RNA Purification Kit (ThermoScientific, USA), following the manufacturer’s protocols. RNA concentration was determined using the Qubit® RNA Assay Kit (ThermoScientific, USA), and RNA integrity was verified via 1% agarose gel electrophoresis to ensure high-quality material for downstream applications.
4.3. Library Preparation and Sequencing
RNA-seq libraries were constructed by uisng the specialized service provider IDSeq, utilizing a rRNA-depleted and lncRNA-seq protocol and the TruSeq Stranded mRNA Library Prep Kit (Illumina®, USA) according to the provider’s specifications. High-throughput sequencing was conducted on an Illumina platform. Around 2 millions of reads per library, for each replicate and each condition were obtained after sequencing (Supplementary Table 1).
4.4. Transcriptome Assembly and Reference Generation
To establish a robust reference for differential expression analysis, we utilized a publicly available transcriptomic dataset from T. alata (NCBI SRA accession: SRX30473604; BioProject: SRP620205), originally generated by Ruiz (2024). This dataset consists of a comprehensive pool of RNA obtained from both vegetative and reproductive tissues, ensuring a broad representation of the specie’s gene space. The de novo assembly derived from these sequences served as the transcriptomic framework for identifying candidate genes involved in light-shade transcriptomic responses.
4.5. Transcriptome Assembly and Bioinformatics Pipeline
The de novo transcriptome of T. alata was assembled using the Trinity v2.8.5 software, integrating raw reads from a mix of vegetative and reproductive tissues (SRA: SRX30473604) to ensure a comprehensive representation of the gene space. Pre-processing of raw reads included the removal of adapter sequences and low-quality bases (Phred score < 20) using Trimmomatic v0.39. The assembly followed a sequential execution of the Inchworm, Chrysalis, and Butterfly modules with in silico read normalization (max_cov 50) to optimize computational efficiency. To reduce transcript redundancy, the raw assembly was clustered using CD-HIT-EST with a 95% identity threshold, retaining the longest representative isoform for each cluster as a unigene. Transcriptome completeness was validated via BUSCO v5.0 against the embryophyta_odb10 database. For differential expression analysis, clean reads from Light and Shade samples were mapped to this reference assembly using Salmon in quasi-mapping mode.
4.6. Statistical Analysis and Data Visualization
All bioinformatic processing, statistical analyses, and graphical representations were performed using the R statistical environment (v4.3.0). Differential expression analysis (DEA) was conducted using the DESeq2 package, applying a Generalized Linear Model (GLM) based on the negative binomial distribution. To control the inflation of Type I errors due to multiple testing, p-values were adjusted using the Benjamini-Hochberg False Discovery Rate (FDR) procedure. Genes were considered significantly differentially expressed (DEGs) if they met the criteria of an adjusted p-value < 0.05 and an absolute Log2 Fold Change (|LFC|) > 1. Data normalization and transformation were carried out using the Variance Stabilizing Transformation (VST) to minimize the heteroscedasticity of the count data for visualization purposes. Functional enrichment of Gene Ontology (GO) terms was analyzed and visualized using the clusterProfiler, AnnotationDbi, and GO.db packages.
High-resolution graphical outputs were generated using custom-made R scripts. Multi-panel heatmaps for targeted gene families were constructed using pheatmap and ggplot2, utilizing Z-score scaling of VST-transformed counts to compare relative expression patterns across Light, Shade, and Base Line conditions. Data manipulation and tidying were handled through the tidyverse suite. All scripts were optimized to ensure reproducibility and specific integration of the T. alata functional annotation.
5. Conclusions
This study presents a comprehensive de novo transcriptome assembly for the aggressive tropical invader T. alata, providing a critical step forward in elevating this species from its “genomic orphan” status using cost-effective Next-Generation Sequencing (NGS). Our functional genomic framework reveals that the striking phenotypic plasticity of T. alata transitioning from rapid vertical growth in the shade to reproductive maturity under full light is underpinned by a massive transcriptomic reprogramming of over 4,000 genes. This adaptive success is driven by a sophisticated dual-strategy: an energetic and antioxidant “physiological priming” network managed by SnRK1 signaling and thylakoid-bound ROS-scavenging mechanisms, alongside morphological agility orchestrated through PIF/Auxin growth modules and NAC and WRKY transcription factors. Furthermore, the identification of a large reservoir of unclassified, species-specific genes highlights novel genetic elements that likely contribute to its evolutionary fitness. Ultimately, these insights establish an essential genomic baseline for the Acanthaceae family and offer a framework for developing targeted, molecularly informed management strategies to mitigate the ecological impact of this species in its invasive ranges.
Author Contributions
Conceptualization, J.C.A.; methodology, J.C.A., D.M. and M.M.; investigation, D.M., M.M. and E.L.; validation, E.L. and J.C.A.; formal analysis, J.C.A.; resources, J.C.A.; data curation, J.C.A.; writing—original draft preparation, J.C.A. and M.Q.; writing, review and editing, J.C.A. and M.Q.; visualization, J.C.A.; supervision, J.C.A.; project administration, J.C.A.; funding acquisition, J.C.A. All authors have read and agreed to the published version of the manuscript.
Funding
This research was funded by Universidad Católica de Oriente through the internal grant call of 2024 and the Instituto Colombiano de Crédito Educativo y Estudios Técnicos en el Exterior (ICETEX) through the Pasaporte a la Ciencia program of 2017 (PhD fellowship awarded to Juan Camilo Alvarez).
Data Availability Statement
We encourage all authors of articles published in MDPI journals to share their research data. In this section, please provide details regarding where data supporting reported results can be found, including links to publicly archived datasets analyzed or generated during the study. Where no new data were created, or where data is unavailable due to privacy or ethical restrictions, a statement is still required. Suggested Data Availability Statements are available in section “MDPI Research Data Policies” at https://www.mdpi.com/ethics.
Acknowledgments
The authors express their gratitude to the Universidad Católica de Oriente for the financial and institutional support provided through the internal grant for research projects. J.C.A. extends a special acknowledgment to ICETEX and the Pasaporte a la Ciencia program for funding his doctoral studies (PhD), which provided the essential experience, training, and knowledge necessary to lead and execute this research project. The authors also thank the administrative and technical staff who provided logistical assistance during the experimental and sequencing phases of this study. During the preparation of this manuscript, the authors used Gemini (version June 2026) for the purposes of structural editing, translating translation verification, and code verification. The authors have reviewed and edited the output and take full responsibility for the content of this publication.
Conflicts of Interest
The authors declare no conflicts of interest.
Abbreviations
The following abbreviations are used in this manuscript:
| ANJ1 | Anisochilus carnosus-like protein 1 |
| BUSCO | Benchmarking Universal Single-Copy Orthologs |
| CAR | Corporación Autónoma Regional de Cundinamarca |
| DEG | Differentially Expressed Gene |
| ANJ1 | Anisochilus carnosus-like protein 1 |
| BUSCO | Benchmarking Universal Single-Copy Orthologs |
| CAR | Corporación Autónoma Regional de Cundinamarca |
| DEG | Differentially Expressed Gene |
| DNA | Deoxyribonucleic acid |
| NAC | NAM, ATAF, and CUC transcription factor family |
| NGS | Next-Generation Sequencing |
| PCA | Principal Component Analysis |
| PIF | Phytochrome-Interacting Factor |
| POK | Phragmoplast orienting kinesin |
| RNA | Ribonucleic acid |
Appendix A
Appendix A.1. Principal Component Analysis (PCA) of the Thunbergia alata transcriptome. The scatter plot illustrates the global transcriptional relationship between biological replicates based on Variance Stabilizing Transformation (VST) normalized counts. PC1 (93% of variance) represents the primary axis of variation, effectively separating the developmental state of the Base Line (green) from the experimental light treatments. PC2 (3% of variance) further distinguishes the specific responses between the Light (yellow) and Shade (grey) conditions.

Table A1.
Sequencing statistics for T. alata light-treatment samples.
| Sample ID | Total Raw Reads | Total Clean Reads | Clean Bases (Gb)* | Q20 (%) | Q30 (%) | GC Content (%) |
|---|---|---|---|---|---|---|
| Light 1 | 2,105,432 | 2,042,269 | 0.61 | 98.4 | 94.2 | 43.15 |
| Light 2 | 1,988,750 | 1,929,087 | 0.58 | 98.1 | 93.8 | 43.41 |
| Light 3 | 2,050,110 | 1,988,606 | 0.60 | 98.5 | 94.5 | 43.22 |
| Shade 1 | 2,210,500 | 2,144,185 | 0.64 | 98.2 | 94.0 | 43.50 |
| Shade 2 | 1,950,400 | 1,891,888 | 0.57 | 97.9 | 93.5 | 43.11 |
| Shade 3 | 2,080,900 | 2,018,473 | 0.61 | 98.3 | 94.1 | 43.34 |
| Average | 2,064,348 | 2,002,418 | 0.60 | 98.2 | 94.0 | 43.29 |
Table A2.
Summary of the Thunbergia alata de novo transcriptome assembly metrics.
| Assembly Metric | Value |
|---|---|
| Total assembled sequences | 68,537 |
| Total assembled bases (bp) | 55,026,443 |
| Contig N50 (bp) | 1,099 |
| N50 count | 2,045 |
| Maximum contig length (bp) | 7,683 |
| Mean contig length (bp) | 802.9 |
| Median contig length (bp) | 613 |
| GC content (%) | 43.29 |
References
- Ballaré, Carlos L.; Pierik, Ronald. The Shade-avoidance Syndrome: Multiple Signals and Ecological Consequences. Plant Cell Environ. 2017, 40(11), 2530–43. [Google Scholar] [CrossRef] [PubMed]
- Chown, Steven L.; Hodgins, Kathryn A.; Griffin, Philippa C.; Oakeshott, John G.; Byrne, Margaret; Hoffmann, Ary A. Biological Invasions, Climate Change and Genomics. Evol. Appl. 2015, 8(1), 23–46. [Google Scholar] [CrossRef] [PubMed]
- Corporación Autónoma Regional de Cundinamarca CAR. “Guía Técnica Para El Manejo y Control de La Especie Invasora Thunbergia Alata (Ojo de Poeta)”. In Dirección de Gestión Biótica; Colombia, B., Ed.; 2020. [Google Scholar]
- Foyer, Christine H.; Lam, Hon Ming; Nguyen, Henry T.; Siddique, Kadambot H. M.; Varshney, Rajeev K.; Colmer, Timothy D.; Cowling, Wallace; Bramley, Helen; Mori, Trevor A.; Hodgson, Jonathan M.; Cooper, James W.; Miller, Anthony J.; Kunert, Karl; Vorster, Juan; Cullis, Christopher; Ozga, Jocelyn A.; Wahlqvist, Mark L.; Liang, Yan; Shou, Huixia; Shi, Kai; Yu, Jingquan; Fodor, Nandor; Kaiser, Brent N.; Wong, Fuk Ling; Valliyodan, Babu; Considine, Michael J. Neglecting Legumes Has Compromised Human Health and Sustainable Food Production. Nat. Plants 2016, 2(8). [Google Scholar] [CrossRef] [PubMed]
- Gundel, Pedro E.; Pierik, Ronald; Mommer, Liesje; Ballaré, Carlos L. Competing Neighbors: Light Perception and Root Function. Oecologia 2014, 176(1), 1–10. [Google Scholar] [CrossRef] [PubMed]
- Heberling, J. Mason; Fridley, Jason D. Resource-use Strategies of Native and Invasive Plants in Eastern North American Forests. New Phytol. 2013, 200(2), 523–33. [Google Scholar] [CrossRef] [PubMed]
- Hellmann, Jessica J.; Byers, James E.; Bierwagen, Britta G.; Dukes, Jeffrey S. Five Potential Consequences of Climate Change for Invasive Species. Conserv. Biol. 2008, 22(3), 534–43. [Google Scholar] [CrossRef] [PubMed]
- Hulsmans, Sander; Rodriguez, Marianela; De Coninck, Barbara; Rolland, Filip. The SnRK1 Energy Sensor in Plant Biotic Interactions. Trends Plant Sci. 2016, 21(8), 648–61. [Google Scholar] [CrossRef] [PubMed]
- Jiang, Lingyan; Zhang, Shizi; Su, Jianbin; Peck, Scott C.; Luo, Lijuan. Protein Kinase Signaling Pathways in Plant-Colletotrichum Interaction. Front. Plant Sci. 2022, 12. [Google Scholar] [CrossRef] [PubMed]
- Khan, Naeem; Bano, Asghari; Babar, MD Ali. Metabolic and Physiological Changes Induced by Plant Growth Regulators and Plant Growth Promoting Rhizobacteria and Their Impact on Drought Tolerance in Cicer Arietinum L. PLoS ONE 2019, 14(3), e0213040. [Google Scholar] [CrossRef] [PubMed]
- Leivar, Pablo; Monte, Elena. PIFs: Systems Integrators in Plant Development. Plant Cell 2014, 26(1), 56–78. [Google Scholar] [CrossRef] [PubMed]
- Meyerson, Laura A.; Mooney, Harold A. Invasive Alien Species in an Era of Globalization. Front. Ecol. Environ. 2007, 5(4), 199–208. [Google Scholar] [CrossRef]
- Phukan, Ujjal J.; Jeena, Gajendra S.; Shukla, Rakesh K. WRKY Transcription Factors: Molecular Regulation and Stress Responses in Plants. Front. Plant Sci. 2016, 7. [Google Scholar] [CrossRef] [PubMed]
- Pyšek, Petr; Richardson, David M. Invasive Species, Environmental Change and Management, and Health. Annu. Rev. Environ. Resour. 2010, 35(1), 25–55. [Google Scholar] [CrossRef]
- Quijano-Abril, Mario Alberto; López, Maria de los Ángeles Castaño; Marín-Henao, Daniela; Sánchez-Gómez, David Alejando; Rojas-Villa, Jose Miguel; Sierra-Escobar, Jorge. Rasgos Funcionales de La Especie Invasora Thunbergia Alata (Acanthaceae) y Su Importancia En La Adaptación a Bosques Andinos. Acta Botan. Mex. 2021, (128). [Google Scholar] [CrossRef]
- Ruiz-Calero, S.; Suárez-Baron, H.; Pérez-Mesa, P. A. Molecular Evolutionary Analysis of Genes Potentially Associated with Invasiveness in Two Species of the Genus Thunbergia (Acanthaceae). Biol. Invasions 2025, 1–26. [Google Scholar]
- Ruiz-Londoño, David; Pérez-Mesa, Pablo A.; Suárez-Baron, Harold. Transcriptomic Dataset of the Invasive Species Thunbergia Alata and Its Congener Thunbergia Grandiflora (Acanthaceae) in Cali, Colombia. Data Brief. 2026, 66, 112861. [Google Scholar] [CrossRef] [PubMed]
- Seebens, Hanno; Meyerson, Laura A.; Richardson, David M.; Lenzner, Bernd; Tricarico, Elena; Courchamp, Franck; Aleksanyan, Alla; Keskin, Emre; Saeedi, Hanieh; Akite, Perpetra; Alexander, Jake M.; Bailey, Sarah A.; Biancolini, Dino; Blackburn, Tim M.; Boehmer, Hans Juergen; Bortolus, Alejandro; Cadotte, Marc W.; Capinha, César; Carlton, James T.; Crouch, Jo Anne; Daehler, Curtis C.; Essl, Franz; Foxcroft, Llewellyn C.; Fridley, Jason D.; Fuentes, Nicol; Gaertner, Mirijam; Galil, Bella; García-Berthou, Emili; García-Díaz, Pablo; Haider, Sylvia; Heneghan, Liam; Hughes, Kevin A.; Hui, Cang; Kaplan, Ekin; Liebhold, Andrew M.; Liu, Chunlong; Marchante, Elizabete; Marchante, Hélia; Marticorena, Alicia; Minter, David W.; Moreno, Rodrigo A.; Nentwig, Wolfgang; Niamir, Aidin; Novoa, Ana; Nunes, Ana L.; Pauchard, Aníbal; Rahlao, Sebataolo; Ricciardi, Anthony; Russell, James C.; Sankaran, K. V.; Schertler, Anna; Schwindt, Evangelina; Shackleton, Ross T.; Simberloff, Daniel; Strayer, David L.; Tawake, Alifereti; Thines, Marco; Villaseñor-Parada, Cristóbal; Vitule, Jean Ricardo Simões; Wagner, Viktoria; Werenkraut, Victoria; Wesche, Karsten; Willette, Demian A.; Zenni, Rafael D.; Pyšek, Petr. Biological Invasions: A Global Assessment of Geographic Distributions, Long-term Trends, and Data Gaps. Biol. Rev. 2025, 100(6), 2542–83. [Google Scholar] [CrossRef] [PubMed]
- Theoharides, Kathleen A.; Dukes, Jeffrey S. Plant Invasion across Space and Time: Factors Affecting Nonindigenous Species Success during Four Stages of Invasion. New Phytol. 2007, 176(2), 256–73. [Google Scholar] [CrossRef] [PubMed]
Figure 1.
Morphological phenotype of Thunbergia alata under contrasting light environments. Representative individuals of T. alata grown under Light (left) and Shade (right) conditions. Plants in the light treatment exhibited advanced reproductive development, characterized by the presence of mature flowers and higher leaf density. Conversely, individuals in the shade treatment maintained a predominantly vegetative state with marked vertical climbing habit, consistent with the induction of shade avoidance responses.
Figure 1.
Morphological phenotype of Thunbergia alata under contrasting light environments. Representative individuals of T. alata grown under Light (left) and Shade (right) conditions. Plants in the light treatment exhibited advanced reproductive development, characterized by the presence of mature flowers and higher leaf density. Conversely, individuals in the shade treatment maintained a predominantly vegetative state with marked vertical climbing habit, consistent with the induction of shade avoidance responses.
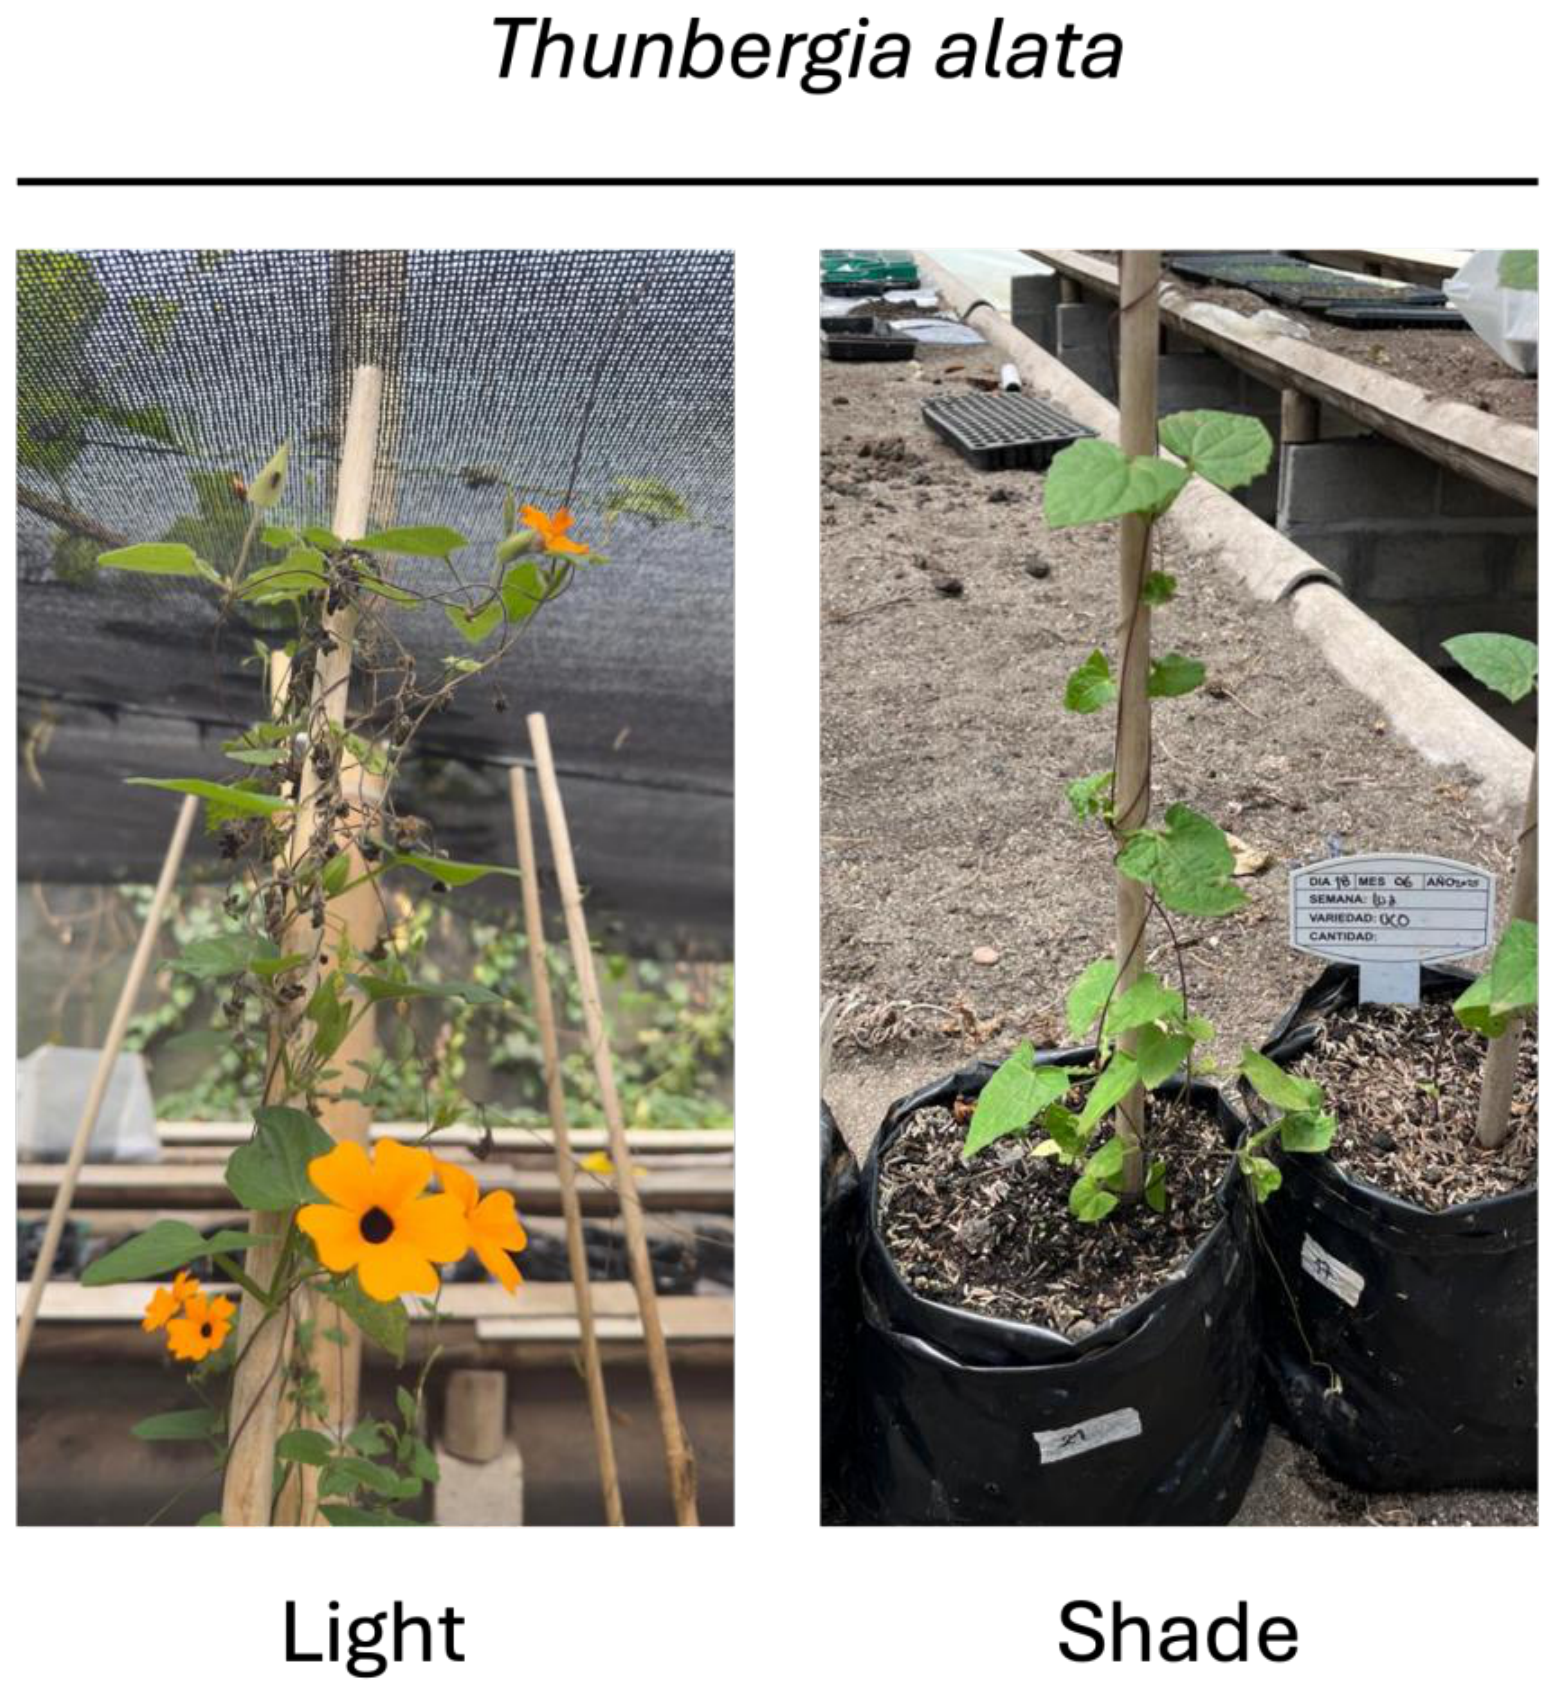
Figure 2.
Functional annotation of the Thunbergia alata transcriptome. The bar chart displays the distribution and abundance of the top annotated functional categories based on the number of transcripts. Colors represent transcript abundance, highlighting the dominance of phosphotransferases and proteins involved in signal transduction and metabolic regulation.
Figure 2.
Functional annotation of the Thunbergia alata transcriptome. The bar chart displays the distribution and abundance of the top annotated functional categories based on the number of transcripts. Colors represent transcript abundance, highlighting the dominance of phosphotransferases and proteins involved in signal transduction and metabolic regulation.
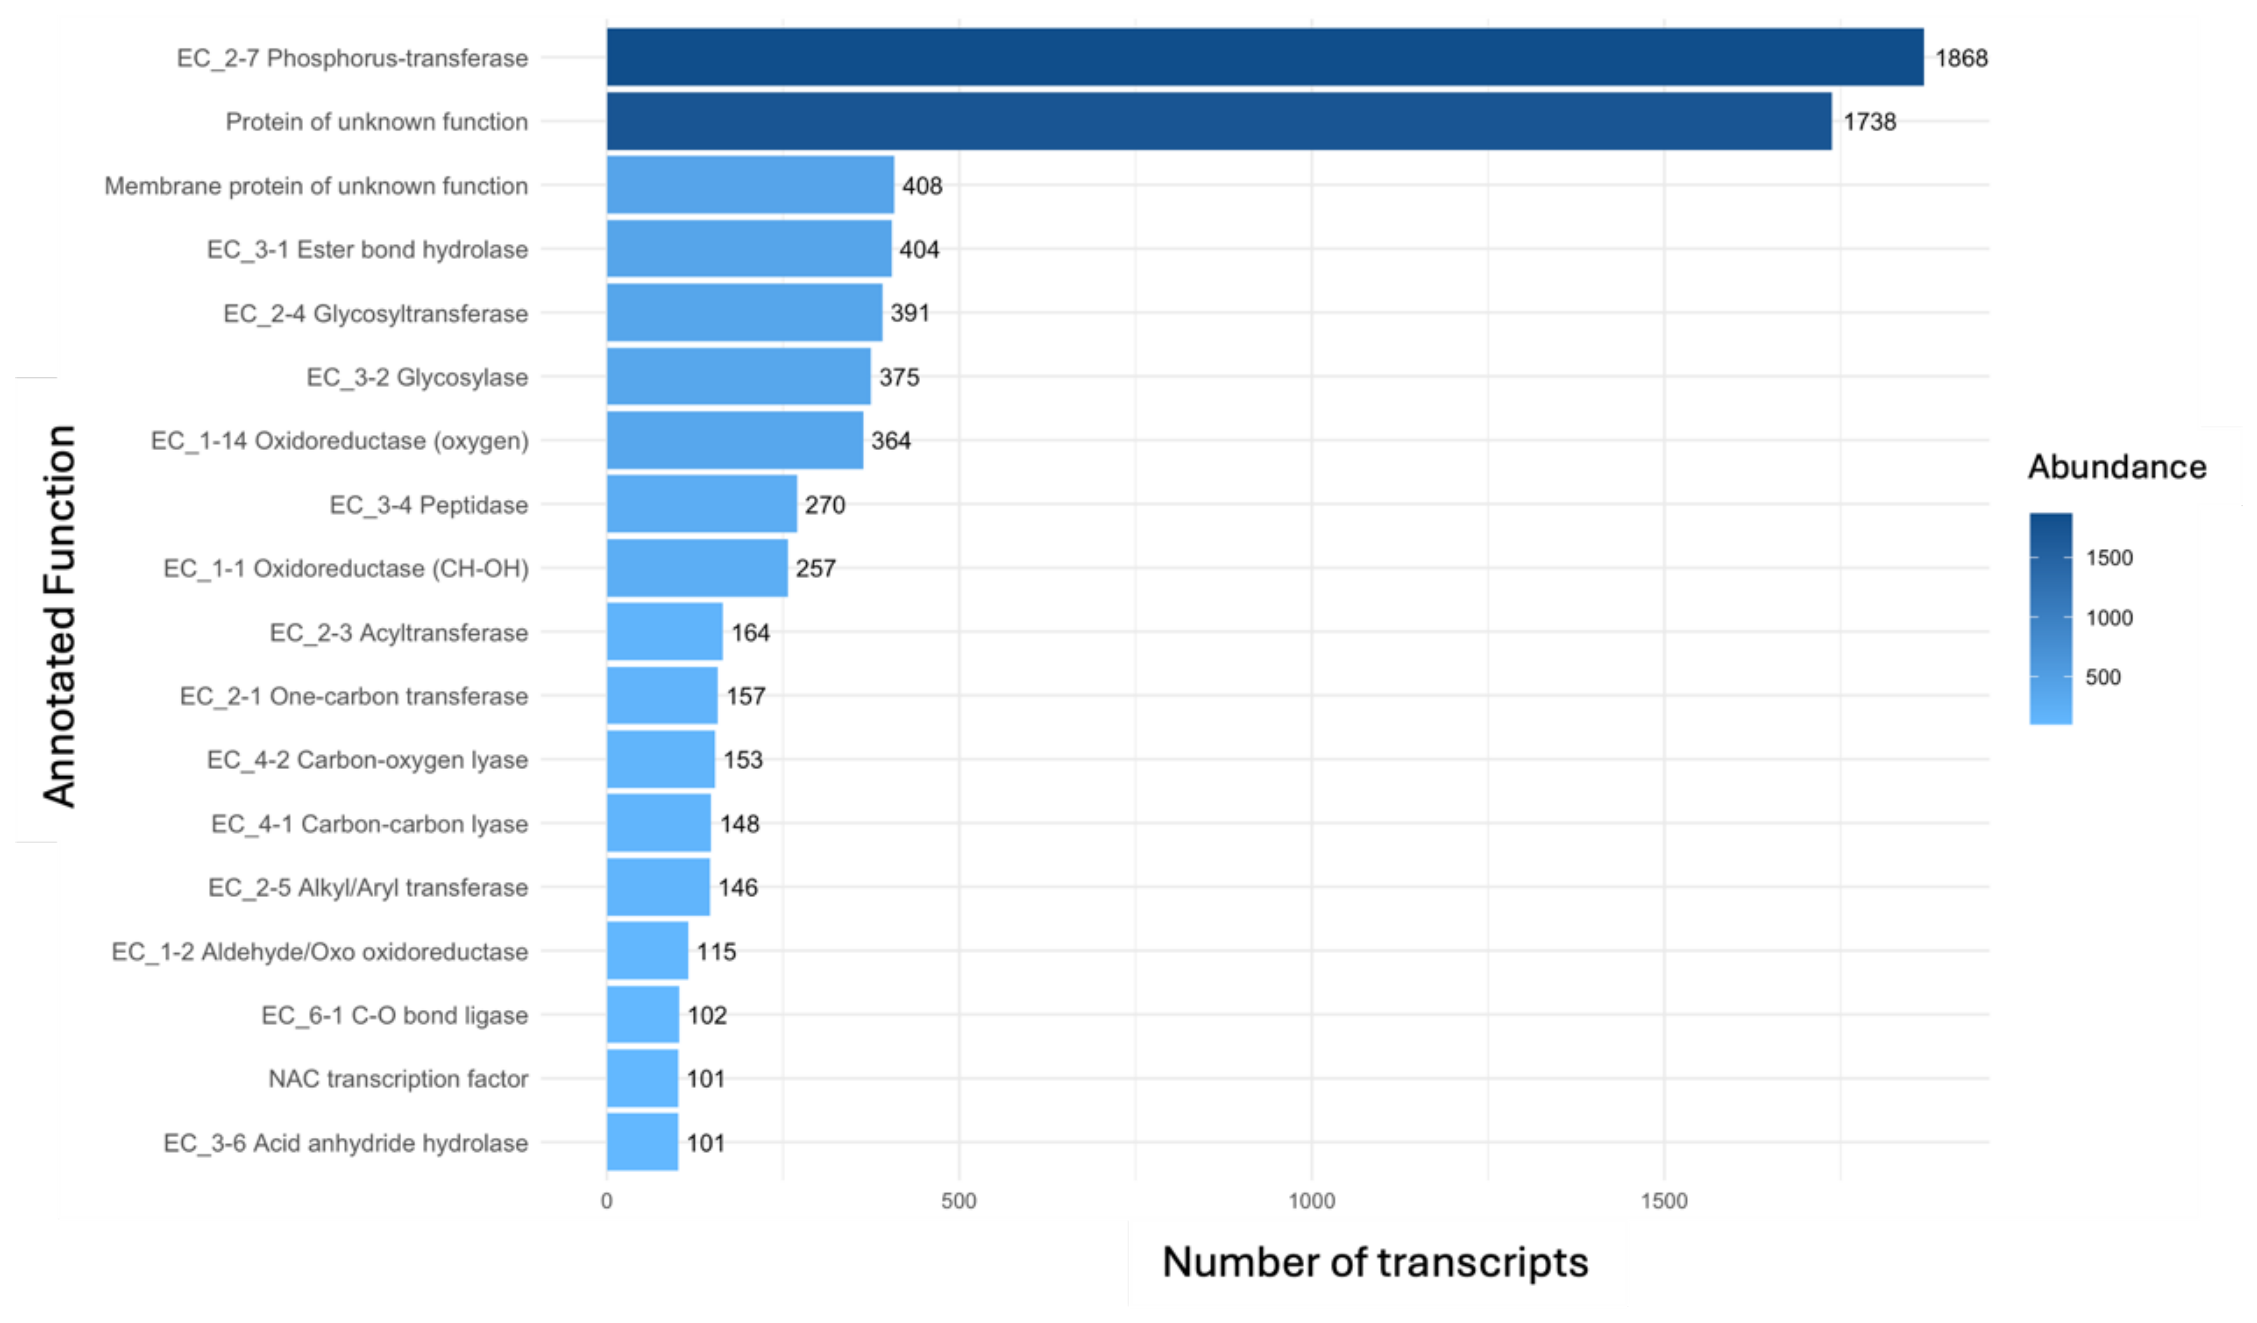
Figure 3.
Global Differential Gene Expression (DGE) Profiles. A, B) Volcano plots acting as analytical controls to visualize the relationship between statistical significance (-log10 p-adjusted) and the magnitude of change (log2 Fold Change) for individual transcripts; the distinctive “double-wing” pattern confirms a high-confidence regulatory response. C) Summary bar chart of the number of up-regulated and down-regulated genes across experimental comparisons.
Figure 3.
Global Differential Gene Expression (DGE) Profiles. A, B) Volcano plots acting as analytical controls to visualize the relationship between statistical significance (-log10 p-adjusted) and the magnitude of change (log2 Fold Change) for individual transcripts; the distinctive “double-wing” pattern confirms a high-confidence regulatory response. C) Summary bar chart of the number of up-regulated and down-regulated genes across experimental comparisons.
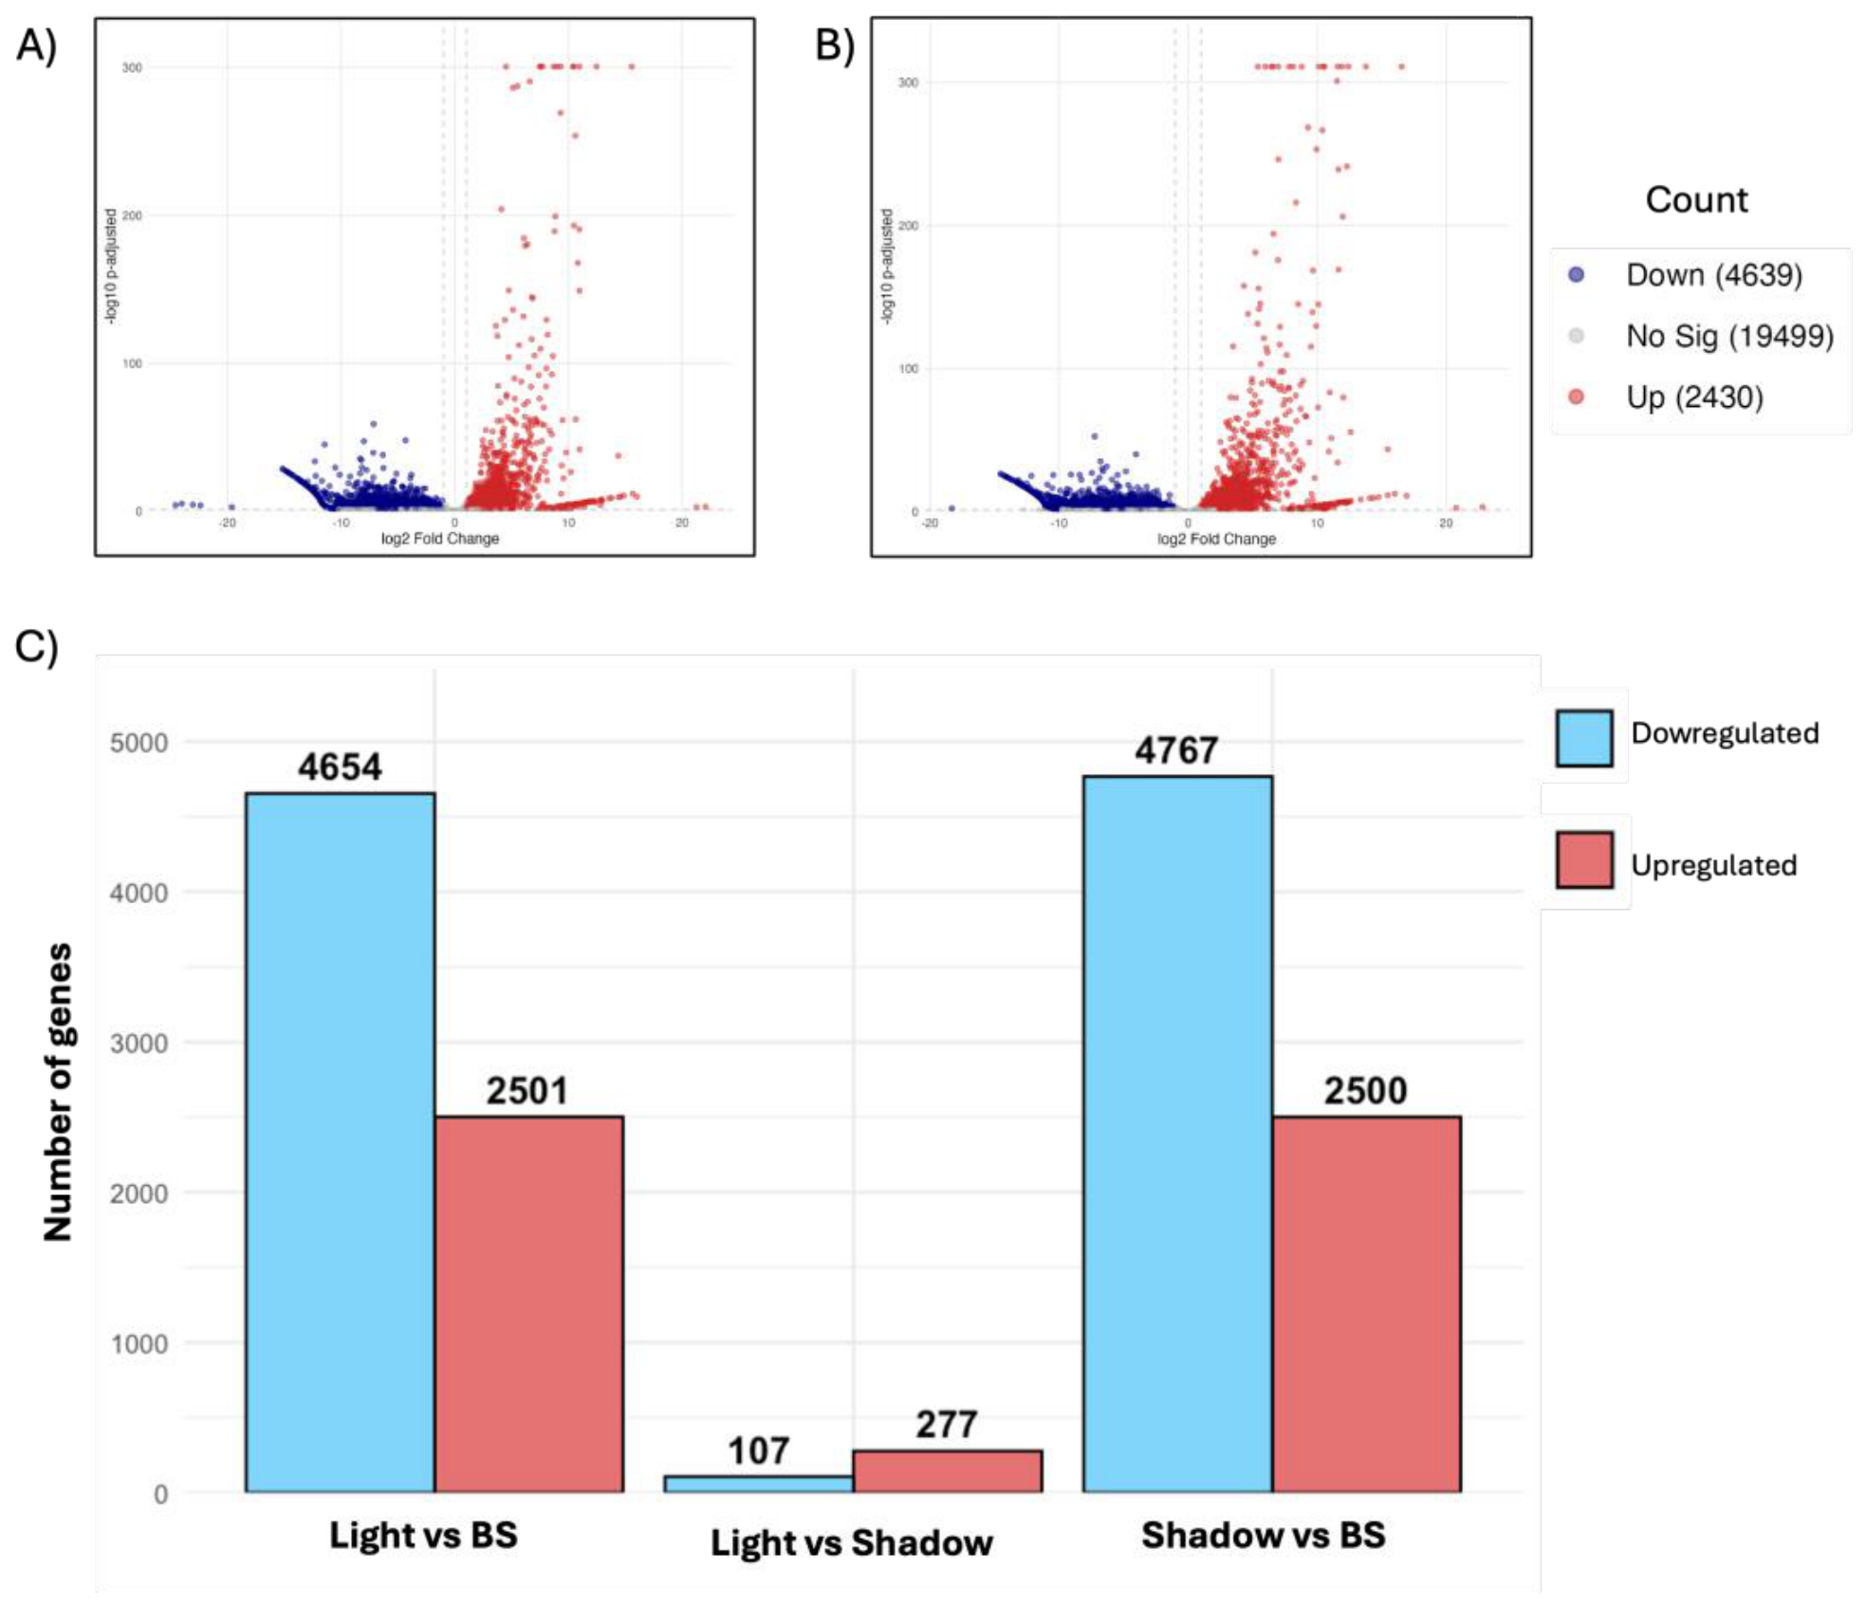
Figure 4.
Expression profiles of the top 50 most highly responsive DEGs in T. alata. The heatmaps display Z-score normalized expression values for three biological replicates across Base Line, Shade, and Light conditions. A) Global top 50 DEGs, including highly regulated transcripts with no current functional annotation, indicating potential novel light-responsive candidates. B) Top 50 DEGs excluding genes with no assigned function to highlight known metabolic and regulatory pathways. Red indicates relative up-regulation and blue indicates down-regulation.
Figure 4.
Expression profiles of the top 50 most highly responsive DEGs in T. alata. The heatmaps display Z-score normalized expression values for three biological replicates across Base Line, Shade, and Light conditions. A) Global top 50 DEGs, including highly regulated transcripts with no current functional annotation, indicating potential novel light-responsive candidates. B) Top 50 DEGs excluding genes with no assigned function to highlight known metabolic and regulatory pathways. Red indicates relative up-regulation and blue indicates down-regulation.
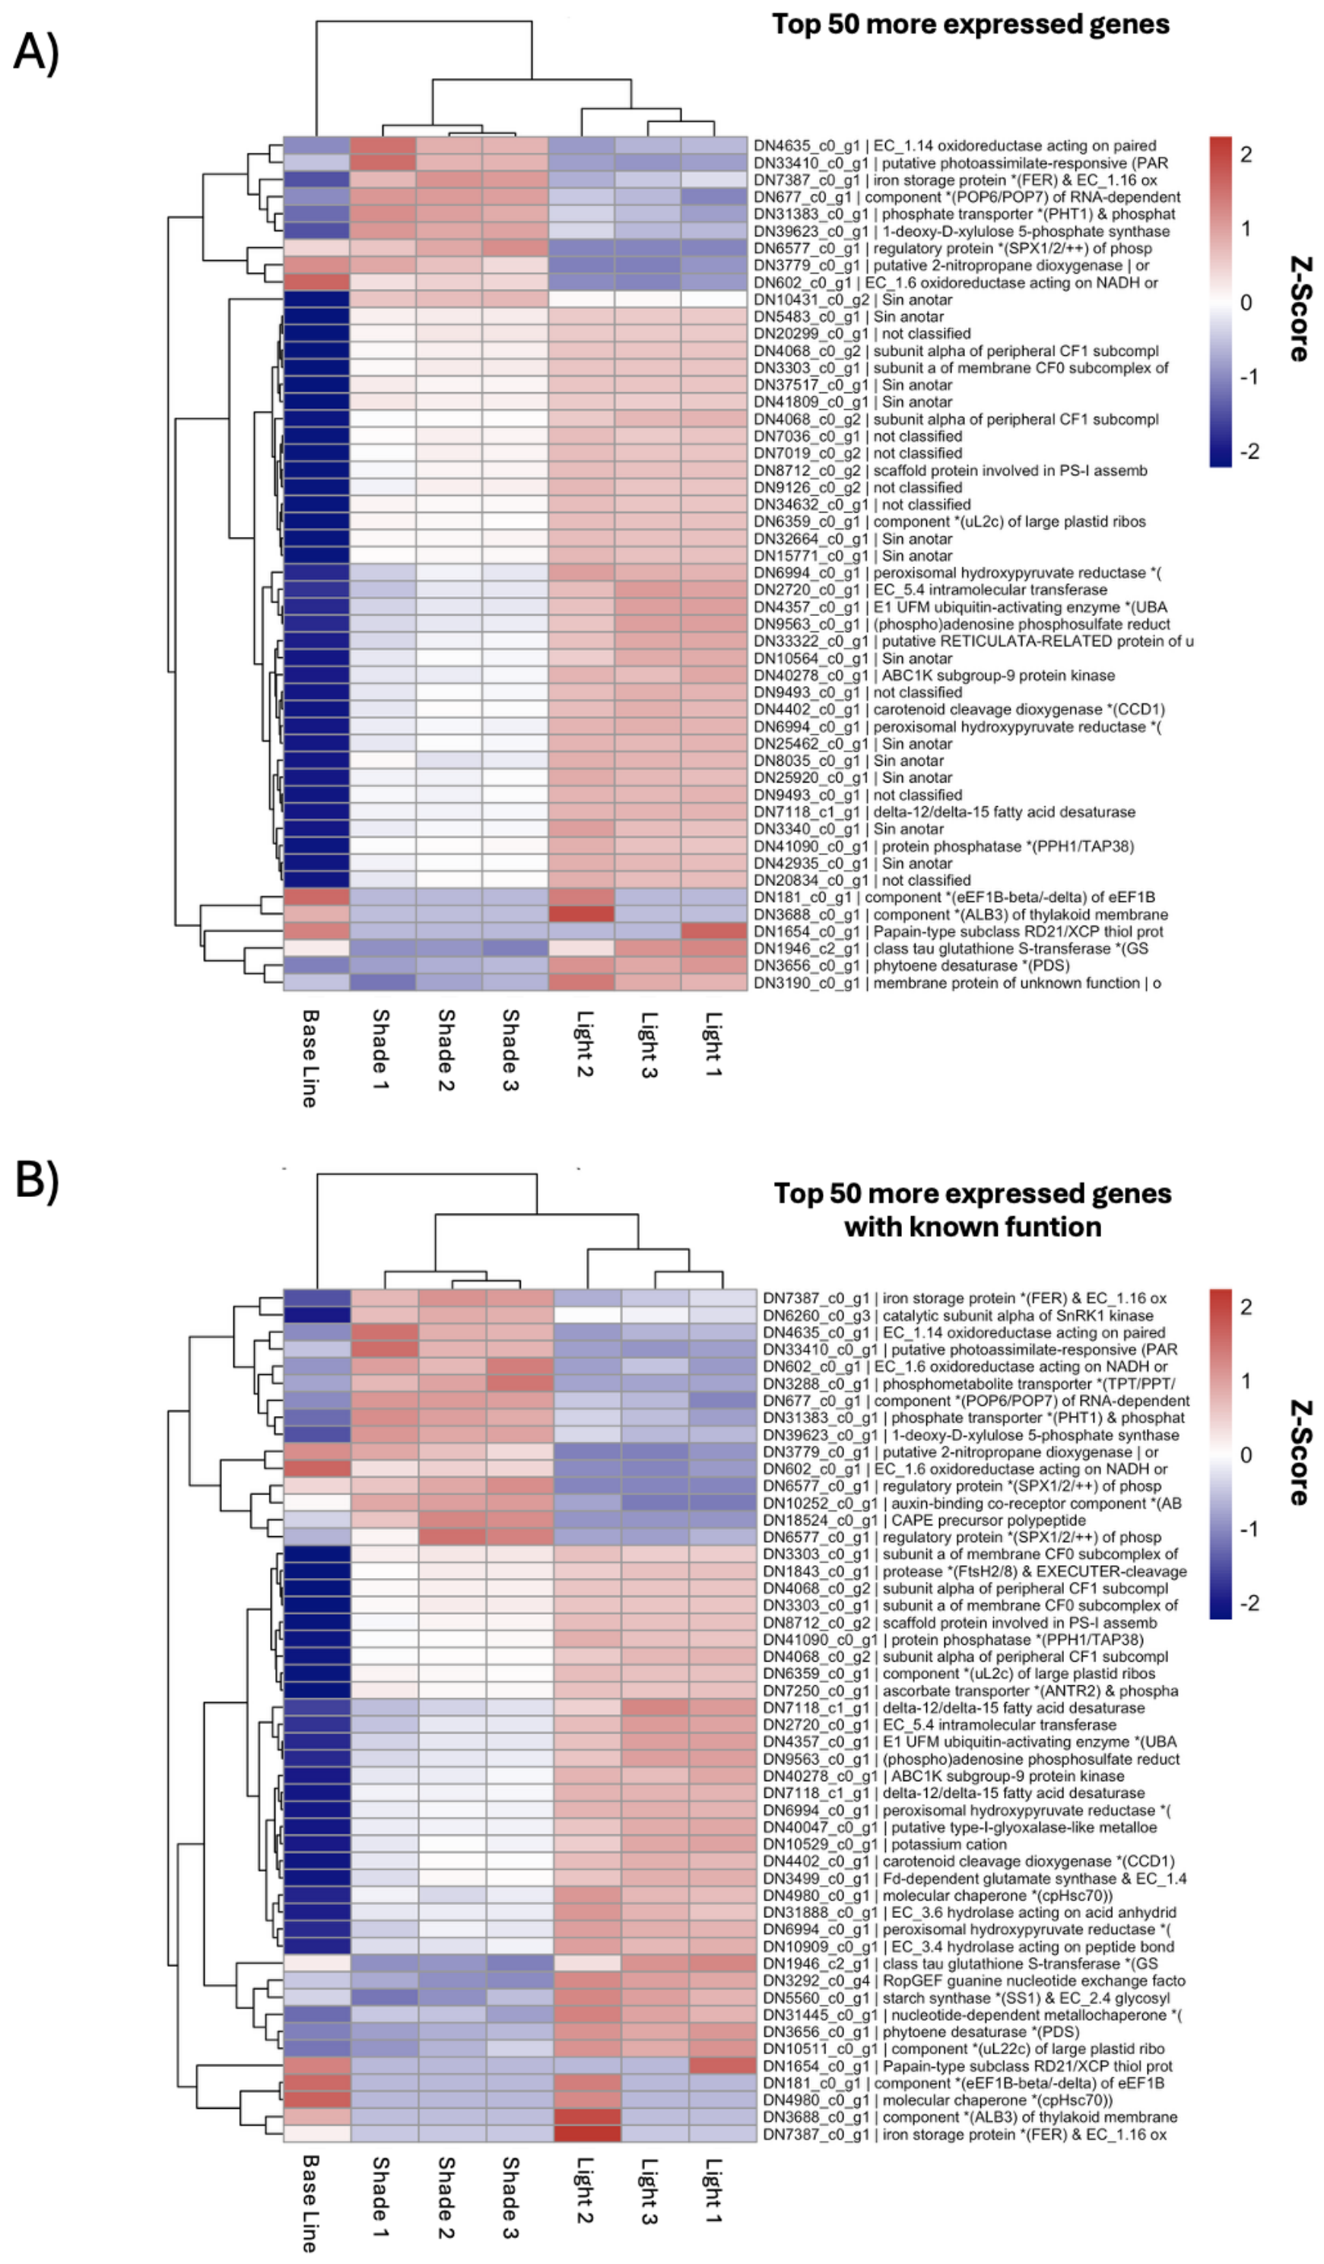
Figure 5.
Gene Ontology (GO) enrichment analysis of differentially expressed genes in T. alata. The dot plots illustrate the top enriched GO terms for the comparisons: A) Light vs. Base Line, B) Shadow vs. Base Line, and C) Light vs. Shadow. The size of the dots represents the Gene Count, and the color indicates the statistical significance (p.adjust), with red representing higher significance. The x-axis indicates the GeneRatio, representing the proportion of DEGs relative to the total number of genes in that GO category.
Figure 5.
Gene Ontology (GO) enrichment analysis of differentially expressed genes in T. alata. The dot plots illustrate the top enriched GO terms for the comparisons: A) Light vs. Base Line, B) Shadow vs. Base Line, and C) Light vs. Shadow. The size of the dots represents the Gene Count, and the color indicates the statistical significance (p.adjust), with red representing higher significance. The x-axis indicates the GeneRatio, representing the proportion of DEGs relative to the total number of genes in that GO category.
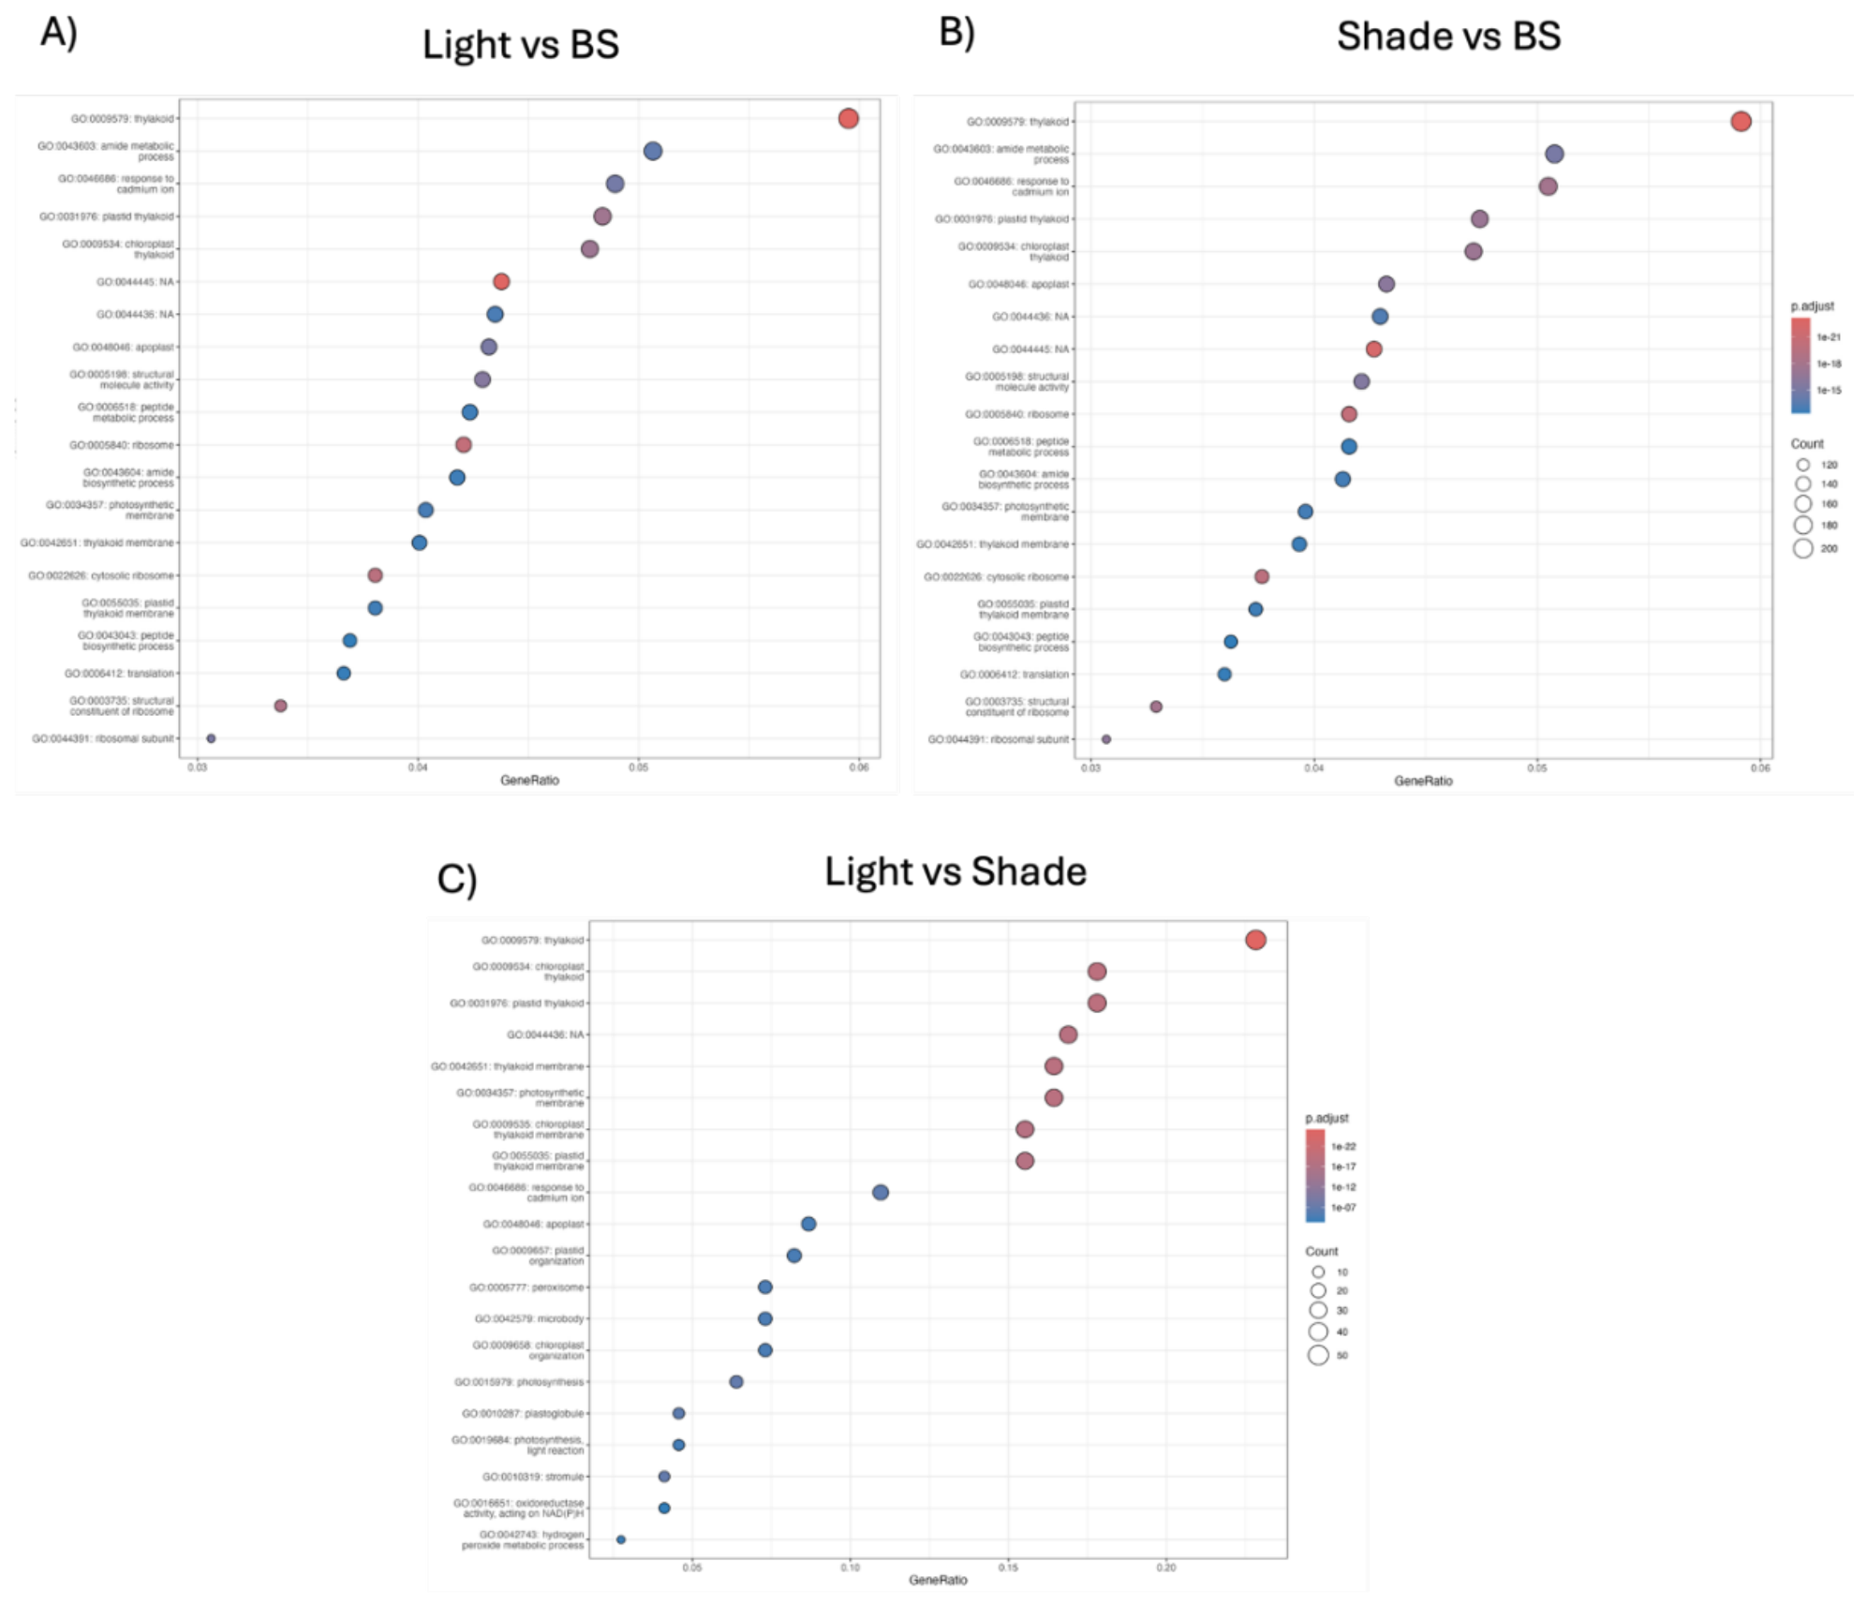
Figure 6.
Targeted expression profiling of key regulatory and metabolic gene families in T. alata. Heatmap targeted analysis for Auxins, bHLH/PIF (Phytochrome Interacting Factors), Photosynthesis, NAC and WRKY transcription factors, and Phosphotransferases (PTS). Data are shown for Base Line, Light, and Shade conditions. Red indicates relative up-regulation and blue indicates down-regulation. The clustering reveals a dominant trend of gene repression following the transition from the base line to stabilized light environments, with specific gene subsets showing condition-specific induction. Z-score represents normalized expression values.
Figure 6.
Targeted expression profiling of key regulatory and metabolic gene families in T. alata. Heatmap targeted analysis for Auxins, bHLH/PIF (Phytochrome Interacting Factors), Photosynthesis, NAC and WRKY transcription factors, and Phosphotransferases (PTS). Data are shown for Base Line, Light, and Shade conditions. Red indicates relative up-regulation and blue indicates down-regulation. The clustering reveals a dominant trend of gene repression following the transition from the base line to stabilized light environments, with specific gene subsets showing condition-specific induction. Z-score represents normalized expression values.
Disclaimer/Publisher’s Note: The statements, opinions and data contained in all publications are solely those of the individual author(s) and contributor(s) and not of MDPI and/or the editor(s). MDPI and/or the editor(s) disclaim responsibility for any injury to people or property resulting from any ideas, methods, instructions or products referred to in the content. |
© 2026 by the authors. Licensee MDPI, Basel, Switzerland. This article is an open access article distributed under the terms and conditions of the Creative Commons Attribution (CC BY) license (http://creativecommons.org/licenses/by/4.0/).
Copyright: This open access article is published under a Creative Commons CC BY 4.0 license, which permit the free download, distribution, and reuse, provided that the author and preprint are cited in any reuse.


