

Submitted:
08 July 2026
Posted:
09 July 2026
You are already at the latest version
Abstract
Tea quality is primarily determined by the accumulation of specialized metabolites in fresh leaves; however, the mechanisms by which propagation methods influence tea quality through plant–soil–microbiome interactions remain poorly understood. Here, sexually propagated (SR) and asexually propagated (AR) tea plants were comparatively investigated by integrating soil physicochemical analyses, leaf physiological assessments, widely targeted metabolomics, and rhizosphere metagenomic profiling. Compared with AR, SR significantly improved soil nutrient availability, characterized by higher soil organic matter, nitrogen, and phosphorus contents, and promoted the accumulation of key quality-related components, including tea polyphenols and soluble sugars. In particular, tea polyphenol content increased by 58.8%, while available phosphorus increased by 161.5% under SR conditions. SR also exhibited enhanced antioxidant capacity, as evidenced by elevated superoxide dismutase, peroxidase, and indole-3-acetic acid oxidase activities while maintaining hydrogen peroxide homeostasis.
Metabolomic analysis revealed distinct metabolic reprogramming between propagation types, with differential metabolites significantly enriched in flavonoid biosynthesis, phenolic acid metabolism, caffeine metabolism, and α-linolenic acid metabolism pathways. Concurrently, metagenomic analyses demonstrated that SR reshaped rhizosphere microbial communities by enriching Actinomycetota, Pseudomonadota, and Planctomycetota and altering microbial functional profiles associated with central carbon metabolism, including glycolysis and the tricarboxylic acid cycle. Integrated microbiome–metabolome analyses further revealed strong positive associations between SR-enriched microbial taxa and quality-related metabolites, particularly flavonoids and phenolic acids, suggesting a close coupling between rhizosphere microbial functions and leaf metabolic reprogramming. Collectively, our findings demonstrate that propagation method acts as an important driver of tea quality formation by coordinating soil nutrient availability, rhizosphere microbial carbon-cycling functions, plant physiological regulation, and metabolite accumulation. This study provides multi-omics evidence for a soil–microbiota–metabolome coupling mechanism underlying propagation method-dependent tea quality formation and highlights the potential of sexual propagation as a strategy for producing high-quality tea.
Keywords:
Camellia sinensis
; propagation method
; tea quality
; metabolomics
; microbiome
1. Introduction
Tea plant (Camellia sinensis L.) is one of the most economically important perennial crops worldwide and provides one of the most widely consumed beverages. Tea quality is largely determined by the composition and accumulation of specialized metabolites in fresh leaves, particularly tea polyphenols, flavonoids, phenolic acids, amino acids, soluble sugars, and alkaloids [1,2]. These metabolites collectively contribute to tea flavor, aroma, nutritional value, and health-promoting properties [3]. Consequently, elucidating the factors and mechanisms regulating the accumulation of quality-related metabolites has become a major objective in tea science and sustainable tea production [4].
Tea quality formation is influenced by a combination of genetic, environmental, and management factors [5]. Among these, propagation strategy represents a fundamental determinant of plant development and long-term adaptation [6]. In tea cultivation systems, both sexual propagation and asexual propagation are widely employed. Asexual propagation through cuttings is generally preferred because it preserves elite parental traits and ensures population uniformity [7]. In contrast, sexually propagated plants often exhibit greater genetic diversity, stronger root development, and improved environmental adaptability [8,9]. Previous studies have mainly focused on the effects of propagation methods on seedling establishment, growth performance, and stress resistance [10]. However, whether propagation strategy contributes to tea quality formation and the ecological processes underlying such effects remain poorly understood.
Recent advances in plant–soil ecology have demonstrated that crop quality is not solely regulated by plant genetic characteristics but is also strongly influenced by belowground ecological processes [11,12]. The rhizosphere microbiome constitutes a key biological interface linking soil environments with plant physiological and metabolic activities [13]. Rhizosphere microorganisms participate in organic matter decomposition, nutrient mineralization, phosphorus solubilization, nitrogen transformation, and phytohormone production, thereby regulating plant growth and metabolism [14,15]. Increasing evidence suggests that microbial communities can influence the biosynthesis and accumulation of secondary metabolites through nutrient mobilization and plant–microbe signaling interactions [16]. In tea ecosystems, rhizosphere microbial composition has been reported to be closely associated with nutrient availability, tea plant health, and quality-related metabolic traits [17,18]. Furthermore, plant genotype and cultivation practices can significantly alter microbial community assembly and functional composition, indicating that plant-associated factors may affect tea quality through microbiome-mediated pathways [19].
Among the diverse ecological functions performed by rhizosphere microorganisms, carbon cycling is increasingly recognized as a central process governing plant–soil–microbe interactions [20]. Soil microorganisms regulate the transformation and utilization of plant-derived carbon through glycolysis, gluconeogenesis, the tricarboxylic acid (TCA) cycle, and various fermentation pathways [21]. These processes drive nutrient turnover, energy flow, and ecosystem functioning while simultaneously influencing soil fertility and nutrient availability [22]. Recent studies have shown that microbial carbon metabolism plays a crucial role in determining the fate of plant-fixed carbon and regulating nutrient acquisition by plants [23,24]. Alterations in microbial carbon-cycling functions may therefore influence plant physiological status and metabolic activity, ultimately affecting crop quality [25]. Despite the recognized importance of carbon cycling in agroecosystems, its potential involvement in propagation method-dependent tea quality formation has not yet been systematically investigated.
The rapid development of high-throughput metabolomics and metagenomics has substantially improved our understanding of the mechanisms underlying plant quality formation [26]. Emerging evidence indicates that soil physicochemical properties, rhizosphere microbial communities, and plant metabolic networks are tightly interconnected and collectively regulate the accumulation of quality-related metabolites [27,28]. This has led to the development of the Soil–Microbiome–Metabolome coupling concept, which emphasizes coordinated interactions among soil nutrient availability, microbial functional activities, and plant metabolic reprogramming [29]. Although such coupling relationships have been increasingly reported in agricultural ecosystems, whether different propagation strategies can reshape rhizosphere microbial communities and carbon-cycling functions and subsequently drive metabolic reprogramming associated with tea quality remains unclear [30].
Therefore, sexually propagated (SR) and asexually propagated (AR) tea plants were comparatively investigated using an integrated framework combining soil physicochemical analyses, leaf physiological assessments, widely targeted metabolomics, and rhizosphere metagenomic profiling. The objectives of this study were to elucidate how propagation method regulates tea quality formation through coordinated changes in soil nutrient availability, rhizosphere microbial community assembly, microbial carbon-cycling functions, and leaf metabolic profiles, and to establish a Soil–Microbiome–Metabolome coupling framework underlying propagation method-dependent tea quality formation.
2. Results
2.1. Soil Properties and Leaf Physiological Traits
Propagation method significantly affected soil nutrient status (Figure 1). Soil pH and total potassium (TK) did not differ significantly between SR and AR tea plantations. Compared with AR, SR significantly increased soil organic matter (SOM), total nitrogen (TN), alkali-hydrolyzable nitrogen (AN), and available phosphorus (AP) by 23.1%, 18.2%, 27.8%, and 161.5%, respectively (P < 0.05). In contrast, available potassium (AK) was significantly reduced by 24.4% under SR relative to AR (P < 0.05). These results indicate that SR was associated with higher organic matter accumulation and greater nitrogen and phosphorus availability.
2.2. Leaf Quality-Related Traits and Physiological Responses
Significant differences in several quality-related traits were observed between SR and AR tea plants (Figure 2). Moisture content, water extract, and free amino acid content showed no significant differences between treatments. However, SR significantly increased dry matter, tea polyphenol, and soluble sugar contents by 11.5%, 58.8%, and 8.6%, respectively, compared with AR (P < 0.05). The superoxide anion (O2⁻) production rate was also significantly higher in SR than in AR, increasing by 9.3% (P < 0.05). These results suggest that SR promoted the accumulation of key quality-related components, particularly tea polyphenols.
Reactive oxygen species levels and antioxidant enzyme activities also differed between propagation methods (Figure 3). H2O2 content, catalase (CAT) activity, and polyphenol oxidase (PPO) activity showed no significant differences between SR and AR. In contrast, superoxide dismutase (SOD), peroxidase (POD), and indole-3-acetic acid oxidase (IAAO) activities were significantly increased under SR by 30.4%, 92.0%, and 21.7%, respectively (P < 0.05). Overall, SR exhibited higher activities of antioxidant-related enzymes while maintaining H2O2 homeostasis.
2.3. Metabolomic Profiling and Differential Metabolite Accumulation
Metabolomic profiling revealed clear differences in leaf metabolic composition between SR and AR (Figure 4). Both PCA and OPLS-DA showed distinct separation between the two treatments, indicating substantial metabolic divergence. A total of 113 differentially accumulated metabolites were identified, including 32 upregulated and 81 downregulated metabolites in SR relative to AR. KEGG enrichment analysis showed that these metabolites were mainly involved in α-linolenic acid metabolism, caffeine metabolism, carotenoid biosynthesis, plant hormone signal transduction, and flavonoid-related biosynthetic pathways.
The heatmap further confirmed distinct metabolite accumulation patterns between SR and AR (Figure 5). Biological replicates within each treatment clustered closely, indicating good reproducibility of the metabolomic profiles. Differential metabolites mainly included flavonoids, phenolic acids, lipids, terpenoids, alkaloids, amino acids and derivatives, lignans and coumarins, nucleotides and derivatives, organic acids, and tannins. These results demonstrate that propagation method substantially altered leaf metabolic profiles, particularly pathways related to secondary metabolite accumulation.
2.4. Rhizosphere Microbial Community Structure and Biomarkers
Rhizosphere microbial community composition differed markedly between SR and AR (Figure 6). PCoA based on Bray–Curtis distances showed clear separation between the two treatments, with PCoA1 and PCoA2 explaining 99.1% and 1.62% of the total variation, respectively. Samples within each treatment clustered closely, indicating high reproducibility among biological replicates. These results indicate that propagation method strongly reshaped rhizosphere microbial community structure.
LEfSe analysis identified several microbial taxa that contributed to the differentiation between SR and AR (Figure 7). SR was mainly enriched with Actinomycetota, Alphaproteobacteria, Streptomycetales, Pseudomonadota, and Planctomycetota. In contrast, AR was enriched with Acidobacteriota, Chloroflexota, Bradyrhizobium, Nitrobacteraceae, and several archaeal lineages. These findings suggest that SR and AR supported distinct rhizosphere microbial assemblages.
2.5. Microbial Functional Profiles and Carbon Cycling Pathways
Microbial functional profiles also differed between propagation methods (Figure 8). PCoA based on functional composition showed clear separation between SR and AR, with PCoA1 and PCoA2 explaining 74.5% and 25.46% of the total variation, respectively. This separation indicates that propagation method altered not only microbial taxonomic composition but also microbial functional potential.
Carbon-cycling pathway analysis showed that central carbon metabolism pathways dominated the functional profiles of both treatments (Figure 9). Major pathways included anaplerotic reactions, gluconeogenesis, glycolysis, the tricarboxylic acid (TCA) cycle, and fermentation-related pathways. Distinct abundance patterns of these pathways were observed between SR and AR, indicating propagation method-dependent shifts in microbial carbon metabolic functions.
2.6. Microbiome–Metabolome Association and Co-Occurrence Network
Spearman correlation analysis revealed extensive associations between dominant microbial taxa and differentially accumulated metabolites (Figure 10). Actinomycetota, Pseudomonadota, and Planctomycetota, which were enriched in SR, showed significant positive correlations with multiple flavonoids, phenolic acids, and soluble sugar-related metabolites. In contrast, Acidobacteriota and Chloroflexota, which were enriched in AR, were predominantly negatively correlated with these metabolites.
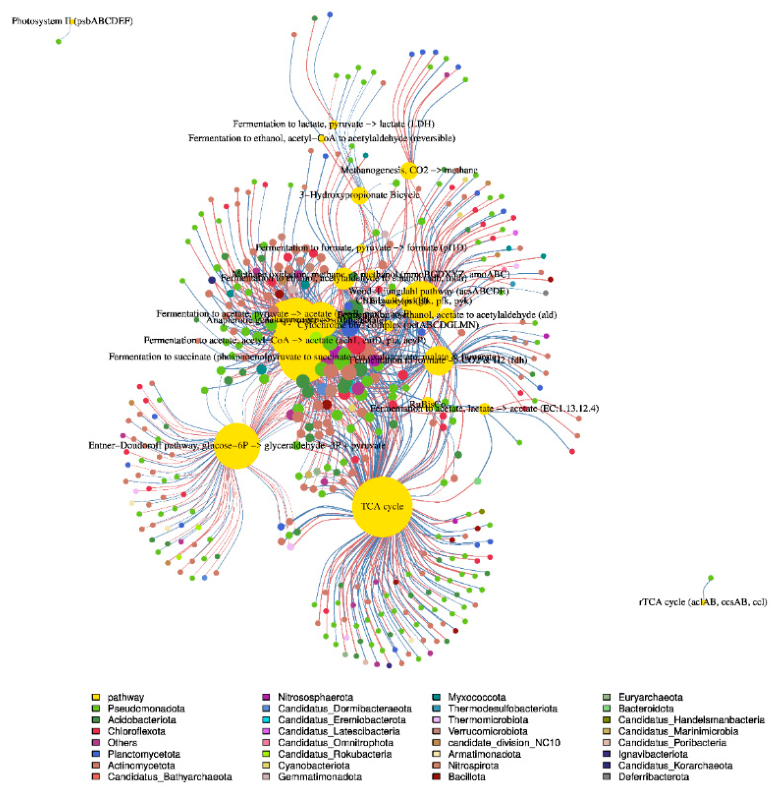
Co-occurrence network analysis showed that key carbon-cycling pathways, including the tricarboxylic acid (TCA) cycle, glycolysis, gluconeogenesis, and acetate-producing fermentation pathways, occupied central positions within the network and were connected to multiple dominant microbial taxa (Figure 11). Taxa affiliated with Actinomycetota, Pseudomonadota, Acidobacteriota, and Chloroflexota exhibited significant associations with carbon-cycling pathways.
3. Discussion
3.1. Sexual Propagation Improves Soil Nutrient Availability and Promotes Tea Quality Formation
Soil nutrient availability is a fundamental determinant of tea growth, productivity, and quality formation. Previous studies have demonstrated that soil organic matter and available nutrient pools not only regulate nutrient supply capacity but also influence the biosynthesis and accumulation of quality-related metabolites in tea plants [31,32]. In the present study, SR exhibited significantly higher SOM, TN, AN, and AP contents than AR, indicating that propagation strategy substantially altered the rhizosphere nutrient environment. Similar observations have been reported in perennial crops, where sexually propagated plants often develop deeper and more extensive root systems, resulting in enhanced nutrient acquisition and greater efficiency in soil resource utilization [33,34].
Among essential nutrients, nitrogen and phosphorus play particularly important roles in determining tea quality. Nitrogen serves as a key constituent of amino acids, proteins, nucleic acids, and numerous secondary metabolites, whereas phosphorus is indispensable for energy transfer, photosynthesis, and carbon metabolism [35,36]. Improved nitrogen and phosphorus availability can enhance photosynthetic carbon assimilation and increase the supply of metabolic precursors required for the biosynthesis of flavonoids, phenolic compounds, and other quality-related metabolites [37]. Consistent with this mechanism, SR significantly increased tea polyphenol and soluble sugar contents relative to AR. Tea polyphenols are major contributors to tea flavor, antioxidant capacity, and health-promoting properties, whereas soluble sugars are closely associated with sweetness and overall flavor balance [38,39].
The positive relationship between nutrient availability and tea quality observed in this study is supported by previous reports. Wang et al. (2024) demonstrated that elevated levels of soil organic matter, nitrogen, and phosphorus were positively associated with the accumulation of tea polyphenols and soluble sugars, highlighting the critical role of nutrient supply in quality formation. Notably, the increase in tea polyphenol content observed in SR (58.8%) was substantially greater than the responses commonly reported under conventional nutrient management practices. This finding suggests that propagation strategy may exert broader influences on quality formation beyond nutrient acquisition alone, potentially through long-term effects on plant growth characteristics and resource utilization patterns.
Plant physiological status represents another important factor regulating metabolite accumulation. ROS function not only as indicators of oxidative stress but also as signaling molecules involved in the regulation of plant growth, development, and secondary metabolism [40]. Antioxidant enzymes, including SOD, POD, and CAT, constitute the primary defense system responsible for maintaining cellular redox homeostasis [41]. In the present study, SR significantly increased SOD, POD, and IAAO activities while maintaining a stable H2O2 concentration. Similar responses have been reported in plants exhibiting enhanced physiological vigor and greater metabolic activity [42]. Elevated antioxidant enzyme activities may facilitate the maintenance of intracellular redox balance, thereby creating favorable physiological conditions for sustained biosynthesis and accumulation of quality-related metabolites.
Collectively, these findings indicate that sexual propagation creates a more favorable nutrient environment and physiological status for tea quality formation. The coordinated enhancement of nutrient availability and physiological activity under SR likely contributes to the greater accumulation of quality-related metabolites observed in tea leaves.
3.2. Sexual Propagation Reshapes Rhizosphere Microbial Community Assembly
Our results revealed distinct rhizosphere microbial community structures between SR and AR. PCoA analysis demonstrated a clear separation of microbial communities between the two propagation strategies. In addition, SR was characterized by higher relative abundances of Actinomycetota, Pseudomonadota, and Planctomycetota, whereas Acidobacteriota and Chloroflexota were enriched in AR. These findings indicate that propagation strategy plays an important role in shaping rhizosphere microbial community assembly in tea plantations.
The composition of rhizosphere microbial communities is strongly influenced by host plant traits, including root architecture, nutrient acquisition patterns, and root exudate composition [43,44]. Increasing evidence suggests that variations in plant genetic background can modify rhizosphere niches and subsequently alter microbial community assembly [45,46]. Therefore, the microbial divergence observed in this study suggests that sexual and asexual propagation strategies may create distinct rhizosphere environments, leading to different microbial assembly patterns.
Notably, Actinomycetota enriched in SR are widely recognized for their capacity to degrade complex organic substrates and participate in soil organic matter turnover and nutrient cycling processes [47]. Many members of this phylum can also produce plant growth-promoting compounds and antimicrobial metabolites, thereby contributing to rhizosphere health and plant performance [48]. Similarly, Pseudomonadota are generally regarded as copiotrophic microorganisms whose abundance is often associated with nutrient-rich environments and active carbon metabolism [49]. In the present study, SR simultaneously exhibited higher SOM, TN, and AP levels together with increased abundances of these microbial groups, suggesting a close linkage between nutrient availability and microbial community composition.
In contrast, Acidobacteriota enriched in AR are commonly considered oligotrophic microorganisms that are better adapted to nutrient-limited environments [50]. Likewise, Chloroflexota are frequently associated with ecological niches characterized by relatively low nutrient availability and slower metabolic turnover rates [51]. The enrichment of these taxa in AR therefore reflects differences in rhizosphere ecological conditions established under the two propagation strategies.
Similar patterns have been reported in other perennial plant systems. Xiong et al. [52] demonstrated that plants with greater nutrient-use efficiency tended to recruit more Actinomycetota and Pseudomonadota, whereas Acidobacteriota were more abundant in plants exhibiting lower nutrient acquisition capacity. Our observations are generally consistent with these findings. However, unlike previous studies that primarily focused on cultivar differences or fertilization regimes, the present study demonstrates that propagation strategy alone can substantially reshape rhizosphere microbial community structure under otherwise similar management conditions.
Collectively, these findings indicate that sexual and asexual propagation strategies establish distinct rhizosphere microbial assembly patterns. The enrichment of Actinomycetota and Pseudomonadota under SR is generally associated with active organic matter turnover and nutrient cycling processes, whereas AR favors microbial taxa characterized by oligotrophic ecological strategies. Such differences highlight the important role of propagation strategy in regulating rhizosphere ecological niches and microbial community assembly.
3.3. Microbial Carbon-Cycling Functions Mediate Metabolic Reprogramming
Our results demonstrated that propagation strategy altered not only the taxonomic composition of rhizosphere microbial communities but also their functional profiles. Functional PCoA revealed a clear separation between SR and AR, indicating substantial differences in microbial metabolic potential. In addition, carbon-cycling pathway analysis showed that key pathways, including glycolysis, gluconeogenesis, the tricarboxylic acid (TCA) cycle, and fermentation-related processes, differed markedly between the two propagation strategies. These findings suggest that propagation strategy may influence rhizosphere carbon metabolism through shifts in microbial functional composition.
Carbon cycling is a fundamental ecological process governing nutrient turnover, energy flow, and organic matter transformation in terrestrial ecosystems [53,54]. Microorganisms are the primary drivers of carbon-cycling processes and play critical roles in regulating the decomposition, transformation, and utilization of organic carbon substrates [55]. Consequently, changes in microbial community composition are frequently accompanied by shifts in carbon-cycling functions, ultimately affecting nutrient availability and plant metabolic processes [56].
In the present study, SR was associated with a greater abundance of microbial taxa involved in organic matter decomposition and nutrient cycling, including Actinomycetota and Pseudomonadota. These microbial groups are widely recognized for their ability to utilize diverse carbon substrates and participate in active carbon turnover processes [57,58]. Enhanced microbial carbon metabolism may accelerate the release and recycling of nutrients from soil organic matter, thereby increasing the availability of resources required for plant growth and secondary metabolism.
Previous studies have shown that alterations in rhizosphere carbon metabolism can influence plant metabolic profiles by modifying carbon allocation patterns and nutrient acquisition efficiency [59,60]. Carbon fluxes generated through microbial activity are closely linked to the biosynthesis of secondary metabolites, particularly flavonoids, phenolic compounds, and other carbon-rich metabolites [61]. Consistent with these observations, the present study identified substantial differences in metabolite accumulation patterns between SR and AR, especially among flavonoids, phenolic acids, and other secondary metabolites. These results suggest that microbial carbon-cycling functions may represent an important ecological link connecting rhizosphere processes with leaf metabolic reprogramming.
Notably, most previous studies have focused on the effects of fertilization practices, soil amendments, or plant genotypes on rhizosphere carbon metabolism [62,63]. In contrast, our findings indicate that propagation strategy alone can significantly alter microbial carbon-cycling functions under comparable management conditions. This observation expands current understanding of the ecological consequences of propagation strategy and highlights its potential role in regulating plant–soil interactions.
Collectively, these findings suggest that microbial carbon-cycling functions serve as an important intermediary linking rhizosphere microbial community assembly with leaf metabolic variation. The observed shifts in carbon metabolism may contribute to the differential accumulation of quality-related metabolites between SR and AR, providing a functional basis for propagation-dependent metabolic reprogramming.
3.4. Soil–Microbiome–Metabolome Coupling Underlies Propagation-Dependent Tea Quality Formation
The present study revealed coordinated changes in soil properties, rhizosphere microbial communities, microbial functional profiles, and leaf metabolite accumulation under different propagation strategies. Compared with AR, SR not only improved rhizosphere nutrient availability but also altered microbial community assembly, enhanced carbon-cycling functions, and promoted the accumulation of quality-related metabolites. These findings suggest that propagation strategy influences tea quality through a complex ecological network rather than through a single regulatory pathway.
Increasing evidence indicates that plant performance is jointly regulated by interactions among soil conditions, microbial communities, and plant metabolic processes [64,65]. Within this framework, soil nutrients provide the material basis for plant growth, rhizosphere microorganisms regulate nutrient transformation and resource turnover, and plant metabolism ultimately determines the synthesis and accumulation of quality-related compounds [66]. Consequently, the interaction among these components forms an integrated Soil–Microbiome–Metabolome system that plays a critical role in plant adaptation and quality formation.
In the present study, SR was associated with higher nutrient availability, particularly SOM, TN, AN, and AP, which may have contributed to the recruitment of microbial taxa involved in organic matter turnover and nutrient cycling. The enrichment of Actinomycetota and Pseudomonadota was accompanied by shifts in microbial carbon-cycling functions and significant changes in metabolite accumulation patterns. These observations suggest that modifications in rhizosphere ecological niches may trigger cascading responses from microbial community assembly to functional processes and ultimately to plant metabolism.
Notably, correlation and co-occurrence network analyses further demonstrated close associations among dominant microbial taxa, carbon-cycling pathways, and quality-related metabolites. Although correlation does not necessarily imply causation, these relationships indicate that rhizosphere microorganisms and their associated functional pathways may contribute to the regulation of metabolite accumulation. Similar coupling relationships among soil properties, microbial communities, and plant metabolomes have been reported in several crop systems [67,68], supporting the ecological framework proposed in this study.
Based on the integrated results, we propose a conceptual model in which propagation strategy first modifies rhizosphere nutrient conditions, subsequently reshapes microbial community assembly and carbon-cycling functions, and ultimately influences leaf metabolic reprogramming and tea quality formation. This framework highlights the importance of Soil–Microbiome–Metabolome interactions in mediating propagation-dependent phenotypic variation and provides a new perspective for understanding the ecological consequences of propagation strategy in perennial crops.
Collectively, our findings suggest that Soil–Microbiome–Metabolome coupling represents a key mechanism underlying the superior quality characteristics observed in SR. The coordinated regulation of nutrient availability, microbial assembly, functional metabolism, and metabolite accumulation may jointly contribute to propagation-dependent tea quality formation.
4. Materials and Methods
4.1. Experimental Site
The study was initiated in October 2022 and sample collection was conducted during the spring tea-growing season of 2024 at the Tea Experimental Station of the Jiangxi Academy of Economic Crops, Jiangxi Province, China (28°22′N, 116°00′E). The experimental site is located in a major tea-producing region of southern China and is characterized by a typical subtropical monsoon climate, with abundant precipitation, moderate temperatures, and a long frost-free period.
The experimental plantation consisted of approximately 40-year-old tea plants (Camellia sinensis cv. ‘Fudingdabai’) managed under conventional cultivation practices. Tea plants were arranged with a row spacing of 1.5 m and an intra-row spacing of approximately 0.20 m and were subjected to light annual pruning. Both sexually propagated and asexually propagated tea plantations had been established prior to the initiation of this study and had been managed under similar agronomic conditions for an extended period.
The soil at the experimental site is classified as red soil derived from Quaternary red clay. Prior to sample collection, composite soil samples were collected from the 0–20 cm soil layer to determine the initial soil physicochemical properties. The soil was strongly acidic, with a pH of 4.48. Soil organic matter (SOM), total nitrogen (TN), total phosphorus (TP), and total potassium (TK) contents were 31.04, 2.59, 2.19, and 4.21 g kg‒1, respectively. The concentrations of alkali-hydrolyzable nitrogen (AN), available phosphorus (AP), and available potassium (AK) were 130.71, 115.34, and 158.25 mg kg‒1, respectively.
4.2. Experimental Design and Sampling
Sexually propagated tea plants (SR) and asexually propagated tea plants (AR) of the cultivar ‘Fudingdabai’ were used as experimental materials. To minimize the influence of non-propagation factors, both plantations were located within the same experimental station and were managed under identical agronomic practices, including fertilization, pruning, irrigation, and pest and disease control.
A single-factor comparative design was employed, with propagation method as the only experimental variable. Two treatments were established: sexually propagated tea plants and asexually propagated tea plants. Each treatment consisted of three independent biological replicates. For each replicate, tea plants exhibiting uniform growth and free from visible symptoms of pests or diseases were selected for sampling.
Sampling was conducted during the spring tea-growing season of 2024. Fresh leaf samples consisting of one bud and two adjacent leaves were collected from multiple tea plants within each replicate and pooled to form one composite sample. Leaf samples were immediately transported to the laboratory on ice and divided into two portions. One portion was used for the determination of tea quality-related traits and physiological parameters, whereas the remaining portion was immediately frozen in liquid nitrogen and stored at −80 °C for subsequent metabolomic analyses.
Rhizosphere soil samples were collected simultaneously with leaf sampling. Briefly, tea roots were carefully excavated, and loosely attached soil was removed by gentle shaking. Soil tightly adhering to the root surface was collected using sterile brushes and defined as rhizosphere soil. Rhizosphere soil collected from three to five tea plants within each replicate was thoroughly mixed to obtain one composite sample. After removing roots and plant residues through a 2-mm sieve, each sample was divided into two portions. One portion was air-dried for soil physicochemical analyses, whereas the other portion was immediately frozen in liquid nitrogen and stored at −80 °C for metagenomic sequencing and functional analyses.
4.3. Soil Physicochemical Analysis
Soil pH was determined potentiometrically using a pH meter (PHS-3C, INESA Scientific Instrument Co., Ltd., Shanghai, China) at a soil-to-water ratio of 1:2.5 (w/v) according to Lu [69]. Soil organic matter (SOM) was determined using the potassium dichromate oxidation method [69]. Total nitrogen (TN) was determined using the Kjeldahl digestion method as previously described by Wang et al. [70]. Total phosphorus (TP) was determined by the molybdenum–antimony colorimetric method following acid digestion, whereas total potassium (TK) was determined by flame photometry [69]. Alkali-hydrolyzable nitrogen (AN) was determined using the alkali diffusion method [69]. Available phosphorus (AP) was extracted with 0.5 M NaHCO₃ and quantified following the procedure described by He et al. [71]. Available potassium (AK) was extracted with 1 M ammonium acetate and determined by flame photometry [69]. All measurements were performed in triplicate.
4.4. Determination of Quality-Related Traits
Tea polyphenol content was determined using the Folin–Ciocalteu colorimetric method as previously described by Mao et al. [72]. Free amino acid content was determined using the ninhydrin colorimetric method following the procedure reported by Ma et al. [73]. Water extract content was determined according to the method described by He et al. [74]. Briefly, dried tea samples were extracted with boiling distilled water, filtered, and the extract was evaporated to dryness to determine the water extract content. Caffeine content was determined using a UV–Vis spectrophotometer (UV-2600, Shimadzu Corporation, Kyoto, Japan) according to the method described by Kalisz et al. [75]. All measurements were performed using three biological replicates.
4.5. Determination of Reactive Oxygen Species and Antioxidant Enzyme Activities
Fresh leaf samples (0.5 g) were homogenized in pre-cooled phosphate buffer (pH 7.0) and centrifuged at 12,000 × g for 20 min at 4 °C. The resulting supernatant was used for the determination of physiological parameters.
Hydrogen peroxide (H2O2) content and superoxide anion (O2⁻) production rate were determined using commercial assay kits (Nanjing Jiancheng Bioengineering Institute, Nanjing, China) according to the manufacturer’s instructions. The activities of superoxide dismutase (SOD), peroxidase (POD), catalase (CAT), polyphenol oxidase (PPO), and indole-3-acetic acid oxidase (IAAO) were measured using corresponding commercial assay kits supplied by the same manufacturer.
Absorbance changes were monitored using a UV–Vis spectrophotometer (UV-2600, Shimadzu Corporation, Kyoto, Japan), and enzyme activities were calculated according to the protocols provided by the manufacturer. All measurements were conducted using three biological replicates.
4.6. Widely Targeted Metabolomic Analysis
Widely targeted metabolomic analysis was performed using an ultra-performance liquid chromatography–tandem mass spectrometry (UPLC–MS/MS) platform comprising a Shimadzu UPLC system (Shimadzu Corporation, Kyoto, Japan) coupled with a QTRAP 6500+ mass spectrometer (AB Sciex, Framingham, MA, USA).
Leaf samples were freeze-dried using a vacuum freeze dryer and subsequently ground into a fine powder using a mixer mill equipped with zirconia beads. Metabolites were extracted with 70% methanol and incubated overnight at 4 °C. Following centrifugation, the supernatants were collected and filtered through a 0.22 μm membrane prior to LC–MS/MS analysis.
Metabolite detection was performed in multiple reaction monitoring (MRM) mode. Metabolite identification and quantification were conducted based on comparisons with an in-house metabolite database (Metware Biotechnology Co., Ltd., Wuhan, China) in combination with public metabolite databases. Quality control (QC) samples were prepared by pooling aliquots from all biological samples and were injected periodically throughout the analytical sequence to monitor instrument stability and analytical reproducibility.
Raw metabolomic data were normalized prior to statistical analyses. Principal component analysis (PCA) was employed to evaluate overall metabolic variation among samples. Orthogonal partial least squares discriminant analysis (OPLS-DA) was performed to identify metabolites contributing to group separation. Differentially accumulated metabolites (DAMs) were screened based on a variable importance in projection (VIP) value ≥ 1 and an absolute log2 fold change (|log2FC|) ≥ 1. Volcano plots and hierarchical clustering heatmaps were generated to visualize metabolite variation patterns. Kyoto Encyclopedia of Genes and Genomes (KEGG) enrichment analysis was subsequently performed to identify significantly affected metabolic pathways.
All metabolomic analyses were conducted by Metware Biotechnology Co., Ltd. (Wuhan, China).
4.7. DNA Extraction and Metagenomic Sequencing
Total microbial DNA was extracted from rhizosphere soil samples using a commercial soil DNA extraction kit according to the manufacturer’s instructions. DNA concentration and purity were assessed using a NanoDrop spectrophotometer (Thermo Fisher Scientific, Wilmington, DE, USA), and DNA integrity was evaluated by agarose gel electrophoresis.
Sequencing libraries were constructed following standard protocols and subsequently sequenced on the Illumina NovaSeq platform (Illumina Inc., San Diego, CA, USA) using a paired-end sequencing strategy. Raw sequencing reads were subjected to quality control procedures, including adapter trimming, removal of low-quality reads, and elimination of potential host-derived sequences. High-quality clean reads were retained for downstream analyses.
Clean reads were assembled into contigs using MEGAHIT, and open reading frames (ORFs) were predicted using Prodigal. Non-redundant gene catalogs were subsequently generated for taxonomic and functional annotation analyses.
4.8. Taxonomic Annotation and Microbial Community Structure Analysis
Taxonomic annotation of predicted genes was performed using DIAMOND against the NCBI non-redundant (NR) protein database, which was extracted to include bacterial, fungal, archaeal, and viral sequences. The NR database version used for taxonomic assignment was 2022.05. DIAMOND blastp searches were performed with an e-value threshold of 1 × 10⁻⁵ [76]. For each sequence, hits with e-values within tenfold of the best hit were retained, and taxonomic assignment was determined using the lowest common ancestor (LCA) algorithm implemented in MEGAN. The relative abundances of microbial taxa at different taxonomic levels were calculated based on the summed abundances of genes assigned to each taxon.
Principal coordinate analysis (PCoA) based on Bray–Curtis dissimilarity was conducted to evaluate differences in microbial community composition between treatments. Taxonomic composition at different classification levels was visualized using relative abundance profiles. Differentially abundant microbial taxa between SR and AR treatments were identified using LEfSe analysis [77] and used for downstream correlation analyses.
4.9. Functional Annotation and Carbon Cycling Pathway Analysis
Functional annotation of non-redundant genes was performed using the Kyoto Encyclopedia of Genes and Genomes (KEGG) database. Functional profiles were generated according to annotated KEGG Orthology (KO) entries.
To investigate propagation method-induced alterations in microbial metabolic potential, genes involved in central carbon metabolism were extracted from the KEGG database. Carbon-cycling pathways analyzed in this study included glycolysis, gluconeogenesis, the tricarboxylic acid (TCA) cycle, pyruvate metabolism, and fermentation-related pathways.
The relative abundances of carbon-cycling pathways were calculated and compared between treatments. Functional differences among microbial communities were further evaluated using multivariate analyses and pathway enrichment approaches.
Associations between carbon-cycling pathways and dominant microbial taxa were evaluated using Spearman’s rank correlation analysis in the R statistical environment based on the relative abundances of carbon-cycling pathways and microbial taxa. Only statistically significant associations with an absolute correlation coefficient (|r|) > 0.7 and P < 0.05 were retained for network construction. The resulting association matrix was imported into Cytoscape (version 3.9.1, Cytoscape Consortium, USA) for network visualization and topological analysis [78]. Cytoscape was used exclusively for network visualization and did not perform correlation calculations.
4.10. Microbiota–Metabolite Correlation Analysis
To investigate the relationships between rhizosphere microbial communities and leaf metabolic profiles, correlation analyses were performed between significantly enriched microbial taxa and differentially accumulated metabolites (DAMs). Spearman’s rank correlation analysis was performed in the R statistical environment using the relative abundances of dominant microbial taxa and the normalized abundances of DAMs. Only statistically significant correlations with an absolute correlation coefficient (|r|) > 0.7 and P < 0.05 were retained for subsequent analyses. Correlation heatmaps were generated to visualize the associations between microbial taxa and metabolites.
4.11. Statistical Analysis
All data are presented as mean ± standard error (SE). Differences between SR and AR tea plants were evaluated using independent-sample Student’s t-tests. Statistical significance was considered at P < 0.05.
Principal component analysis (PCA) and orthogonal partial least squares discriminant analysis (OPLS-DA) were performed to evaluate overall metabolic variation and sample discrimination. Principal coordinate analysis (PCoA) based on Bray–Curtis dissimilarity was used to assess differences in microbial community structure and functional composition between treatments.
Differential metabolites were identified using the criteria of variable importance in projection (VIP) ≥ 1 and |log2 fold change (FC)| ≥ 1. Hierarchical clustering, volcano plot visualization, and pathway enrichment analyses were conducted using standard bioinformatic procedures.
All statistical analyses were performed using SPSS 26.0 (IBM Corp., Armonk, NY, USA), and graphical visualizations were generated using Origin 2024 (OriginLab Corporation, Northampton, MA, USA) and R software (version 4.3.1).
5. Conclusions
This study demonstrated that propagation strategy plays a critical role in regulating tea quality formation through coordinated changes in rhizosphere nutrient availability, microbial community assembly, microbial carbon-cycling functions, and leaf metabolic profiles. Compared with asexual propagation, sexual propagation promoted nutrient accumulation, enriched microbial taxa associated with organic matter turnover and nutrient cycling, enhanced carbon-cycling functions, and increased the accumulation of quality-related metabolites. Integrated analyses further revealed a propagation strategy-driven Soil–Microbiome–Metabolome coupling framework, in which shifts in rhizosphere ecological processes were closely linked to metabolic reprogramming and tea quality formation. These findings provide new insights into the ecological mechanisms underlying propagation-dependent quality variation and offer a theoretical basis for optimizing propagation practices and improving tea production through ecological regulation of plant–soil systems.
Author Contributions
Conceptualization, L.-f.W., X.-f.J. and Y.C.; methodology, L.-x.W., J.-g.Z. and C.L.; software, J.-g.Z.; validation, L.-x.W., J.-g.Z. and C.L.; formal analysis, Y.-x.Z. and L.-x.W.; investigation, Y.-x.Z., L.-x.W., J.-g.Z. and C.L.; resources, L.-f.W., X.-f.J. and Y.C.; data curation, L.-x.W. and J.-g.Z.; writing—original draft preparation, Y.-x.Z. and L.-x.W.; writing—review and editing, L.-f.W., X.-f.J., Y.C., J.-g.Z. and C.L.; visualization, Y.-x.Z. and L.-x.W.; supervision, L.-f.W. and X.-f.J.; project administration, L.-f.W. and X.-f.J.; funding acquisition, L.-f.W. and X.-f.J. All authors have read and agreed to the published version of the manuscript.
Funding
This research was supported by the National Natural Science Foundation of China (Grant No. 32460785), Jiangxi Provincial Key Laboratory of Plantation and High Valued Utilization of Specialty Fruit Tree and Tea (20241ZDD02045), the Jiangxi Provincial Key Laboratory of Plantation and High-Valued Utilization of Specialty Fruit Trees and Tea (Grant No. 20241ZDD02045), Open Research Project of Jiangxi Intelligent Agricultural Machinery Equipment Engineering Research Center(Grant No. 202301),and the Yingtan Municipal Science and Technology Plan Project (Grant No. 202558-22380) .
Conflicts of Interest
The authors declare no conflicts of interest. The funders had no role in the design of the study; in the collection, analyses, or interpretation of data; in the writing of the manuscript; or in the decision to publish the results.
Artificial Intelligence Statement
Generative artificial intelligence (AI) was used solely to assist with language editing and improving the readability of the manuscript. All scientific content, data analysis, interpretations, and conclusions were developed, verified, and approved by the authors. The authors take full responsibility for the accuracy and integrity of all statements, references, and conclusions presented in this manuscript.
References
- Wu, T.; He, J.; Deng, X.; et al. Influencing Factors and Regulatory Mechanisms of Fresh Tea Leaf Quality: A Review. Foods 2025, 14, 3268. [Google Scholar] [CrossRef] [PubMed]
- Liu, Y.; Li, S.; Xu, X.; et al. Harnessing Functional Metabolite Diversity in Tea Plant Germplasm: From Metabolic Signatures to Quality-Oriented Breeding. Beverage Plant Res. 2025, 5, e034. [Google Scholar] [CrossRef]
- Wang, C.; Yang, J.; Li, X.; et al. Tea (Camellia sinensis): A Review of Nutritional Composition, Potential Applications, and Omics Research. Appl. Sci. 2022, 12, 5874. [Google Scholar] [CrossRef]
- Zhang, Z.; Song, C.; Zhao, J.; et al. Editorial: Secondary Metabolites and Metabolism in Tea Plants. Front. Plant Sci. 2023, 14, 1143022. [Google Scholar] [CrossRef] [PubMed]
- Chen, Y.; Zhang, L.; Chen, J.; et al. Topics and Trends in Fresh Tea (Camellia sinensis) Leaf Research: A Comprehensive Bibliometric Study. Front. Plant Sci. 2023, 14, 1092511. [Google Scholar] [CrossRef] [PubMed]
- Ding, Z.; Jiang, C. Transcriptome Profiling to the Effects of Drought Stress on Different Propagation Modes of Tea Plant (Camellia sinensis). Front. Genet. 2022, 13, 907026. [Google Scholar] [CrossRef] [PubMed]
- Shrestha, S.; Miles, C. Timing and Shoot Section Influence Success of Tea-Cutting Propagation in a Temperate Climate. Horticulturae 2025, 11, 645. [Google Scholar] [CrossRef]
- Zhou, Y.; Lu, Z.; Li, D.; et al. Rooting Efficiency in Tea Plant Varieties: Physiological and Biochemical Determinants. Hortic. Sci. Technol. 2025, 43, 343–356. [Google Scholar] [CrossRef]
- Chen, Y.; Fu, W.; Xiao, H.; et al. A Review on Rhizosphere Microbiota of Tea Plant (Camellia sinensis L.): Recent Insights and Future Perspectives. J. Agric. Food Chem. 2023, 71, 19165–19188. [Google Scholar] [CrossRef] [PubMed]
- Tang, W.; Chen, Y.; Fu, W.; et al. Tea Plant Microorganisms in the Improvement of Tea Quality. Trends Microbiol. 2025, 33, 1–13. [Google Scholar] [CrossRef]
- Zhang, X.; Wang, Y.; Chen, L.; et al. Microbial Community Shifts in Tea Plant Rhizosphere under Environmental Stress. Microorganisms 2024, 12, 1401. [Google Scholar] [CrossRef] [PubMed]
- Mao, C.; He, J.; Wen, X.; et al. Correlation and Pathway Analysis of Carbon, Nitrogen and Phosphorus with Tea Quality Components. Phyton 2024, 93, 487–502. [Google Scholar] [CrossRef]
- Cai, J.; Qiu, Z.; Liao, J.; et al. Comprehensive Analysis of the Yield and Leaf Quality of Fresh Tea under Different Nitrogen Fertilization Levels. Foods 2024, 13, 2091. [Google Scholar] [CrossRef] [PubMed]
- Li, Y.; Jeyaraj, A.; Yu, H.; et al. Metabolic Regulation Profiling of Carbon and Nitrogen in Tea Plants in Response to Shading. J. Agric. Food Chem. 2020, 68, 961–974. [Google Scholar] [CrossRef] [PubMed]
- Shao, C.; Wang, X.; Chen, X.; et al. Carbon and Nitrogen Metabolism Are Jointly Regulated during the Formation of Tea Quality. Front. Plant Sci. 2022, 13, 894840. [Google Scholar] [CrossRef] [PubMed]
- Zhang, H.; Chen, Y.; Wang, J.; et al. The Reduction of Tea Quality Caused by Irrational Phosphate Fertilization Is Associated with Metabolic Reprogramming in Tea Leaves. Beverage Plant Res. 2023, 3, 10. [Google Scholar] [CrossRef]
- Zhang, X.; Wang, M.; Chen, L.; et al. Enhancing Soil Health and Tea Plant Quality through Integrated Organic and Chemical Fertilization Strategies. Horticulturae 2024, 10, 1311. [Google Scholar] [CrossRef]
- Edwards, J.; Johnson, C.; Santos-Medellín, C.; et al. Structure, Variation, and Assembly of the Root-Associated Microbiomes of Rice. Proc. Natl. Acad. Sci. U.S.A. 2015, 112, E911–E920. [Google Scholar] [CrossRef] [PubMed]
- Singh, B.K.; Delgado-Baquerizo, M.; Egidi, E.; et al. Microbiome-Facilitated Plant Nutrient Acquisition. Cell Host Microbe 2025, 33, 1–15. [Google Scholar] [CrossRef]
- Trivedi, P.; Delgado-Baquerizo, M.; Jeffries, T.C.; et al. Soil Microbiome Interactions with Plants and Their Implications for Sustainable Agriculture. Nat. Rev. Microbiol. 2020, 18, 607–621. [Google Scholar] [CrossRef] [PubMed]
- Morrissey, E.M.; Mau, R.L.; Schwartz, E.; et al. Bacterial Carbon Use Plasticity, Phylogenetic Diversity and the Priming of Soil Organic Matter. ISME J. 2021, 15, 1590–1603. [Google Scholar]
- Malik, A.A.; Martiny, J.B.H.; Brodie, E.L.; et al. Defining Trait-Based Microbial Strategies with Consequences for Soil Carbon Cycling under Climate Change. ISME J. 2020, 14, 1–9. [Google Scholar] [PubMed]
- Nuccio, E.E.; Starr, E.; Karaoz, U.; et al. Niche Differentiation Is Spatially and Temporally Regulated in the Rhizosphere. ISME J. 2020, 14, 999–1014. [Google Scholar] [CrossRef] [PubMed]
- Berg, G.; Grube, M.; Schloter, M.; et al. The Plant Microbiome and Its Importance for Plant and Human Health. Front. Microbiol. 2014, 5, 491. [Google Scholar] [CrossRef] [PubMed]
- Kuzyakov, Y.; Blagodatskaya, E. Microbial Hotspots and Hot Moments in Soil: Concept and Review. Soil Biol. Biochem. 2015, 83, 184–199. [Google Scholar] [CrossRef]
- Chen, W.; Gong, L.; Guo, Z.; et al. A Novel Integrated Method for Large-Scale Detection, Identification, and Quantification of Widely Targeted Metabolites. Mol. Plant 2013, 6, 1769–1780. [Google Scholar] [CrossRef] [PubMed]
- Xu, J.; Zhang, Y.; Zhang, P.; et al. The Structure and Function of the Global Citrus Rhizosphere Microbiome. Nat. Commun. 2018, 9, 4894. [Google Scholar] [CrossRef] [PubMed]
- Toju, H.; Peay, K.G.; Yamamichi, M.; et al. Core Microbiomes for Sustainable Agroecosystems. Nat. Plants 2018, 4, 247–257. [Google Scholar] [CrossRef] [PubMed]
- Oyserman, B.O.; Medema, M.H.; Raaijmakers, J.M. Road MAPs to Engineer Host Microbiomes. Curr. Opin. Microbiol. 2018, 43, 46–54. [Google Scholar] [CrossRef] [PubMed]
- Saleem, M.; Hu, J.; Jousset, A. More than the Sum of Its Parts: Microbiome Biodiversity as a Driver of Plant Growth and Soil Health. Annu. Rev. Ecol. Evol. Syst. 2019, 50, 145–168. [Google Scholar] [CrossRef]
- Song, X.; Chen, X.; Liu, M.; et al. Soil Nutrient Availability Regulates Tea Quality Formation through Rhizosphere Interactions. Plant Soil 2023, 486, 321–337. [Google Scholar]
- Ruan, J.; Gerendás, J.; Härdter, R.; et al. Effect of Nitrogen Form and Root-Zone pH on Growth and Nitrogen Uptake of Tea. Ann. Bot. 2007, 99, 301–310. [Google Scholar] [CrossRef] [PubMed]
- Mondal, T.K.; Bhattacharya, A.; Laxmikumaran, M.; et al. Recent Advances of Tea (Camellia sinensis) Biotechnology. Plant Cell Tissue Organ Cult. 2004, 76, 195–254. [Google Scholar] [CrossRef]
- Busby, P.E.; Soman, C.; Wagner, M.R.; et al. Research Priorities for Harnessing Plant Microbiomes in Sustainable Agriculture. PLoS Biol. 2017, 15, e2001793. [Google Scholar] [CrossRef] [PubMed]
- Ruan, J.; Haerdter, R.; Gerendás, J. Impact of Nitrogen Supply on Carbon/Nitrogen Metabolism and Tea Quality. Plant Soil 2010, 327, 321–334. [Google Scholar]
- Chen, Y.; Li, Y.; Yang, X.; et al. Effects of Long-Term Nitrogen Fertilization on the Formation of Metabolites Related to Tea Quality in Subtropical China. Metabolites 2021, 11, 146. [Google Scholar] [CrossRef] [PubMed]
- Mao, C.; He, J.; Wen, X.; et al. Correlation and Pathway Analysis of Carbon, Nitrogen and Phosphorus with Tea Quality Components. Phyton 2024, 93, 487–502. [Google Scholar] [CrossRef]
- Zhao, Y.; Chen, P.; Lin, L.; et al. Tea Polyphenols and Their Biological Activities. Food Chem. 2022, 373, 131546. [Google Scholar]
- Cabrera, C.; Artacho, R.; Giménez, R. Beneficial Effects of Green Tea—A Review. J. Am. Coll. Nutr. 2006, 25, 79–99. [Google Scholar] [CrossRef] [PubMed]
- Mittler, R. ROS Are Good. Trends Plant Sci. 2017, 22, 11–19. [Google Scholar] [CrossRef] [PubMed]
- Gill, S.S.; Tuteja, N. Reactive Oxygen Species and Antioxidant Machinery in Abiotic Stress Tolerance in Crop Plants. Plant Physiol. Biochem. 2010, 48, 909–930. [Google Scholar] [CrossRef] [PubMed]
- Hasanuzzaman, M.; Bhuyan, M.H.M.B.; Zulfiqar, F.; et al. Reactive Oxygen Species and Antioxidant Defense in Plants under Abiotic Stress: Revisiting the Crucial Role of a Universal Defense Regulator. Antioxidants 2020, 9, 681. [Google Scholar] [CrossRef] [PubMed]
- Trivedi, P.; Leach, J.E.; Tringe, S.G.; et al. Enabling Sustainable Agriculture through Understanding and Enhancement of Plant Microbiomes. New Phytol. 2021, 230, 2129–2147. [Google Scholar] [CrossRef] [PubMed]
- Liu, H.; Brettell, L.E. Plant Defense by VOC-Induced Microbial Priming. Trends Plant Sci. 2019, 24, 187–189. [Google Scholar] [CrossRef] [PubMed]
- Walters, W.A.; Jin, Z.; Youngblut, N.; et al. Large-Scale Replicated Field Study of Maize Rhizosphere Identifies Heritable Microbes. Proc. Natl. Acad. Sci. U.S.A. 2018, 115, 7368–7373. [Google Scholar] [CrossRef] [PubMed]
- Fitzpatrick, C.R.; Copeland, J.; Wang, P.W.; et al. Assembly and Ecological Function of the Root Microbiome across Angiosperm Plant Species. Proc. Natl. Acad. Sci. U.S.A. 2018, 115, E1157–E1165. [Google Scholar] [CrossRef] [PubMed]
- Lewin, G.R.; Carlos, C.; Chevrette, M.G.; et al. Evolution and Ecology of Actinobacteria and Their Bioenergy Applications. Annu. Rev. Microbiol. 2016, 70, 235–254. [Google Scholar] [CrossRef] [PubMed]
- Barka, E.A.; Vatsa, P.; Sanchez, L.; et al. Taxonomy, Physiology and Natural Products of Actinobacteria. Microbiol. Mol. Biol. Rev. 2016, 80, 1–43. [Google Scholar] [CrossRef] [PubMed]
- Fierer, N.; Bradford, M.A.; Jackson, R.B. Toward an Ecological Classification of Soil Bacteria. Ecology 2007, 88, 1354–1364. [Google Scholar] [CrossRef] [PubMed]
- Kielak, A.M.; Barreto, C.C.; Kowalchuk, G.A.; et al. The Ecology of Acidobacteria: Moving beyond Genes and Genomes. Front. Microbiol. 2016, 7, 744. [Google Scholar] [CrossRef] [PubMed]
- Hug, L.A.; Castelle, C.J.; Wrighton, K.C.; et al. A New View of the Tree of Life. Nat. Microbiol. 2016, 1, 16048. [Google Scholar] [CrossRef] [PubMed]
- Xiong, C.; Zhu, Y.G.; Wang, J.T.; et al. Host Selection Shapes Crop Microbiome Assembly and Network Complexity. New Phytol. 2021, 229, 1091–1104. [Google Scholar] [PubMed]
- Allison, S.D. A Trait-Based Approach for Modelling Microbial Litter Decomposition. Ecol. Lett. 2012, 15, 1058–1070. [Google Scholar] [CrossRef] [PubMed]
- Schimel, J.P.; Schaeffer, S.M. Microbial Control over Carbon Cycling in Soil. Front. Microbiol. 2012, 3, 348. [Google Scholar] [CrossRef] [PubMed]
- Cotrufo, M.F.; Wallenstein, M.D.; Boot, C.M.; et al. The Microbial Efficiency-Matrix Stabilization Framework. Nat. Geosci. 2013, 6, 790–792. [Google Scholar]
- De Vries, F.T.; Griffiths, R.I.; Bailey, M.; et al. Soil Bacterial Networks Are Less Stable under Drought. Nat. Commun. 2018, 9, 3033. [Google Scholar] [CrossRef] [PubMed]
- Bhattacharyya, P.N.; Jha, D.K. Plant Growth-Promoting Rhizobacteria (PGPR): Emergence in Agriculture. World J. Microbiol. Biotechnol. 2012, 28, 1327–1350. [Google Scholar] [PubMed]
- Ho, A.; Di Lonardo, D.P.; Bodelier, P.L.E. Revisiting Life Strategy Concepts in Environmental Microbial Ecology. FEMS Microbiol. Ecol. 2017, 93, fix006. [Google Scholar] [CrossRef]
- Trivedi, P.; Delgado-Baquerizo, M.; Anderson, I.C.; et al. Response of Soil Properties and Microbial Communities to Agriculture: Implications for Plant Metabolism. Nat. Rev. Earth Environ. 2022, 3, 307–320. [Google Scholar]
- Philippot, L.; Raaijmakers, J.M.; Lemanceau, P.; et al. Going Back to the Roots: The Microbial Ecology of the Rhizosphere. Nat. Rev. Microbiol. 2013, 11, 789–799. [Google Scholar] [CrossRef] [PubMed]
- Zhalnina, K.; Louie, K.B.; Hao, Z.; et al. Dynamic Root Exudate Chemistry and Microbial Substrate Preferences Drive Patterns in Rhizosphere Microbial Community Assembly. Nat. Microbiol. 2018, 3, 470–480. [Google Scholar] [CrossRef] [PubMed]
- Han, W.Y.; Kemmitt, S.J.; Brookes, P.C. Soil Microbial Biomass and Activity in Tea Gardens. Biol. Fertil. Soils 2007, 44, 473–484. [Google Scholar] [CrossRef]
- Bulgarelli, D.; Schlaeppi, K.; Spaepen, S.; et al. Structure and Functions of the Bacterial Microbiota of Plants. Annu. Rev. Plant Biol. 2013, 64, 807–838. [Google Scholar] [CrossRef] [PubMed]
- Berg, G.; Rybakova, D.; Fischer, D.; et al. Microbiome Definition Re-Visited: Old Concepts and New Challenges. Microbiome 2020, 8, 103. [Google Scholar] [CrossRef] [PubMed]
- Compant, S.; Samad, A.; Faist, H.; et al. A Review on the Plant Microbiome: Ecology, Functions, and Emerging Trends in Microbial Application. J. Adv. Res. 2019, 19, 29–37. [Google Scholar] [CrossRef] [PubMed]
- Vorholt, J.A.; Vogel, C.; Carlström, C.I.; et al. Establishing Causality: Opportunities of Synthetic Communities for Plant Microbiome Research. Cell Host Microbe 2017, 22, 142–155. [Google Scholar] [CrossRef] [PubMed]
- Zhang, N.; Wang, D.; Liu, Y.; et al. Effects of Different Plant Root Exudates and Their Organic Acid Components on Chemotaxis, Biofilm Formation and Colonization by Beneficial Rhizosphere Microorganisms. Plant Soil 2014, 374, 689–700. [Google Scholar]
- Hanif, M.S.; Zhang, F.; Li, P.; et al. Plant Microbiome Technology for Sustainable Agriculture: Current Status and Future Perspectives. Front. Microbiol. 2024, 15, 1500260. [Google Scholar] [CrossRef] [PubMed]
- Lu, R.K. Analytical Methods for Soil and Agro-Chemistry; China Agricultural Science and Technology Press: Beijing, China, 2000. [Google Scholar]
- Wang, Y.; Shi, M.; Zhang, R.; Zhang, W.; Liu, Y.; Sun, D.; Wang, X.; Qin, S.; Kang, Y. Legume-potato rotation affects soil physicochemical properties, enzyme activity, and rhizosphere metabolism in continuous potato cropping. Chem. Biol. Technol. Agric. 2023, 10, 132. [Google Scholar] [CrossRef]
- He, H.; Wang, C.; Chen, Y.; et al. The quality difference in five oolong tea accessions under naturally growing and cultivated patterns. Front. Agron. 2024, 6, 1304559. [Google Scholar]
- Mao, Y.; Wang, X.; Huang, M.; et al. Prediction of tea polyphenols, free amino acids and caffeine in tea using hyperspectral imaging. Foods 2022, 11, 2537. [Google Scholar] [CrossRef] [PubMed]
- Ma, C.; Ma, B.; Wang, J.; Wang, Z.; Zhou, B.; Chen, X. Grade identification of ripened Pu-erh teas, and their differences of phenolic components, in vitro antioxidant capacity and hypoglycemic effect. Food Chem. X 2025, 27, 102421. [Google Scholar] [CrossRef] [PubMed]
- Tang, Y.; Wang, F.; Zhao, X.; Yang, G.; Xu, B.; Zhang, Y.; Liu, Y.; Kang, Y.; Li, L. A nondestructive method for determination of green tea quality by hyperspectral imaging. J. Food Compos. Anal. 2023, 123, 105621. [Google Scholar] [CrossRef]
- Kalisz, O.; Jaworska, A.; Studzińska, S.; Bocian, S. Elimination of toxic solvents from analytical methods in food analysis: Caffeine determination in tea as an example. Foods 2024, 13, 1189. [Google Scholar] [CrossRef] [PubMed]
- Buchfink, B.; Reuter, K.; Drost, H.G. Sensitive protein alignments at tree-of-life scale using DIAMOND. Nat. Methods 2021, 18, 366–368. [Google Scholar] [CrossRef] [PubMed]
- Segata, N.; Izard, J.; Waldron, L.; Gevers, D.; Miropolsky, L.; Garrett, W.S.; Huttenhower, C. Metagenomic biomarker discovery and explanation. Genome Biol. 2011, 12, R60. [Google Scholar] [CrossRef] [PubMed]
- Shannon, P.; Markiel, A.; Ozier, O.; Baliga, N.S.; Wang, J.T.; Ramage, D.; Amin, N.; Schwikowski, B.; Ideker, T. Cytoscape: A software environment for integrated models of biomolecular interaction networks. Genome Res. 2003, 13, 2498–2504. [Google Scholar] [CrossRef] [PubMed]
Figure 1.
Variations in soil physicochemical properties between SR and AR tea plantations. Note: SR and AR represent sexually and asexually propagated tea plants, respectively. Data are expressed as mean ± standard error (SE) (n = 3). Different lowercase letters indicate significant differences between treatments at P < 0.05.
Figure 1.
Variations in soil physicochemical properties between SR and AR tea plantations. Note: SR and AR represent sexually and asexually propagated tea plants, respectively. Data are expressed as mean ± standard error (SE) (n = 3). Different lowercase letters indicate significant differences between treatments at P < 0.05.
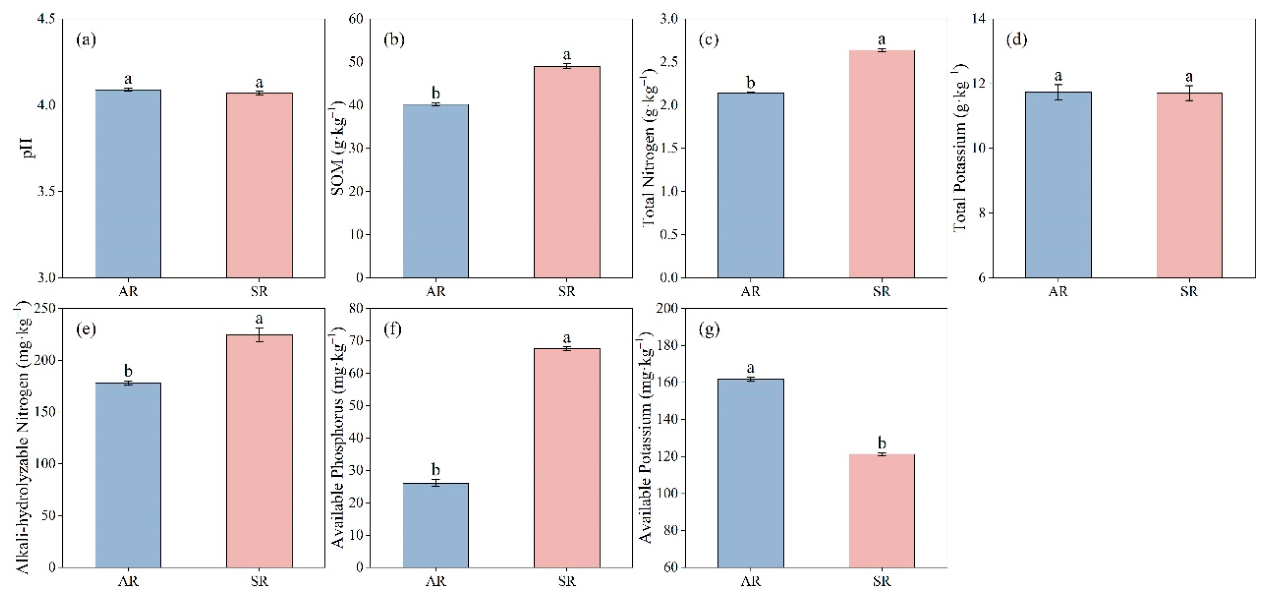
Figure 2.
Variations in quality-related traits of fresh tea leaves between SR and AR tea plants. Note: SR and AR represent sexually and asexually propagated tea plants, respectively. Data are expressed as mean ± standard error (SE) (n = 3). Different lowercase letters indicate significant differences between treatments at P < 0.05.
Figure 2.
Variations in quality-related traits of fresh tea leaves between SR and AR tea plants. Note: SR and AR represent sexually and asexually propagated tea plants, respectively. Data are expressed as mean ± standard error (SE) (n = 3). Different lowercase letters indicate significant differences between treatments at P < 0.05.
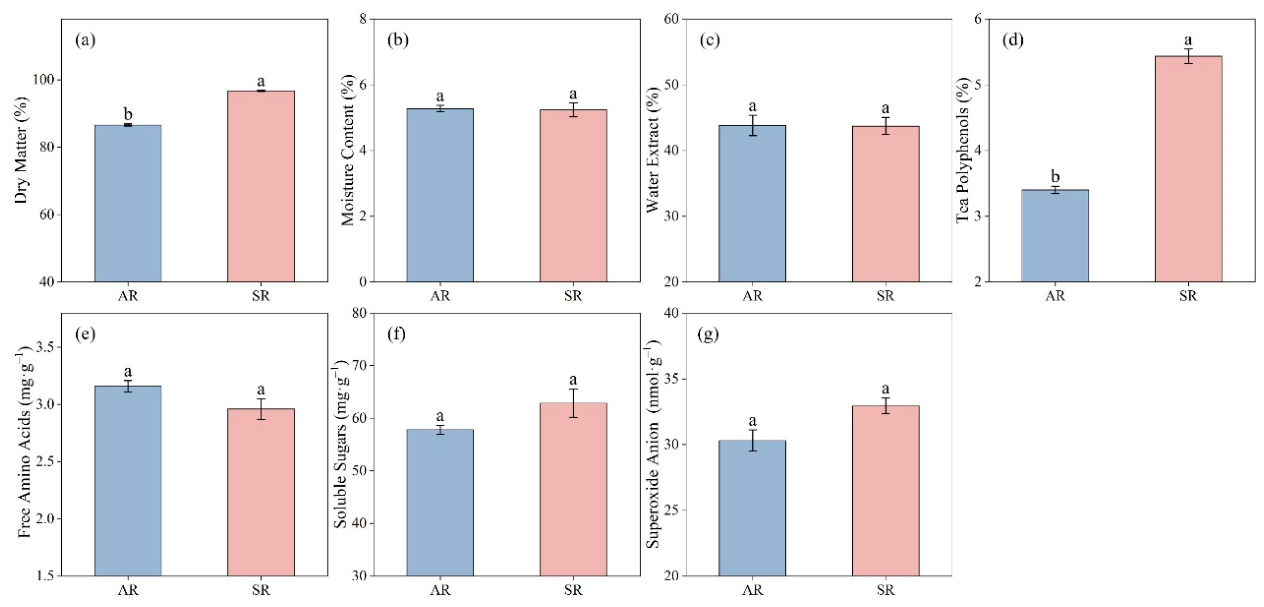
Figure 3.
Quality-related traits of fresh tea leaves under different propagation methods. Note: SR and AR represent sexually and asexually propagated tea plants, respectively. Data are expressed as mean ± standard error (SE) (n = 3). Different lowercase letters indicate significant differences between treatments at P < 0.05.
Figure 3.
Quality-related traits of fresh tea leaves under different propagation methods. Note: SR and AR represent sexually and asexually propagated tea plants, respectively. Data are expressed as mean ± standard error (SE) (n = 3). Different lowercase letters indicate significant differences between treatments at P < 0.05.
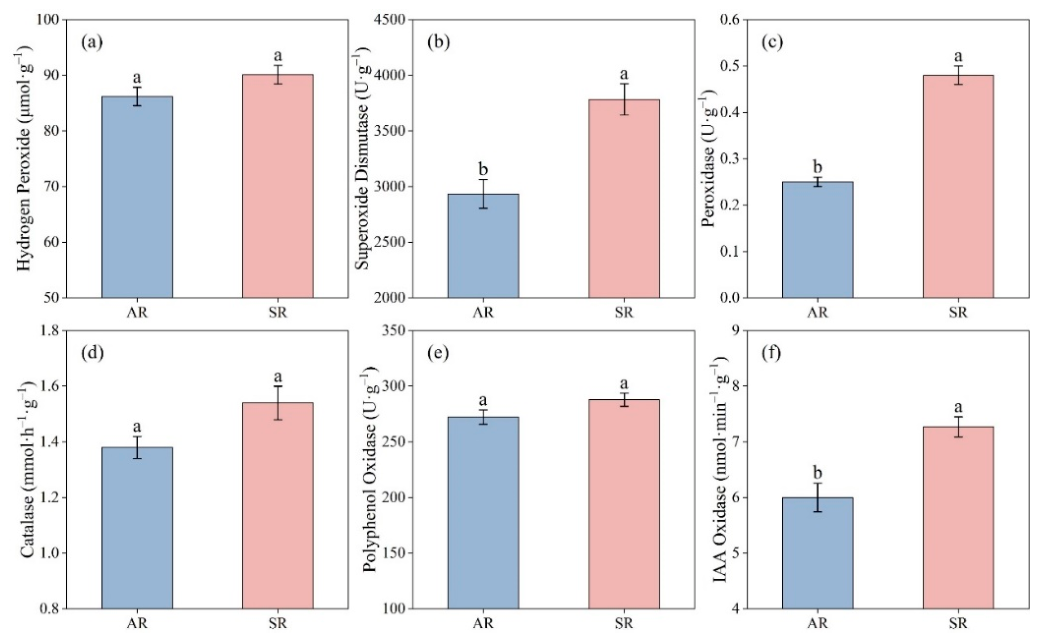
Figure 4.
Metabolic profiling and pathway enrichment analysis of differential metabolites between AR and SR treatments. PCA (a), OPLS-DA (b), volcano plot of differential metabolites (c), and KEGG pathway enrichment analysis (d). Note: Each point in PCA and OPLS-DA plots represents an independent biological replicate. Red and green dots in the volcano plot indicate significantly upregulated and downregulated metabolites, respectively, while gray dots represent non-significant metabolites. In the KEGG enrichment plot, bubble size indicates the number of enriched metabolites and color represents the significance level of enrichment.
Figure 4.
Metabolic profiling and pathway enrichment analysis of differential metabolites between AR and SR treatments. PCA (a), OPLS-DA (b), volcano plot of differential metabolites (c), and KEGG pathway enrichment analysis (d). Note: Each point in PCA and OPLS-DA plots represents an independent biological replicate. Red and green dots in the volcano plot indicate significantly upregulated and downregulated metabolites, respectively, while gray dots represent non-significant metabolites. In the KEGG enrichment plot, bubble size indicates the number of enriched metabolites and color represents the significance level of enrichment.
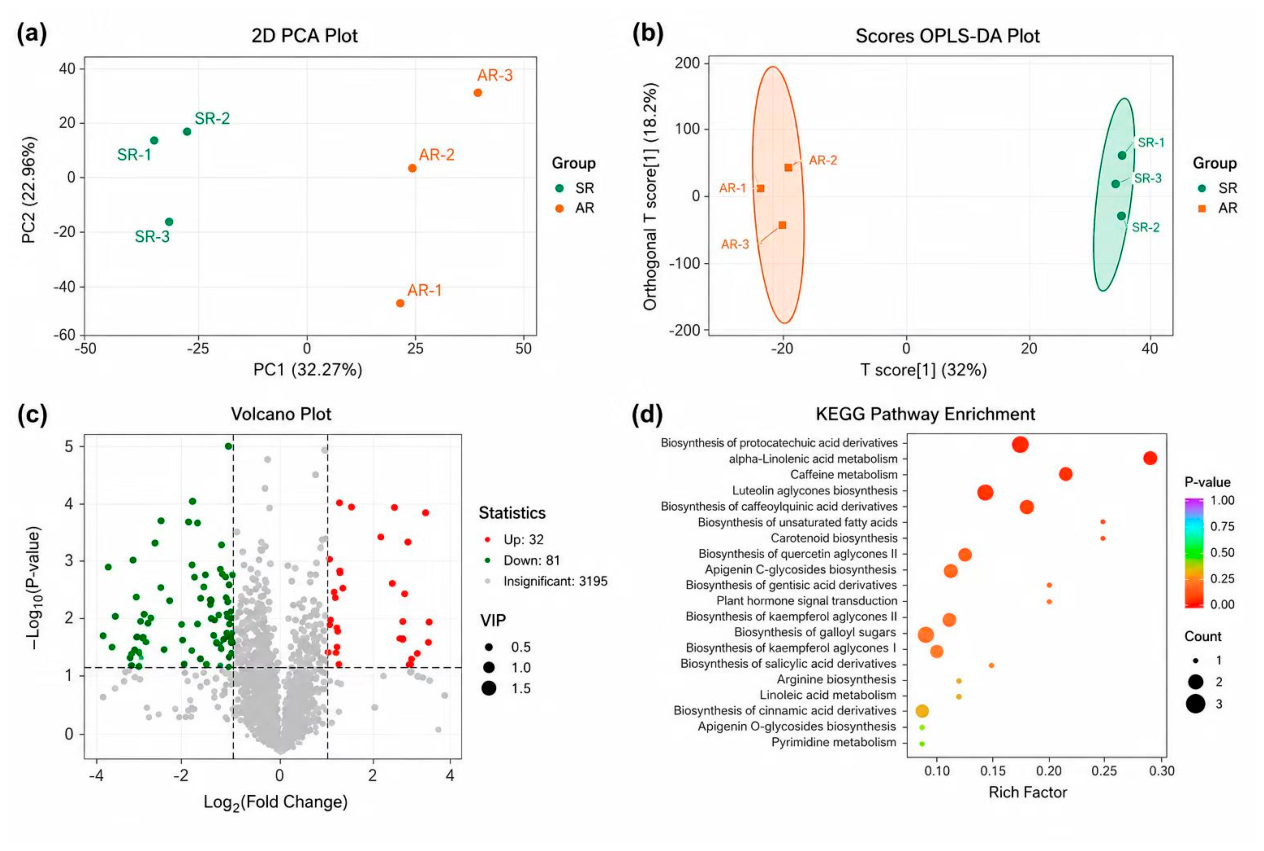
Figure 5.
Heatmap of differential metabolite accumulation patterns between SR and AR. Note: Rows represent differential metabolites and columns represent biological replicates. Colors indicate normalized metabolite abundance based on Z-score transformation, with red and green representing relatively high and low accumulation levels, respectively. Metabolites are classified into flavonoids, terpenoids, phenolic acids, lipids, alkaloids, amino acids and derivatives, lignans and coumarins, nucleotides and derivatives, organic acids, and tannins.
Figure 5.
Heatmap of differential metabolite accumulation patterns between SR and AR. Note: Rows represent differential metabolites and columns represent biological replicates. Colors indicate normalized metabolite abundance based on Z-score transformation, with red and green representing relatively high and low accumulation levels, respectively. Metabolites are classified into flavonoids, terpenoids, phenolic acids, lipids, alkaloids, amino acids and derivatives, lignans and coumarins, nucleotides and derivatives, organic acids, and tannins.
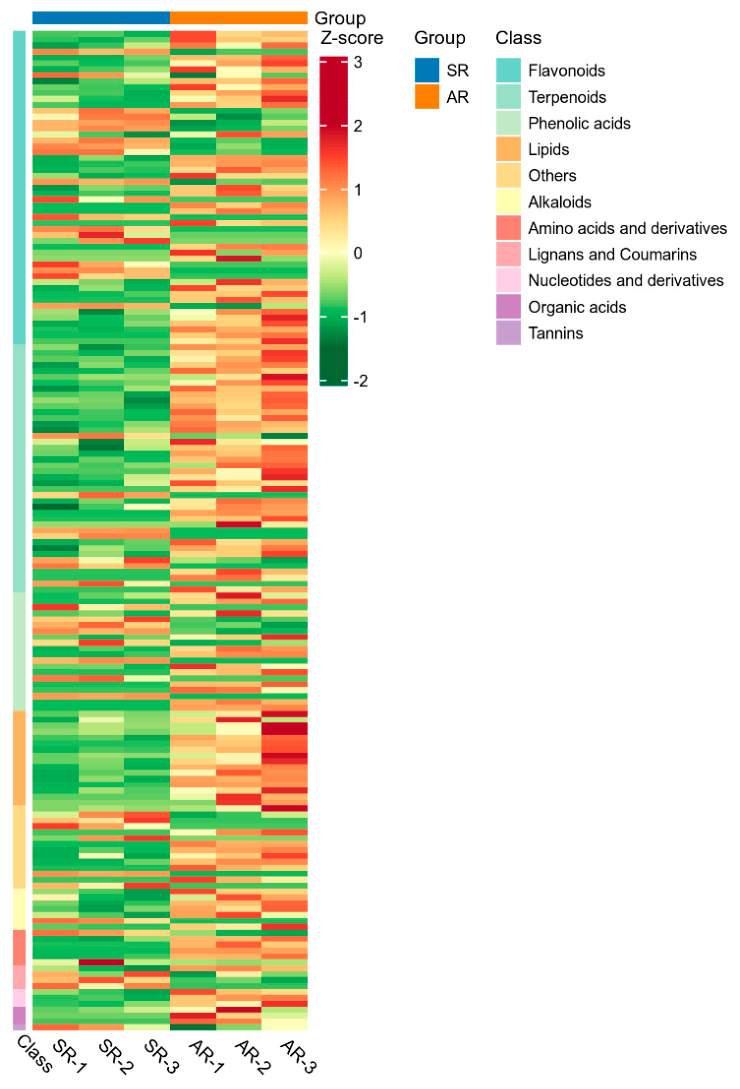
Figure 6.
Principal coordinate analysis (PCoA) of rhizosphere microbial communities under different propagation methods. Note: SR and AR represent sexually propagated and asexually propagated tea plants, respectively. Each point represents an independent biological replicate (n = 3). PCoA was conducted based on Bray–Curtis distance matrices to evaluate differences in rhizosphere microbial community composition between propagation methods.
Figure 6.
Principal coordinate analysis (PCoA) of rhizosphere microbial communities under different propagation methods. Note: SR and AR represent sexually propagated and asexually propagated tea plants, respectively. Each point represents an independent biological replicate (n = 3). PCoA was conducted based on Bray–Curtis distance matrices to evaluate differences in rhizosphere microbial community composition between propagation methods.
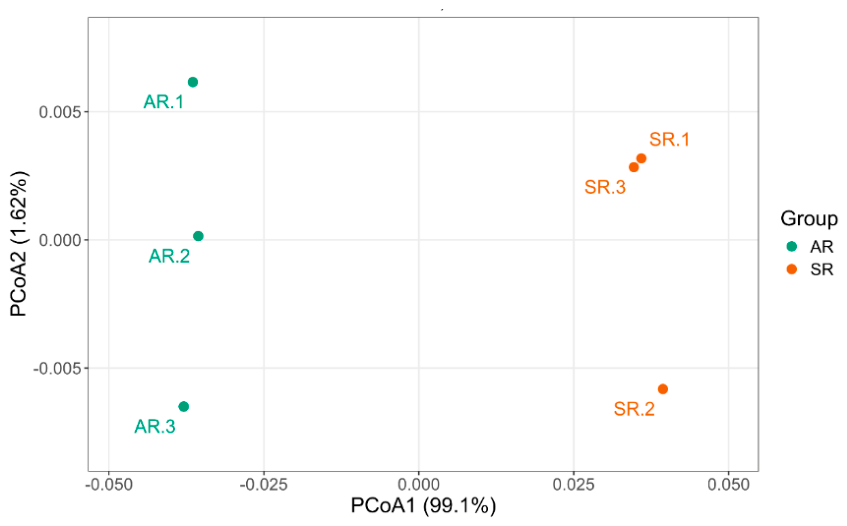
Figure 7.
LEfSe analysis identifying differentially abundant microbial taxa between SR and AR. Note: Green and red bars indicate taxa significantly enriched in SR and AR, respectively. The length of each bar represents the logarithmic LDA score, reflecting the contribution of each taxon to group differentiation.
Figure 7.
LEfSe analysis identifying differentially abundant microbial taxa between SR and AR. Note: Green and red bars indicate taxa significantly enriched in SR and AR, respectively. The length of each bar represents the logarithmic LDA score, reflecting the contribution of each taxon to group differentiation.
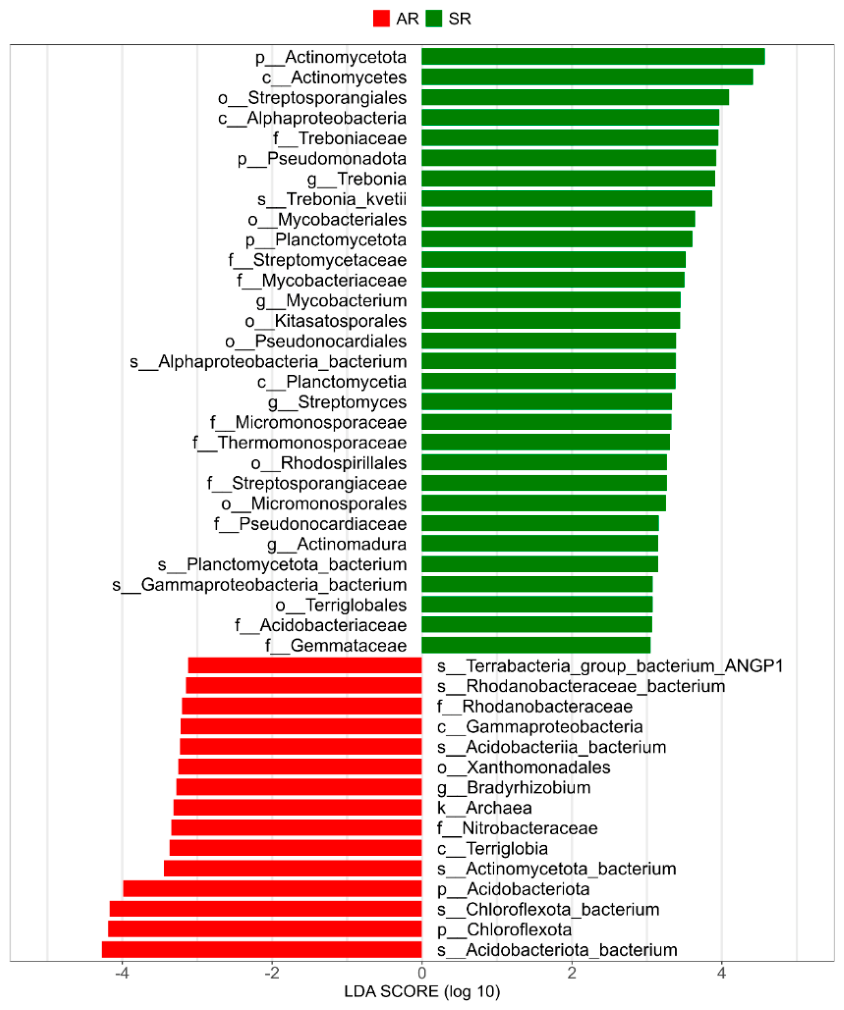
Figure 8.
Principal coordinate analysis (PCoA) of microbial functional profiles between SR and AR. Note: Each point represents an independent biological replicate. PCoA was performed based on Bray–Curtis distances calculated from microbial functional profiles. PCoA1 and PCoA2 explained 74.5% and 25.46% of the total variation, respectively.
Figure 8.
Principal coordinate analysis (PCoA) of microbial functional profiles between SR and AR. Note: Each point represents an independent biological replicate. PCoA was performed based on Bray–Curtis distances calculated from microbial functional profiles. PCoA1 and PCoA2 explained 74.5% and 25.46% of the total variation, respectively.
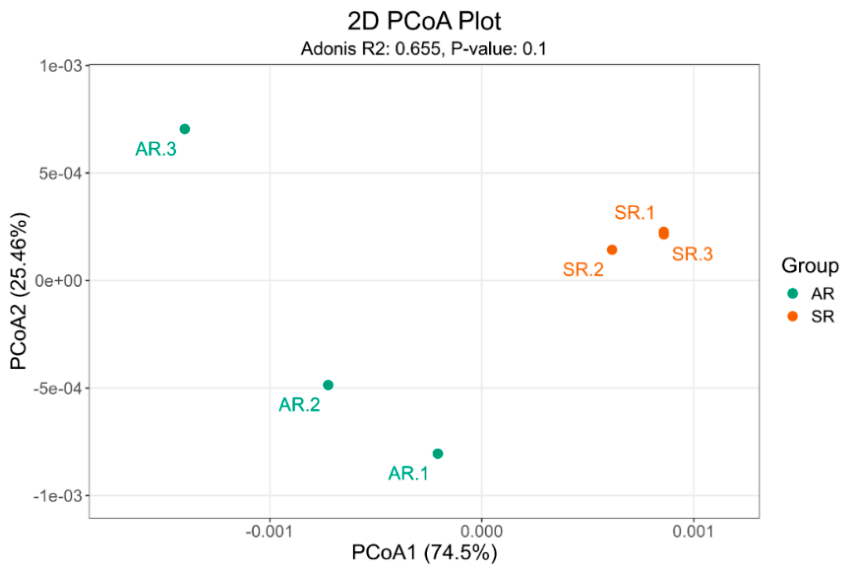
Figure 9.
Relative abundance of carbon cycling pathways in SR and AR. Note: Stacked bar plots show the relative abundance of major carbon cycling pathways identified from microbial functional annotation. Different colors represent distinct carbon metabolic pathways, including anaplerotic reactions, gluconeogenesis, glycolysis, TCA cycle, fermentation pathways, and other carbon transformation processes.
Figure 9.
Relative abundance of carbon cycling pathways in SR and AR. Note: Stacked bar plots show the relative abundance of major carbon cycling pathways identified from microbial functional annotation. Different colors represent distinct carbon metabolic pathways, including anaplerotic reactions, gluconeogenesis, glycolysis, TCA cycle, fermentation pathways, and other carbon transformation processes.
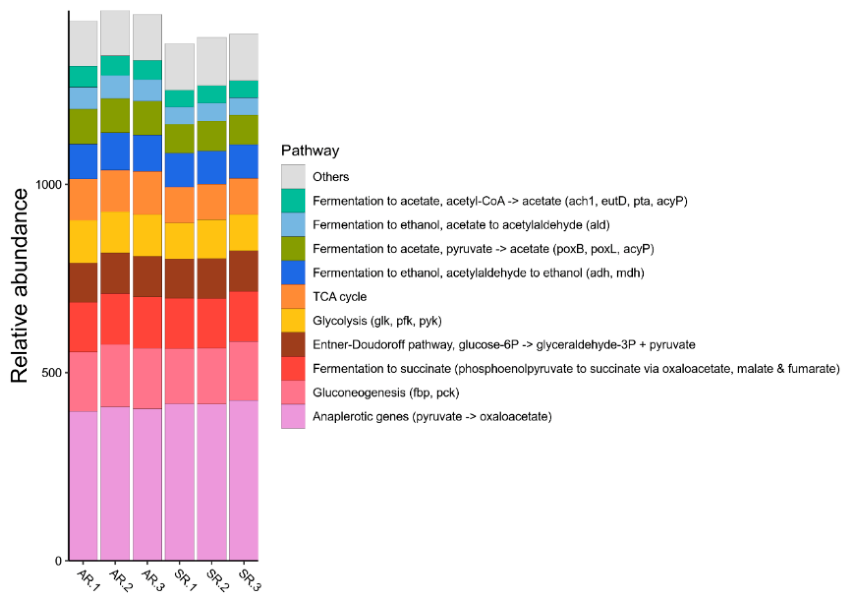
Figure 10.
Hierarchical clustering heatmap of correlations between microbial phyla and differential metabolites. Note: Rows represent microbial phyla and columns represent differential metabolites. Dendrograms indicate clustering results of microbial taxa and metabolites. Red and blue colors denote positive and negative correlations, respectively. * P < 0.05; ** P < 0.01.
Figure 10.
Hierarchical clustering heatmap of correlations between microbial phyla and differential metabolites. Note: Rows represent microbial phyla and columns represent differential metabolites. Dendrograms indicate clustering results of microbial taxa and metabolites. Red and blue colors denote positive and negative correlations, respectively. * P < 0.05; ** P < 0.01.
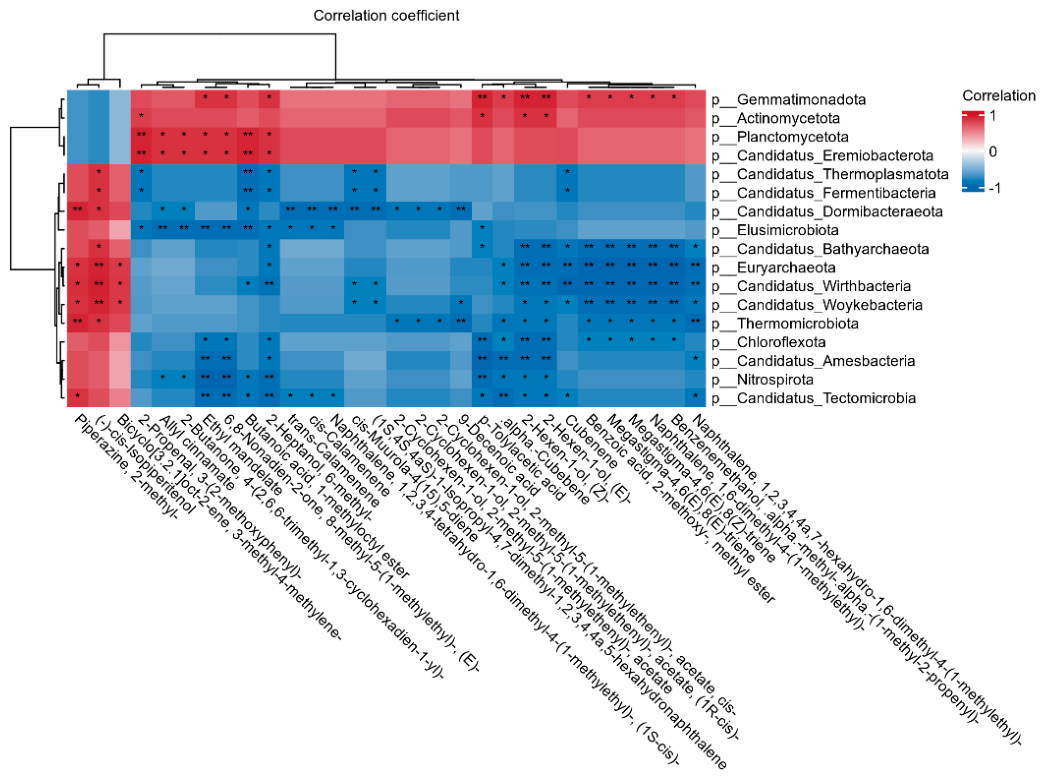
Figure 11.
Co-occurrence network between carbon cycling pathways and microbial taxa. Note: Co-occurrence network illustrating the associations between dominant carbon-cycling pathways and microbial taxa in rhizosphere soils. Yellow nodes represent carbon-cycling pathways, whereas colored nodes represent microbial taxa. Node size is proportional to connectivity degree, and edges indicate significant associations between pathways and taxa. Edges represent significant Spearman’s rank correlations (|r| > 0.7, P < 0.05). Cytoscape (version 3.9.1) was used exclusively for network visualization.
Figure 11.
Co-occurrence network between carbon cycling pathways and microbial taxa. Note: Co-occurrence network illustrating the associations between dominant carbon-cycling pathways and microbial taxa in rhizosphere soils. Yellow nodes represent carbon-cycling pathways, whereas colored nodes represent microbial taxa. Node size is proportional to connectivity degree, and edges indicate significant associations between pathways and taxa. Edges represent significant Spearman’s rank correlations (|r| > 0.7, P < 0.05). Cytoscape (version 3.9.1) was used exclusively for network visualization.
Disclaimer/Publisher’s Note: The statements, opinions and data contained in all publications are solely those of the individual author(s) and contributor(s) and not of MDPI and/or the editor(s). MDPI and/or the editor(s) disclaim responsibility for any injury to people or property resulting from any ideas, methods, instructions or products referred to in the content. |
© 2026 by the authors. Licensee MDPI, Basel, Switzerland. This article is an open access article distributed under the terms and conditions of the Creative Commons Attribution (CC BY) license (http://creativecommons.org/licenses/by/4.0/).
Copyright: This open access article is published under a Creative Commons CC BY 4.0 license, which permit the free download, distribution, and reuse, provided that the author and preprint are cited in any reuse.


