

Submitted:
06 July 2026
Posted:
09 July 2026
You are already at the latest version
Abstract
Background: East African runners, particularly from Kenya, have long dominated long-distance running. This study compared structural and modifiable body composition traits between professional Kenyan and European long-distance runners, and explored associations between local muscularity and skeletal robustness. Methods: A total of 52 male marathon runners (32 Kenyan and 20 European) were assessed according to the International Society for the Advancement of Kinanthropometry (ISAK) protocol. Participants were 27.2±5.2 years with a BMI of 18.4±1.1 kg·m⁻² and a marathon time of 02:09:26 in the Kenyan group, and 30.9±4.9 years, BMI 21.1±2.1 kg·m⁻², and marathon time of 02:18:31 in the European group. Corrected girths were calculated to explore associations between skeletal breadths and muscularity. Results: European runners exhibited significantly greater body mass, sitting height, girths, skeletal breadths, and muscle mass compared to Kenyan runners (p<0.05), with large to very large effect sizes. In contrast, Kenyan runners showed lower adiposity and more linear body proportions, including a lower Cormic index and higher intermembral index. Differences in segment lengths were generally limited. Principal component analysis showed clearer group separation for modifiable than structural traits. Significant positive associations were observed between humeral breadth and corrected arm girth (r=0.41, p=0.002), femur breadth and corrected thigh girth (r=0.66, p<0.001), and bimalleolar breadth and corrected calf girth (r=0.72, p<0.001). Conclusions: These findings indicate that Kenyan long-distance runners are characterized by a lighter and more linear morphology, whereas European runners display greater structural robustness and musculoskeletal development. Differences in muscularity may also be associated with skeletal robustness.
Keywords:
anthropometry
; body composition
; body proportions
; fat mass
; ISAK
; skinfolds
1. Introduction
East African runners, particularly from Kenya, have dominated middle- and long-distance running for decades [1]. This phenomenon has been partly attributed to superior running economy [2,3,4], which is considered one of the primary physiological determinants of endurance performance beyond maximal oxygen uptake alone [5,6]. Previous studies have also demonstrated that slimmer lower legs and lower lower-limb cross-sectional areas are associated with reduced oxygen cost during running, likely because of lower distal mass and reduced energetic demands during locomotion [7,8]. These characteristics may improve running economy by decreasing lower-limb moment of inertia and enhancing mechanical efficiency during running.
However, the interpretation of lower local muscularity in Kenyan runners remains incomplete. Muscle-related traits are often considered predominantly modifiable characteristics influenced by training and nutritional status. Nevertheless, recent magnetic resonance imaging-based evidence has demonstrated that skeletal dimensions are among the strongest predictors of muscularity, suggesting a close coupling between bone size and muscle volume [9]. These findings raise the possibility that the lower muscularity observed in Kenyan runners may not solely reflect training-related or modifiable factors, but could also be partially associated with lower skeletal robustness and a more gracile musculoskeletal structure [6].
In this context, anthropometric approaches based on skeletal breadths and adiposity-corrected girths may provide useful field-based proxies to investigate the relationship between structural robustness and local muscularity [10]. This may be particularly relevant in endurance athletes, who are generally not exposed to hypertrophy-oriented training stimuli [7]. Furthermore, distinguishing between structural and modifiable traits may improve the understanding of the morphological phenotype associated with elite endurance running [5].
Therefore, the aim of the present study was to compare structural and modifiable anthropometric traits between Kenyan and European long-distance runners and to investigate whether local muscularity was associated with skeletal robustness through the analysis of skeletal breadths and corrected girths. We hypothesized that Kenyan runners would exhibit a more linear and less robust musculoskeletal phenotype characterized by smaller skeletal breadths, lower corrected girths, and reduced body mass components compared with European runners. In addition, we hypothesized that skeletal breadths would be positively associated with adiposity-corrected girths, particularly in the lower limbs, suggesting that local muscularity may be partly constrained by underlying skeletal robustness.
2. Materials and Methods
Before participation, all subjects were informed about the study procedures and provided written informed consent. The study protocol was approved by the Ethics Committee of the University of Padua on 31/07/2023 (approval code: HECDSB.022023) and conducted in accordance with the Declaration of Helsinki.
2.1. Participants
Participants were 27.2 ± 5.2 years with a BMI of 18.4 ± 1.1 kg·m⁻² and a marathon time of 02:09:26 in the Kenyan group, and 30.9 ± 4.9 years, BMI 21.1 ± 2.1 kg·m⁻², and marathon time of 02:18:31 in the European group. All measurements were performed approximately 10–12 weeks before competition under standardized conditions.
2.2. Procedures
This cross-sectional study aimed to compare body composition between professional Kenyan and European long-distance runners. A total of 52 male marathon runners (32 Kenyan and 20 European) were assessed according to the International Society for the Advancement of Kinanthropometry (ISAK) protocol. All athletes competed at national or international marathon level and were actively engaged in structured endurance training at the time of assessment.
Anthropometric assessments were conducted by operators certified by the International Society for the Advancement of Kinanthropometry (ISAK), following standardized international procedures [11]. ISAK certification requires verification of intra- and inter-tester measurement precision according to internationally standardized criteria. Intra-operator Technical Error of Measurement (TEM) values were below 5% for skinfold thicknesses and below 1% for all other anthropometric measurements. Body mass and stature were measured using a scale with an integrated stadiometer (Seca, Hamburg, Germany) to the nearest 0.1 kg and 0.1 cm, respectively. Skinfold thicknesses were measured using a type A [12] skinfold caliper (Holway, California, USA) at eight anatomical sites: triceps, subscapular, biceps, iliac crest, supraspinale, abdominal, thigh, and calf, and their sum was calculated. Girth measurements were obtained using a non-elastic anthropometric tape (Lufkin, Apex Tool Group, USA) with a sensitivity of 0.1 mm, including head, neck, arm relaxed, flexed and tensed arm, forearm, wrist, chest, waist, hips, thigh 1 cm gluteal, thigh middle, calf, and ankle. Breadths and segment lengths were measured to the nearest 0.1 cm using a sliding caliper (Holway, California, USA). These included biacromial, biliocristal, chest, humerus, femur, bi-styloid, and bimalleolar breadths, as well as multiple segment lengths (upper and lower limbs and trunk-related measures). Somatotype was determined according to the Heath–Carter anthropometric method [13].
Several anthropometric proportional indices were derived from the linear and breadth measurements to characterize segmental proportions and overall body shape. The relative arm span was calculated as arm span divided by stature and multiplied by 100, whereas the Cormic index was calculated as sitting height divided by stature and multiplied by 100. These indices were used to describe upper-limb reach and trunk proportionality relative to total body height, respectively. The brachial index was calculated as radiale–stylion length divided by acromiale–radiale length and multiplied by 100, thereby expressing forearm length relative to upper arm length. The intermembral index was calculated as total upper-limb length divided by total lower-limb length and multiplied by 100, where total upper-limb length was defined as the sum of acromiale–radiale, radiale–stylion, and midstylion–dactylion lengths, and total lower-limb length as the iliospinale height. The crural index was calculated as tibiale mediale-sphyrion tibiale length divided by trochanterion–tibiale laterale length and multiplied by 100, representing lower leg length relative to thigh length. Finally, the acromio-iliac index was calculated as biiliocristal breadth divided by biacromial breadth and multiplied by 100 and was used to describe shoulder-to-pelvis proportionality. All indices were expressed as percentages.
The muscle-to-bone ratio was estimated using anthropometric prediction equations based on the Kerr fractionation model [14], based on the proportionality system relative to the Phantom reference developed by Drinkwater and Ross [15]. For each tissue compartment (muscle and bone), a Z-score was calculated using the equation Z = [(V × (170.18 / H)) − P] / s, where V is the sum of the compartment-specific anthropometric variables, H is stature (cm), P is the Phantom reference value, and s is the corresponding Phantom standard deviation. In the equation M = (Z × s + P) × (H / 170.18)³, M represents the estimated tissue mass expressed in kilograms, Z is the standardized Phantom Z-score, s is the Phantom standard deviation, P is the Phantom reference value, and H is stature in centimeters. Muscle mass was estimated from the sum of corrected girths (arm, forearm, chest, thigh, and calf), adjusted for subcutaneous adipose tissue using the equation: Corrected girths = C − π × (SKF / 10), where C is girth (cm) and SKF is the corresponding skinfold thickness in mm, and π is the mathematical constant pi. Bone mass was estimated by combining the contribution of the body (based on biacromial and biiliocristal breadths, and humerus and femur bicondylar breadths) and the head (derived from head girth), following the original Kerr formulation. Tissue masses were calculated independently of total body mass, and no post hoc adjustment was applied to match measured body mass.
2.3. Statistical Analysis
All statistical analyses were performed using RStudio. Data are presented as mean ± standard deviation (SD). Normality of distributions was assessed using the Shapiro–Wilk test, and homogeneity of variances was evaluated using Levene’s test. Between-group differences (Kenyan vs. European runners) were assessed using independent samples t-tests. In cases where the assumption of equal variances was violated, Welch’s t-test was applied. All tests were two-tailed. To control for multiple comparisons, p-values were adjusted using the Benjamini–Hochberg false discovery rate (FDR) procedure. Effect sizes were calculated using Hedges’ g and interpreted as small (0.2), moderate (0.5), and large (0.8), with values >1.2 considered very large [16]. Principal component analysis (PCA) was performed on standardized variables (z-scores) based on the correlation matrix. PCA was used as an exploratory dimensionality reduction technique for visualization of clustering patterns. Two separate PCAs were conducted to distinguish between i) predominantly structural traits (including stature, skeletal breadths, and proportional indices) and ii) modifiable traits (including body mass, girths, skinfolds, and body composition variables). The number of components retained was based on explained variance, and the first two principal components were used for visualization. To further investigate the relationship between skeletal robustness and local muscularity, corrected girths were calculated according to the ISAK methodology by subtracting the adipose tissue component from the corresponding limb girths using the equation: corrected girth = girth − π × (skinfold / 10), where girth was expressed in centimetres and skinfold thickness in millimetres. Pearson correlation analyses were performed between skeletal breadths and corrected girths, including humeral breadth and corrected arm girth, femur breadth and corrected thigh girth, and bimalleolar breadth and corrected calf girth. Statistical significance was set at p < 0.05.
3. Results
3.1. General Characteristics and Body Size
Descriptive statistics and between-group comparisons are reported in Table 1, Table 2, Table 3, Table 4, Table 5, Table 6 and Table 7. European runners exhibited significantly higher values in body mass and sitting height compared to Kenyan runners (both q < 0.05), with large effect sizes (Table 1). Stature was also greater in European runners, although with a smaller effect size.
3.2. Girths and Skeletal Breadths
European runners showed significantly higher values in all major girth measurements, including chest, waist, hip, and limb girths (all q < 0.05; Table 2), with very large effect sizes (Hedges’ g often > 1.5). The largest differences were observed for hip and waist girths. Similarly, skeletal breadths and body depths (Table 3) were generally greater in European runners, particularly for biacromial breadth, transverse chest, and biliocristal breadth (all q < 0.05). However, the magnitude of these differences was smaller compared to girths.

Table 2.
Girth measurements in the Kenyan and European runners.
| Variable | Kenya (mean ± SD) | Europe (mean ± SD) | p_FDR | Hedges g |
|---|---|---|---|---|
| Head (cm) | 54.62 ± 1.50 | 56.80 ± 1.80 | < 0.001 | -1.57 |
| Neck (cm) | 33.56 ± 1.90 | 36.40 ± 2.20 | 0.001 | -1.10 |
| Arm relaxed (cm) | 23.76 ± 1.80 | 27.30 ± 2.10 | < 0.001 | -1.63 |
| Arm flexed and tensed (cm) | 26.83 ± 2.10 | 30.40 ± 2.50 | < 0.001 | -1.72 |
| Forearm (cm) | 23.54 ± 1.50 | 25.80 ± 1.90 | 0.003 | -1.06 |
| Wrist (cm) | 15.04 ± 0.90 | 15.70 ± 1.10 | 0.090 | -0.52 |
| Chest (cm) | 84.05 ± 4.80 | 92.70 ± 6.10 | < 0.001 | -1.85 |
| Waist (cm) | 69.27 ± 4.50 | 77.80 ± 5.80 | < 0.001 | -1.93 |
| Hip (cm) | 82.86 ± 4.20 | 91.15 ± 5.30 | < 0.001 | -2.36 |
| Thigh 1 cm gluteal (cm) | 48.18 ± 3.20 | 54.60 ± 3.90 | < 0.001 | -1.66 |
| Thigh (cm) | 46.31 ± 2.90 | 52.10 ± 3.40 | < 0.001 | -1.58 |
| Calf (cm) | 32.08 ± 2.10 | 35.10 ± 2.50 | < 0.001 | -2.00 |
| Ankle (cm) | 19.63 ± 1.20 | 21.80 ± 1.40 | < 0.001 | -1.48 |
| Values are presented as mean ± standard deviation (SD); P-values were adjusted for multiple comparisons using the Benjamini–Hochberg false discovery rate (FDR) procedure false discovery rate; Effect sizes were calculated using Hedges’ g and interpreted as small (0.2), moderate (0.5), and large (0.8), with values >1.2 considered very large. | ||||
Table 3.
Skeletal breadths and depths in the Kenyan and European runners.
| Variable | Kenyan runners (mean ± SD) | European runners (mean ± SD) | p_FDR | Hedges g |
|---|---|---|---|---|
| Biacromial (cm) | 39.21 ± 2.10 | 42.50 ± 2.80 | 0.003 | -0.97 |
| Transverse chest (cm) | 26.62 ± 1.50 | 29.10 ± 2.10 | < 0.001 | -1.49 |
| Antero-posterior chest (cm) | 19.30 ± 1.10 | 19.80 ± 1.30 | 0.386 | -0.23 |
| Antero-posterior abdominal (cm) | 17.95 ± 1.80 | 21.30 ± 2.40 | < 0.001 | -1.32 |
| Biliocristal (cm) | 25.70 ± 1.90 | 28.10 ± 2.10 | < 0.001 | -1.39 |
| Humerus (cm) | 6.68 ± 0.50 | 7.10 ± 0.60 | 0.096 | -0.50 |
| Bi-styloid (cm) | 5.49 ± 0.40 | 5.80 ± 0.50 | 0.229 | -0.43 |
| Femur (cm) | 9.09 ± 0.70 | 10.20 ± 0.80 | 0.001 | -1.04 |
| Bimalleolar (cm) | 7.00 ± 0.60 | 7.90 ± 0.70 | 0.003 | -0.90 |
| Values are presented as mean ± standard deviation (SD); P-values were adjusted for multiple comparisons using the Benjamini–Hochberg false discovery rate (FDR) procedure false discovery rate; Effect sizes were calculated using Hedges’ g and interpreted as small (0.2), moderate (0.5), and large (0.8), with values >1.2 considered very large. | ||||
3.3. Segment Lengths and Heights
Differences in segment lengths and heights were less pronounced (Table 4). Kenyan runners showed higher values in selected upper-limb segment lengths, whereas European runners exhibited greater foot length (q < 0.05). Most other segmental variables did not differ significantly between groups after FDR correction.
Table 4.
Segment lengths and heights in the Kenyan and European runners.
| Variable | Kenya (mean ± SD) | Europe (mean ± SD) | p_FDR | Hedges g |
|---|---|---|---|---|
| Arm span (cm) | 178.61 ± 6.50 | 180.90 ± 7.20 | 0.315 | 0.39 |
| Acromiale-radiale (cm) | 33.68 ± 1.80 | 31.80 ± 2.00 | 0.018 | 0.99 |
| Radiale-stylion (cm) | 28.19 ± 1.50 | 27.20 ± 1.70 | 0.065 | 0.70 |
| Midstylion-dactylion (cm) | 20.05 ± 1.10 | 19.30 ± 1.20 | 0.165 | 0.53 |
| Iliospinale height (cm) | 100.62 ± 4.20 | 100.80 ± 4.50 | 0.897 | -0.04 |
| Trochanterion height (cm) | 100.58 ± 4.30 | 101.10 ± 4.70 | 0.827 | -0.09 |
| Troch-tibiale laterale (cm) | 51.43 ± 3.10 | 49.90 ± 3.40 | 0.069 | -0.57 |
| Tibiale laterale height (cm) | 49.60 ± 3.00 | 50.80 ± 3.30 | 0.315 | 0.38 |
| Tibiale mediale-sphyrion tibiale (cm) | 40.77 ± 2.80 | 40.50 ± 2.90 | 0.827 | 0.10 |
| Foot (cm) | 25.60 ± 1.20 | 27.10 ± 1.50 | 0.015 | -0.86 |
| Values are presented as mean ± standard deviation (SD); P-values were adjusted for multiple comparisons using the Benjamini–Hochberg false discovery rate (FDR) procedure false discovery rate; Effect sizes were calculated using Hedges’ g and interpreted as small (0.2), moderate (0.5), and large (0.8), with values >1.2 considered very large. | ||||
3.4. Skinfolds
European runners presented higher values in several skinfold measurements and in the sum of eight skinfolds (Table 5), although not all comparisons remained significant after FDR correction. Kenyan runners consistently showed lower adiposity values.
Table 5.
Skinfold thickness in the Kenyan and European runners.
| Variable | Kenya (mean ± SD) | Europe (mean ± SD) | p_FDR | Hedges g |
|---|---|---|---|---|
| Triceps (mm) | 3.72 ± 0.92 | 4.90 ± 1.20 | 0.020 | -0.92 |
| Subscapular (mm) | 5.97 ± 1.13 | 6.90 ± 1.50 | 0.108 | -0.49 |
| Biceps (mm) | 2.40 ± 0.40 | 2.30 ± 0.50 | 0.445 | 0.24 |
| Iliac crest (mm) | 5.52 ± 1.65 | 6.80 ± 2.00 | 0.097 | -0.60 |
| Supraspinale (mm) | 3.95 ± 0.88 | 5.10 ± 1.20 | 0.014 | -0.91 |
| Abdominal (mm) | 6.19 ± 2.26 | 7.80 ± 2.90 | 0.061 | -0.71 |
| Thigh (mm) | 4.75 ± 1.03 | 6.80 ± 1.50 | 0.014 | -1.21 |
| Calf (mm) | 3.14 ± 0.49 | 3.80 ± 0.70 | 0.097 | -0.62 |
| Σ8SKF (mm) | 35.87 ± 7.39 | 44.50 ± 9.10 | 0.014 | -0.97 |
| Values are presented as mean ± standard deviation (SD); p-values were adjusted for multiple comparisons using the Benjamini–Hochberg false discovery rate (FDR) procedure false discovery rate; Effect sizes were calculated using Hedges’ g and interpreted as small (0.2), moderate (0.5), and large (0.8), with values >1.2 considered very large. Σ8SKF, sum of eight skinfolds thicknesses. | ||||
3.5. Body Mass Components and Somatotype
Analysis of body mass components (Table 6) revealed that European runners had significantly greater SMM, bone mass, FM, FMI, and SMI (all q < 0.05), with large effect sizes. Although the muscle-to-bone index was also significantly higher in European runners (q < 0.05) (Figure 1), the effect size was moderate, indicating limited biological relevance compared to absolute differences in SMM and bone mass.
Table 6.
Body composition characteristics in the Kenyan and European runners.
| Variable | Kenya (mean ± SD) | Europe (mean ± SD) | p_FDR | Hedges g |
|---|---|---|---|---|
| Bone Mass (kg) | 6.95 ± 1.02 | 8.10 ± 1.20 | < 0.001 | -1.46 |
| Muscle Mass (kg) | 23.21 ± 3.38 | 27.90 ± 3.90 | < 0.001 | -1.81 |
| Muscle-to-bone index | 3.33 ± 0.35 | 3.60 ± 0.40 | 0.016 | -0.77 |
| Fat mass (kg) | 7.07 ± 1.33 | 9.40 ± 2.10 | < 0.001 | -1.29 |
| Fat mass (%) | 12.83 ± 2.08 | 13.90 ± 2.40 | 0.131 | -0.46 |
| FMI (kg/m2) | 2.36 ± 0.39 | 3.10 ± 0.60 | < 0.001 | -1.20 |
| SMI (kg/m2) | 7.77 ± 1.02 | 9.10 ± 1.30 | < 0.001 | -1.69 |
| Endomorphy | 1.09 ± 0.31 | 1.60 ± 0.50 | 0.006 | -0.93 |
| Mesomorphy | 5.43 ± 0.89 | 6.30 ± 1.00 | < 0.001 | -1.03 |
| Ectomorphy | 4.71 ± 0.75 | 3.20 ± 0.80 | < 0.001 | 1.39 |
| Values are presented as mean ± standard deviation (SD); P-values were adjusted for multiple comparisons using the Benjamini–Hochberg false discovery rate (FDR) procedure false discovery rate; Effect sizes were calculated using Hedges’ g and interpreted as small (0.2), moderate (0.5), and large (0.8), with values >1.2 considered very large. MBR, muscle to bone ratio; FMI, fat mass index; SMI, skeletal muscle mass index | ||||
The somatotype analysis illustrated in Figure 2 showed that both Kenyan and European runners were distributed within the mesomorphic–ectomorphic region, with minor differences in somatotype components.
3.6. Proportional Indices
Analysis of proportional indices (Table 7 and Figure 3) revealed distinct morphological patterns between groups. Kenyan runners exhibited significantly lower Cormic index values (q < 0.001), indicating relatively shorter trunk length in relation to stature, and significantly higher relative arm span and intermembral index (q < 0.05), reflecting relatively longer limb segments. Differences in brachial, crural, and acromio-iliac indices were smaller and did not consistently reach statistical significance after correction.
Table 7.
Proportional indices in the Kenyan and European runners.
| Variable | Kenya (mean ± SD) | Europe (mean ± SD) | p_FDR | Hedges g |
|---|---|---|---|---|
| Cormic index | 48.3 ± 1.80 | 52.0 ± 2.00 | < 0.001 | -1.45 |
| Relative arm span | 103.49 ± 4.13 | 100.10 ± 3.90 | 0.012 | 0.88 |
| Brachial index | 83.75 ± 4.13 | 84.20 ± 4.50 | 0.764 | -0.08 |
| Intermembral index | 81.37 ± 2.57 | 79.00 ± 2.80 | 0.012 | 0.88 |
| Crural index | 79.11 ± 6.50 | 76.90 ± 5.80 | 0.086 | 0.51 |
| Acromio-iliac index | 66.12 ± 4.99 | 67.50 ± 5.20 | 0.364 | -0.28 |
| Values are presented as mean ± standard deviation (SD); P-values were adjusted for multiple comparisons using the Benjamini–Hochberg false discovery rate (FDR) procedure false discovery rate; Effect sizes were calculated using Hedges’ g and interpreted as small (0.2), moderate (0.5), and large (0.8), with values >1.2 considered very large. | ||||
3.7. Principal Component Analysis
PCA was performed on standardized variables (z-scores) separately for predominantly structural and modifiable traits, as shown in Figure 4, respectively. The predominantly structural dataset included stature, sitting height, arm span, biacromial breadth, biliocristal breadth, femur breadth, bimalleolar breadth, cormic index, relative arm span, brachial index, intermembral index, crural index, and acromio-iliac index. The modifiable dataset included body mass, chest, waist, hip, thigh middle, and calf girth, sum of 8 skinfolds, bone mass, SMM, muscle-to-bone index, FM, FMI, SMI, endomorphy, mesomorphy, and ectomorphy. These variables represent body composition, adiposity, muscularity, and somatotype components, which are more susceptible to training and environmental influences.
In the PCA of predominantly structural traits, the first principal component (PC1) explained 35.7% of the total variance and was mainly associated with overall body size and skeletal breadths (e.g., stature, biacromial and femur breadths), whereas the second component (PC2; 17.5%) was primarily driven by proportional indices (e.g., Cormic index, relative arm span, and intermembral index). Kenyan and European runners showed partial separation along PC1, although substantial overlap remained between groups. In contrast, the PCA of modifiable traits showed a clearer separation between groups. PC1 explained 60.6% of the variance and was strongly associated with body mass, girths (chest, waist, hip), and SMM, representing a dimension primarily associated with body size and muscularity-related variables. The second component (PC2; 20.8%) was more closely related to adiposity variables (skinfolds, FMI, and endomorphy). Kenyan runners were predominantly distributed at lower PC1 scores, whereas European runners clustered at higher values, indicating greater body mass, girths, and overall musculoskeletal development. No collinearity filtering was applied because the purpose of PCA was dimensionality reduction and pattern visualization rather than predictive variable selection.
3.8. Associations Between Skeletal Breadths and Corrected Girths
To investigate whether local muscularity was associated with skeletal robustness, corrected girths were calculated by adjusting limb girths for the corresponding skinfold thicknesses. Significant positive associations were observed between humeral breadth and corrected arm girth (r = 0.41, p = 0.002), femur breadth and corrected thigh girth (r = 0.66, p < 0.001), and bimalleolar breadth and corrected calf girth (r = 0.72, p < 0.001), as shown in Figure 5.
4. Discussion
The primary aim of the present study was to compare structural anthropometric traits and modifiable body composition characteristics between Kenyan and European long-distance runners and to investigate whether local muscularity was associated with skeletal robustness. The European runners exhibited greater body mass, girths, skeletal breadths, and muscle-related body composition variables, whereas the Kenyan runners displayed a more linear body configuration characterized by lower Cormic index values and relatively longer limb proportions. In addition, significant positive associations were observed between skeletal breadths and adiposity-corrected girths, particularly in the lower limbs, suggesting that local muscularity may be associated with underlying skeletal robustness.
The present findings are consistent with previous studies describing East African endurance athletes as having lower body mass, slimmer lower limbs, and relatively longer limb proportions compared with non-African runners [8,17]. In particular, the Kenyan runners exhibited lower girths, smaller skeletal breadths, and lower body mass components related to muscularity, whereas proportional indices reflected a more linear morphology. Specifically, the lower Cormic index observed in the Kenyan runners indicates a relatively shorter trunk in relation to stature, which indirectly reflects relatively longer lower limbs. In contrast, the higher relative arm span and intermembral index values suggest proportionally longer upper limbs relative to stature and lower-limb length. These proportional characteristics may contribute to improved locomotor efficiency and running economy in endurance running.
The European runners exhibited a significantly higher muscle-to-bone index compared with Kenyan runners, indicating a greater amount of skeletal muscle mass relative to bone mass and reflecting a generally more robust musculoskeletal phenotype. However, the subsequent associations observed between skeletal breadths and corrected girths suggest that local muscularity may still be partially associated with underlying skeletal robustness. These findings are consistent with recent MRI-based evidence demonstrating strong muscle–bone coupling across multiple body regions, where skeletal dimensions were identified as major predictors of muscle volume (“big bones mean big muscles”) [9]. Although the present study used anthropometric proxies rather than direct imaging techniques, the observed relationships between skeletal breadths and corrected girths support the concept that local muscularity may not exclusively reflect lower muscle mass. This interpretation may also help explain previous observations reporting lower lower-limb volumes and slimmer lower legs in Kenyan runners [8]. In this context, the reduced limb girths observed in the Kenyan runners may not exclusively reflect lower muscle mass, but may also be partially associated with a more gracile skeletal structure. Conversely, the higher muscle-to-bone index observed in the European runners may also be influenced by differences in skeletal robustness, but could also be indirectly related to their greater skeletal mass and overall structural robustness. Comparisons with previous studies investigating muscle-to-bone relationships should nevertheless be interpreted cautiously because different methodological approaches may capture distinct biological compartments [19]. For example, some investigations have calculated muscle-to-bone ratios using dual x-ray absorptiometry-derived lean soft mass and bone mineral content, which represent molecular-level body composition variables [20], whereas the present study estimated skeletal muscle mass and bone mass at the tissue level using anthropometric equations derived from cadaver-based models [21,22,23]. Consequently, these indices are not directly interchangeable and may reflect different aspects of musculoskeletal morphology. Overall, these findings suggest that muscle-related anthropometric characteristics may also be associated with underlying skeletal robustness rather than being exclusively explained by training-related adaptations.
These findings are also consistent with previous evidence in elite Kenyan marathon runners reporting a predominantly ectomorphic somatotype, characterized by low endomorphy and mesomorphy combined with a highly linear body configuration [18]. In that study, the Kenyan runners exhibited very low body mass, reduced adiposity, and slender segmental morphology, features considered potentially advantageous for running economy and long-distance performance. One of the most relevant findings of the present study was that several variables traditionally considered modifiable, particularly muscle-related girths and SMI, also appeared to show associations with structural characteristics. Significant positive associations were observed between skeletal breadths and adiposity-corrected girths, especially in the lower limbs, indicating that local muscularity may be partially associated with skeletal robustness. The strength of these associations progressively increased from the upper to the lower limbs, with the strongest relationships observed between femur breadth and corrected thigh girth and between bimalleolar breadth and corrected calf girth. Interestingly, the PCA of predominantly structural traits suggested that skeletal robustness and body proportionality may represent partially independent morphological dimensions, whereas the PCA of modifiable variables was predominantly driven by body mass, girths, and skeletal muscle mass. These findings are consistent with anthropometric and imaging-based evidence suggesting that skeletal dimensions are closely associated with local muscularity and body composition characteristics [10,24]. In endurance athletes, this interaction may be particularly relevant in the lower limbs, where reduced skeletal robustness and slimmer distal segments have been associated with improved running economy and lower energetic cost of locomotion [6,8]. Accordingly, part of the variability in local muscularity observed among endurance runners may reflect interactions between structural morphology and training-related adaptations.
The stronger associations observed in the lower limbs compared with the upper limbs may reflect the functional specialization of these segments in endurance running. Lower-limb morphology plays a central role in running economy, force transmission, and elastic energy utilization during locomotion [25,26]. Therefore, the combination of lower skeletal robustness and reduced local muscularity may contribute to the slender lower-limb morphology commonly observed in Kenyan endurance runners. Importantly, lower skeletal breadths should not be interpreted as reduced skeletal adaptation or impaired bone health. Previous studies have reported high proximal femur bone mineral density in elite Kenyan runners despite their generally slender morphology, likely reflecting adaptation to repetitive endurance loading and high training volumes [2]. Therefore, skeletal geometry and skeletal density should be considered distinct aspects of musculoskeletal adaptation. Kenyan runners may exhibit a more gracile skeletal morphology while simultaneously maintaining high functional adaptation of bone tissue.
The present findings suggest that field anthropometry may provide useful information regarding the interaction between skeletal structure and local muscularity in endurance runners. Distinguishing between predominantly structural and modifiable traits may improve the interpretation of body composition profiles in elite long-distance athletes. However, some limitations should be acknowledged. First, the study used anthropometric proxies rather than imaging technique-derived measurements of muscle and bone volumes. Second, the cross-sectional design does not allow causal inference regarding the relationship between skeletal structure and muscularity. In addition, the study design does not allow discrimination between genetic, developmental, environmental, and training-related contributors to the observed morphological differences. Third, the sample included only male runners, limiting the generalizability of the findings to female athletes and other endurance disciplines. In addition, corrected girths represent indices of local muscularity and should not be interpreted as direct measures of muscle mass. Finally, the present study did not investigate direct associations between anthropometric characteristics and running performance outcomes. Furthermore, training volume, nutritional practices, and altitude exposure were not controlled and may have contributed to the observed differences.
5. Conclusions
In conclusion, Kenyan long-distance runners appear to be characterized by a structurally lighter musculoskeletal phenotype combining greater linearity, lower skeletal robustness, and reduced local muscularity, particularly in the lower limbs. The present findings suggest that muscularity-related characteristics may also be associated with structural morphology in endurance athletes. Overall, these findings support the concept that both structural morphology and body composition contribute to the distinct endurance phenotype commonly observed in Kenyan runners.
Author Contributions
Conceptualization, C.S. and J.M.L; methodology, F.C. and F.S.; formal analysis, F.C.; investigation, C.S., J.M.L., and F.H.; data curation, C.S. and J.M.L.; writing—original draft preparation, F.S. and F.C.; writing—review and editing, C.S., F.H., and J.M.L, Y.Y. All authors have read and agreed to the published version of the manuscript.
Funding
The authors received no specific funding for this work.
Institutional Review Board Statement
The study protocol was approved by the Ethics Committee of the University of Padua on 31/07/2023 (approval code: HECDSB.022023) and conducted in accordance with the Declaration of Helsinki.
Informed Consent Statement
Written informed consent was received from all participants involved
in the study.
Data Availability Statement
The data supporting the findings of this study are not publicly available due to privacy and ethical restrictions. However, they can be accessed upon reasonable request from the corresponding author.
Acknowledgments
We would like to sincerely thank all the athletes involved and every member of the staff from their respective teams.
Conflicts of Interest
The authors declare no conflicts of interest.
References
- Tucker, R.; Onywera, V.O.; Santos-Concejero, J. Analysis of the Kenyan distance-running phenomenon. Int. J. Sports Physiol. Perform. 2015, 10, 285–291. [Google Scholar] [CrossRef]
- Tam, E.; Rossi, H.; Moia, C.; Berardelli, C.; Rosa, G.; Capelli, C.; et al. Energetics of running in top-level marathon runners from Kenya. Eur. J. Appl. Physiol. 2012, 112, 3797–3806. [Google Scholar] [CrossRef] [PubMed]
- Larsen, H.B. Kenyan dominance in distance running. Comp. Biochem Physiol. Part A Mol. Integr. Physiol. 2003, 136, 161–170. [Google Scholar] [CrossRef] [PubMed]
- Tawa, N.; Louw, Q. Biomechanical factors associated with running economy and performance of elite Kenyan distance runners: A systematic review. J. Bodyw. Mov. Ther. 2018, 22, 1–10. [Google Scholar] [CrossRef] [PubMed]
- Barnes, K.R.; Kilding, A.E. Running economy: measurement, norms, and determining factors. Sport Med.-Open 2015, 1, 8. [Google Scholar] [CrossRef] [PubMed]
- Saunders, P.U.; Pyne, D.B.; Telford, R.D.; Hawley, J.A. Factors Affecting Running Economy in Trained Distance Runners. Sport Med. 2004, 34, 465–485. [Google Scholar] [CrossRef] [PubMed]
- Lucia, A.; Esteve-Lanao, J.; Oliván, J.; Gómez-Gallego, F.; San Juan, A.F.; Santiago, C.; et al. Physiological characteristics of the best Eritrean runners—exceptional running economy. Appl. Physiol. Nutr. Metab. 2006, 31, 530–540. [Google Scholar] [CrossRef] [PubMed]
- Larsen, H.B.; Boit, M.K.; Adamsen, M.L.; Madsen, F.; Berg, R.M.G.; Hanel, B. Running economy and lower-limb anthropometry in adult male Kenyan and Danish middle- and long-distance runners and in untrained adolescents. Exp. Physiol. 2026, 111, 1919–1932. [Google Scholar] [CrossRef] [PubMed]
- Riem, L.; Pinette, M.; DuCharme, O.; Pabon, V.; Morris, J.; Coggins, A.; et al. Big bones mean big muscles: an MRI-based dataset of muscle-bone-body size relationships across 70 human muscles of the upper limb, trunk, and lower limb. J. Appl. Physiol. 2026, 140, 1–19. [Google Scholar] [CrossRef] [PubMed]
- Lee, R.C.; Wang, Z.; Heo, M.; Ross, R.; Janssen, I.; Heymsfield, S.B. Total-body skeletal muscle mass: development and cross-validation of anthropometric prediction models. Am. J. Clin. Nutr. 2000, 72, 796–803. [Google Scholar] [CrossRef] [PubMed]
- Esparza-Ros, F.; Vaquero-Cristóbal, R.; Marfell-Jones. International standards for anthropometric assessment; UCAM Universidad Católica de Murcia: Murcia, 2019. [Google Scholar]
- Cintra, J.; Lohman, T.; Campa, F.; Heymsfield, S. Systematic organisation of skinfold callipers: an approach based on physical-mechanical properties and characteristics. Br. J. Nutr. 2025, 134, 929–935. [Google Scholar] [CrossRef] [PubMed]
- Carter, J.E.L. The Heath-Carter Anthropometric Somatotype; San Diedo, 2002. [Google Scholar]
- Ross, W.; Kerr, D. Fraccionamiento de la Masa Corporal: Un Nuevo Método para Utilizar en Nutrición, Clínica y Medicina Deportiva; PubliCE, 1993. [Google Scholar]
- Martin, A.D.; Ross, W.D.; Drinkwater, D.T.; Clarys, J.P. Prediction of body fat by skinfold caliper: assumptions and cadaver evidence. Int. J. Obes. 1985, 9, 31–39. [Google Scholar]
- Cohen, J. Statistical Power Analysis for the Behavioral Sciences; routledge: New York, NY, 2013. [Google Scholar] [CrossRef]
- Saltin, B.; Larsen, H.; Terrados, N.; Bangsbo, J.; Bak, T.; Kim, C.K.; et al. Aerobic exercise capacity at sea level and at altitude in Kenyan boys, junior and senior runners compared with Scandinavian runners. Scand. J. Med. Sci. Sports 1995, 5, 209–221. [Google Scholar] [CrossRef] [PubMed]
- Vernillo, G.; Schena, F.; Berardelli, C.; Rosa, G.; Galvani, C.; Maggioni, M.; et al. Anthropometric characteristics of top-class Kenyan marathon runners. J. Sports Med. Phys. Fit. 2013, 53, 403–408. [Google Scholar]
- Baglietto, N.; Albaladejo-Saura, M.; Esparza-Ros, F.; Vaquero-Cristóbal, R. Agreement and differences between the equations for estimating muscle and bone mass using the anthropometric method in recreational strength trainees. PeerJ. 2024, 12, e17506. [Google Scholar] [CrossRef] [PubMed]
- Silva, A.M. Structural and functional body components in athletic health and performance phenotypes. Eur. J. Clin. Nutr. 2019, 73, 215–224. [Google Scholar] [CrossRef] [PubMed]
- Dengel, D.R.; Studee, H.R.; Juckett, W.T.; Bosch, T.A.; Carbuhn, A.F.; Stanforth, P.R.; et al. Muscle-To-Bone Ratio in NCAA Division i Collegiate Football Players by Position. J. Strength Cond. Res. 2024, 38, 1607–1612. [Google Scholar] [CrossRef] [PubMed]
- Dengel, D.R.; Juckett, W.T.; Stanforth, P.R.; Evanoff, N. Muscle-to-Bone Ratio in Collegiate Female Athletes in Low and High Impact Sports. Int. J. Sports Med. 2026, 47, 206–211. [Google Scholar] [CrossRef] [PubMed]
- Westerberg, H.; Stanforth, P.R.; Carbuhn, A.; Bosch, T.; Dengel, D.R. Muscle-to-bone and soft tissue-to-bone ratios in track and field athletes. Int. J. Sports Med. 2025, 46, 90–96. [Google Scholar] [CrossRef] [PubMed]
- Fricke, O.; Schoenau, E. The “Functional Muscle-Bone Unit”: probing the relevance of mechanical signals for bone development in children and adolescents. Growth Horm IGF Res Off J Growth Horm Res Soc Int IGF Res Soc. 2007, 17, 1–9. [Google Scholar] [CrossRef] [PubMed]
- Mooses, M.; Mooses, K.; Haile, D.W.; Durussel, J.; Kaasik, P.; Pitsiladis, Y.P. Dissociation between running economy and running performance in elite Kenyan distance runners. J. Sports Sci. 2015, 33, 136–144. [Google Scholar] [CrossRef] [PubMed]
- Kunimasa, Y.; Sano, K.; Nicol, C.; Barthèlemy, J.; Ishikawa, M. Is the muscle-tendon architecture of non-athletic Kenyans different from that of Japanese and French males? J. Physiol. Anthropol. 2023, 42, 9. [Google Scholar] [CrossRef] [PubMed]
Figure 1.
Muscle-to-bone ratio of the Kenyan and European runners.
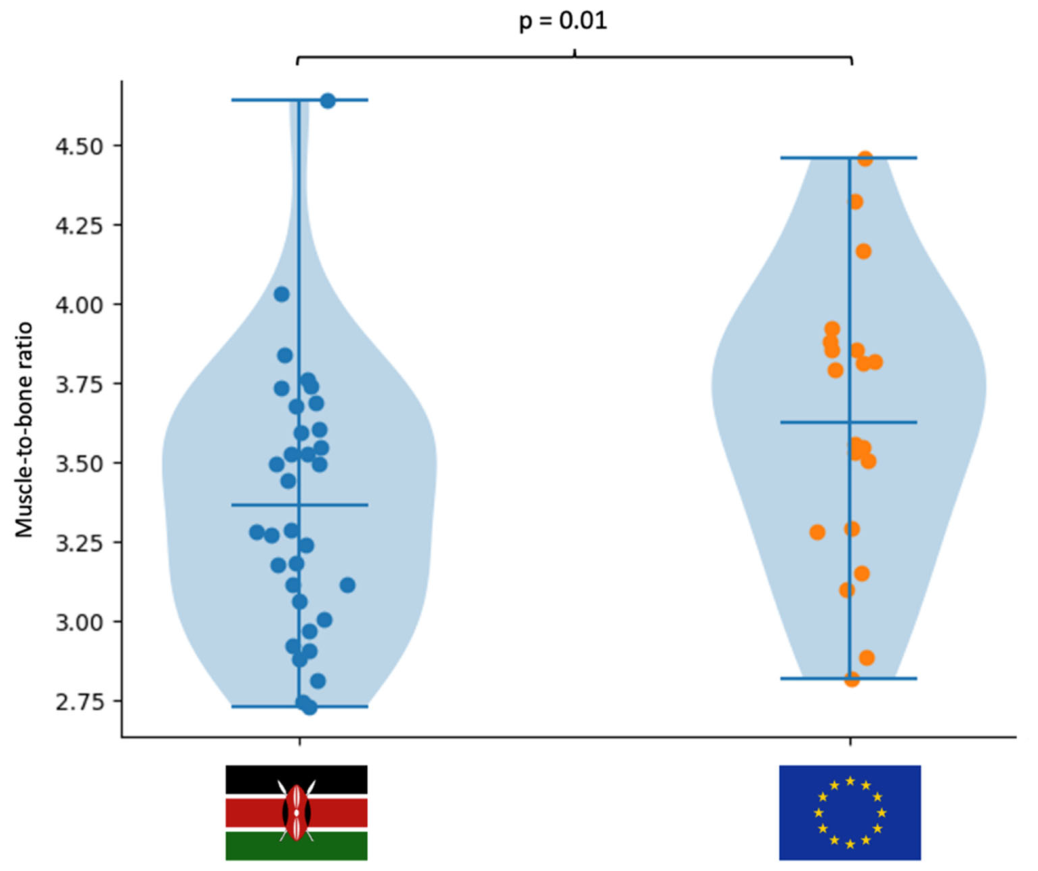
Figure 2.
Somatochart with the main coordinates used to define the 13 somatotype categories. The somatotypes of the Kenyan and European runners are plotted with their respective centroids. CEN (Central), BE (Balanced Ectomorph), BEn (Balanced Endomorph), BM (Balanced Mesomorph), E-En (Ectomorph–Endomorph), Ec-En (Ectomorphic–Endomorph), Ec-M (Ectomorphic–Mesomorph), En-E (Endomorphic–Ectomorph), En-M (Endomorphic–Mesomorph), M-E (Mesomorph–Ectomorph), Mc-E (Mesomorphic–Ectomorph), M-En (Mesomorph–Endomorph), and Mc-En (Mesomorphic–Endomorph).
Figure 2.
Somatochart with the main coordinates used to define the 13 somatotype categories. The somatotypes of the Kenyan and European runners are plotted with their respective centroids. CEN (Central), BE (Balanced Ectomorph), BEn (Balanced Endomorph), BM (Balanced Mesomorph), E-En (Ectomorph–Endomorph), Ec-En (Ectomorphic–Endomorph), Ec-M (Ectomorphic–Mesomorph), En-E (Endomorphic–Ectomorph), En-M (Endomorphic–Mesomorph), M-E (Mesomorph–Ectomorph), Mc-E (Mesomorphic–Ectomorph), M-En (Mesomorph–Endomorph), and Mc-En (Mesomorphic–Endomorph).
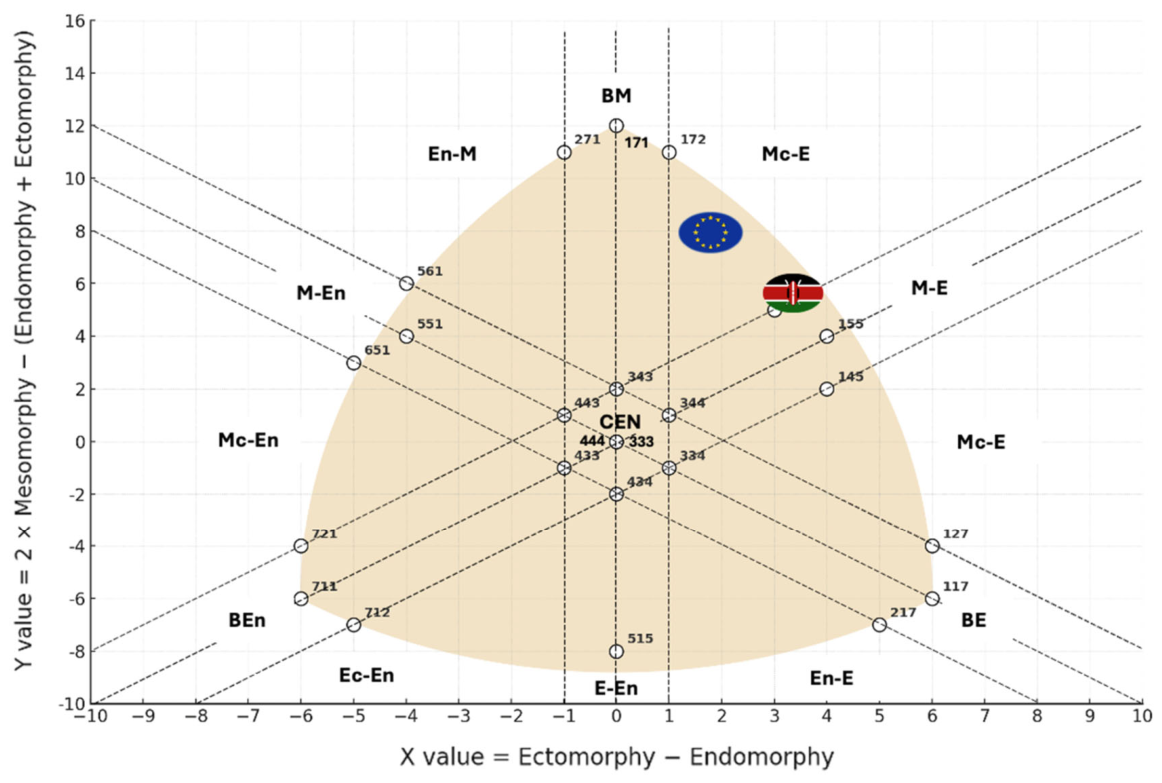
Figure 3.
Violin plots showing the distribution of selected proportional indices in the Kenyan and European runners.
Figure 3.
Violin plots showing the distribution of selected proportional indices in the Kenyan and European runners.
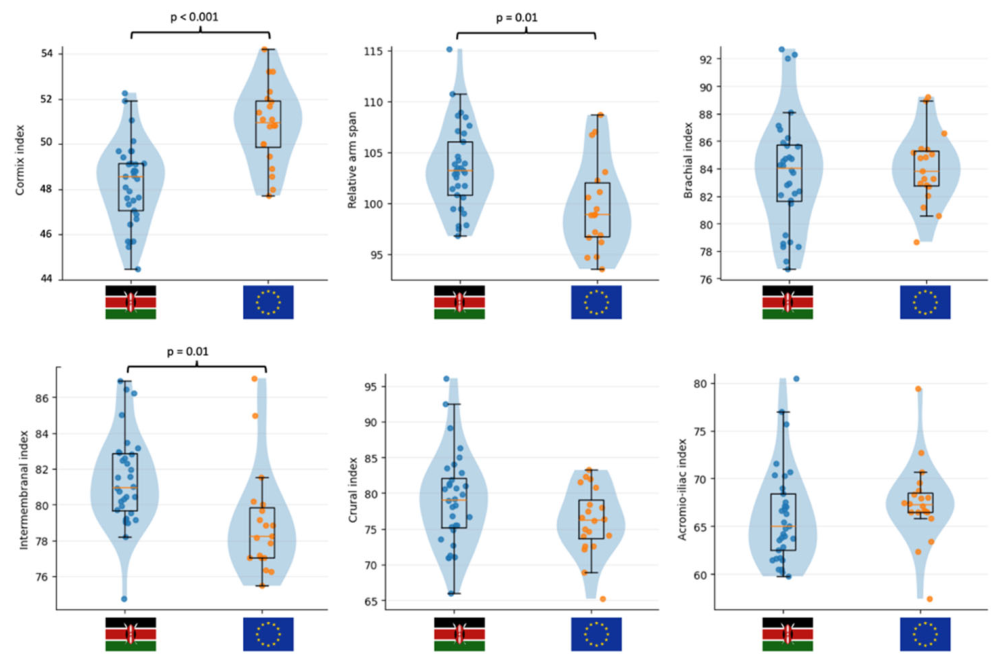
Figure 4.
Principal component analysis (PCA) of predominantly structural traits (panel A) and modifiable traits (panel B) in Kenyan and European runners. Percentages on axes indicate explained variance for each principal component.
Figure 4.
Principal component analysis (PCA) of predominantly structural traits (panel A) and modifiable traits (panel B) in Kenyan and European runners. Percentages on axes indicate explained variance for each principal component.
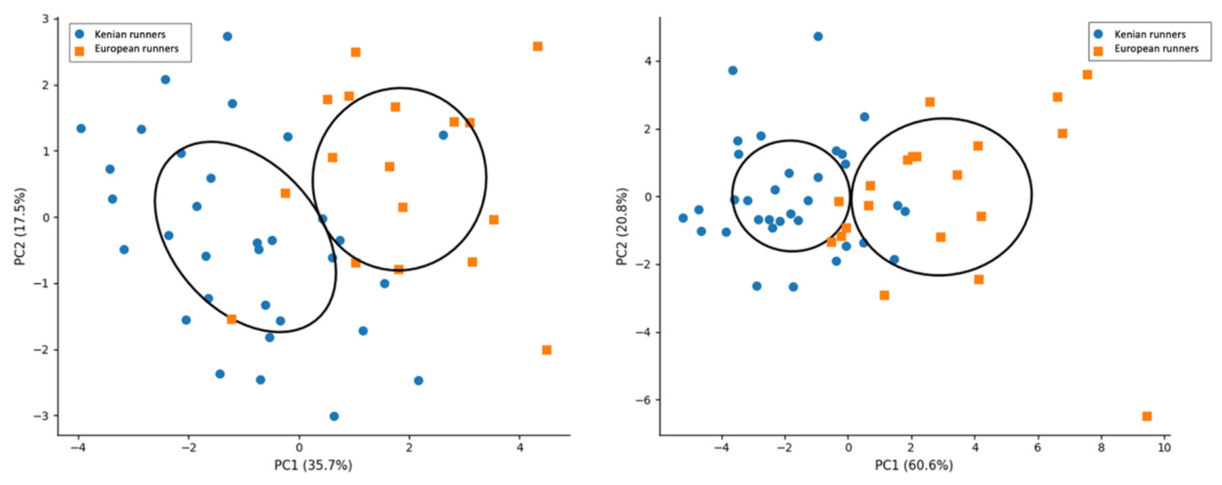
Figure 5.
Associations between skeletal breadths and corrected girths in Kenyan and European runners. Pearson correlation coefficients (r) and p-values are reported for each association.
Figure 5.
Associations between skeletal breadths and corrected girths in Kenyan and European runners. Pearson correlation coefficients (r) and p-values are reported for each association.
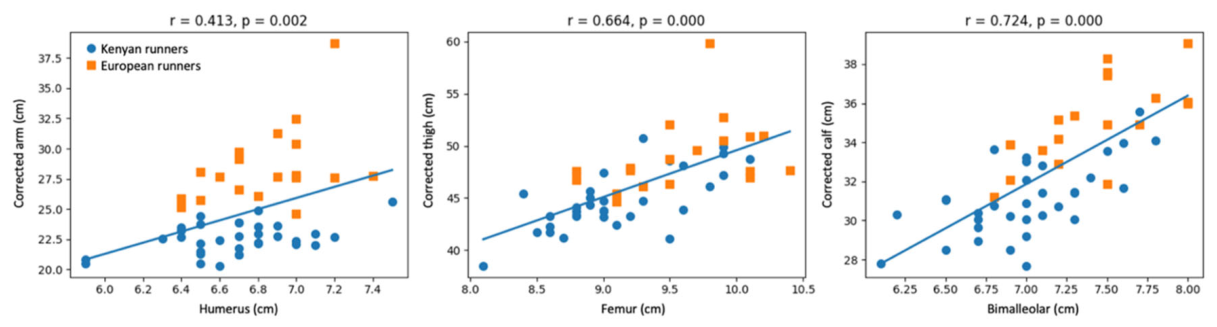
Table 1.
General characteristics of Kenyan and European runners.
| Variable | Kenyan runners (mean ± SD) | European runners (mean ± SD) | p_FDR | Hedges g |
|---|---|---|---|---|
| Age (years) | 27.23 ± 5.17 | 30.85 ± 4.90 | 0.011 | -0.81 |
| Body mass (kg) | 55.00 ± 4.88 | 65.30 ± 6.10 | < 0.001 | -1.93 |
| Stature (cm) | 172.78 ± 5.32 | 178.90 ± 6.40 | 0.003 | -0.91 |
| Sitting height (cm) | 83.38 ± 3.70 | 89.55 ± 4.20 | < 0.001 | -1.96 |
| Values are presented as mean ± standard deviation (SD); P-values were adjusted for multiple comparisons using the Benjamini–Hochberg false discovery rate (FDR) procedure false discovery rate. Effect sizes were calculated using Hedges’ g and interpreted as small (0.2), moderate (0.5), and large (0.8), with values >1.2 considered very large. | ||||
Disclaimer/Publisher’s Note: The statements, opinions and data contained in all publications are solely those of the individual author(s) and contributor(s) and not of MDPI and/or the editor(s). MDPI and/or the editor(s) disclaim responsibility for any injury to people or property resulting from any ideas, methods, instructions or products referred to in the content. |
© 2026 by the authors. Licensee MDPI, Basel, Switzerland. This article is an open access article distributed under the terms and conditions of the Creative Commons Attribution (CC BY) license (http://creativecommons.org/licenses/by/4.0/).
Copyright: This open access article is published under a Creative Commons CC BY 4.0 license, which permit the free download, distribution, and reuse, provided that the author and preprint are cited in any reuse.


