

Submitted:
08 July 2026
Posted:
08 July 2026
You are already at the latest version
Abstract
Upper-level wind and spatial inhomogeneities in the vorticity field are the key characteristics of atmospheric turbulence. In this paper, we study the spatial and temporal variations in wind speed and atmospheric vorticity within the layer 9.5–13.6 km (300 - 150 hPa) at the site of Special Astrophysical Observatory (SAO). Using hourly data from the ERA-5 reanalysis over a ten-year period, from 2016 to 2025, we obtained seasonal spatial distributions above SAO and evaluated long-term trends using the non-parametric Mann–Kendall test. Analysis of the spatial distributions reveals the subregion with strong upper-level winds southeast of the observatory during winter, spring, and autumn. In summer, the subregion shifts northward due to dynamics of frontal zone and jet stream. Three-dimensional atmospheric vorticity fields exhibit complex, multi-layered, and localized structures. The spatial inhomogeneity of vorticity field acts as an indicator of local optical turbulence. Jet stream winds and the associated wind shears at the 200 hPa pressure level are primary drivers of tropospheric optical turbulence. It is important to emphasize that the optical turbulence strenght depends on the specific location of the jet stream. Turbulence is suppressed within the jet stream while the repeatability of turbulent fluctuations increases significantly at its periphery. Long-period trend assessments indicate a statistically significant decrease in winter wind speeds (-0.0028 to -0.0060 m/s per night, p ≤ 0.01), as well as a significant decrease in winter local vorticity at heights of 12.8–13.6 km (-0.0007 to -0.0011 1/s per night, p ≤ 0.04). These changes are linked to the global (arctic) warming and reduced latitudinal large-scale temperature contrasts. A systematic decrease in wind speed should lead to a decrease in total atmospheric turbulence (the kinetic energy of flow should tend to decrease). However, turbulence can be additionally generated locally due to the deformations of large-scale jet stream. Conversely, summer profiles show a robust and significant increase in wind speed (up to 0.0038 m/s per night, p ≤ 0.04). Long-period changes in vorticity are not significant. For comparison, trends in the optical turbulence strength at the Baikal Astrophysical Observatory are analyzed. Analysis of data obtained make it possible to note that in the summer-autumn period, when the quality of astronomical images is the best, one can expect a deterioration in conditions for astronomical observations under the influence of climate changes.
Keywords:
climate
; wind speed
; optical turbulence
1. Introduction
Turbulent atmosphere significantly affects the propagation of radiation. In particular, the absorption, scattering, and refraction of light in the atmosphere severely limit the capabilities of astronomical observations at ground-based telescopes. The statistical ensemble of atmospheric conditions that determines the possibilities and potential for conducting astronomical observations can defined as the astroclimate. The study of astroclimate is of importance during the period of observed global warming, since natural and anthropogenic factors are potentially capable of altering the conditions for astronomical observations.
The angular resolution of ground-based telescopes is fundamentally limited by atmospheric optical (small-scale) turbulence associated with the formation of inhomogeneities in the air refractive index at different heights [1]. Such inhomogeneities are driven by localized microscale variations in temperature and humidity, which develop under the influence of dynamic processes in the atmosphere. Image quality statistics related to the formation of refractive index fluctuations can be determined by analyzing the structural characteristics of atmospheric turbulence. In the absence of long-term empirical time series, the structure of optical turbulence can be studied using special models and parametrizations. For this purpose, global atmospheric reanalysis data are actively utilized to reconstruct long-term changes.
In the practice of ground-based astronomy, optical turbulence is frequently characterized by the wind speed at the 200 hPa isobaric level (V200) [2,3,4,5,6,7,8,9]. According to the concept proposed in foundational paper [3], V200 parameter is considered a key indicator of atmospheric (tropospheric) optical turbulence. In particular, Vernin find [10]:
where is the structural characteristic in the air refractive index fluctuations, z si the height, is the turbulent integral, is the calibration constant, and are the horizontal components of the wind velocity at the 200 hPa level. As demonstrated by long-term site characterization campaigns, powerful high-altitude winds (V200) directly govern the atmospheric coherence time, which is critically important for the operation of adaptive optics systems [11]. Indeed, the layer of the upper troposphere and lower stratosphere at the 200 hPa isobaric level (the height of ∼ 11–12 km) is the primary zone where intense, large-scale jet streams form. The development of jet streams is governed by the thermal wind concept, which couples the vertical wind shear of the geostrophic wind to the large-scale horizontal temperature gradient of the underlying moving atmospheric layers. Consequently, the values of V200 are tightly linked to the horizontal temperature gradients in the lower and middle troposphere, as well as to the vertical wind profiles across the entire atmospheric column. When strong wind shear is generated at the boundaries between distinct atmospheric layers, small-scale optical turbulence is triggered. This dynamic concept establishes the high relevance of investigating wind speeds at the 200 hPa level for the long-term monitoring of both operational and projected astronomical observatories. In the context of this objective, the North Caucasus region (and Special astrophysical observatory (SAO), in particular) is of interest due to its unique environmental conditions for executing astrophysical research in the optical and near-infrared bands [12,13,14].
In the present paper we study the spatio-temporal variability of wind speed and vorticity at the 200 hPa level, as well as in its immediate vicinity, for SAO over the ten-year period spanning from 2016 to 2025. Selecting this specific temporal interval enables the assessment of contemporary climate change trends and their direct footprint on the localized atmospheric layer dynamics above the observatory. Analyzing the wind field is a pivotal step in astroclimatic research. On the one hand, air density inhomogeneities arise in regions with high vertical wind speed shears. Intense vertical wind shear triggers the development of Kelvin–Helmholtz hydrodynamic instability and disturbs stable atmospheric layers. On the other hand, the laminarization of airflows during the intensification of jet streams may lead to a systematic reduction in the kinetic energy fraction of turbulence. Decreasing small-scale turbulence near upper-level jet streams minimizes phase fluctuation variance, thereby enhancing the stability of the telescope’s point spread function (PSF) [15]. Furthermore, suppressed free-atmosphere turbulence expands the isoplanatic angle, allowing for more effective application of speckle interferometry and lucky imaging techniques.
1.1. Wind Speed Distributions Above the Special Astrophysical Observatory
Wind speed at 200 hPa and its temporal variations have been studied for many astronomical sites. However, analysis of spatial inhomogeneities in this characteristic (around observatories) has received little attention in the literature. In this section we present and analyze the spatial distributions of wind speed and atmospheric vorticity around the Special astrophysical observatory for the period from 2016 to 2025. Trends in these characteristics over this period are also examined.
In order to obtain spatial distributions of wind speed, hourly data from the ERA-5 reanalysis were used. Figure 1 and Figure 2 show the spatial night-time distributions of median wind speed values for different seasons.
Analysis of Figure 1 and Figure 2 indicates substantial spatial variations in the wind speed within the upper atmospheric layers at SAO. Areas with high winds are located southeast of the observatory. Also, wind speed rises sharply with height for all seasons. The strongest winds are observed in summer: at heights of 10.5–13.6 km, an area with high wind speeds () is formed. In winter, strong wind values are observed at heights above 11.6 km, with wind maximum east of the observatory (∼ 24 m/s). However, over SAO median wind speeds are somewhat lower (approximately 20–22 m/s).
In spring, the figure is dominated by yellow-orange colors: the lowest speed values are observed (among all seasons). In autumn, the distribution is similar to winter. The red zone at heights of 13.0–13.6 km is more pronounced than in spring, and, just as in winter, it is more displaced from the observatory’s central axis. Thus, analysis of these figures shows that in winter and during transitional seasons, the region of strong winds is located southeast of SAO. The position is associated with seasonal changes in the upper-level frontal zone. In summer, the opposite is observed, a northward shift is observed. These features are critical for astroclimate, as they influence variations in wavefront coherence time.
1.2. Atmospheric Vorticity Distributions Above the Special Astrophysical Observatory
Figure 3 and Figure 4 show distributions of atmospheric vorticity above Special astrophysical observatory for different seasons. In the figures, regions of low vorticity are excluded.
Analysis of the three-dimensional spatial distributions of atmospheric vorticity suggests that the structure of the fields in the free atmosphere over SAO is complex, dynamic, and often multilayered. Changes in vorticity with height does not follow monotonic linear laws, but rather reflects complex baroclinic and the intermittent nature of the atmosphere. A key feature is that the vorticities are spatially limited.
In winter, the region with strong vertical wind shear shifts southeastward from the observatory. Multiple mesoscale regions of strong vorticity form above the observatory. These regions can cause fluctuations in the jet stream axis or serve as an indicator of this process. A spatially inhomogeneous vorticity field likely indicates that the jet stream is losing its average kinetic energy to viscous friction. This should increase the kinetic energy of turbulence.
In summer, the vorticity field change significantly. Locally, large-scale vorticity values increase. However, vertical and horizontal vorticity gradients are significantly reduced. This may lead not to the formation of optical small-scale turbulence, but to its smoothing and deformations of turbulence spectra. SAO is located at the boundary between weak and strong vorticity fields. This means that vorticity is minimal at the zenith. The weakening of high-level turbulent fluctuations is associated with the ordered action of the slightly deformed jet stream. Vorticity regions develop north of the observatory.
In spring and autumn, isolated "islands" of low and high values emerge in the vorticity field. Compared to winter, the jet stream slows, and conditions for tropospheric turbulence generation deteriorate. Vorticity structure above SAO is intermittent, with an intensity close to background state.
1.3. Long-Period Trends in Wind Speed Values and Atmospheric Vorticity at the Site of the Special Astrophysical Observatory
Taking into account that the climate is constantly changing, it is important to estimate trends in high-level wind for SAO. For detection of monotonic trends in the temporal variations of optical turbulence, we used the non-parametric Mann–Kendall statistical method. The primary advantage of this method is that it does not require a normal distribution of analyzed values and is robust against outliers. The latter is particularly important due to the wide dynamic range in turbulence strength characteristics.
Table 1 and Table 2 shown wind speed and atmospheric vorticity statistics estimated for atmospheric layer 9.1–13.6 km by seasons, respectively. Figure 5 and Figure 6 show vertical changes in wind speed trends over the observatory and time series of V200 from 2016 to 2025. Similar to wind speed, the same graphs are obtained for atmospheric vorticity (Figure 7 and Figure 8).
During winter period, strong negative and statistically significant trends are observed within the atmospheric layer 9.1–13.6 km (-0.0028 to -0.0060 m/s per night . Trends in the Sen slope for vorticity also show a statistically significant decrease within the atmospheric layer 12.8–13.6 km (-0.0007 to -0.0011 1/s per night ). Such behavior in long-period changes is associated with warming of the Arctic surface layer. Intense warming of polar latitudes due to sea ice loss blurs the latitudinal temperature contrast. Decreasing the temperature contrasts lead to a decrease in zonal wind speed values, destabilization and waviness of upper-level jets.
In summer, the situation changes: wind speed demonstrates the most powerful and statistically significant increase (trends up to 0.0038 m/s per night, ()). The atmosphere at the height levels is determined by dynamics of the underlying layers. Climatic increase in the atmospheric boundary layer height (ABLH) and surface air temperatures strengthen the large-scale turbulent vertical fluxes (momentum and water vapor) into these underlying layers, whose characteristics directly influence the jet streams. This can lead to a change in the latent heat of condensation, especially over humid regions of the Earth. It is likely that this heat entering the low latitudes somewhat enhances the horizontal pressure gradient and jet streams.
In spring, wind speed trends are positive. Significant trends () appear only in the stratosphere (200–150 hPa). At this time, the Arctic effect of reduced horizontal temperature contrasts is stable. However, vertical interlayer exchange processes intensify, and the jet accelerates.
In autumn, radiative cooling of the Arctic is just beginning, while heating of humid regions is decreasing. During this period, the atmosphere is in a somewhat balanced state, and there is no climate trend.
Statistically significant negative trends in vorticity associated with turbulence are observed only in winter at heights of 12.8–13.6 km (150–175 hPa). This is due to the fact that jet streams are deformed due to Arctic warming, which is most pronounced during cold periods. Also, it can be noted that the trends in wind speed for different atmospheric levels are predominantly statistically significant. This indicates some potential degradation in image quality in the long term.
2. Trends in Optical Turbulence Strenght at Baikal Astrophysical Observatory
Addressing climate change issues is highly relevant. For ground-based astronomy, it is important to understand what is happening to the atmospheric optical turbulence structure and how observed climate changes affect the quality of astronomical images. We saw above that the jet stream, which is formed under the influence of underlying layers, tends to accelerate during summer. This is especially important since summer is the observing season for many astronomical observatories (high image quality). In this paper, we also examined how the strength of optical turbulence varies at the site of Baikal Astrophysical Observatory (BAO). BAO serves as a reference site. This is because we are continuously refining our methods for estimating turbulence by comparing modeling data with optical distortion measurements performed at the Large Solar Vacuum Telescope using wavefront sensor.
In particular, the methodology for calculation of optical turbulence strength is based on formulas:
In this expression, the strength of optical (small-scale) turbulence () is related to the mean vertical gradient of the air refractive index and the outer scale of turbulence . is a numerical constant, which is equal to 2.8, is the coefficient determined by comparing the measured and calculated values of . The parameter can be estimated using the following:
where P is the atmospheric pressure and T is the air temperature. is the potential air temperature:
Figure 9 and Figure 10 show long-period variations in the optical turbulence strength (in terms of the structural characteristics of the air refractive index fluctuations ) over BAO. It is noteworthy that turbulence also increases within individual upper atmospheric layers (for example, at height of 11.6 km). However, turbulence within the surface layer of atmosphere, which contribute most to total optical distortions, decreases. Therefore, one would expect that the total turbulence (tropospheric) should decrease. Due to the thickening of the lower atmospheric boundary layer in summer (∼ 800-900 m, the median is 840 m), image quality remains stable (Figure 11). The above estimates indicate a significant, multidirectional impact of global warming on atmosphere structure.
3. Conclusions
Three-dimensional distributions of wind speed and vorticity were obtained in the SAO region. Vorticity over SAO have a complex, dynamic, and multilayered structure. In winter, multiple mesoscale regions of strong vorticity form over the observatory. In summer, the linear scales of vorticity increase, and its vertical and horizontal gradients are greatly smoothed. Changes in the parameter V200 above SAO vary depending on the season. In winter, this parameter decreases, while in other seasons, it shows a slight positive trend.
SAO region is characterized by strong seasonal changes: in autumn-winter and spring, subregions of strong high-level winds shift southeast of the observatory, while in summer they shift north. Analysis of trends revealed a statistically significant weakening of winter winds and vorticity due to Arctic warming, while in summer, wind speeds, conversely, increase. Due to these climate changes and the strengthening of jet streams, we predict deterioration in conditions for astronomical observations during the summer-autumn period, traditionally considered the best for image quality.
The quality of astronomical images is sensitive to changes in the Earth’s climate system. Obtained data indicate a twofold effect of global warming on the optical turbulence. On the one hand, an increase in turbulence strength is observed in the upper atmosphere. On the other hand, in the middle and lower troposphere, turbulence intensity tends to decrease in a linear approximation. The lower atmospheric boundary layer simultaneously increases in thickness. This increase compensates for negative trends in turbulence strenght. As a result, total tropospheric optical turbulence changes little, the quality of astronomical images should remain stable.
Funding
Testing the method for assessing optical turbulence was funded by the RSF grant № 24-72-10043. Measurement data and primary analysis was supported by the Ministry of Science and Higher Education of the Russian Federation.
Institutional Review Board Statement
Not applicable.
Informed Consent Statement
Not applicable.
Data Availability Statement
Data are available upon request.
Acknowledgments
The approaches were previously tested using the Unique Research Facility Large Solar Vacuum Telescope (accessed on 1 November 2025). (http://ckp-rf.ru/usu/200615/).
Conflicts of Interest
The author declares no conflicts of interest.
References
- Roddier, F. The effects of atmospheric turbulence in optical astronomy. Prog. Opt. 1981, 19, 281–376. [Google Scholar] [CrossRef]
- Haslebacher, C.; Demory, M.-E.; Demory, B.-O.; Sarazin, M.; Vidale, P.L. Impact of climate change on site characteristics of eight major astronomical observatories using high-resolution global climate projections until 2050. Astron. Astrophys. 2022, 665, A149. [Google Scholar] [CrossRef]
- Sarazin, M.; Tokovinin, A. The Statistics of Isoplanatic Angle and Adaptive Optics Time Constant derived from DIMM Data. In Proceedings of the Topical Meeting Beyond Conventional Adaptive Optics, Venice, Italy, 7–10 May; European Southern Observatory: Garching, Germany, 2001; Volume 58, p. 321. [Google Scholar]
- Han, Y.; Yang, Q.; Liu, N.; Zhang, K.; Qing, C.; Li, X.; Wu, X.; Luo, T. Analysis of wind-speed profiles and optical turbulence above Gaomeigu and the Tibetan Plateau using ERA5 data. Mon. Not. R. Astron. Soc. 2021, 501, 4692–4701. [Google Scholar] [CrossRef]
- Bounhir, A.; Benkhaldoun, Z.; Carrasco, E.; Sarazin, M. High-altitude wind velocity at Oukaimeden observatory. Mon. Not. R. Astron. Soc. 2009, 398, 862–872. [Google Scholar] [CrossRef]
- Chueca, S.; García-Lorenzo, B.; Muñoz-Tuñón, C.; Fuensalida, J.J. Statistics and analysis of high-altitude wind above the Canary Islands observatories. Mon. Not. R. Astron. Soc. 2004, 349, 627–631. [Google Scholar] [CrossRef]
- Qian, X.; Yao, Y.; Wang, H.; Zou, L.; Li, Y. Statistics and analysis of high-altitude wind above the western Tibetan Plateau. Mon. Not. R. Astron. Soc. 2020, 498, 5786–5797. [Google Scholar] [CrossRef]
- García-Lorenzo, B.; Eff-Darwich, A.; Fuensalida, J.J.; Castro-Almazán, J. Adaptive optics parameters connection to wind speed at the Teide Observatory. Mon. Not. R. Astron. Soc. 2009, 397, 1633–1646. [Google Scholar] [CrossRef]
- Garcia-Lorenzo, B.; Fuensalida, J.J.; Munoz-Tunon, C.; Mendizabal, E. Astronomical Site Ranking Based on Tropospheric Wind Statistics. Mon. Not. R. Astron. Soc. 2005, 356, 849–858. [Google Scholar] [CrossRef]
- Vernin, J. Astronomical Site Selection: A New Meteorological Approach. In Proceedings of the Advanced Technology Optical Telescopes III Proc. SPIE 0628, Tucson, AZ, United States, 20 August 1986; pp. 626–628. [Google Scholar]
- Bolbasova, L.A.; Kopylov, E.A. Long-Term Trends of Astroclimatic Parameters above the Terskol Observatory. Atmosphere 2023, 14, 1264. [Google Scholar] [CrossRef]
- Panchuk, V.E.; Afanas’ev, V.L. Astroclimate of Northern Caucasus-myths and reality. Astrophys. Bull. 2011, 66(2), 233–254. [Google Scholar] [CrossRef]
- Kudryavtsev, D.O.; Vlasyuk, V.V. The Largest Russian Optical Telescope BTA: Current Status and Modernization Prospects. In Ground-Based Astronomy in Russia. 21st Century, Proceedings of the All-Russian Conference, Nizhny Arkhyz, Russia; Special Astrophysical Observatory of the Russian Academy of Sciences, 21–25 September 2020; Special Astrophysical Observatory of the Russian Academy of Sciences: Nizhny Arkhyz, 2020; pp. 21–31. [Google Scholar] [CrossRef] [PubMed]
- Vlasyuk, V.V. SAO RAS Optical telescopes in the Epoch of multimessenger astronomy. In Ground-Based Astronomy in Russia. 21st Century, Proceedings of the All-Russian Conference, Nizhny Arkhyz, Russia; Special Astrophysical Observatory of the Russian Academy of Sciences, 21–25 September 2020; Special Astrophysical Observatory of the Russian Academy of Sciences: Nizhny Arkhyz, 2020; pp. 3–11. [Google Scholar] [CrossRef] [PubMed]
- Yuan, Y.; Ke, X.; Wang, R. Experiment of Suppressing Atmospheric Turbulence by Using Fast-Steering Mirror. Appl. Sci. 2025, 15, 9920. [Google Scholar] [CrossRef]
Figure 1.
Distributions of high-level wind speed above Special astrophysical observatory, 2016 - 2025. Black markers correspond to the site of SAO.
Figure 1.
Distributions of high-level wind speed above Special astrophysical observatory, 2016 - 2025. Black markers correspond to the site of SAO.
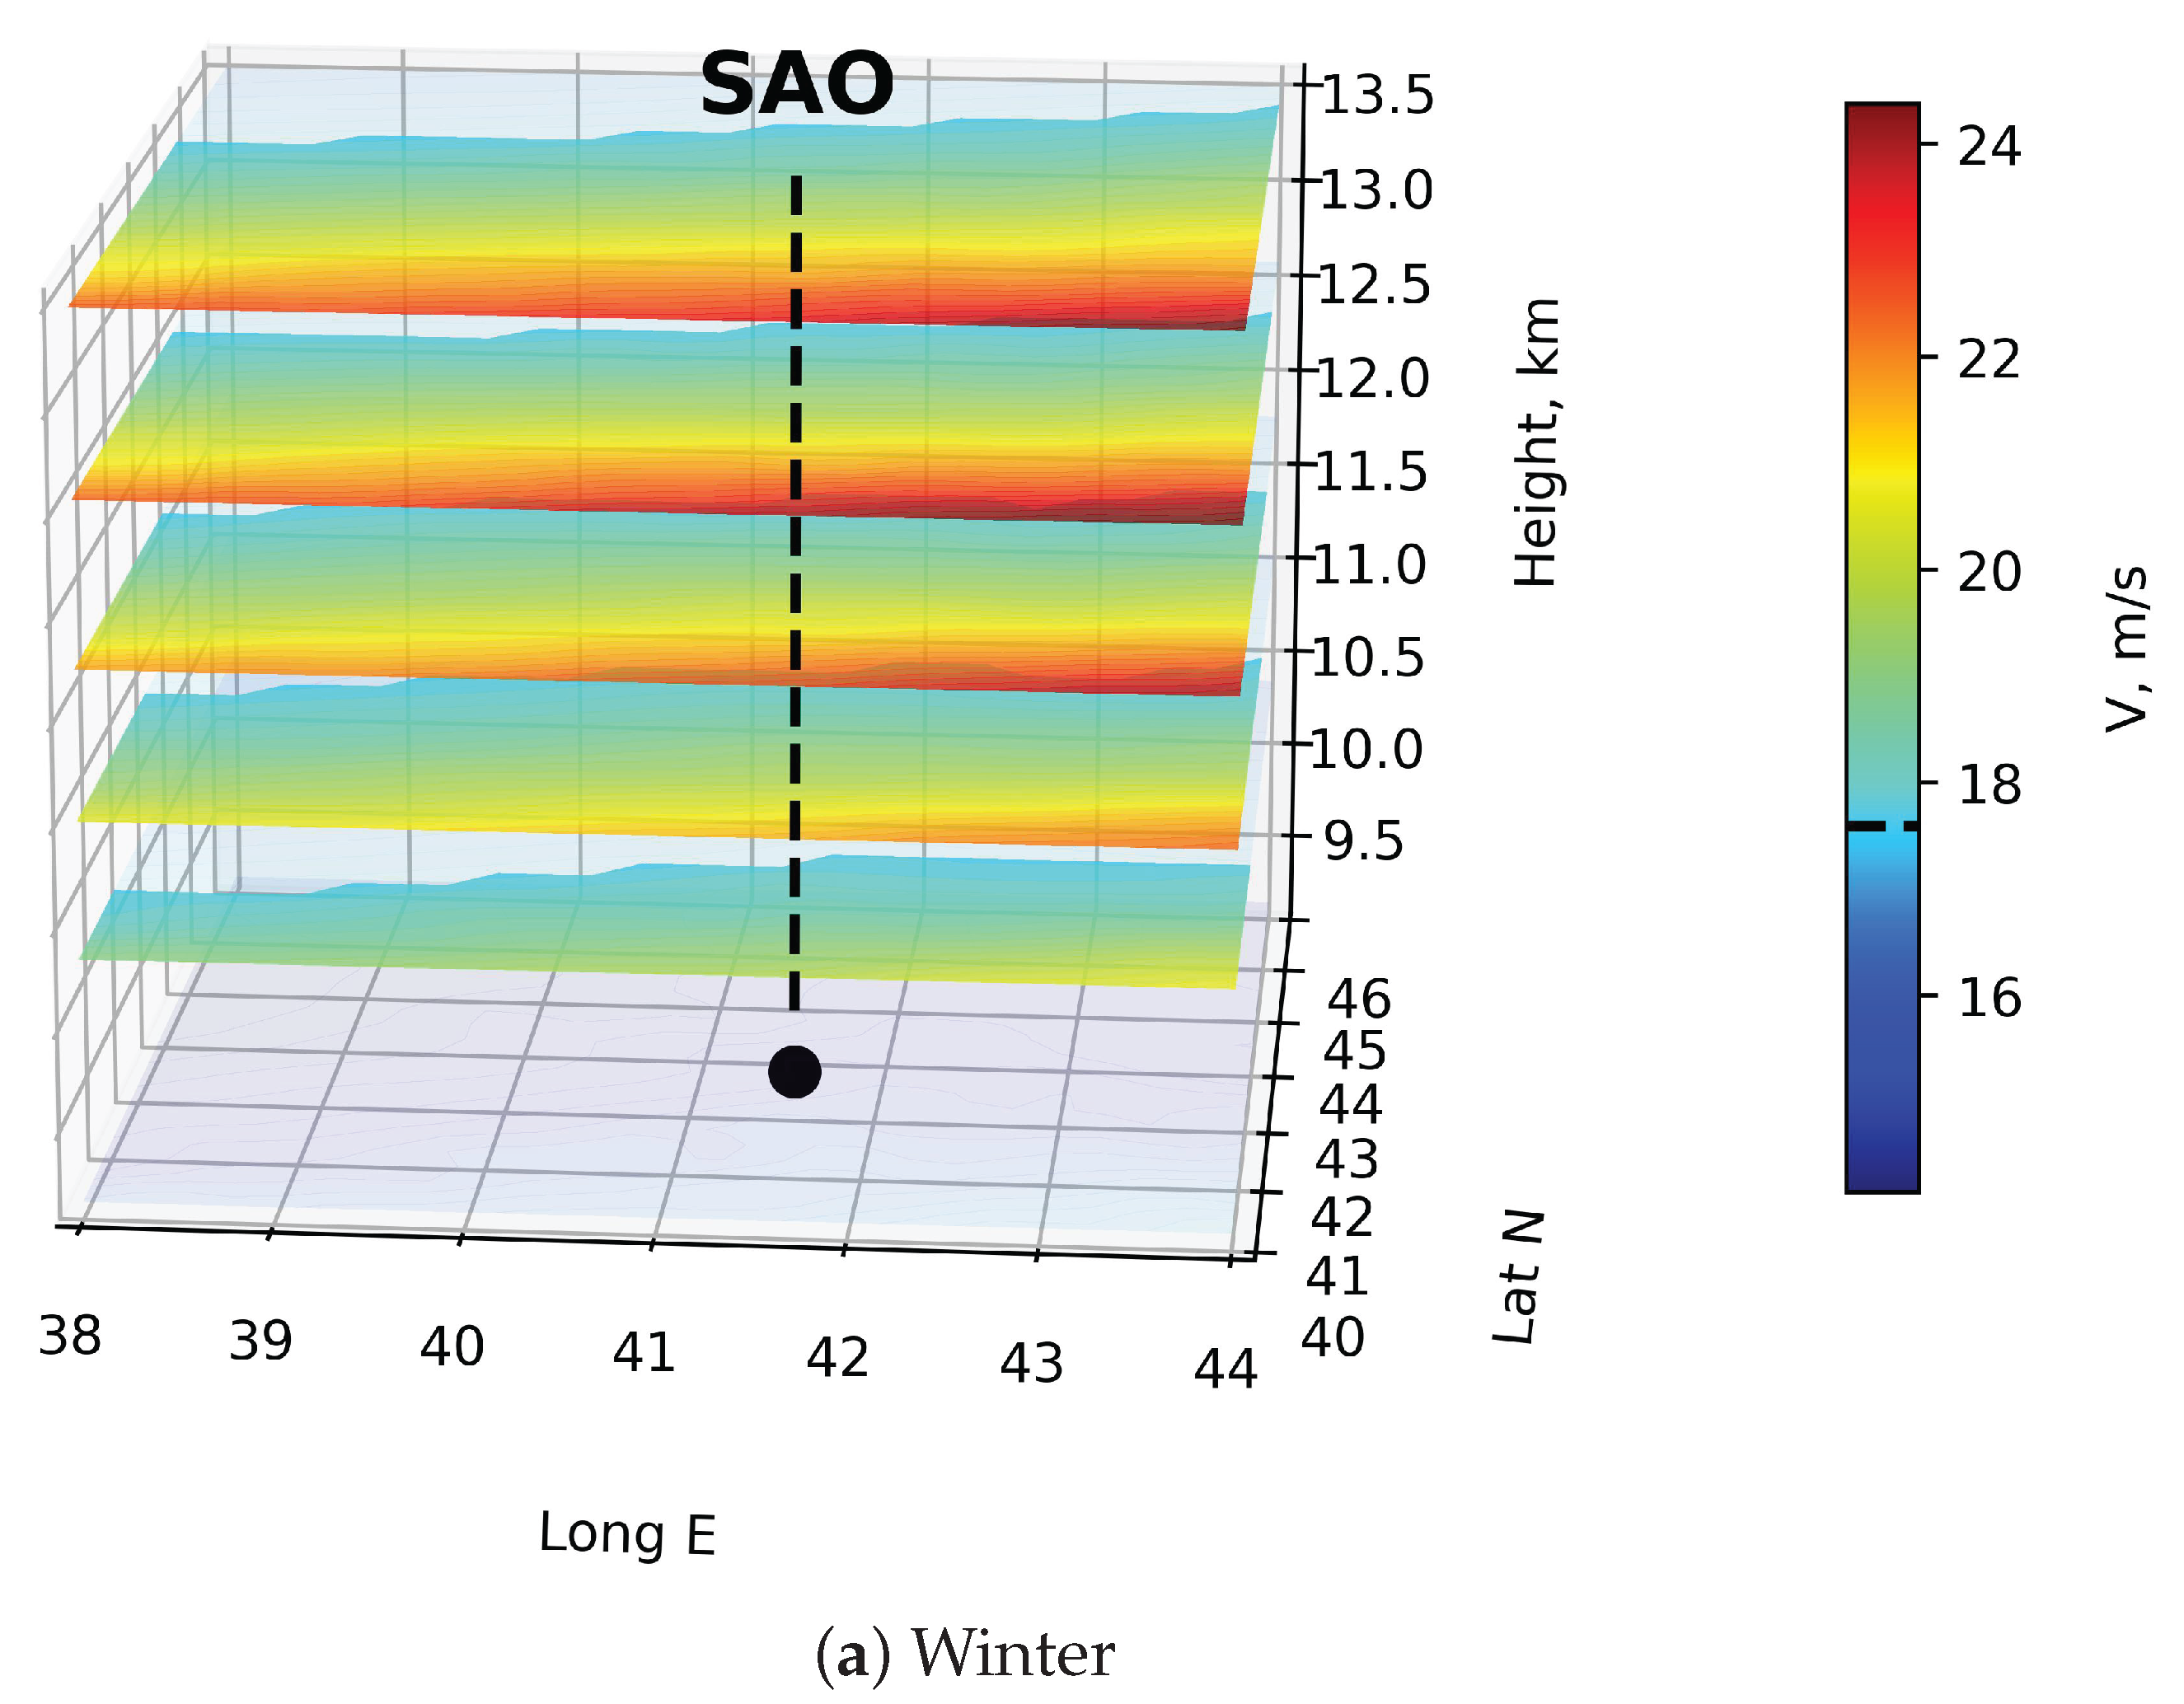
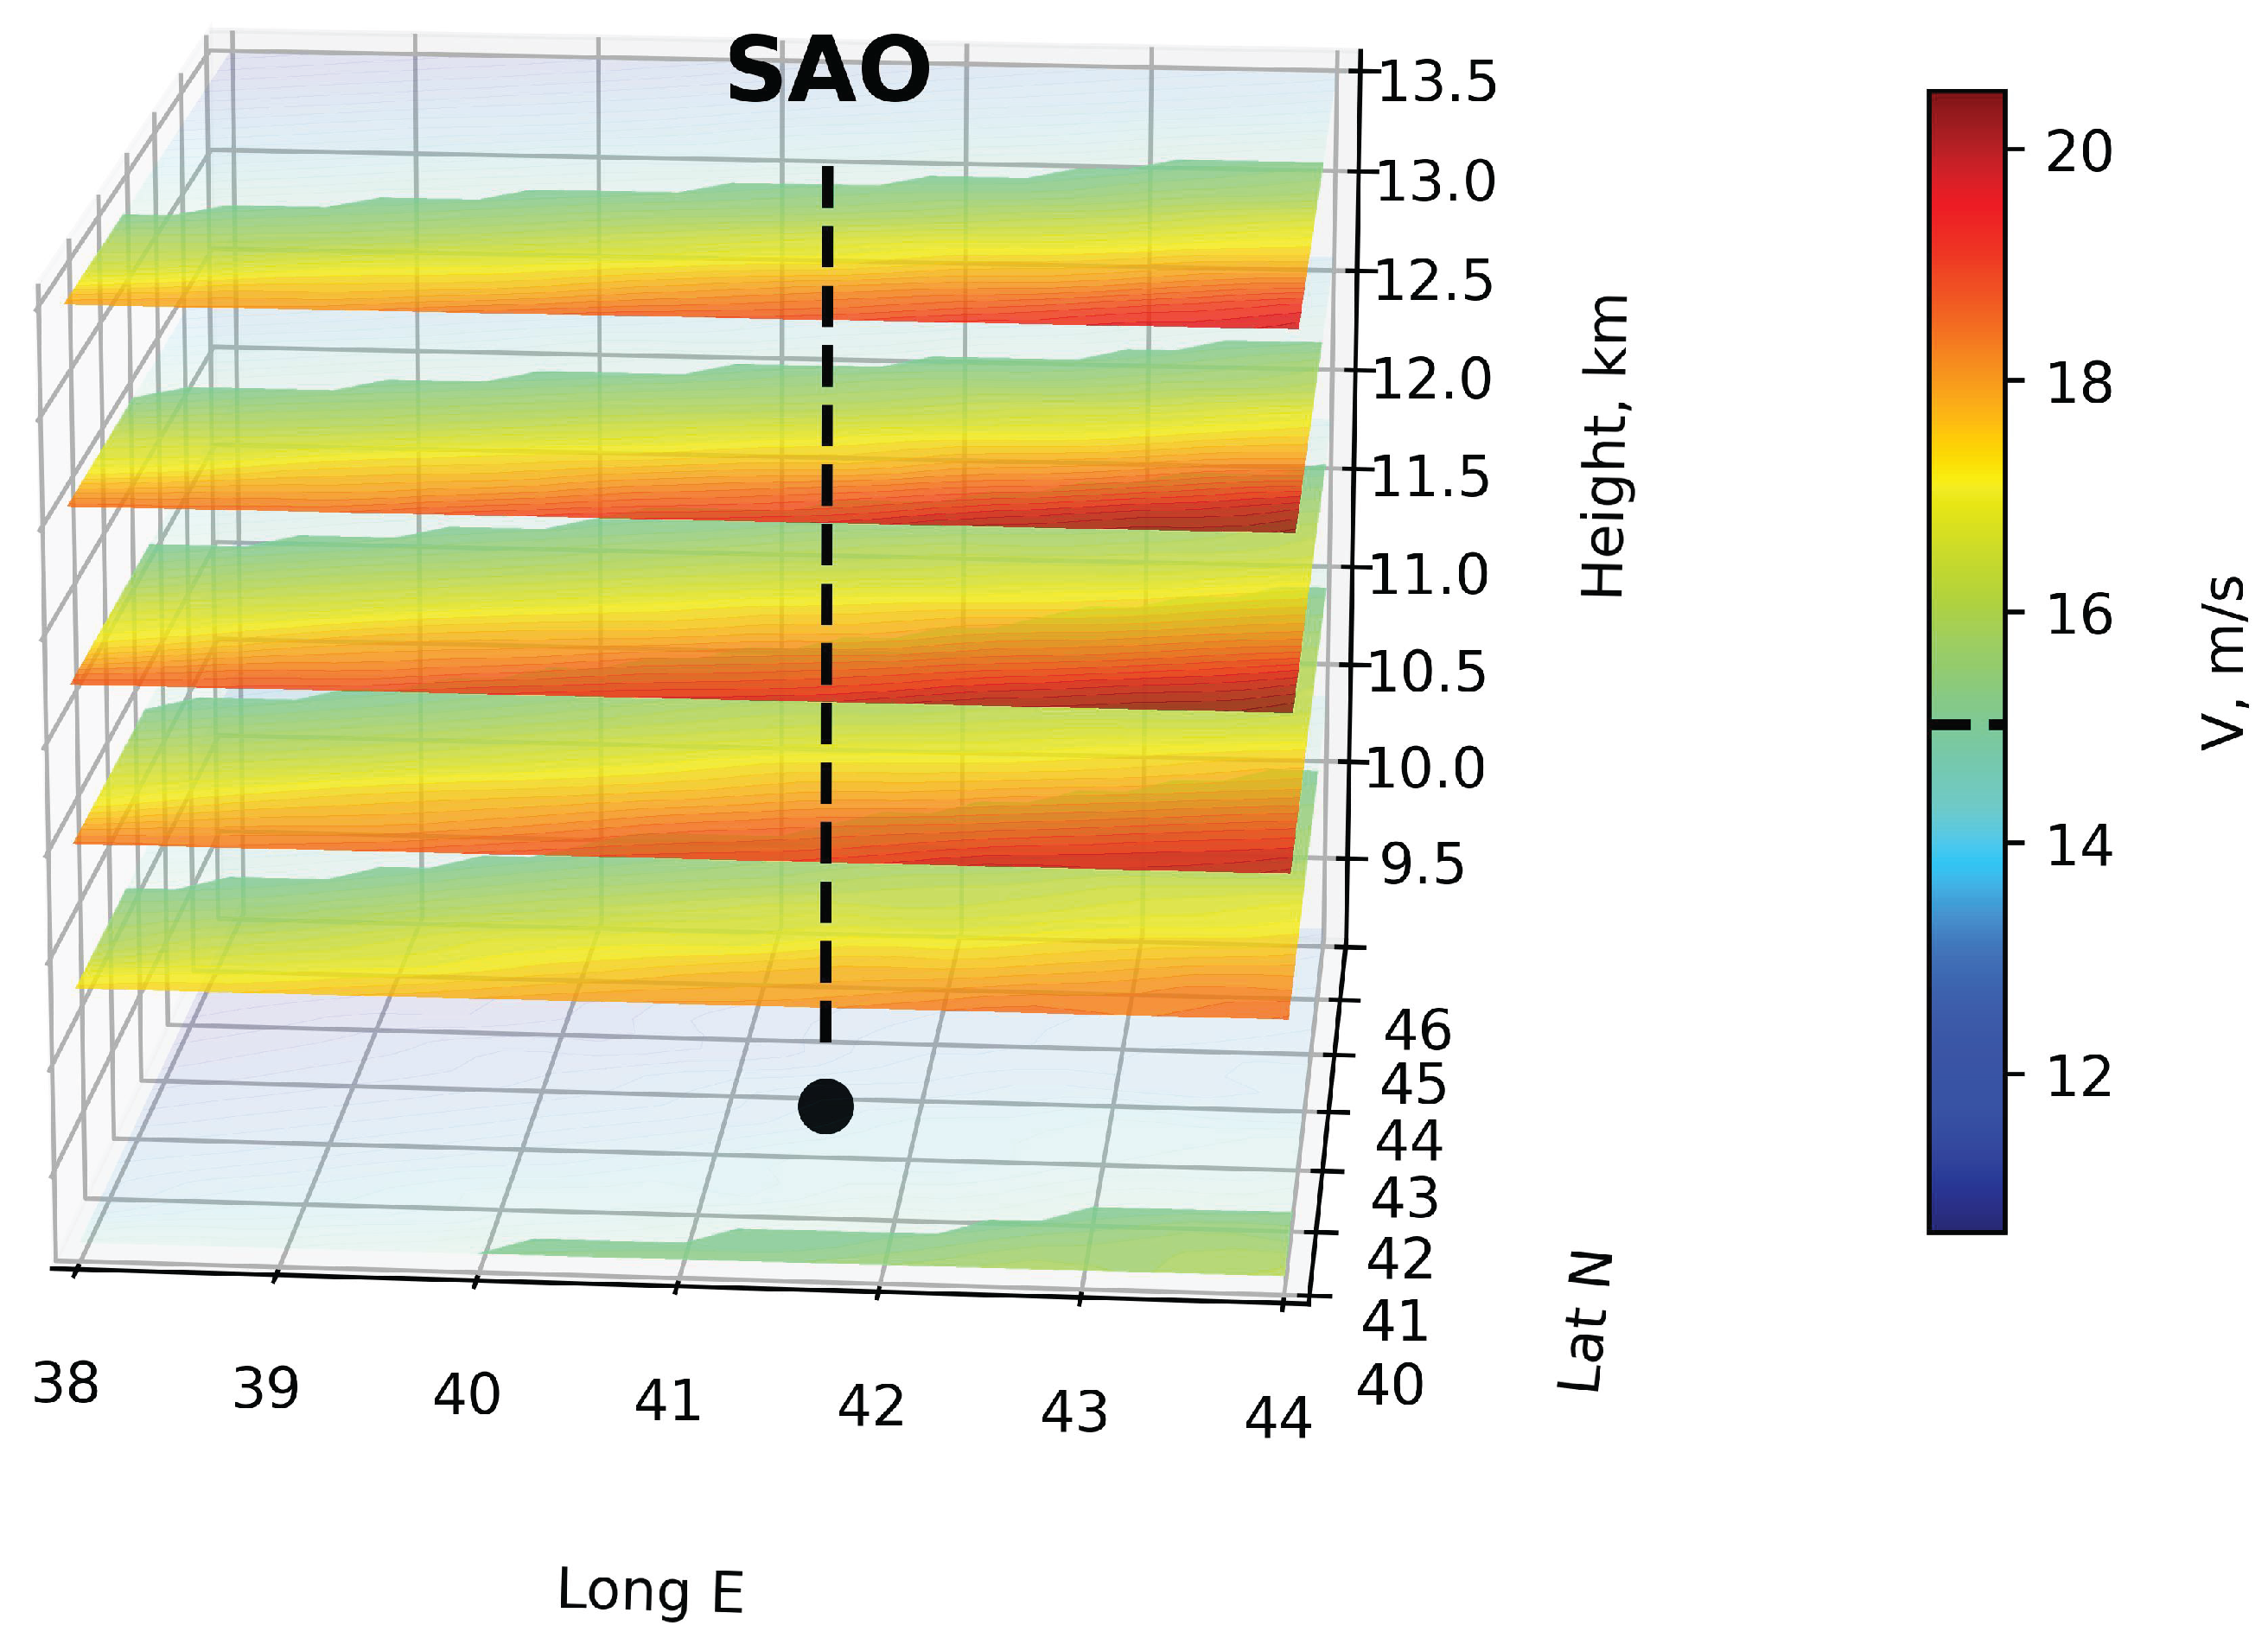
Figure 2.
Same as Figure 1 but for summer and autumn, respectively.
Figure 2.
Same as Figure 1 but for summer and autumn, respectively.
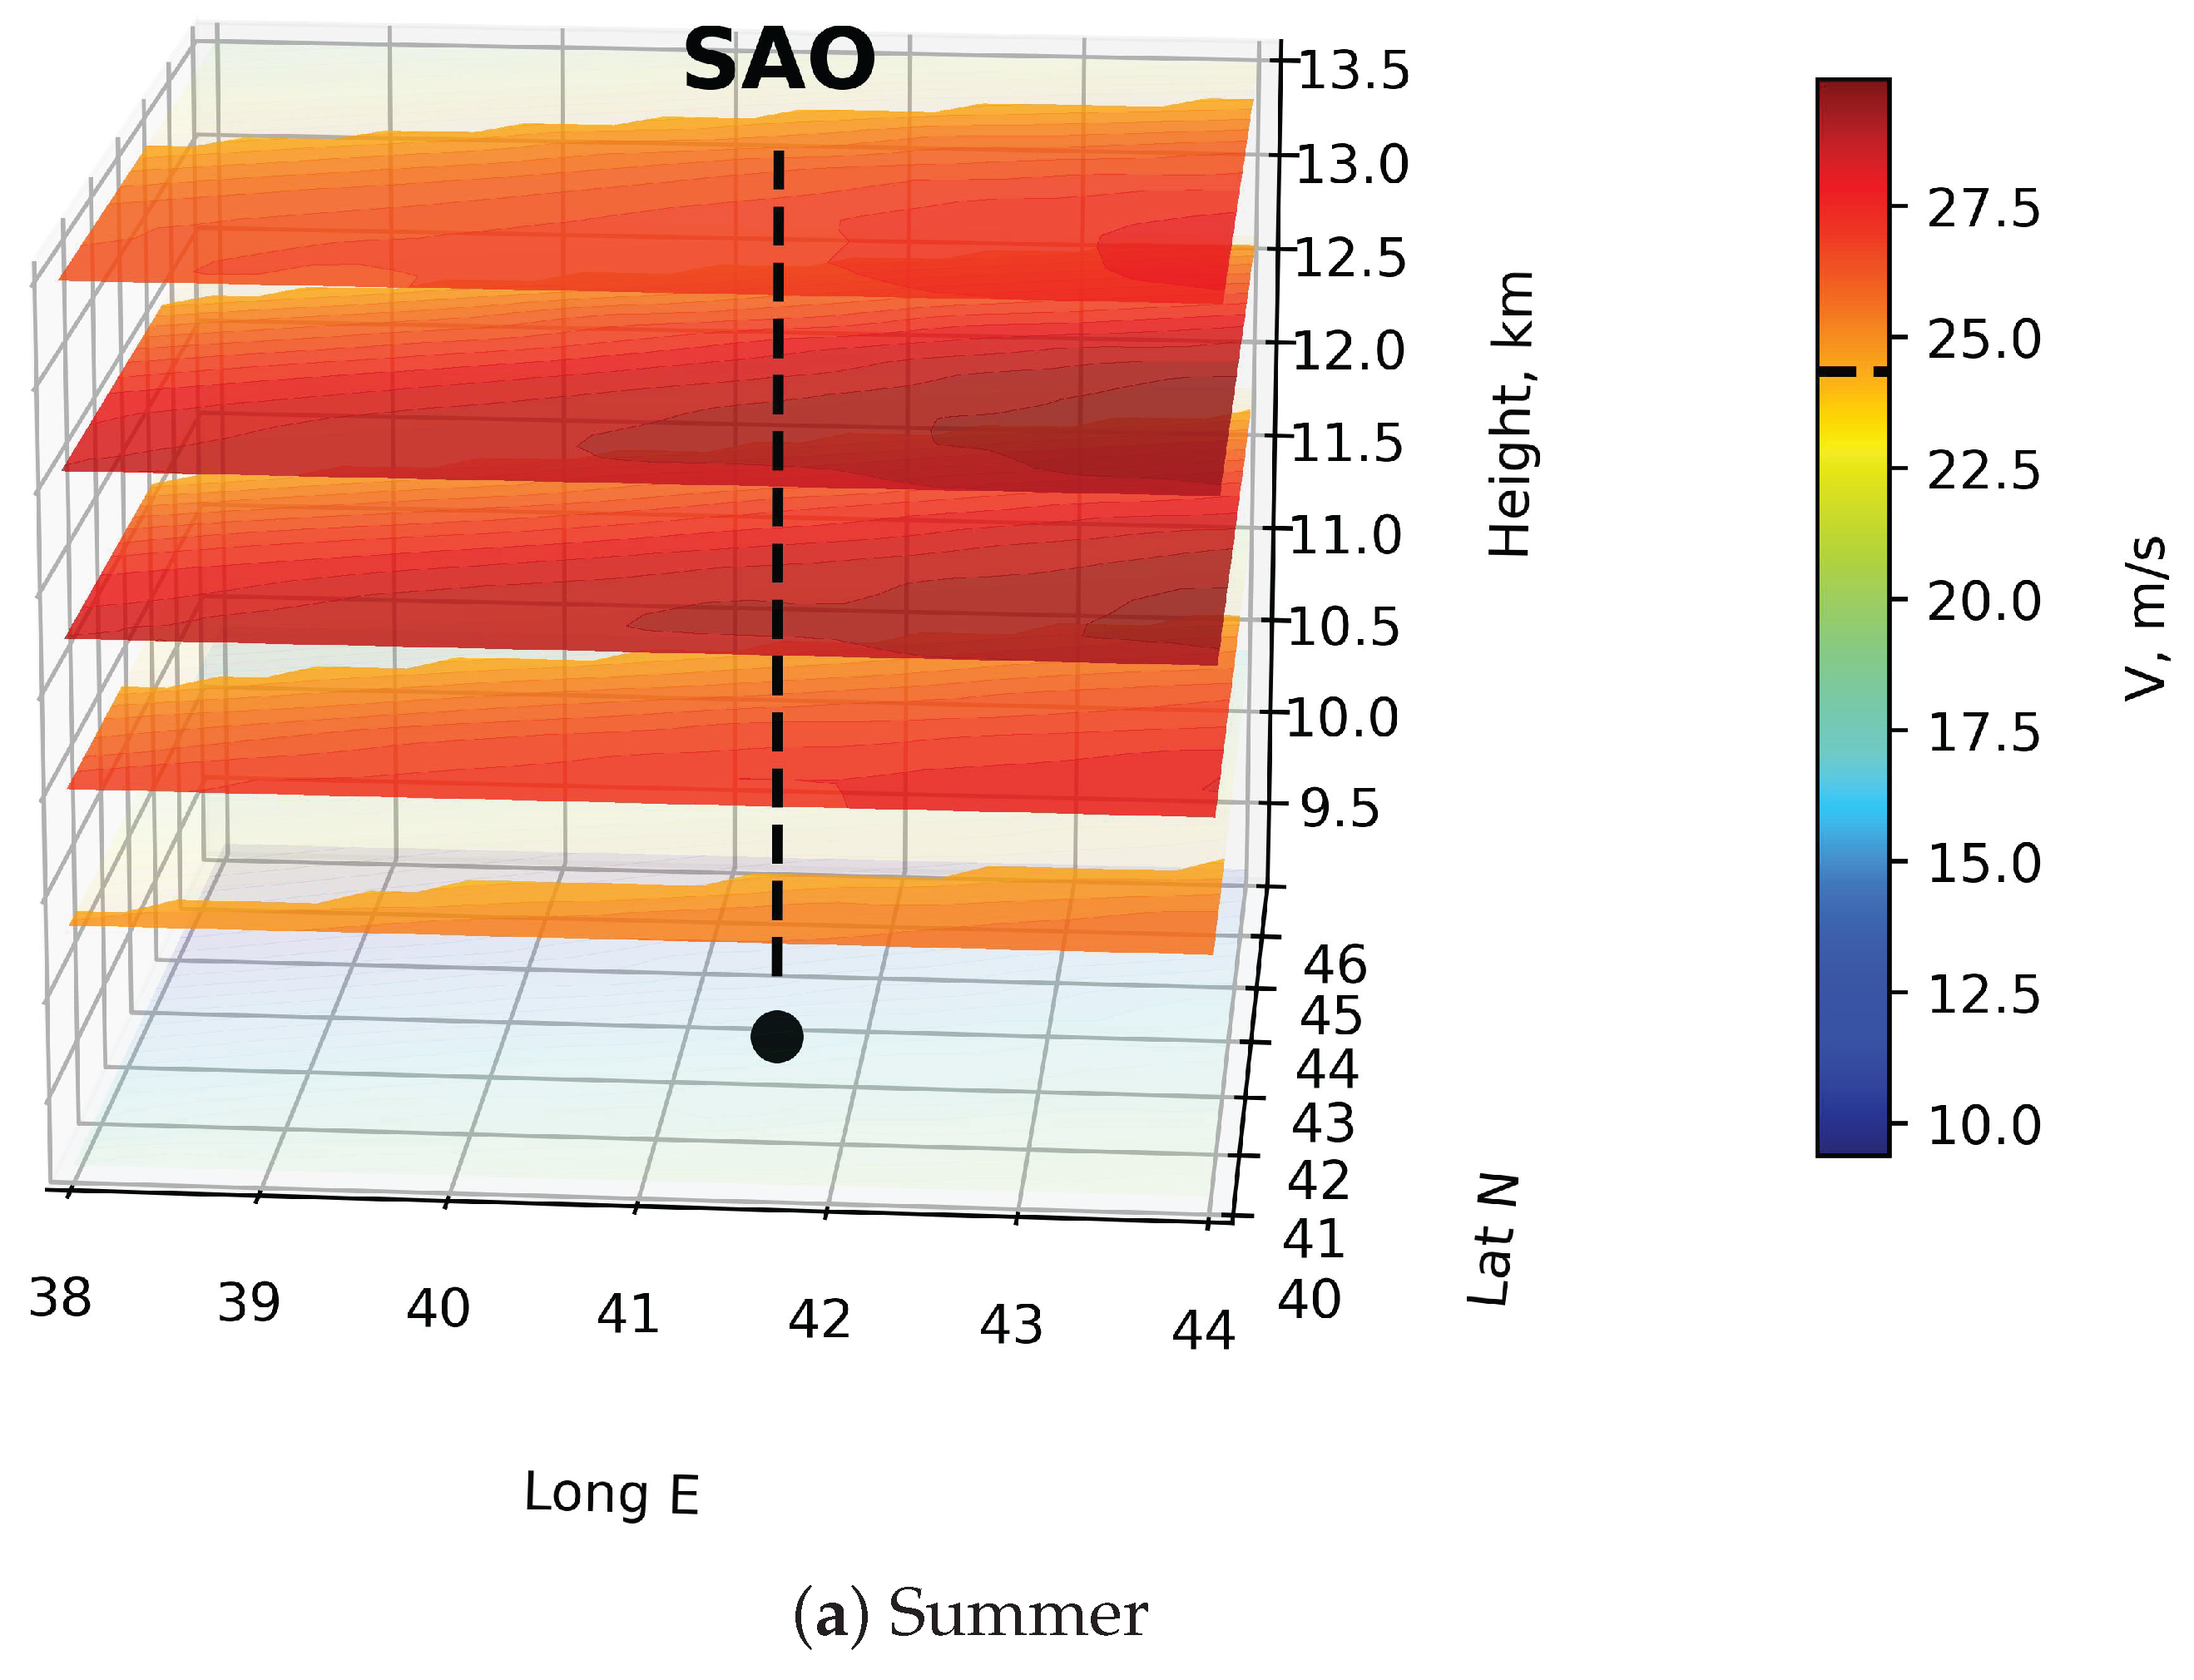
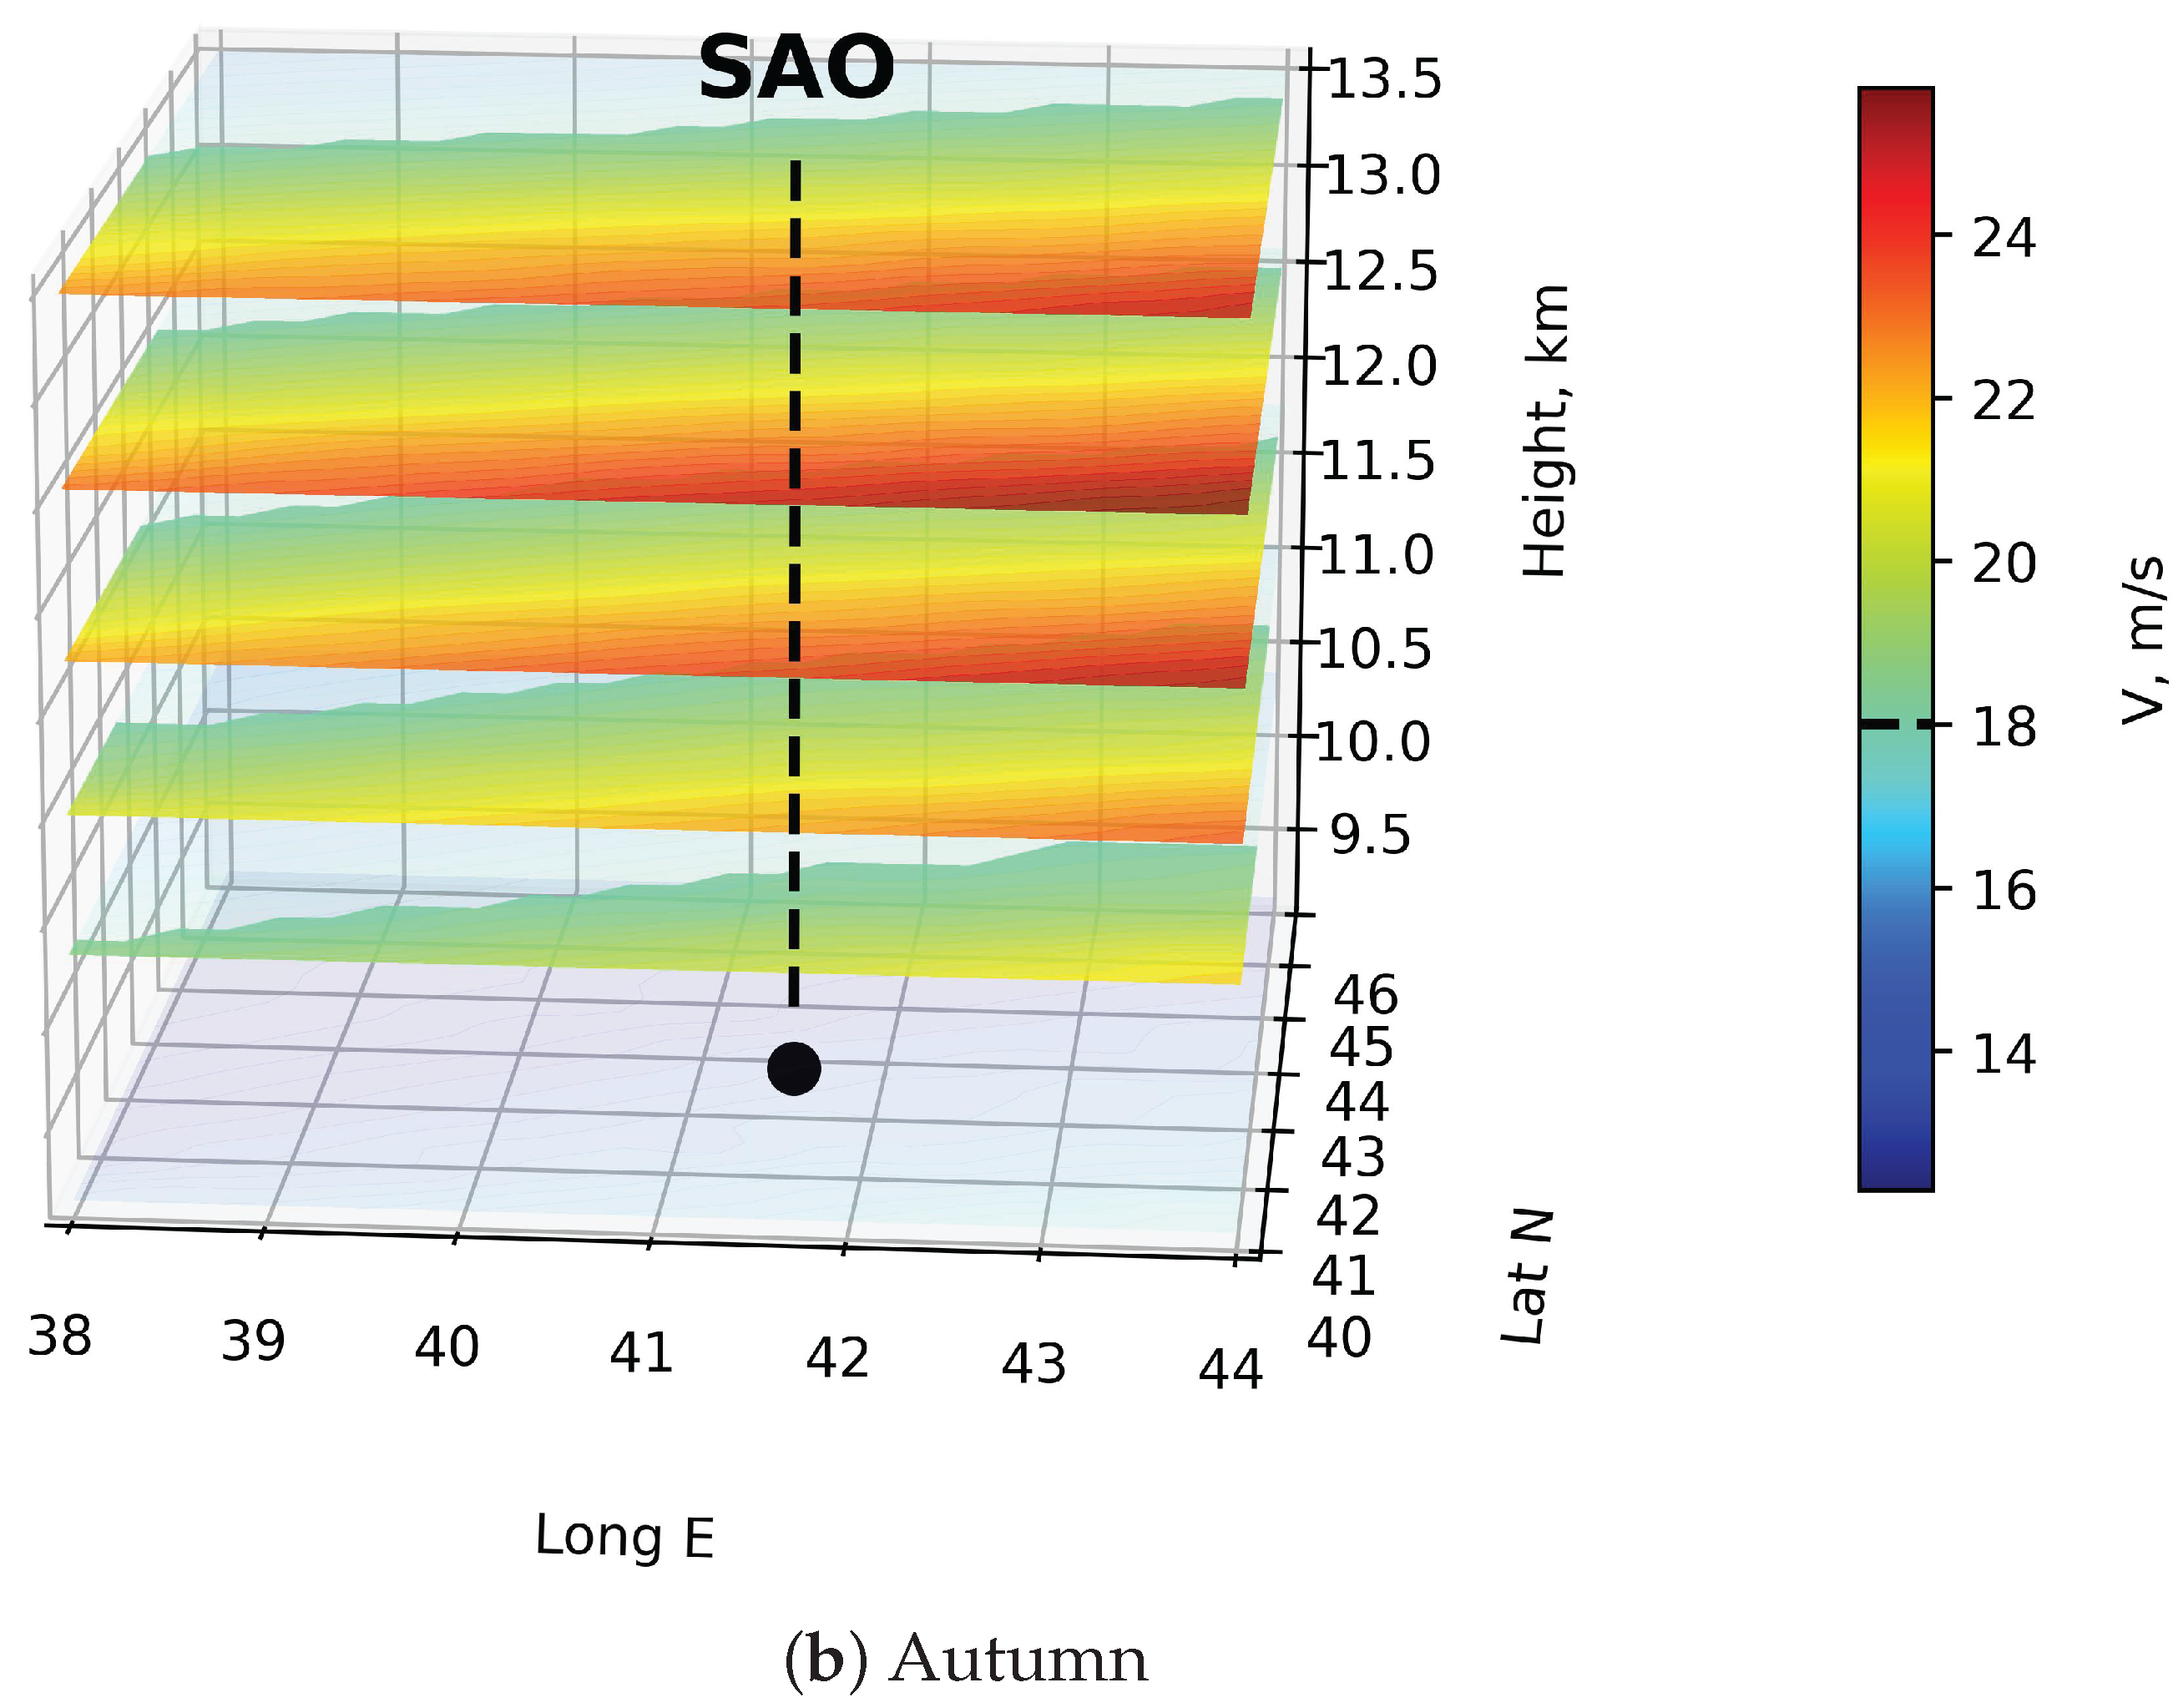
Figure 3.
Distributions of atmospheric vorticity above Special astrophysical observatory, 2016–2025.
Figure 3.
Distributions of atmospheric vorticity above Special astrophysical observatory, 2016–2025.
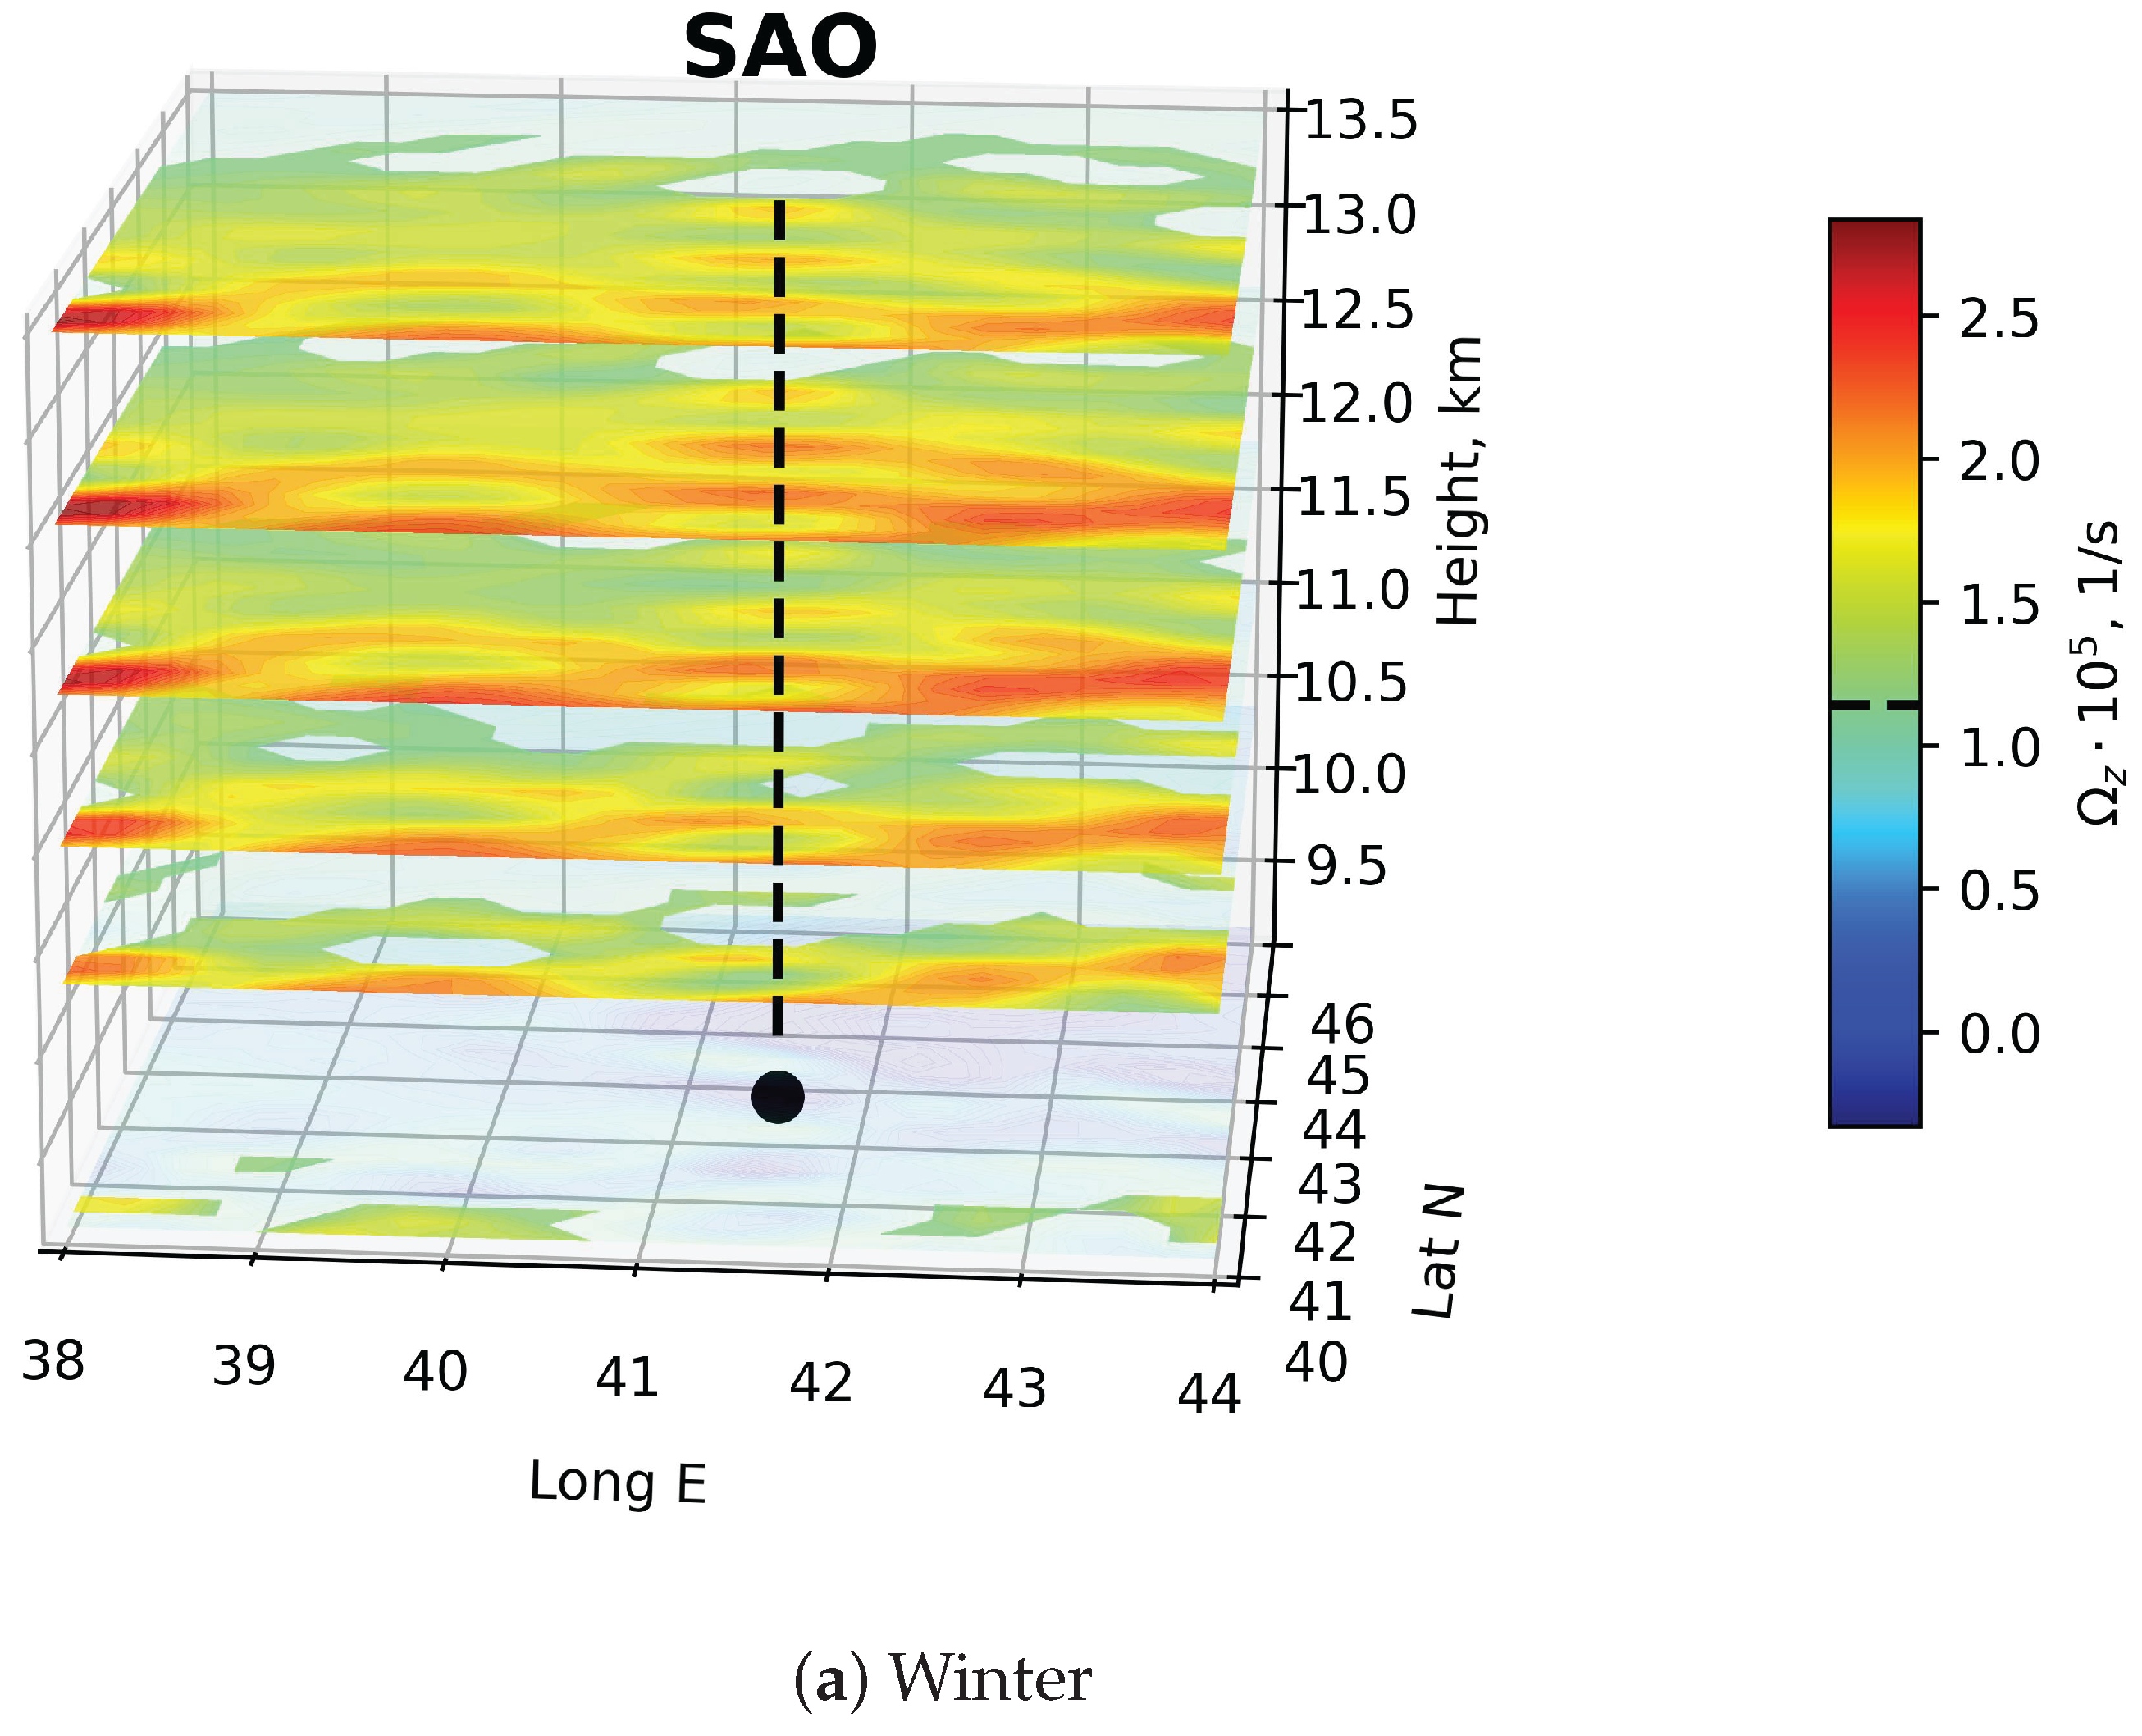
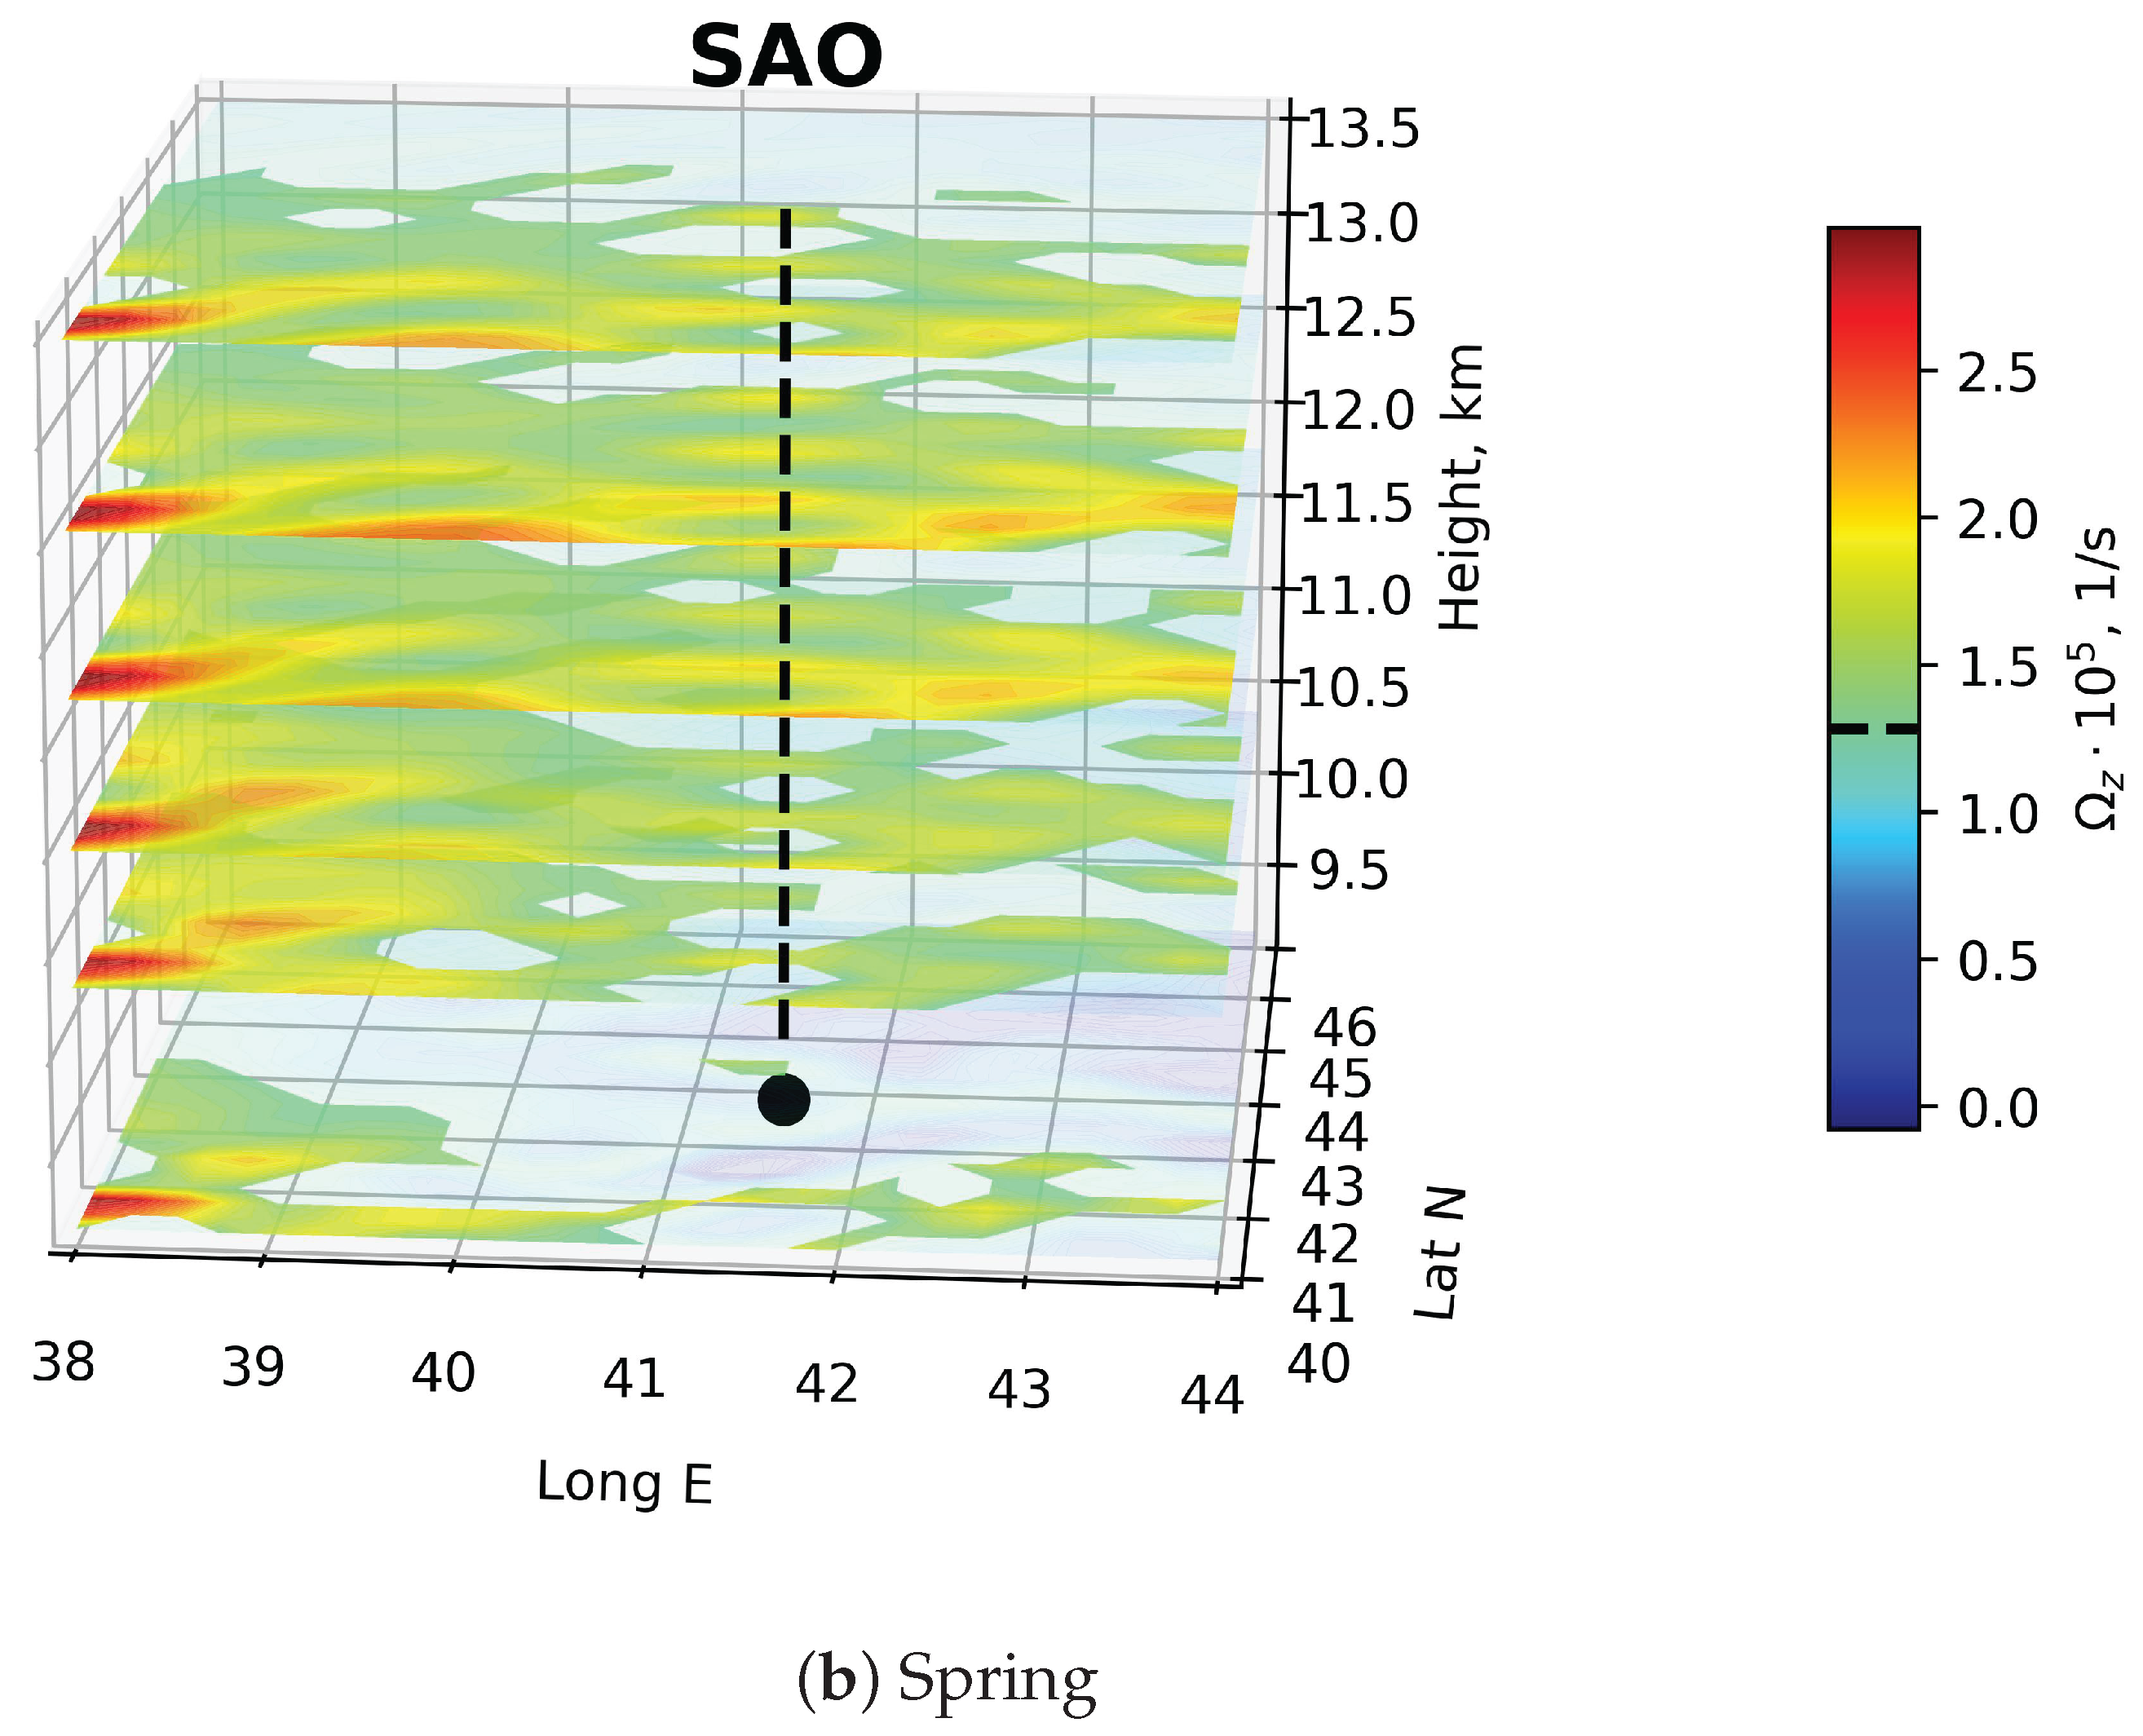
Figure 4.
Same as Figure 3 but for summer and autumn, respectively.
Figure 4.
Same as Figure 3 but for summer and autumn, respectively.
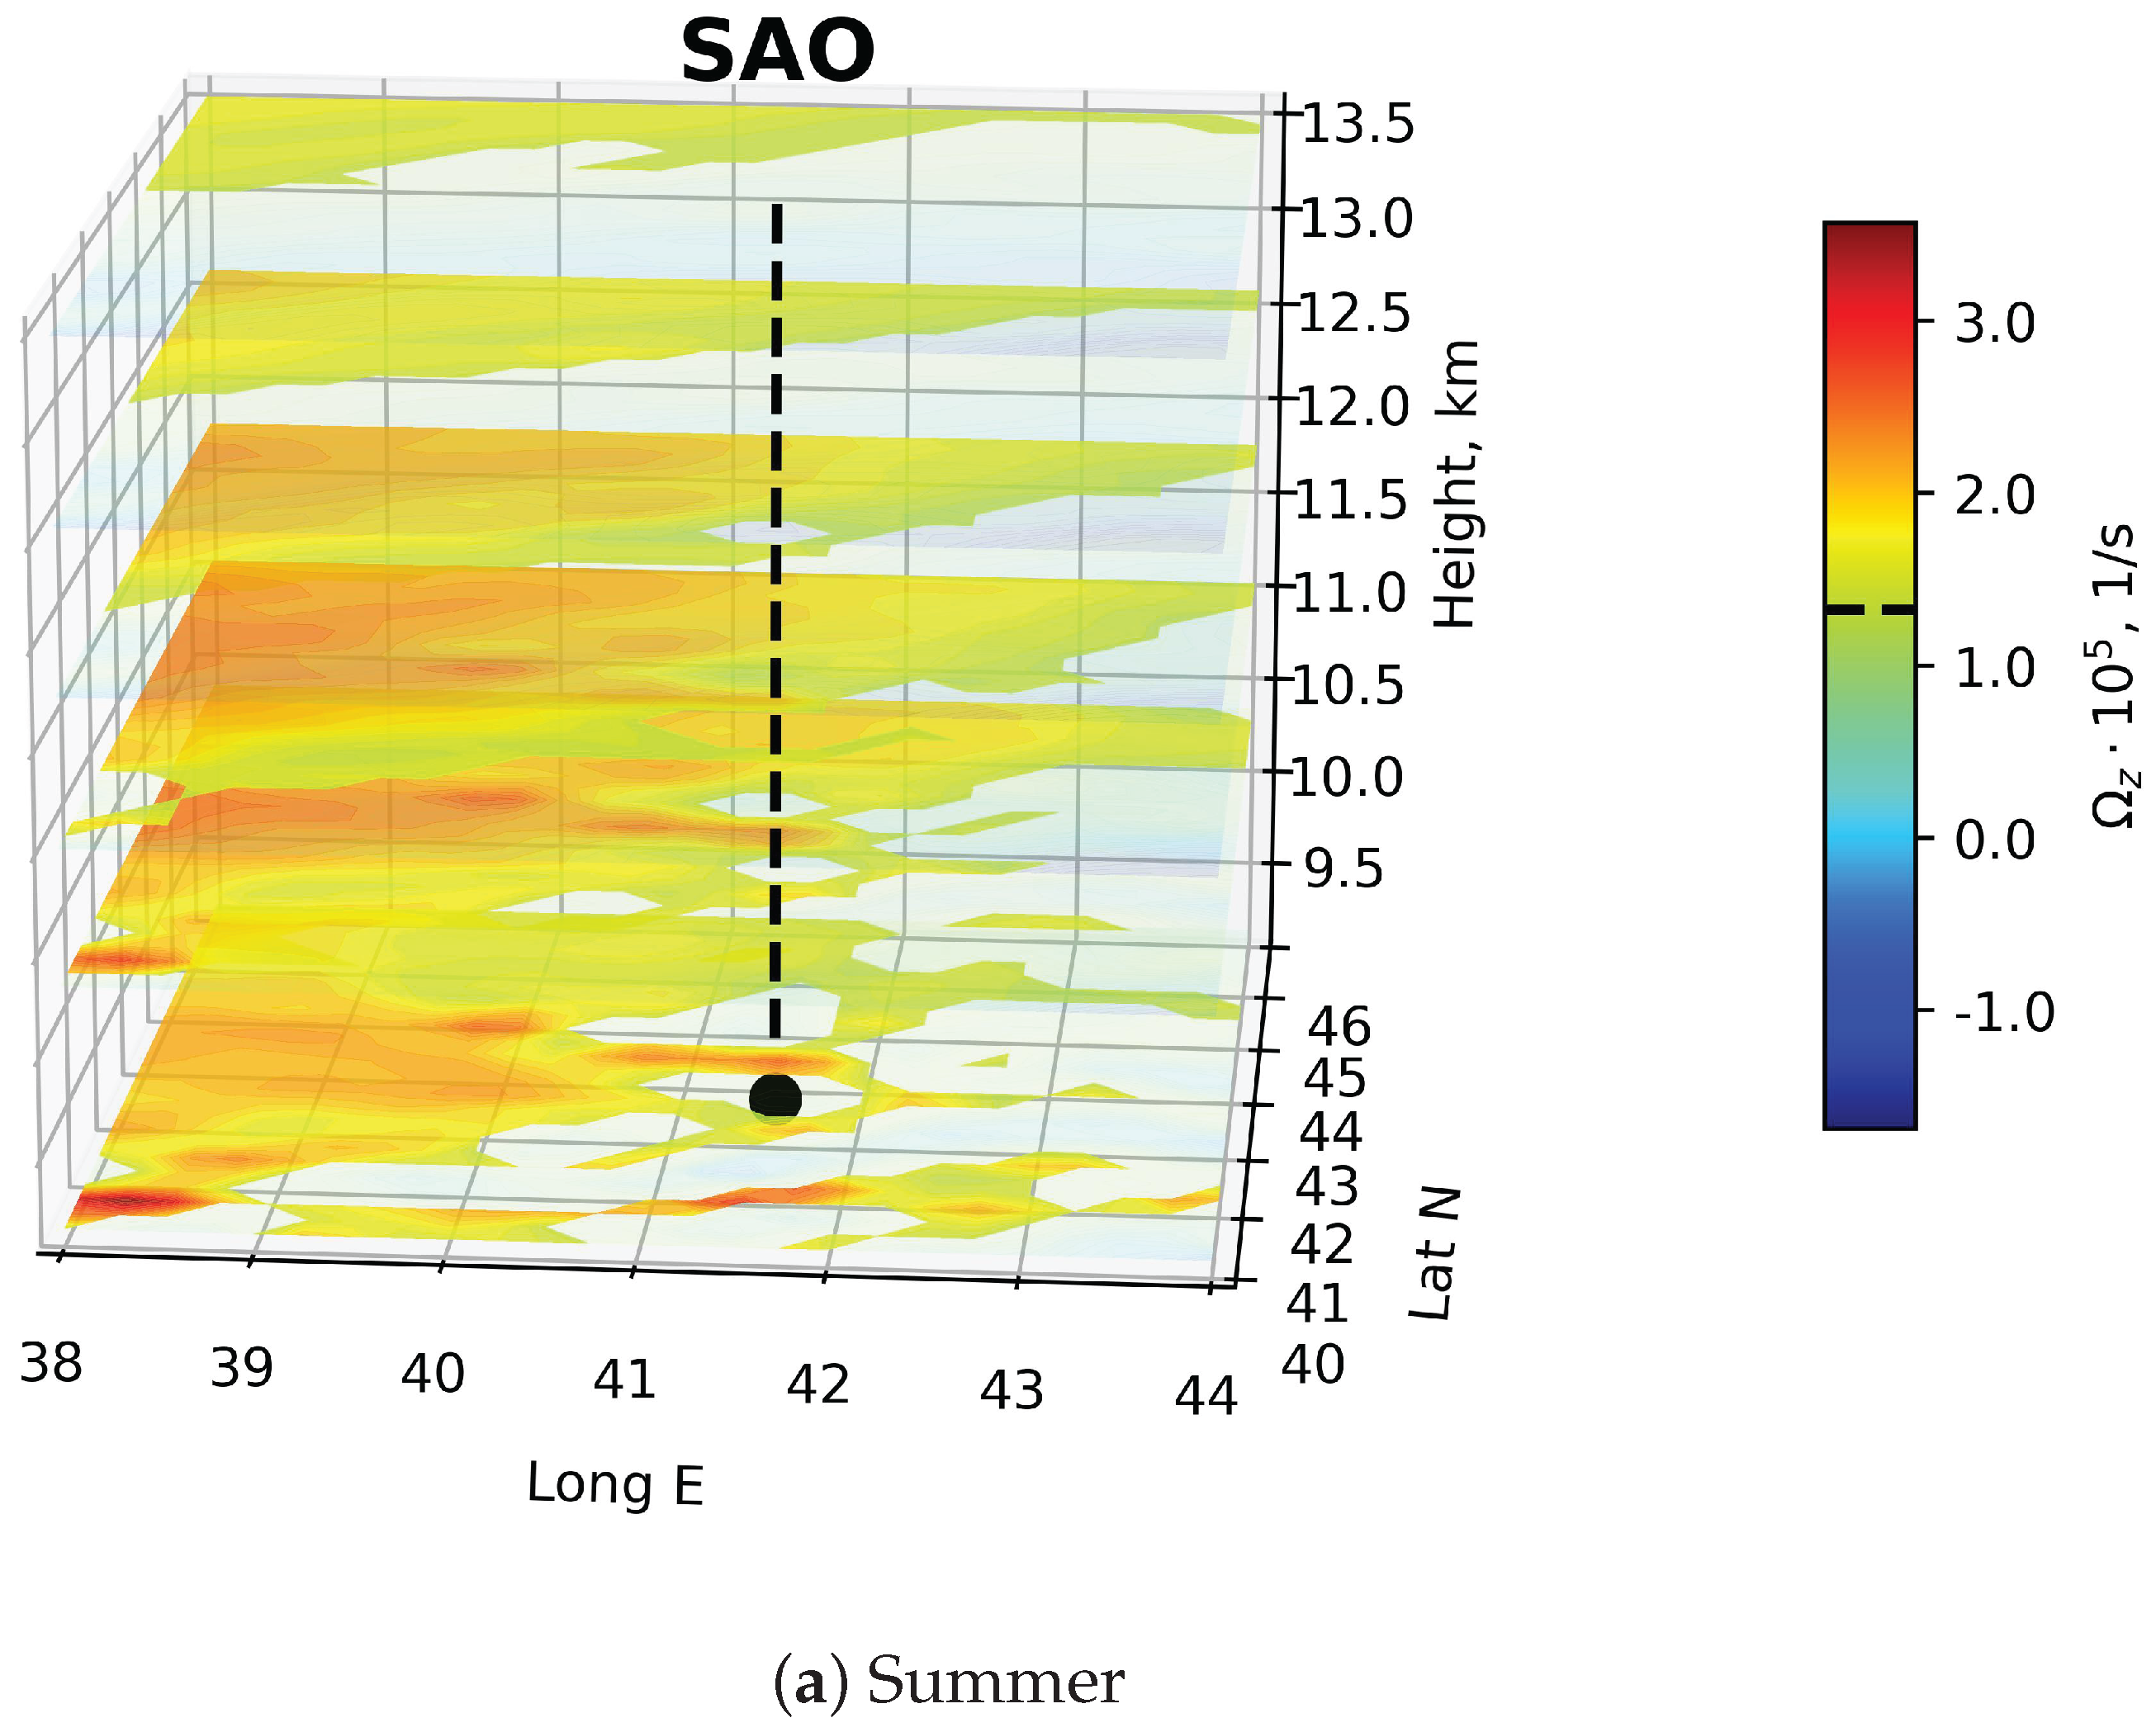
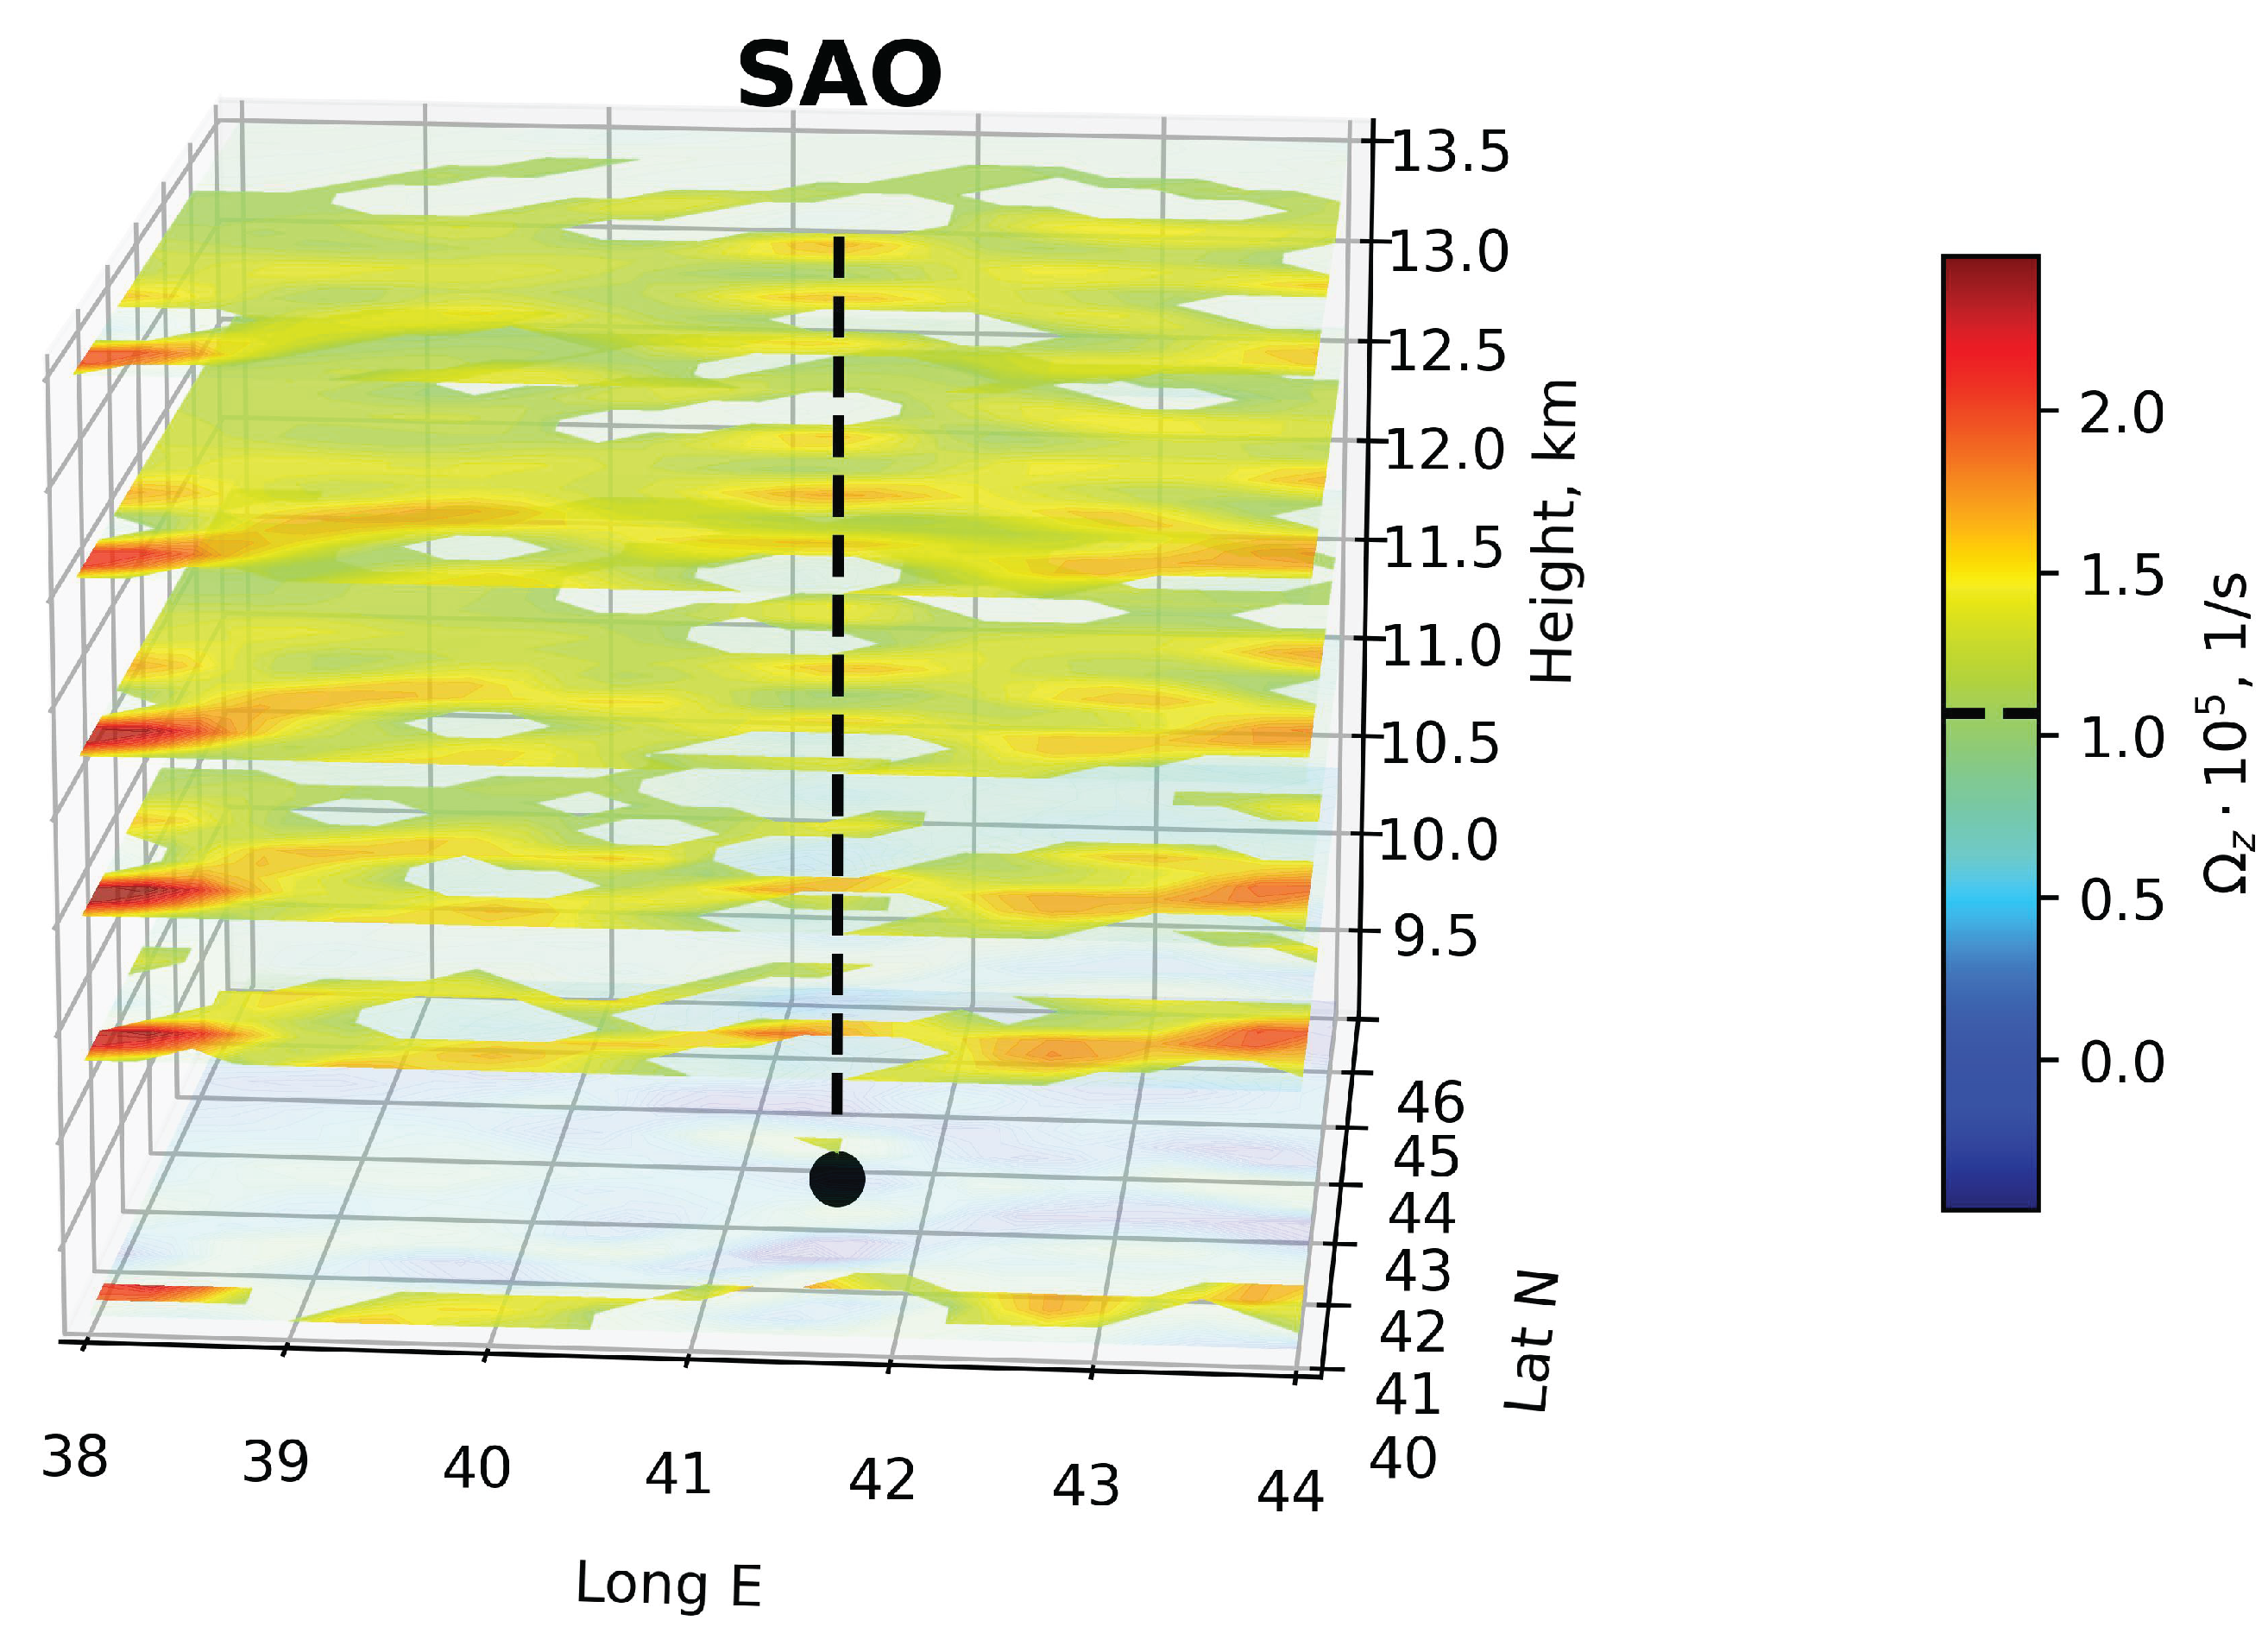
Figure 5.
Vertical changes in wind speed trends over the observatory and time series of wind speed at the 200 hPa level from 2016 to 2025. Red markers correspond to statistically significant trends. Black lines correspond to smoothed data. Red lines indicate the linear regressions.
Figure 5.
Vertical changes in wind speed trends over the observatory and time series of wind speed at the 200 hPa level from 2016 to 2025. Red markers correspond to statistically significant trends. Black lines correspond to smoothed data. Red lines indicate the linear regressions.
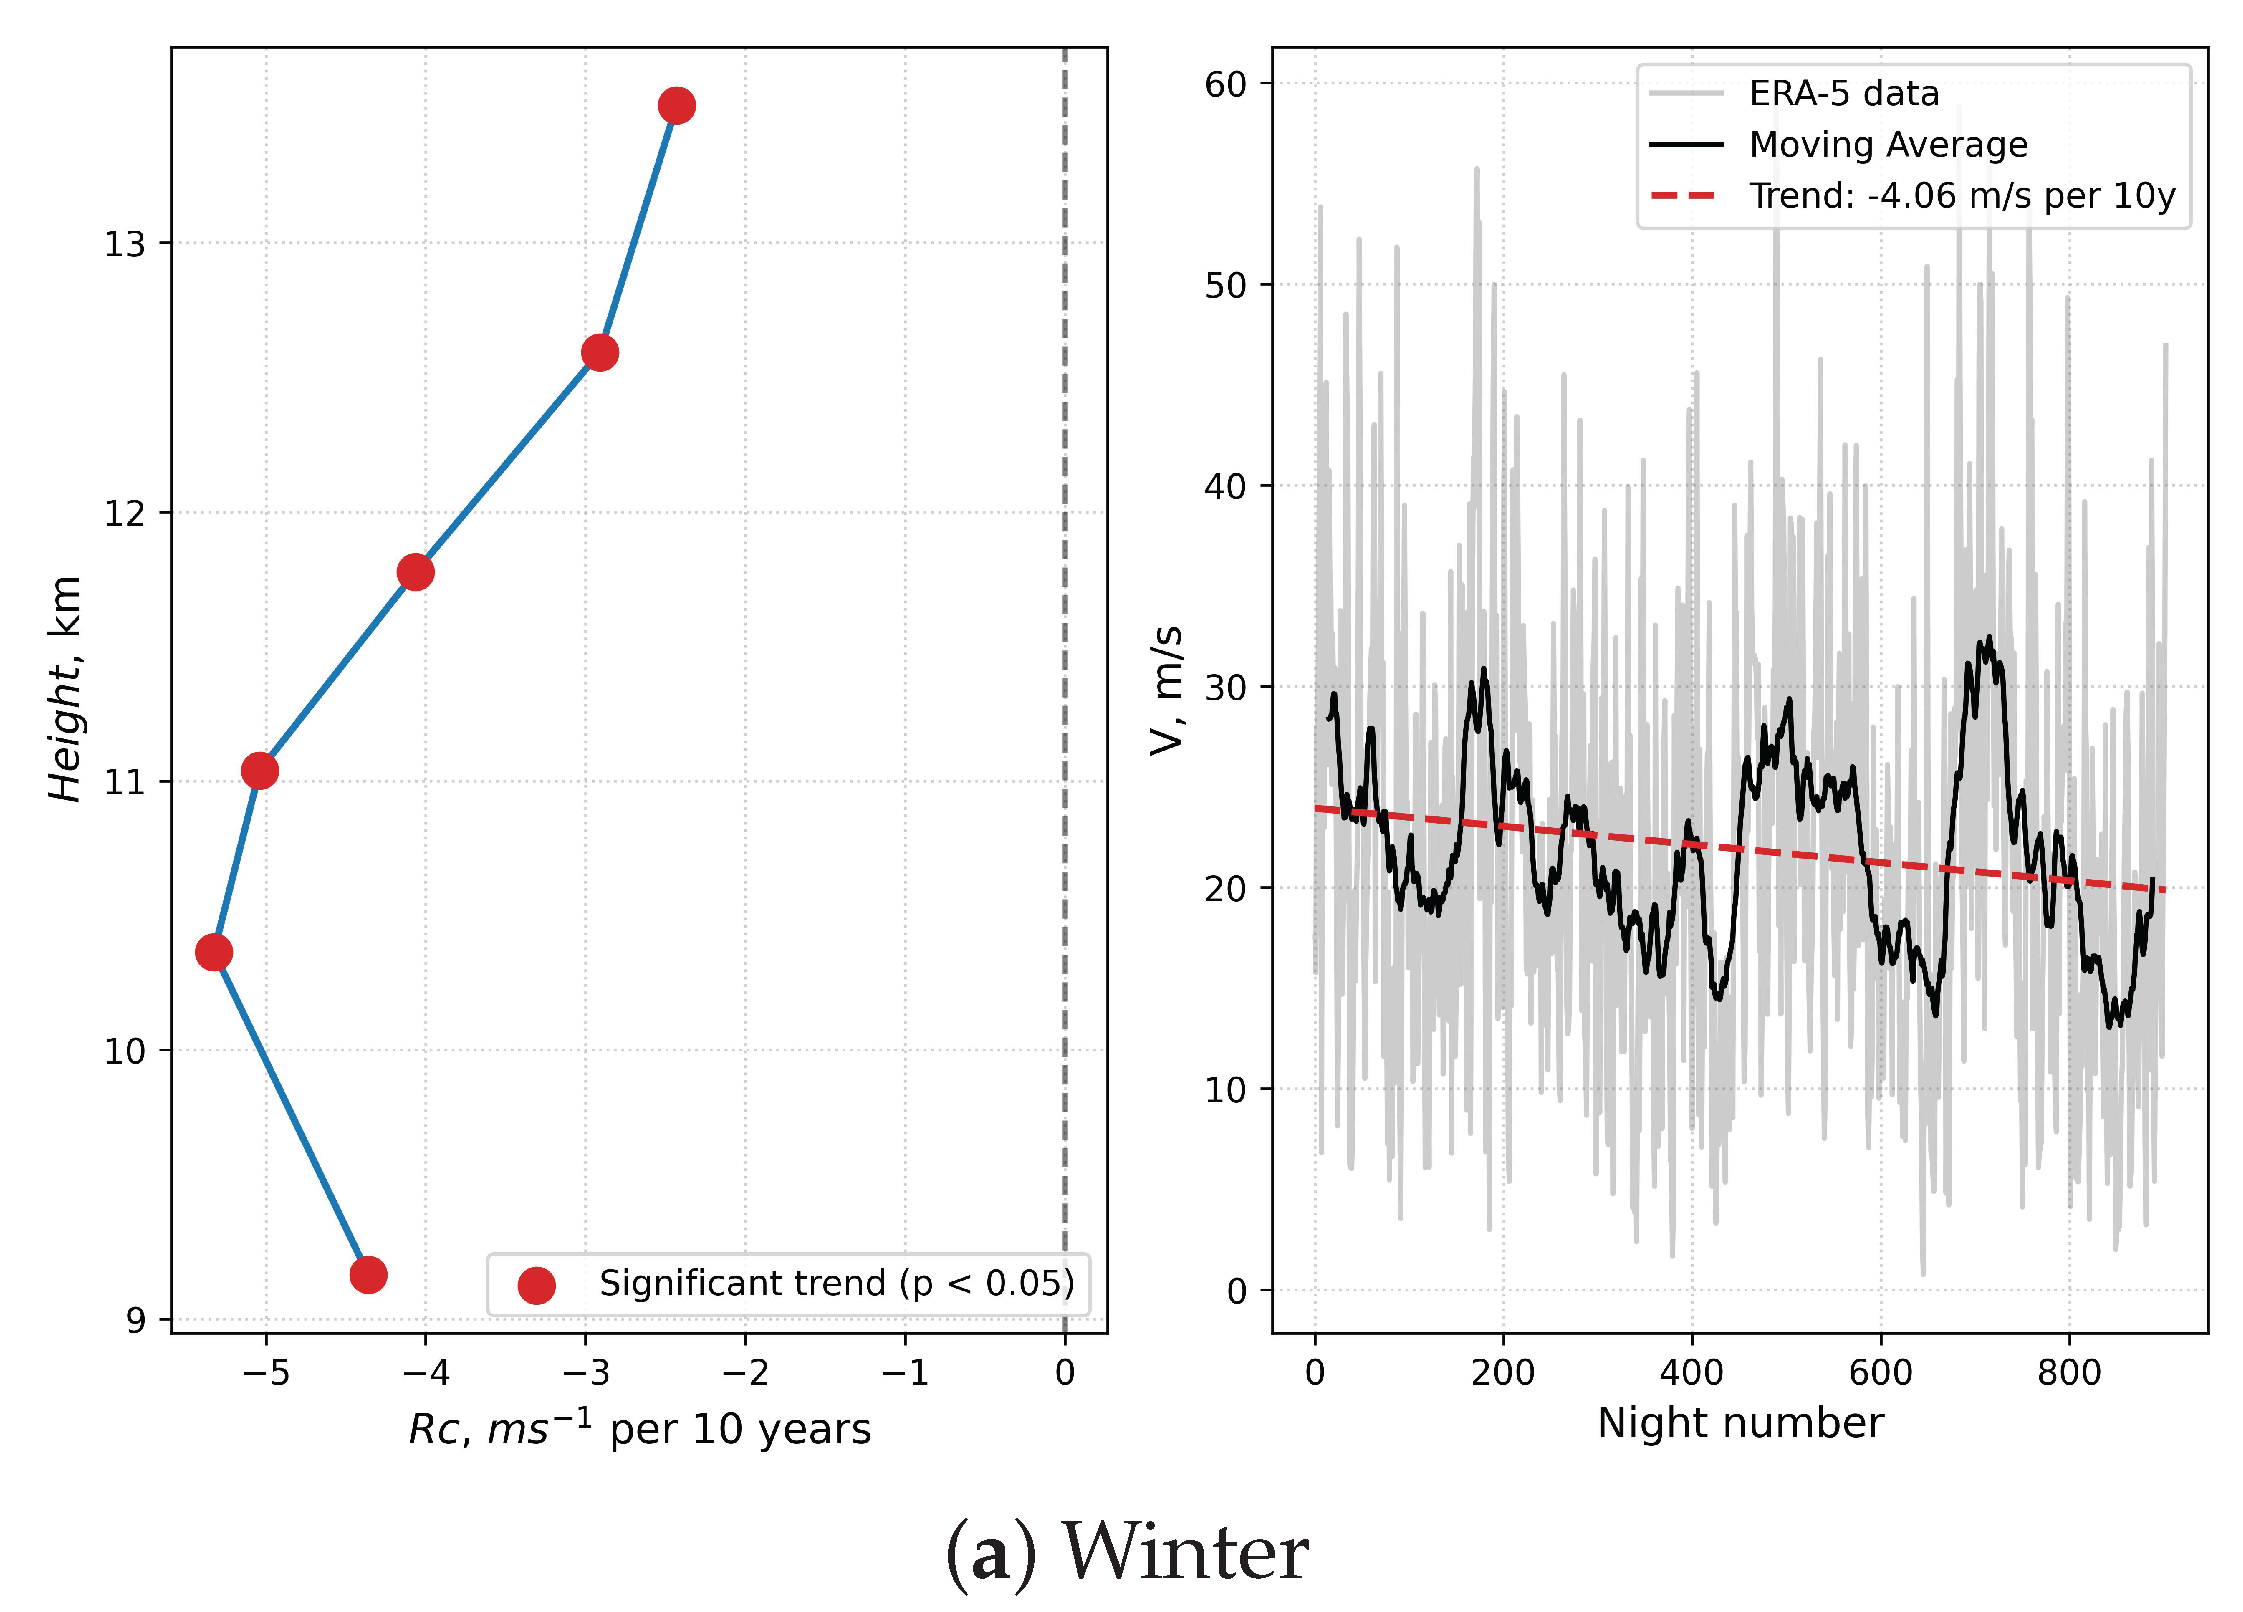
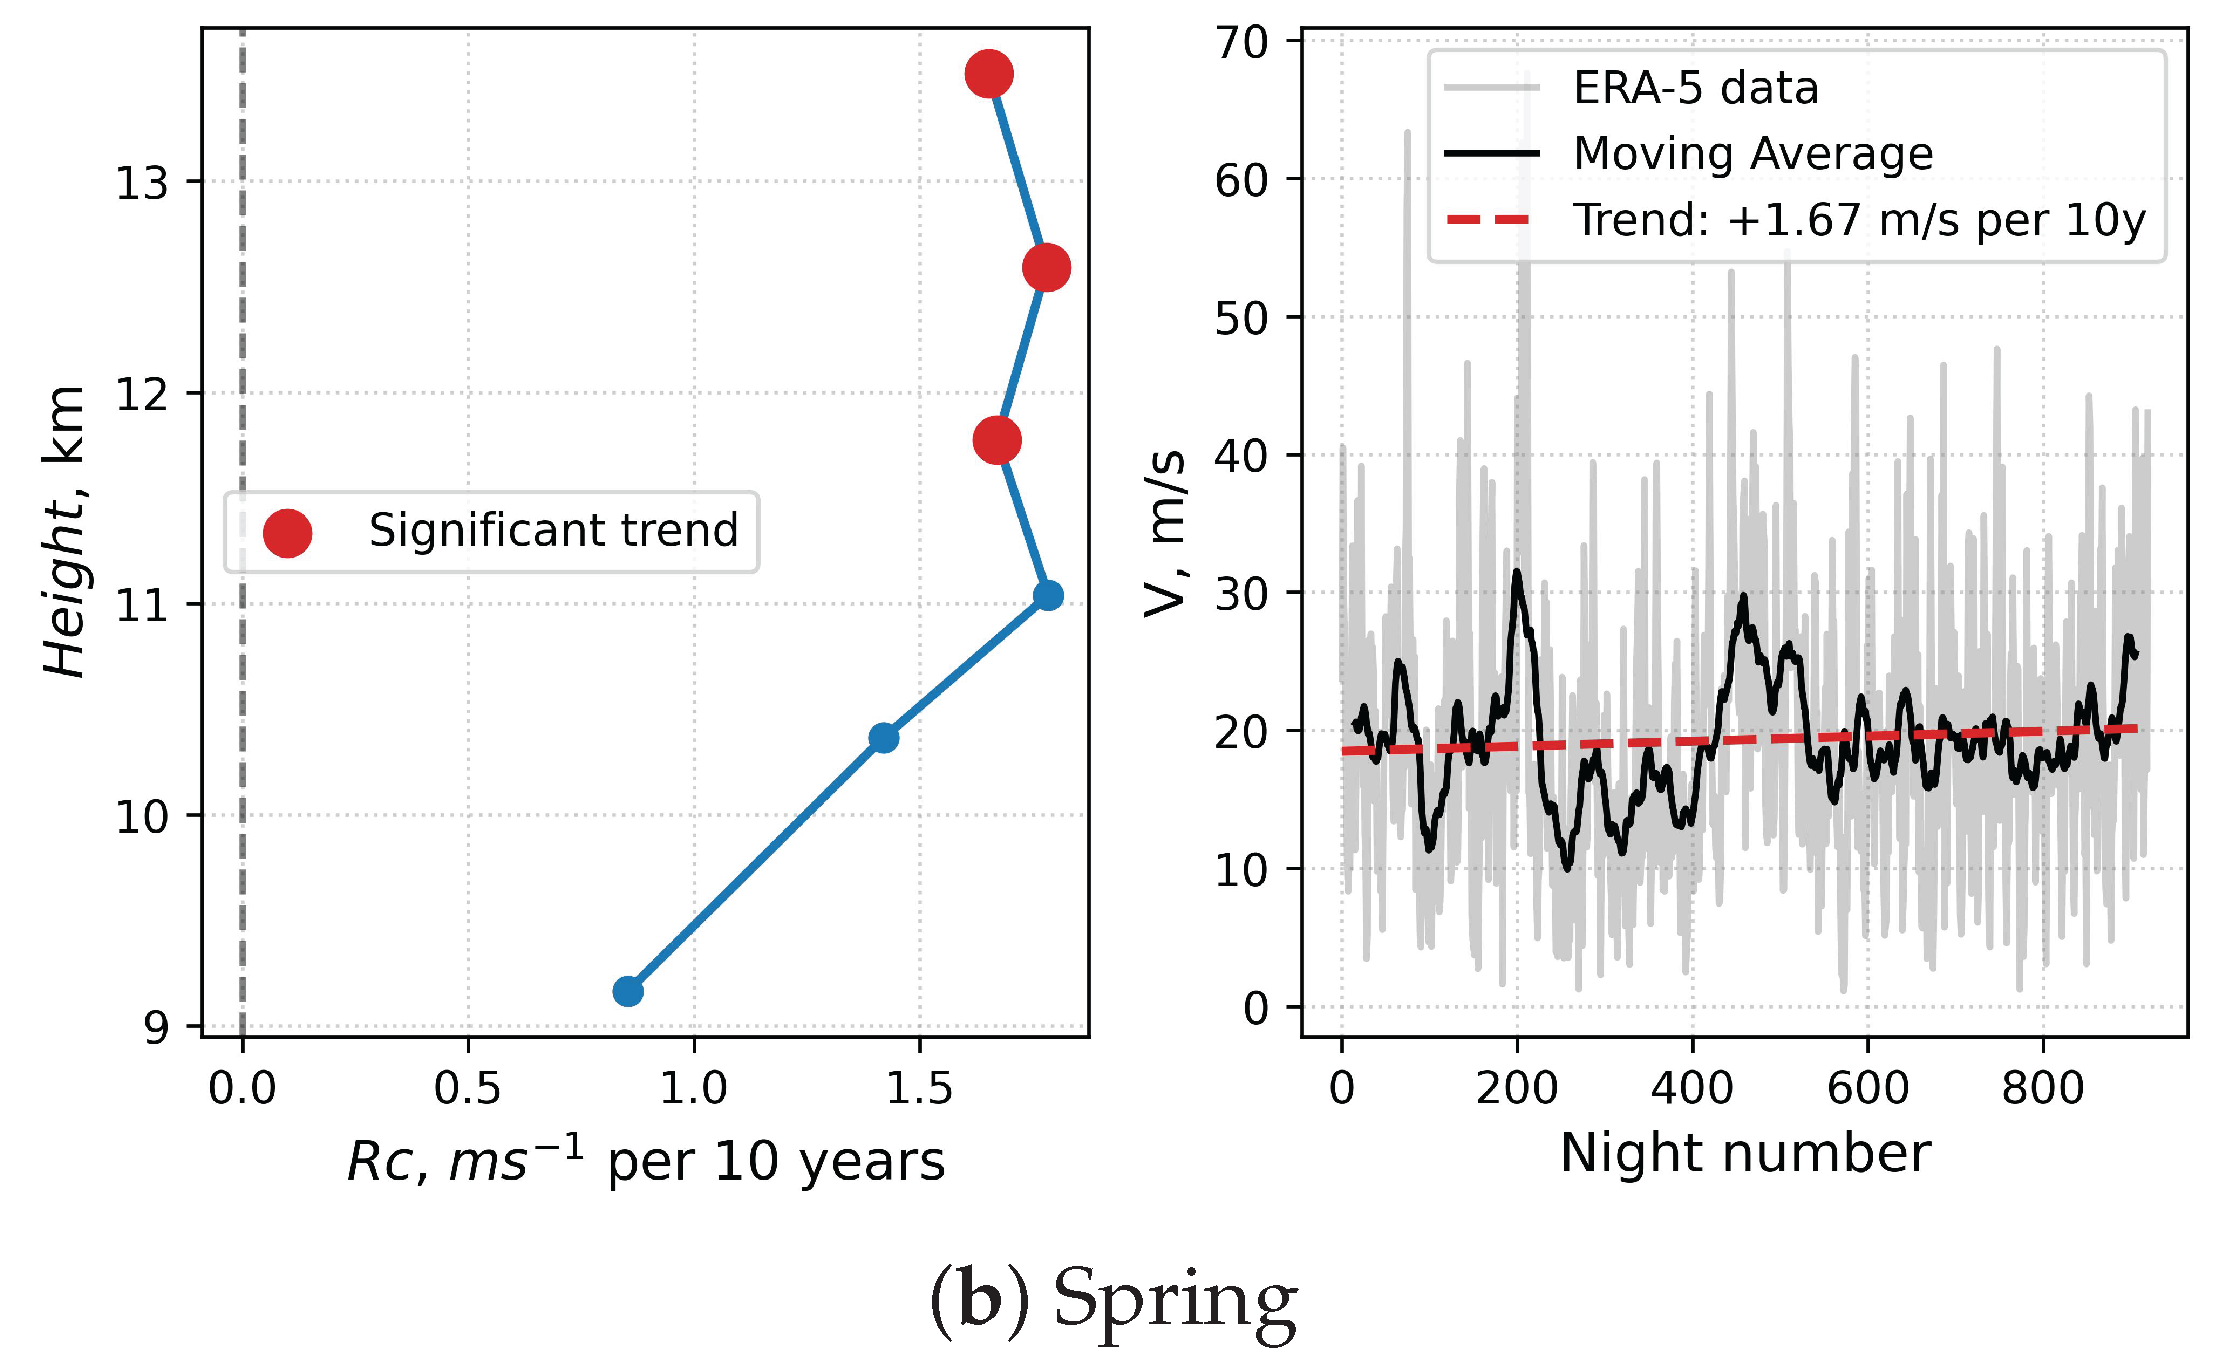
Figure 6.
Same as Figure 5 but for summer and autumn, respectively.
Figure 6.
Same as Figure 5 but for summer and autumn, respectively.
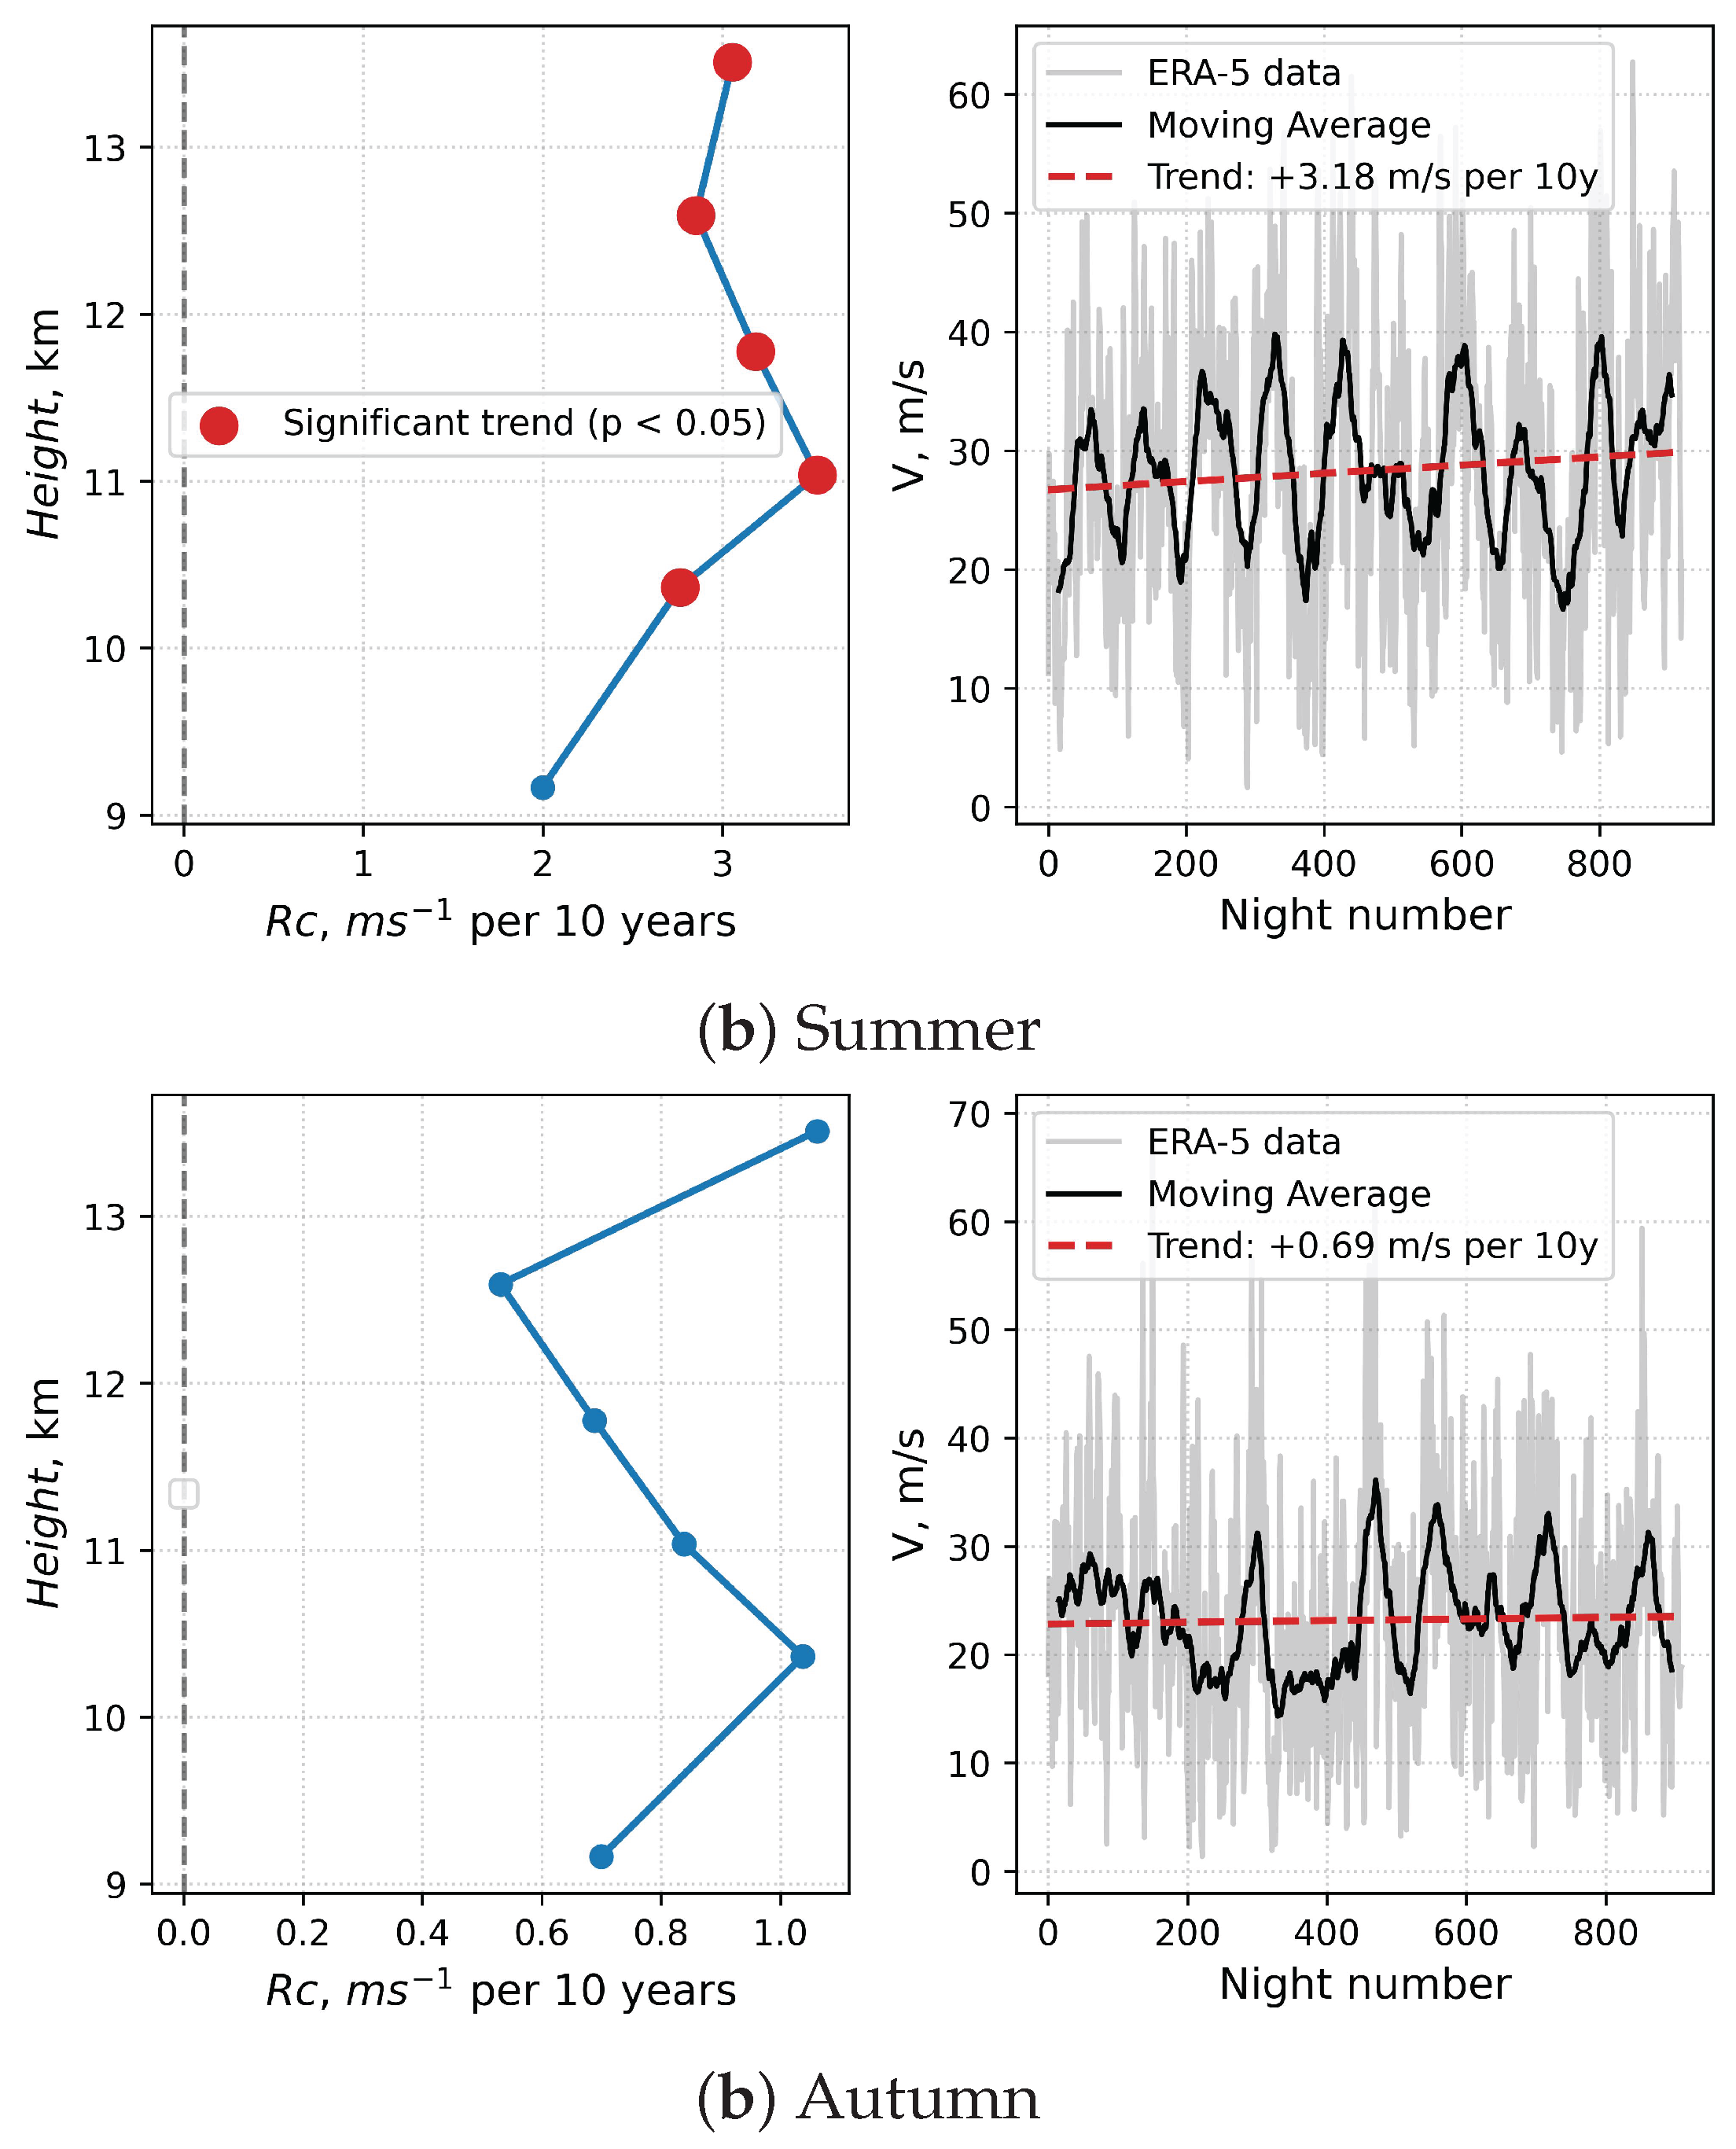
Figure 7.
Same as Figure 3 but for atmospheric vorticity.
Figure 7.
Same as Figure 3 but for atmospheric vorticity.
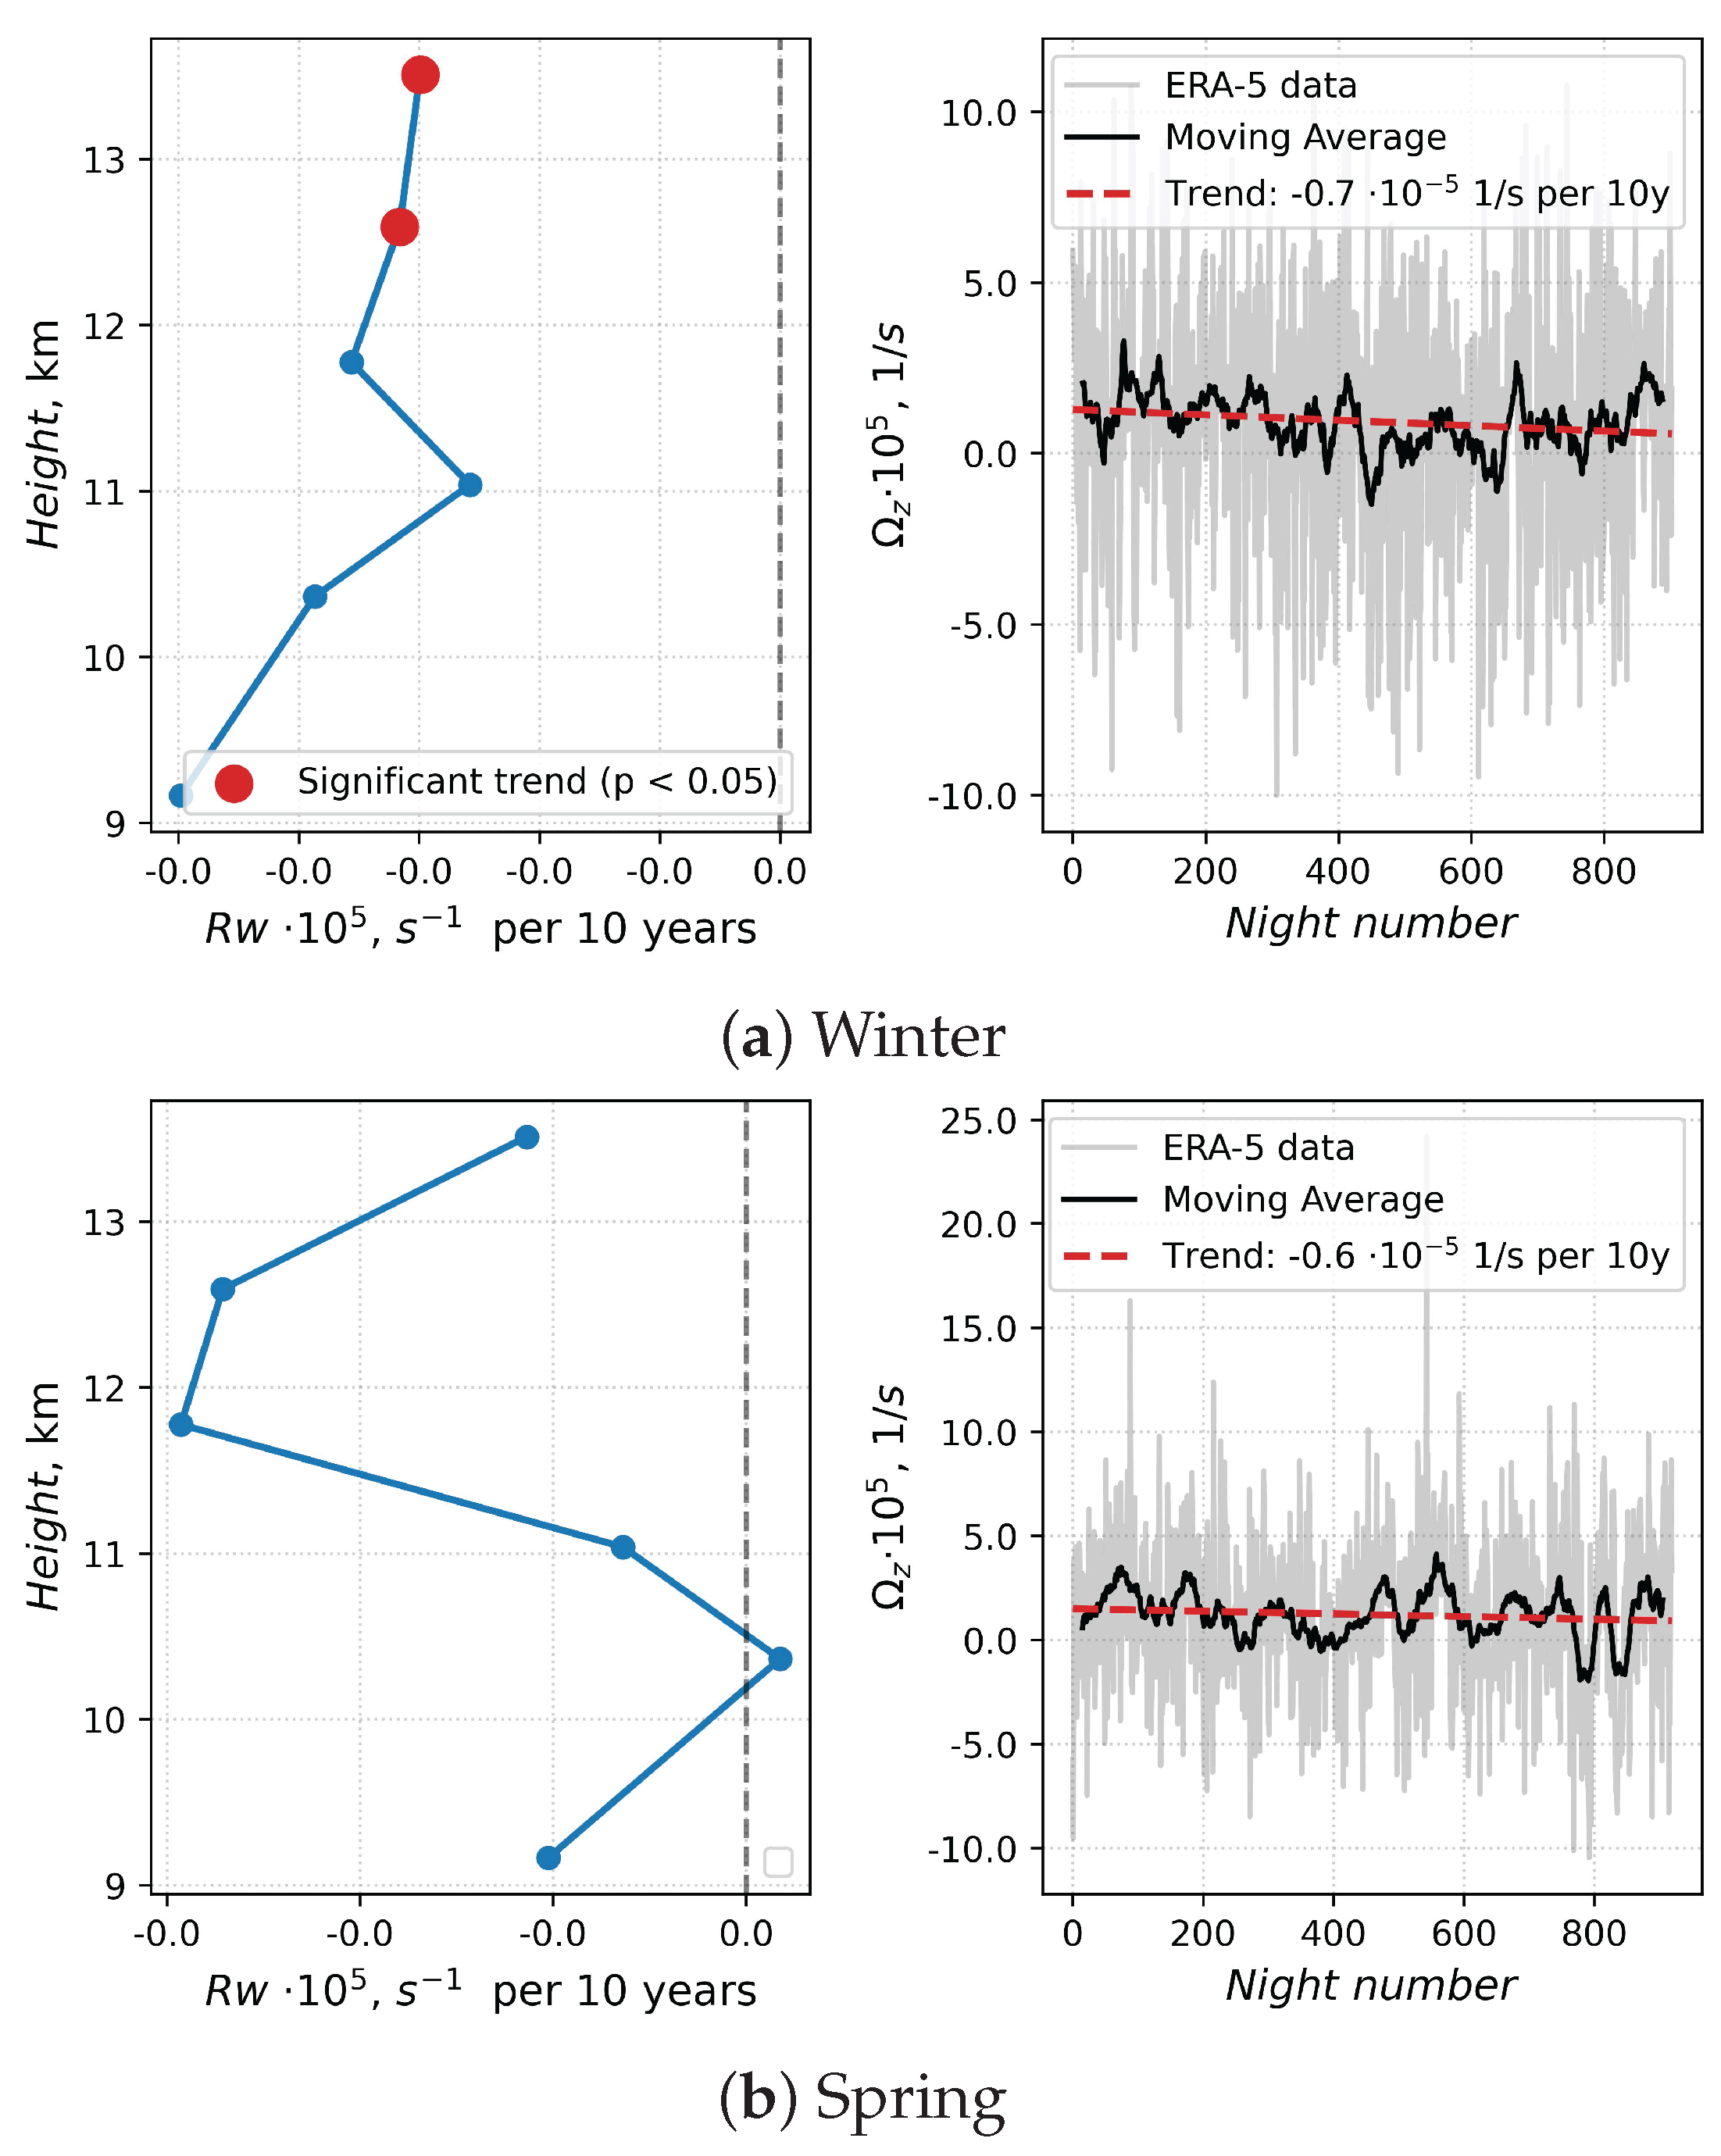
Figure 8.
Same as Figure 4 but for atmospheric vorticity.
Figure 8.
Same as Figure 4 but for atmospheric vorticity.
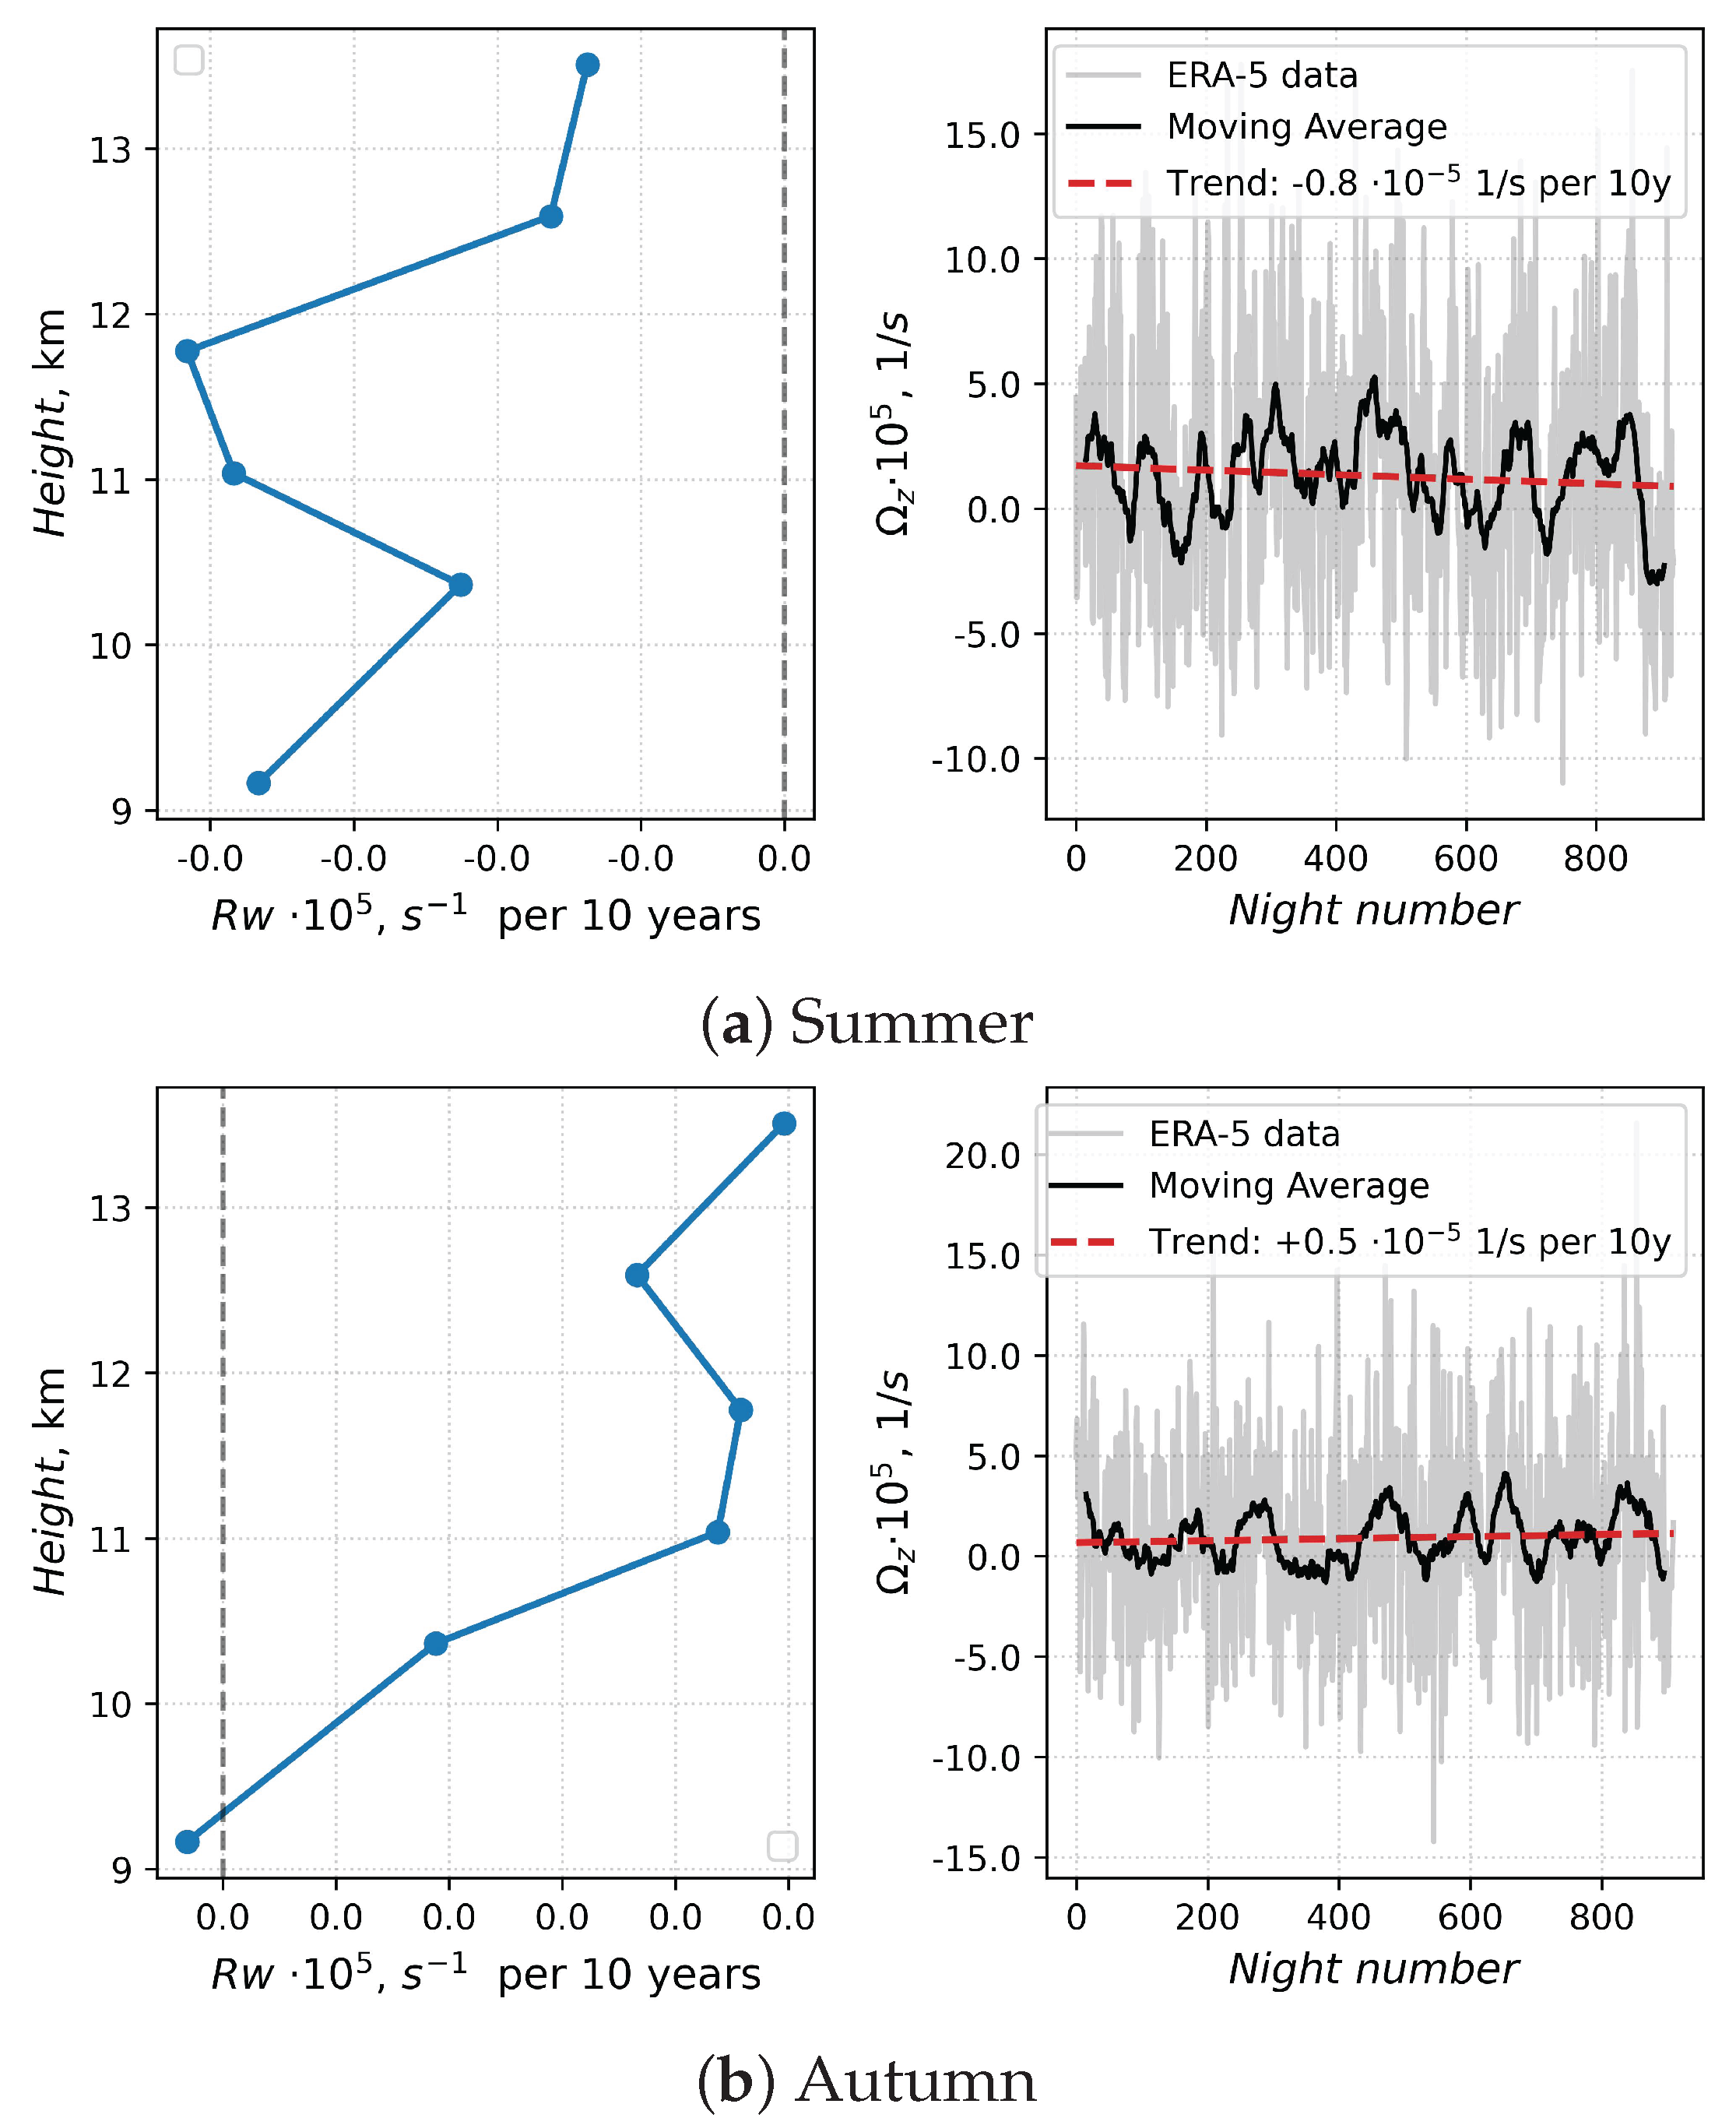
Figure 9.
Examples of changes in the optical turbulence strenght at the site of BAO in winter period from 1940 to 2023. Black lines correspond to smoothed data. Grey lines indicate the linear regressions.
Figure 9.
Examples of changes in the optical turbulence strenght at the site of BAO in winter period from 1940 to 2023. Black lines correspond to smoothed data. Grey lines indicate the linear regressions.
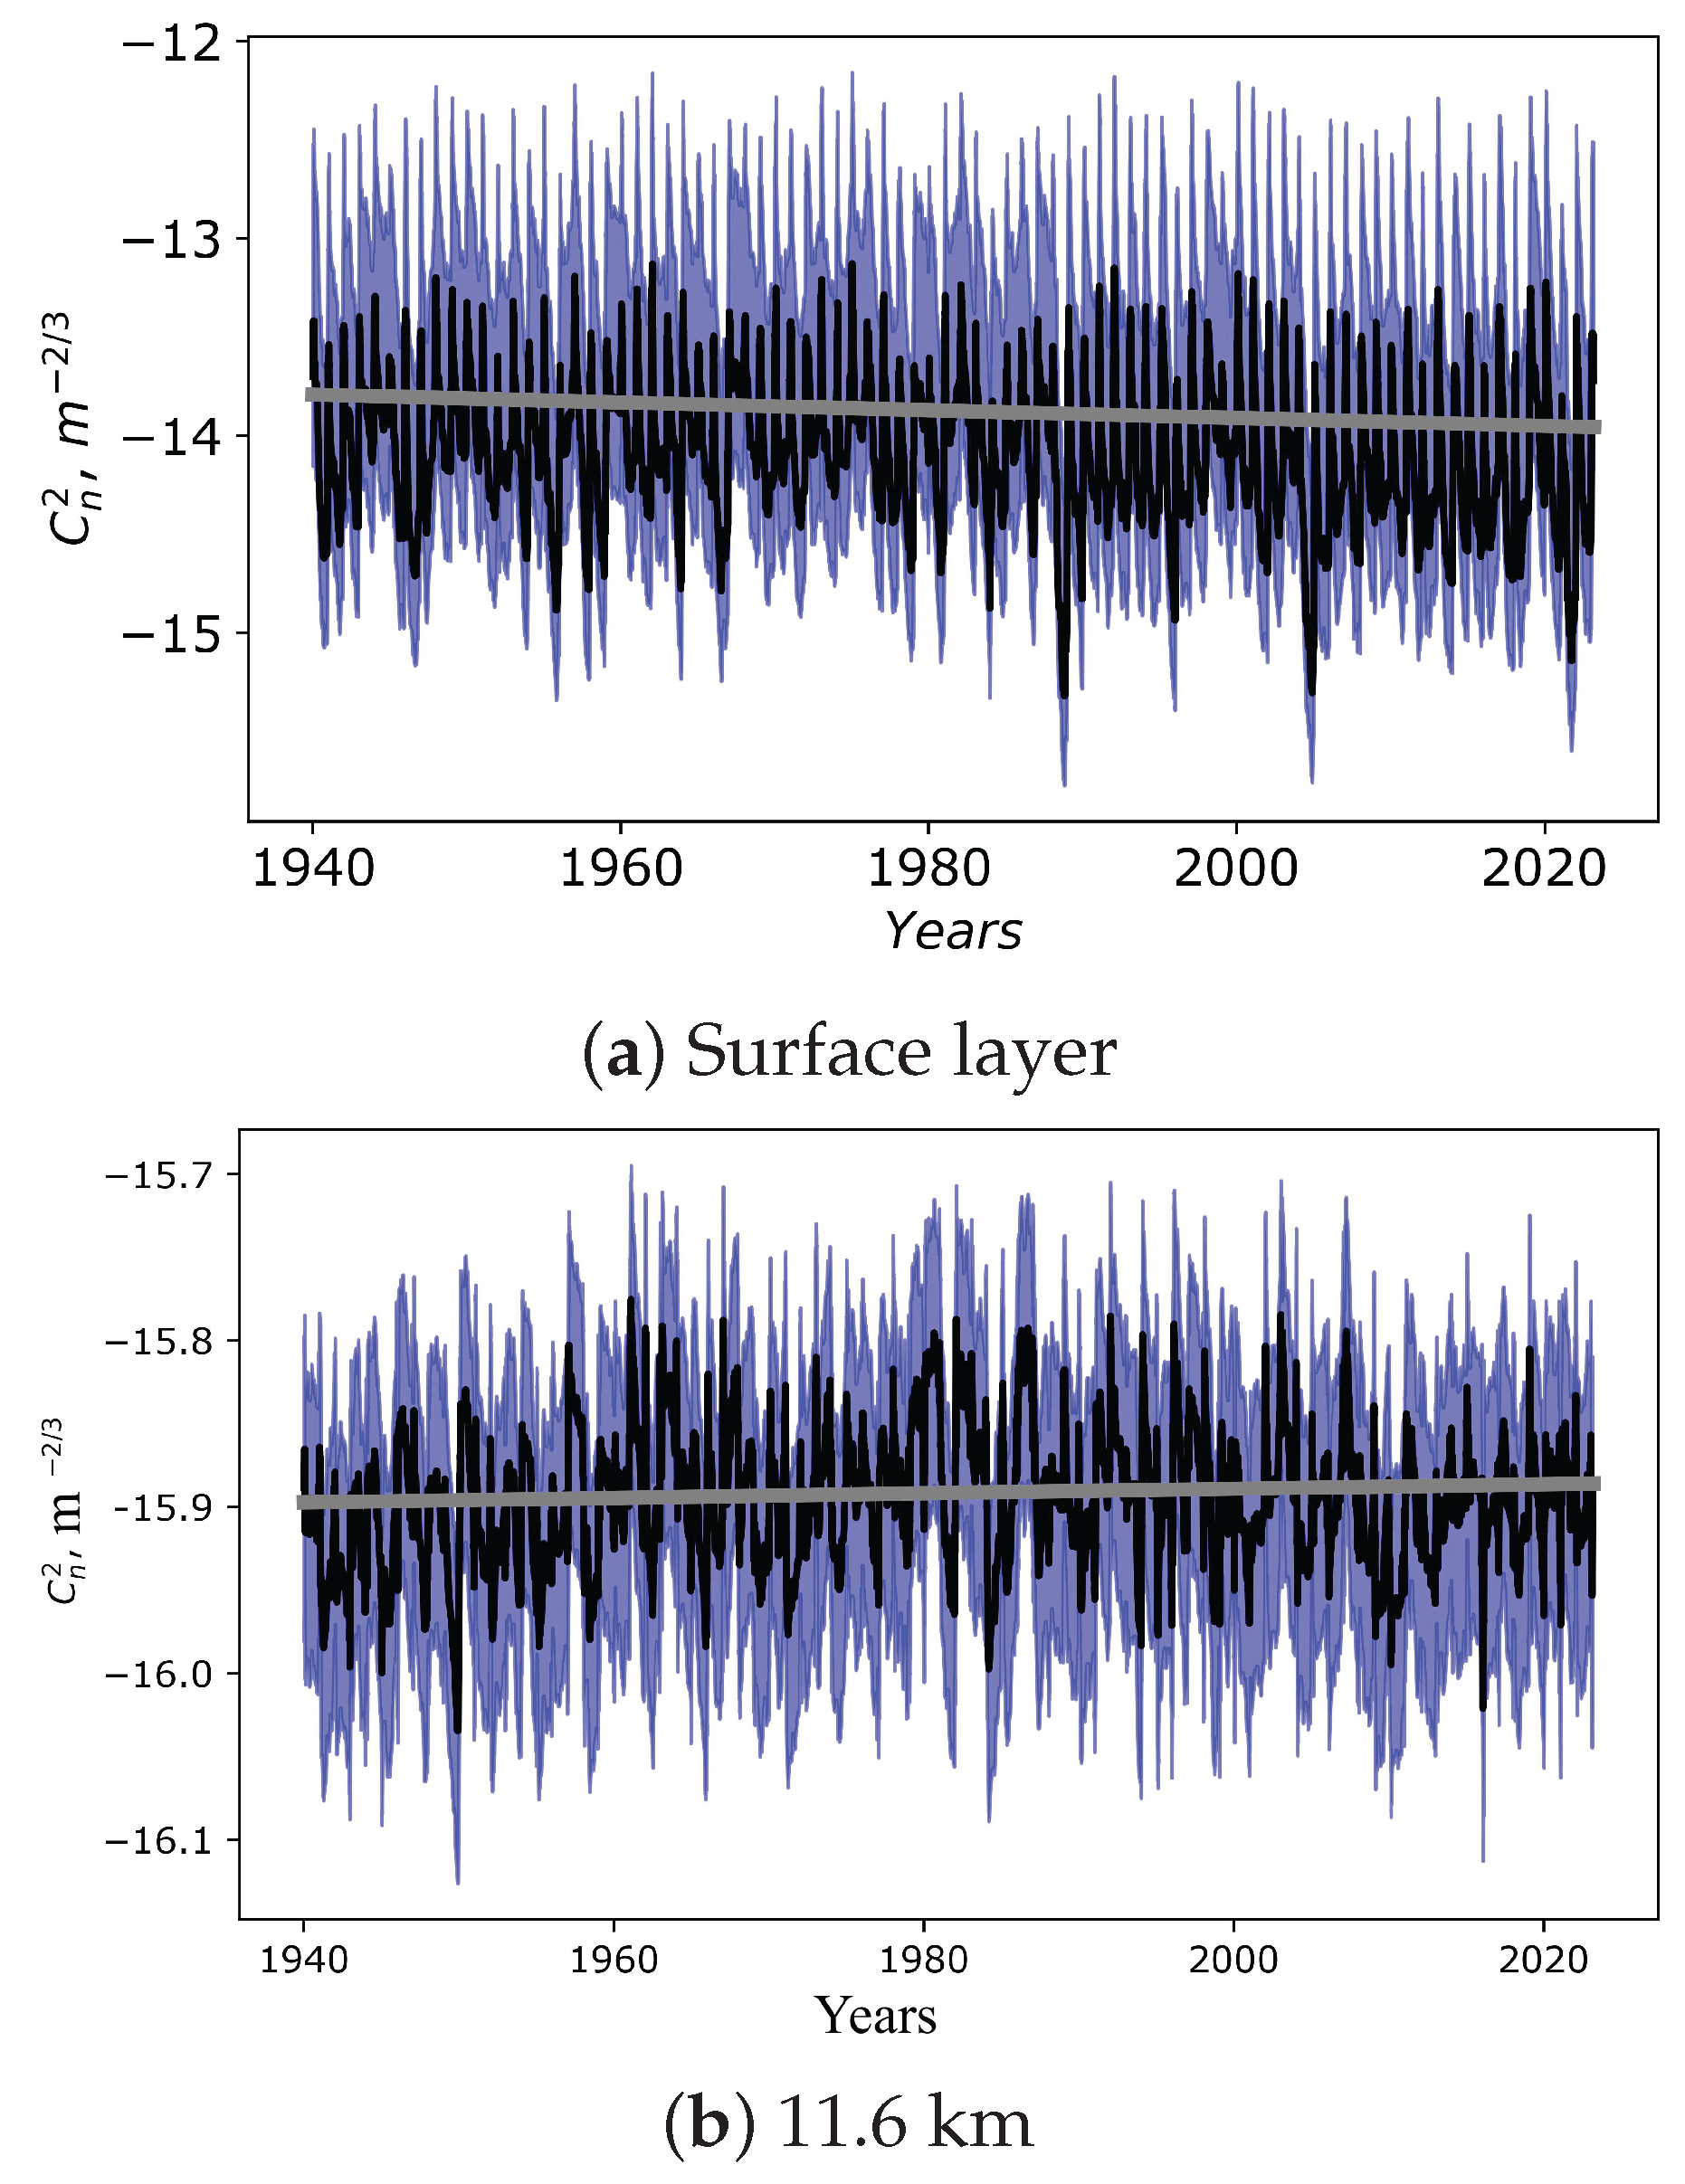
Figure 10.
Examples of changes in the day-time optical turbulence strength at the site of BAO in summer period from 1940 to 2023. Black lines correspond to smoothed data. Grey lines indicate the linear regressions.
Figure 10.
Examples of changes in the day-time optical turbulence strength at the site of BAO in summer period from 1940 to 2023. Black lines correspond to smoothed data. Grey lines indicate the linear regressions.
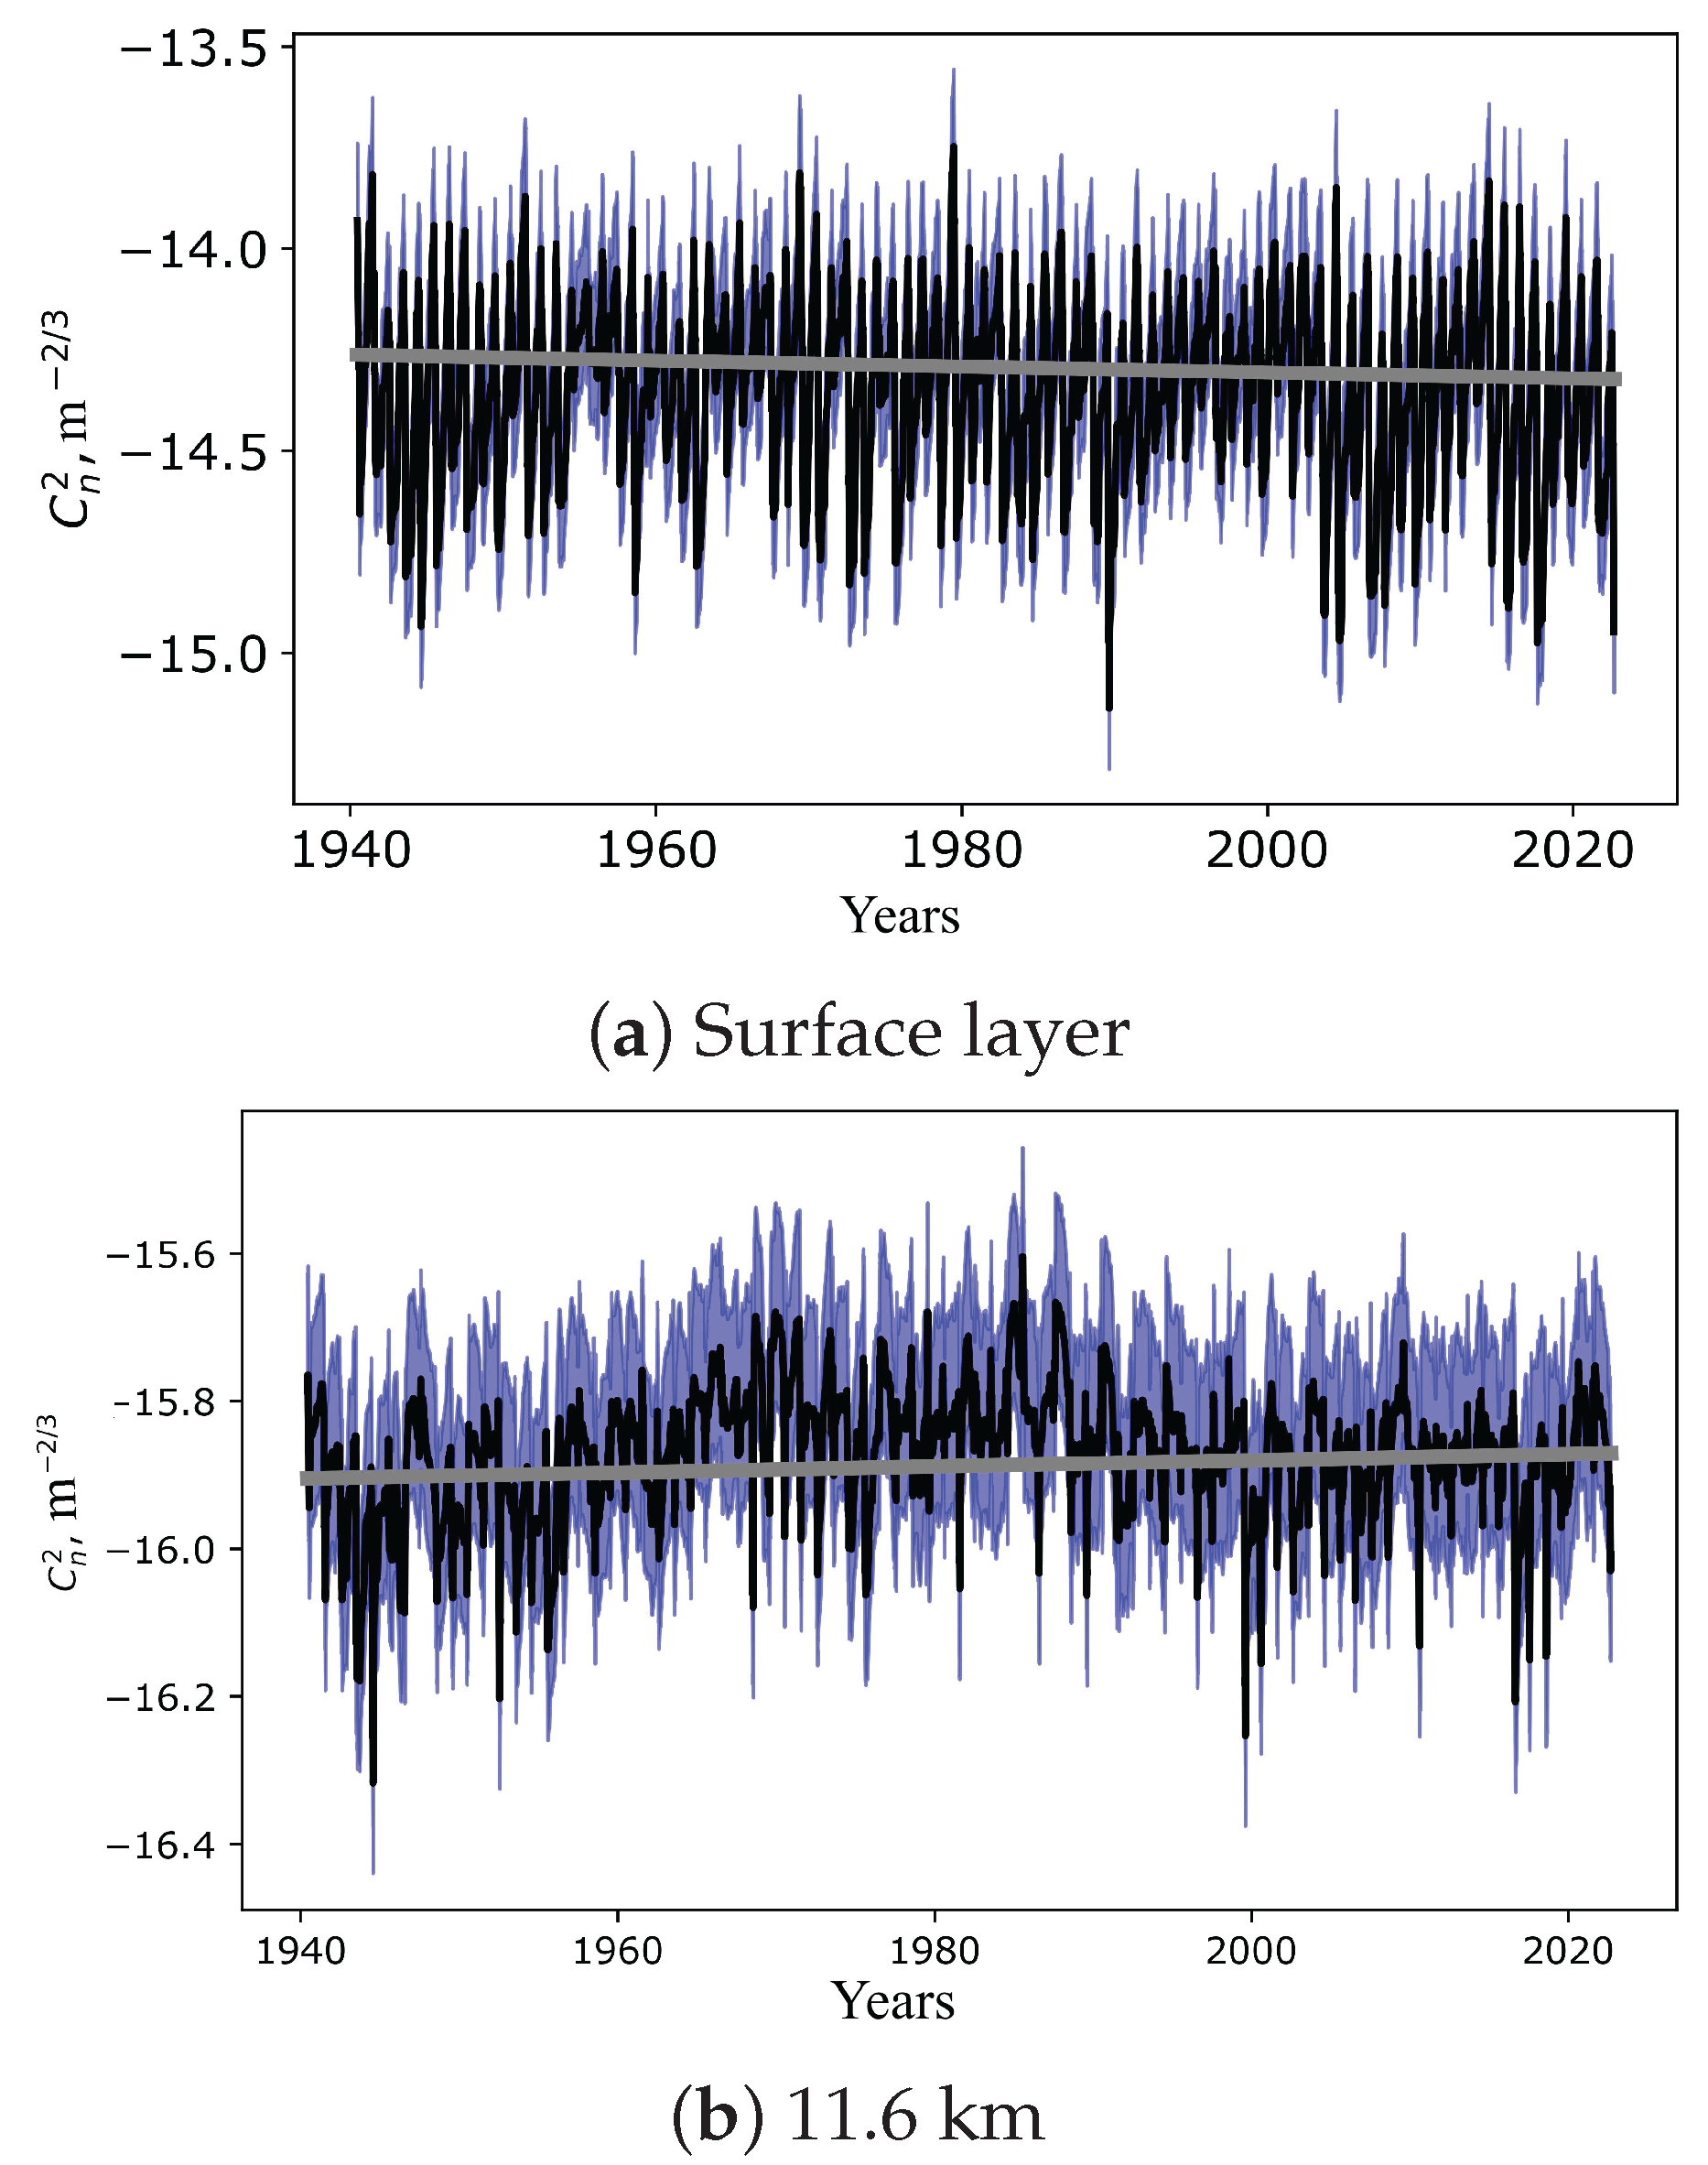
Figure 11.
Variations in day-time atmospheric boundary layer height above BAO from 1940 to 2023, ERA-5 data, total cloud cover ≤ 0.5. The color shading corresponds to the interval between the first and third quartiles.
Figure 11.
Variations in day-time atmospheric boundary layer height above BAO from 1940 to 2023, ERA-5 data, total cloud cover ≤ 0.5. The color shading corresponds to the interval between the first and third quartiles.
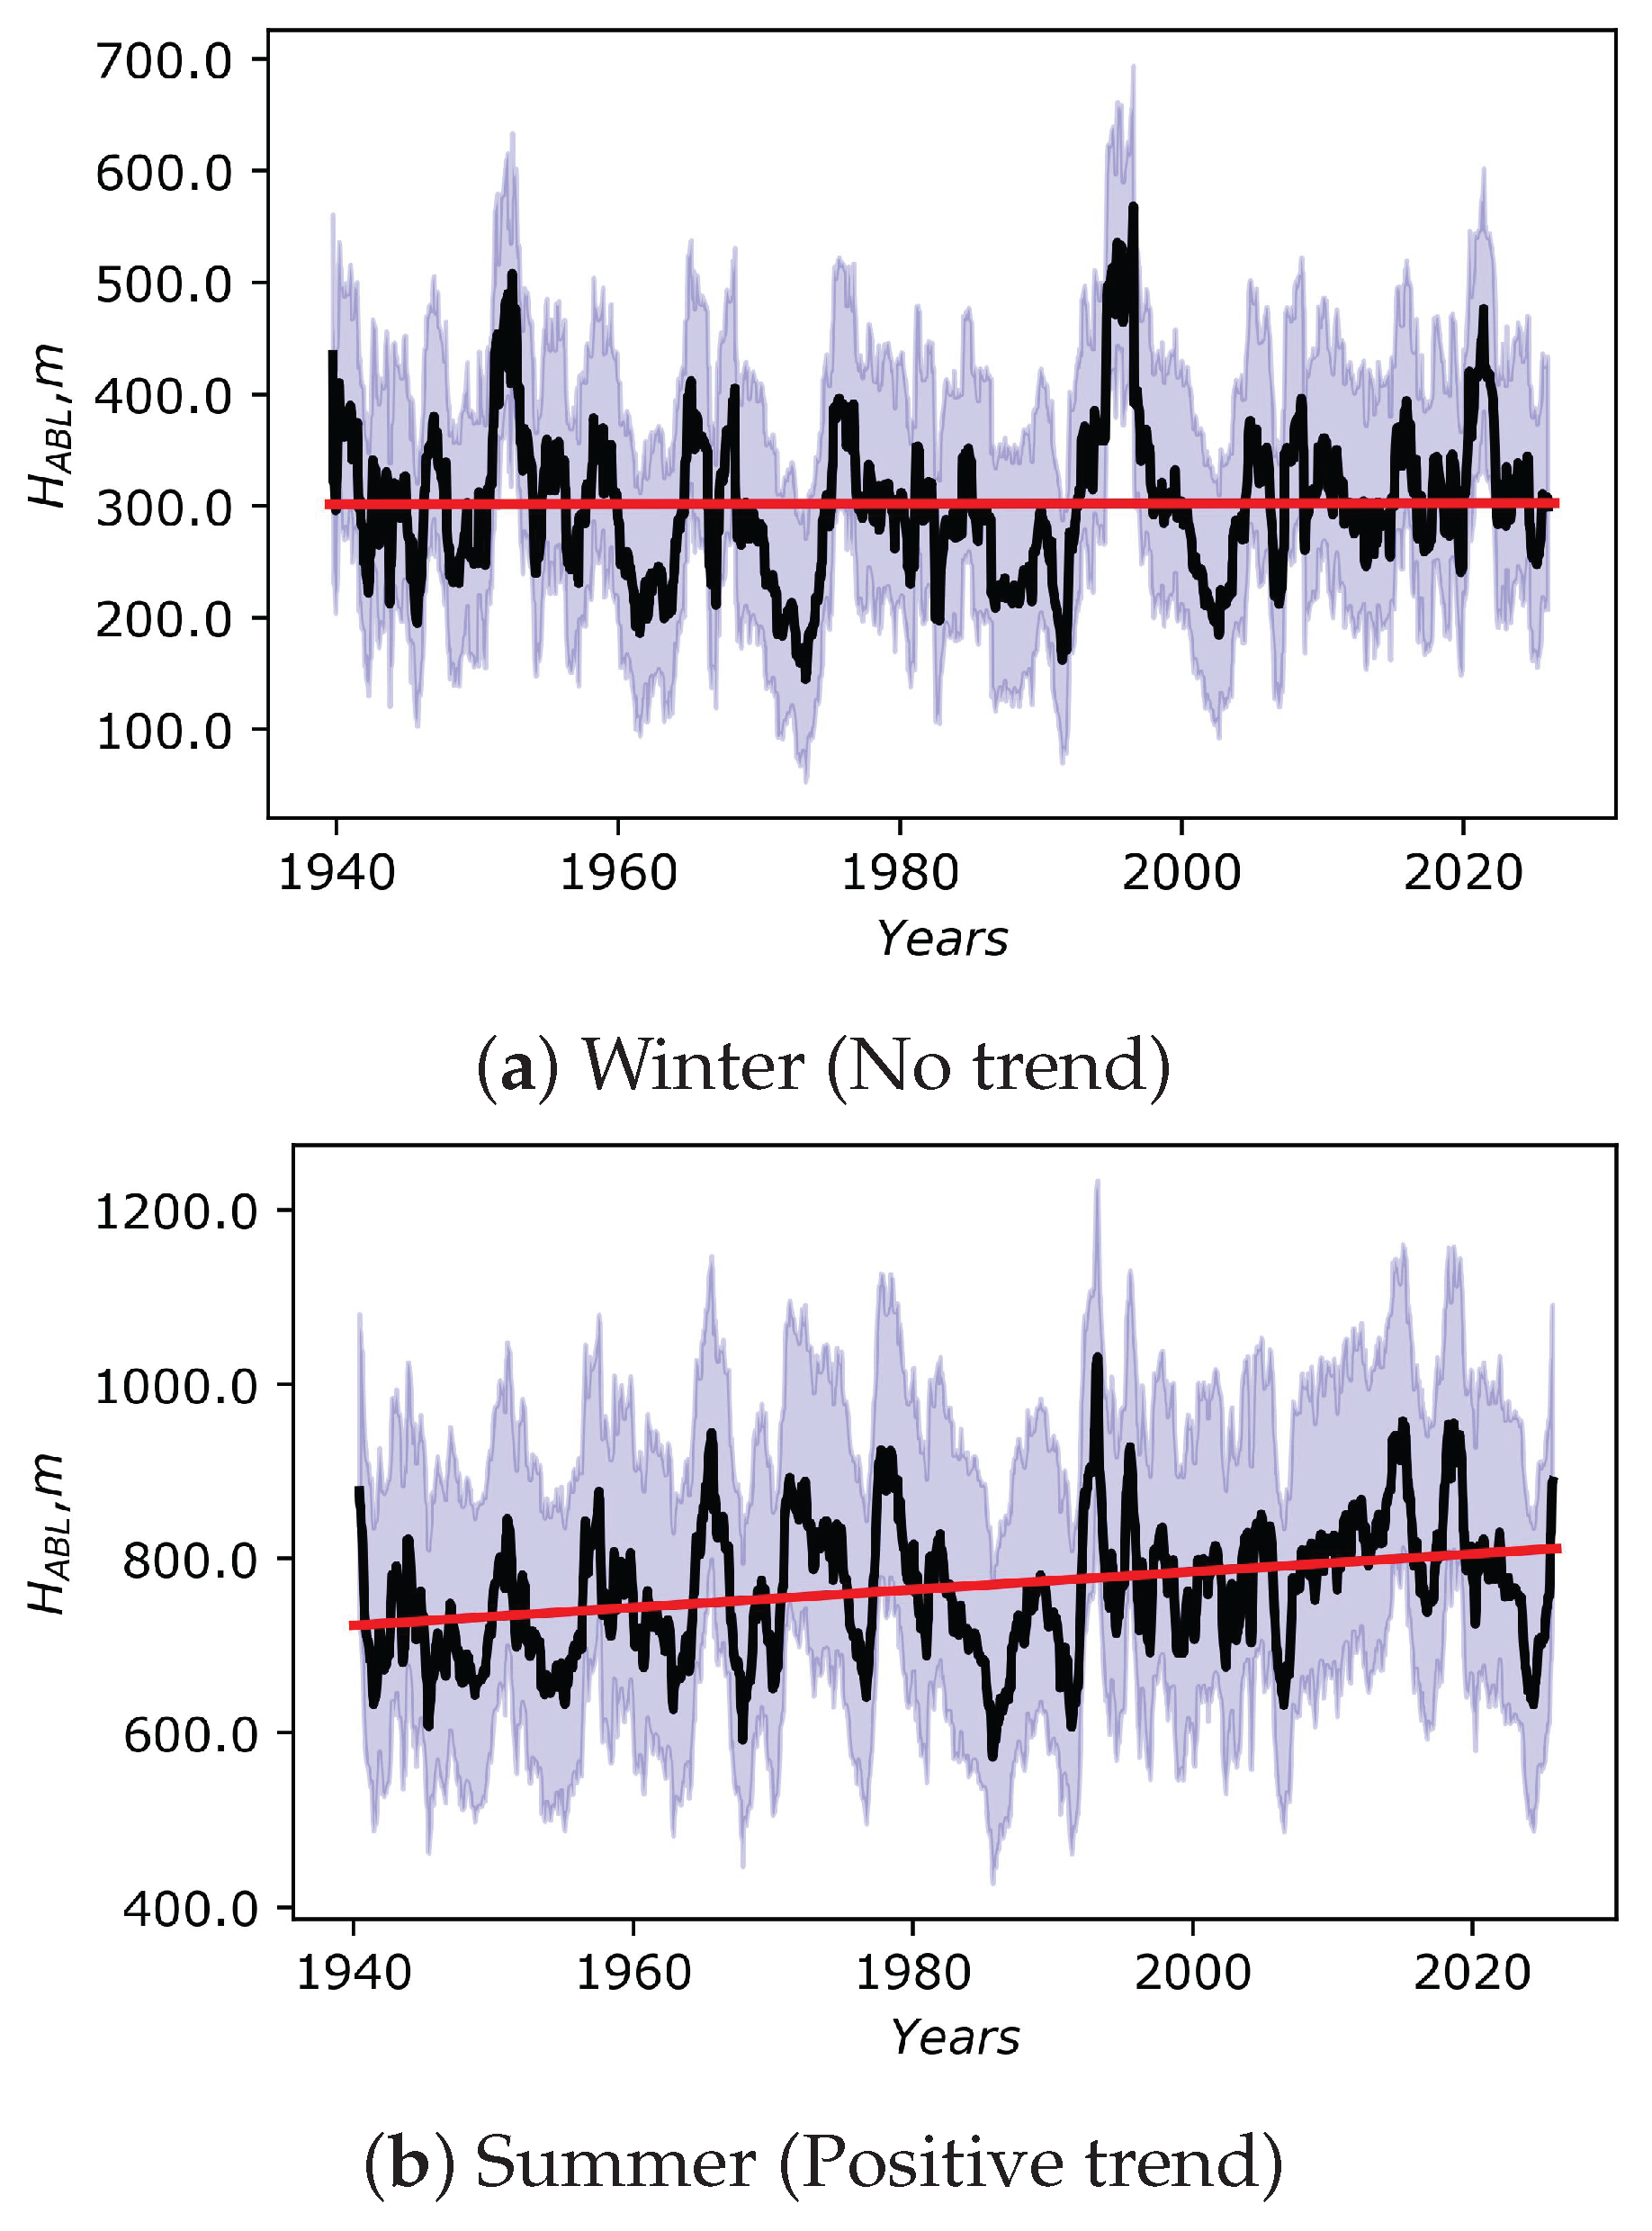

Table 1.
Wind speed statistics by seasons.
| Season | Pressure | Mean Speed | Trend | p-Value | Significance |
|---|---|---|---|---|---|
| (hPa) | (m/s) | (Sen, ) | (95%) | ||
| Winter | 300.0 | 22.2 | −0.0053 | 0.00 | Significant |
| 250.0 | 23.3 | −0.0060 | 0.00 | Significant | |
| 225.0 | 22.9 | −0.0056 | 0.00 | Significant | |
| 200.0 | 21.9 | −0.0048 | 0.00 | Significant | |
| 175.0 | 20.9 | −0.0034 | 0.01 | Significant | |
| 150.0 | 20.4 | −0.0028 | 0.01 | Significant | |
| Spring | 300.0 | 20.1 | 0.0019 | 0.16 | Non-significant |
| 250.0 | 21.4 | 0.0023 | 0.09 | Non-significant | |
| 225.0 | 20.9 | 0.0026 | 0.05 | Non-significant | |
| 200.0 | 19.3 | 0.0026 | 0.03 | Significant | |
| 175.0 | 17.4 | 0.0026 | 0.01 | Significant | |
| 150.0 | 16.4 | 0.0023 | 0.01 | Significant | |
| Summer | 300.0 | 18.2 | 0.0022 | 0.08 | Non-significant |
| 250.0 | 23.6 | 0.0031 | 0.03 | Significant | |
| 225.0 | 26.3 | 0.0038 | 0.01 | Significant | |
| 200.0 | 28.3 | 0.0032 | 0.03 | Significant | |
| 175.0 | 28.8 | 0.0031 | 0.04 | Significant | |
| 150.0 | 26.9 | 0.0035 | 0.01 | Significant | |
| Autumn | 300.0 | 20.0 | 0.0011 | 0.39 | Non-significant |
| 250.0 | 22.2 | 0.0014 | 0.30 | Non-significant | |
| 225.0 | 23.0 | 0.0013 | 0.37 | Non-significant |
Table 2.
Vorticity statistical parameters by seasons.
| Season | Pressure | Mean Vorticity | Trend | p-Value | Significance |
|---|---|---|---|---|---|
| (hPa) | () | () | (95%) | ||
| Winter | 300.0 | −0.33 | −0.0011 | 0.15 | Non-significant |
| 250.0 | 0.34 | −0.0008 | 0.26 | Non-significant | |
| 225.0 | 0.75 | −0.0005 | 0.39 | Non-significant | |
| 200.0 | 0.93 | −0.0007 | 0.14 | Non-significant | |
| 175.0 | 1.06 | −0.0007 | 0.04 | Significant | |
| 150.0 | 1.04 | −0.0007 | 0.02 | Significant | |
| Spring | 300.0 | 0.42 | −0.0002 | 0.79 | Non-significant |
| 250.0 | 0.80 | 0.0000 | 0.92 | Non-significant | |
| 225.0 | 1.04 | −0.0001 | 0.93 | Non-significant | |
| 200.0 | 1.21 | −0.0005 | 0.28 | Non-significant | |
| 175.0 | 1.19 | −0.0004 | 0.25 | Non-significant | |
| 150.0 | 1.03 | −0.0003 | 0.27 | Non-significant | |
| Summer | 300.0 | 0.89 | −0.0013 | 0.07 | Non-significant |
| 250.0 | 1.22 | −0.0005 | 0.46 | Non-significant | |
| 225.0 | 1.48 | −0.0009 | 0.21 | Non-significant | |
| 200.0 | 1.30 | −0.0009 | 0.18 | Non-significant | |
| 175.0 | 1.03 | −0.0006 | 0.28 | Non-significant | |
| 150.0 | 0.79 | −0.0004 | 0.43 | Non-significant | |
| Autumn | 300.0 | −0.03 | −0.0003 | 0.66 | Non-significant |
| 250.0 | 0.28 | −0.0001 | 0.88 | Non-significant | |
| 225.0 | 0.55 | 0.0003 | 0.73 | Non-significant | |
| 200.0 | 0.90 | 0.0004 | 0.54 | Non-significant | |
| 175.0 | 1.04 | 0.0004 | 0.46 | Non-significant | |
| 150.0 | 0.93 | 0.0006 | 0.10 | Non-significant |
Disclaimer/Publisher’s Note: The statements, opinions and data contained in all publications are solely those of the individual author(s) and contributor(s) and not of MDPI and/or the editor(s). MDPI and/or the editor(s) disclaim responsibility for any injury to people or property resulting from any ideas, methods, instructions or products referred to in the content. |
© 2026 by the authors. Licensee MDPI, Basel, Switzerland. This article is an open access article distributed under the terms and conditions of the Creative Commons Attribution (CC BY) license (http://creativecommons.org/licenses/by/4.0/).
Copyright: This open access article is published under a Creative Commons CC BY 4.0 license, which permit the free download, distribution, and reuse, provided that the author and preprint are cited in any reuse.


