

Submitted:
07 July 2026
Posted:
08 July 2026
You are already at the latest version
Abstract
Yeast surface display (YSD) is a powerful tool for protein engineering, yet its broader application is often limited by suboptimal display efficiency. To address this, we systematically investigated the combinatorial effects of three key genetic determinants—promoter strength, anchoring protein identity, and fusion orientation (N- vs. C-terminal)—on the surface display level of enhanced green fluorescent protein (eGFP) in Saccharomyces cerevisiae. A library of recombinant yeast strains was constructed, each harboring distinct combinations of these elements, and their display efficiencies were quantitatively assessed via flow cytometry-based fluorescence analysis. Our results demonstrate that the synergistic optimization of all three parameters is essential for maximizing YSD performance. Among all constructs tested, the novel plasmid system pYGAL1-Sed1p-eGFP-C—which combines the strong inducible GAL1promoter, the Sed1p cell wall anchor, and a C-terminal eGFP fusion—exhibited the highest display efficiency. This optimal configuration achieved a mean fluorescence intensity over 10.3-fold higher than the baseline system (pYSED1-Aga1p-eGFP-C) and 8.4-fold higher than the alternative N-terminal fusion design (pYSED1-eGFP-Aga1p-N). These findings establish a clear design principle for engineering high-efficiency YSD platforms. The pYGAL1-Sed1p-eGFP-C system not only provides a robust and highly efficient chassis for displaying eGFP but also holds significant promise as a versatile scaffold for the surface presentation of diverse heterologous proteins in yeast, thereby expanding the utility of YSD in biotechnology and synthetic biology.
Keywords:
yeast surface display
; saccharomyces cerevisiae
; eGFP
; promoter optimization
; anchoring protein
; Sed1p
; GAL1 promoter
; protein engineering
1. Introduction
Yeast surface display (YSD) has emerged as a robust alternative for enzyme immobilization, overcoming limitations associated with conventional methods such as protein conformational sensitivity, enzyme purity, carrier specificity, and immobilization complexity [1]. Among various microbial hosts, yeasts—particularly Saccharomyces cerevisiae, Pichia pastoris, and Yarrowia lipolytica—offer distinct advantages: large cell size, well-characterized genetics, ease of cultivation and genetic manipulation, and GRAS (Generally Recognized as Safe) status, making them ideal for applications in food, pharmaceutical, and health sectors. Moreover, as eukaryotes, yeasts can perform post-translational modifications on target proteins, further enhancing their suitability for surface display [2].
Target protein anchoring on yeast cells occurs via glycosylphosphatidylinositol (GPI)-dependent and non-GPI-dependent mechanisms [3]. GPI-dependent anchors include Aga1p, Sed1p, Flo1p, and Spi1p. For example, Mei et al. [4] employed α-lectin-anchored YSD to construct a nanobody library targeting the Fg-binding domain of Staphylococcus aureus, yielding nanobodies capable of preventing bacterial adhesion to fibrinogen. The Flo1p anchor, containing ~70% repetitive amino acid sequences, primarily mediates cell flocculation [5]. Notably, anchor protein choice influences target protein localization within the cell wall: Inokuma et al. [6] showed that eGFP fused with Sed1p localizes predominantly on the outer cell wall surface, whereas Sag1p-fused eGFP resides on the inner surface, highlighting the potential to exploit the spatial architecture of the yeast cell wall. Non-GPI-dependent anchoring is primarily mediated by Pir proteins (Pir1–Pir4), a family of covalently linked cell wall proteins characterized by up to ten conserved repeat units [7]. Pir-based display systems support N-terminal, C-terminal, and insertion fusions [8], broadening the repertoire of displayable target proteins. Insertion fusion typically exploits restriction enzyme sites within Pir proteins for targeted insertion at single or double cleavage sites.
Recent efforts to improve YSD efficiency have explored novel anchoring strategies. Li et al. [9] developed an indirect display system in P. pastoris by anchoring Im7 protein, leveraging its ultra-high affinity for CL7 to capture CL7-fused targets (e.g., sfGFP, mCherry, human Arginase I). Meanwhile, Yang et al. [10] modified the α-lectin system by replacing the Aga1p–Aga2p dimer with a single Aga1p anchor, directly fusing the target protein to the N-terminus of Aga1p. This nearly doubled YSD efficiency and increased displayed α-galactosidase activity by 39%. Promoters are fundamental to transcriptional control, influencing both the strength and timing of gene expression [11]. Yeast promoters are classified as constitutive (e.g., GAP1, THD3, SED1, PGK1) or inducible (e.g., GAL1, GAL10). Inducible promoters offer regulated expression, with considerations including induction cost, sensitivity, duration, and leakiness [12]. In S. cerevisiae, galactose-inducible promoters are widely used [13]. Piraine et al. [14] employed the GAL1 promoter to display bovine herpesvirus type 5 glycoprotein D on the BY4741 strain. Rakestraw et al. [15] used GAL10-driven display to screen a mutant α-mating factor that boosted single-chain antibody secretion by 16-fold. Among constitutive promoters, Kajiwara et al. [16] applied GAP1 for nanobody evaluation, while Inokuma et al. [17] used THD3 and SED1 promoters to express β-glucosidase and endoglucanase II, respectively. Notably, combining the SED1 promoter with the Sed1p anchor protein facilitated efficient enzyme incorporation into the cell wall.
Despite these advances, yeast surface display (YSD) systems continue to face critical bottlenecks, including low heterologous protein expression levels and compromised enzymatic activity upon surface immobilization. While individual studies have examined isolated parameters—such as promoter selection or anchor protein choice—a systematic, combinatorial investigation integrating multiple genetic determinants (promoter type, anchor identity, and fusion orientation) within a unified framework remains conspicuously absent. This knowledge gap hinders the rational design of high-performance YSD platforms.
In this study, we address this gap by presenting the first comprehensive and side-by-side comparison of these three key variables in Saccharomyces cerevisiae, using enhanced green fluorescent protein (eGFP) as a quantifiable reporter. Our approach uniquely enables the identification of synergistic interactions among these elements, rather than evaluating them in isolation. As a result, we discovered a previously unreported optimal combination—the pYGAL1-Sed1p-eGFP-C system—which achieves a >10-fold improvement in display efficiency over conventional configurations. This finding not only establishes a new benchmark for YSD performance but also provides a generalizable design strategy for displaying diverse heterologous proteins on yeast surfaces. By systematically deconvoluting the contributions of each genetic component, our work offers actionable insights for future YSD engineering, moving beyond trial-and-error approaches toward predictive optimization.
2. Materials and Methods
2.1. Strains and Reagents
The plasmid pYGAL1-eGFP and the S. cerevisiae BY4741 strain were maintained in our laboratory. DNA primers, as well as primary and secondary antibodies, were obtained from Generay Biotech Co., Ltd (Shanghai, China). All plasmid vectors, along with restriction enzymes and ligases, were sourced from Takara Bio (Shanghai, China). Reagents for bacterial culture were acquired from Oxide and ThermoFisher (Shanghai, China), and all chemicals used in this study were purchased from Solarbio Co., unless otherwise specified.
2.2. Construction of Recombinant S. cerevisiae BY4741 Containing Different Promoters
2.2.1. Construction of Yeast Display Systems Based on the SED1 Promoter
This study employs Saccharomyces cerevisiae BY4741 as the host strain, utilizing the yeast surface display plasmid pYGAL1-eGFP as the initial plasmid. The eGFP genes were cloned into the pYGAL1-eGFP vector. Elements of the yeast constitutive promoter SDE1 and anchoring proteins Aga1p and Sed1p were cloned from Gene Bank. Combinations of the SDE1 promoter with the anchoring proteins Aga1p and Sed1p were developed. Enhanced Green Fluorescent Protein (eGFP) was fused to the N-terminus and C-terminus of Aga1p and Sed1p, respectively. As a control, the plasmid system pYSED1-eGFP was constructed using the SDE1 promoter without an anchoring protein. Additionally, four combinations were created with anchoring proteins (Aga1p and Sed1p) where eGFP was fused to either their N- or C-terminus. The five yeast surface display systems based on the SDE1 promoter element are detailed in Table 1.
2.2.2. Construction of Yeast Display Systems Based on the GAP1 Promoter
A plasmid system, pYGAP1-eGFP, lacking an anchoring protein, was constructed using the yeast constitutive promoter GAP1 as its core, serving as a control. Simultaneously, four combinations were developed, incorporating the anchoring proteins Aga1p and Sed1p, with eGFP fused to either their N- or C-terminus. Table 1 displays the five yeast surface display systems constructed using the GAP1 promoter element.
2.2.3. Construction of Yeast Display Systems Based on the GAL1 Promoter
A plasmid system, pYGAL1-eGFP, which lacks anchoring protein, was developed using the yeast promoter GAL1 as its core to serve as a control. Concurrently, four combinations were designed by incorporating the anchoring proteins Aga1p and Sed1p, with eGFP fused to either their N- or C-terminus. Table 1 presents the five yeast surface display systems constructed using the GAL1 promoter element. Subsequently, the 15 yeast surface display plasmids, constructed based on the yeast promoters SED1, GAP1, and GAL1, were digested, linearized, and transformed into S. cerevisiae BY4741 to obtain recombinant yeasts with surface display.
2.3. Yeast Surface Display of eGTP Protein
The positive transformants were selected on Minimal Dextrose tryptophan-free Agar Plates containing 6.7 g/L YNB without amino acids (BD Difco), 20 g/L glucose, 0.1 g/L leucine, and 2% agar. To induce surface-displayed enzyme expression, the fifteen recombinant yeast clones were cultured in 50 mL YNB-CAA medium (6.7 g/L YNB, 5 g/L casamino acids) with 20 g/L glucose at 30°C until OD600 reached 4-5. The yeast cells were harvested by centrifugation at 4°C and 1500 g for 5 min, then resuspended in YNB-CAA medium with 2% galactose to an OD600 of 0.5-1. The cells were then cultivated at 25°C for 48 h to express the enzymes.
2.4. Detection of Displayed eGFP by Fluorescence Microscope
Fluorescence microscopy was employed to measure surface-displayed protein. The yeast cells were washed twice with PBS buffer. A volume of 400 μL of the first antibody (Anti-6X His Tag-ChIP Grade) was added to the sample, mixed, and incubated overnight at 4 ℃. The next day, the sample was centrifuged at 150 g for 1 minute at 4 ℃ to recover the yeast cells bound to the first antibody. Subsequently, the second antibody (IgG H&L (Alexa Fluor 488)) was added and incubated for 1 hour. A 10 μL aliquot of the sample was placed on a glass slide. The sample prepared was then observed using a confocal fluorescence microscope (Leica SP8-STED 3X).
2.5. Measurement of Fluorescence Value
Take 1 mL of fresh yeast culture and measure its optical density at 600 nm (OD600). Centrifuge the cell culture at 1,000 rpm for 1 minute and discard the supernatant. Wash the pellet twice with 1× phosphate-buffered saline (PBS) buffer, then resuspend the pellet in an equal volume of 1× PBS. Measure the fluorescence at an emission wavelength of 518 nm with an excitation wavelength of 488 nm. Calculate the unit fluorescence value (FLu/OD600) by dividing the fluorescence value at 518 nm by the OD600 value.
3. Results and Discussion
The efficiency of yeast surface display (YSD) is critically dependent on the interplay between promoters and anchor proteins. Despite their importance, a systematic evaluation of how different combinations of these genetic elements affect exogenous protein display has been lacking. In this study, we addressed this gap by constructing a series of YSD systems in Saccharomyces cerevisiaeBY4741, using pYGAL1-eGFP as the backbone. We systematically varied three key parameters: promoters (SED1, GAP1, GAL1), anchor proteins (Aga1p, Sed1p), and fusion orientation (N-terminal vs. C-terminal). A flexible GS linker (GSSSS) was inserted between the target protein and anchor protein to preserve spatial conformation and biological activity. The α-factor secretion signal peptide and CYC1 terminator were employed, with eGFP serving as the reporter. Display efficiency was quantified by measuring cell-surface eGFP fluorescence intensity. This section may be divided by subheadings. It should provide a concise and precise description of the experimental results, their interpretation, as well as the experimental conclusions that can be drawn.
3.1. Constructed SED1-Based YSD Systems and eGFP Surface Display
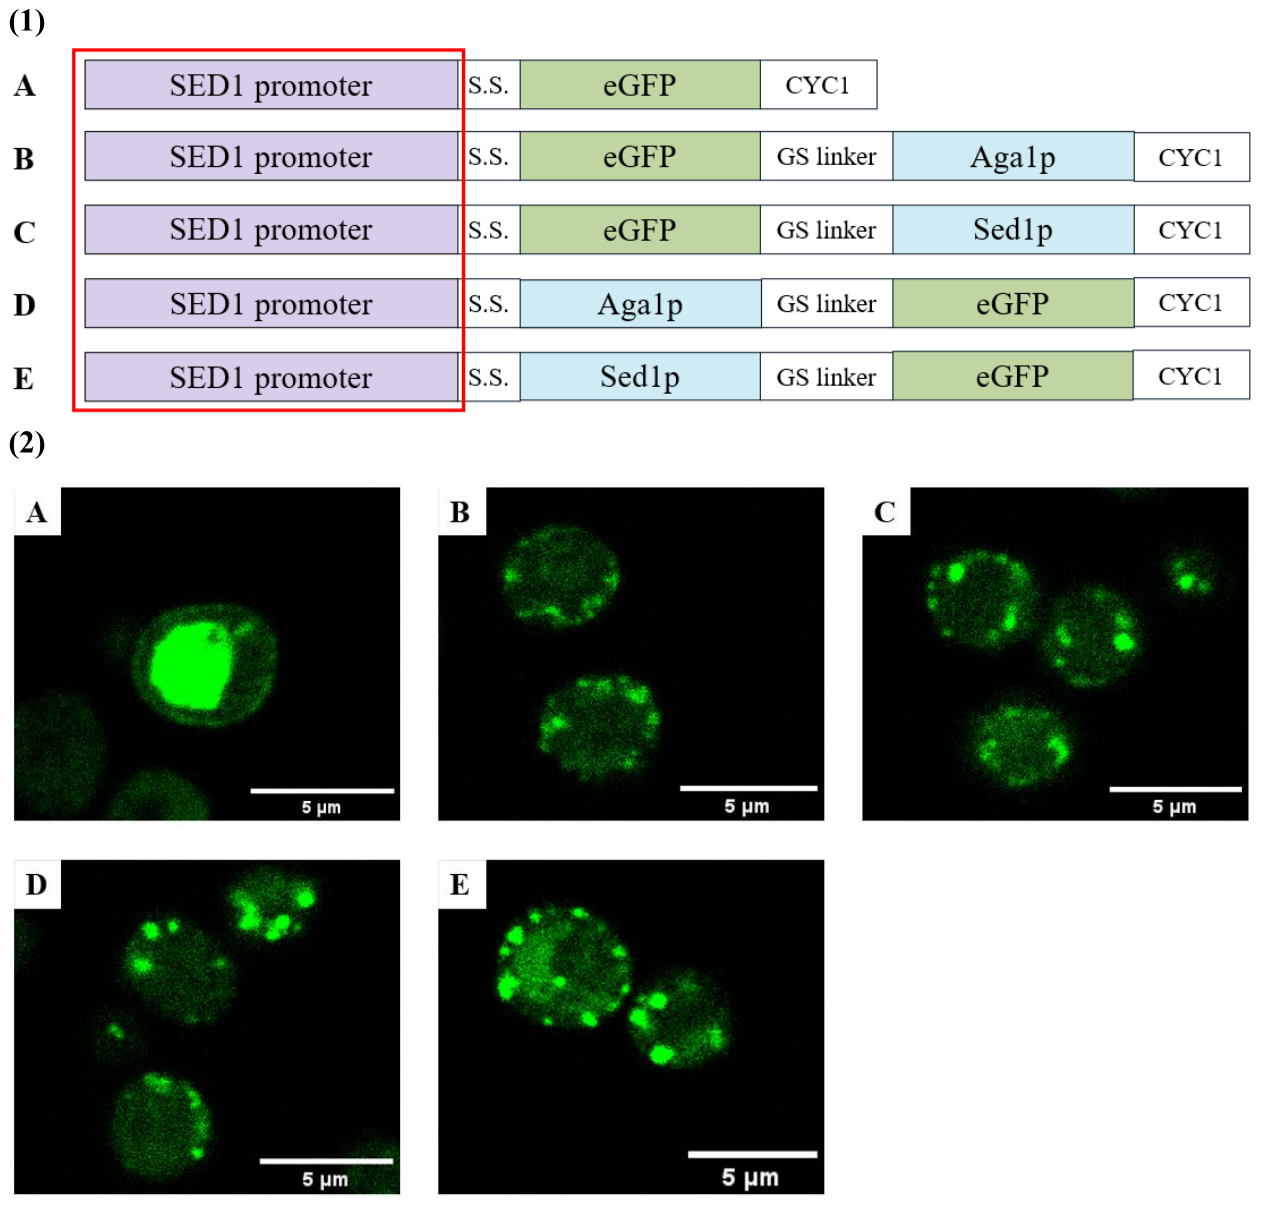
We first constructed a panel of five plasmid systems driven by the constitutive SED1 promoter (Figure 1(1)): pYSED1-eGFP (control, eGFP secreted into the extracellular space), pYSED1-eGFP-Aga1p-N (N-terminal fusion of eGFP to Aga1p), pYSED1-eGFP-Sed1p-N (N-terminal fusion of eGFP to Sed1p), pYSED1-Aga1p-eGFP-C (C-terminal fusion of eGFP to Aga1p), and pYSED1-Sed1p-eGFP-C (C-terminal fusion of eGFP to Sed1p).
All plasmids contained the SED1 promoter, α-factor signal peptide, eGFP gene, and CYC1 terminator. After transformation into BY4741, cells were cultured in SD-URA medium for 24 h, harvested, and imaged by confocal fluorescence microscopy. As shown in Figure 1(2), the control strain (pYSED1-eGFP) exhibited intracellular green fluorescence, whereas all four anchor-containing strains displayed fluorescence localized to the cell wall, confirming successful surface anchoring of eGFP via Aga1p or Sed1p.
Figure 1.
Schematic representation of constructs and assembly strategy (1) and Construction of yeast surface display plasmids and confocal fluorescence microscopy images of recombinant yeast (2). A: BY4741(pYSED1-eGFP), B: BY4741(pYSED1-eGFP-Aga1p-N), C: BY4741(pYSED1-eGFP-Sed1p-N), D: BY4741(pYSED1-Aga1p-eGFP-C), E: BY4741(pYSED1-Sed1p-eGFP-C).
Figure 1.
Schematic representation of constructs and assembly strategy (1) and Construction of yeast surface display plasmids and confocal fluorescence microscopy images of recombinant yeast (2). A: BY4741(pYSED1-eGFP), B: BY4741(pYSED1-eGFP-Aga1p-N), C: BY4741(pYSED1-eGFP-Sed1p-N), D: BY4741(pYSED1-Aga1p-eGFP-C), E: BY4741(pYSED1-Sed1p-eGFP-C).
Quantitative fluorescence measurements at three temperatures (20 °C, 25 °C, and 30 °C) are presented in A–C. All anchor-bearing strains showed significantly higher fluorescence than the control, validating the functionality of both anchoring proteins. At 20 °C and 25 °C, fluorescence values remained stable over time (8 h vs. 48 h), indicating that eGFP was fully displayed within 8 h under lower temperatures. In contrast, at 30 °C, fluorescence peaked at 8 h and subsequently declined, suggesting that elevated temperature compromises the stability of surface-displayed eGFP. Overall, lower cultivation temperatures (20 °C and 25 °C) yielded markedly higher fluorescence intensities than 30 °C, underscoring the benefit of low-temperature culture for YSD.
Among the four anchor-fusion combinations, the Sed1p anchor consistently outperformed Aga1p across all temperatures and fusion orientations. Furthermore, C-terminal fusion of eGFP to Sed1p produced higher fluorescence than N-terminal fusion. The best performing strain, BY4741 (pYSED1-Sed1p-eGFP-C), reached a maximum fluorescence of 3550.4 at 25 °C (D). This value was 46.8% higher than that of BY4741 (pYSED1-Aga1p-eGFP-C) and 16.6% higher than BY4741 (pYSED1-eGFP-Sed1p-N) under the same condition. At 20 °C, the fluorescence of this strain increased further to 4147.8, representing a 16.8% improvement over 25 °C and a 115.7% improvement over 30 °C. Compared to the weakest surface-display system, the optimized pYSED1-Sed1p-eGFP-C system achieved a 3.6-fold enhancement in fluorescence, demonstrating a substantial improvement in YSD capacity.
Figure 2.
The fluorescence value of yeast surface displays GFP at different cultural temperatures. (A) fluorescence value of GFP displayed on yeast surface at 20 ℃; (B) fluorescence value of GFP displayed on yeast surface at 25 ℃; (C) fluorescence value of GFP displayed on yeast surface at 30 ℃; (D) the highest fluorescence value of GFP displayed on yeast surface after 16 h of culture. SED1-E: BY4741 (pYSED1-eGFP), SED1-E-A: BY4741(pYSED1-eGFP-Aga1p-N), SED1-E-S: BY4741(pYSED1-eGFP-Sed1p-N), SED1-A-E: BY4741(pYSED1-Aga1p-eGFP-C), SED1-S-E: BY4741(pYSED1-Sed1p-eGFP-C).
Figure 2.
The fluorescence value of yeast surface displays GFP at different cultural temperatures. (A) fluorescence value of GFP displayed on yeast surface at 20 ℃; (B) fluorescence value of GFP displayed on yeast surface at 25 ℃; (C) fluorescence value of GFP displayed on yeast surface at 30 ℃; (D) the highest fluorescence value of GFP displayed on yeast surface after 16 h of culture. SED1-E: BY4741 (pYSED1-eGFP), SED1-E-A: BY4741(pYSED1-eGFP-Aga1p-N), SED1-E-S: BY4741(pYSED1-eGFP-Sed1p-N), SED1-A-E: BY4741(pYSED1-Aga1p-eGFP-C), SED1-S-E: BY4741(pYSED1-Sed1p-eGFP-C).
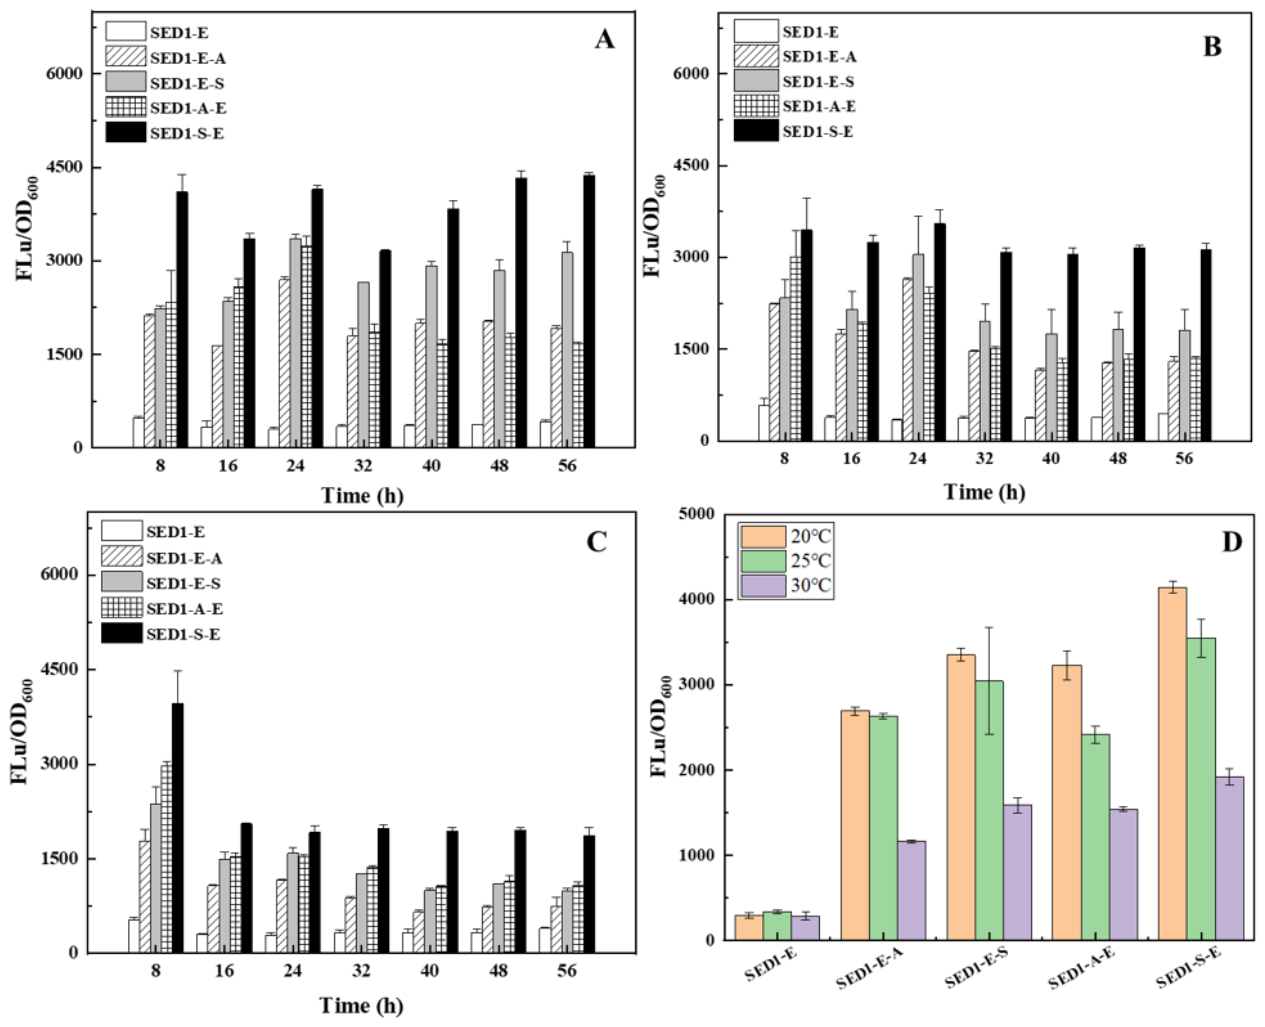
The superior performance of Sed1p over Aga1p may be attributed to differences in cell wall integration depth and accessibility. Previous studies have shown that Sed1p directs target proteins to the outermost layer of the yeast cell wall, whereas Aga1p tends to embed more deeply, potentially limiting exposure to external ligands and reducing fluorescence detection efficiency [6]. The advantage of C-terminal fusion over N-terminal fusion likely arises because the N-terminus of the anchor protein is essential for proper secretion signal processing and cell wall attachment; fusing eGFP to the N-terminus may sterically hinder these processes, leading to lower display yields. Furthermore, the observed temperature-dependent stability of surface-displayed eGFP is consistent with reports that lower temperatures reduce cellular protease activity and membrane fluidity, thereby preserving the integrity of displayed proteins [18]. These findings collectively suggest that the combination of a moderately strong constitutive promoter (SED1), an outer-layer anchor (Sed1p), and a C-terminal fusion orientation represents a robust design principle for optimizing YSD under constitutive expression.
3.2. Constructed GAP1-Based YSD Systems and eGFP Surface Display
We next evaluated the effect of anchor proteins (Aga1p and Sed1p) and fusion orientations (N-terminal vs. C-terminal) under the constitutive GAP1 promoter. Five plasmids were constructed (Figure 3(1)): pYGAP1-eGFP (control, lacking anchor protein, resulting in eGFP secretion into the extracellular space), pYGAP1-eGFP-Aga1p-N, pYGAP1-eGFP-Sed1p-N, pYGAP1-Aga1p-eGFP-C, and pYGAP1-Sed1p-eGFP-C. All plasmids contained the GAP1 promoter, α-factor signal peptide, eGFP gene, and CYC1 terminator.
Figure 3.
Schematic representation of constructs and assembly strategy (1) and construction of yeast surface display plasmids and confocal fluorescence microscopy images of recombinant yeast (2). A: BY4741(pYGAP1-eGFP), B: BY4741(pYGAP1-eGFP-Aga1p-N), C: BY4741(pYGAP1-eGFP-Sed1p-N), D: BY4741(pYGAP1-Aga1p-eGFP-C), E: BY4741 (pYGAP1 -Sed1p-eGFP-C).
Figure 3.
Schematic representation of constructs and assembly strategy (1) and construction of yeast surface display plasmids and confocal fluorescence microscopy images of recombinant yeast (2). A: BY4741(pYGAP1-eGFP), B: BY4741(pYGAP1-eGFP-Aga1p-N), C: BY4741(pYGAP1-eGFP-Sed1p-N), D: BY4741(pYGAP1-Aga1p-eGFP-C), E: BY4741 (pYGAP1 -Sed1p-eGFP-C).
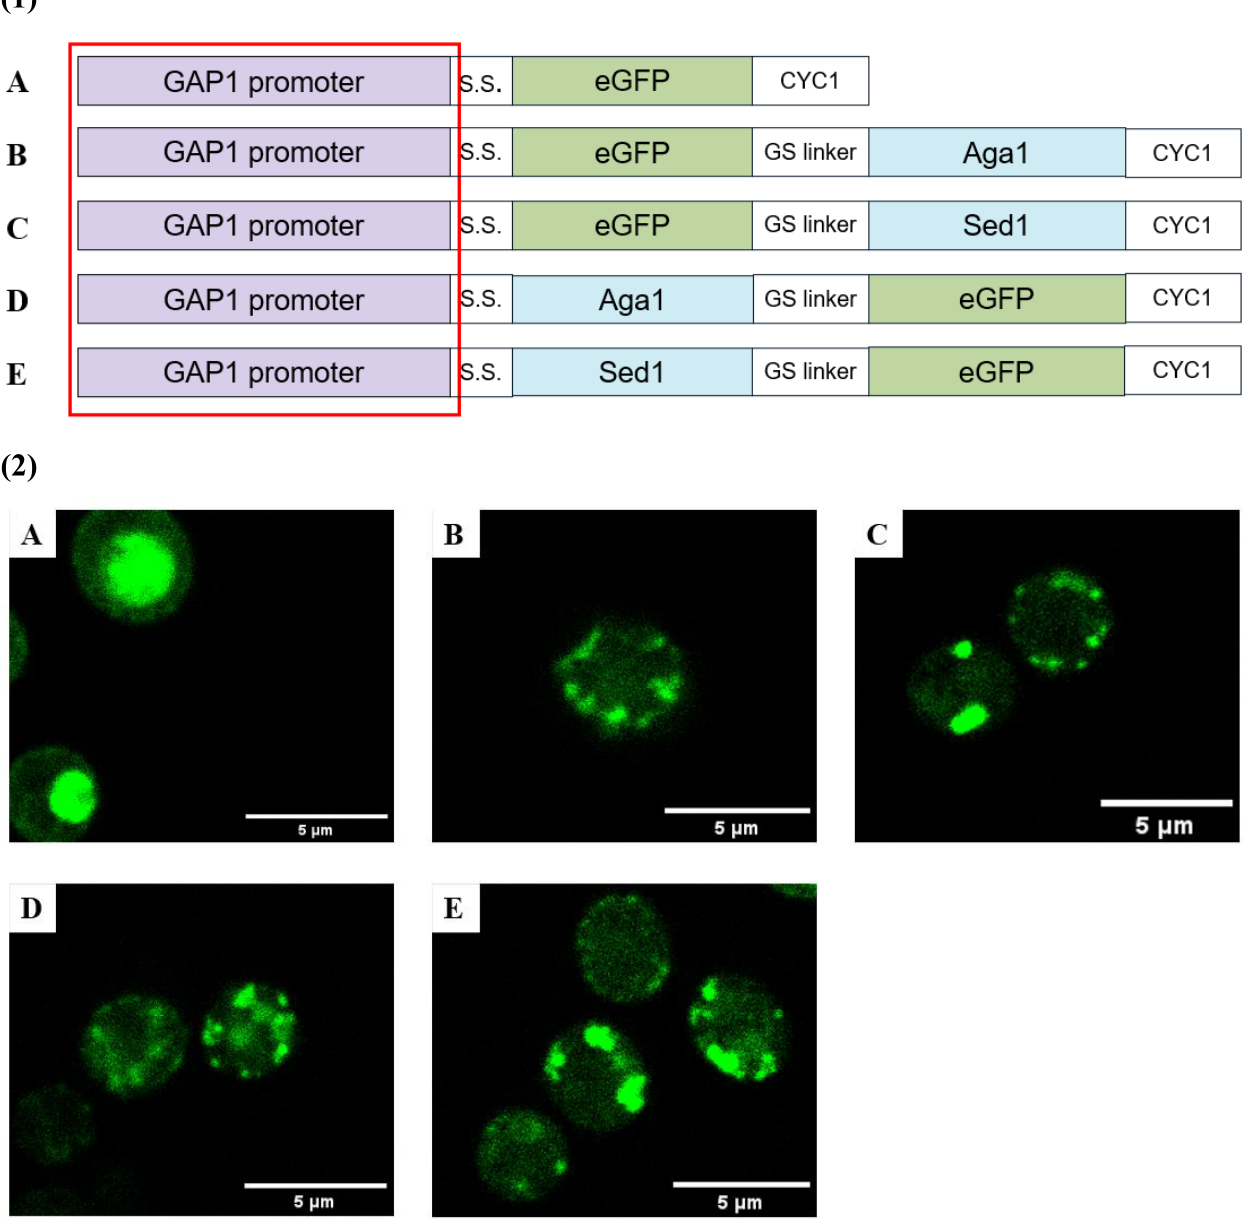
After transformation into BY4741, cells were cultured in SD-URA medium for 24 h and examined by confocal fluorescence microscopy. As shown in Figure 3(2), the control strain (pYGAP1-eGFP) displayed intracellular green fluorescence, whereas all four anchor-bearing strains exhibited fluorescence localized to the cell wall, confirming successful surface display of eGFP via Aga1p or Sed1p.
Figure 4.
The fluorescence value of yeast surface displays GFP at different cultural temperatures. (A) fluorescence value of GFP displayed on yeast surface at 20 ℃; (B) fluorescence value of GFP displayed on yeast surface at 25 ℃; (C) fluorescence value of GFP displayed on yeast surface at 30 ℃; (D) the highest fluorescence value of GFP displayed on yeast surface after 16 h of culture. GAP1-E: BY4741 (pYGAP1-eGFP), GAP1-E-A: BY4741(pYGAP1-eGFP-Aga1p-N), GAP1-E-S: BY4741(pYGAP1-eGFP-Sed1p-N), GAP1-A-E: BY4741(pYGAP1-Aga1p-eGFP-C), GAP1-S-E: BY4741(pYGAP1-Sed1p-eGFP-C).
Figure 4.
The fluorescence value of yeast surface displays GFP at different cultural temperatures. (A) fluorescence value of GFP displayed on yeast surface at 20 ℃; (B) fluorescence value of GFP displayed on yeast surface at 25 ℃; (C) fluorescence value of GFP displayed on yeast surface at 30 ℃; (D) the highest fluorescence value of GFP displayed on yeast surface after 16 h of culture. GAP1-E: BY4741 (pYGAP1-eGFP), GAP1-E-A: BY4741(pYGAP1-eGFP-Aga1p-N), GAP1-E-S: BY4741(pYGAP1-eGFP-Sed1p-N), GAP1-A-E: BY4741(pYGAP1-Aga1p-eGFP-C), GAP1-S-E: BY4741(pYGAP1-Sed1p-eGFP-C).
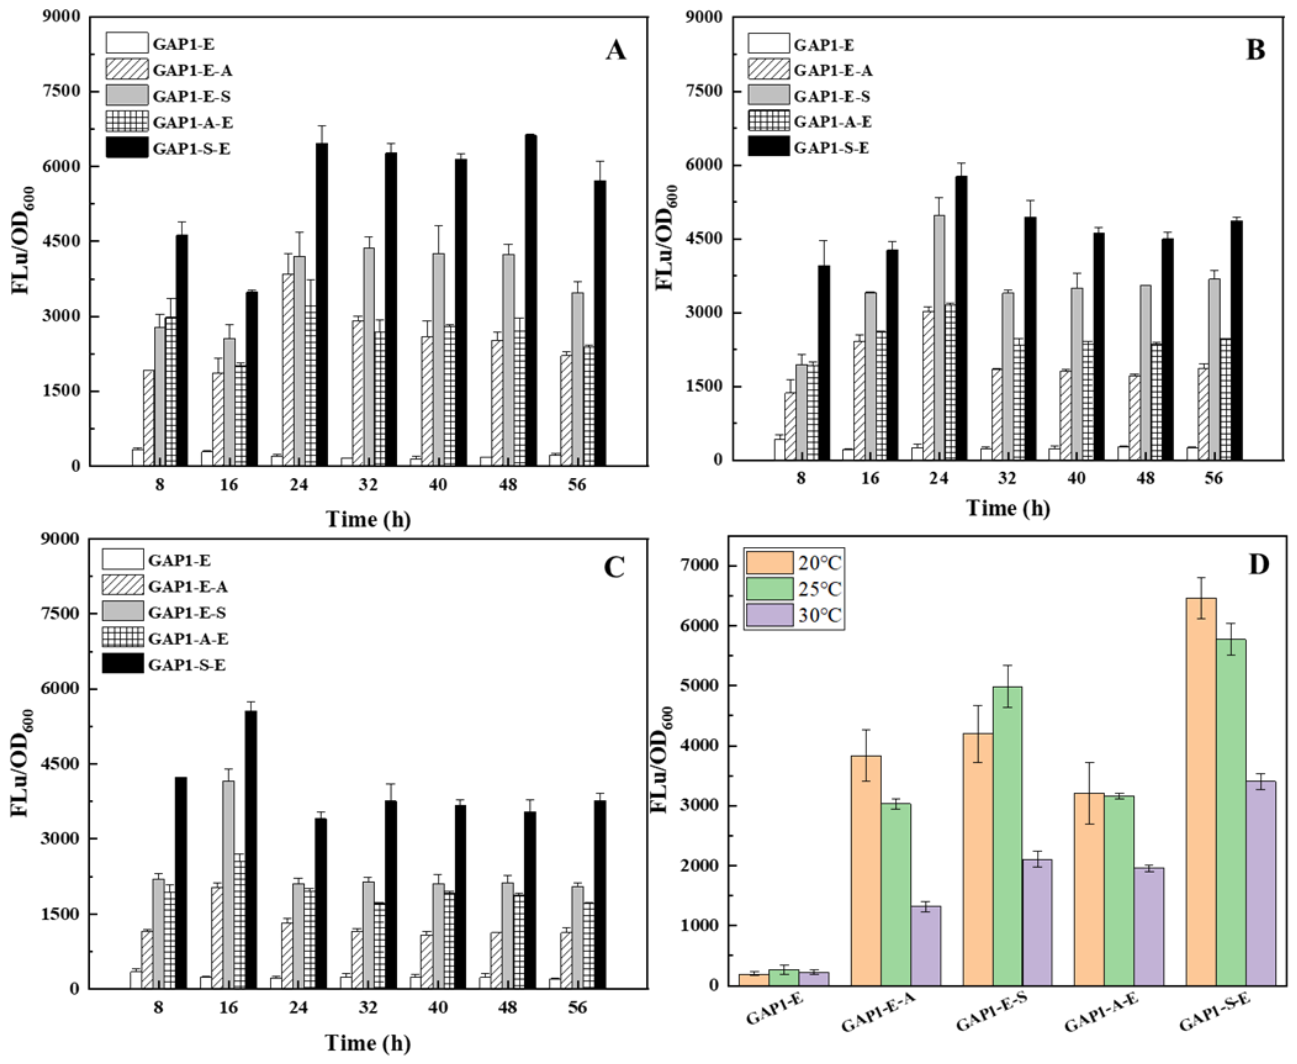
Quantitative fluorescence measurements at three temperatures are presented in A–C. All anchor-containing strains showed significantly higher fluorescence than thecontrol, validating the functionality of both anchors. At 20 °C and 25 °C, fluorescence peaked at 24 h, indicating that surface display was completed within this timeframe under lower temperatures. In contrast, at 30 °C, fluorescence peaked at 8 h and subsequently declined, suggesting that higher temperature reduces the stability of surface-displayed eGFP. Overall, low-temperature cultivation (20 °C and 25 °C) yielded substantially higher fluorescence than 30 °C, consistent with the trend observed for the SED1 promoter.
Comparison of anchor proteins revealed that Sed1p consistently outperformed Aga1p across all temperatures and fusion orientations. Furthermore, C-terminal fusion of eGFP to either anchor produced higher fluorescence than N-terminal fusion, corroborating the findings from the SED1-based systems. As shown in D, the best-performing strain, BY4741 (pYGAP1-Sed1p-eGFP-C), reached a maximum fluorescence of 5771.2 at 25 °C. This value was 82.7% higher than that of BY4741 (pYGAP1-Aga1p-eGFP-C) and 15.3% higher than BY4741 (pYGAP1-eGFP-Sed1p-N) under the same condition. At 20 °C, the fluorescence of this strain increased further to 6466.0, representing a 12.0% improvement over 25 °C and an 89.9% improvement over 30 °C. Compared to the weakest surface-display system, the optimized pYGAP1-Sed1p-eGFP-C system achieved a 3.9-fold enhancement in fluorescence, further demonstrating the potential of combinatorial optimization for improving YSD efficiency.
Notably, the absolute fluorescence values achieved with the GAP1 promoter were considerably higher than those obtained with the SED1 promoter under identical anchor-fusion configurations. For example, pYGAP1-Sed1p-eGFP-C at 25 °C exhibited a fluorescence intensity 62.5% greater than that of pYSED1-Sed1p-eGFP-C (5771.2 vs. 3550.4). This difference likely reflects the stronger transcriptional activity of the GAP1 promoter relative to SED1 in S. cerevisiae under glucose-repressed conditions [19]. The fact that the same anchor-fusion preference (Sed1p + C-terminal) held true for both promoters strongly suggests that the optimal design principles are promoter-independent, at least among constitutive promoters. Additionally, the longer time required to reach peak fluorescence under GAP1 (24 h) compared to SED1 (8 h) may be due to differences in promoter kinetics or secretory pathway saturation. From a practical standpoint, the GAP1-driven system offers a higher overall yield but requires a longer cultivation period, whereas the SED1-driven system provides faster display. These trade-offs should be considered when designing YSD platforms for specific applications, such as high-throughput screening (where speed is critical) versus preparative production (where yield is prioritized).
3.3. Constructed GAL1-Based YSD Systems and eGFP Surface Display
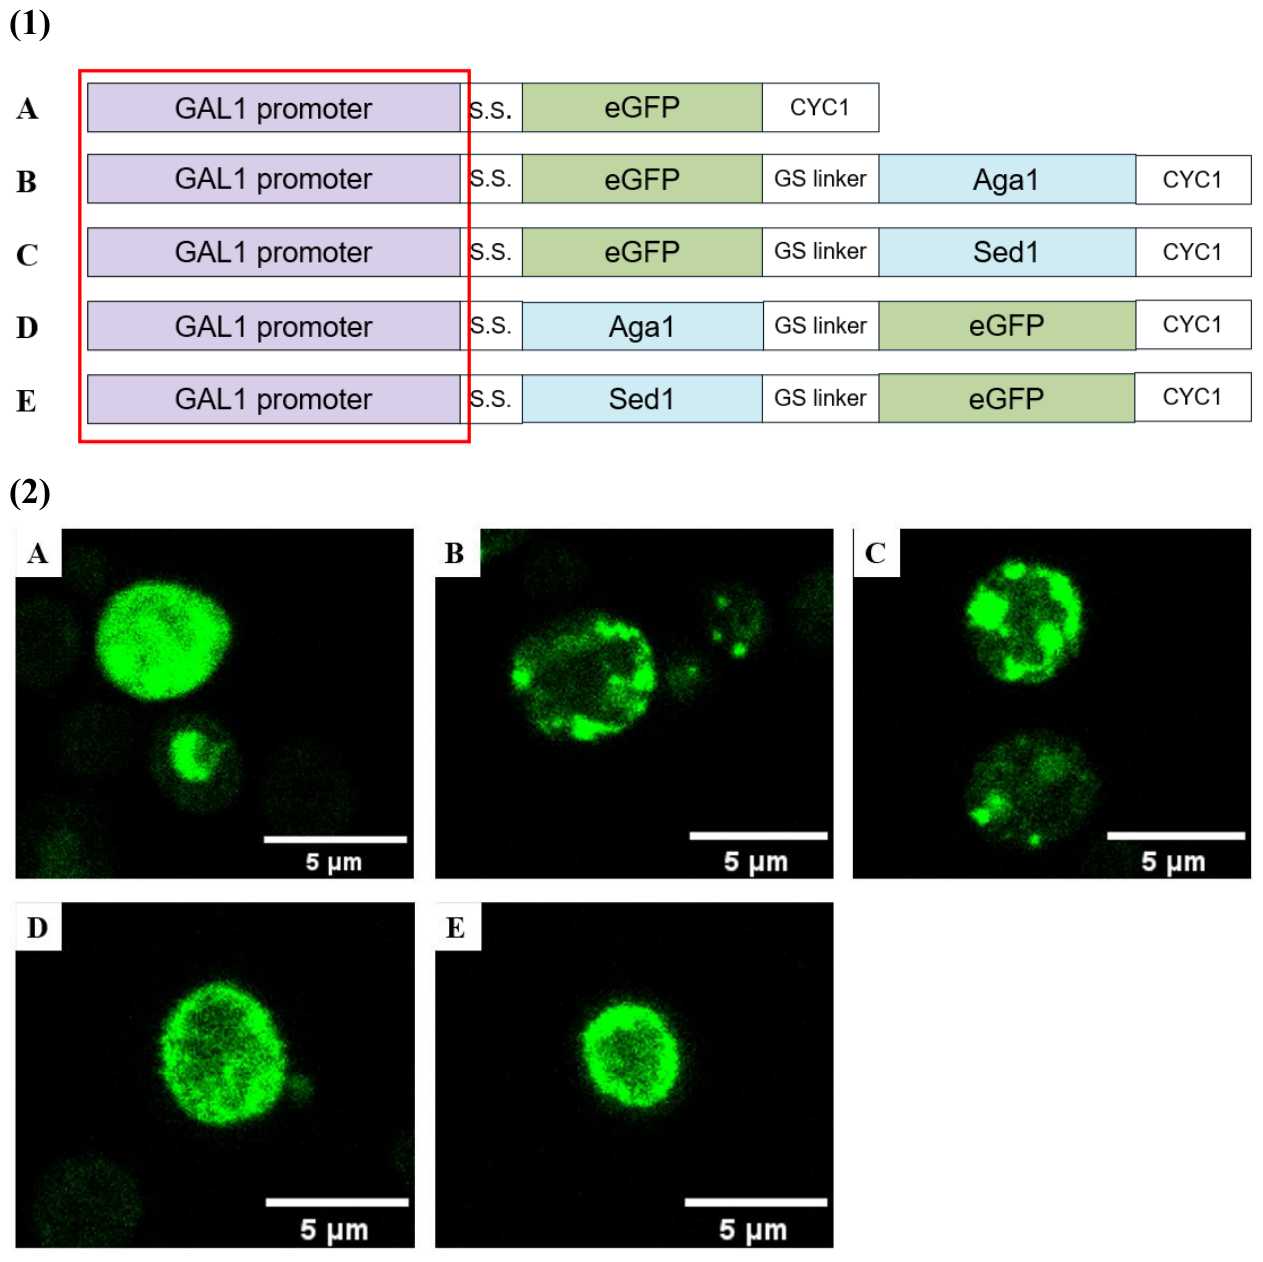
We next evaluated the effect of anchor proteins (Aga1p and Sed1p) and fusion orientations (N-terminal vs. C-terminal) under the inducible GAL1 promoter. Unlike constitutive promoters, the GAL1 promoter is activated by galactose, enabling temporal control of target gene expression. Cells were first grown in SD-URA liquid medium to logarithmic phase and then transferred to SG-URA induction medium containing galactose for 24 h. Five plasmids were constructed (Figure 5(1)): pYGAL1-eGFP (control, lacking anchor protein), pYGAL1-eGFP-Aga1p-N, pYGAL1-eGFP-Sed1p-N, pYGAL1-Aga1p-eGFP-C, and pYGAL1-Sed1p-eGFP-C. All plasmids contained the GAL1 promoter, α-factor signal peptide, eGFP gene, and CYC1 terminator.
After transformation into BY4741, cells were cultured in SD-URA medium for 12 h, transferred to SG-URA induction medium for 24 h, and examined by confocal fluorescence microscopy. As shown in Figure 5(2), the control strain (pYGAL1-eGFP) displayed intracellular green fluorescence, whereas all four anchor-bearing strains exhibited fluorescence localized to the cell wall, confirming successful surface display of eGFP via Aga1p or Sed1p under inducible conditions.
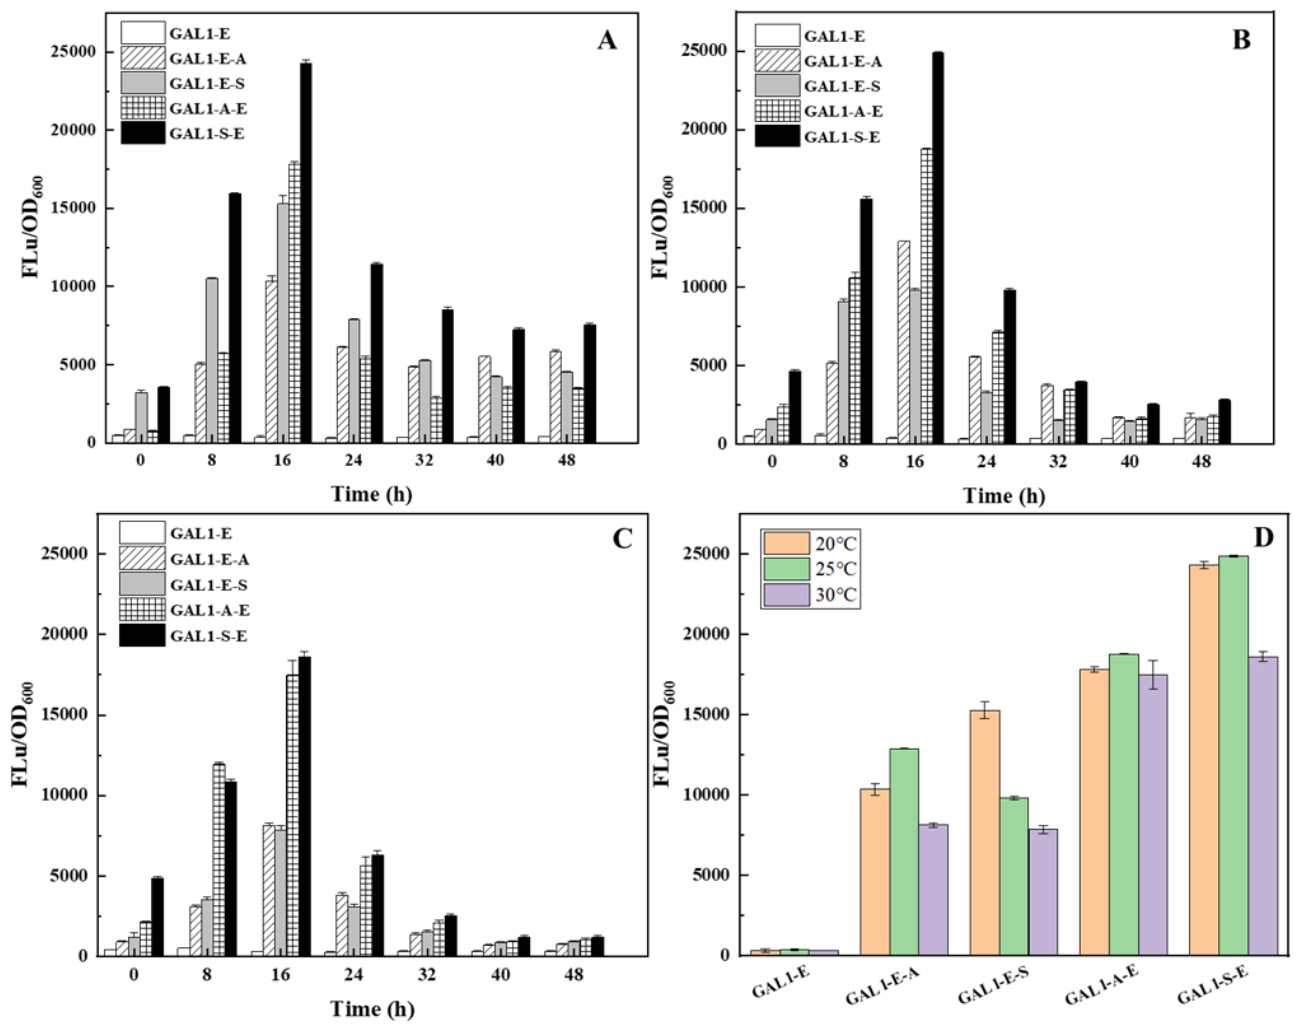
Quantitative fluorescence measurements at three temperatures after 16 h of induction are presented in A–C. All anchor-containing strains showed significantly higher fluorescence than the control, validating the functionality of both anchors under the inducible system. Notably, fluorescence peaked at 16 h and subsequently declined with extended culture time, a pattern distinct from that observed with constitutive promoters. This behavior is consistent with Reider Apel et al. [18], who reported that although GAL1 is one of the strongest promoters in yeast, its activity decreases significantly during late growth stages. Comparison across temperatures again revealed that low-temperature cultivation (20 °C and 25 °C) yielded substantially higher fluorescence than 30 °C, reinforcing the beneficial effect of lower temperatures on YSD stability.
Figure 5.
Schematic representation of constructs and assembly strategy (1) and construction of yeast surface display plasmids and confocal fluorescence microscopy images of recombinant yeast (2). A: BY4741(pYGAL1-eGFP), B: BY4741(pYGAL1-eGFP-Aga1p-N), C: BY4741(pYGAL1-eGFP-Sed1p-N), D: BY4741(pYGAL1-Aga1p-eGFP-C), E: BY4741(pYGAL1-Sed1p-eGFP-C).
Figure 5.
Schematic representation of constructs and assembly strategy (1) and construction of yeast surface display plasmids and confocal fluorescence microscopy images of recombinant yeast (2). A: BY4741(pYGAL1-eGFP), B: BY4741(pYGAL1-eGFP-Aga1p-N), C: BY4741(pYGAL1-eGFP-Sed1p-N), D: BY4741(pYGAL1-Aga1p-eGFP-C), E: BY4741(pYGAL1-Sed1p-eGFP-C).
Consistent with the trends observed for SED1 and GAP1, Sed1p outperformed Aga1p across all temperatures and fusion orientations, and C-terminal fusion produced higher fluorescence than N-terminal fusion. As shown in D, the best-performing strain, BY4741 (pYGAL1-Sed1p-eGFP-C), reached a maximum fluorescence of 24,876.7 at 25 °C. This value was 32.4% higher than that of BY4741 (pYGAL1-Aga1p-eGFP-C) and 153.6% higher than BY4741 (pYGAL1-eGFP-Sed1p-N) under the same condition. When cultured at different temperatures, the fluorescence of BY4741 (pYGAL1-Sed1p-eGFP-C) at 25 °C was slightly higher than at 20 °C, and 33.6% higher than at 30 °C. Compared to the weakest surface-display system in this group, the optimized pYGAL1-Sed1p-eGFP-C system achieved a 2.1-fold enhancement in fluorescence.
Remarkably, the absolute fluorescence values obtained with the GAL1 promoter far exceeded those of both constitutive promoters. The pYGAL1-Sed1p-eGFP-C system at 25 °C achieved a fluorescence intensity of 24,876.7, which is 7.0-fold higher than the best SED1-based system (3,550.4) and 4.3-fold higher than the best GAP1-based system (5,771.2). This dramatic improvement underscores the superior transcriptional strength of the GAL1 promoter under inducing conditions, as previously documented [13]. Interestingly, unlike the constitutive systems where 20 °C consistently outperformed 25 °C, the GAL1-driven system showed slightly higher fluorescence at 25 °C than at 20 °C. This may reflect a temperature dependence of galactose uptake or metabolic activation of the GAL pathway; lower temperatures could slow down inducer transport or the Gal4p/Gal80p regulatory cascade, partially offsetting the benefits of reduced proteolysis. Nevertheless, the same anchor-fusion hierarchy (Sed1p > Aga1p; C-terminal > N-terminal) was maintained across all three promoter contexts, strongly suggesting that these preferences are intrinsic properties of the anchor proteins and fusion geometry, independent of promoter strength. The rapid decline in fluorescence after 16 h under GAL1 induction highlights a critical limitation: while the inducible system offers very high peak expression, its window of maximal display is narrow. For applications requiring sustained surface presentation, constitutive promoters may be preferable despite lower absolute yields. Conversely, for applications such as library screening or transient functional assays where high instantaneous display is paramount, the GAL1-based system provides a compelling advantage.
Figure 6.
The fluorescence value of yeast surface displays GFP at different cultural temperatures. (A) fluorescence value of GFP displayed on yeast surface at 20 ℃; (B) fluorescence value of GFP displayed on yeast surface at 25 ℃; (C) fluorescence value of GFP displayed on yeast surface at 30 ℃; (D) the highest fluorescence value of GFP displayed on yeast surface after 16 h of culture. GAL1-E: BY4741(pYGAL1-eGFP), GAL1-E-A: BY4741(pYGAL1-eGFP-Aga1p-N), GAL1-E-S: BY4741(pYGAL1-eGFP-Sed1p-N), GAL1-A-E: BY4741(pYGAL1-Aga1p-eGFP-C), GAL1-S-E: BY4741(pYGAL1-Sed1p-eGFP-C).
Figure 6.
The fluorescence value of yeast surface displays GFP at different cultural temperatures. (A) fluorescence value of GFP displayed on yeast surface at 20 ℃; (B) fluorescence value of GFP displayed on yeast surface at 25 ℃; (C) fluorescence value of GFP displayed on yeast surface at 30 ℃; (D) the highest fluorescence value of GFP displayed on yeast surface after 16 h of culture. GAL1-E: BY4741(pYGAL1-eGFP), GAL1-E-A: BY4741(pYGAL1-eGFP-Aga1p-N), GAL1-E-S: BY4741(pYGAL1-eGFP-Sed1p-N), GAL1-A-E: BY4741(pYGAL1-Aga1p-eGFP-C), GAL1-S-E: BY4741(pYGAL1-Sed1p-eGFP-C).
3.4. Comparative Analysis of Promoter, Anchor Protein, and Fusion Orientation Effects on YSD Efficiency
To systematically evaluate the contribution of each genetic determinant to yeast surface display (YSD) efficiency, we compared the fluorescence intensities of recombinant strains carrying plasmids with different combinations of promoters (SED1, GAP1, GAL1), anchor proteins (Aga1p, Sed1p), and fusion orientations (N-terminal vs. C-terminal). Measurements were taken at the optimal time points determined for each system: 24 h for constitutive promoters (SED1 and GAP1) and 16 h for the inducible GAL1 promoter. The complete dataset is summarized in Table 2.
3.4.1. Effect of Promoter Type on Display Efficiency
Among the three promoters tested, the inducible GAL1 promoter yielded by far the highest surface display levels. The optimal strain, BY4741 (pYGAL1-Sed1p-eGFP-C), achieved a fluorescence intensity of 24,876.7 (FLu/OD₆₀₀), which was over 6-fold higher than the best SED1-driven strain (pYSED1-Sed1p-eGFP-C, 3,550.4) and more than 3.3-fold higher than the best GAP1-driven strain (pYGAP1-Sed1p-eGFP-C, 5,771.2). Among the constitutive promoters, GAP1 significantly outperformed SED1, with a 62.6% increase in fluorescence intensity for the Sed1p-C-terminal configuration.
These results underscore the superior transcriptional strength of the GAL1 promoter under inducing conditions, consistent with its established role in driving high-level synthesis of natural products in S. cerevisiae, including artemisinic acid [18], caffeic acid[19], and sesquiterpenes [20]. However, it is important to note that the GAL1 system’s peak expression is transient; fluorescence declined sharply after 16 h, reflecting a characteristic decrease in promoter activity during late growth stages [18]. In contrast, constitutive promoters provided more stable, albeit lower, display levels over extended culture periods. Therefore, the choice of promoter should be guided by the specific application: the GAL1 system is ideal for high-throughput screening or transient functional assays where maximum instantaneous display is required, whereas constitutive promoters are better suited for sustained surface presentation or preparative processes.
3.4.2. Effect of Anchor Protein on Display Efficiency
Across all three promoter backgrounds, Sed1p consistently outperformed Aga1p. Replacing Aga1p with Sed1p led to fluorescence increases of 46.8%, 82.7%, and 32.4% for the SED1, GAP1, and GAL1 systems, respectively (Table 2). This consistent advantage suggests that Sed1p is intrinsically more effective for surface display, independent of promoter strength.
We attribute this superiority to the significant difference in molecular size between the two anchors: Sed1p (~39 kDa) is approximately half the size of Aga1p (~78 kDa). Smaller anchor protein likely imposes less steric hindrance, allowing a higher density of eGFP molecules to be displayed on the cell surface. Additionally, previous studies have shown that Sed1p directs target proteins to the outermost layer of the yeast cell wall, whereas Aga1p tends to localize more deeply [6]; this differential positioning may further enhance the accessibility and detectability of Sed1p-anchored eGFP. These findings provide a clear rationale for prioritizing Sed1p when designing high-efficiency YSD platforms.
3.4.3. Effect of Fusion Orientation on Display Efficiency
Fusion orientation also exerted a pronounced and consistent effect: C-terminal fusion of eGFP to the anchor protein uniformly outperformed N-terminal fusion across all promoter-anchor combinations (Table 2). The magnitude of this advantage was particularly striking under the strong GAL1 promoter, where the C-terminal fusion to Sed1p (pYGAL1-Sed1p-eGFP-C) showed a 153.6% increase in fluorescence compared to its N-terminal counterpart (pYGAL1-eGFP-Sed1p-N).
We propose that C-terminal fusion is less disruptive to the native conformation and folding of eGFP, as the N-terminus of the anchor protein is typically involved in secretion signal processing and cell wall attachment. Fusing eGFP to the N-terminus may interfere with these early trafficking events, reducing the efficiency of surface delivery. The greater impact observed with the GAL1 promoter likely reflects the higher protein burden imposed by strong transcription, which amplifies any inefficiencies in the secretion and anchoring pathway. Collectively, these results establish C-terminal fusion as a universal design principle for maximizing surface display of eGFP and, by extension, other heterologous proteins.
3.4.4. Synergistic Optimization and Overall Performance
The most effective system identified in this study—pYGAL1-Sed1p-eGFP-C—combines the strongest promoter (GAL1), the most efficient anchor (Sed1p), and the optimal fusion orientation (C-terminal). This configuration achieved a fluorescence intensity of 24,876.7, representing a >10-fold improvement over the initial reference system (pYSED1-Aga1p-eGFP-C). Importantly, the hierarchical preferences observed (GAL1 > GAP1 > SED1; Sed1p > Aga1p; C-terminal > N-terminal) were remarkably consistent across all experimental conditions, suggesting that these design principles are robust and transferable. Our work therefore provides a rational framework for engineering high-efficiency YSD platforms, moving beyond empirical trial-and-error toward predictable optimization.
4. Conclusions
In this study, we systematically evaluated the combinatorial effects of three key genetic determinants—promoter type (SED1, GAP1, GAL1), anchor protein (Aga1p, Sed1p), and fusion orientation (N-terminal vs. C-terminal)—on the efficiency of yeast surface display (YSD) using eGFP as a quantifiable reporter. Through parallel construction and comparative analysis of a series of recombinant Saccharomyces cerevisiae strains, we established a clear hierarchy of design preferences: the inducible GAL1 promoter outperformed constitutive promoters; Sed1p consistently surpassed Aga1p; and C-terminal fusion proved universally superior to N-terminal fusion.
The optimally configured system, pYGAL1-Sed1p-eGFP-C, achieved the highest surface display efficiency, yielding an eGFP fluorescence intensity over 10.3-fold higher than the initial reference system (pYSED1-Aga1p-eGFP-C) and 8.4-fold higher than the alternative N-terminal fusion design (pYSED1-eGFP-Aga1p-N). Beyond establishing a new performance benchmark, our work reveals that the observed design principles are robust and promoter-independent, providing a rational and transferable framework for engineering high-efficiency YSD platforms.
These findings not only demonstrate the practical utility of the pYGAL1-Sed1p-eGFP-C system for displaying heterologous proteins on yeast surfaces but also offer actionable guidelines for future YSD optimization. By decoupling the contributions of individual genetic elements, this study moves the field beyond empirical trial-and-error toward predictive design, with broad implications for protein engineering, biocatalysis, and synthetic biology.
Author Contributions
Conceptualization and methodology, Z.Y.; software, validation, and formal analysis, F.J.; data curation, writing—original draft preparation, W.N.; writing—review and editing, supervision, project administration, funding acquisition, k.J. All authors have read and agreed to the published version of the manuscript.
Funding
This research was funded by the National Natural Science Foundation of China (No. 21978244) and Natural Science Foundation of Fujian, China ((No. 2023J01019) and the Scientific Research Foundation of State Key Laboratory of Vaccines for Infectious Diseases, Xiang An Biomedicine Laboratory (2023XAKJ0102062).
Institutional Review Board Statement
Not applicable
Informed Consent Statement
Not applicable.
Data Availability Statement
The original contributions presented in this study are included in the article. Further inquiries can be directed to the corresponding author
Conflicts of Interest
The authors declare no conflicts of interest.
References
- Lozančić, M.; Sk. Hossain, A.; Mrša, V.; Teparić, R. Surface Display—An Alternative to Classic Enzyme Immobilization. Catalysts 2019, 9, 728. [Google Scholar] [CrossRef]
- Ye, M.; Ye, Y.; Du, Z.; Chen, G. Cell-surface engineering of yeasts for whole-cell biocatalysts. Bioprocess Biosyst. Eng. 2021, 44, 1003–1019. [Google Scholar] [CrossRef] [PubMed]
- Eisenhaber, B.; Bork, P.; Eisenhaber, F. Post-translational GPI lipid anchor modification of proteins in kingdoms of life: analysis of protein sequence data from complete genomes. Protein Eng. 2001, 14, 17–25. [Google Scholar] [CrossRef] [PubMed]
- Mei, M.; Lu, M.; Li, S.; Ren, X.; Xing, B.; Hu, Y.; Wu, Y.; Chen, H.; Wang, L.; Yi, L.; et al. Development of nanobodies specific to clumping factors A of Staphylococcus aureus by yeast surface display. Int. J. Biol. Macromol. 2024, 259, 129208. [Google Scholar] [CrossRef] [PubMed]
- Bidard, F.; Bony, M.; Blondin, B.; Dequin, S.; Barre, P. The Saccharomyces cerevisiae FLO1 flocculation gene encodes for a cell surface protein. Yeast 1995, 11, 809–822. [Google Scholar] [CrossRef] [PubMed]
- Inokuma, K.; Kurono, H.; den Haan, R.; van Zyl, W.H.; Hasunuma, T.; Kondo, A. Novel strategy for anchorage position control of GPI-attached proteins in the yeast cell wall using different GPI-anchoring domains. Metab. Eng. 2020, 57, 110–117. [Google Scholar] [CrossRef] [PubMed]
- Ecker, M.; Deutzmann, R.; Lehle, L.; Mrsa, V.; Tanner, W. Pir proteins of Saccharomyces cerevisiae are attached to beta-1,3-glucan by a new protein-carbohydrate linkage. J. Biol. Chem. 2006, 281, 11523–11529. [Google Scholar] [CrossRef] [PubMed]
- Yang, N.; Yu, Z.; Jia, D.; Xie, Z.; Zhang, K.; Xia, Z.; Lei, L.; Qiao, M. The contribution of Pir protein family to yeast cell surface display. Appl. Microbiol. Biotechnol. 2014, 98, 2897–2905. [Google Scholar] [CrossRef] [PubMed]
- Li, S.; Qiao, J.; Lin, S.; Liu, Y.; Ma, L. A Highly Efficient Indirect P. pastoris Surface Display Method Based on the CL7/Im7 Ultra-High-Affinity System. Molecules 2019, 24, 1483–1497. [Google Scholar] [CrossRef] [PubMed]
- Yang, X.; Tang, H.; Song, M.; Shen, Y.; Hou, J.; Bao, X. Development of novel surface display platforms for anchoring heterologous proteins in Saccharomyces cerevisiae. Microb. Cell Fact. 2019, 18, 85. [Google Scholar] [CrossRef] [PubMed]
- He, S.; Zhang, Z.; Lu, W. Natural promoters and promoter engineering strategies for metabolic regulation in Saccharomyces cerevisiae. J. Ind. Microbiol. Biotechnol. 2023, 50, 1–16. [Google Scholar] [CrossRef] [PubMed]
- Redden, H.; Morse, N.; Alper, H.S. The synthetic biology toolbox for tuning gene expression in yeast. FEMS Yeast Res. 2015, 15, 1–10. [Google Scholar] [CrossRef] [PubMed]
- Wu, Y.L.; Deng, J.L.; Zheng, Z.H.; Chen, N.Z.; Luo, X.Z.; Tang, H.T. Engineering an Efficient Expression Using Heterologous GAL1 Promoters and Transcriptional Activators in Saccharomyces cerevisiae. Acs Synth. Biol. 2023, 12, 1859–1867. [Google Scholar] [CrossRef] [PubMed]
- Piraine, R.E.A.; Goncalves, V.S.; Dos Santos Junior, A.G.; Cunha, R.C.; de Albuquerque, P.M.M.; Conrad, N.L.; Leite, F.P.L. Expression cassette and plasmid construction for Yeast Surface Display in Saccharomyces cerevisiae. Biotechnol. Lett. 2021, 43, 1649–1657. [Google Scholar] [CrossRef] [PubMed]
- Rakestraw, J.A.; Sazinsky, S.L.; Piatesi, A.; Antipov, E.; Wittrup, K.D. Directed evolution of a secretory leader for the improved expression of heterologous proteins and full-length antibodies in Saccharomyces cerevisiae. Biotechnol. Bioeng. 2009, 103, 1192–11201. [Google Scholar] [CrossRef] [PubMed]
- Kajiwara, K.; Aoki, W.; Ueda, M. Evaluation of the yeast surface display system for screening of functional nanobodies. AMB Express 2020, 10, 51–61. [Google Scholar] [CrossRef] [PubMed]
- Inokuma, K.; Hasunuma, T.; Kondo, A. Efficient yeast cell-surface display of exo- and endo-cellulase using the SED1 anchoring region and its original promoter. Biotechnol. Biofuels 2014, 7, 8–19. [Google Scholar] [CrossRef] [PubMed]
- Ro, D.K.; Paradise, E.M.; Ouellet, M.; Fisher, K.J.; Newman, K.L.; Ndungu, J.M.; Ho, K.A.; Eachus, R.A.; Ham, T.S.; Kirby, J.; et al. Production of the antimalarial drug precursor artemisinic acid in engineered yeast. Nature 2006, 440, 940–943. [Google Scholar] [CrossRef] [PubMed]
- Zhou, P.; Yue, C.; Shen, B.; Du, Y.; Xu, N.; Ye, L. Metabolic engineering of Saccharomyces cerevisiae for enhanced production of caffeic acid. Appl. Microbiol. Biotechnol. 2021, 105, 5809–5819. [Google Scholar] [CrossRef] [PubMed]
- Hayat, I.F.; Plan, M.; Ebert, B.E.; Dumsday, G.; Vickers, C.E.; Peng, B. Auxin-mediated induction of GAL promoters by conditional degradation of Mig1p improves sesquiterpene production in Saccharomyces cerevisiae with engineered acetyl-CoA synthesis. Microb. Biotechnol. 2021, 14, 2627–2642. [Google Scholar] [CrossRef] [PubMed]

Table 1.
Summary of eGFP display-Yeast display platform plasmids.
| plasmid | characteristic | source |
| pYGAL1-eGFP | GAL1 promoter, eGFP gene | miaolingbio |
| pYSED1-eGFP | SED1 promoter, eGFP gene | constructed by this work |
| pYSED1-eGFP-Aga1p-N | SED1 promoter, the Aga1 anchoring protein gene was inserted into the 3 'end of the eGFP gene | constructed by this work |
| pYSED1-eGFP-Sed1p-N | SED1 promoter, the Sed1 anchoring protein gene was inserted into the 3 'end of the eGFP gene | constructed by this work |
| pYSED1-Aga1p-eGFP-C | SED1 promoter, the Aga1 anchoring protein gene was inserted into the 5 'end of the eGFP gene | constructed by this work |
| pYSED1-Sed1p-eGFP-C | SED1 promoter, the Sed1 anchoring protein gene was inserted into the 5 'end of the eGFP gene | constructed by this work |
| pYGAP1-eGFP | GAP1 promoter, eGFP gene | constructed by this work |
| pYGAP1-eGFP-Aga1p-N | GAP1 promoter, the Aga1 anchoring protein gene was inserted into the 3 'end of the eGFP gene | constructed by this work |
| pYGAP1-eGFP-Sed1p-N | GAP1 promoter, the Sed1 anchoring protein gene was inserted into the 3 'end of the eGFP gene | constructed by this work |
| pYGAP1-Aga1p-eGFP-C | GAP1 promoter, the Aga1 anchoring protein gene was inserted into the 5 'end of the eGFP gene | constructed by this work |
| pYGAP1-Sed1p-eGFP-C | GAP1 promoter, the Sed1 anchoring protein gene was inserted into the 5 'end of the eGFP gene | constructed by this work |
| pYGAL1-eGFP | GAP1 promoter | GenScript Biotech |
| pYGAL1-eGFP-Aga1p-N | GAL1 promoter, the Aga1 anchoring protein gene was inserted into the 3 'end of the eGFP gene | constructed by this work |
| pYGAL1-eGFP-Sed1p-N | GAL1 promoter, the Sed1 anchoring protein gene was inserted into the 3 'end of the eGFP gene | constructed by this work |
| pYGAL1-Aga1p-eGFP-C | GAL1 promoter, the Aga1 anchoring protein gene was inserted into the 5 'end of the eGFP gene | constructed by this work |
| pYGAL1-Sed1p-eGFP-C | GAL1 promoter, the Sed1 anchoring protein gene was inserted into the 5 'end of the eGFP gene | constructed by this work |
Table 2.
Fluorescence values of recombinant yeast strains cultured at 25 ℃.
| Fusion mode | Anchor | FLu/OD600 | ||
| Promoter | ||||
| SED1 | GAP1 | GAL1 | ||
| N-terminal | Aga1 | 2631.2±33.9 | 3029.1±88.0 | 12903.5±17.9 |
| Sed1 | 3044.9±625.6 | 4986.5±346.6 | 9810.4±105.1 | |
| C-terminal | Aga1 | 2419.0±101.2 | 3159.0±46.5 | 18789.7±35.6 |
| Sed1 | 3550.4±226.2 | 5771.2±267.8 | 24876.7±51.9 | |
Disclaimer/Publisher’s Note: The statements, opinions and data contained in all publications are solely those of the individual author(s) and contributor(s) and not of MDPI and/or the editor(s). MDPI and/or the editor(s) disclaim responsibility for any injury to people or property resulting from any ideas, methods, instructions or products referred to in the content. |
© 2026 by the authors. Licensee MDPI, Basel, Switzerland. This article is an open access article distributed under the terms and conditions of the Creative Commons Attribution (CC BY) license (http://creativecommons.org/licenses/by/4.0/).
Copyright: This open access article is published under a Creative Commons CC BY 4.0 license, which permit the free download, distribution, and reuse, provided that the author and preprint are cited in any reuse.


