

Submitted:
07 July 2026
Posted:
08 July 2026
You are already at the latest version
Abstract
Fungal immunomodulatory proteins (FIPs) have attracted increasing interest because of their reported immunomodulatory and anticancer properties. Here, we report the identification, recombinant expression, and structural characterization of FIP-ach from Am-ylostereum chailletii, together with its preliminary functional evaluation in vitro. FIP-ach consists of 114 amino acids (12.97 kDa) and was efficiently produced in Escherichia coli, yieldig a soluble recombinant protein suitable for structural and functional analyses. The crystal structure of FIP-ach was determined at 2.13 Å resolution, revealing a heart-shaped homodimer that assembles into a tetramer through characteristic intermolecular interactions. Although the overall fold is conserved among FIPs, FIP-ach exhibits distinct oligomerization interface interactions compared with previously characterized family members. In vitro, recombinant FIP-ach exhibited cytotoxic activity against LoVo colorectal cancer cells (IC₅₀ = 25.2 µg/mL). Treatment was associated with increased expression of TP53, CASP3, CASP8, CASP9, and AIFM1, together with an increased BAX/BCL2 expression ratio, indicating modulation of apoptosis-related molecular markers. These molecular changes were accompanied by activa-tion of caspase-3, caspase-8, and caspase-9 and alterations in cell-cycle distribution. However, the causal relationships between these molecular responses and cell death require further investigation. Collectively, these findings identify FIP-ach as a structurally distinct member of the FIP family and provide a foundation for future mechanistic and in vivo studies.
Keywords:
Fungal immunomodulatory protein
; Amylostereum chailletii
; recombinant expression
; colorectal cancer
; cytotoxicity
; apoptosis
1. Introduction
Colorectal cancer is the third most common cancer globally and the second leading cause of cancer-related mortality, accounting for over 1.9 million new cases and 930,000 deaths in 2020 [1]. With projections estimating a 60% increase in cases by 2040, driven by aging populations and lifestyle-related factors such as poor diet, sedentary behavior, smoking, and alcohol consumption, colorectal cancer presents a significant public health challenge. Despite advances in screening and prevention, many cases are still diagnosed at advanced stages when treatment options are limited, highlighting the need for continued identification and evaluation of novel molecules with potential anticancer activity [2,3]. Traditional treatments, such as chemotherapy and radiotherapy, while effective, often cause severe side effects, including immunosuppression and damage to healthy tissues, which significantly reduce patients' quality of life [4]. Consequently, there is growing interest in targeted biological therapies that can selectively eliminate cancer cells [5].
Recent advances in molecular biology have contributed to the development of immunomodulatory drugs, which have revolutionized the treatment of immune-related diseases [6]. Natural compounds play a critical role in the search for new anticancer agents [4]. For centuries, plants and their bioactive constituents have been central to disease treatment, with many modern drugs derived from natural sources [7]. Fungi, due to their diversity of bioactive metabolites, represent a valuable resource for novel anticancer drugs. Among fungi, species such as Ganoderma lucidum, Lentinula edodes, and Coriolus versicolor have been extensively studied, and many clinical trials have investigated their therapeutic potential [8,9]. An important direction in fungal research has been the identification of fungal immunomodulatory proteins (FIPs), for which immunomodulatory, anti-inflammatory, and in some experimental models anticancer activities have been reported. The first FIPs were isolated in the late 1980s from medicinal fungi Ganoderma lucidum [10]. Although initial challenges related to low extraction yields limited their widespread application, advances in recombinant protein expression systems and genetic engineering have facilitated their production and therapeutic exploration [11,12,13].
To date, 38 FIP family members have been identified, although only a few have been produced in heterologous expression systems [14]. Most FIPs have been derived from fungi within the Basidiomycota phylum, and some have also been identified in species of the Ascomycota phylum [15]. The first FIP identified was Ling Zhi-8 (LZ-8 or FIP-glu), isolated from Ganoderma lucidum [10]. This discovery triggered extensive research on other FIP family members, which were subsequently identified in species such as Botryobasidium botryosum [16], Chroogomphus rutilus [12] and Dichomitus squalens [17]. Multiple FIPs have been identified within a single species; for example, seven distinct FIPs have been isolated from Volvariella volvacea [18].
Contemporary research highlights the potential of FIPs as anticancer agents. Their mechanisms of action include both direct pathways—induction of apoptosis in cancer cells—and indirect pathways—activation of the host immune system to produce cytokines [19]. Due to their ability to modulate immune responses, FIPs constitute an interesting group of proteins for further investigation [20]. Notably, fungal immunomodulatory proteins (FIPs) have been extensively investigated in numerous in vitro and in vivo experimental models and exhibit diverse immunomodulatory, anti-inflammatory, and anticancer activities in various experimental models [11,21]. Importantly, For some FIPs, a favorable tolerability profile has been reported in selected animal models [22]. Moreover, recent research has explored the synergistic effects of combining FIPs with conventional anticancer drugs, although the relevance of these observations remains dependent on the experimental model used [23]. With the growing demand for innovative anticancer biopharmaceuticals, identifying new FIP members and achieving their recombinant production and characterization remain key research priorities. Understanding their mechanisms of action may contribute to the development of cancer therapies, aligned with global trends in precision medicine [24,25,26]. However, despite extensive functional studies, very few FIPs have been structurally characterized at the atomic level. Since protein function is closely tied to structure, obtaining high-resolution crystallographic data is crucial for understanding how FIPs interact with cellular targets and mediate their biological effects.
In this study, we report the identification of FIP-ach, a novel FIP derived from Amylostereum chailletii, together with its structural characterization and initial biological evaluation. We resolved its crystal structure at 2.13 Å resolution, providing insight into its unique dimer of dimers organization. Functional assays demonstrated cytotoxic activity and changes in apoptosis-associated markers. This study aims to integrate structural and functional data to provide an initial characterization of the biological activity and apoptosis-associated responses induced by FIP-ach in vitro.
2. Results
2.1. Bioinformatics analysis
A BLASTp search of the A. chailletii sequence revealed a previously uncharacterized FIP-like protein, herein designated FIP-ach, representing the first FIP family member identified from this fungal species. FIP-ach is composed of 114 amino acids, and its theoretical molecular mass (~12.97 kDa, ProtParam) falls within the expected range for FIPs. Sequence alignment showed that FIP-ach shares the highest sequence identity with FIP-tvc (67.6%), followed by FIP-gmi (66.7%), FIP-gap1 (64.3%), and LZ-8 (63.9%) (Supplementary Table S4). A Neighbor-Joining phylogenetic tree based on 20 representative FIP sequences placed FIP-ach within a separate branch of the analyzed FIP family members (Figure 1), suggesting evolutionary divergence from the other proteins included in the analysis.
Additionally, a multiple sequence alignment was performed between FIP-ach and structurally characterized FIPs with experimentally determined 3D structures available in the Protein Data Bank (PDB). The alignment, generated using Clustal X2 (Figure 2), revealed both conserved residues and variable regions among the analyzed FIP sequences.
Based on its phylogenetic placement within the analyzed FIP family and the presence of con-served structural features identified in the alignment, FIP-ach was selected for further experimental investigation. To enable downstream biochemical and cellular analyses, the protein was heterologously expressed in E. coli.
2.2. Heterologous Production and Efficient Expression of FIP-ach in E. coli
Recombinant FIP-ach (~12.97 kDa) was successfully expressed in E. coli. Following induction and purification by immobilized metal affinity chromatography (IMAC) on cobalt resin, SDS-PAGE analysis revealed a prominent protein band at approximately 15 kDa corresponding to recombinant FIP-ach in the soluble fraction (Figure 3, lane 2). Only minor amounts of the target protein were detected in the flow-through fraction (Figure 3, lanes 3–4), whereas strong protein bands were observed in the eluted fractions (lanes 5–11), indicating efficient retention on the affinity resin and subsequent recovery during elution. The final yield of purified recombinant FIP-ach was approximately 42.3 mg per liter of bacterial culture.
2.3. Structural Determination and Crystallographic Insights of FIP-Ach (PDB ID: 9Q8P )
The FIP-ach crystal was determined to belong to the trigonal space group P3₁21, with unit cell parameters a = b = 73.32 Å, c = 167.54 Å, and angles α = β = 90.00°, γ = 120.00°. Initial phases were obtained via molecular replacement using two chains of the FIP-gmi structure (PDB ID: 3KCW) as the search model. The final structure was refined to a resolution of 2.13 Å, yielding favorable geometry with acceptable MOLPROBITY and clash scores. A summary of diffraction data and refinement statistics is provided in Table 1.
The FIP-ach monomer oligomerizes in a dumbbell-shaped dimeric conformation (Figure 4A). These homodimers further associate via a face-to-face interface to form a dimer of dimer (tetrameric oligomer) (Figure 4B). This tetramer assembly is of total 19874.2 Å2 surface area with 10123.4 Å2 of buried area. The N-terminal domain of FIP-ach consists of a single α-helix, whereas the C-terminal domain is composed of β-sheets forming a fibronectin type III (FNIII) fold. As shown in Figure 4A, the homodimer is formed by a swap of two α-helices (residues Ser3–Val17) in an antiparallel orientation, which contributes to the formation of the homodimeric assembly. Seven β-strands in the C-terminal domain are arranged in an antiparallel fashion, forming two β-sheets. The first β-sheet is composed of strands A, B, and E, and the second consists of strands C, D, G, and H (Figure 4C). The β-strands of these two sheets are connected by secondary structure elements such as coils and turns. Moreover, a less common 3₁₀-helix is present between strands E and F.
The interactions within the tetramer were analyzed using PDBePISA [27]. One of the main homodimer interfaces contains 16 hydrogen bonds between chain A and chain B (Supplementary Table S1), with a complex formation significance score (CSS) of 1 (Figure 5). Another interface between two homodimers promotes oligomerization into the tetramer, featuring 6 hydrogen bonds between chain A of one homodimer and chain B of the other (Supplementary Table S2), with a CSS of 0.126 (Figure 5).
To date, several fungal FIP structures have been reported: FIP-fve (PDB ID: 1OSY), LZ-8 (PDB ID: 3F3H), FIP-gmi (PDB ID: 3KCW), and FIP-nha [28,29,30,31]. Among the available FIP structures, the crystallographic dimer-of-dimers arrangement observed for FIP-ach resembles the assembly reported for FIP-nha [31]. Structural superposition of FIP-ach with the previously reported FIPs is shown in Figure 6.
2.3. Cytotoxic Activity of FIP-Ach on LoVo Colorectal Cancer Cells and BJ Normal Fibroblasts
The effect of FIP-ach on cellular metabolic viability was assessed using LoVo human colorectal cancer cells and BJ normal fibroblasts. The IC50 value, defined as the concentration required to reduce metabolic viability by 50% relative to the control, was determined. Control samples consisted of denatured FIP-ach at concentrations corresponding to those used in the experimental groups. FIP-ach reduced the metabolic viability of LoVo cells, with an IC50 value of 25.2 µg/mL after 72 h of treatment. In contrast, an IC50 value was not reached for BJ fibroblasts within the tested concentration range (Figure 7).
To assess whether treatment with FIP-ach is associated with changes in apoptosis-related markers, LoVo colorectal cancer cells were treated with the IC50 concentration of FIP-ach for 24, 48, and 72 h. A thermally denatured form of FIP-ach, prepared by heating at 95°C for 10 min, was used as a control. The expression of seven apoptosis-related genes (TP53, BCL2, BAX, CASP8, CASP9, CASP3, and AIFM1) was evaluated by RT-qPCR. Gene expression was normalized using B2M and GAPDH as reference genes, selected based on previous validation in colorectal cancer cell lines [32]. In parallel, flow cytometry was used to assess the activation levels of caspase-8, caspase-9, caspase-3, and the cellular level of p53 protein. Changes in mitochondrial fluorescence signal were evaluated using MitoTracker™ Green staining at 24, 48, and 72 h following treatment.
2.4. p53 Signaling and Cell Cycle Alterations
FIP-ach treatment resulted in a marked increase in TP53 gene expression, with approximately a 6.2-fold elevation observed after 48 h compared with the control group (Figure 8A). By 72 h, TP53 expression levels declined but remained approximately 3-fold higher than in the control group. Flow cytometry revealed a similar trend at the protein level, with a 3.5-fold increase in p53 protein levels after 48 h, followed by a decrease at 72 h, although values remained elevated relative to the control group (Figure 8B).
By 48 h, p53 levels increased significantly and remained elevated at 72 h, coinciding with changes in cell-cycle distribution (Figure 9). Treated cells exhibited an increased proportion of cells in the G0/G1 phase after 48 h, followed by a marked increase in the sub-G1 population after 72 h. These observations indicate an association between elevated p53 levels and alterations in cell-cycle distribution following FIP-ach treatment. However, the causal relationship between these events requires further investigation
2.5. Changes in Apoptosis-Related Gene Expression and Mitochondrial Fluorescence Signal
Because an increased sub-G1 population was observed following FIP-ach treatment, the expression of the apoptosis-related genes BAX and BCL2, encoding pro- and anti-apoptotic regulators, respectively, was further evaluated. At 48 h post-treatment, BAX expression was significantly elevated in FIP-ach-treated cells compared with the control group. Expression of BCL2 was also significantly increased but remained lower than that of BAX, resulting in an increased BAX/BCL2 ratio. At 72 h, expression levels of both genes decreased relative to the 48 h time point but remained elevated compared with the control group (Figure 10).
To further investigate mitochondrial-associated changes, mitochondrial fluorescence signal was evaluated using MitoTracker™ Green staining and flow cytometry. Cells were analyzed at 24, 48, and 72 h following treatment with native FIP-ach. Fluorescence intensity increased slightly after 24 h and decreased at later time points (Figure 11). A statistically significant decrease in mitochondrial fluorescence intensity was confirmed at these later time points (*p ≤ 0.05), despite the observed variability among biological replicates.
2.6. Caspases Activation
To further characterize changes in apoptosis-related markers following FIP-ach treatment, the expression and activation of caspase-9 were evaluated in LoVo cells. Caspase-9 is an initiator caspase associated with the intrinsic apoptotic pathway [33,34,35]. CASP9 gene expression was significantly increased after 48 h of treatment and remained elevated at 72 h compared with the control group (Figure 12A). Flow cytometric analysis demonstrated increased caspase-9 activation at all analyzed time points, with the highest level observed after 72 h (Figure 12B).
Caspase-8, an initiator caspase commonly associated with the extrinsic apoptotic pathway, was also evaluated in FIP-ach-treated LoVo cells. RT-qPCR analysis revealed an approximately sevenfold increase in CASP8 expression after 48 h and an approximately twofold increase after 72 h compared with the control group (Figure 13A). Flow cytometric analysis demonstrated increased caspase-8 activation throughout the experiment, with the highest level observed after 48 h and elevated values maintained at 72 h (Figure 13B). An approximately 1.9-fold increase in caspase-8 activation was already detected after 24 h of treatment, indicating that changes in this apoptosis-related marker occurred at an early stage following FIP-ach exposure.
Caspase-3, an executioner caspase activated downstream of both the intrinsic and extrinsic apoptotic pathways [36] was also evaluated in LoVo cells treated with FIP-ach. RT-qPCR analysis revealed an approximately threefold increase in CASP3 expression after 48 h compared with the control group (Figure 14A), whereas expression returned close to baseline after 72 h. Flow cytometric analysis demonstrated a delayed increase in caspase-3 activation, with the highest level observed after 72 h (Figure 14B).
To further characterize changes in apoptosis-related markers following FIP-ach treatment, the expression of AIFM1 was also evaluated. AIFM1 encodes apoptosis-inducing factor (AIF), a mitochondrial protein involved in chromatin condensation and DNA fragmentation following its translocation from mitochondria to the nucleus [37]. In LoVo cells treated with FIP-ach, AIF mRNA levels increased nearly threefold at 48 hours and by 1.5-fold at 72 hours compared to the control (Figure 15). The functional significance of the observed increase in AIFM1 expression requires further investigation, as activation of AIF is primarily regulated by protein release and nuclear translocation rather than transcriptional upregulation.
3. Discussion
The phylogenetic analysis of FIP-ach and related FIPs revealed distinct clustering patterns. FIPs derived from Ganoderma species formed a well-supported monophyletic group, consistent with their shared evolutionary origin within this genus. Although FIP-ach shares 67.6% sequence identity with FIP-tvc from Chroogomphus rutilus, it was located on a separate branch of the Neighbor-Joining tree, indicating sequence divergence within the analyzed FIP family. FIP-ach was positioned in proximity to FIPs from Nectria haematococca (FIP-nha) and Stachybotrys chartarum (FIP-sch). Whether this phylogenetic relationship reflects structural or functional similarities remains to be established experimentally. In contrast, FIPs from Ganoderma species formed a compact cluster, consistent with their relatively high sequence similarity and the extensive characterization of this subgroup [38]. The occurrence of FIPs in edible, medicinal, and non-edible fungi [39] highlights the broad evolutionary distribution of this protein family.
Multiple sequence alignment demonstrated that FIP-ach shares approximately 54–66% sequence similarity with structurally characterized FIPs (Supplementary Table S3). Five residues located within the homodimer interface were unique to FIP-ach, whereas residues contributing to the crystallographic dimer-of-dimers interface were largely conserved among the analyzed FIPs (Figure 2). These observations are consistent with our crystallographic analysis, which demonstrated that FIP-ach retains the canonical FIP fold while exhibiting a distinct quaternary organization. Although the functional significance of these unique interface residues remains unknown, they further support the structural distinctiveness of FIP-ach within the currently characterized FIP family. To date, only a limited number of fungal immunomodulatory proteins have been structurally resolved at atomic resolution; therefore, the crystal structure of FIP-ach expands the structural knowledge of this protein family and provides a valuable framework for future structure–function studies. FIP-ach also shares 63.9% sequence identity with LZ-8 from Ganoderma lucidum [24,25,26]. Because LZ-8 has been extensively studied for its immunomodulatory properties [40] this sequence similarity may indicate conservation of selected structural features. However, functional similarity cannot be inferred from sequence identity alone and requires experimental verification.
The theoretical molecular weight (~13 kDa) and length (114 amino acids) of FIP-ach are consistent with those reported for other fungal immunomodulatory proteins (FIPs), which typically comprise 111–134 amino acid residues [21,39]. These characteristics support the classification of FIP-ach as a member of the FIP family. Sequence alignment revealed a conserved β-sandwich core, which is considered a characteristic structural feature of FIPs [14]. In contrast, the N- and C-terminal regions displayed greater sequence variability, consistent with previous reports suggesting that these regions may contribute to receptor specificity or influence protein stability and localization [14].
Structurally, FIP-ach represents one of the few FIPs for which a three-dimensional crystal structure has been determined. To date, several fungal FIP structures have been reported, including FIP-fve (PDB ID: 1OSY;[28]), LZ-8 (PDB ID: 3F3H;[30]), GMI (PDB ID: 3KCW;{29]) and FIP-nha (PDB ID: 7WDL;[31]). Although FIP-ach shares only moderate sequence identity with previously characterized FIPs, its overall three-dimensional architecture is highly conserved. The characteristic domain-swapped homodimer, FNIII-like β-sandwich fold, and tetrameric assembly closely resemble those reported for LZ-8, GMI, and FIP-nha, suggesting that the structural framework of fungal immunomodulatory proteins has been strongly conserved during evolution despite substantial sequence divergence. The crystallographic dimer-of-dimers arrangement observed for FIP-ach resembles that reported for FIP-nha. Structural superposition of FIP-ach with these FIPs (Figure 6) demonstrated conservation of the overall fold, whereas the greatest structural differences were observed within surface loops and the N- and C-terminal regions. In addition, several interface residues were unique to FIP-ach, suggesting structural features that distinguish this protein from previously characterized FIPs. Whether these differences influence protein function remains to be established experimentally. The preservation of the tetrameric organization despite sequence divergence further supports the structural conservation of the FIP family. The preservation of the tetrameric organization despite sequence divergence further supports the structural conservation of the FIP family. Recent evidence suggests that specific oligomeric states contribute to FIP functionality and influence receptor engagement, highlighting the potential biological importance of quaternary structure [41]. Likewise, the domain-swapped N-terminal α-helices that mediate homodimer formation appear to represent a conserved structural hallmark of fungal immunomodulatory proteins [28,29,30,31]. The phylogenetic relationships observed in this study, together with the structural comparisons, indicate that FIPs share a conserved structural framework despite their occurrence in phylogenetically diverse fungi [19]. Conservation of the β-sandwich core together with sequence divergence in peripheral regions is consistent with structural conservation accompanied by functional diversification within the FIP family. The relatively high sequence similarity between FIP-ach and the well-characterized FIP LZ-8 provided the rationale for further biochemical and cellular characterization of FIP-ach. However, functional similarity cannot be inferred from sequence identity alone and requires experimental validation. Interestingly, despite their highly conserved structural scaffold, different FIPs exhibit considerable variation in their reported biological activities, including immunomodulatory, antitumor, antiviral, and anti-inflammatory effects [25,38,39]. This suggests that functional diversification within the FIP family is likely driven by relatively subtle differences in surface-exposed residues or oligomeric interfaces rather than by major alterations of the overall protein fold. The availability of the FIP-ach crystal structure therefore provides an important framework for future structure-function studies aimed at identifying the molecular determinants underlying the functional diversity of fungal immunomodulatory proteins.
Recombinant production of FIPs has been widely explored using Escherichia coli expression systems because of their simplicity, scalability, and relatively low production costs [42,43]. In the present study, recombinant FIP-ach was successfully produced in E. coli, yielding approximately 42.3 mg of purified protein per liter of bacterial culture. Previous studies have reported variable recombinant yields for different FIPs expressed in E. coli, including FIP-bbo from Botryobasidium botryosum [16], FIP-dsq2 from D. squalens [17], and FIP-gat from G. atrum [44]. quantities. Although direct comparison between studies should be made with caution because of differences in expression constructs, host strains, and purification procedures, the yield obtained for FIP-ach compares favorably with those reported for several previously characterized recombinant FIPs. Traditional purification of FIPs from fungal fruiting bodies is often associated with relatively low protein recovery (e.g., only ~10 mg of LZ-8 was obtained from 300 g of G. lucidum fruiting bodies [10]. Therefore, recombinant expression provides a practical approach for obtaining sufficient quantities of protein for structural and functional studies. Although the C-terminal hexahistidine tag was not removed prior to downstream analyses, successful determination of the crystal structure at 2.13 Å resolution together with the preserved biological activity indicate that the tag did not measurably interfere with the structural integrity or function of FIP-ach. A similar recombinant strategy employing a C-terminal His₆ tag has also been used for the crystallographic characterization of GMI (PDB ID: 3KCW), in which the C-terminal region remained unresolved in the final crystal structure [29].
The effects of FIP-ach on the metabolic viability of LoVo colorectal cancer cells were compared with those reported previously for other recombinant FIPs. To our knowledge, this is the first study evaluating the activity of a fungal immunomodulatory protein in a colorectal cancer cell model. FIP-ach reduced the metabolic viability of LoVo cells with an IC50 value of approximately 25 µg/mL after 72 h of treatment. Previous studies reported IC50 values of 55.5 µg/mL for MGC-823 gastric cancer cells and 12.2 µg/mL for HepG2 liver cancer cells treated with recombinant FIP-nha (from N. haematococca, expressed in E. coli) [45]. FIP-ppl from Postia placenta exhibited IC50 values of 28.3 µg/mL and 35.2 µg/mL against MGC823 gastric cancer cells and HepG2 hepatocellular carcinoma cells, respectively [46].
Recombinant Ganoderma FIPs produced in Pichia pastoris have also demonstrated anticancer activity. Qu et al. (2018) reported moderate cytotoxic activity of recombinant LZ-8 and FIP-gsi against A549, HeLa, and MCF-7 cancer cell lines, whereas recombinant FIP-gap2 displayed comparatively lower activity [38]. Similarly, Zhou et al. (2018) reported that recombinant FIP-gap1 and FIP-gap2 from Ganoderma applanatum exhibited different antiproliferative activities against A549 lung carcinoma, HeLa cervical carcinoma, and MCF-7 breast adenocarcinoma cells. In particular, rFIP-gap1 showed greater cytotoxic activity than rFIP-gap2 across all three cell lines [13]. Although direct comparisons between studies should be interpreted with caution because of differences in cancer cell lines, recombinant expression systems, treatment conditions, and experimental protocols, the IC50 value obtained for FIP-ach falls within the lower range of those reported for recombinant FIPs exhibiting anticancer activity in vitro. Similarly, the recently characterized recombinant FIP-Gre from Ganoderma resinaceum exhibited selective cytotoxicity, showing the strongest activity against A549 lung adenocarcinoma cells while displaying no significant toxicity toward normal HEK293 cells [47]. The lack of significant cytotoxicity towards normal cells while simultaneously affecting target cells may indicate a favorable selectivity profile of the FIP protein and its potential for further application studies. However, confirmation using additional non-malignant colorectal cell models will be required.
The observed increases in caspase-9 and caspase-8 activation suggest that FIP-ach may affect apoptosis-related processes associated with both the intrinsic and extrinsic apoptotic pathways in colorectal cancer cells. Although our findings are consistent with the involvement of multiple apoptosis-associated mechanisms, further studies using pathway-specific inhibitors or genetic approaches are required to confirm the contribution of these pathways and establish their causal role in FIP-ach-induced cell death. The present study focused on the downstream cellular responses induced by FIP-ach rather than on identification of its primary molecular target. Therefore, the upstream signaling events responsible for initiating these responses remain to be established. An important observation was the effect of FIP-ach on p53 expression and cell-cycle distribution. FIP-ach induced a transient but strong increase in p53 levels, with the highest mRNA and protein expression detected after 48 h of treatment, followed by a partial decline at 72 h, although both remained above control levels. The sustained elevation of p53 above control levels at 72 h indicates that the p53 response persisted throughout the experimental period despite the partial decline observed after 48 h. Oscillatory dynamics of p53 in response to cellular stress have been well documented [48] , and the temporal pattern observed in our study is consistent with these observations. The p53–MDM2 negative feedback loop plays a central role in regulating p53 dynamics, although this regulatory mechanism is frequently disrupted in cancer cells [49,50].
In parallel with the increase in p53 levels, alterations in cell-cycle distribution were observed, including an accumulation of cells in the G0/G1 phase after 48 h and a subsequent increase in the sub-G1 population after 72 h. These findings are consistent with the well-established role of p53 in regulating cell-cycle progression and maintaining genome integrity [50,51]. The transition from G0/G1 accumulation at 48 h to an increased sub-G1 population at 72 h suggests a temporal progression from cell-cycle redistribution to cell death. The increase in the sub-G1 population at 72 h coincided with sustained p53 expression and elevated BAX expression. Since BAX is a well-established transcriptional target of p53 [50,51], these observations are consistent with activation of apoptosisrelated signaling. However, the causal relationship between p53 activation, BAX upregulation, alterations in cell-cycle distribution, and cell death cannot be established based on the present data and requires further investigation. Nevertheless, other fungal immunomodulatory proteins have also been reported to modulate p53 signaling in cancer cells. For instance, the antitumor activity of FIP-dsq2 in A549 lung cancer cells has been associated with increased TP53 expression [17], whereas the antiproliferative activity of FIP-fve in A549 cells has also been linked to TP53 upregulation [52]. FIP-ach similarly increased TP53 expression, and although our study was performed in a colorectal cancer cell line, the involvement of p53 across different FIPs and cancer cell types suggests that modulation of p53 signaling may represent a common feature of their anticancer activity.
Beyond p53, FIP-ach also altered the expression of the BAX and BCL2 genes, supporting the involvement of mitochondrial apoptotic signaling. We observed a pronounced increase in BAX expression together with a more moderate increase in BCL2 expression, resulting in an increased BAX/BCL2 ratio, which is commonly associated with increased susceptibility to apoptosis [53]. Bax promotes mitochondrial outer membrane permeabilization (MOMP), enabling cytochrome c release and apoptosome formation, leading to activation of caspase-9 and subsequently caspase-3, whereas Bcl-2 counteracts this process by preserving mitochondrial integrity [53]. Accordingly, the observed changes in BAX and BCL2 expression are consistent with the involvement of mitochondrial apoptotic signaling. Moreover, a noticeable decrease in MitoTracker Green fluorescence was observed at 48 and 72 h. This trend, combined with the shifts in the BAX/BCL2 ratio, caspase-9 activation, and other apoptosis-related markers, consistently supports the involvement of mitochondrial apoptotic signaling. This interpretation is also aligned with current therapeutic strategies aimed at overcoming apoptosis resistance by targeting mitochondrial pathways [54].
The downstream executioner caspase-3 was activated in a delayed manner, with the highest activation observed after 72 h, although CASP3 mRNA expression peaked at 48 h. This delay between transcription and full activation is typical in apoptosis signaling, where the presence of active initiator caspases (and sufficient cellular damage) is needed to trigger executioner activation. Caspase-3 serves as the convergence point of intrinsic and extrinsic pathways, cleaving numerous substrates to execute cell death [36]. The transient increase in CASP3 expression followed by delayed caspase-3 activation observed in our study is consistent with this sequence of events. This observation also agrees with previous reports showing that changes in mRNA expression often precede corresponding changes at the protein level [55,56].
Interestingly, we also detected increased AIFM1 expression, suggesting that FIP-ach may also influence apoptosis-related processes associated with AIF signaling. AIF, when released from mitochondria, can induce chromatin condensation and DNA fragmentation independently of caspase activation [37,57]. However, because we did not assess AIF protein expression or its translocation from mitochondria to the nucleus, the functional significance of the observed increase in AIFM1 expression remains unclear. Further studies will be required to determine whether AIF-mediated, caspase-independent cell death contributes to the biological activity of FIP-ach.
Overall, our findings indicate that FIP-ach modulates multiple apoptosis-related pathways in colorectal cancer cells. FIP-ach increased p53 expression, altered cell-cycle distribution, enhanced the BAX/BCL2 ratio, increased activation of caspase-8, caspase-9, and caspase-3, and elevated AIFM1 expression. Together, these observations are consistent with the involvement of both caspase-dependent and potentially caspase-independent apoptotic mechanisms. However, additional mechanistic studies, including pathway-specific inhibition and analysis of protein localization, will be required to establish the precise contribution of these pathways to FIP-ach-induced cell death.
4. Materials and Methods
4.1. Bioinformatics Analysis
Bioinformatic analysis was conducted to identify and characterize the FIP-ach protein sequence. The initial sequence encoding FIP-ach was retrieved from the GenBank database (Accession Number: KAI0315152.1), based on bioinformatics screening of publicly available genomic data from Amylostereum chailletii. The sequence was verified using BLASTp against the NCBI non-redundant protein database (nr) to identify homology with previously described fungal immunomodulatory proteins (FIPs) and support its classification within the FIP family. Further characterization was carried out using ProtParam to determine key physicochemical properties, including theoretical molecular weight and isoelectric point. Representative FIP sequences available in public databases were selected based on sequence similarity and the availability of full-length protein sequences. Multiple sequence alignment was performed using ClustalX2 to identify conserved and variable regions within the FIP family. The resulting alignments were manually inspected prior to downstream analyses. Evolutionary relationships among selected FIP proteins were inferred using the Neighbor-Joining method implemented in MEGA11. The robustness of the inferred tree topology was evaluated by bootstrap analysis, and bootstrap support values are presented at the corresponding nodes of the phylogenetic tree.
4.2. Cloning
The coding sequence corresponding to FIP-ach (GenBank accession number KAI0315152.1) was synthesized by GeneUniversal and cloned into the bacterial expression vector pET21a(+) using BamHI and XhoI restriction sites. The recombinant construct was designed for heterologous expression in Escherichia coli and contained a C-terminal hexahistidine (His6) tag to facilitate affinity purification by immobilized metal affinity chromatography (IMAC). A tobacco etch virus (TEV) protease cleavage site was included in the construct design upstream of the affinity tag. Although the construct contained a TEV protease cleavage site, tag removal was not performed. Consequently, the recombinant His-tagged FIP-ach protein was used in all subsequent purification, crystallographic, and cell-based experiments.
4.3. Protein Expression in E. coli BL21(DE3)
E. coli BL21(DE3) cells were transformed with the FIP-ach expression plasmid using standard heat-shock procedures. A single colony was inoculated into 5 mL of LB medium supplemented with 100 µg/mL ampicillin and incubated at 37°C with shaking (200 rpm) overnight. For large-scale protein expression, 250 mL of TB medium containing ampicillin (100 µg/mL) was inoculated with 500 µL of the overnight culture. Cells were grown at 37°C with shaking (150 rpm) until the optical density at 600 nm (OD600) reached 0.8–1.0. Protein expression was induced by the addition of 1 mM IPTG, followed by incubation at 20°C for 16 hours with shaking. Cells were harvested by centrifugation and stored at −20°C for further processing.
4.4. Cell Lysis
Cell lysis was performed by sonication. The cell pellet was resuspended in lysis buffer containing 50 mM sodium polyphosphate (NaPP) and 300 mM NaCl. Sonication was carried out using a Branson Sonifier 250 at 50% amplitude, applied as pulsed bursts (0.1 s on, 0.2 s off) for three 10-minute cycles, with 10-minute intervals between cycles to prevent overheating. The lysate was centrifuged at 7500 × g for 40 minutes at 4°C, and the supernatant containing the soluble protein fraction was collected for further processing
4.5. Protein Purification by Immobilized Metal Affinity Chromatography (IMAC)
Recombinant FIP-ach protein was purified using HisPur™ Cobalt Resin, which selectively binds His-tagged proteins. The resin was equilibrated with 5 column volumes (CV) of binding buffer containing 50 mM sodium polyphosphate (NaPP) and 300 mM NaCl. The clarified cell lysate was loaded onto the column and incubated on ice for 1 hour to enhance protein binding. Unbound proteins were removed by washing the column with 10 CV of the same binding buffer. Bound protein was eluted using an elution buffer composed of 50 mM NaPP, 300 mM NaCl, and 300 mM imidazole. Protein-containing fractions were pooled and their concentrations measured for subsequent analyses.
4.6. Endotoxin Removal
To reduce endotoxin contamination that could potentially interfere with downstream cell-based assays, the purified FIP-ach protein was treated using Pierce™ High-Capacity Endotoxin Removal Spin Columns. The columns were equilibrated with 2.5 mL of calibration buffer and centrifuged at 500 × g for 1 minute (repeated twice). The protein solution was incubated with the column at 4°C for 1 hour to maximize endotoxin binding. Following incubation, the columns were centrifuged, and the treated protein preparation was collected for subsequent desalting.
4.7. Desalting
Desalting of the purified FIP-ach protein was performed using Zeba Desalting Spin Columns (Thermo Scientific) to remove excess salts and imidazole prior to cell-based assays. The columns were equilibrated with phosphate-buffered saline (PBS), and the protein solution was applied and centrifuged at 1000 × g for 3 minutes. The desalted protein was collected and either used immediately or stored at 4°C (short term) or −20°C (long term). For crystallization experiments, a separate batch of protein was prepared using the same affinity purification protocol but exchanged into a low-salt, non-phosphate buffer compatible with crystallization screens. Endotoxin removal was performed only for the cell-based applications.
4.8. Protein Concentration Determination using BCA Assay
The concentration of the purified FIP-ach protein was determined using the Pierce™ BCA Protein Assay Kit (Thermo Scientific), following the manufacturer’s protocol. A standard curve was generated using bovine serum albumin (BSA) standards ranging from 0 to 2000 µg/mL. Protein samples were incubated with the working reagent for 30 minutes at 37°C, and absorbance was measured at 562 nm using a microplate reader.
4.9. SDS-PAGE
Sodium dodecyl sulfate-polyacrylamide gel electrophoresis (SDS-PAGE) was used to assess the purity and molecular weight of the purified FIP-ach protein under denaturing conditions. A stacking gel (4%) and resolving gel (15%) were prepared using standard protocols. Protein samples (10 µL) were mixed with 5 µL of SDS loading buffer and denatured by heating at 95°C for 10 minutes. The denatured samples (10–15 µL) and 3 µL of molecular weight markers were loaded onto the gel. Electrophoresis was run at 135 V in Tris-glycine running buffer until the smallest molecular weight marker reached the bottom of the gel. The gel was stained with Coomassie Brilliant Blue for 1 hour and destained in a solution containing 10% acetic acid and 10% methanol for 24 hours. The presence of distinct protein bands indicated successful purification.
4.10. Protein Crystallization and Diffraction Data Collection
Purified FIP-ach protein at a concentration of 8 mg/mL was used for crystallization trials. Initial screening was conducted using a variety of commercial crystallization screens, including PACT premier, ProPlex, PEG/Ion, JCSG+, LMB, and Morpheus. Crystallization was carried out using the sitting-drop vapor diffusion method in 96-well MRC plates, with a drop volume of 0.3 µL, set up using a PHOENIX/RE crystallization robot (Art Robbins Instruments). Crystals suitable for X-ray diffraction were obtained under a condition composed of 0.09 M NPS (0.3 M sodium nitrate, 0.3 M disodium phosphate, and 0.3 M ammonium sulfate), 0.1 M buffer system 1 (imidazole and MES monohydrate, pH 6.5), and 30% (v/v) precipitant mix 3 (40% (v/v) glycerol, 20% (w/v) PEG 4000), incubated at 27°C. Diffraction data were collected at beamline P11 of PETRA III, DESY, Hamburg, Germany [58,59].
4.11. Data Processing and Structure Refinement
Diffraction data indexing and integration were performed using iMOSFLM [60]. The resulting datasets were scaled, merged, and truncated using the CCP4i2 suite and Aimless [61,62,63]. Molecular replacement was carried out using PHASER [64], employing the immunomodulatory protein structure from Ganoderma microsporum (PDB ID: 3KCW) as the search model. Model refinement was conducted through a combination of automated and manual procedures using REFMAC5 [63] and Coot [65] respectively, until satisfactory R-factors and model geometry were achieved. Model validation was performed at each refinement step using MOLPROBITY [67] within the CCP4i2 environment. Final structural analysis and visualization were performed using Chimera [68] and PyMOL (version 3.0; Schrödinger, LLC). Secondary structure elements were assigned using STRIDE [69], and protein–protein interaction analysis was carried out via the PDBePISA web server [27].
4.12. In Vitro Culture of LoVo and BJ Cells
Human LoVo colorectal cancer cells (DSMZ ACC-350) and human BJ foreskin fibroblasts (ATCC CRL-2522) were cultured under optimal conditions (37°C, 5% CO₂, 95% humidity) until stationary growth phase was reached after 72 hours. For passaging, cells were detached from the monolayer using 0.25% trypsin, centrifuged at 400 × g for 5 minutes at 21°C, and resuspended in fresh growth medium. Cells were then seeded into new culture vessels at a density of 20,000 cells/cm². The growth medium consisted of F-12K Nutrient Mixture (Kaighn’s Modification) for LoVo cells or Eagle's Minimum Essential Medium for BJ cells supplemented with 10% (v/v) heat-inactivated fetal bovine serum and antibiotics (100 units/mL penicillin, 100 µg/mL streptomycin). Before experimental treatments, cells were cultured for 24 hours (lag phase) under the same optimal conditions to allow for adherence and recovery. Experimental conditions involved the addition of FIP-ach protein or control solutions. The control group was treated with denatured FIP-ach protein at the same concentration as the experimental group, ensuring a consistent comparison. Cells were further incubated for 24, 48 or 72 hours, depending on the specific experiment.
4.13. Determination of Cytotoxicity - MTT Method
The cytotoxic potential of the purified FIP-ach protein was evaluated using the MTT assay, which measures cell viability based on the reduction of MTT (3-(4,5-dimethylthiazol-2-yl)-2,5-diphenyltetrazolium bromide) to insoluble formazan crystals by mitochondrial enzymes in metabolically active cells. LoVo colorectal cancer cells and BJ normal fibroblasts were seeded in 96-well plates at a density of 10000 cells/well in 90 μL of growth medium. Following a 24-hour adaptation period, 10 μL of FIP-ach protein was added to obtain final concentrations ranging from 0.1 to 80 μg/mL for LoVo cells and from 2 to 40 μg/mL for BJ fibroblasts. Control wells received denatured FIP-ach protein at the corresponding concentrations. The control ensured that any observed effects on metabolic viability were attributable to the biologically active form of FIP-ach rather than to non-specific effects of additives. Cells were incubated for 72 hours under optimal conditions, after which 20 μL of MTT solution (2.5 mg/mL) was added to each well and incubated for 3 hours to allow for formazan formation. The crystals were dissolved in 100 μL of DMSO, and absorbance was measured at 555 nm and 720 nm using a microplate reader. Experiments were performed in triplicate. The IC50 value was determined as the concentration of FIP-ach required to reduce metabolic viability by 50% relative to the control. To account for potential background interference, absorbance from non-enzymatic formazan formation was subtracted from the final results.
4.14. RT-qPCR Method
Total RNA was extracted from LoVo colorectal cancer cells using the RNA MiniPrep Kit (Euryx) following the manufacturer’s protocol. RNA concentration and purity (A260/A280 ratio) were determined using a NanoDrop 2000 spectrophotometer (Thermo Fisher Scientific, USA) to ensure sample quality. Reverse transcription was performed to synthesize complementary DNA (cDNA), which was subsequently used for quantitative real-time PCR (RT-qPCR) on a Bio-Rad CFX96 detection system (Bio-Rad Inc., USA). Each 20 μL reaction consisted of 12.5 μL of SYBR Green PCR Master Mix, 10 ng of cDNA, and gene-specific primers. Primer specificity was verified by melt curve analysis following amplification. No-template controls (NTC) were included in each RT-qPCR run to monitor potential contamination and non-specific amplification. The following apoptosis-related genes were analyzed: BCL2, BAX, TP53, CASP3, CASP8, CASP9, and AIFM1. Gene expression was normalized using B2M and GAPDH as reference genes. The primer sequences used in this study were: BCL2: F 5′-GCC GGT TCA GGT ACT CAG TC-3′, R 5′-CAT GTG TGT GGA GAG AGC GTC A-3′; BAX: F 5′-GTT GCG GTC AGA AAA CAT GT-3′, R 5′-GCC GCC GTG GAC ACA-3′; TP53: F 5′-GAG CTG AAT GAG GCC TTG GA-3′, R 5′-CTG AGT CAG GCC CTT CTG TCT T-3′; CASP3: F 5′-ATG GTT TGA GCC TGA GCA GA-3′, R 5′-GGC AGC ATC ATC CAC ACA TAC-3′; CASP8: F 5′-GGA GGA GTT GTG TGG GGT AA-3′, R 5′-GAT CAG ACA GTA TCC CCG AGG-3′; CASP9: F 5′-GAC AGG CTC TTA GCA GCT TCC-3′, R 5′-CAC AAG TCA CTA GCC CTG GAC-3′; AIFM1: F 5′-GGA GGA CTA CGG CAA AGG T-3′, R 5′-CTT CCT TGC TAT TGG CAT TCG-3′; B2M: F 5′-TGC TGT CTC CAT GTT TGA TGT ATC T-3′, R 5′-TCT CTG CTC CCC ACC TCT AAG T-3′; GAPDH: F 5′-GAA GGT GAA GGT CGG AGT C-3′, R 5′-GAA GAT GGT GAT GGG ATT TC-3′. Relative gene expression levels were calculated using the 2^−ΔΔCt method, with the geometric mean of B2M and GAPDH used for normalization [32]. RT-qPCR analyses were performed using three independent biological replicates, with each biological replicate analyzed in technical triplicate to ensure reproducibility.
4.15. Mitochondrial Fluorescence Assessment Using MitoTracker™
In this experiment, LoVo cells were treated with purified FIP-ach protein at the IC50 concentration (25.2 µg/mL), while the control group received denatured FIP-ach protein at the same concentration. MitoTracker™ Green staining was used to evaluate changes in mitochondrial fluorescence signal following FIP-ach treatment. After 24, 48, and 72 h of treatment, cells were harvested, washed with PBS, and incubated with MitoTracker™ Green FM (200 nM) in serum-free medium for 30 min at 37°C. Following staining, cells were washed to remove excess dye and analyzed by flow cytometry. Fluorescence intensity was measured in the green fluorescence channel (λex = 488 nm, λem = 525/40 nm BP filter) and 5000 events were acquired per sample. MitoTracker™ Green fluorescence was quantified as the fold change in relative fluorescence intensity in FIP-ach-treated cells compared with control cells. Changes in fluorescence intensity were interpreted as alterations in mitochondrial staining patterns associated with FIP-ach treatment. Each experiment was performed using three independent biological replicates, with each biological replicate analyzed in technical triplicate. Data acquisition and analysis were performed using a CytoFLEX flow cytometer and CytExpert 2.6 software (Beckman Coulter, Brea, CA, USA).
4.16. The FLICA Method Assesses the Degree of Caspase Activation
Caspase activation in LoVo cells was evaluated using the FLICA (Fluorescent Labeled Inhibitors of Caspases) method, which relies on fluorochrome-labeled inhibitors that selectively bind to active caspases. Specific inhibitors for caspases 3, 8, and 9 were used to monitor activation of apoptosis-related pathways. These inhibitors are cell-permeable and form irreversible complexes only with active caspases, generating a fluorescence signal associated with the presence of active caspases. In all assays, LoVo cells (20,000 cells/cm²) were treated with FIP-ach at its IC50 concentration (25.2 µg/mL) after a 24 h adaptation period, while control cells received an equal concentration of denatured FIP-ach. Cells were collected after 24, 48, and 72 h of treatment, washed with PBS, and stained using CaspGLOW™ kits (Invitrogen) according to the manufacturer’s instructions. Stained cells were analyzed by flow cytometry, with fluorescence intensity measured in the green fluorescence channel (λex = 488 nm, λem = 525/40 nm BP filter). A total of 5000 events were acquired per sample. Cellular debris was excluded based on forward and side scatter characteristics prior to fluorescence analysis. Caspase activation in treated cells was quantified as fold change in fluorescence intensity relative to the control group. Experiments were performed using three independent biological replicates, with each biological replicate analyzed in technical triplicate. Data acquisition and analysis were performed using a CytoFLEX flow cytometer and CytExpert 2.6 software (Beckman Coulter, Brea, CA, USA).
4.18. Determining the Level of p53 Protein
The intracellular level of p53 protein in LoVo cells was evaluated by flow cytometry using a FITC-conjugated anti-p53 monoclonal antibody. Cells were fixed in 0.1% formaldehyde for 15 min, followed by washing and permeabilization with 0.5% Tween 20 for 15 min. For staining, 5 µL of FITC-conjugated anti-p53 monoclonal antibody was added to 100 µL of permeabilization buffer (0.5% Tween 20 in PBS), and the mixture was incubated with the cells for 30 min at room temperature in the dark. Excess antibody was removed by washing, and cells were resuspended in PBS for flow cytometric analysis. Fluorescence intensity was measured in the green fluorescence channel (λex = 488 nm, λem = 525/40 nm BP filter), and 5000 events were acquired per sample. Cellular debris was excluded based on forward and side scatter characteristics prior to fluorescence analysis. Cellular p53 levels were expressed as fold change in fluorescence intensity relative to control cells. Experiments were performed using three independent biological replicates, with each biological replicate analyzed in technical triplicate. Data acquisition and analysis were performed using a CytoFLEX flow cytometer and CytExpert 2.6 software (Beckman Coulter, Brea, CA, USA).
4.19. Cell Cycle Analysis
The distribution of LoVo cells across different phases of the cell cycle was assessed using propidium iodide (PI) staining. PI intercalates stoichiometrically into double-stranded DNA, allowing quantification of DNA content and cell cycle phase-specific identification. This method also allows identification of cells with sub-G1 DNA content, commonly associated with DNA fragmentation. At 24, 48, and 72 hours post-treatment, cells were trypsinized, centrifuged (400g, 5 min, 4°C), and washed with cold PBS (10 mM Na₂HPO₄, 2 mM KH₂PO₄, 134 mM NaCl; pH 7.25). The cell pellet was resuspended in 100 μL PBS and fixed by adding 300 μL of 70% ethanol pre-chilled to −20°C, followed by incubation at −20°C for ≥24 h. Fixed cells were centrifuged (400g, 5 min, 4°C) and washed twice with PBS. Cells were stained by incubation in 200 μL PBS containing RNase A (100 µg/mL) and PI (20 µg/mL) for 30 min at room temperature in the dark. Fluorescence intensity was measured in the yellow-orange fluorescence channel (λem = 585/42 nm BP filter, λex = 488 nm) for 5000 events per sample. Quantification of cell populations was expressed as a percentage of the total population, normalized to the negative control. Cells and data analysis were conducted using a CytoFlex flow cytometer and CytExpert 2.6 software (Beckman Coulter, Brea, CA, USA).
4.20. Statistical Analysis
Statistical analyses were performed using Statistica 13.3 software (TIBCO). Unless otherwise stated, experiments were conducted using three independent biological replicates, with each biological replicate analyzed in technical triplicate. As the data did not meet the assumptions of normal distribution, nonparametric statistical methods were applied. The Kruskal–Wallis ANOVA test was used for comparisons between multiple independent groups, whereas Friedman ANOVA was used for repeated measurements within the same experimental group. When significant differences were detected, pairwise comparisons were performed using the Wilcoxon post hoc test. Statistical significance was set at *p ≤ 0.05; **p ≤ 0.01; ***p ≤ 0.001.
5. Conclusions
We identified a novel fungal immunomodulatory protein, FIP-ach, from Amylostereum chailletii. The protein consists of 114 amino acids (~13 kDa), shares structural similarity with the well-characterized fungal immunomodulatory protein LZ-8, and represents a phylogenetically distinct member of the FIP family [41]. Recombinant FIP-ach was efficiently produced in Escherichia coli, enabling structural and functional characterization. In vitro experiments demonstrated dose-dependent cytotoxicity toward LoVo colorectal cancer cells. Molecular analyses revealed increased TP53, BAX, CASP8, CASP9, CASP3, and AIFM1 expression, activation of caspase-8, caspase-9, and caspase-3, and alterations in cell-cycle distribution, collectively supporting the involvement of apoptosis-related mechanisms [17,52,70,71]. Compared with previously characterized FIPs, including FIP-fve, FIP-gmi, and FIP-gts [29,52,72], FIP-ach exhibited a distinct apoptosis-associated profile in LoVo colorectal cancer cells.
To our knowledge, this study represents the first characterization of the biological activity of a fungal immunomodulatory protein in a colorectal cancer cell model. The obtained results expand current knowledge of fungal immunomodulatory proteins and indicate that FIP-ach is a promising member of this protein family for further biological investigation. However, although no significant cytotoxicity was observed in BJ fibroblasts under the experimental conditions used in this study, the selectivity of FIP-ach should be confirmed using additional non-malignant cell models before drawing conclusions regarding its therapeutic applicability.
Several limitations of this study should be acknowledged. The biological activity of FIP-ach was evaluated in a single colorectal cancer cell line, and its molecular mechanism was investigated primarily through changes in gene expression and apoptosis-related markers. Although the obtained results are consistent with the involvement of multiple apoptosis-associated mechanisms, additional studies employing pathway-specific inhibitors, receptor identification, and protein localization analyses will be required to establish the precise molecular mechanisms underlying FIP-ach activity. Furthermore, the pharmacokinetic properties, tissue distribution, stability, and degradation profile of FIP-ach remain unknown.
Future studies should evaluate the biological activity of FIP-ach in additional colorectal cancer models, confirm its selectivity using a broader panel of normal human cells, and determine its efficacy and safety in appropriate animal models. Investigation of its stability under gastrointestinal conditions, bioavailability, and potential delivery strategies may further support its translational potential. Finally, identification of the cellular receptors and signaling pathways involved in FIP-ach activity will provide a more comprehensive understanding of its mechanism of action and help assess its potential as a candidate for future colorectal cancer therapy.
Together, these findings establish FIP-ach as a structurally characterized member of the FIP family and provide a basis for future mechanistic and preclinical studies.
Author Contributions
Conceptualization Agata Wszołek; Investigation Agata Wszołek, Marcelina Gałka, Stuti Patel; Żwierełło Wojciech Supervision Agata Wszołek; Funding and resources – Agata Wszołek, Grzegorz Dubin; Writing – original draft, Agata Wszołek; Writing – review & editing Agata Wszołek, Marcelina Gałka, Stuti Patel, Grzegorz Dubin, Żwierełło Wojciech, Agnieszka Maruszewska, Izabela Gutowska
Funding
Co-financed by the Minister of Science under the "Regional Excellence Initiative" Program for 2024-2027 (RID/SP/0045/2024/01) and supported by the National Science Centre, Poland, through the MINIATURA 7 programme (grant no. DEC-2023/07/X/NZ1/00092).
Acknowledgments
We acknowledge DESY (Hamburg, Germany), a member of the Helmholtz Association HGF, for the provision of experimental facilities. Parts of this research were carried out at PETRA III. Graphical abstract was created with BioRender.com
Conflicts of Interest
The authors declare no conflicts of interest.
References
- World Health Organization. GLOBOCAN 2022 Database. Available online: https://gco.iarc.fr/ (accessed on 5 February 2026).
- Mármol, I.; Sánchez-de-Diego, C.; Dieste, A.P.; Cerrada, E.; Yoldi, M.J.R. Colorectal carcinoma: A general overview and future perspectives in colorectal cancer. Int. J. Mol. Sci. 2017, 18, 197. [Google Scholar] [CrossRef] [PubMed]
- Rastin, F.; Javid, H.; Oryani, M.A.; Rezagholinejad, N.; Afshari, A.R.; Karimi-Shahri, M. Immunotherapy for colorectal cancer: Rational strategies and novel therapeutic progress. Int. Immunopharmacol. 2024, 126, 111055. [Google Scholar] [CrossRef] [PubMed]
- Elmore, S. Apoptosis: A review of programmed cell death. Toxicol. Pathol. 2007, 35, 495–516. [Google Scholar] [CrossRef] [PubMed]
- Kesik-Brodacka, M. Progress in biopharmaceutical development. Biotechnol. Appl. Biochem. 2018, 65, 306–322. [Google Scholar] [CrossRef] [PubMed]
- Bascones-Martinez, A.; Mattila, R.; Gomez-Font, R.; Meurman, J.H. Immunomodulatory drugs: Oral and systemic adverse effects. Med. Oral Patol. Oral Cir. Bucal 2014, 19, e24–e31. [Google Scholar] [CrossRef] [PubMed]
- Ye, T.; Ge, Y.; Jiang, X.; Song, H.; Peng, C.; Liu, B. A review of anti-tumour effects of Ganoderma lucidum in gastrointestinal cancer. Chin. Med. 2023, 18, 143. [Google Scholar] [CrossRef] [PubMed]
- Panda, S.K.; Sahoo, G.; Swain, S.S.; Luyten, W. Anticancer activities of mushrooms: A neglected source for drug discovery. Pharmaceuticals 2022, 15, 176. [Google Scholar] [CrossRef] [PubMed]
- Roupas, P.; Keogh, J.; Noakes, M.; Margetts, C.; Taylor, P. The role of edible mushrooms in health: Evaluation of the evidence. J. Funct. Foods 2012, 4, 687–709. [Google Scholar] [CrossRef]
- Kino, K.; Yamashita, A.; Yamaoka, K.; Watanabe, J.; Tanaka, S.; Ko, K.; Shimizu, K.; Tsunoo, H. Isolation and characterization of a new immunomodulatory protein, Ling Zhi-8 (LZ-8), from Ganoderma lucidum. J. Biol. Chem. 1989, 264, 472–478. [Google Scholar] [CrossRef]
- Lin, J.W.; Hao, L.X.; Xu, G.X.; Sun, F.; Gao, F.; Zhang, R.; Liu, L.X. Molecular cloning and recombinant expression of a gene encoding a fungal immunomodulatory protein from Ganoderma lucidum in Pichia pastoris. World J. Microbiol. Biotechnol. 2009, 25, 383–390. [Google Scholar] [CrossRef]
- Lin, J.W.; Guan, S.Y.; Duan, Z.W.; Shen, Y.H.; Fan, W.L.; Chen, L.J.; Zhang, L.; Zhang, L.; Li, T.L. Gene cloning of a novel fungal immunomodulatory protein from Chroogomphus rutilus and its expression in Pichia pastoris. J. Chem. Technol. Biotechnol. 2016, 91, 2815–2823. [Google Scholar] [CrossRef]
- Zhou, S.; Guan, S.; Duan, Z.; Han, X.; Zhang, X.; Fan, W.; Li, H.; Chen, L.; Ma, H.; Liu, H.; Ruan, Y.; Lin, J. Molecular cloning, codon-optimized gene expression, and bioactivity assessment of two novel fungal immunomodulatory proteins from Ganoderma applanatum in Pichia. Appl. Microbiol. Biotechnol. 2018, 102, 5607–5620. [Google Scholar] [CrossRef] [PubMed]
- Liu, Y.; Bastiaan-Net, S.; Wichers, H.J. Current understanding of the structure and function of fungal immunomodulatory proteins. Front. Nutr. 2020, 7, 132. [Google Scholar] [CrossRef] [PubMed]
- Wang, X.F.; Su, K.Q.; Bao, T.W.; Cong, W.R.; Chen, Y.F.; Li, Q.Z.; Zhou, X.W. Immunomodulatory effects of fungal proteins. Curr. Top. Nutraceutical Res. 2012, 10, 1–11. [Google Scholar]
- Wang, Y.; Gao, Y.N.; Bai, R.; Chen, H.Y.; Wu, Y.Y.; Shang, J.J.; Bao, D.P. Identification of a novel anticancer protein, FIP-bbo, from Botryobasidium botryosum and protein structure analysis using molecular dynamic simulation. Sci. Rep. 2019, 9, 9423. [Google Scholar] [CrossRef] [PubMed]
- Li, S.; Jiang, Z.; Sun, L.; Liu, X.; Huang, Y.; Wang, F.; Xin, F. Characterization of a new fungal immunomodulatory protein, FIP-dsq2, from Dichomitus squalens. J. Biotechnol. 2017, 246, 45–54. [Google Scholar] [CrossRef] [PubMed]
- Wang, Y.; Gao, Y.; Li, Y.; Wan, J.N.; Yang, R.H.; Mao, W.J.; Zhou, C.L.; Tang, L.H.; Gong, M.; Wu, Y.Y.; Bao, D.P. Discovery and characterization of the highly active fungal immunomodulatory protein FIP-vvo82. J. Chem. Inf. Model. 2016, 56, 2463–2472. [Google Scholar] [CrossRef] [PubMed]
- Li, Q.Z.; Zheng, Y.Z.; Zhou, X.W. Fungal immunomodulatory proteins: Characteristics, potential antitumor activities, and their molecular mechanisms. Drug Discov. Today 2019, 24, 24–33. [Google Scholar] [CrossRef] [PubMed]
- Chu, P.Y.; Sun, H.L.; Ko, J.L.; Ku, M.S.; Lin, L.J.; Lee, Y.T.; Liao, P.F.; Pan, H.H.; Lu, H.L.; Lue, K.H. Oral fungal immunomodulatory protein from Flammulina velutipes influences pulmonary inflammation and shows therapeutic potential in allergic airway disease. J. Microbiol. Immunol. Infect. 2017, 50, 297–306. [Google Scholar] [CrossRef] [PubMed]
- Ejike, U.C.; Chan, C.J.; Okechukwu, P.N.; Lim, R.L.H. New advances and potentials of fungal immunomodulatory proteins for therapeutic purposes. Crit. Rev. Biotechnol. 2020, 40, 1176–1193. [Google Scholar] [CrossRef] [PubMed]
- Fu, H.Y.; Hseu, R.S. Safety assessment of the fungal immunomodulatory protein from Ganoderma microsporum (GMI) derived from engineered Pichia pastoris: Genetic toxicology, a 13-week oral gavage toxicity study, and an embryo-fetal developmental toxicity study in Sprague-Dawley rats. Toxicol. Rep. 2022, 9, 1240–1254. [Google Scholar] [CrossRef]
- Hsin, I.L.; Ou, C.C.; Wu, M.F.; Jan, M.S.; Hsiao, Y.M.; Lin, C.H.; Ko, J.L. GMI, an immunomodulatory protein from Ganoderma microsporum, potentiates cisplatin-induced apoptosis via autophagy in lung cancer cells. Mol. Pharm. 2015, 12, 1534–1543. [Google Scholar] [CrossRef] [PubMed]
- Xue, Q.; Ding, Y.; Shang, C.; Jiang, C.; Zhao, M. Functional expression of LZ-8, a fungal immunomodulatory protein from Ganoderma lucidum, in Pichia pastoris. J. Gen. Appl. Microbiol. 2008, 54, 393–399. [Google Scholar] [CrossRef] [PubMed]
- Wu, C.T.; Lin, T.Y.; Hsu, H.Y.; Sheu, F.; Ho, C.M.; Chen, E.I.T. Ling Zhi-8 mediates p53-dependent growth arrest of lung cancer cells via the ribosomal protein S7–MDM2–p53 pathway. Carcinogenesis 2011, 32, 1890–1896. [Google Scholar] [CrossRef] [PubMed]
- Liang, C.; Li, H.; Zhou, H.; Zhang, S.; Liu, Z.; Zhou, Q.; Sun, F. Recombinant LZ-8 from Ganoderma lucidum induces endoplasmic reticulum stress-mediated autophagic cell death in SGC-7901 human gastric cancer cells. Oncol. Rep. 2012, 27, 1079–1089. [Google Scholar] [CrossRef]
- Krissinel, E.; Henrick, K. Protein interfaces, surfaces and assemblies service PISA at European Bioinformatics Institute. J. Mol. Biol. 2007, 372, 774–797. [Google Scholar] [CrossRef] [PubMed]
- Paaventhan, P.; Joseph, J.S.; Seow, S.V.; Vaday, S.; Robinson, H.; Chua, K.Y.; Kolatkar, P.R. A 1.7 Å structure of Fve, a member of the new fungal immunomodulatory protein family. J. Mol. Biol. 2003, 332, 461–470. [Google Scholar] [CrossRef]
- Huang, L.; Sun, F.; Liang, C.; He, Y.X.; Bao, R.; Liu, L.; Zhou, C.Z. Crystal structure of LZ-8 from the medicinal fungus Ganoderma lucidum. Proteins 2009, 75, 524–527. [Google Scholar] [CrossRef]
- Huang, L.; Sun, F.; Liang, C.; He, Y. X.; Bao, R.; Liu, L.; Zhou, C. Z. Crystal structure of LZ-8 from the medicinal fungus Ganoderma lucidium. Proteins Struct. Funct. Bioinform. 2009, 75(2), 524–527. [Google Scholar] [CrossRef]
- Liu, Y.; Lin, X.; Wang, X.; et al. Linking the thermostability of FIP-nha (Nectria haematococca) to its structural properties. Int. J. Biol. Macromol. 2022, 213, 555–564. [Google Scholar] [CrossRef] [PubMed]
- Hu, Y.; et al. Screening and validation of the optimal panel of reference genes in colonic epithelium and relative cancer cell lines. Sci. Rep. 2023, 13, 17777. [Google Scholar] [CrossRef]
- Granville, D.J.; Gottlieb, R.A. Mitochondria: Regulators of cell death and survival. Sci. World J. 2002, 2, 1569–1578. [Google Scholar] [CrossRef] [PubMed]
- Johnson, C.R.; Jarvis, W.D. Caspase-9 regulation: An update. Apoptosis 2004, 9, 423–427. [Google Scholar] [CrossRef] [PubMed]
- Kiraz, Y.; Adan, A.; Kartal Yandim, M.; Baran, Y. Major apoptotic mechanisms and genes involved in apoptosis. Tumour Biol. 2016, 37, 8471–8486. [Google Scholar] [CrossRef] [PubMed]
- Brentnall, M.; Rodriguez-Menocal, L.; De Guevara, R.L.; Cepero, E.; Boise, L.H. Caspase-9, caspase-3 and caspase-7 have distinct roles during intrinsic apoptosis. BMC Cell Biol. 2013, 14, 32. [Google Scholar] [CrossRef] [PubMed]
- Jeong, E.G.; Lee, J.W.; Soung, Y.H.; Nam, S.W.; Kim, S.H.; Lee, J.Y.; Yoo, N.J.; Lee, S.H. Immunohistochemical and mutational analysis of apoptosis-inducing factor (AIF) in colorectal carcinomas. APMIS 2006, 114, 867–873. [Google Scholar] [CrossRef] [PubMed]
- Qu, Z.W.; Zhou, S.Y.; Guan, S.X.; Gao, R.; Duan, Z.W.; Zhang, X.; Sun, W.Y.; Fan, W.L.; Chen, S.S.; Chen, L.J.; Lin, J.W.; Ruan, Y.Y. Recombinant expression and bioactivity comparison of four typical fungal immunomodulatory proteins from three main Ganoderma species. BMC Biotechnol. 2018, 18, 74. [Google Scholar] [CrossRef] [PubMed]
- Ramlal, A.; Samanta, A. In silico functional and phylogenetic analyses of fungal immunomodulatory proteins of some edible mushrooms. AMB Express 2022, 12, 167. [Google Scholar] [CrossRef] [PubMed]
- An, M.; Gao, F.G.; Qi, J.; Li, F.; Liu, X. Expression and crystallographic studies of a fungal immunomodulatory protein LZ-8 from the medicinal fungus Ganoderma lucidum. Sheng Wu Gong. Cheng Xue Bao 2010, 26, 1535–1541. [Google Scholar]
- Chen, H.; et al. Structural evolution and immunomodulatory versatility of fungal immunomodulatory proteins: Insights into mechanisms and bioproduction strategies. J. Agric. Food Chem. 2026, 74, 13398–13417. [Google Scholar] [CrossRef] [PubMed]
- Ejike, U.C.; Chan, C.J.; Lim, C.S.Y.; Lim, R.L.H. Functional evaluation of a recombinant fungal immunomodulatory protein from Lignosus rhinocerus produced in Pichia pastoris and Escherichia coli host expression systems. Appl. Microbiol. Biotechnol. 2021, 105, 2921–2935. [Google Scholar] [CrossRef]
- Rosano, G.L.; Morales, E.S.; Ceccarelli, E.A. New tools for recombinant protein production in Escherichia coli: A five-year update. Protein Sci. 2019, 28, 1412–1422. [Google Scholar] [CrossRef] [PubMed]
- Xu, H.; Kong, Y.Y.; Chen, X.; Guo, M.Y.; Bai, X.H.; Lu, Y.J.; Li, W.; Zhou, X.W. Recombinant FIP-gat, a fungal immunomodulatory protein from Ganoderma atrum, induces growth inhibition and cell death in breast cancer cells. J. Agric. Food Chem. 2016, 64, 2690–2699. [Google Scholar] [CrossRef] [PubMed]
- Li, S.; Nie, Y.; Ding, Y.; Shi, L.; Tang, X. Recombinant expression of a novel fungal immunomodulatory protein with human tumor cell antiproliferative activity from Nectria haematococca. Int. J. Mol. Sci. 2014, 15, 17751–17762. [Google Scholar] [CrossRef] [PubMed]
- Li, S.; Shi, L.J.; Ding, Y.; Nie, Y.; Tang, X.M. Identification and functional characterization of a novel fungal immunomodulatory protein from Postia placenta. Food Chem. Toxicol. 2015, 78, 1–8. [Google Scholar] [CrossRef]
- Ameen, R.; Sumrin, A. Characterization and anticancer bioactivity of the fungal immunomodulatory protein FIP-Gre from Ganoderma resinaceum. Mol. Biol. Rep. 2026, 53, 485–495. [Google Scholar] [CrossRef] [PubMed]
- Lindström, M.S.; Bartek, J.; Maya-Mendoza, A. p53 at the crossroad of DNA replication and ribosome biogenesis stress pathways. Cell Death Differ. 2022, 29, 913–927. [Google Scholar] [CrossRef] [PubMed]
- Abuetabh, Y.; Wu, H.H.; Chai, C.; Al Yousef, H.; Persad, S.; Sergi, C.M.; Leng, R. DNA damage response revisited: The p53 family and its regulators provide endless cancer therapy opportunities. Exp. Mol. Med. 2022, 54, 1718–1732. [Google Scholar] [CrossRef] [PubMed]
- Aubrey, B.J.; Kelly, G.L.; Janic, A.; Herold, M.J.; Strasser, A. How does p53 induce apoptosis and how does this relate to p53-mediated tumour suppression? Cell Death Differ. 2018, 25, 104–113. [Google Scholar] [CrossRef] [PubMed]
- Vousden, K.H.; Ryan, K.M. p53 and metabolism. Nat. Rev. Cancer 2009, 9, 691–700. [Google Scholar] [CrossRef] [PubMed]
- Chang, Y.C.; Hsiao, Y.M.; Wu, M.F.; Ou, C.C.; Lin, Y.W.; Lue, K.H.; Ko, J.L. Interruption of lung cancer cell migration and proliferation by fungal immunomodulatory protein FIP-fve from Flammulina velutipes. J. Agric. Food Chem. 2013, 61, 12044–12052. [Google Scholar] [CrossRef] [PubMed]
- Brunelle, J.K.; Letai, A. Control of mitochondrial apoptosis by the BCL-2 family. J. Cell Sci. 2009, 122, 437–441. [Google Scholar] [CrossRef] [PubMed]
- Ramesh, P.; Medema, J.P. BCL-2 family deregulation in colorectal cancer: Potential for BH3 mimetics in therapy. Apoptosis 2020, 25, 305–320. [Google Scholar] [CrossRef] [PubMed]
- Gry, M.; Rimini, R.; Strömberg, S.; Asplund, A.; Pontén, F.; Uhlén, M.; Nilsson, P. Correlations between RNA and protein expression profiles in 23 human cell lines. BMC Genom. 2009, 10, 365. [Google Scholar] [CrossRef] [PubMed]
- Guo, Y.; Xiao, P.; Lei, S.; Deng, F.; Xiao, G.G.; Liu, Y.; Chen, X.; Li, L.; Wu, S.; Chen, Y.; Jiang, H.; Tan, L.; Xie, J.; Zhu, X.; Liang, S.; Deng, H. How is mRNA expression predictive for protein expression? A correlation study on human circulating monocytes. Acta Biochim. Biophys. Sin. 2008, 40, 426–436. [Google Scholar] [CrossRef] [PubMed]
- Candé, C.; Cecconi, F.; Dessen, P.; Kroemer, G. Apoptosis-inducing factor (AIF): Key to the conserved caspase-independent pathways of cell death? J. Cell Sci. 2002, 115, 4727–4734. [Google Scholar] [CrossRef] [PubMed]
- Burkhardt, A.; Pakendorf, T.; Reime, B.; Meyer, J.; Fischer, P.; Stübe, N.; et al. Status of the crystallography beamlines at PETRA III. Eur. Phys. J. Plus 2016, 131, 56. [Google Scholar] [CrossRef]
- Meents, A.; Reime, B.; Stübe, N.; Fischer, P.; Warmer, M.; Goeries, D.; et al. Development of an in-vacuum X-ray microscope with cryogenic sample cooling for beamline P11 at PETRA III. In X-Ray Nanoimaging: Instruments and Methods; SPIE: Bellingham, WA, USA, 2013; p. 8851. [Google Scholar] [CrossRef]
- Battye, T.G.G.; Kontogiannis, L.; Johnson, O.; Powell, H.R.; Leslie, A.G.W. iMOSFLM: A new graphical interface for diffraction-image processing with MOSFLM. Acta Crystallogr. D. Biol. Crystallogr. 2011, 67, 271–281. [Google Scholar] [CrossRef] [PubMed]
- Potterton, L.; Agirre, J.; Ballard, C.; Cowtan, K.; Dodson, E.; Evans, P.R.; et al. CCP4i2: The new graphical user interface to the CCP4 program suite. Acta Crystallogr. D. Struct. Biol. 2018, 74, 68–84. [Google Scholar] [CrossRef] [PubMed]
- Evans, P.R.; Murshudov, G.N. How good are my data and what is the resolution? Acta Crystallogr. D. Biol. Crystallogr. 2013, 69, 1204–1214. [Google Scholar] [CrossRef] [PubMed]
- Murshudov, G.N.; Skubák, P.; Lebedev, A.A.; Pannu, N.S.; Steiner, R.A.; Nicholls, R.A.; et al. REFMAC5 for the refinement of macromolecular crystal structures. Acta Crystallogr. D. Biol. Crystallogr. 2011, 67, 355–367. [Google Scholar] [CrossRef] [PubMed]
- McCoy, A.J. Solving structures of protein complexes by molecular replacement with Phaser. Acta Crystallogr. D. Biol. Crystallogr. 2007, 63, 32–41. [Google Scholar] [CrossRef] [PubMed]
- Emsley, P.; Cowtan, K. Coot: Model-building tools for molecular graphics. Acta Crystallogr. D. Biol. Crystallogr. 2004, 60, 2126–2132. [Google Scholar] [CrossRef] [PubMed]
- Emsley, P.; Lohkamp, B.; Scott, W.G.; Cowtan, K. Features and development of Coot. Acta Crystallogr. D. Biol. Crystallogr. 2010, 66, 486–501. [Google Scholar] [CrossRef] [PubMed]
- Chen, V.B.; Arendall, W.B.; Headd, J.J.; Keedy, D.A.; Immormino, R.M.; Kapral, G.J.; et al. MolProbity: All-atom structure validation for macromolecular crystallography. Acta Crystallogr. D. Biol. Crystallogr. 2010, 66, 12–21. [Google Scholar] [CrossRef] [PubMed]
- Pettersen, E.F.; Goddard, T.D.; Huang, C.C.; Couch, G.S.; Greenblatt, D.M.; Meng, E.C.; Ferrin, T.E. UCSF Chimera—A visualization system for exploratory research and analysis. J. Comput. Chem. 2004, 25, 1605–1612. [Google Scholar] [CrossRef] [PubMed]
- Frishman, D.; Argos, P. Knowledge-based protein secondary structure assignment. Proteins 1995, 23, 566–579. [Google Scholar] [CrossRef] [PubMed]
- Boice, A.; Bouchier-Hayes, L. Targeting apoptotic caspases in cancer. Biochim. Biophys. Acta Mol. Cell Res. 2020, 1867, 118688. [Google Scholar] [CrossRef] [PubMed]
- Singh, R.; Letai, A.; Sarosiek, K. Regulation of apoptosis in health and disease: The balancing act of BCL-2 family proteins. Nat. Rev. Mol. Cell Biol. 2019, 20, 175–193. [Google Scholar] [CrossRef] [PubMed]
- Jinn, T.R.; Wu, C.M.; Tu, W.C.; Ko, J.L.; Tzen, J.T.C. Functional expression of FIP-gts, a fungal immunomodulatory protein from Ganoderma tsugae in Sf21 insect cells. Biosci. Biotechnol. Biochem. 2006, 70, 2627–2634. [Google Scholar] [CrossRef] [PubMed]
Figure 1.
Phylogenetic tree of selected fungal immunomodulatory proteins (FIPs), including FIP-ach. The tree was constructed using the Neighbor-Joining (NJ) method implemented in MEGA11 based on amino acid sequences of representative FIP family members. Numbers shown at the nodes indicate bootstrap support values.
Figure 1.
Phylogenetic tree of selected fungal immunomodulatory proteins (FIPs), including FIP-ach. The tree was constructed using the Neighbor-Joining (NJ) method implemented in MEGA11 based on amino acid sequences of representative FIP family members. Numbers shown at the nodes indicate bootstrap support values.
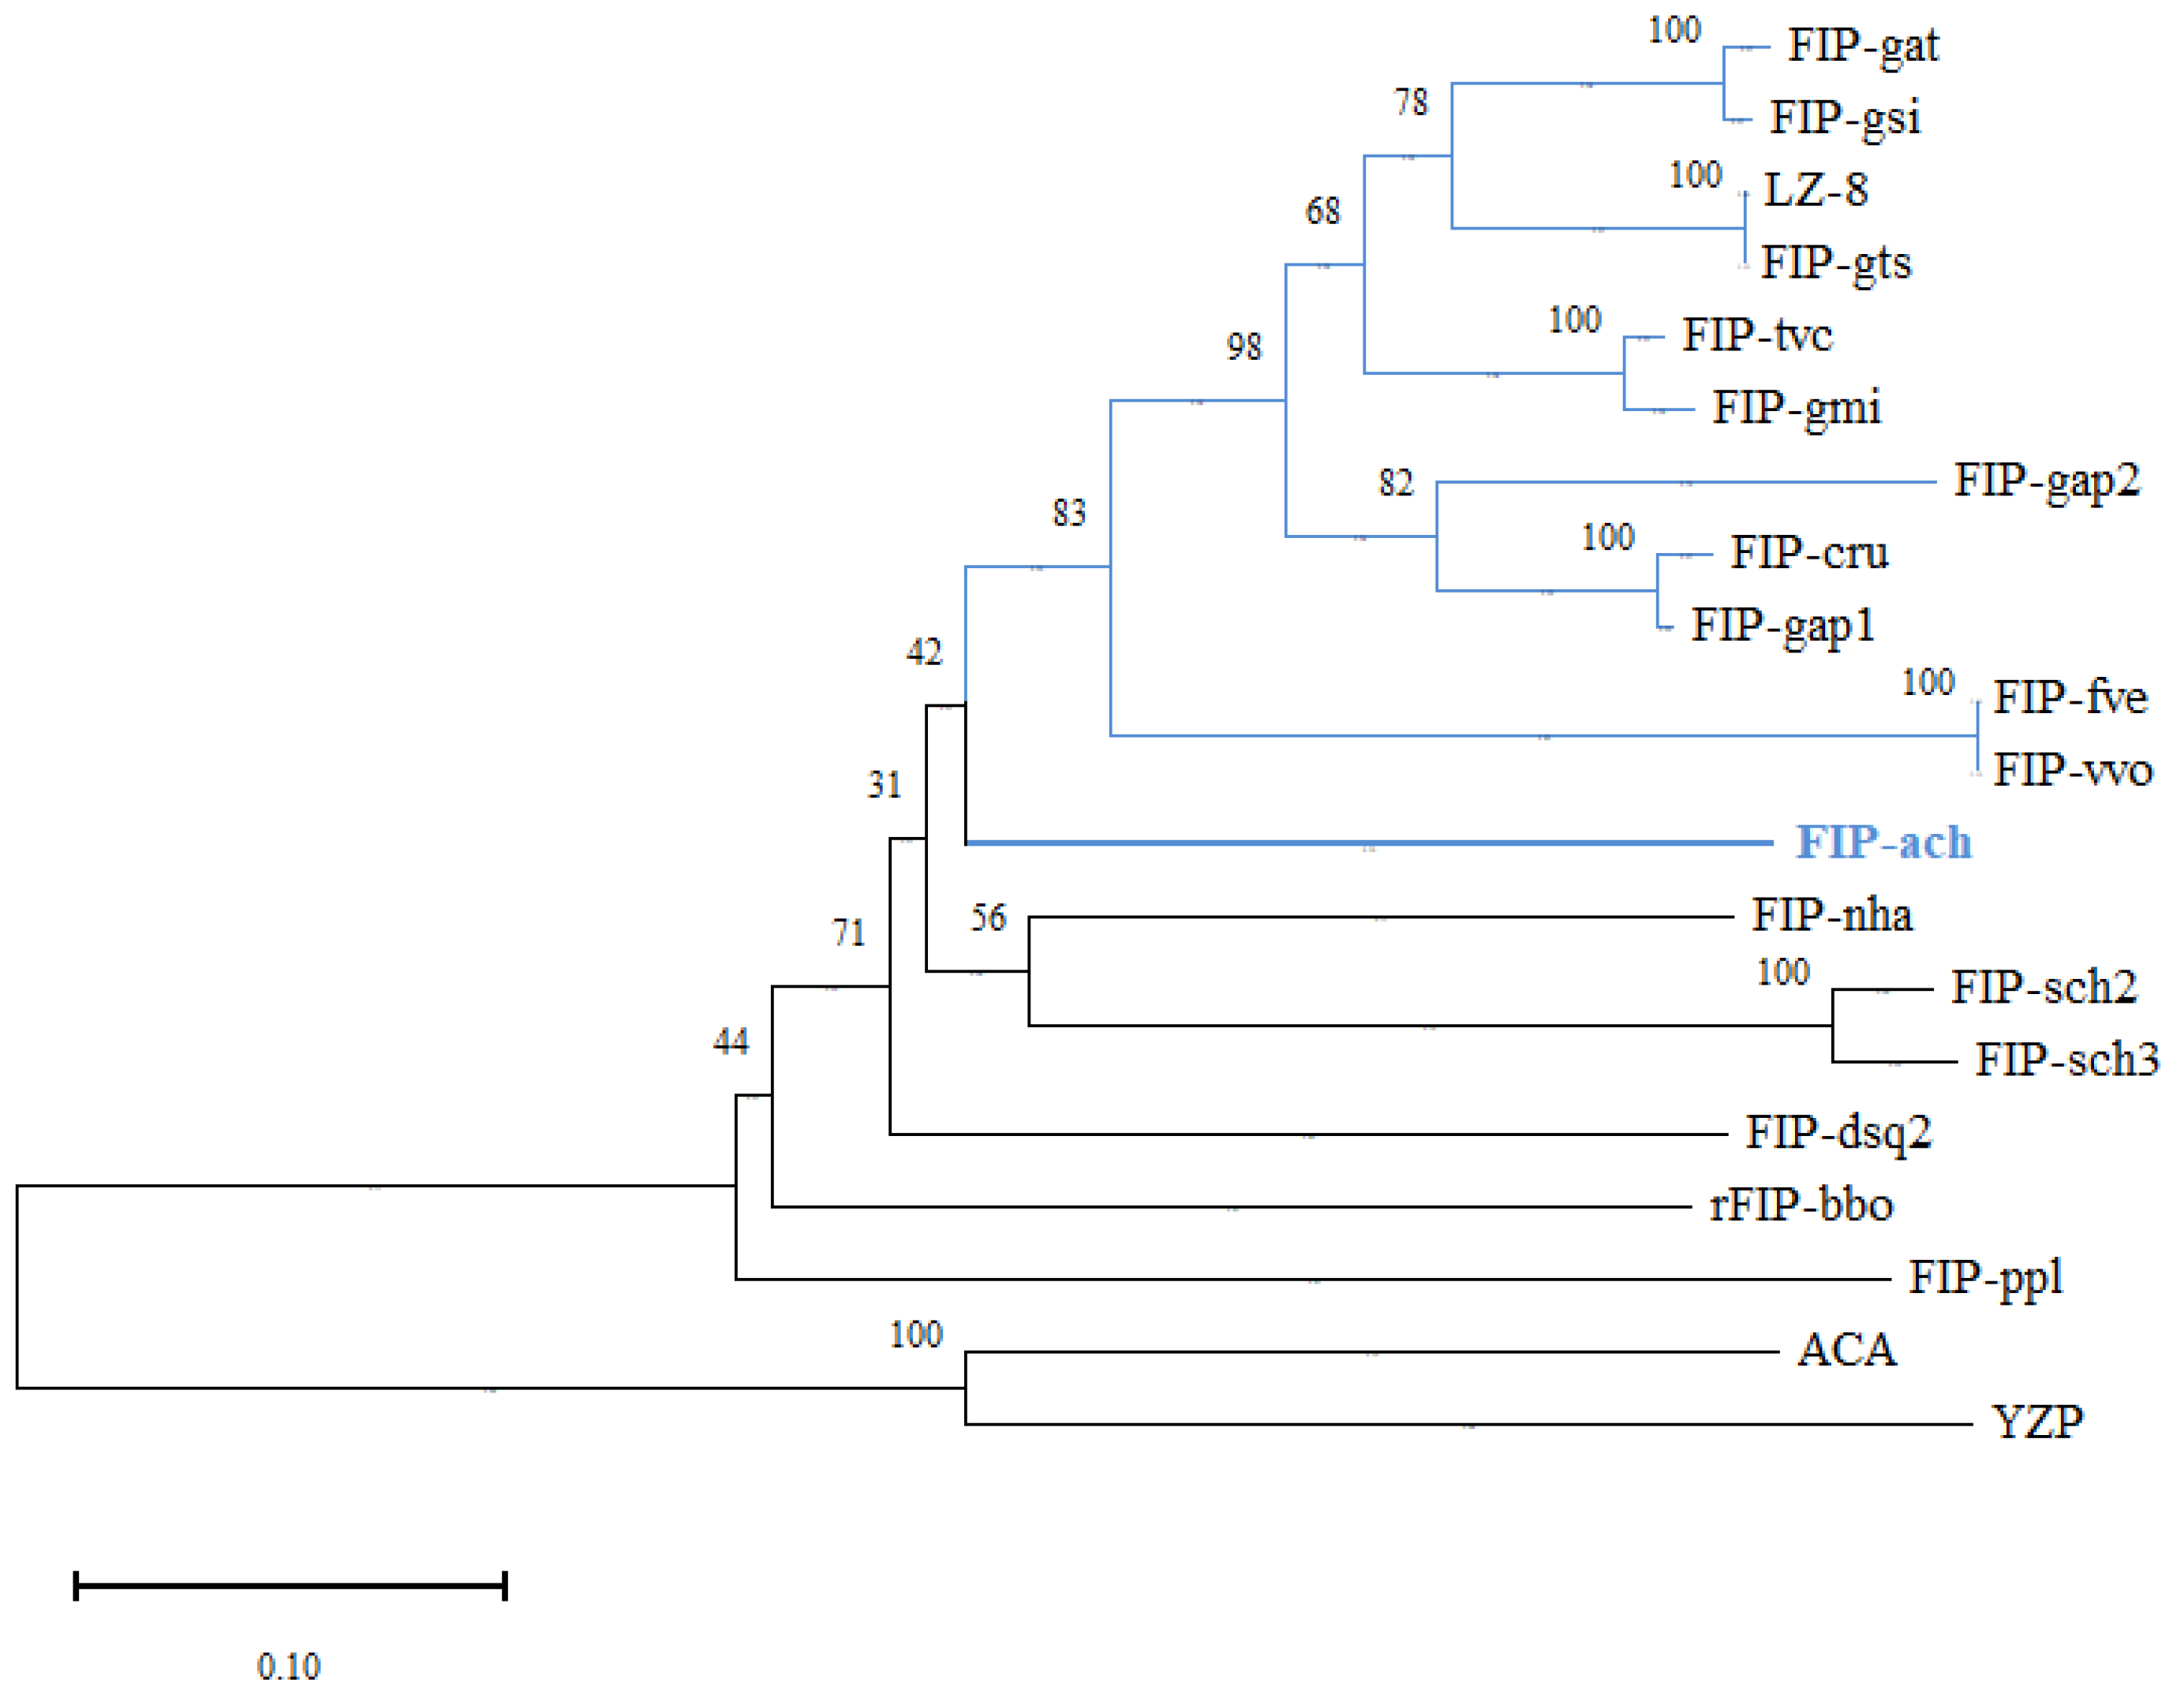
Figure 2.
Multiple sequence alignment of FIP-ach with structurally characterized FIPs for which experimentally determined structures are available in the Protein Data Bank (PDB).
Figure 2.
Multiple sequence alignment of FIP-ach with structurally characterized FIPs for which experimentally determined structures are available in the Protein Data Bank (PDB).
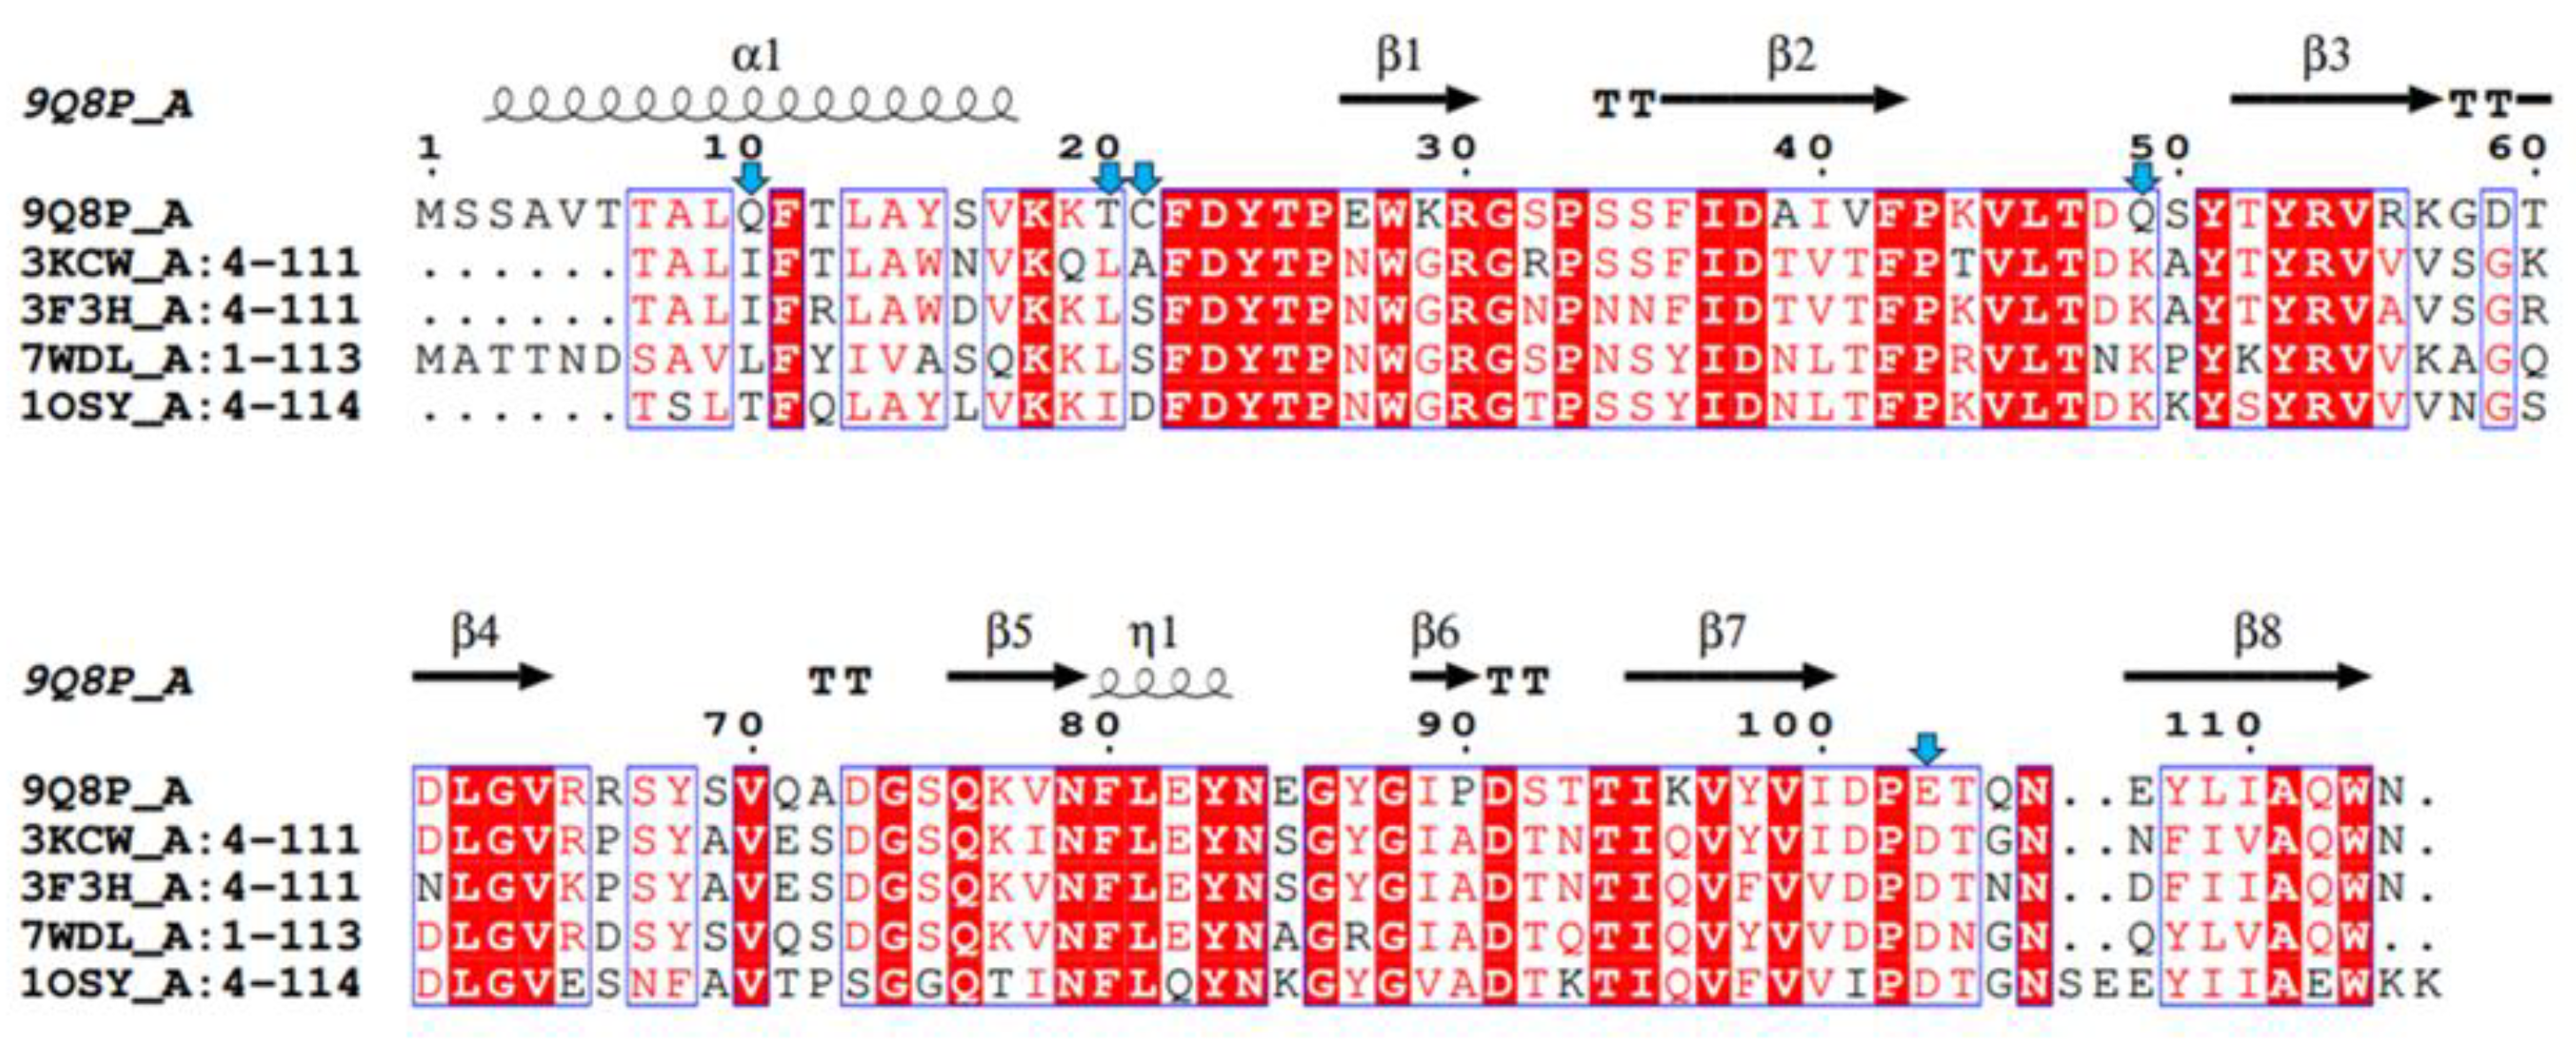
Figure 3.
SDS-PAGE analysis of recombinant FIP-ach protein isolated from E. coli and purified using IMAC. Lane 1: molecular weight marker (kDa); lane 2: soluble protein fraction; lane 3: flow-through fraction; lane 4: final wash prior to elution; lanes 5–11: protein fractions collected during elution. The protein band observed at approximately 15 kDa corresponds to recombinant FIP-ach.
Figure 3.
SDS-PAGE analysis of recombinant FIP-ach protein isolated from E. coli and purified using IMAC. Lane 1: molecular weight marker (kDa); lane 2: soluble protein fraction; lane 3: flow-through fraction; lane 4: final wash prior to elution; lanes 5–11: protein fractions collected during elution. The protein band observed at approximately 15 kDa corresponds to recombinant FIP-ach.
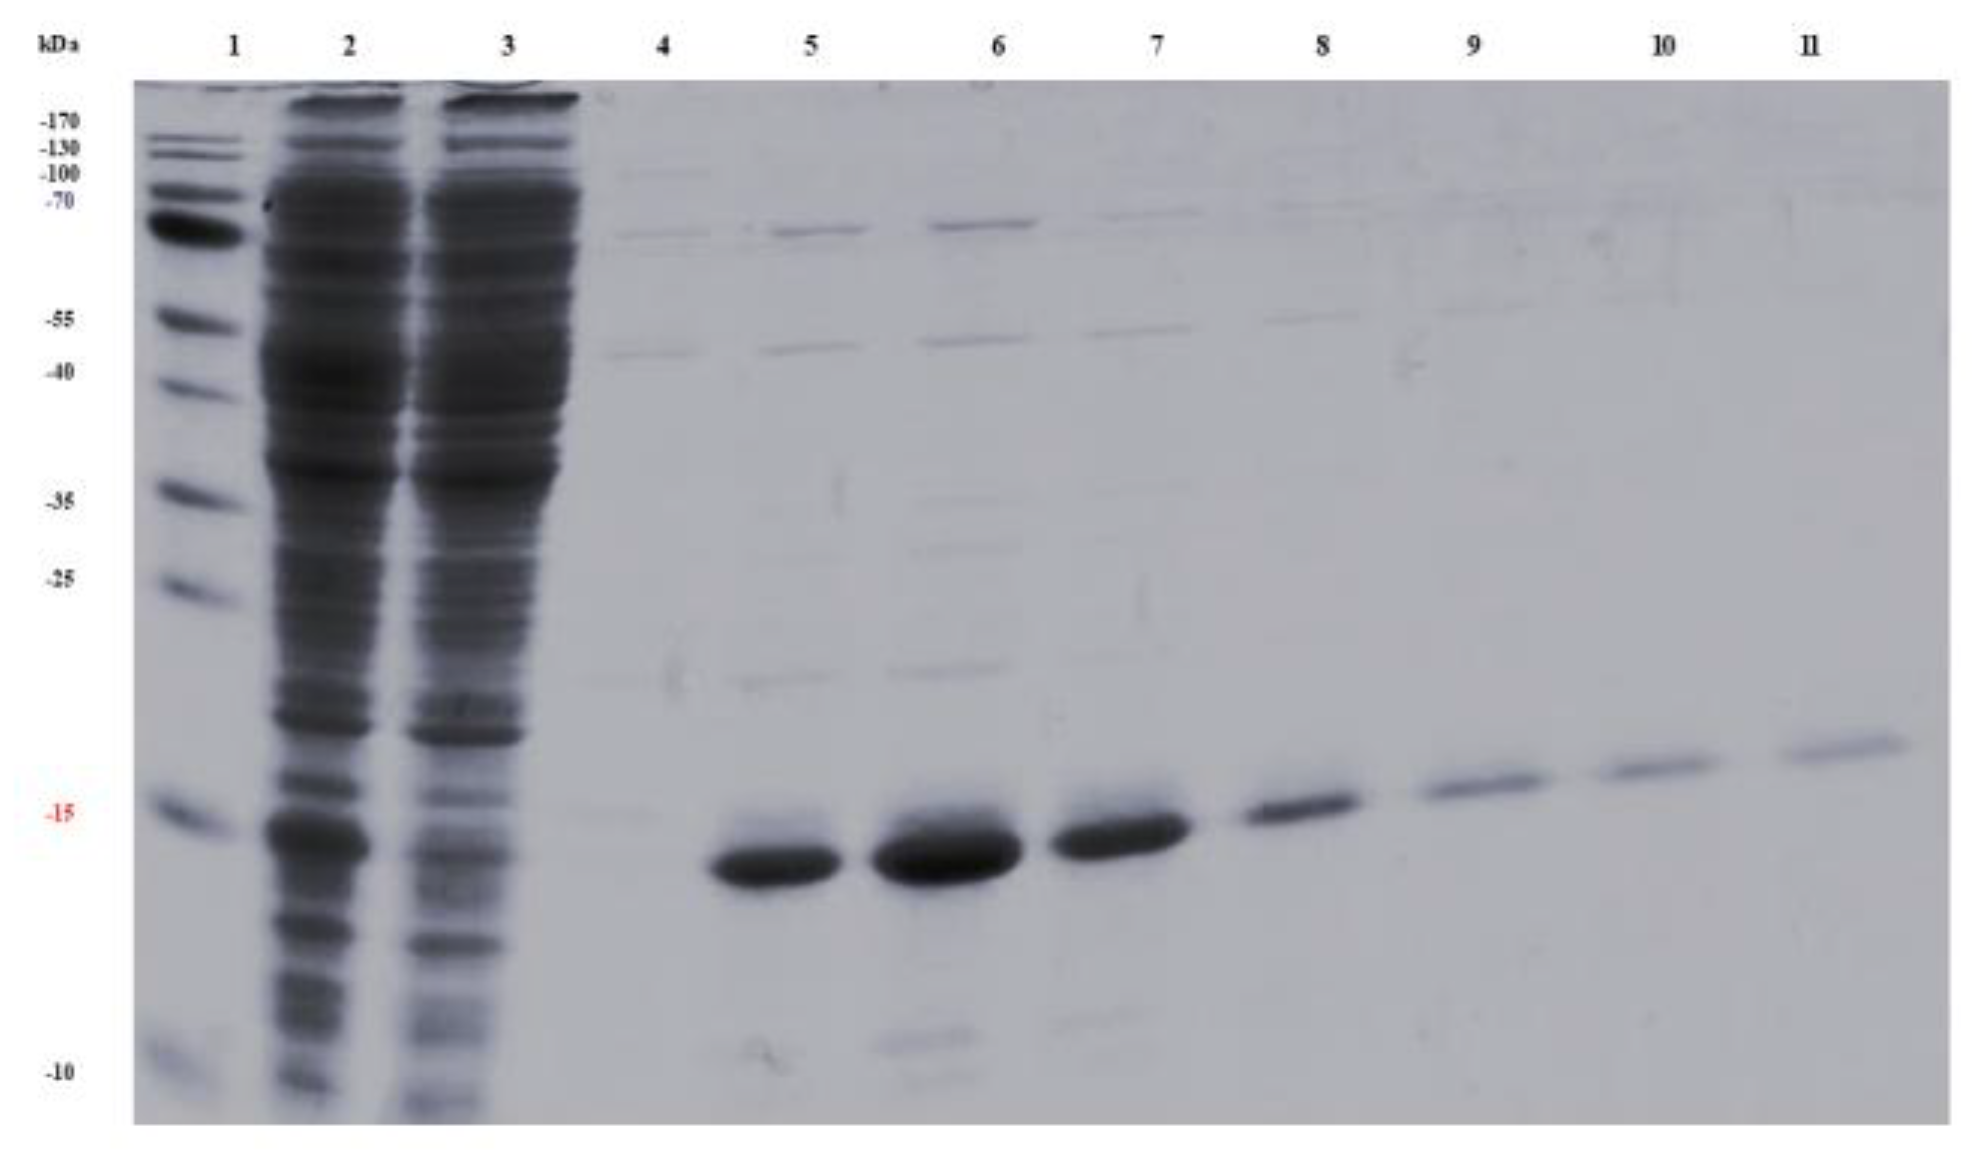
Figure 4.
(A) The representation of N- and C-terminal domains of FIP-ach in homodimer and (B) dimer of dimers (tetramer), (C) The anti-parallel arrangement of β-strands (A to H) in C-terminal domain. Here, the structure is coloured based on secondary structure; pink colour represent the β-strands, marine colour represents the helix and orange colour represents the coil/turn in the structure.
Figure 4.
(A) The representation of N- and C-terminal domains of FIP-ach in homodimer and (B) dimer of dimers (tetramer), (C) The anti-parallel arrangement of β-strands (A to H) in C-terminal domain. Here, the structure is coloured based on secondary structure; pink colour represent the β-strands, marine colour represents the helix and orange colour represents the coil/turn in the structure.
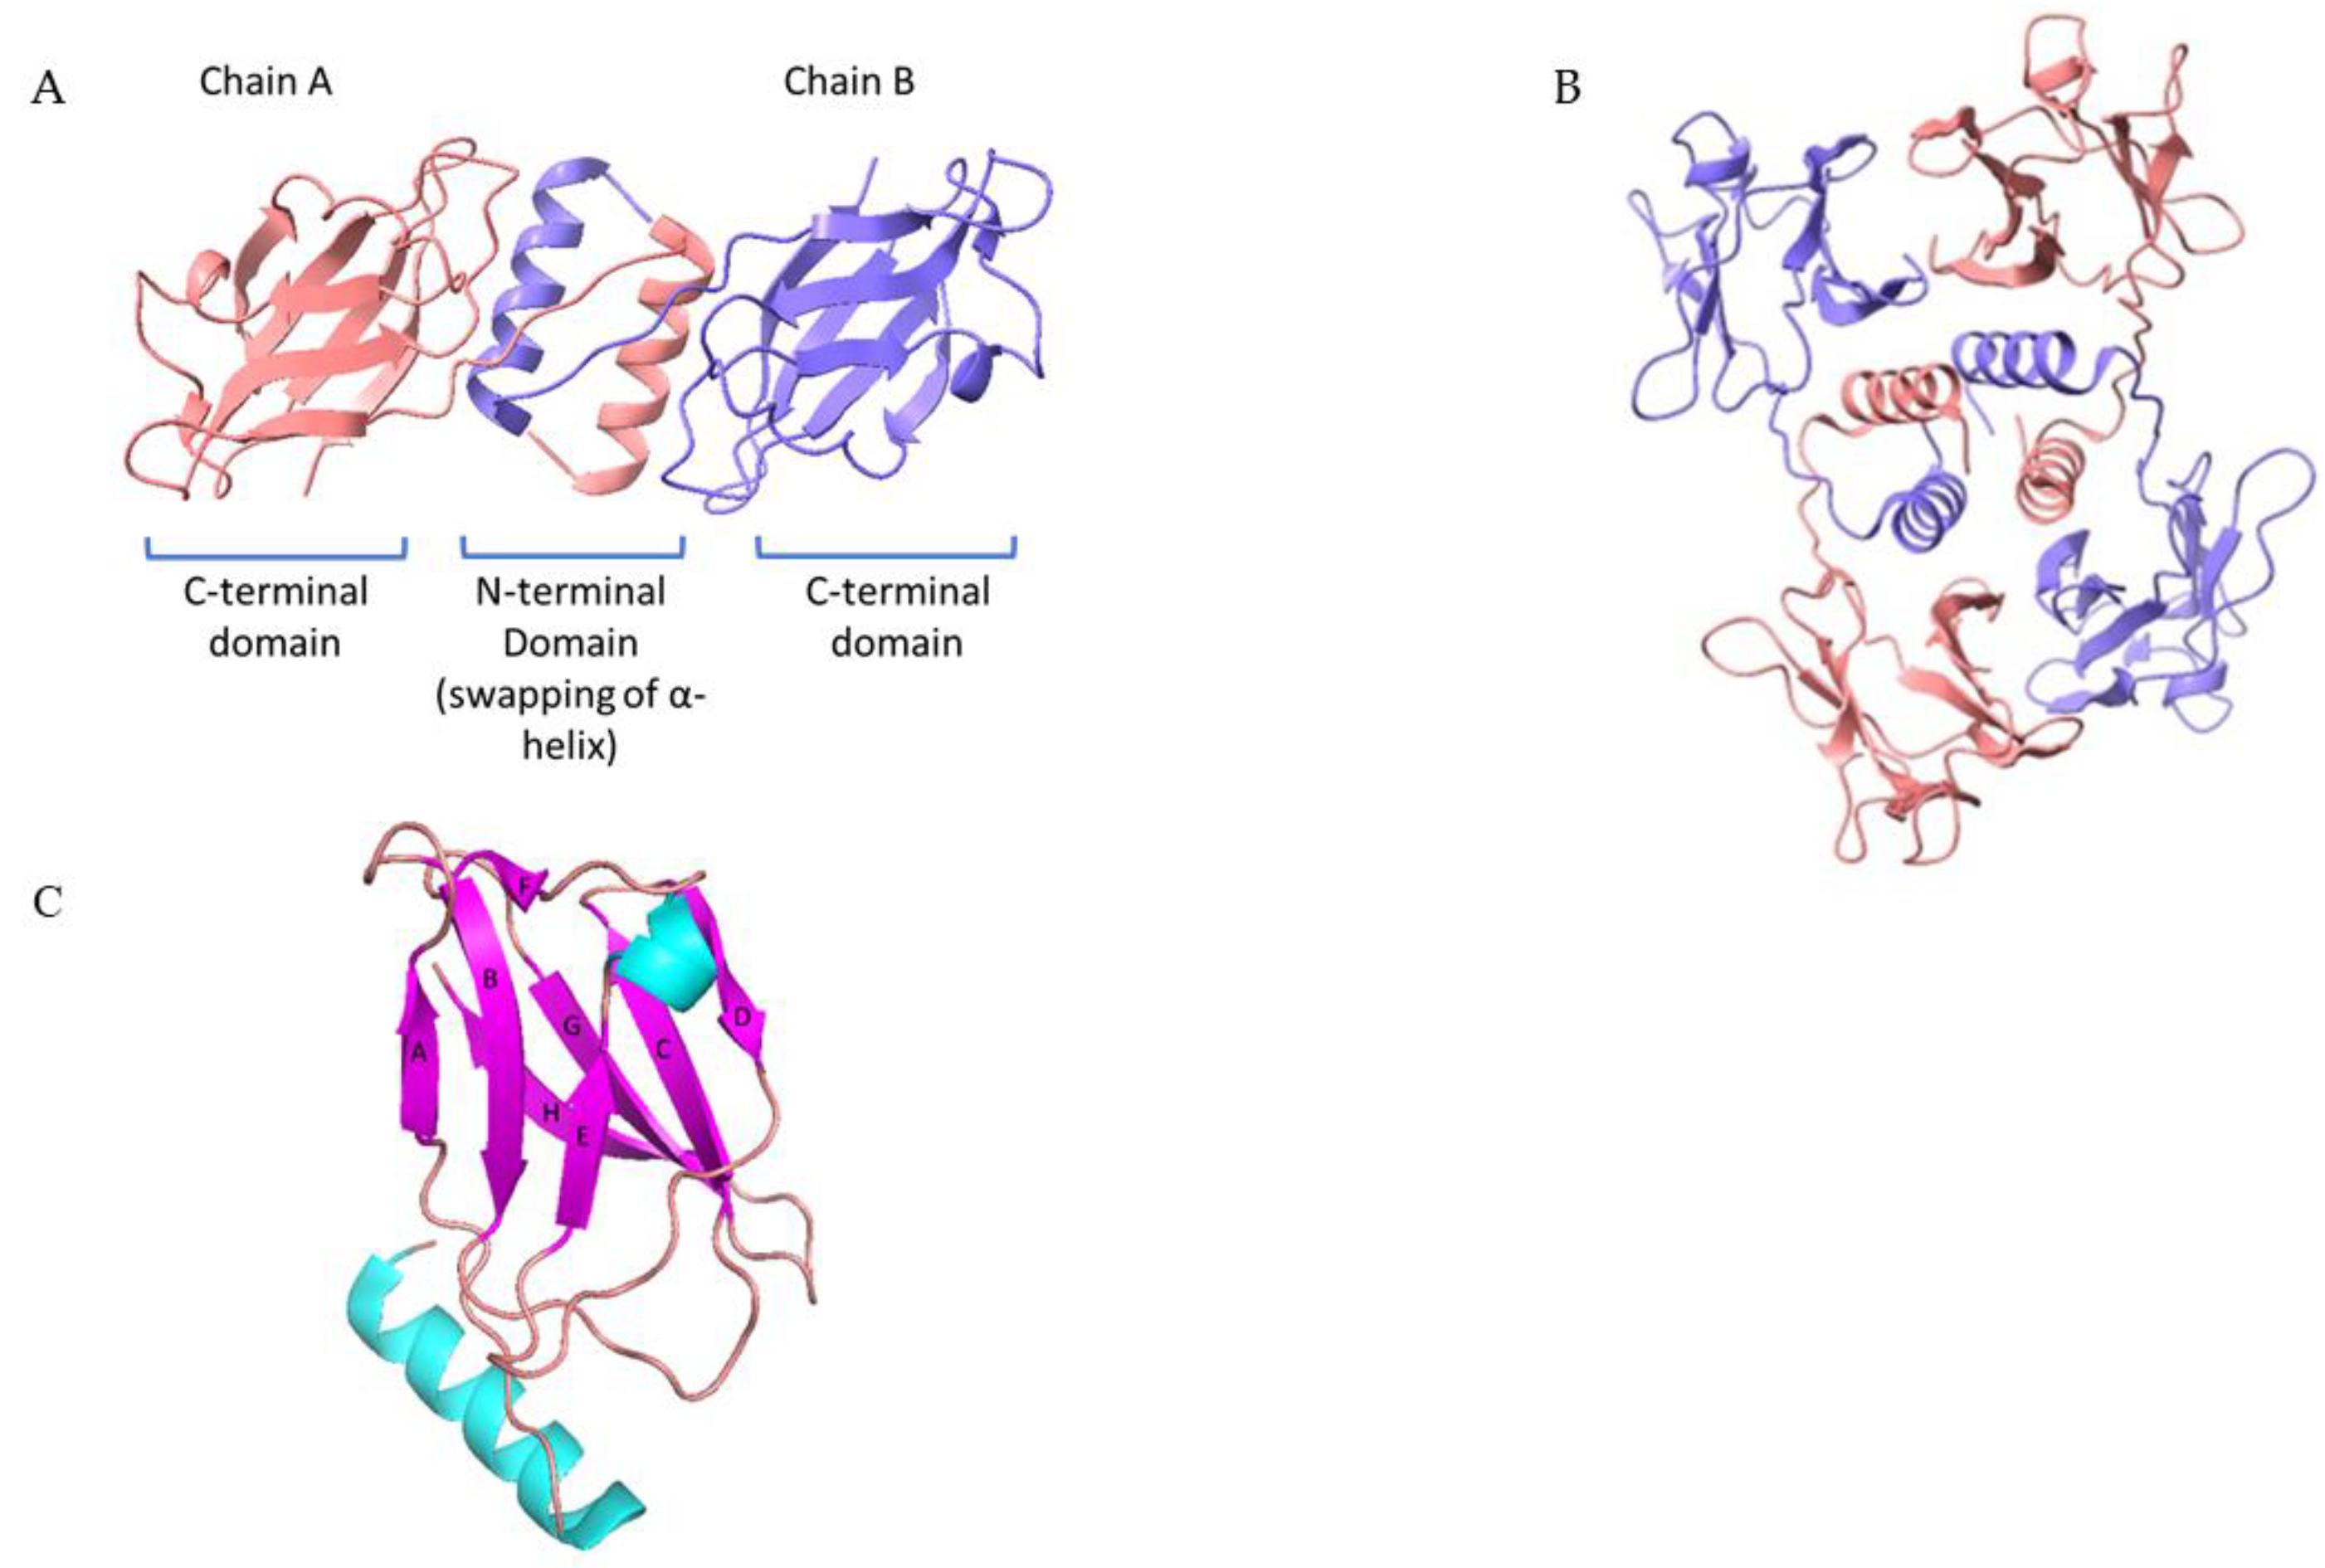
Figure 5.
Surface representation of the FIP-ach tetramer. Residues highlighted in pink are involved in the interaction between two FIP-ach monomers forming a homodimer, while residues in blue indicate the interaction interface between two homodimers forming a tetramer.
Figure 5.
Surface representation of the FIP-ach tetramer. Residues highlighted in pink are involved in the interaction between two FIP-ach monomers forming a homodimer, while residues in blue indicate the interaction interface between two homodimers forming a tetramer.
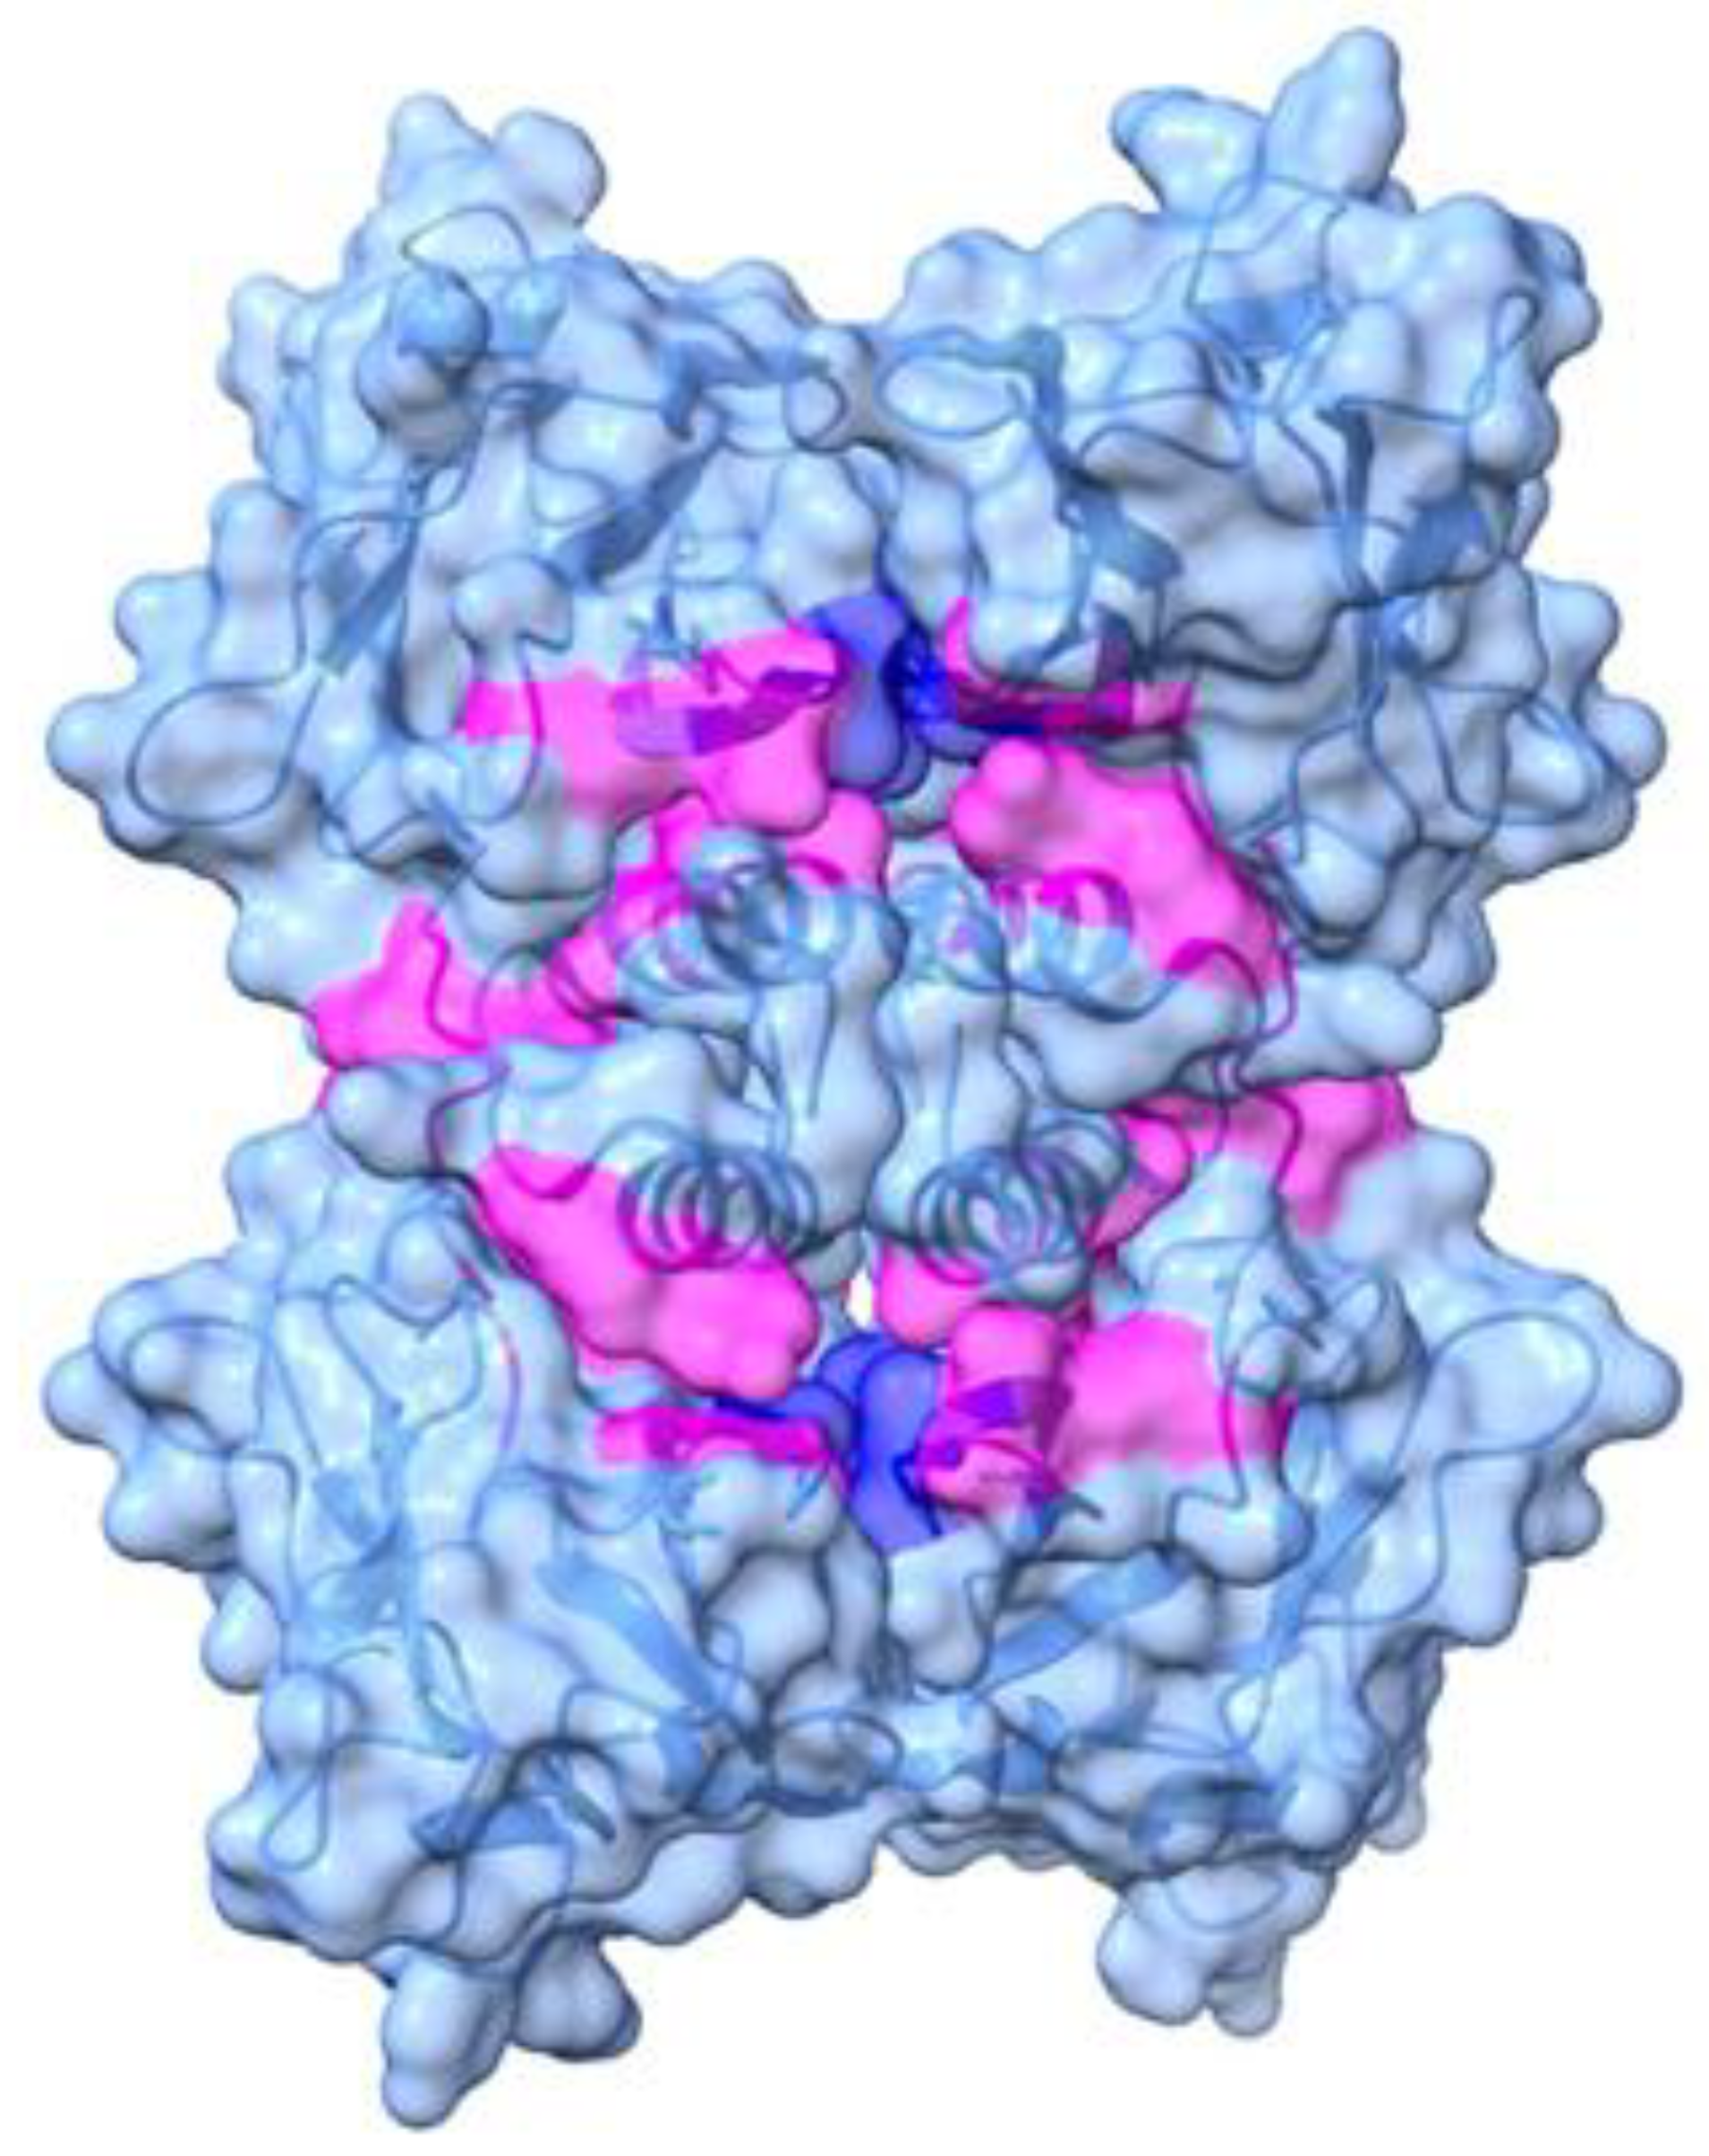
Figure 6.
Superposition of FIP-ach (B=blue, PDB ID: 9Q8P) with the FIP-fve (purple, PDB ID: 1OSY), FIP-LZ-8 (green, PDB ID: 3F3H), FIP-nha (red, PDB ID: 7WDL), and FIP-gmi (yellow, PDB ID: 3KCW).
Figure 6.
Superposition of FIP-ach (B=blue, PDB ID: 9Q8P) with the FIP-fve (purple, PDB ID: 1OSY), FIP-LZ-8 (green, PDB ID: 3F3H), FIP-nha (red, PDB ID: 7WDL), and FIP-gmi (yellow, PDB ID: 3KCW).
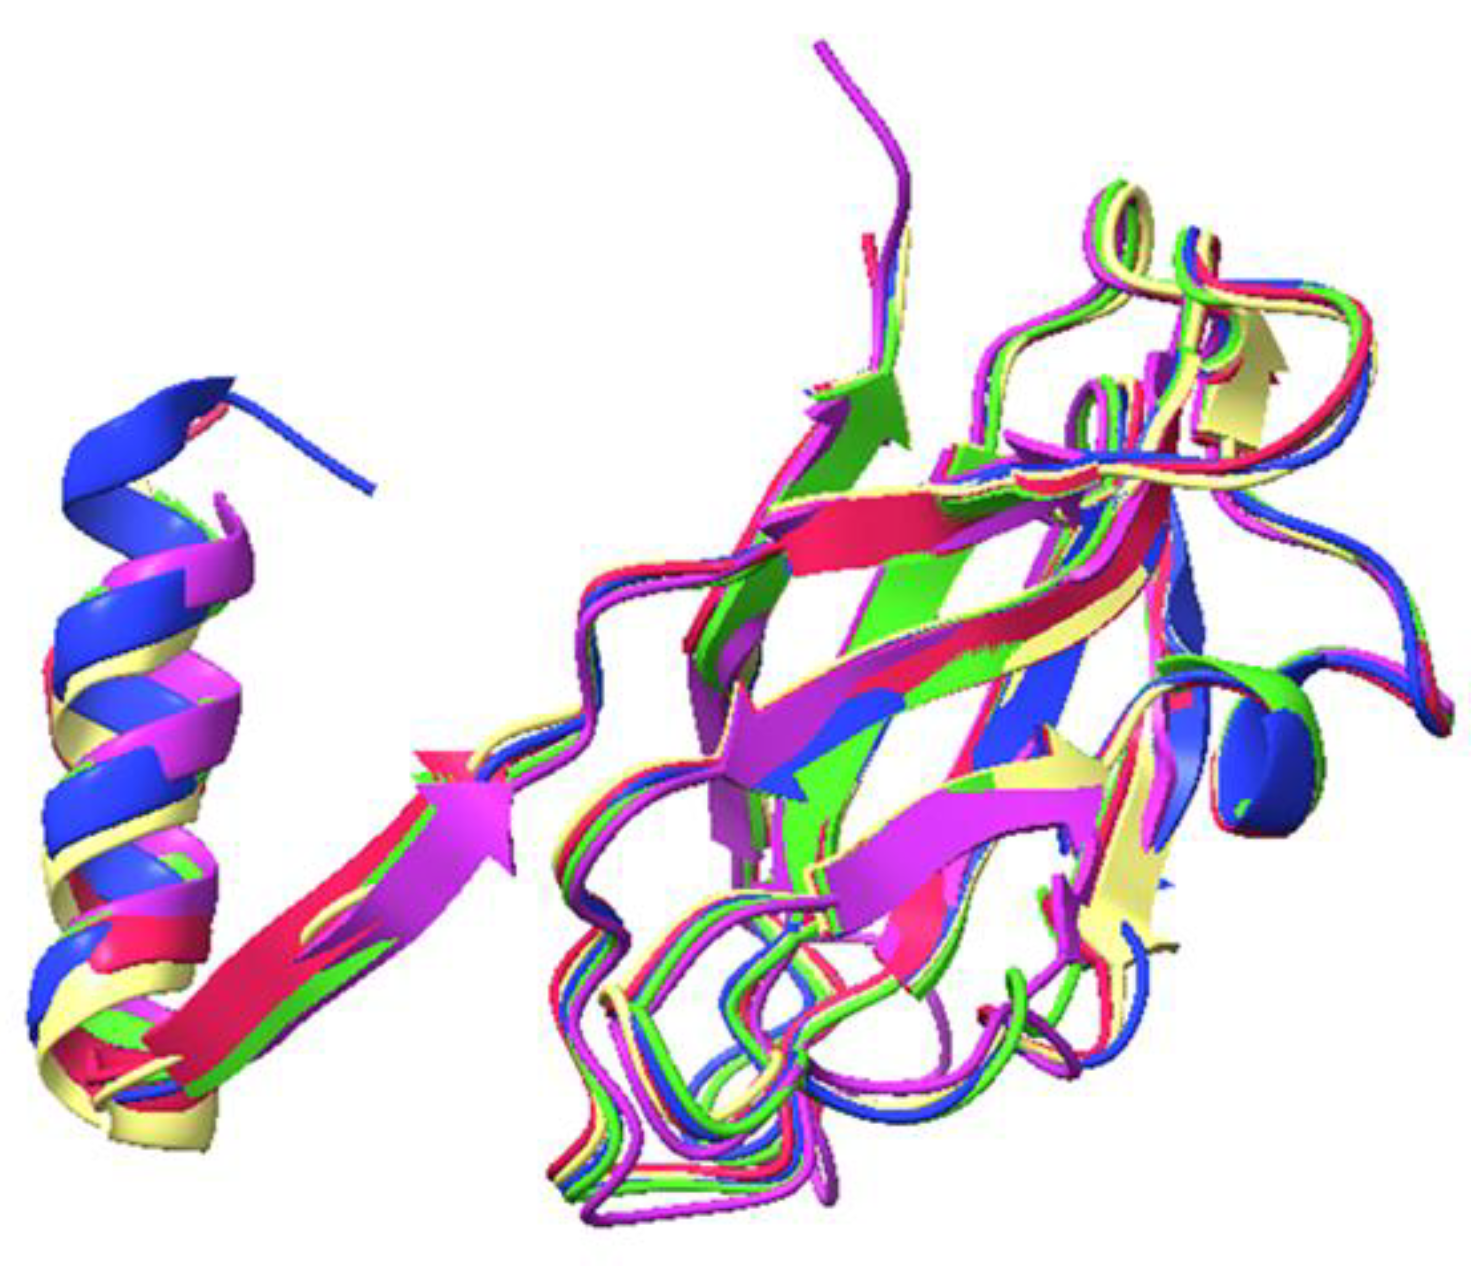
Figure 7.
Cytotoxic activity of FIP-ach protein against A) LoVo colorectal cancer cells, and B) BJ foreskin fibroblasts. Cells were incubated for 72 hours under optimal conditions with FIP-ach protein at concentrations ranging from 0.1-80 μg/mL for LoVo cells and 2-40 μg/mL for BJ cells, respectively. Cell viability was assessed using the MTT assay. The graph shows representative cytotoxicity curves.
Figure 7.
Cytotoxic activity of FIP-ach protein against A) LoVo colorectal cancer cells, and B) BJ foreskin fibroblasts. Cells were incubated for 72 hours under optimal conditions with FIP-ach protein at concentrations ranging from 0.1-80 μg/mL for LoVo cells and 2-40 μg/mL for BJ cells, respectively. Cell viability was assessed using the MTT assay. The graph shows representative cytotoxicity curves.
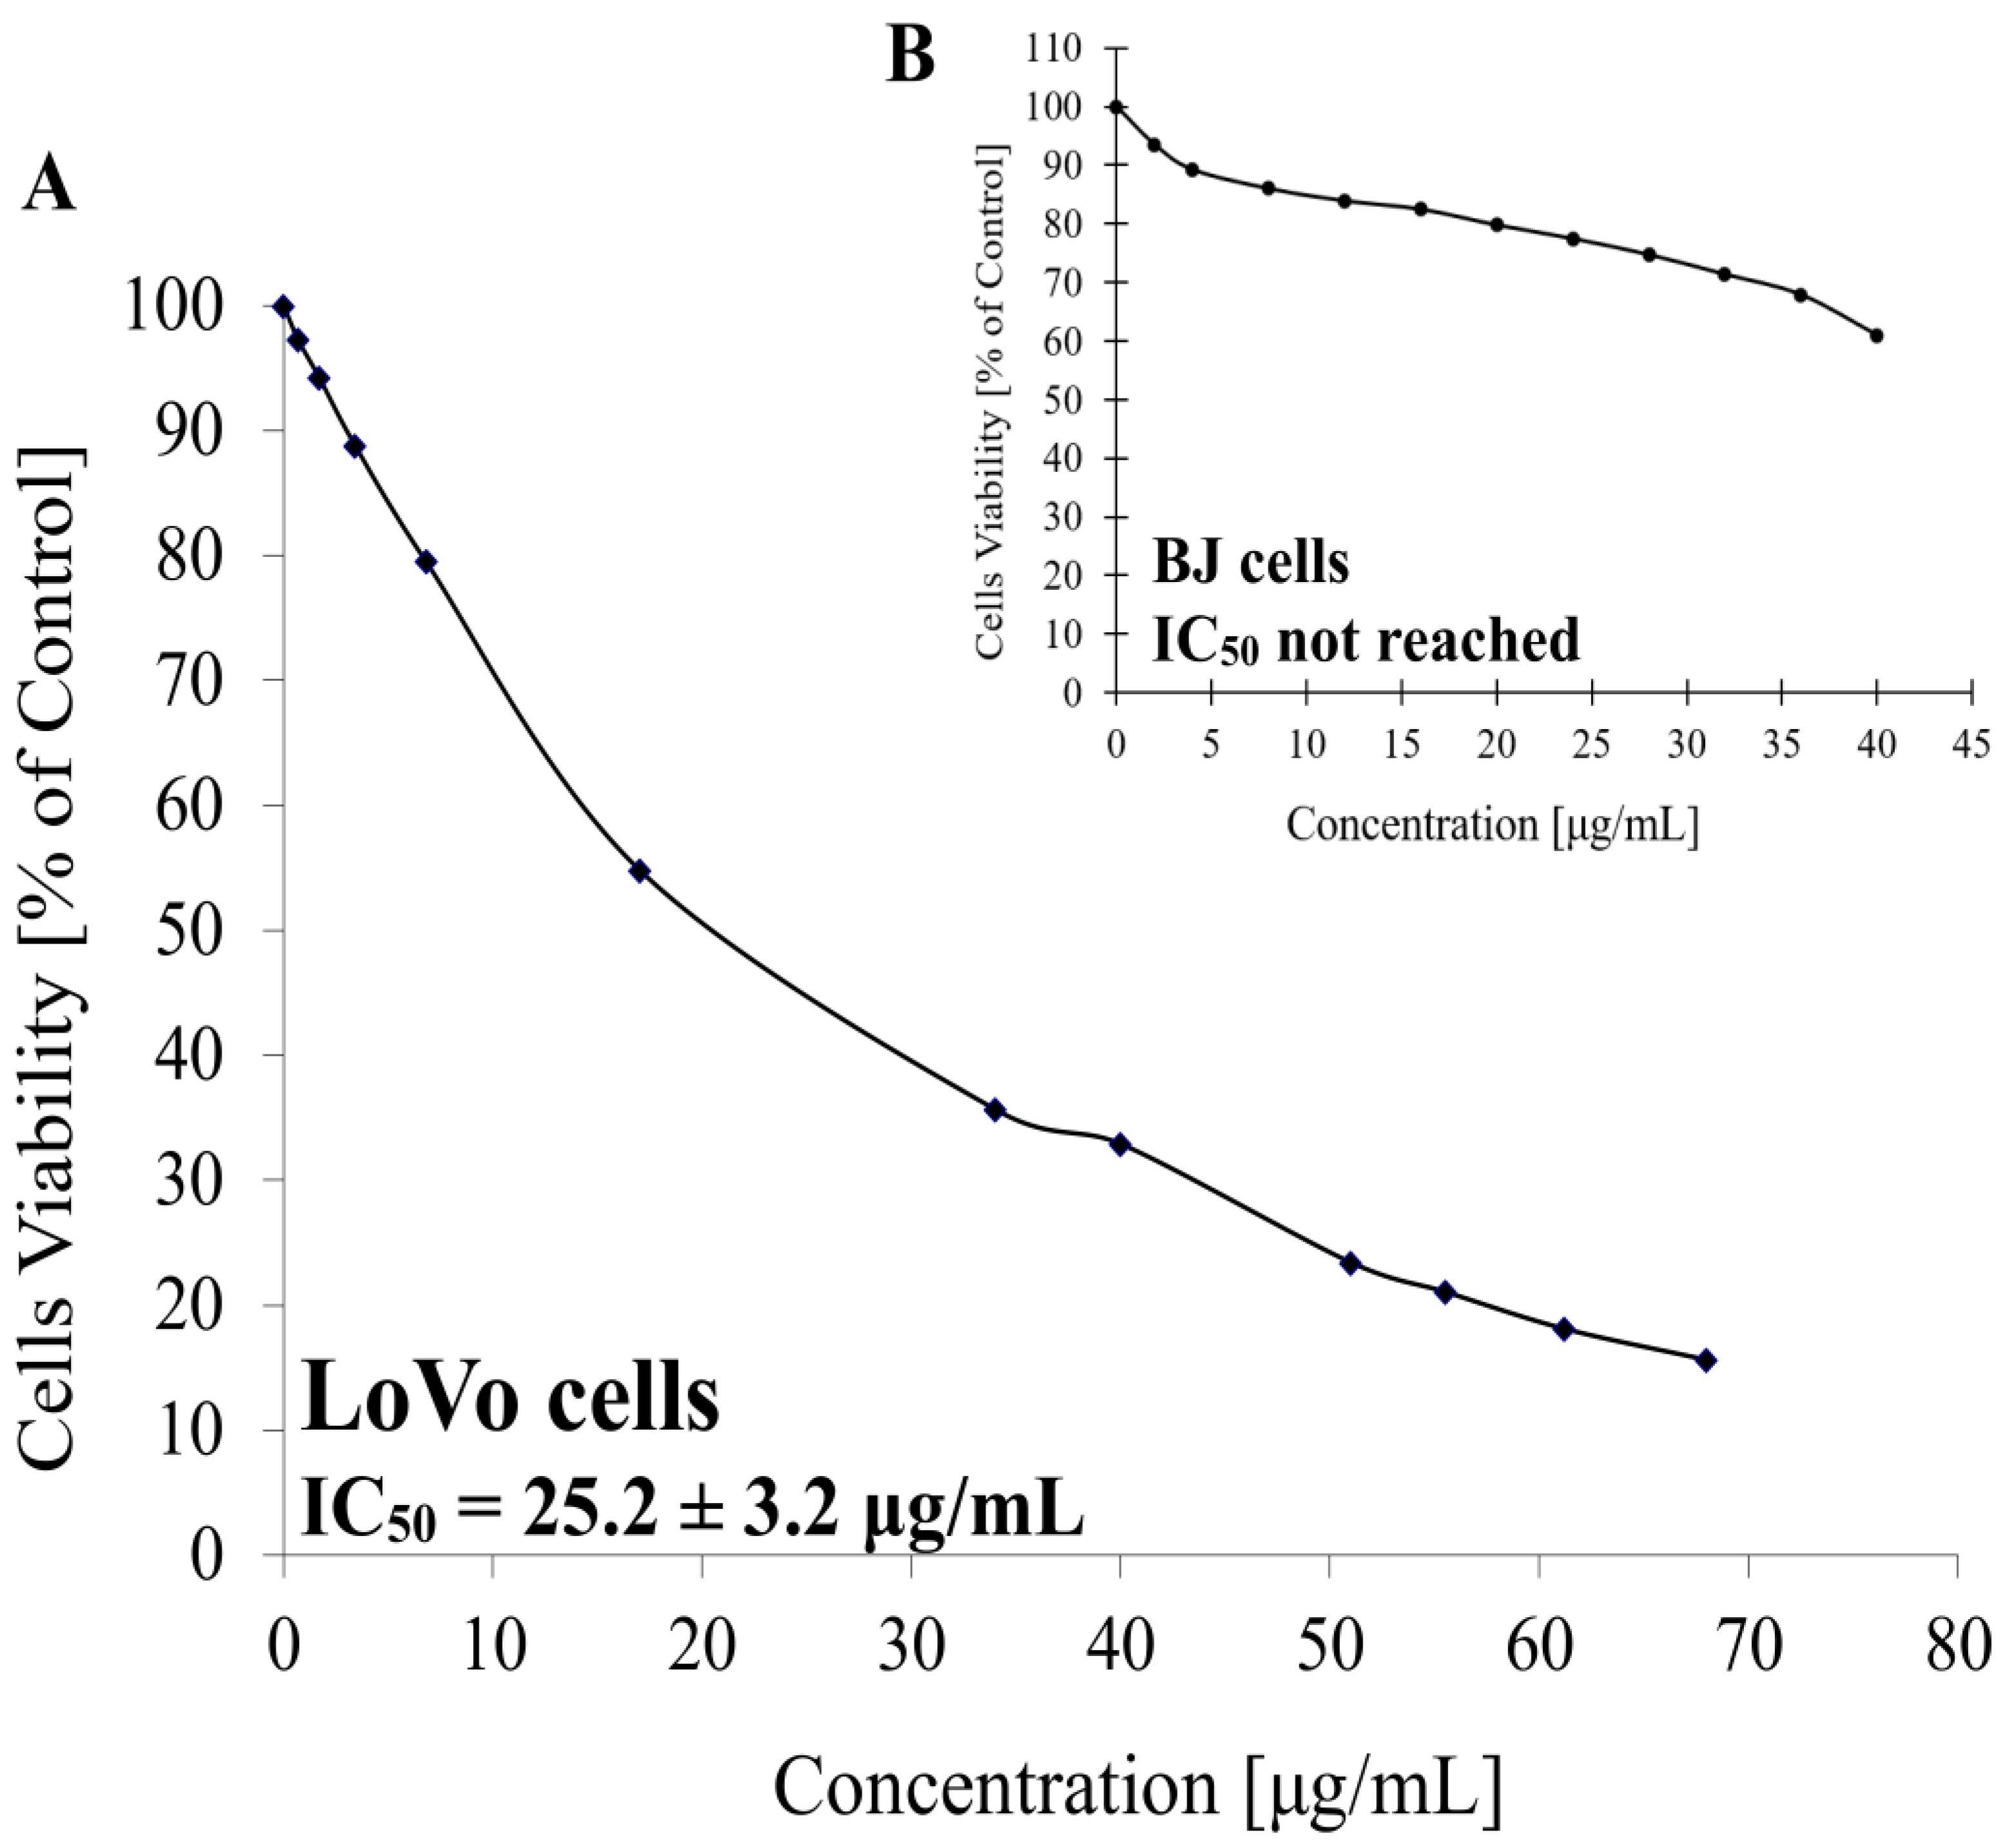
Figure 8.
Relative TP53 gene expression and p53 protein level in LoVo colorectal cancer cells treated with FIP-ach. (A) Gene expression analysis using qPCR, (B) Protein p53 level was analyzed via flow cytometry (24, 48, 72h). The graph depicts median values and quartiles from at least three independent replicates. Statistical significance refers to differences between cells treated with native FIP-ach and the negative control group (denatured FIP-ach): **p ≤ 0.01, ***p ≤ 0.001.
Figure 8.
Relative TP53 gene expression and p53 protein level in LoVo colorectal cancer cells treated with FIP-ach. (A) Gene expression analysis using qPCR, (B) Protein p53 level was analyzed via flow cytometry (24, 48, 72h). The graph depicts median values and quartiles from at least three independent replicates. Statistical significance refers to differences between cells treated with native FIP-ach and the negative control group (denatured FIP-ach): **p ≤ 0.01, ***p ≤ 0.001.
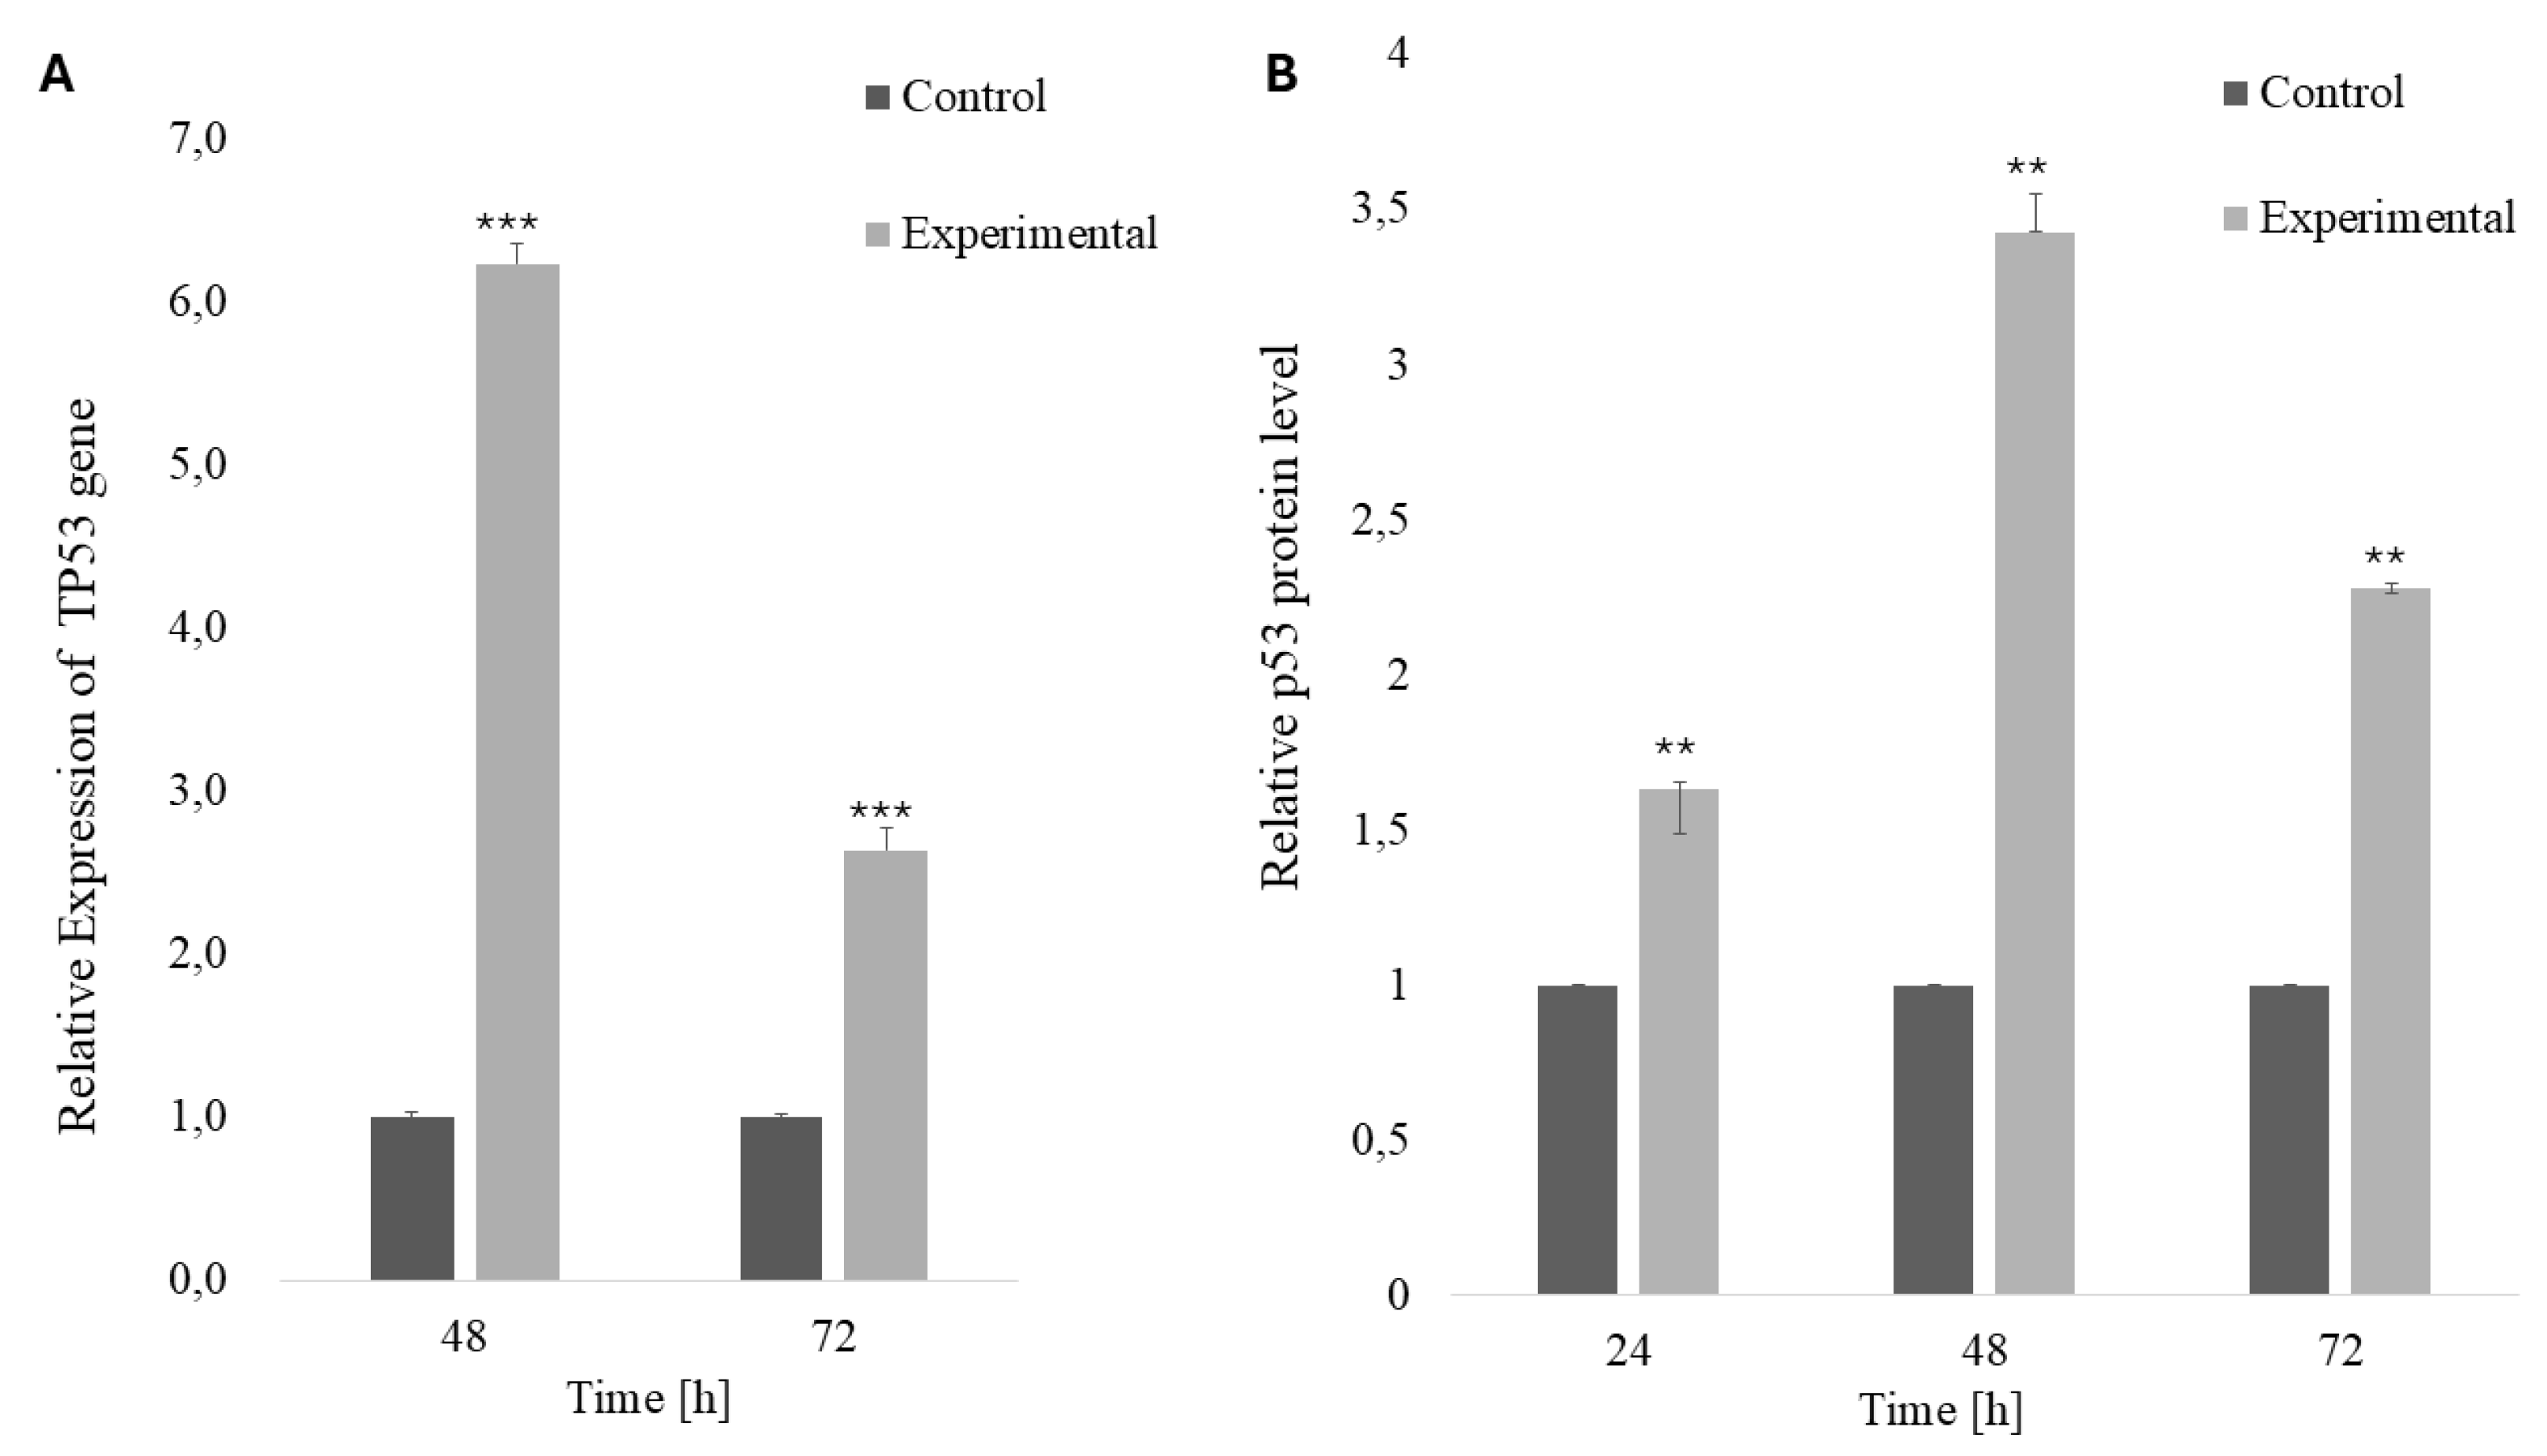
Figure 9.
Effect of FIP-ach on cell-cycle distribution in LoVo cells. Cells were treated with FIP-ach and analyzed after 24, 48, and 72 h using propidium iodide (PI) staining and flow cytometry. The graph depicts median values and quartiles from at least three independent biological replicates. Statistical significance refers to differences between cells treated with native FIP-ach and the negative control group (denatured FIP-ach): ***p ≤ 0.001.
Figure 9.
Effect of FIP-ach on cell-cycle distribution in LoVo cells. Cells were treated with FIP-ach and analyzed after 24, 48, and 72 h using propidium iodide (PI) staining and flow cytometry. The graph depicts median values and quartiles from at least three independent biological replicates. Statistical significance refers to differences between cells treated with native FIP-ach and the negative control group (denatured FIP-ach): ***p ≤ 0.001.
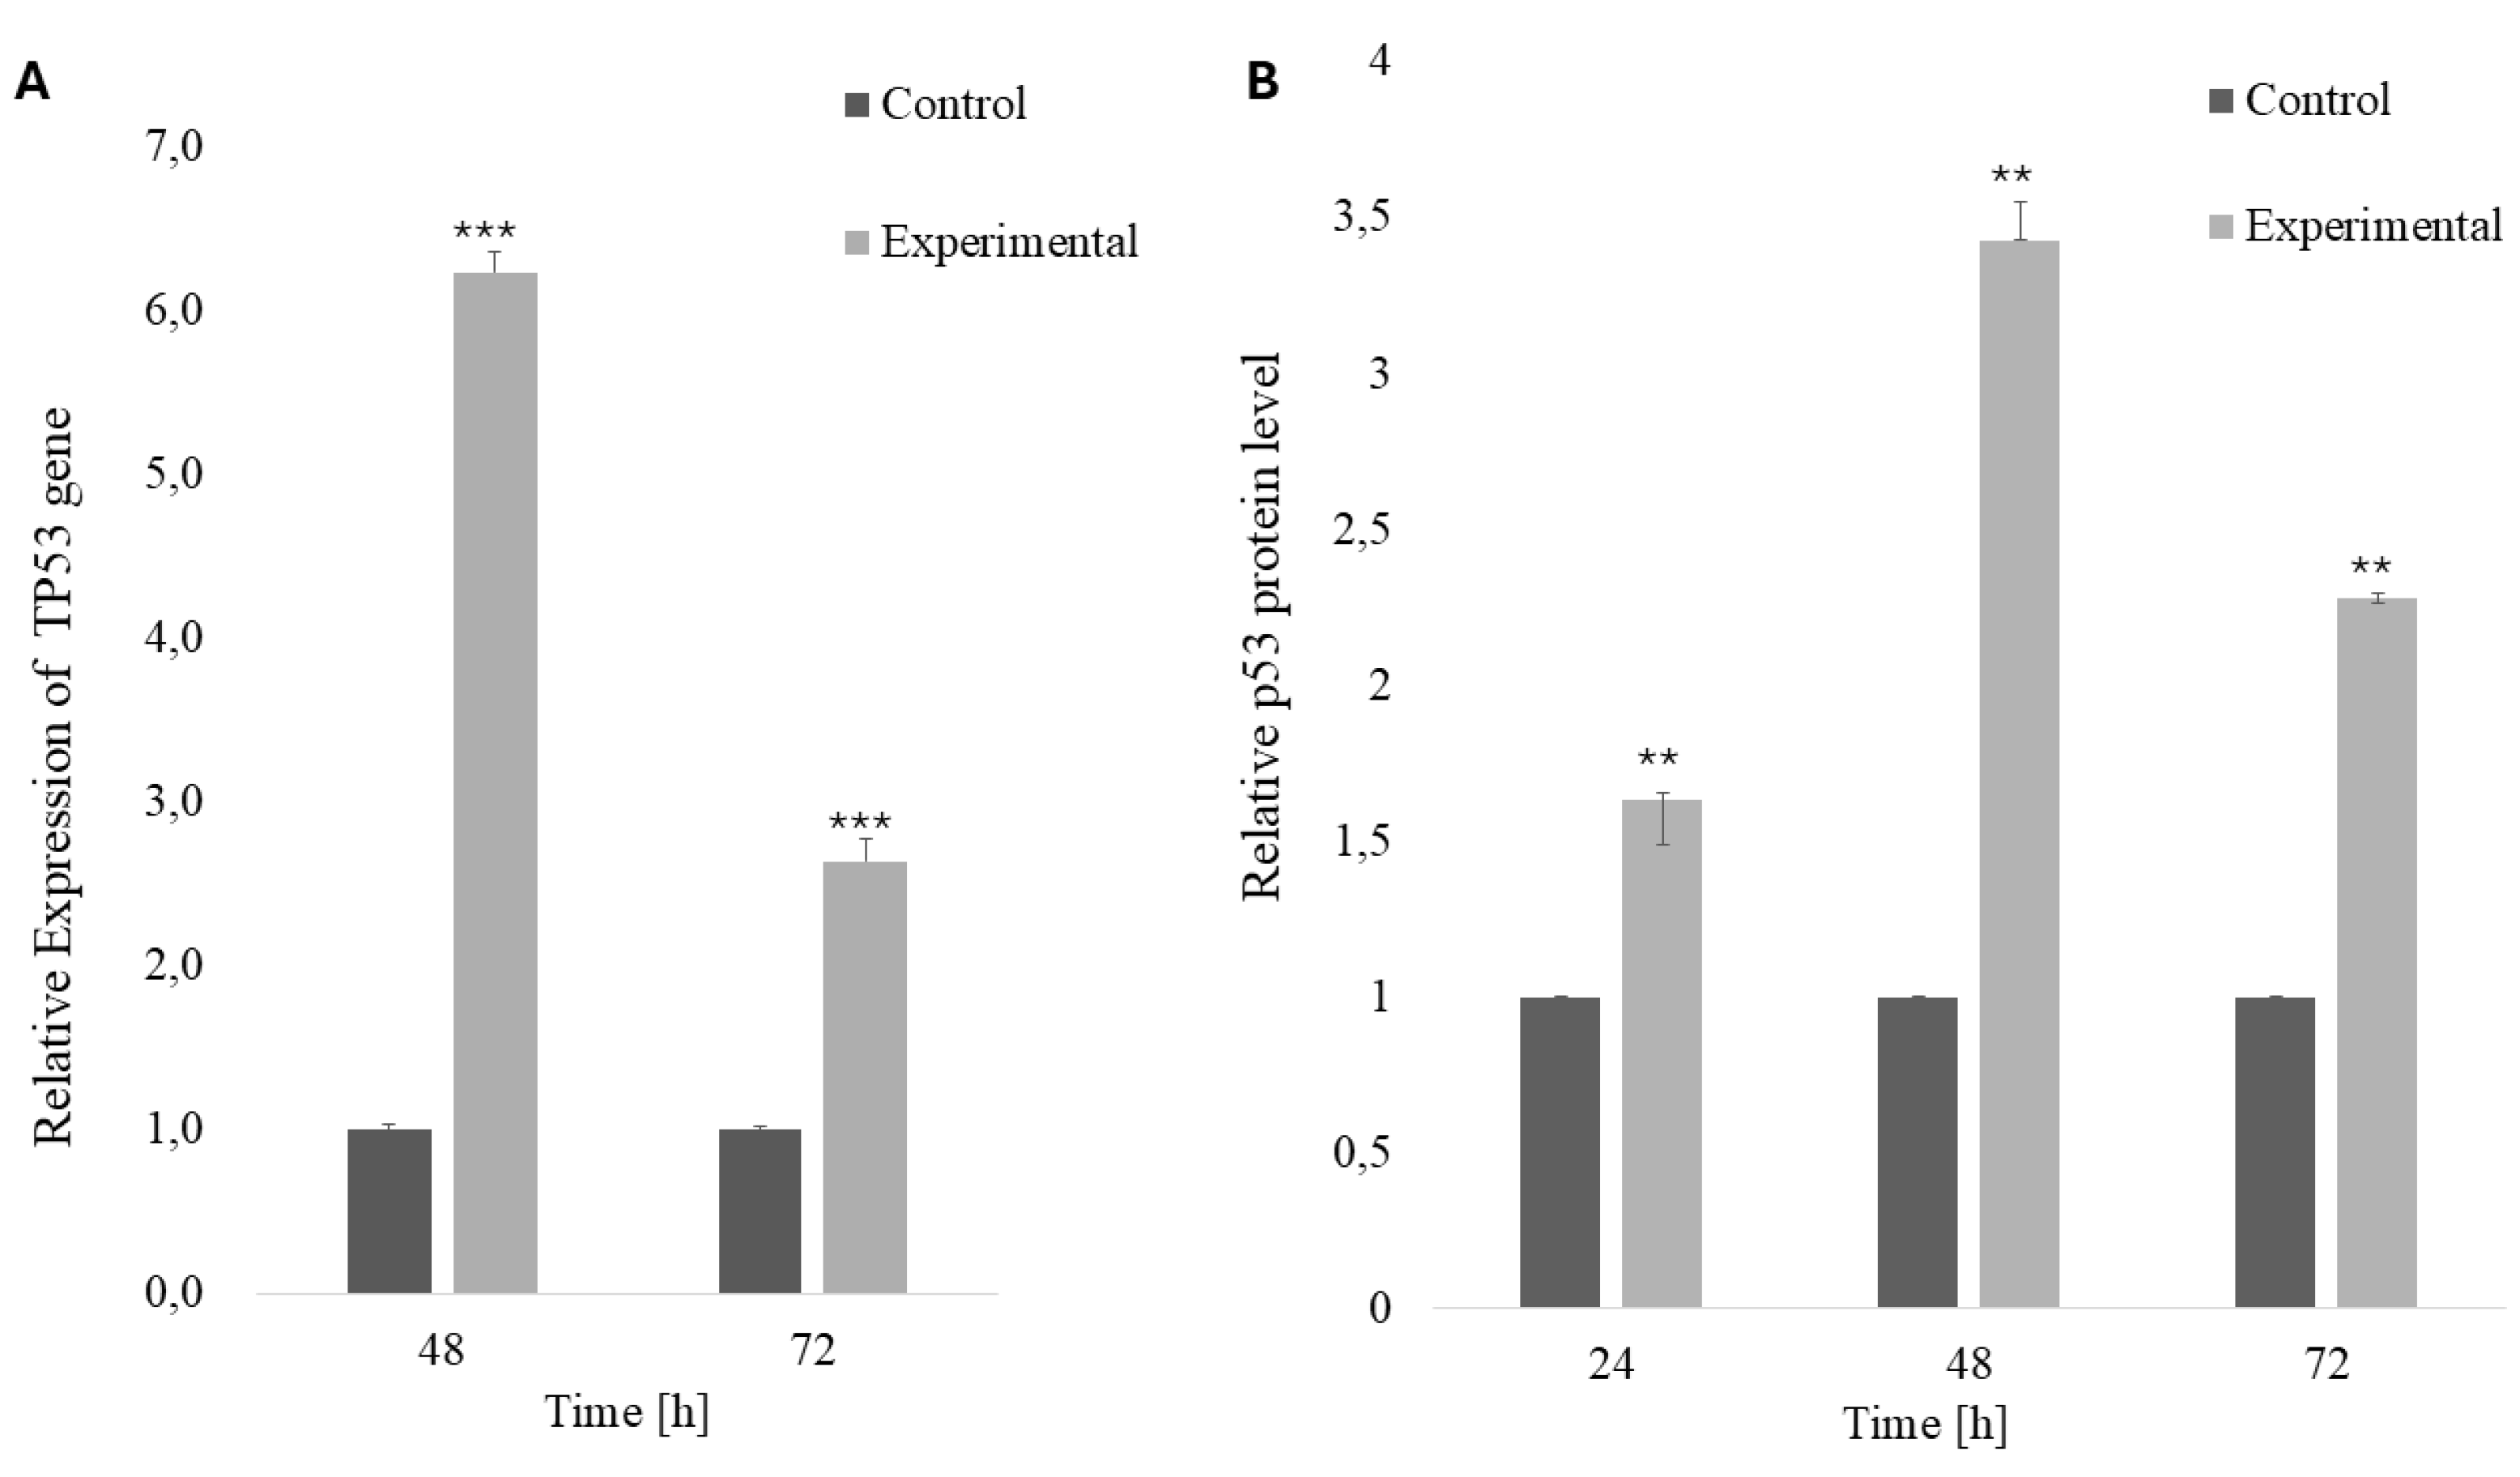
Figure 10.
Changes in the expression levels of apoptosis-related genes BAX and BCL2 in LoVo cells treated with FIP-ach. Relative mRNA expression levels of BAX and BCL2 in LoVo cells treated with native FIP-ach for 48 and 72 hours, measured by qPCR. The graph depicts median values and quartiles from at least three independent replicates. Statistical significance refers to differences between cells treated with native FIP-ach and the negative control group (denatured FIP-ach): ***p ≤ 0.001.
Figure 10.
Changes in the expression levels of apoptosis-related genes BAX and BCL2 in LoVo cells treated with FIP-ach. Relative mRNA expression levels of BAX and BCL2 in LoVo cells treated with native FIP-ach for 48 and 72 hours, measured by qPCR. The graph depicts median values and quartiles from at least three independent replicates. Statistical significance refers to differences between cells treated with native FIP-ach and the negative control group (denatured FIP-ach): ***p ≤ 0.001.
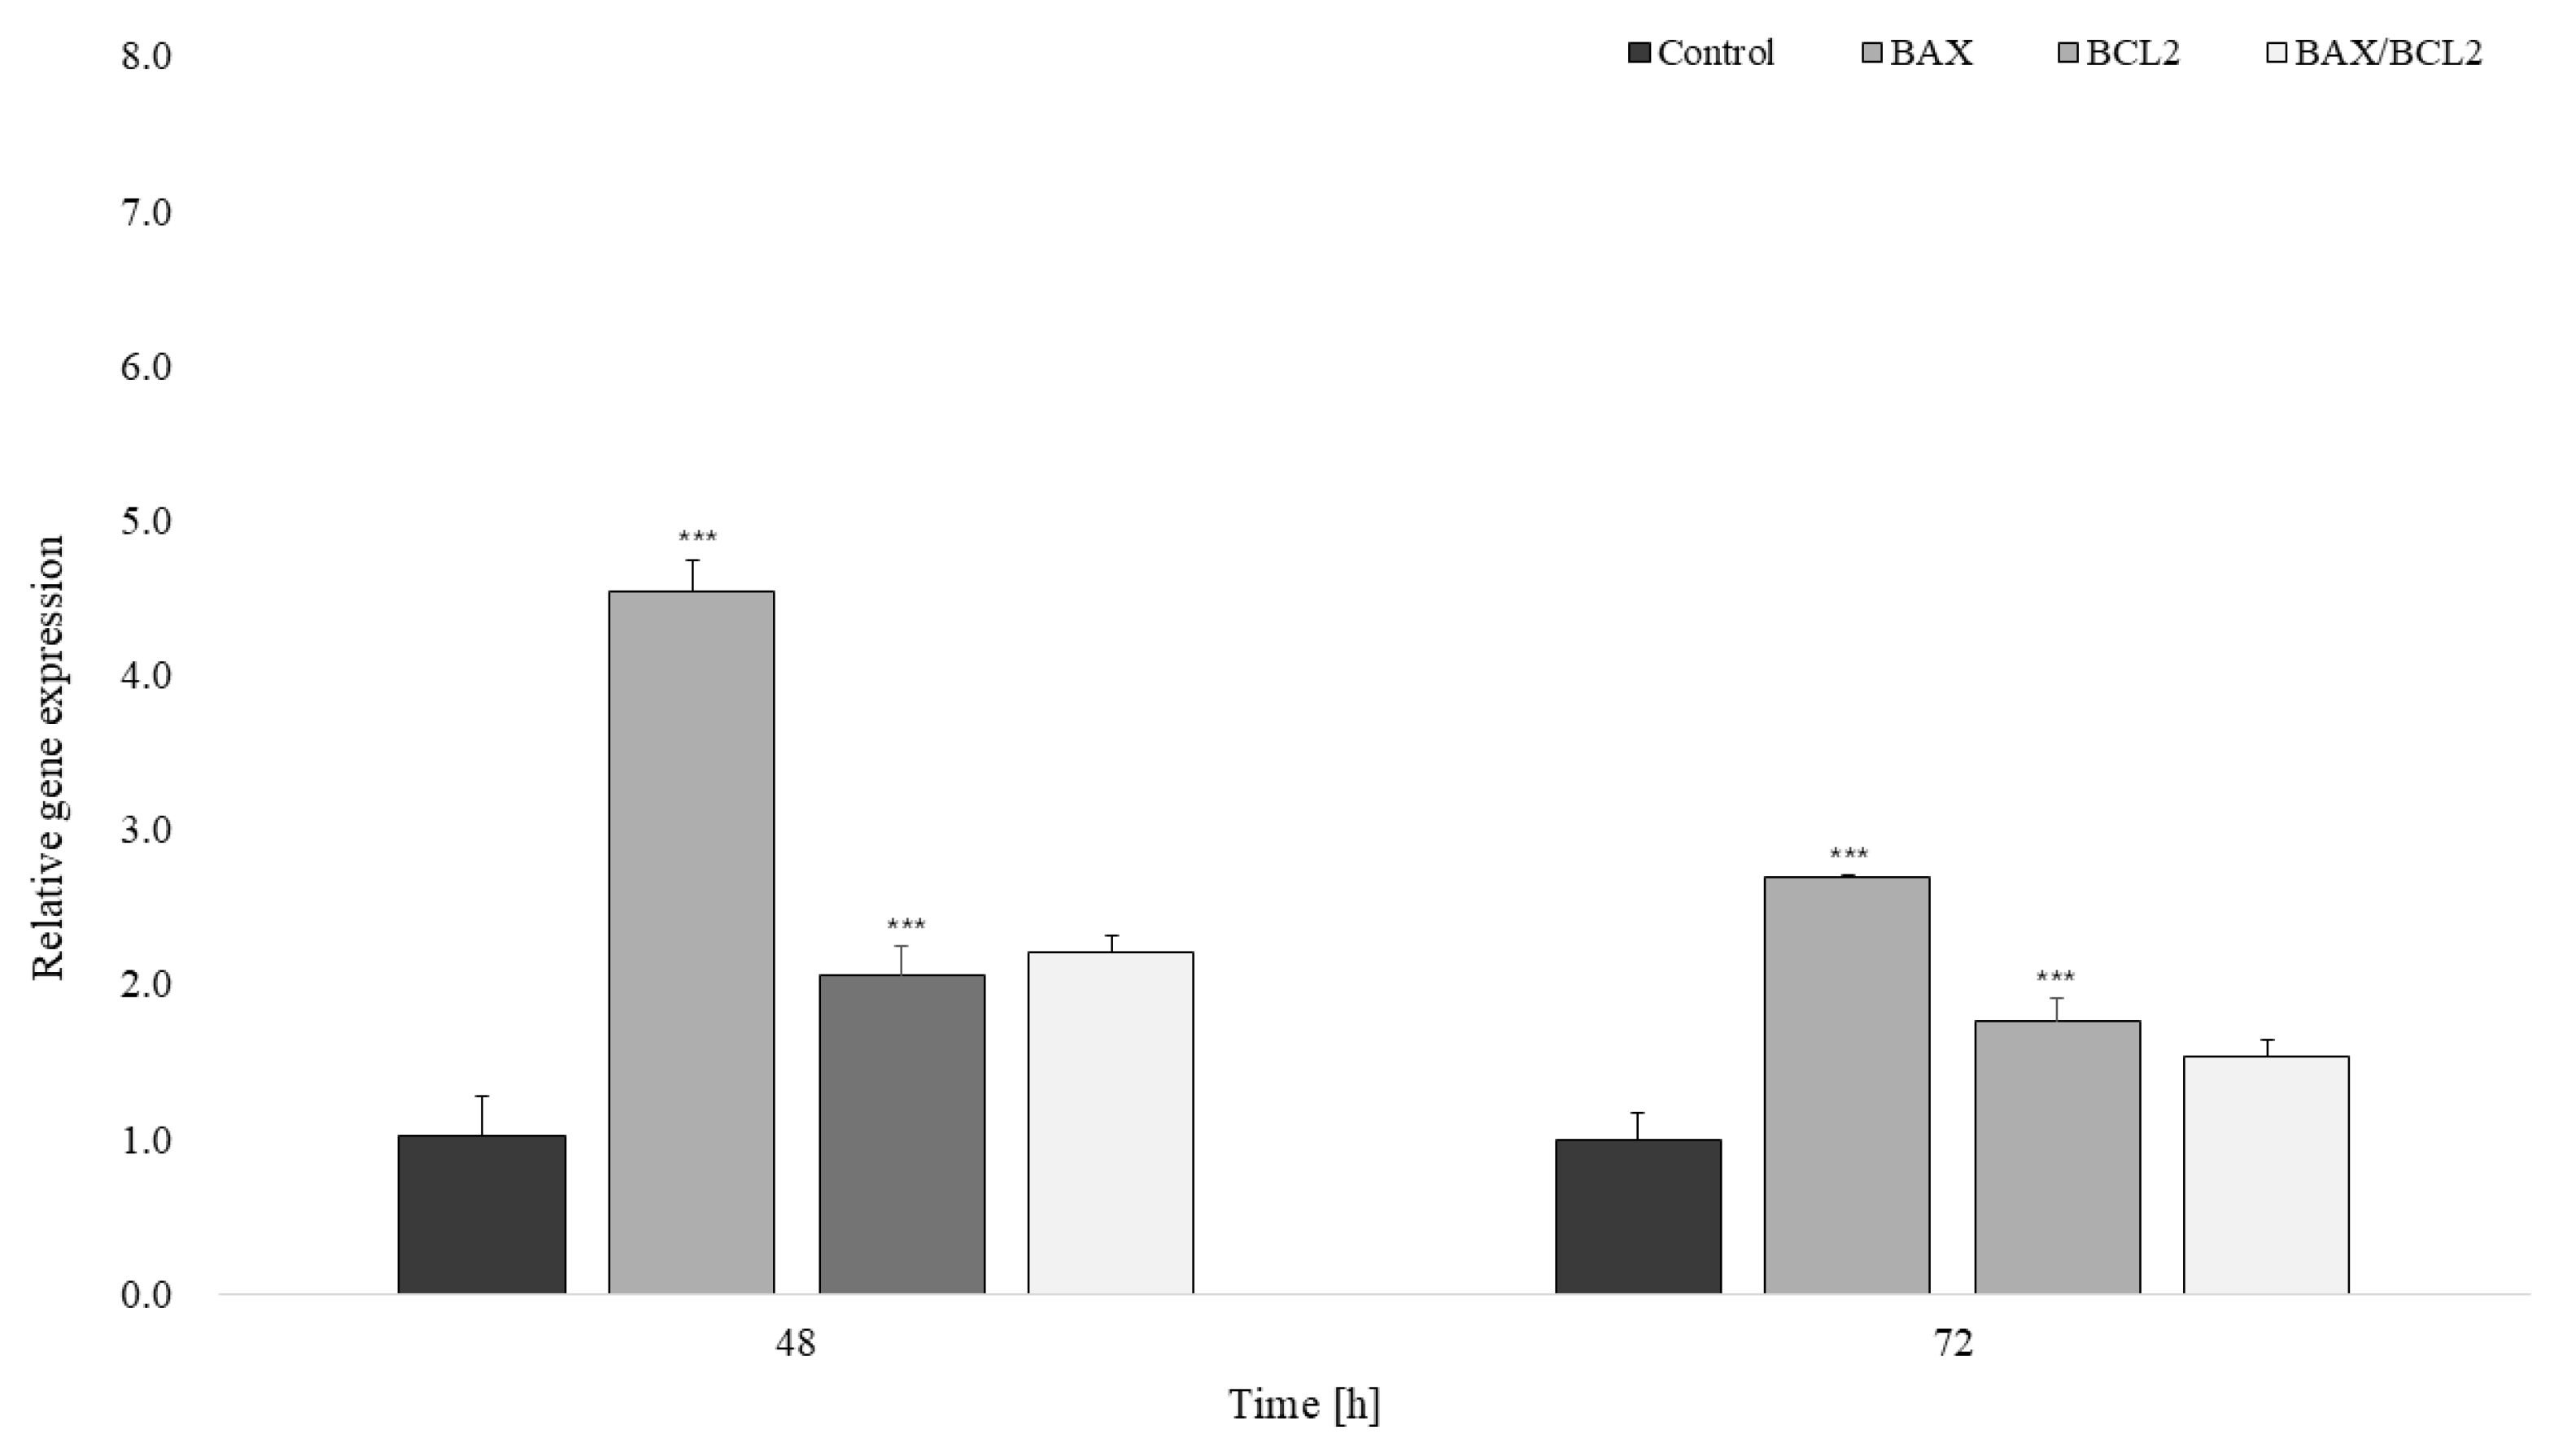
Figure 11.
Mitochondrial membrane integrity in control and FIP-ach-treated LoVo cells at 24, 48, and 72 hours. The graph depicts median values and quartiles from at least three independent replicates. Statistical significance refers to differences between cells treated with native FIP-ach and the negative control group (denatured FIP-ach): *p≤0.05.
Figure 11.
Mitochondrial membrane integrity in control and FIP-ach-treated LoVo cells at 24, 48, and 72 hours. The graph depicts median values and quartiles from at least three independent replicates. Statistical significance refers to differences between cells treated with native FIP-ach and the negative control group (denatured FIP-ach): *p≤0.05.
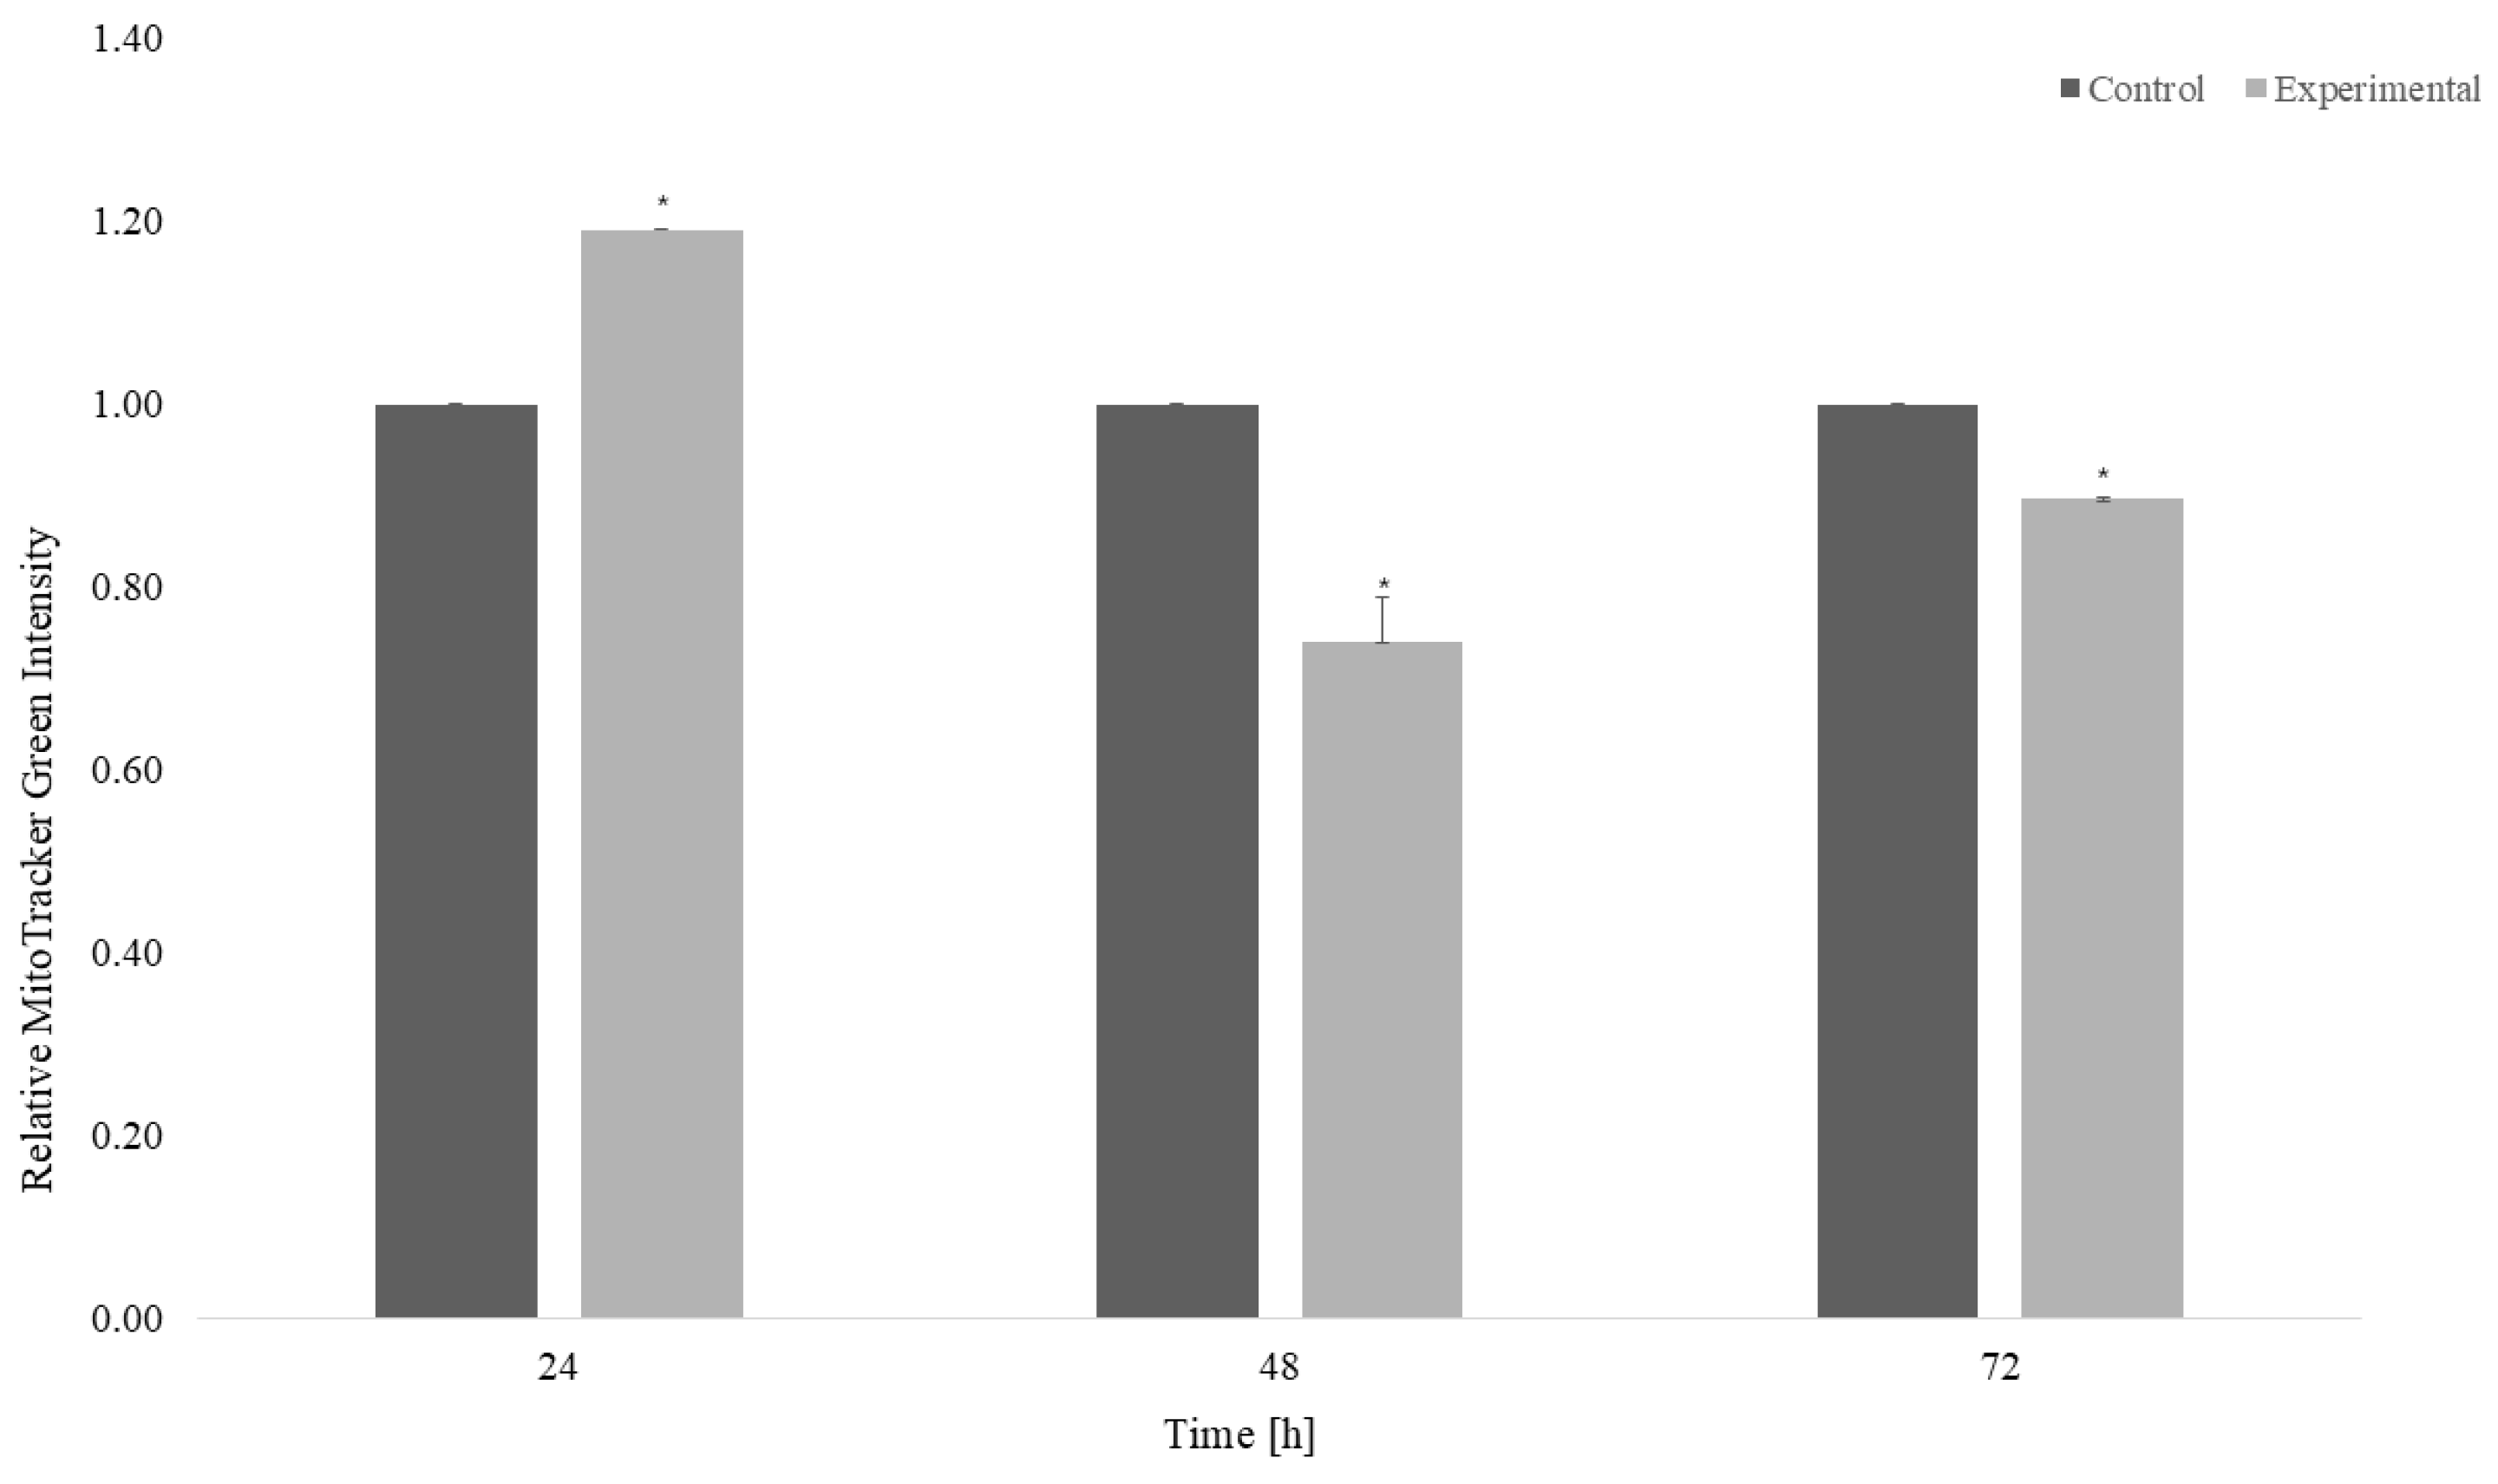
Figure 12.
FIP-ach induced expression of caspase-9. (A) Changes in the expression level of caspase-9 gene. The mRNA expression was quantified using qPCR and is presented as fold change relative to the control after 48 and 72 hours of treatment. (B) Activated caspase-9 relative levels in LoVo cells treated with FIP-ach. The protein level was measured using flow cytometry and is presented as fold change relative to the control after 24, 48 and 72 hours of treatment. The graph depicts median values and quartiles from at least three independent replicates. Statistical significance refers to differences between cells treated with native FIP-ach and the negative control group (denatured FIP-ach): **p ≤ 0.01, ***p ≤ 0.001.
Figure 12.
FIP-ach induced expression of caspase-9. (A) Changes in the expression level of caspase-9 gene. The mRNA expression was quantified using qPCR and is presented as fold change relative to the control after 48 and 72 hours of treatment. (B) Activated caspase-9 relative levels in LoVo cells treated with FIP-ach. The protein level was measured using flow cytometry and is presented as fold change relative to the control after 24, 48 and 72 hours of treatment. The graph depicts median values and quartiles from at least three independent replicates. Statistical significance refers to differences between cells treated with native FIP-ach and the negative control group (denatured FIP-ach): **p ≤ 0.01, ***p ≤ 0.001.
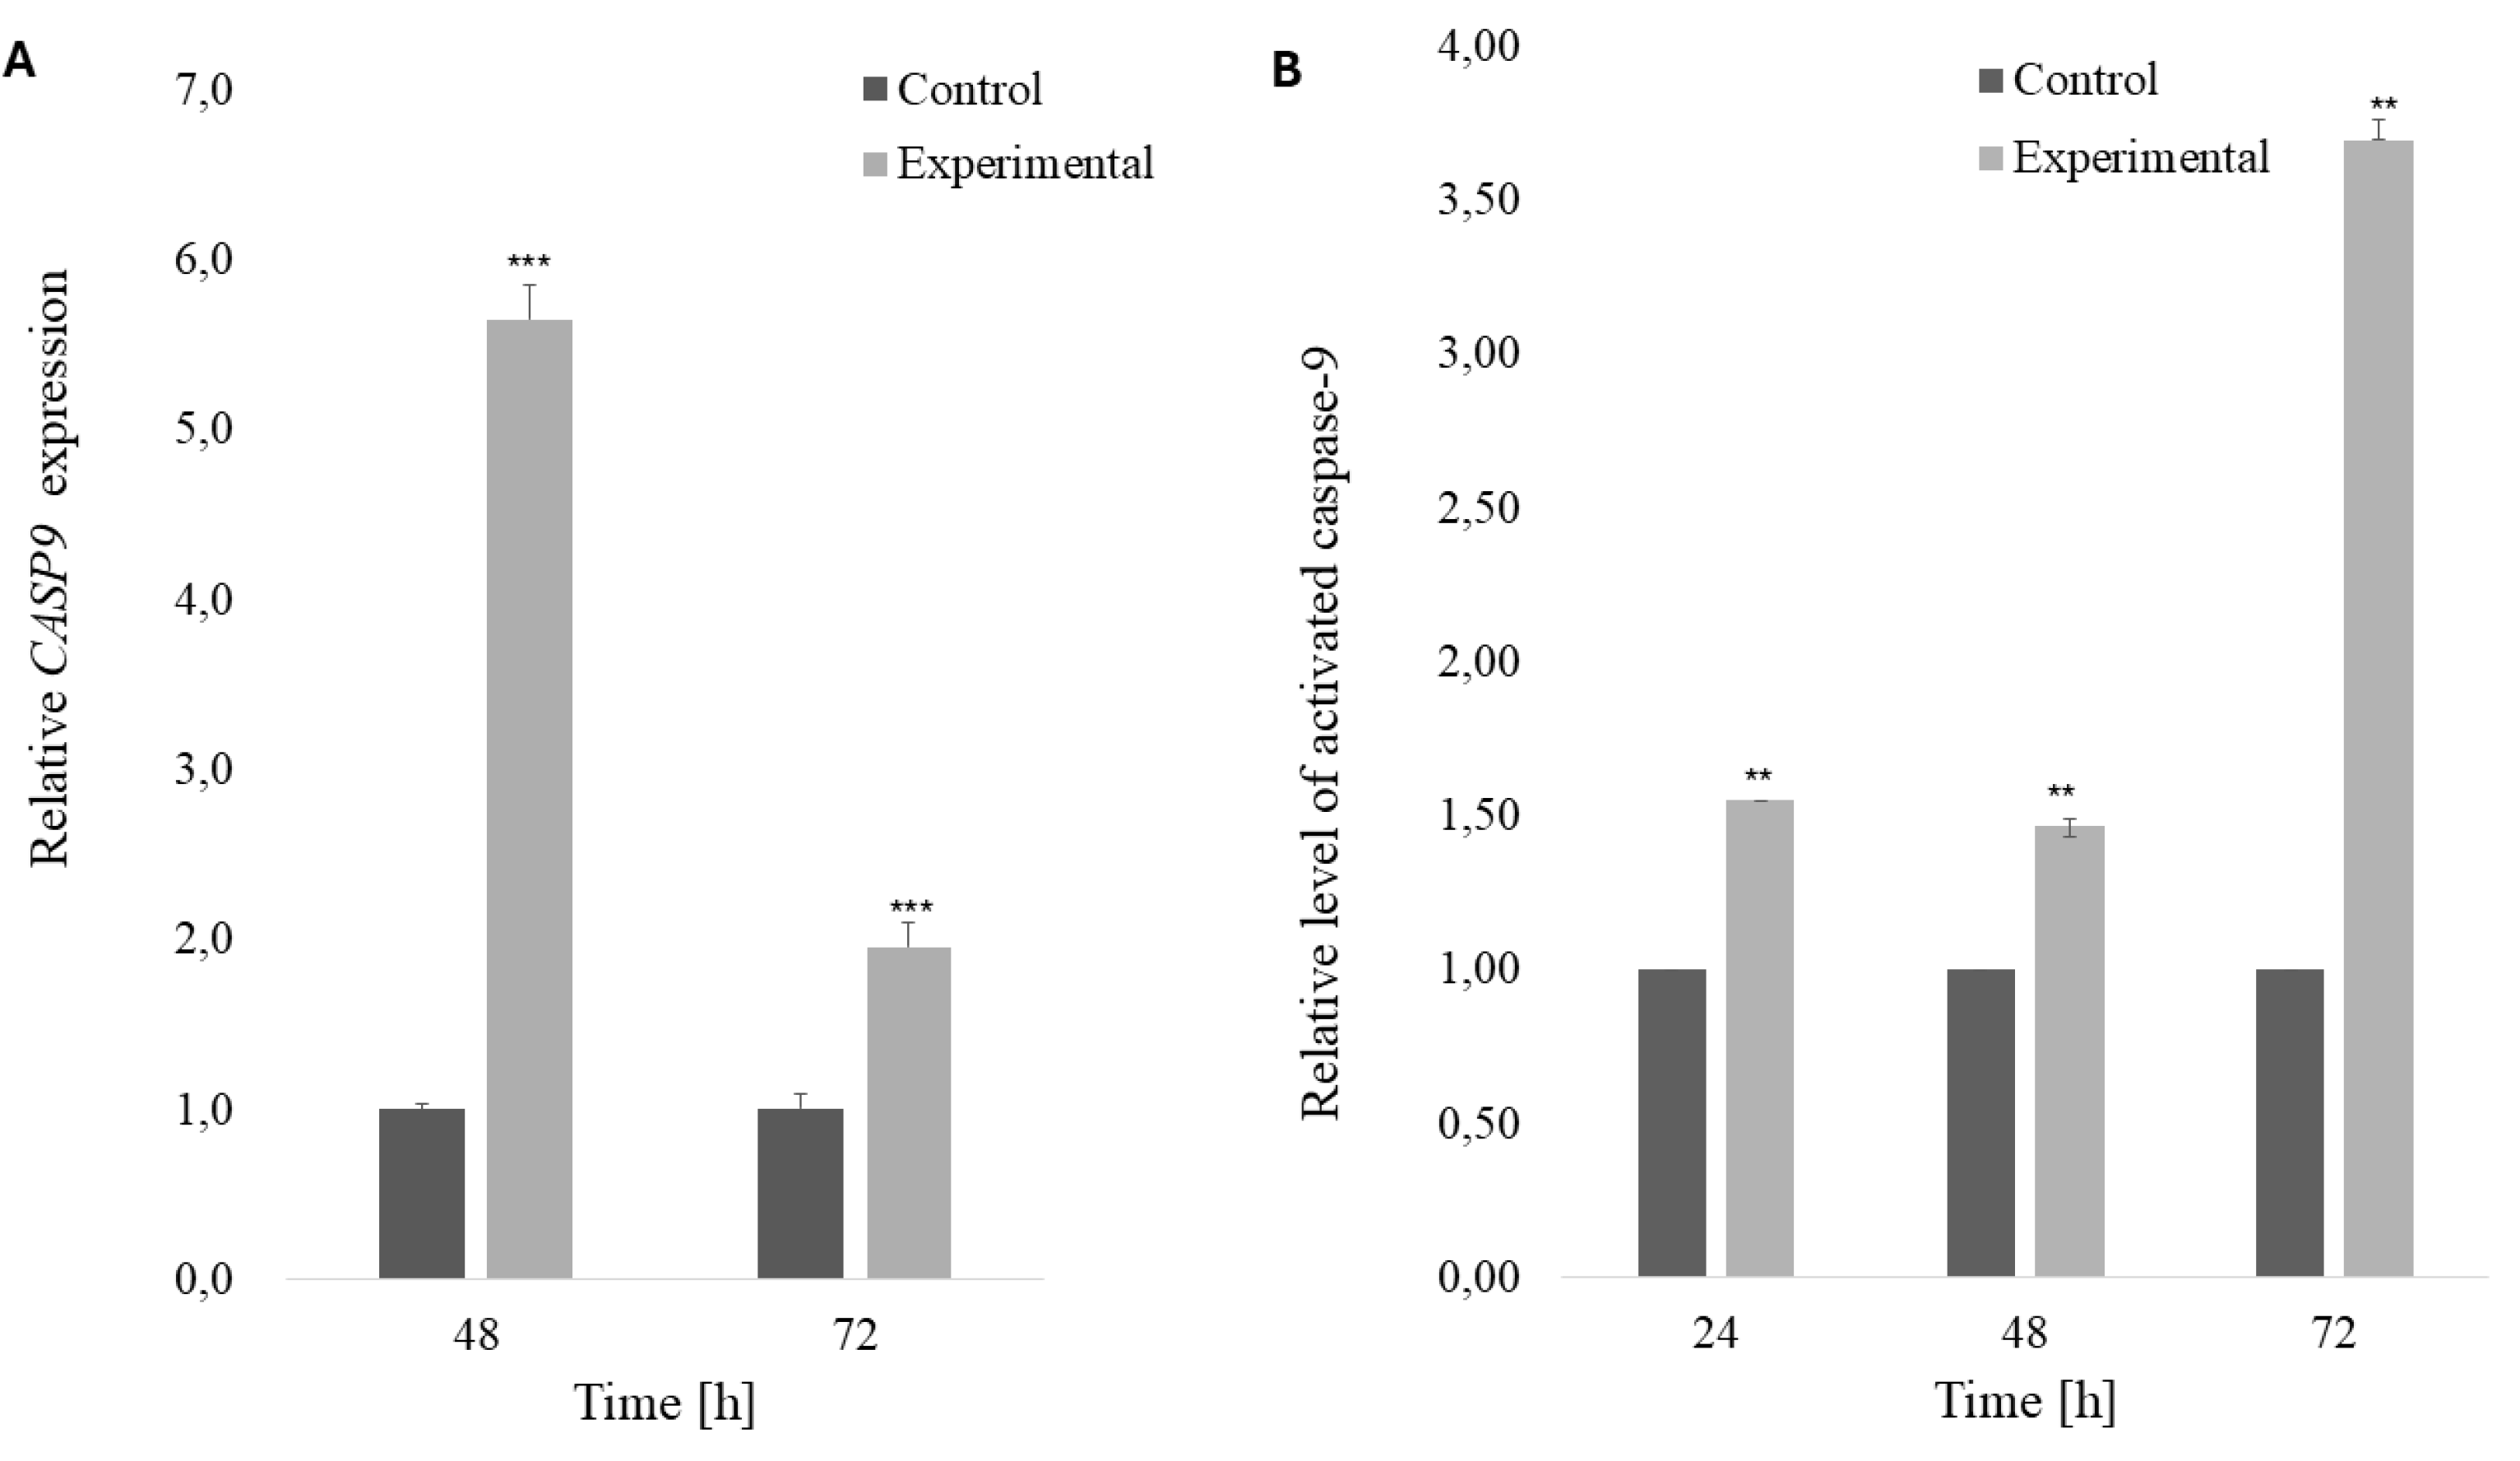
Figure 13.
FIP-ach induced expression of caspase-8. (A) Changes in the expression level of caspase-8 gene. The mRNA expression was quantified using qPCR and is presented as fold change relative to the control after 48 and 72 hours of treatment. (B) Activated caspase-8 levels in LoVo cells treated with FIP-ach. The protein expression was measured using flow cytometry and is presented as fold change relative to the control after 24, 48 and 72 hours of treatment. The graph depicts median values and quartiles from at least three independent replicates. Statistical significance refers to differences between cells treated with native FIP-ach and the negative control group (denatured FIP-ach): *p ≤ 0.05, **p ≤ 0.01, ***p ≤ 0.001.
Figure 13.
FIP-ach induced expression of caspase-8. (A) Changes in the expression level of caspase-8 gene. The mRNA expression was quantified using qPCR and is presented as fold change relative to the control after 48 and 72 hours of treatment. (B) Activated caspase-8 levels in LoVo cells treated with FIP-ach. The protein expression was measured using flow cytometry and is presented as fold change relative to the control after 24, 48 and 72 hours of treatment. The graph depicts median values and quartiles from at least three independent replicates. Statistical significance refers to differences between cells treated with native FIP-ach and the negative control group (denatured FIP-ach): *p ≤ 0.05, **p ≤ 0.01, ***p ≤ 0.001.
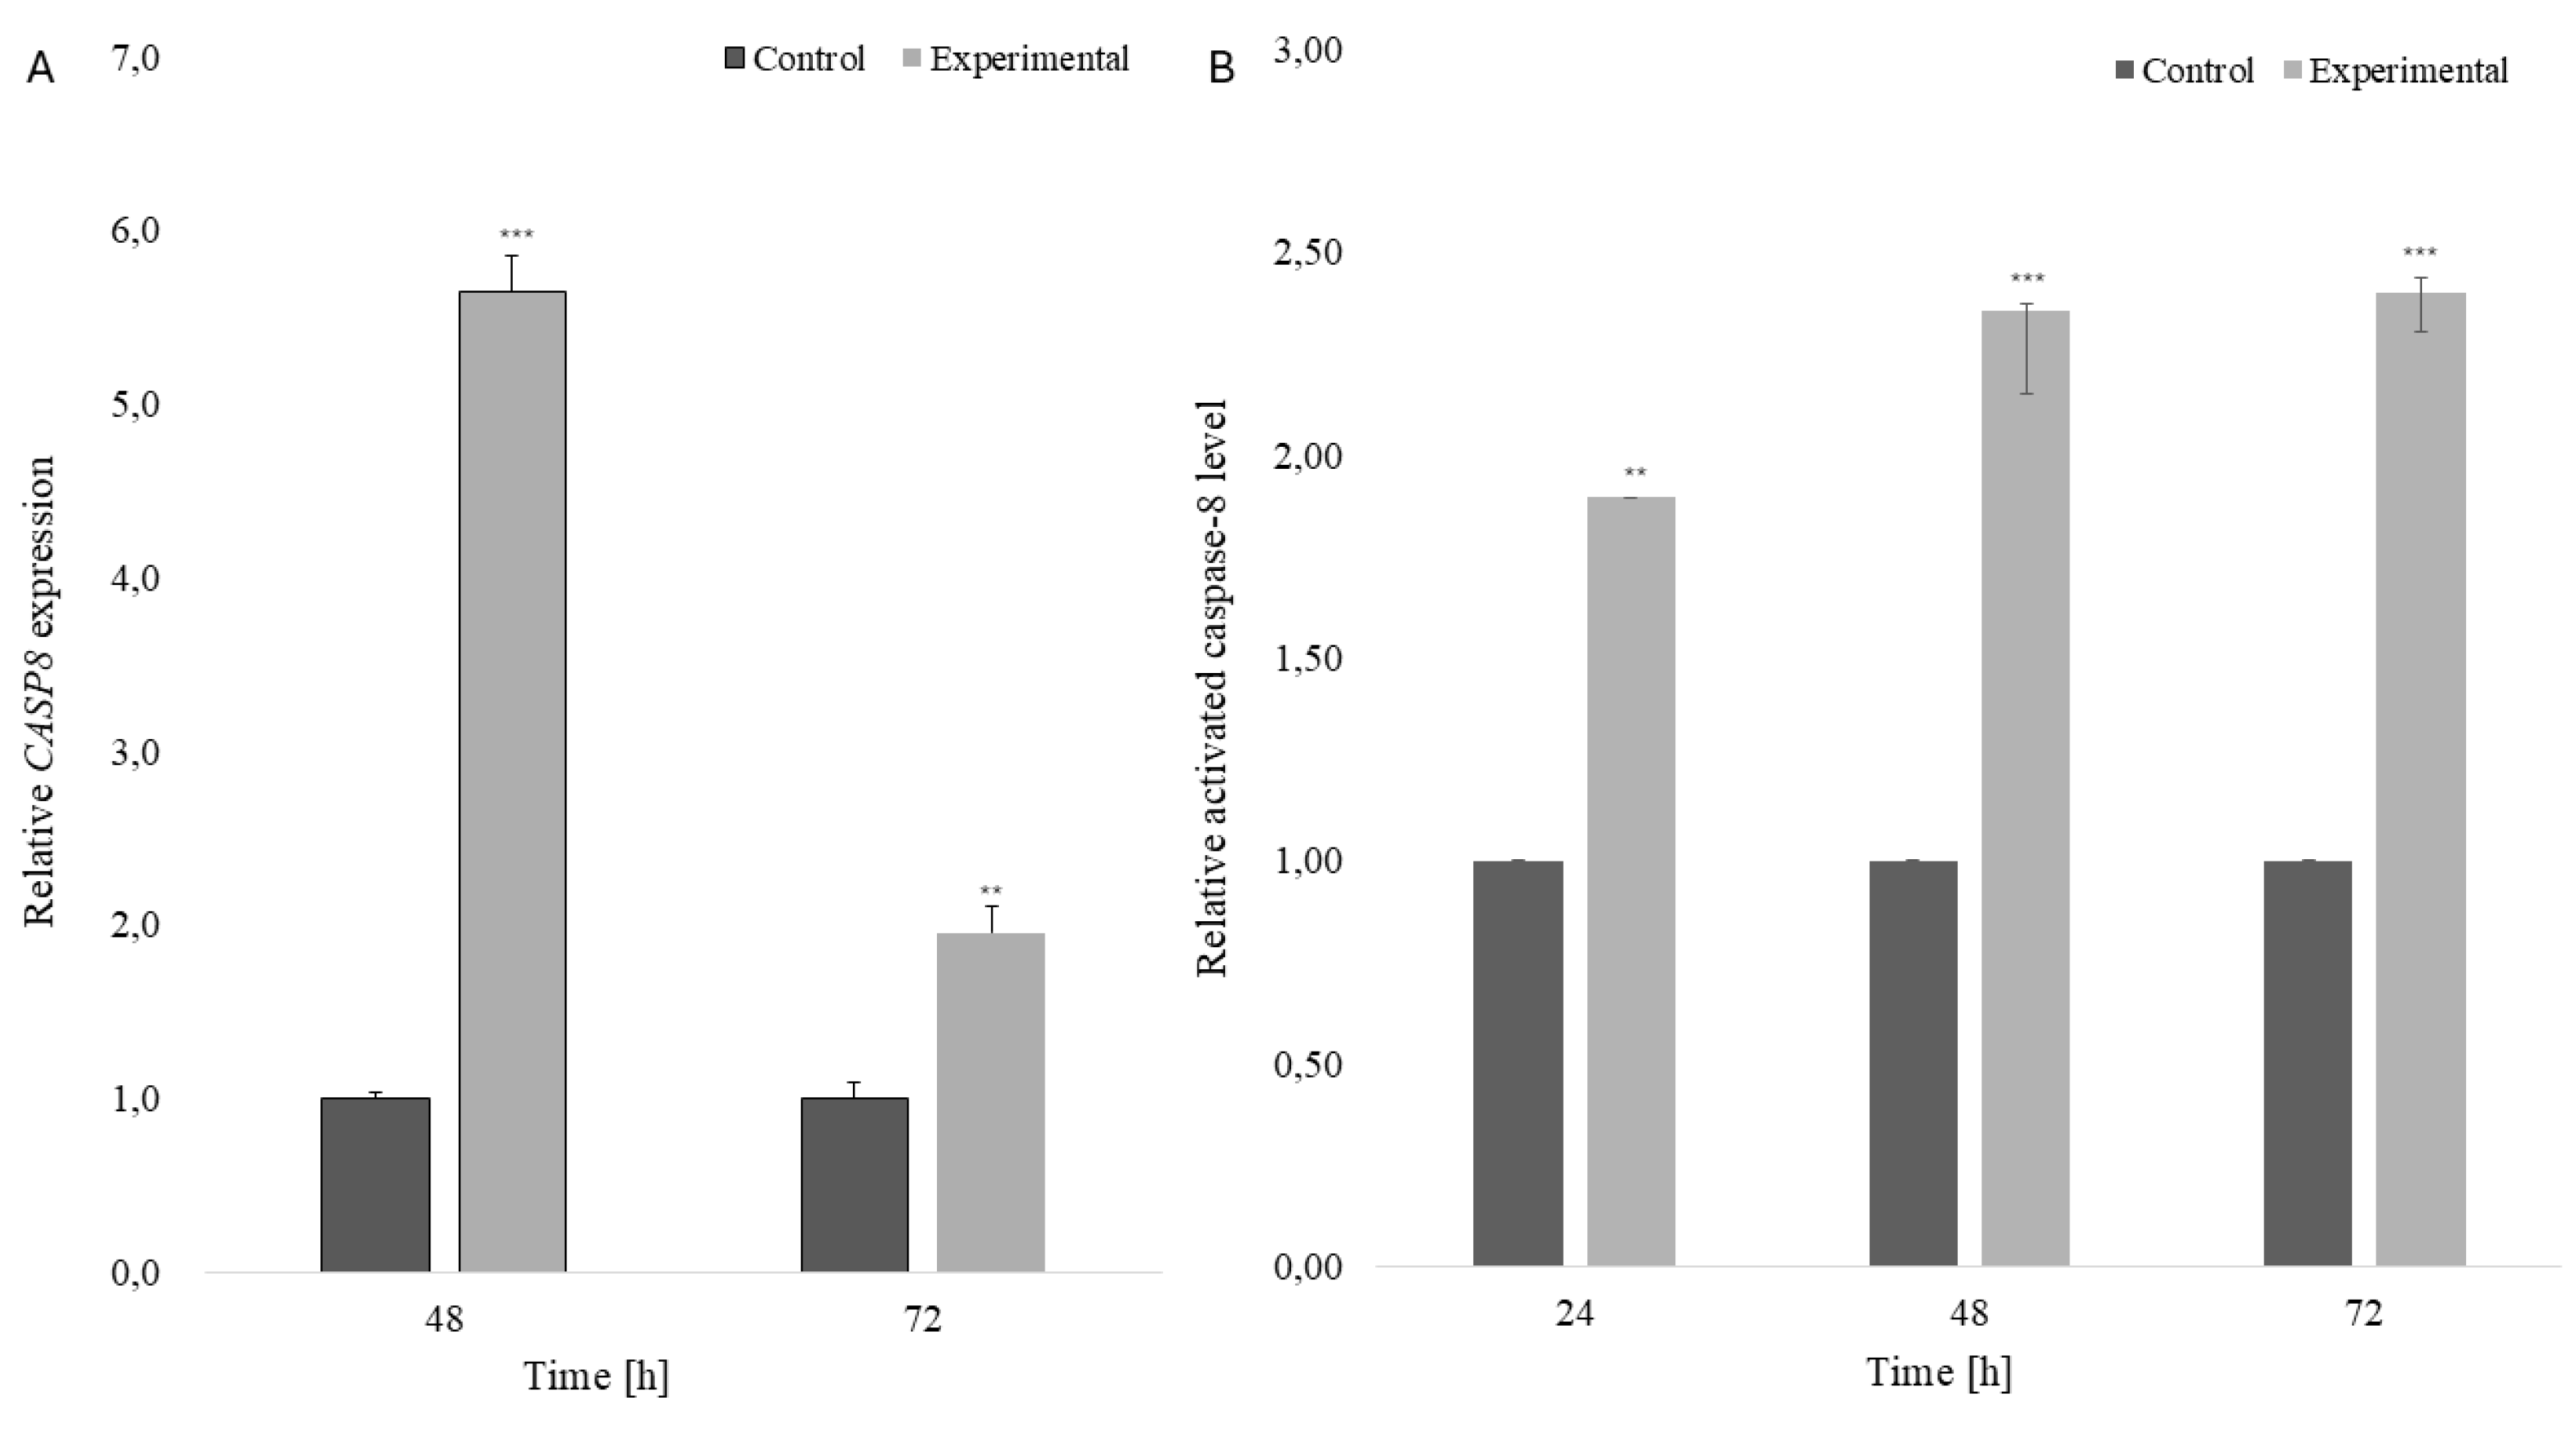
Figure 14.
FIP-ach induced expression of caspase-3. Effect of FIP-ach on CASP3 expression and caspase-3 activation in LoVo cells. (A) Relative CASP3 mRNA expression determined by RT-qPCR after 48 and 72 h of treatment. (B) Relative caspase-3 activation determined by flow cytometry after 24, 48, and 72 h of treatment. Data are presented as median values with quartiles from at least three independent biological replicates. Statistical significance refers to differences between cells treated with native FIP-ach and the negative control group (denatured FIP-ach): *p ≤ 0.05, ***p ≤ 0.001.
Figure 14.
FIP-ach induced expression of caspase-3. Effect of FIP-ach on CASP3 expression and caspase-3 activation in LoVo cells. (A) Relative CASP3 mRNA expression determined by RT-qPCR after 48 and 72 h of treatment. (B) Relative caspase-3 activation determined by flow cytometry after 24, 48, and 72 h of treatment. Data are presented as median values with quartiles from at least three independent biological replicates. Statistical significance refers to differences between cells treated with native FIP-ach and the negative control group (denatured FIP-ach): *p ≤ 0.05, ***p ≤ 0.001.
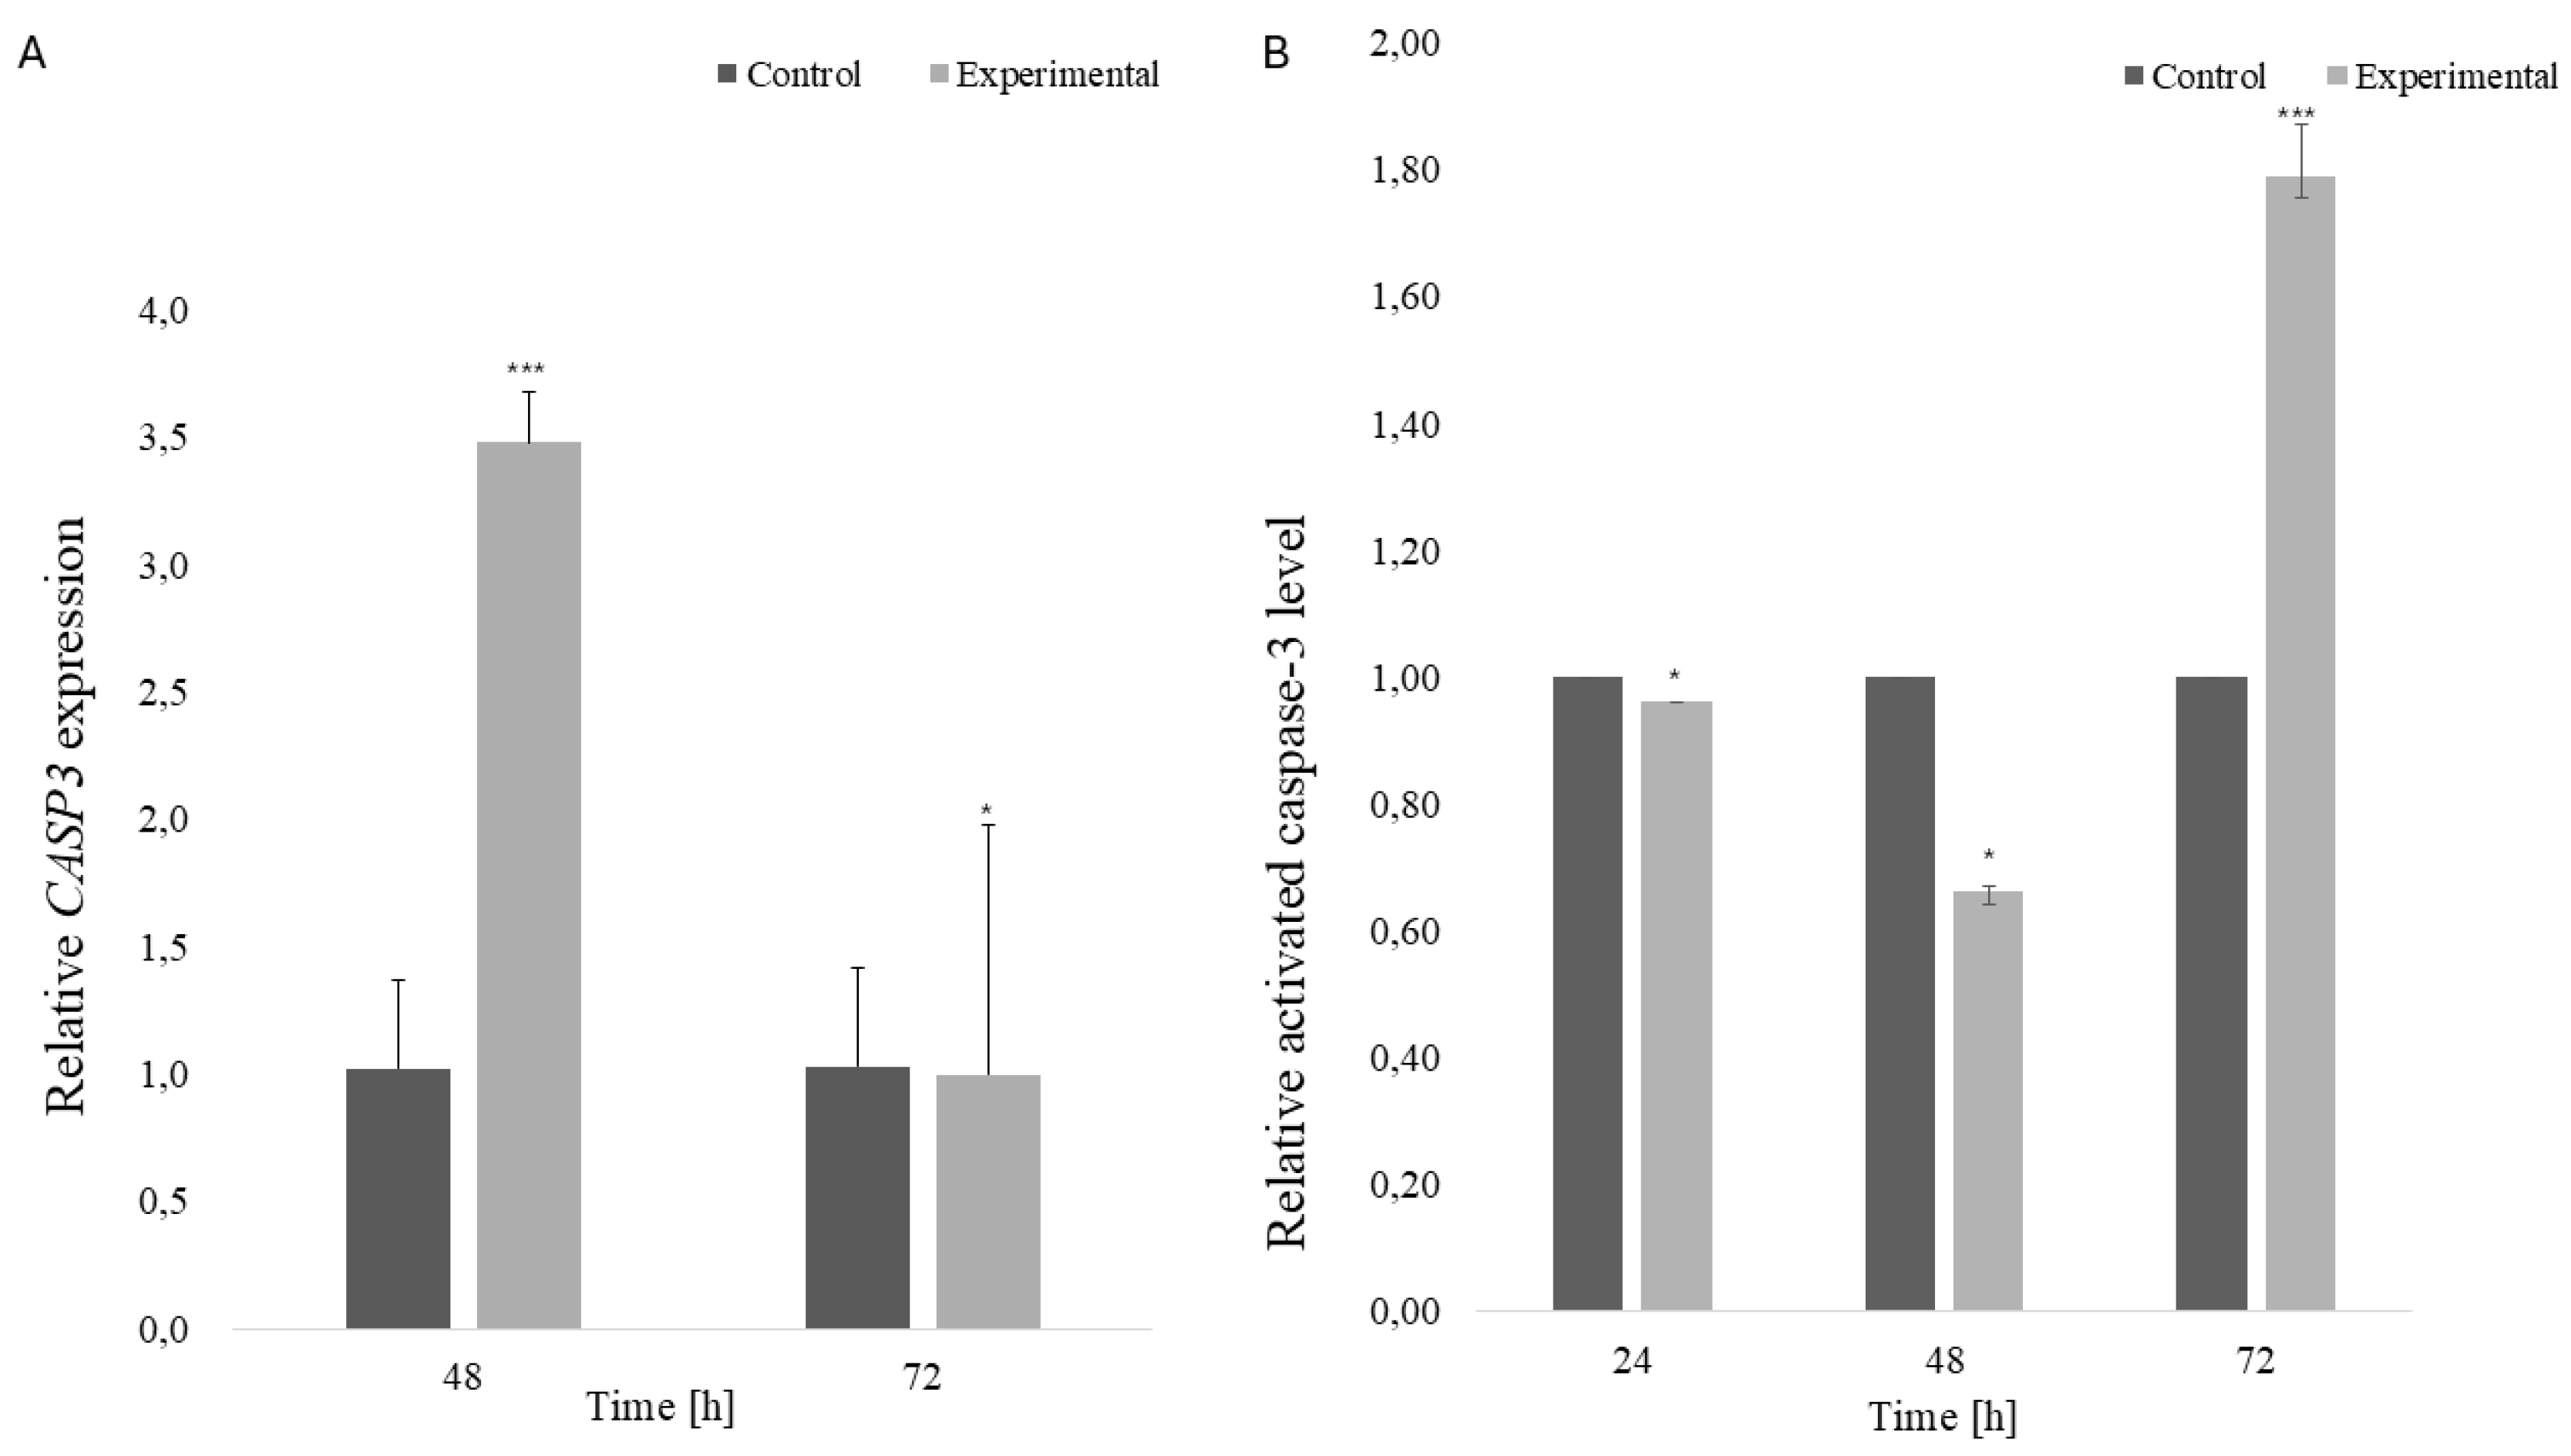
Figure 15.
Relative AIFM1 mRNA expression in LoVo cells treated with FIP-ach. Gene expression was determined by RT-qPCR after 48 and 72 h of treatment and is presented as fold change relative to the control group. Data are presented as median values with quartiles from at least three independent biological replicates. Statistical significance refers to differences between cells treated with native FIP-ach and the negative control group (denatured FIP-ach): ***p ≤ 0.001.
Figure 15.
Relative AIFM1 mRNA expression in LoVo cells treated with FIP-ach. Gene expression was determined by RT-qPCR after 48 and 72 h of treatment and is presented as fold change relative to the control group. Data are presented as median values with quartiles from at least three independent biological replicates. Statistical significance refers to differences between cells treated with native FIP-ach and the negative control group (denatured FIP-ach): ***p ≤ 0.001.
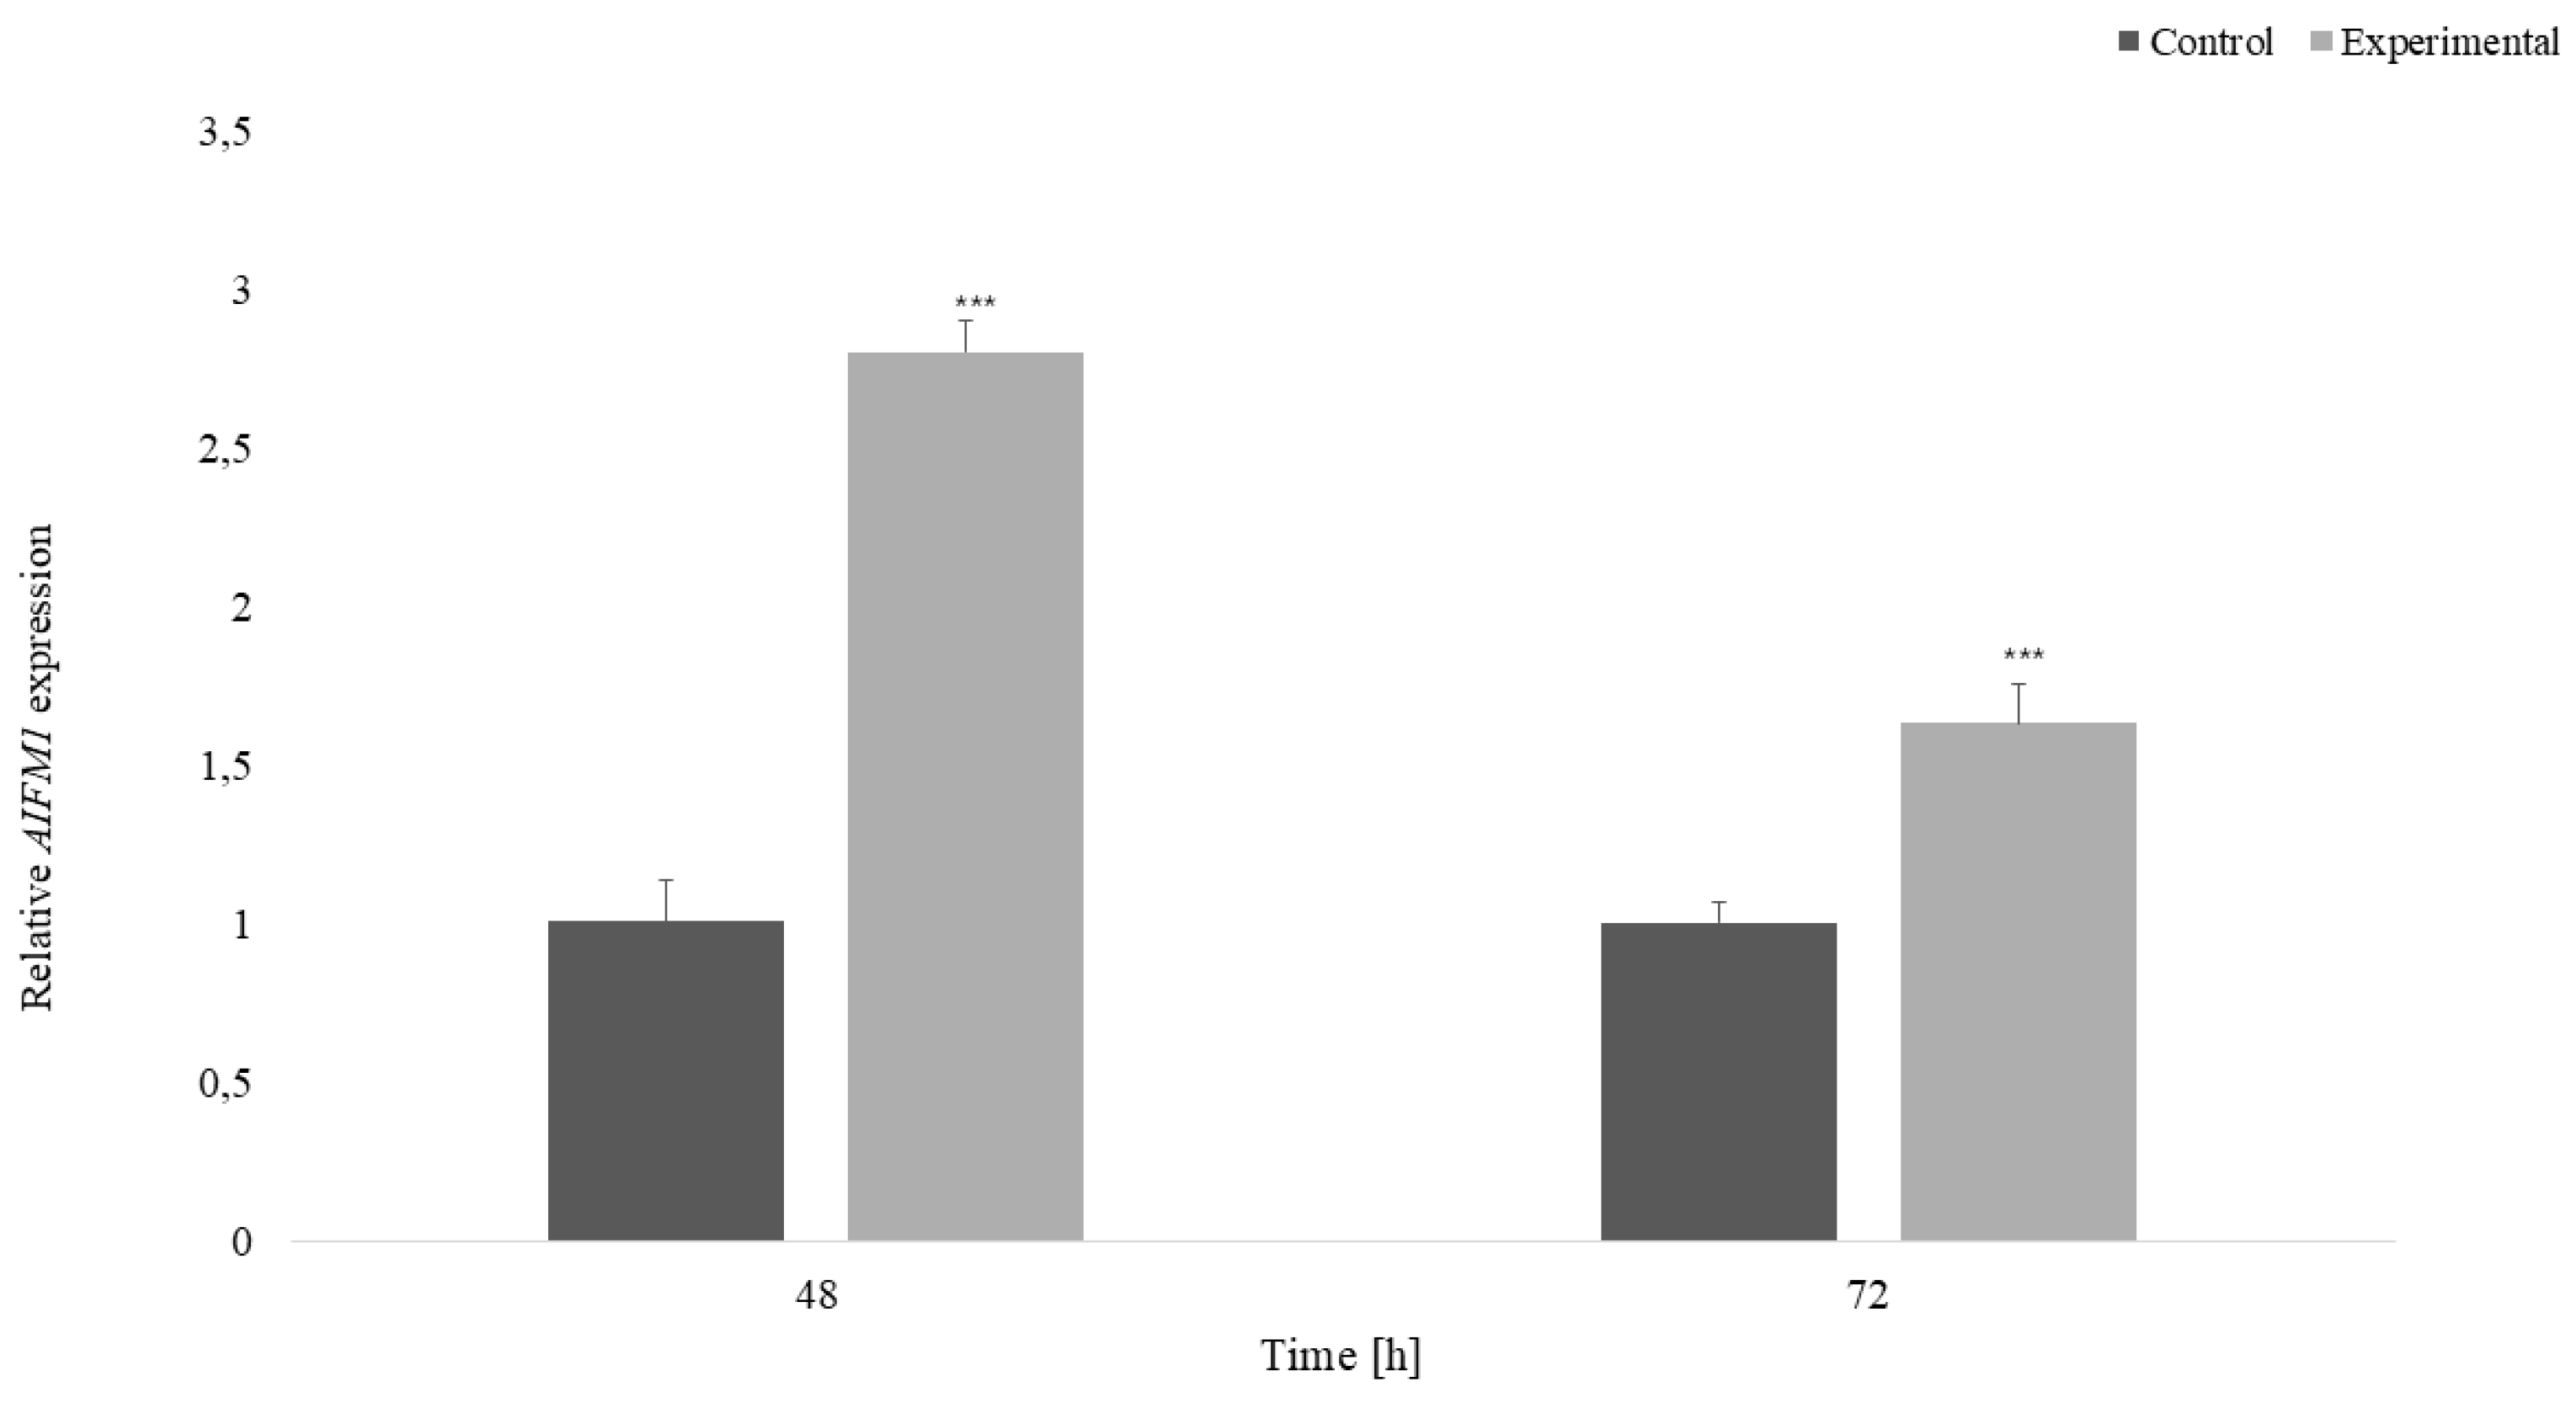

Table 1.
The X-ray crystallography data collection and structure refinement statistics of FIP-ach. Values given in brackets represent the highest resolution shell values.
Table 1.
The X-ray crystallography data collection and structure refinement statistics of FIP-ach. Values given in brackets represent the highest resolution shell values.
| Data-collection | |
| Space group | P 31 2 1 |
| Unit cell parameters | 73.32 Å 73.32 Å 167.54 Å 90.00° 90.00° 120.00° |
| Observed reflections | 329,156 (27,082) |
| Unique reflections | 29,993 (2,417) |
| Resolution (Å) | 50.65-2.13 (2.19-2.13) |
| Completeness (%) | 99.8 (100.0) |
| Rmerge | 0.061 (1.296) |
| CC1/2 | 0.999 (0.933) |
| Mean I/σ(I) | 5.63 |
| Multiplicity | 11.0 (11.2) |
| Mosaicity | 0.27 |
| Refinement | |
| Resolution (Å) | 50.65-2.13 |
| Rwork/Rfree (%) | 23.0/26.6 |
| R.m.s.d. bonds (Å) | 0.008 |
| R.m.s.d. angles (°) | 2.006 |
|
Ramachandran values (%) Most favoured/additional allowed/outliers |
95.98 /3.12 /0.89 |
| PDB ID | 9Q8P |
Disclaimer/Publisher’s Note: The statements, opinions and data contained in all publications are solely those of the individual author(s) and contributor(s) and not of MDPI and/or the editor(s). MDPI and/or the editor(s) disclaim responsibility for any injury to people or property resulting from any ideas, methods, instructions or products referred to in the content. |
© 2026 by the authors. Licensee MDPI, Basel, Switzerland. This article is an open access article distributed under the terms and conditions of the Creative Commons Attribution (CC BY) license (http://creativecommons.org/licenses/by/4.0/).
Copyright: This open access article is published under a Creative Commons CC BY 4.0 license, which permit the free download, distribution, and reuse, provided that the author and preprint are cited in any reuse.


