
Submitted:
07 July 2026
Posted:
08 July 2026
You are already at the latest version
Abstract
This research study will provide methodical scientific explanations for color-mismatches in compounded plastics and identify the dispersion characteristics of the pigments used. Related issues will also be addressed to develop better formulations that enhance color coordination, color stability, and the uniformity of compounded plastic materials, while minimizing waste. In previous research, the focus was on transparent grades, whereas in this paper, opaque polycarbonate (PC) grades were the focus, with data collected through data mining of archived records from an industrial plant. Also, data mining methods were used to identify relationships between particular processing factors and color variations. In addition, Grade B was considered due to its identical pigmentation but different polycarbonate resin percentages, with R1/R2 equal to 90/10% which yields 101 associated color adjustments in total. The number of lots without adjustment is 60, and 41 with adjustment. Interactions among three parameters of the processing (PPs) in order to maintain the same color mixture under various conditions were studied using both experimental and numerical methods. Using General Trends (GT) methods, PPs were controlled at five different levels independently, while keeping all other variables constant. Moreover, the impact effects of PPs on color output and the effect of tristimulus color (l*, a*,b*, L*, and dE*) were also analyzed. From the above and from an engineering perspective, it is crucial to understand how these parameters affect color consistency. A comparison, using a spectrophotometer, between standard target values (CIE L* - 63.36, a* - -0.34, b* - 0.20) and the measured color values was conducted, identifying the significant PPs that contribute to the minimum color deviation. The distribution of the particle (PSD) size (2 µm) is dominated by small particles at all temperatures (T). Similar peak percentages (60–63%) are shown when Temp reaches 230 °C and 280 °C, and slightly lower percentages (60%) when Temp reaches 255 °C. This suggests is rising in temperature (from 230 to 280 degrees Celsius) slightly shifts the distribution toward smaller particles, but a more balanced mix of small and medium particles appears at 255°C, suggesting Temp, which influences particle breakage and agglomeration behavior. When most particles stay in the range of 1-3 µm for all Temps, consistent fine dispersion is demonstrated. Using Design of Experiments (DOE), impending research will expand GT analysis to include interactions between several parameters. Furthermore, processing temperature will be the subject of an ANOVA to determine its statistical significance, with the results being confirmed at a confidence level of p < 0.05. In order to back up the creation of prediction models for industrial-scale applications, the study will also evaluate the diagnostic procedure's robustness across different polymer grades and colorants. The improved color matching performance for opaque grades was a direct outcome of the high-quality mixing that occurred during the polycarbonate compounding process, which also minimized color streaking and guaranteed uniform distribution of pigments. By means of a particle size analyzer on the Microtrac S3500, it examined the distribution of primary particle sizes for four different colors. Black channel (13-20 µm), red iron oxide (0.8-1.6 µm), titanium dioxide (1.7-8.0 µm), and organic yellow (0.8-1.8 µm)were the ranges of measurements. Improved dispersion and less aggregation were achieved by employing increased ultrasonic power and duration. Similar to the reference pigment, the main pigment displays ranging from 1 to 2 µm in size. Mean particle size and particle count are positively correlated; rising temperatures result in smaller pigments and more particles, which affect colour response. Particle sizes were nearly identical when PSA and SEM were compared to PSD. The improved color matching performance for opaque grades was a direct outcome of the high-quality mixing that occurred during the polycarbonate compounding process, which also minimized color streaking and guaranteed uniform pigment dispersion.To finish, the influence of processing temperature on viscosity, dispersion of pigment size at three different temperatures, and color superiority was investigated by analyzing the effects of viscosity, Digital Optical Microscopy (DOM),Scanning Electron Microscopy(SEM) ,and pigment size distribution(PSA) at various processing levels. The samples were characterized for viscosity, DOM, and Particle size distribution at (230°C, 255°C, and 280 °C) temperatures. The overall mixing of PC compounding ingredients ensures uniform pigment dispersion, minimizes color-mismatching and results in minimal color difference (dE*), which improves color-matching significantly.
Keywords:
data mining
; opaque PC-grade
; color
; processing temp
; PSA
; DOE
; PSD
; viscosity
; DOM-SEM
; characterization
1. Introduction
Globally, the Plastic industry is growing rapidly. For example, it makes a significant contribution to the North American economy, where 11 billion dollars, around 5 billion Kg, were added to economic output in 2005. [1,2]. The mechanical properties of solid plastics are fundamental, as well as their color. Reducing usage while increasing product delivery is the most significant challenge for plastic compounders, especially for those investing small sums in prototype companies, given their quick turnaround times [3].
The whole lot may have been rejected because of a slight color change caused by too much compounding. Color differences could be caused by things like differences in terms of degradation efficiency, pigment distribution or preparation, and the acoustic effects of PPs. Standard processing tools change how well the pigments mix with the resin and how the resin flows [4].
Concerning polycarbonates (PC) in particular, there is a dearth of in-depth studies investigating the effects of PP alterations. Therefore, the current research mainly aims to examine the effects of varying PPs on the desired colorant production.
Plastic patterns are frequently chosen above the rest. Numerous applications are found in the complicated, clear PC plastic, including exterior plastics, which are known to change color dramatically under multiple conditions. Recognizing these situations is deemed crucial, as is the effect they have, particularly with ingredients for compounding. The effect of processing factors (PPs) on color-matching is being investigated for a limited set of grade-color combinations.
In order to make high-quality items in the correct shade with a minimum waste, the plastics sector has recently concentrated on deciphering the intricacies of plastic color-matching. Both Beer's law (which states that the amount of absorbed light correlates to the thickness) and Lambert's law (which states that the level of concentration of the absorbs material) hold true[5].To make small and medium-sized prototypes using plastic techniques, the best approach is to use colored plastic from reputable suppliers. As a result, the factory gets orders that need to be filled quickly.As a result, when a colorant absorbs visible light, the item looks white because there is no absorption and the light scatters evenly across the visible spectrum [6].
This proves that color perception has a fundamental impact on the total amount and kind of dispersal and absorbance. Resins, pigments, and additives are the primary categories, each comprising numerous distinct components. By carefully combining distinct ingredients and additives, a specific kind of plastic is produced. The plastic's color is a compound effect of its hues: the pigments engage in a dynamic interplay, delicately reflecting some hues while absorbing others, a phenomenon intricately attached to their proportions and configurations. In the plastic compounding field, the color evaluation depends on regulation. However, Modern color depth devices, such as spectrophotometers or colorimeters, have replaced the conventional observer and white light source. White light is produced through the amalgamation of all spectral wavelengths in about equal proportions [7,8].
For even more accurate color alignment, colors can also be represented by codes or values. A pair of data extraction methods are employed: The first is OLAP, or online analytical -processing, which helps find the variables that led batches to fail and the correlations between the parameters with the most volatility. Secondly, there's DTC (Decision-Based Tree Classification), a tool for making decisions that may pinpoint the characteristics that cause color mismatches. The color-mismatch difficulties in compounded polymers are investigated by the DTC. These types of explanations were formerly amenable to online analytical processing approaches like data mining [9,10]. Here, DTC is usually employed to check if the grade-color-kind-product-series components are viable. Our literature search revealed that no studies have used DTC for color-match evaluation. There are a few related manufactured commodities (semiconductors) that engage in DTC [11]. Previous studies have used historical data to derive neural system color estimates [12].
In the present study, we will use artificial neural networks (ANNs) in order to reduce errors in coloring tristimulus target values L*, a*, and b*. ANNs have been found to be a practical tool to eliminate errors in PC color configuration [13] and for immediately impacting the dE* color metric [14]. According to the research, there were notable differences in the working circumstances and the design of the ultimate screws among the grades. Further, production circumstances and/or solid mixes of resin structure changers and additives may have a negative effect on the desired finish hue [15,16]. Notably, whereas plastics have gotten a lot of research on pigment distribution, paints and colorants have gotten far less [17,18]. T, high shear rates, and pressures are components of mechanized plastic processing that drastically alter dispersion mechanisms [18]. Moreover, various compounding tests have shown that these processing parameters have a noticeable effect on colorant [19,20]. When processing time is minimized while maximizing gloss, brilliance, and mix consistency, each item would have a maximum load. Excessive color is costly and limits bearing capacity [21,22]. To improve disperse and uniformity, increase the mixing time and decrease the resin viscosity [23].
The importance of polymer mixing has been recognized by polymer scientists, who have conducted numerous studies[24,25] to determine the effect of processing on blending in dynamic extruder by means of inventive material synthesis. In the melt stage, PC/PBT blends are transparent and solidify into equally dispersed solutions, as mentioned before by Sanchez et al. [25]. Compared with pure PC, the rheological characteristics of recycled PC were investigated by Liang and Gupta (2000). As a result, you can merge the two PCs into one. Additions up to 15% do not alter its properties [26]. The rheological and segmental performances of (PC/Polyester) blends were discovered by Lee S. and colleagues. But, as is usual with any changes, they show that the arrangements are not mixed law compliant. The results showed that the combinations did not follow the mixing directions, which is consistent with previous research [27]. Like twin-screw extruders, several researchers have shown that one extruder screw could impact dispersive mixing capacities [28].
In addition, the experiment examined the mixed color process using eight glass panes and a single-screw extrusion (diameter = 45 mm) [29]. With this technique, the investigation pinpointed the exact locations where color blending begins and ends. Investigations on the twin-screw compounding phase focused on the effects of torque, screw design, and operating conditions on loading and dispersal effectiveness [30]. The impact of high extruder processing pressure on mixing quality was also discovered by the researchers. The researcher will conduct both independent and combined tests using a randomized design to determine how PPs affect output color. We ran the tests, looked at the PPs, and defined the rheological dispersion.
Results from a comprehensive study of processing sets, various connections, pigments, additives, and resins demonstrated the capability of the statistical model [31,32,33,34,35]. A subsequent study also includes changes in surface color as well as appearance caused by different plasticizer concentrations and screw speeds, demonstrating how speed of processing impacts the visual color sound characteristics in extrusion PLA [36].
More than that, we used machine learning to predict the corresponding values of the color processing settings (CIELAB): (L*, a*, b*) of the extruded thermoplastic resins based on processing data collected right now. In order to reduce off-color manufacturing and maintain consistent color quality, their simulation models accurately forecast the color difference (dE*) between projected and measured values, enabling proactive practice modifications [37].The color change of PLA throughout twin screw extrusion processes at varied temperatures and speeds was determined using CIELAB color analysis (L*, a*, b*, and dE*) [38]. Faster screw speeds helped keep the color true to the original and lowered dE*.
Where, in the color scheme of the (CIE L*a*b*), dE* represents the relative hue. When measuring the apparent difference in two different colors, this is the gold standard metric to use.
Lightness (black/0, white/100) is represented by (L*), while (a*) denotes when positive-yellow, negative-blue (the yellow-blue axis) and (a*) denote when positive-red, negative-green (the red-green axis) are true.
Variations in a, b, and L are represented by da*, db*, dL*, and dE*, respectively; dE stands for the total color variation.Researchers were most concerned with how the twin co-rotating screw course processing parameters affected variations in color grade. Our multi-stage investigation begins with opaque PC grades and continues with data mining, PPs, rheological analysis, and dispersions; previous historical data mining studies focused on transparent PC grades. In order to investigate color output results, this study will examine and link data mining findings with the effects of viscosity, pigment distribution, and PPs [39,40,41,42,43,44,45,46]. Once again, in subsequent phases, two grades will be distinguished by the same color—even though both grades have a satisfactory outcome for the same color—but they are significantly different. Developing a suitable method to govern the processing T’s effect on the opaque PC grade is the main goal of this research. Using data mining in order to investigate the opaque grading color that is high adjustment and mismatched
The researcher in this study employs a 5-level response control procedure to compare three processing factors across treatments, gathers information through innovative data mining to suggest ways of enhancing the process, and investigates dispersion using deep data analysis and experimental and creative analyses. Detailed morphological analysis, including investigation of the impact of size, pigment count (%), and distribution. By combining the PSA and SEM, we can compare the particle sizes of raw pigment with the experimental distribution.
Also, at comparable temperatures (230, 255, 280 °C), the samples are measured for viscosity, drop-on-melt (DOM), and creative particle size distribution (PSD). Each processing factors are investigated to find the optimal colored-matching and the science underlying colors-mismatch for opaque color PC grade.
Studies have shown that temperatures as high as 280 degrees Celsius can have a major impact on fragmentation. A very small particle size and the mean particle size are affected by variations in temperature, according to the study. Particle size may be reduced on average when exposed to high temperatures. Steady fine dispersion is seen when the majority of particles remain within the size range of 1-3 µm regardless of the temperature. with a rise to 60-63% for the tiny particle fraction. Examine all variables to learn about the physics of opaque color grade coloring mismatching.
2. Materials and Methods
Table 1 and Figure 1 below reveal the formula for the opaque hue of compounded plastic (Grade A), which is made up of two PC resins and six distinct pigments. Both the resin/one and the resin/two components were present, with the former having an auto-ignition temperature of 630 °C and the latter having a density lower than water at 25 g/10 min and 6.5 g/10 min, respectively. A 6 kg batch is primarily composed of two different kinds of resin: 10% (600g) and 90% (5400g), which create the base matrix for the combination. The composition of this batch is shown in the table. A total of six pigments—white, black, green, red, blue, and yellow—are included as minor parts, each added in minute quantities.
2.1. Data Mining
The examination of data mining by algorithms can swiftly reveal information regarding flaws associated with processing circumstances. The data for the remaining resins will be analyzed for defects and associated with materials and PPs, potentially addressing issues that could enhance PPs and reduce overall costs.
The majority of situations necessitate no modifications (blue), a smaller subset requires one adjustment (orange), and an even lesser number necessitate two or more adjustments (light gray and yellow). This signifies a substantial initial-pass success rate with negligible rework.
2.2. Data Mining Parameters Investigated
Use of data mining techniques for patterns detection between different parameters: The total amount of ingredients: Pigments, additives, resins (over 400) and machinery: diverse designs, plus 15 lines. Data Analysis and Processing Identification. The majority of companies maintain their data in electronic format. Data tools employed to identify design adjustments for the runs conducted in 2009 comprised MS Excel and OLAP. Recognizing these data modifications may elucidate color discrepancies, necessitating the resolution of formulation difficulties. The cumulative quantity of adjustments is 9,598 lots. The necessary modifications in the formulas are utilized repeatedly, at a rate of 17.7%. This article utilized DTC to identify the causes of polymer color mismatch by analyzing the correlation among five distinct parameters. The analyzed polymer factors included color, grade, line, product, and type.
P1 shows the highest percentage of lots with pigment adjustments (40.6%), indicating greater variability or a greater need for correction in pigment use compared to other pigments. 2.48% is the pigment involved in P1 (adjusted lots), which is significantly higher than 0.81% in non-adjusted lots; this difference (1.67%) suggests a remarkable correction or overuse.P1 pigment has quality-control or formulation issues due to its high adjustment frequency and a disproportionately high adjustment ratio. Yet it has 101 lots, the second-lowest, and nearly half of those require adjustments when P1 pigment is one of their components, compared to others.
Supplier consistency checks or reformulation efforts specifically for P1 to reduce adjustment frequency and improve efficiency could signal a need for a process review. Pigments such as P11, 12, and 13 exhibit fewer variations in pigment use (0.74–1.21%) and lower adjustment rates (27–28%), which explain their efficiency as well as their stable performance. These could serve as benchmarks for improving underperforming pigments, such as P1.
In Table 2. Upon evaluating "good" and "bad" pigments, it is evident that red pigments (e.g., P1) are the least favorable due to the scarcity of high-quality black colors. Following expert study, two trends have emerged:
Diluted let-down pigments concluding with ...L01
Inferior pigments fall among the categories of: Black, White, and Grey-Blue pigments.
2.3. Data Data Mining Color-Grades High Per Cent Adjusted
InFigure 2. Upon analyzing “good” and “bad” pigment substances, it is evident that red colors are the least favorable due to the scarcity of quality black pigments. Following professional research, two trends have emerged.:
Letdown pigments (diluted), which end …L01. Black, Grey-Blue, as well as White pigments are categorized as inferior pigments. Similarly, it is feasible to identify the “good” hues for the Grades where: Grades G4 constituted 9.75%. while G5 accounted for 2.43%; this analysis is initially driven by the notable 2.43% adjustment. This initial analysis for grade 5 is taken because grade 4, as well as Grade 5, shares the same color, where Grade 4 had 9.75% (the highest adjustment), the relationship between these two grades needs further investigation.
2.4. Pigment Particle Size Analysis via Microtrac S3500 (PSA)
An instrument for measuring particle size, more especially a Microtrac S3500, was used to measure sizes of primary pigment samples taken while they were still damp. In this device, three precisely placed red lasers were used. Detectors that accurately characterize particles between 0.2-2.2 µm in size. A recirculation system, consisting of Wet examination required the use of a sample entry reservoir, a fluid pump, and a methodical outflow valve. This system’s goal was to transfer the material sample to the analyzer in a uniformly distributed fluid state. In a mixture of deionized distilled water and pigment suspension droplets, the non-ionic surfactant Triton X100 was introduced. By examining the random fluctuations in laser light induced by Brownian motion, this technique determines particle sizes. According to Table 3, we may determine the hydrodynamic breadth and dimension dispersion of the particles by observing their diffusing speed [47]. A somewhat newer attempt has used Dynamic Light Scattering (DLS) to measure very small quantities with high precision and consistency, accounting for particle size fluctuations [48].
2.5. Color Measurement Device: Spectrophotometer
For the purpose of assigning a color value, a spectrophotometer determines the amount of light that is either reflected or transmitted. To be specific, it logs the (L*a*b )color coordinates and the
deviation from the standard in terms of color (dE*). An objective numerical assessment of color is provided by this apparatus.
Spectral reflectance, relative spectral emittance, and spectral transmittance can all be measured with this photometric device. In order to quantify the color, this findings utilized along with X-Rite Colour Master software (version 8.9.6) and a CE-7000A spectrometer (Konica Minolta, Tokyo, Japan). It utilized D65 light and set the Standard Observer Operation to 1964-10◦.The injection molding machine was used to shape these pellets into rectangular color chips with dimensions of 3 × 2 × 0.1 inches. The injection pressure was kept at approximately 28 bar (1000 psi) and 280 degrees Celsius and the temperature at 280 ◦C. The goal values were set as (L* = 63.36), (a* = −0.34), and (b* = 0.20), and color measurements were taken at three different sites (in each specimen) to get the tristimulus values (L*, a*, b*). Then, (dL*, da*, db*, dE*, and dC* ) were used to measure the color differences. Researching dispersion with DOM improves reproducibility; by giving more data points per sample, it lessens the effect of random measurement error.
4. Results and Discussion
4.1. Experimentation and Method
Experiments were conducted in industrial sites in Canada utilizing a 27 kW Coperion Germany twin screw extruder (25.5 mm) ZSK26, with ratios L/D=37 and Do/Di=1.55.. At the industrial plant, the grade was tested. On the extruder, 10 heating zones are available: one (at the die) and nine (at the barrel). The detailed specification data of the operating Coperion screw line are shown in Table 4.
This study employs the Brabender gravimetric Feeder (model DDW-H31-FW33-50) for material feeding, targeting CIE 1976 a*b* L* values of a*= 34, b*= 0.17, and L*= 63.38 for the desired color outputs.. The experimental choices of color and materials depend on the industrial plant and the availability of equivalent previous records. Also, the experiment takes into account three process parameters: the F.Rate (to the extruder), the screw speed, as well as the T (of the heating zones); these parameters will be varied at 5 alternative levels. To ensure smooth material flow and prevent bridging, for the first two-barrel zones, Ts are kept low at 70°C and 190°C, respectively.
Two PC resin blends with variant pigment weights are being employed in Grade 5. Accordingly, the autoignition T is 630 °C for all grades, resin/2 has an MFI=6.5 g/10 min, while resin/1 has MFI=25 g/min, and the two resins are heavier than water. After being quenched in cold water, the extruded softened material is pelletized. Then, these pellets are taken in rectangular shape chips (3 × 2 × 0.1”), and by injection moulding, they are measured against a desired value. To guarantee accuracy, three vouchers are made (one for each of the five parameter values) and three readings are obtained from each voucher. For the tristimulus value of color with the 3PPs, there are a total of five runs of design points of data, as shown in Table 4.
4.2. Impact of the Role Effect of PPs on Color Variations
Performing a control study to examine the effects of working variables (T, speed, and F.Rate) on tristimulus color. The processing factors were controlled individually at three levels, while all other parameters (GT) were fixed. Considering the strong relationships observed, the study fixes the speed (750 rpm) and F.Rate 25 kg/h) at the middle values while the selected processing Ts are 230°C, 240°C, 255°C, 270°C, and 280°C. A temp of 240°C brought out the most precise shade with a minimum dE*(1.31); Table 5 represents the GT experimental design. If the above parameters are used in this experiment, the optimizing process Ts is suggested to achieve plastic-grade color tristimulus accuracy for (dL*, da*, db*, dE*).
4.3. Effect of PPs of Opaque Grade 5 on Tristimulus Color
The three processing parameters’ effects on color output, when assorted through 5 changed stages using the definite formulation (Opaque grade 5), have been evaluated. These parameters are represented independently in Figure 2, Figure 3, Figure 4, Figure 5, Figure 6 and Figure 7, expressed as( CIE dE*) values ( i.e., variations from the best color). CIE tristimulus data (L*, a*, and b*) show similar graphs, but dE* values provide deeper analysis and reveal trends in the data. This analysis focuses on how keeping two factors constant while varying the third affects the color quality (dE*). For example, Figure 4 and Figure 5 display the trends in dE* and the differences in color when Speed, F.Rate, and T are varied.
4.3.1. Variation in Temps (Trends)- on dE*
In this stage, the study fixes the speed (750 rpm) and F.Rate (25 kg/h). A slight decrease in color value (dE*) occurs when T increases from 255°C to 280°C, indicating that higher Ts improve the quality of color.
To our understanding of dE, when its value approaches zero (dE* = 0 ), the most perfect color-match (no noticeable difference from the target/reference), where the closer to zero, the better the color accuracy and when it's higher (dE*), it means more deviation from the preferred/standard color.
The summarized result is that at 240°C, it gives the most accurate (closest-to-perfect) color and the lowest dE*.
At 255°C, the most significant color error is observed, indicating degradation or a shift, although at the medium point. The final Goal is to minimize dE* and the operating T at or near 240°C for optimal color accuracy, or to approach the minimum, as shown in Figure 3.
4.3.2. Impact of Temp on Tristimulus Color Lightness(L*)
Based on the records in
Figure 4, while T rises (from 230°C to 280°C), the L* value decreases from approximately 63.3 to 62.6. Notably, the material becomes less reflective and progressively darker when T reaches 280 °C.
4.3.3. Impact of T on Tristimulus Color Redness-Greenish-(a*)
Based on the data provided, the impact of T on the a* value is as displayed in
Figure 5:
The a* value decreases from -0.05 to -0.07 as T rises from 230°C to 255°C. This steady negative shift indicates that the material's color is moving away from red and becoming progressively greener as the processing T increases; this effect explains a direct relationship between higher heat intensity and the material's greenish characteristic.
4.3.4. Tristimulus Color Impacted by Temperature (Yellowish Bluish Color on b*)
According to the above data, Figure 6 explains how the b* value is impacted by Temp:
As T rises from 230°C to 280°C, the b* value shows an apparent, consistent increase from 1.44 to 1.46, indicating a significant shift of the material's color towards yellow (and away from blue), which demonstrates a direct relationship between T and color: a more yellowish color resulted from higher heat.
4.3.5. Processing Temp’s Role. on dl*, da*, db*, & dE* (Tristimulus Color)
Tristimulus color is influenced by Temp., as shown in Figure 7 and Table 6 below. It shows how Temp variations (°C) affect the CIE Lab tristimulus color factors, where da* represents (red-green), db* represents (yellow-blue), and dE* represents (overall color difference). In the Temp. range of(230°C) to (280°C), the dL* (Lightness) shows a consistently negative trend, with values ranging from about -0.35 to -0.60. The color value is constantly darker than the standard. The highest negative (darkest) is at 255°C, then it starts to rise (less dark) at 280°C. Furthermore, the Temp. has a slight effect on lightness, with a peak darkening at 255°C.
The da* (Red-Green) trend is stable at around 0.26-0.29. The conclusion is that there is no significant variation (insignificant impact) on the red-green component across all Temps. On db* (Yellow-Blue), the trend effect is very stable at about 1.27. The yellow color shift is an insignificant effect of temperature in this range. The best color-matching (lowest dE*) occurs at 230°C and 280°C, over that, to avoid temp at 255°C if the objective is color accuracy, and it shows the darkest color. So basically, the Temp mainly affects lightness dL*, while da* and db* are stable.
4.3.6. -Role of PPs (Temp, speed, F.Rate) on Color - Yellowness-Blueness-db*
Within the realm of analysis of colors, a positive db* value indicates yellowness, while a negative one indicates blueness. A positive db* signifies a color shift toward yellow, with higher values meaning a more intense yellow hue, as shown in Figure 8 and Table 7
The effect of PPs on db* is as follows:
- Temp: db* increases slightly with higher Ts, causing more yellowing.
- Speed: db* dips to a minimum (least yellow) at mid-speed, then rises sharply at high speed due to heat-induced yellowing.
- F.Rate: db* decreases from high to less yellow and then stabilizes, as a higher F.Rate dilutes the effect or reduces exposure time.
A higher F.Rate reduces yellowing by shortening heat exposure. At the same time, speed's effect is non-linear, with its heating effect ultimately dominating to increase yellowing, but temperature (T) directly increases yellowing (db*) by thermally degrading the material. The speed must be in the middle; F.Rate increase and decrease. If the target is to minimize yellowing, then lower the F.Rate slightly and increase the Temps. If the target is to maximize yellow tone (greater db*), then increase the speed, lower the F.Rate slightly, and increase the Temps.
5. Experimental Design and Processing Parameters
5.1. How Processing Parameters Affect the Composure of a Grade of Opaque (GT)
Additionally, the impact of processing factors on (PC) compounds, both transparent and opaque, was investigated. Temperature was the most important of the three PPs in determining color variation. Table 4 shows that it was varied at five stages, ranging from 230 to 280 ◦C, 700 to 800 rpm, and 20 to 30 kg/h. Conducting a controlled experiment to determine how various working variables (T, speed, and F.Rate) influence the color of the tristimulus. All other parameters (GT) were kept constant, while the processing variables were changed separately at five levels. The study finds that processing temperatures of (230°C, 240°C, 255°C, 270°C, and 280°C) are optimal, taking into account the strong associations that were detected. The speed is set at 750 rpm, and the F.Rate is 25 kg/h. The color that has the highest accurate and has a minimum dE* (1.31) was achieved at a temperature of 240°C; the GT experimental setup is shown in Table 5. Ts, the optimizing method, is recommended for achieving plastic-grade color tristimulus accuracy for (dL*, da*, db*, dE*) in this experiment, given the aforementioned parameters.
5.2. Contour Plot of ΔE* vs Temperature and Screw Speed
According to the contour plot-Figure 9. At low temperature (~230°C) and high speed (~800 rpm), the screw speed and temperature interact in a way that minimizes ΔE*, where higher shear promotes pigment dispersion. On the other hand, unstable dispersion circumstances are indicated by larger ΔE* even at increased speeds at mid temperatures (~255°C). Although ΔE* stabilizes at temperatures around 280°C, it does not achieve its ideal value at these temperatures. In general, dispersion stability is controlled by temperature, and color deviation is reduced by increasing shear when the screw speed is raised.
5.3. 3D Desirability Surface for Screw Speed Versus Temperature
Based on the graph plot (Figure 10). The 3D desirability surface for screw speed versus temperature indicates that desirability is maximised at lower processing temperatures (≈230–240 °C) combined with higher screw speeds (≈780–800 rpm), reflecting improved colour performance under these conditions. As temperature increases, desirability decreases across all screw speeds, highlighting temperature as the dominant factor influencing colour stability. At lower screw speeds (≈700–720 rpm), desirability remains consistently low, even at reduced temperatures, suggesting insufficient shear for optimal processing. The surface shows a clear ridge of high desirability at high speed–low temperature combinations. Overall, the optimal operating window is defined by high screw speed and low temperature, while elevated temperatures significantly reduce desirability regardless of speed.
6. Three-Level Factorial Design, a Response Surface Method (DOE)
To better show measurement variability and increase data dependability, error bars were added to the plots. We performed statistical tests to find out if the changes in ΔE* were just coincidental or had a meaningful statistical impact. Analyzing the impact of process factors and their interactions, analysis of variance (ANOVA) validated the model's significance and appropriateness. The quadratic model was created and assessed using a mix of tools, including analysis of variance (ANOVA), multiple regression analysis, and response surface methodology (RSM).
Conditions: feed rate (20-30 kg/h), temperatures (230-280 °C), and speed of the screw (700-800 rpm). investigated in a complete factorial Design of Experiments (DOE) with 27 trials were the three fundamental variables. The four color responses (L*, a*, b*, and ΔE*) were used to analyze these parameters. To account for both independent and dependent variables, the experimental design employed a three-level scale (low, medium, high) for all of them.
For statistical analysis and model construction, Stat-Ease Inc. of the United States employed their Design-Expert® program. To optimize numerous responses at once, a desirability function technique was also used. Further, in order to confirm broad patterns found in the experiment, supervised industrial trials were also carried out. When it came to improving color constancy, the DOE method allowed for a systematic study of process parameters and the determination of optimal settings.
6.1. Design of Experiments (DOE) with Three Levels and Multiple Parameters
Three critical variables are examined in this situation. Each is delineated by three potential values: low, medium, and high. To assist you in identifying the optimal point, the technique integrates on those depths in a specified manner to replicate how they connect and their effect on your answer, as illustrated in Table 8.
6.2. Three-Level Factorial Design for Design of Experiments (DOE)
The three input variables were tested using a conventional factorial design with three levels each. Table 9 displays the experimental design levels for the flow rate, temperature, and screw speed (rpm), which represent 3 process parameters.
The proposed 27 a mix of processing parameters for experimental were modelled utilizing the computer software tool Software: Design-Expert® V8.0.7.1 (Minneapolis, MN, USA: Stat-Ease Inc.).Additionally, the investigational design comprised a full factorial design with 27 runs .The three variables being studied are temperatures (230°C to 280°C), speed from (700 to 800 rpm), and F-rate (20-30 kg/h), and the four color responses are L*, a*, b*, and dE*.To evaluate the three-level factorial design, this software was used. Temperatures between 240 and 250°C, speeds between 770 and 790 rpm, feed rates between 28 and 30 kg/h, and an estimated dE* of 1 were the ideal processing settings that lowered color outcomes.. Moreover, the following outcomes were derived from the computational data analysis, including an assessment of factor importance.
Optimal Conditions
Parameter Optimal Value
Temperature (A) 230°C
Feed Rate (C) 25–30
Predicted ΔE* ≈ 1.12 – 1.18
Validation (from actual data)
Run 20 → ΔE = 1.14 (best)*
Run 14 → ΔE = 1.15*
Model aligns with experimental results → strong validity
Statement of the Desirability Function
A minimum anticipated ΔE* of around 1.12-1.18 was obtained by numerically optimizing the process at around 230 degrees Celsius and a feed rate ranging from 25 to 30, using a desire function technique. The experimental validation of these data proved that the model that was constructed was reliable.
Final Key Findings
Findings show that temperature has a more significant impact on color deviation than feed rate, which has a secondary but interacting effect. The significance of optimizing thermal and flow conditions simultaneously is underscored by the notable A×C interaction. The system's behavior is non-linear; at low temperature and moderate to high feed rate, it reaches its clear optimal, where increased shear mitigates the effects of high viscosity, resulting in more uniform coloration and better pigment dispersion.
6.3. Examining Variance (ANOVA)
ANOVA is used to analyze the results of a three-level design.The factor of their interactions statistically determines the significant variation in the response. One finds out which parameters actually affect the process, which leads to the best possible configuration.
ANOVA was handled to examine the experimental outcomes, as shown in Table 10. The processing settings were optimized to L*=63.36, a*=−0.34, and b*=0.20 are the optimal values for the stimulus.
The range of the greatest permissible variation was 2 degrees; thus, this was well inside it. Temperature and speed had a more significant effect on color values. If you want better pigment dispersion in your polymer color testing, you can use the optimized values as a baseline.
The ANOVA results indicate that temperature is the most statistically significant parameter affecting colour difference (dE*), confirming its dominant influence on color stability. Screw speed also shows a significant effect, particularly through its interaction with temperature, indicating that shear conditions modify color response. Feed rate exhibits a moderate but meaningful effect, mainly through interaction terms rather than as a standalone factor. There are notable impacts of temperature-feed rate and temperature-speed interactions. highlight that the influence of one parameter depends on the level of the other. Overall, the model demonstrates that color behaviour is governed by both main effects and interactions, with temperature playing the primary role. Results was shown shown in Table 10. Furthermore, computational data analysis yielded key outcomes, including factor importanc for.Model Quality Validation Metrics as shown in Table 11.
6.4. Statistical Analysis: Regression Models (DOE)
In order to optimize the process, response surface methods (RSM) were used, including a three-level complete factorial design. The initial step was to develop and conduct tests to evaluate the model parameters. After that, a mathematical model involving second-order polynomials is required for the answers [49].
The ith interaction coefficient is bij, the ith quadratic coefficient is bii, the ith constant is b0, xi is the independent variable, k is the number of factors, and ε is the error. The produced color does not match the required color if there is a large difference (dL*, da*, db*, or dE*) between the two.
This is the distance in three-dimensional color space measured in terms of the Euclidean coordinates [50]. According to the units of (dL, da, db, or dE), the permissible tolerance limits are determined by the standards set by the customer.Beginning encompassing all predicted effects and a mathematically confirmed optimization equation for: Tristimulus color values
1.Linear regression models
L*=63.22196−0.17267A−0.04417B−0.03378C
a*=0.06496−0.01139A−0.02117B−0.00083C
b*=1.41074−0.00389A+0.00417B−0.02889C
ΔE*=1.38430+0.05144A−0.03161B−0.05789C
2.Quadratic models
L∗=63.49919−0.17267A−0.04417B−0.03378C−0.05417AB−0.00600AC+0.15833 BC−0.11122 A²−0.00339 B²−0.30122 C²
a∗=0.04352−0.01139A−0.02117B−0.00083C+0.00650AB−0.00617AC+0.03192BC+0.04894 A²−0.01306 B²−0.00372 C²
b∗=1.39685−0.00389A+0.00417B−0.02889C−0.01292AB+0.03000AC+0.00250BC+0.08611 A²−0.01972 B²−0.04556 C²
ΔE∗=1.50841+0.05144A−0.03161B−0.05789C−0.01117AB+0.03317AC−0.05433BC−0.18022 A²+0.04061 B²−0.04656 C²
7. Impact of Viscosity at Temperature (T) (230, 255, and 280°C) for Grade 5
In Figure 11. Viscosity dramatically drops as T rises. The viscosity is high in order exhibits shear-thinning characteristics at high frequencies at 230 °C. It exhibits reduced viscosity and less severe frequency dependency at 280°C.This pattern reveals the typical behavior of polymers, which is that their viscosity (the molecular barrier to flow) decreases as the temperature (T) increases. We can attribute this to shear-thinning behaviors. The viscosity remains rather constant at low frequencies (less than 10 Hz) for all Ts, but it drops off sharply beyond that frequency. The shear-thinning performance, which is common in polymer melts, is demonstrated here. The polymer materials show non-Newtonian behavior. Additionally, the polymer shows shear-thinning behavior that depends on temperature, with the minimum resistance to flow at 280°C and the maximum at 230°C.
8. Analysis of the Distribution of Pigment Sizes and the Impact of Temperature
8.1. Optimizing Particle Size Distribution Through Melt Viscosity at Different Temperatures(T)
In Figure 12. The small particles dominate the distribution of the particle size (2 µm) across all temperatures (Temp), similar peak percentages (60–63%) are shown when Temp reach 230 °C and 280 °C and slightly lower (60%) when T reach 255 °C; indicating that as the temperature rises (from 230°C to 280°C) slightly shifts the distribution toward smaller particles, but a more balanced-mix of small and medium particles at while at HF-255°C shows, suggesting Temp, which influences particle breakage and agglomeration behavior. Consistent fine dispersion is shown when the majority of particles remain in the range of 1–3 µm for all Temps.
Moreover, the quality of dispersion is dictated by temperature (T), which controls the viscosity of the material: at 230°C, due to excessive viscosity, a reduction in molecules’ mobility is shown, leading to insufficient mixing and the formation of larger agglomerates of particles. At 280°C, productive shear mixing is enabled by lower viscosity, leading to a finer, more uniform particle distribution, whereas higher Temp is associated with reduced viscosity, indicating a clear inverse relationship that subsequently leads to a reduction in particle size. The 255°C intermediate condition revealed this transition, in which breakage and coalescence are balanced. Thus, optimal mixing is realized at Temps, leading to a reduction in the viscosity which encourage the division of effective particle.
8.2. Quantitative Pigment Size Distribution Analysis at 230°C, 255°C, 280°C
The quantitative analysis, Distribution of particle sizes, measures how the dimensions of the particles (in a test) is statistically distributed, as displayed in Figure 13.
In Figure 13. At 230°C, the particles are mostly microscopic (around 1µm), giving the material a high surface area and making it highly reactive, but this makes it prone to clumping and sticking together. However, larger particles are much less common, and thermal energy and reaction rates, not mechanical forces, control their size distribution. This fine structure creates challenges for both cohesion and agglomeration, but boosts reactivity.
As illustrated in Figure 14 at a processing temperature of 255 °C, the particles are mostly excellent (with 60% around 1µm in size), but as the size of the particle increases, particle number drops sharply, especially when the sizes are greater than 6µm (which are rare). The distribution is steep; a significant drop in particle count results from a slight increase in particle size, indicating a greater abundance of fine particles and a lower abundance of larger agglomerates.
At 280°C, due to increased agglomeration from higher thermal energy, 65.3% of particles are mostly concentrated at 2µm. The finer particles sinter and fuse into larger agglomerates due to the heat, resulting in a peak at 2µm. The key factor at this T (280°C) is agglomeration. as illustrated in Figure 15 at a processing temperature of 280 °C
8.3. DOM Characterization at Various Temperatures (T)
In Figure 16. At 230°C, the viscosity of the high matrix prevents shear forces from breaking apart particle clusters and limits flow, which leads to large agglomerates and poor dispersion. The image shows a structure dominated by fine particles around 1µm, providing high surface area and reactivity, but these particles tend to clump, causing challenges with both agglomeration as well as cohesion. At this temperature (Temp), thermal energy promotes particle clustering, with the distribution influenced by thermal rather than mechanical forces. At 255°C, particles move and collide due to intermediate viscosity, but they do not break apart because there isn’t enough shear energy, resulting in fine particles’ agglomeration into medium-sized aggregates (3-5µm) that create a transition zone. The particle distribution matches the image, mainly showing 1µm fine particles and a few larger agglomerates. Notably, as size increases, a steep drop in particle count is observed, and a few particles larger than 6µm are also present; the morphology reflects this, showing an evident absence of large clumps and a dominance of fine particles. This structure supports moderate agglomeration into medium-sized aggregates and a high concentration of small particles.
At 280°C, a morphology consistent with the described particle distribution is shown. The low matrix viscosity promotes efficient shear mixing, breaks up agglomerates, and promotes dispersion, but due to thermal energy-induced agglomeration, most particles (~65.3%) are concentrated around 2µm. Finer particles sinter and fuse into larger agglomerates due to heat, resulting in a peak at 2µm and a dispersion/agglomeration balance that yields a uniform mixture with dominant 2µm agglomerates at this temperature. The increase in thermal energy causes a clear shift from fine particles to medium-sized aggregates, shown in this distribution. In summary, higher T and lower viscosity promote the formation of 2µm agglomerates and the breakup of fine particles, while at the same time clustering into larger sizes.
8.4. DOM Characterization at Different Temps (Scale 5 µm)
In Figure 17. At 230°C, particles are sparsely distributed with minimal agglomeration, and the surface exhibits a coarse, granular morphology. At 255°C, an increase in particle density and agglomeration, suggesting enhancement in particle movement, as well as more defined structures’ surface. At 280°C, the occurrence of the highest particle concentration and agglomeration, and enhanced diffusion and nucleation due to fine, well-defined particles, as the microstructure reveals.
The increased particle movement and finer particle morphology at the higher T are the primary differences between 230°C and 280°C; as T rises, particles experience greater thermal motion, causing greater agglomeration and finer dispersion. An increase in kinetic energy, as the observed changes reflect, promotes diffusion and nucleation at higher Ts; thus, as T increases, the particle behavior and microstructure evolve significantly, with more uniform and finer particles at increased Temps.
9. Raw Color Characterization Using a Scanning Electron Microscope (SEM)
For this, we used a scanning electron microscope (SEM). The JSM-600 was used with an acceleration voltage of 20 kV, a working distance of 15 mm, and a magnification of 3000×. Applying the following technique to the uncoated pigment allowed us to confirm the presence of agglomerates and the fact that the main particles were within the 100 nm range in the four pigments (red, yellow, black, and white). A scanning electron micrograph (SEM) showing aggregates of white pigments is shown in Figure 16. It has been shown that primary particles with a spherical shape and a size of about 0.1 µm do exist. Figure 17 shows a picture of yellow pigments as seen by imaging microscopy. Approximately 0.1 µm in diameter, the image shows agglomerates made up of main particles that can be elliptical or cylindrical. This also holds true for the black and red pigments, which consist of agglomerates with 10 µm and 0.1 µm spherical primary particles, respectively.
When it comes to the main particle size, the results from the particle analyzer are similar to what is shown in Figure 16, which is the SEM image. Particles' average diameters ranged from 100 to 200 nm.
Particle sizes of the red pigment are average when compared to other pigments, suggesting that the blend is compatible and that the requirements are constant. Figure 18, which shows high-resolution scanning electron microscopy (SEM) pictures, shows that most pigments have irregular forms, with yellow pigments looking more spherical and smaller. The flow and rheological behavior of a suspension is improved by larger, more spherical particles, whereas the stability of a mixture is improved by smaller, more irregular particles, which have providing more surface area and, by extension, more hence a higher suspension viscosity.
Photos of red pigments taken using a scanning electron microscope at various magnifications reveal: (A) the clustering of particles and their size distribution at 50 µm, and (B) the microstructural shape and dispersion quality at 200 nm. Adaptive histogram equalization was used to improve the image's contrast without affecting the resolution or scale. When blending smaller particles like red and yellow pigments with different fillers, it is extremely important to use effective high-shear mixing in order to create a well-dispersed masterbatch with ideal rheological properties. Previous research has also shown that particle concentration and size affect rheological behavior (Mangesana et al. [51]. Greater viscosity and smaller particles are generally linked to better color quality. The analysis of polymer blend structures and the identification of fracture surfaces are both greatly aided by scanning electron microscopy (SEM) [52].
10. Conclusions
The impact of PPs was identified in this research on color accuracy and pigment behavior in opaque polymeric materials by using data mining. The most accurate color was obtained at a temperature close to 240°C, with the lowest dE* (1.31), demonstrating the vitality of this temperature for obtaining trustworthy findings, and all values stayed negative ( −0.05 to −0.07), indicating the shift into green.
At higher temperatures, viscosity decreased, flow and conduct during shear-thinning increased, where the resistance is at its peak at 230°Cand minimum at 280°C. The L* value decreased with temperature, indicating a darker appearance, while the b* value increased from 1.44 to 1.46, indicating stronger yellowing. The PPs' effect on Yellowness-Blueness (db*) was shown as follows: first, an increase with temperature; second, a minimum at mid-speed; third, a sharp rise at high speed; fourth, higher F.Rate reduced yellowing by shortening thermal exposure. Yellowing was increased with temperature-induced thermal degradation, while Feed Rate counteracted it, and speed showed a nonlinear effect on heating. Avoidance of very high Temp, high F.Rate, and mid-speed were required to improve color. The opaque polycarbonate showed particle sizes dominated by 2 µm, with 230°C and 280°C giving 60–63% and 255°C slightly lower (60%). Most particles remained in the 1–3 µm range, confirming fine dispersion across Temps. The temperature rise from 230°C to 280°C caused a little toward smaller particles in the distribution, while 255°C produced a balanced mix. In conclusion, at 230°C, high viscosity led to larger agglomerates, whereas at 280°C, low viscosity enhanced shear mixing and the production of finer, more uniform particles. Thus, higher temperature decreases the viscosity, resulting in a smaller particle size and enabling optimal mixing and improved color uniformity in the PC matrix.
The model underwent experimental validation, achieving minimal ΔE* values of 1.14 at Run 20 and 1.15 at Run 14, so validating its reliability. Optimization forecasted dE* = 1.12–1.18 at approximately 230°C and a feed rate of 25–30, which was confirmed. Temperature is the primary component, while feed rate exerts a secondary yet interactive influence (A×C). The system is non-linear, attaining optimal color uniformity at low temperatures and moderate to high feed rates due to enhanced dispersion. Pigment dispersion and color responsiveness are both improved when the temperature is high enough to decrease viscosity and drive particle refining. The particles in all four characterization methods, PSD (1-2 µm), PSA (0.2-2.2 µm), SEM (100-200 nm), and DOM (1-3 µm), exhibit consistent fine dispersion, as seen by their matching particle size ranges. The methodological convergence shown confirms that controlling the temperature in opaque PC systems is the key to stable pigment formulation, robust rheological function, and high-quality color.
Author Contributions
JA in charge of the study's design, Conceptualization, Methodology. Performed the statistical analyses, Formal Analysis, Investigation, Resources, Data Curation, Writing – Review & Editing, and contributed to the interpretation of the results. I have read and agreed to the published version of the manuscript.
Funding
This research received no external funding.
Institutional Review Board Statement
Not applicable.
Informed Consent Statement
Not applicable.
Data Availability Statement
For the factory's secrecy and safety, I am not authorized to provide any information about the factory's identity or any experimental data supporting the presented results while conducting my research in the factory in Canada, Ontario.
Acknowledgments
The author is grateful to the Deanship of Research at Jadara University for providing financial support for this publication.
Conflicts of Interest
The author declares no conflict of interest.
References
- Markarian. North American compounders seek growth in innovation, Plastics Additives & Compounding May/June. 2006. [Google Scholar]
- Markarian, J. US compounding industry faces challenging times. Plast. Addit. Compd. 2008, 10, 38–41. [Google Scholar] [CrossRef]
- Spook, W.; Matcon Group Ltd. Lean compounding the key to survival, Plastics Additives & Compounding July/August (2008). August.
- Achilleos, E. C.; Hatzikiriakos, S. G. J. Vinyl Addit. Technol. 2002, 8(1), 7–24. [CrossRef]
- Charvat, R.A. (Ed.) Color as a Science. In Coloring of Plastics; John Wiley & Sons: Hoboken, NJ, USA, 2004. [Google Scholar]
- Sabic. Scattering, Absorption/Opacity, Transparency, and Translucency. Internal Scattering. Available online: https://www.sabicip.com/staticcxp/user/images/learnaboutcolor/transparency_and_translucency_1.jpg (accessed on 19 March 2014).
- Callister, W.D.; Rethwisch, D.G. The spectrum of electromagnetic radiation. In (Materials Science and Engineering): An Introduction, 7th edition.; John Wiley & Sons: Hoboken, NJ, USA, 2007. [Google Scholar]
- Judd, D.B.; Wyszeki, G. Color in Business, Science and Industry, 2nd ed.; John Wiley & Sons: Hoboken, NJ, USA, 1975. [Google Scholar]
- Bourennani, F.; Alsadi, J. Manufacturing Processing Improvements Using Business Intelligence. J. Inf. Technol. Rev. 2011, 2, 125–131. [Google Scholar]
- Bourennani, F.; Alsadi, J. Decision Tree Classifier )for Analysis of Parameters Association Causing Polymer Color-Mismatch. In Proceedings of the Annual Technical Conference of the Society of Plastics Engineers (ANTEC)Conference (Orlando, FL, USA, 2–4 April 2012. [Google Scholar]
- Braha, D.; Shmilovici, A. Data mining for improving a cleaning process in the semi-conductor industry. IEEE Trans. Semicond. Manuf. 2012, 15, 91–101. [Google Scholar]
- Kuo, C.F.J.; Huang, Y.J. Computerized Color- Distinguishing System for Color-Printed Fabric by Using the Approach of Probabilistic( Neural Network). NN. Polym.-Plast. Technol. Eng. 2008, 47, 264–272. [Google Scholar] [CrossRef]
- Saeed, U.; Alsadi, J. Neural Network(NN): A potential approach for error reduction in color values of polycarbonate. J. Adv. Polym. Technol. 2013, 33, 21402. [Google Scholar] [CrossRef]
- Saeed, U.; Alsadi, J. Polymer Color Properties: Neural Network Modelling. Adv. Polym. Technol. 2014. [Google Scholar] [CrossRef]
- Mulholland, B.M. Effect of (Additives on the Color) - Appearance of Plastics. In SPE ANTEC; Ticona Engineering Polymers: Irving, TX, USA, 2007. [Google Scholar]
- Markarian, J. North American compounders seek growth in innovation. Plast. Addit. Compd. 2006, 8, 42–44. [Google Scholar] [CrossRef]
- Abrams, R.; Ali, M. Coloring plastics: Fundamentals and trends. Plast. Addit. Compd. 2001, 3, 18–25. [Google Scholar] [CrossRef]
- Hunterlab. Observer. The Basics of Color Perception and Measurement, 2001. Available online: https://www.hunterlab.com/media/documents/basics-of-color-theory.pdf (accessed on 17 February 2015).
- Rwei, S.P. Distributive Mixing in a Single-Screw Extruder—Evaluation in the Flow Direction. Polym. Eng. Sci. 2001, 41, 1665–1673. [Google Scholar] [CrossRef]
- Kimura, K. Distributive Mixing Characteristics of (a Dulmage-Type Screw) For (A Single-Screw Extruder): Experimental and Numerical Evaluation. Chem. Eng. J. Adv. 2021, 7, 100137. [Google Scholar] [CrossRef]
- Wong, A.Y.; Liu, T. Screw -Configuration (Effects on the Color -Mixing Characteristics of Polymer) in Single-Screw Extrusion. In Technical Papers of the Annual Technical Conference-Society of Plastics Engineers Incorporated; Society of Plastics Engineers Inc.: Danbury, CT, USA, 1988. [Google Scholar]
- Wong, A.Y.; Lam, Y.; Wong, A.C.M. Quantification of dynamic mixing performance of single screws of different configurations by visualization and image analysis. Adv. Polym. Technol. 2009, 28, 1–15. [Google Scholar] [CrossRef]
- Duce, C. Alkyd artists’ paints: Do pigments affect the stability of the resin? A TG and DSC study on fast-drying oil colors. Polym. Degrad. Stab. 2014, 105, 4858. [Google Scholar] [CrossRef]
- Wong, A.Y.; Lam, Y. Visualization study on the dynamic mixing quality during single-screw extrusion. J. Polym. Res. 2008, 15, 11–19. [Google Scholar] [CrossRef]
- Sanchez, P.; Remiro, P.M.; Nazabal, J. Physical properties and structure of unreacted (PC/PBT blends). J. Appl. Polym. Sci. 1993, 50, 995–1005. [Google Scholar]
- Liang, R.F.; Gupta, R.K. Society of Plastic Engineering. In Proceedings of the ANTEC, Orlando, FL, USA, 7–11 May 2000. [Google Scholar]
- Lee, S.; Mather, P.T.; Pearson, D.S. Phase behavior and rheology of blends containing polycarbonate and a thermotropic polyester. J. Appl. Polym. Sci. 1996, 59, 243–250. [Google Scholar] [CrossRef]
- Rauwendaal, C. Polymer Mixing, A Self-Study Guide; Hanser Publishers: Munich, Germany, 1998. [Google Scholar]
- Alemaskin, K.; Manas-Zloczower, I.; Kaufman, M. Color Mixing in Single Screw Extruder: Simulation & Experimental Validation. In Proceedings of the Annual Technical Conference-ANTEC, Conference Proceedings, Boston, MA, USA, January 2005. [Google Scholar]
- Mudalamane, R.; Niedenzu, P.; Sedar, W. Impact of (Titanium Dioxide Surface Characteristics) on Extrusion Processing. In Proceedings of the SPE ANTEC, Wilmington, DE, USA, 5–6 October 2004. [Google Scholar]
- Alsadi, J. Processing issues of color-mismatch: Rheological characterization of polycarbonate blends. Polym. Eng. Sci. 2015, 55, 1994–2001. [Google Scholar]
- Alsadi, J.A.; et al. Designing Experiments: Three-Level Full Factorial Design and Variation of Processing Parameters Methods for Polymer Colors. Adv. Sci. Technol. Eng. Syst. J. 2018, 3, 109–115. [Google Scholar]
- Alsadi, J.; et al. Exploring the Impact of Pigment Dilution Ratios on Processing Parameters in Plastic Compounding: Design of Experiments (DOE), Publication Year: 2024, Page(s):91 – 96, 2024 IEEE (MCSoC)-2024; IEEE: Kuala Lumpur, Malaysia, 03 January 2025. [Google Scholar] [CrossRef]
- Al Sadi, J.; et al. Simulating Polycarbonate Processing Interactions: A Comparative Study of RSM Design Techniques, IEEE International Conference on Mechatronics and Automation-IEEE ICMA 2025, August 3 -6, 2025, Beijing, China. [CrossRef]
- Alsadi, J.A.; et al. Process parameters, Investigation of the effects of Formulation.Dispersions, and Rheology on using combined Modelling and experimental Simulations. Mater. Today 2019, 13, 530–540. [Google Scholar] [CrossRef]
- Gálvez, J. Effect of Extrusion Screw Speed and Plasticizer Proportions on the Rheological, Thermal, Mechanical, Morphological and Superficial Properties of PLA. Polymers;MDPI-Polymers 2020, 12(9), 2111. [Google Scholar] [CrossRef] [PubMed]
- Neo, P.K. Development of a Machine Learning Model to Predict the Color of Extruded Thermoplastic Resins. -Polymers 2024, 16, 481. [Google Scholar] [CrossRef] [PubMed]
- Mysiukiewicz, O.; Barczewski, M.; Skórczewska, K.; Matykiewicz, D. Correlation between Processing Parameters and Degradation of Different Polylactide Grades during Twin-Screw Extrusion. Polymers 2020, 12(6), 1333. [Google Scholar] [CrossRef] [PubMed]
- Alsadi, J.; et al. Experimental Assessment of Pigment Dispersion in Compounding of Plastics: Rheological Characterization at the Crossover Points. Mater. Today Proc. 2021, 45, 7344–7351. [Google Scholar] [CrossRef]
- Alsadi, J.; et al. Study on the effect of dispersion and processing parameters in the microscopically evaluated color of plastic grade. J. Am. Inst. Phys. 2019, 2139, 110007. [Google Scholar]
- Alsadi, J. Systematic review: Impact of Processing Parameters on Dispersion of Polycarbonate Composites, and Pigment Characterized by Different techniques. Mater. Today Proc. 2020, 27, 3254–3264. [Google Scholar] [CrossRef]
- Alsadi, J.; et al. Box–Behnken Design for Polycarbonate-Pigment Blending: Applications and Characterization Techniques. Polymers 2022, 14(22), 4860. [Google Scholar] [CrossRef] [PubMed]
- Alsadi, J.; et al. Evaluating Processing Parameter Effects on Polymer Grades and Plastic Coloring: Insights from Experimental Design and Characterization Studies. https://doi.org/10.3390/polym16233409Polymers-MDPI-Accepted on 29 November published 3-Dec-2024, Quartile index-Q1. Polym. Compos. Nanocomposites-MDPI-Polym. 2024, 16(23), 3409, 2024. [Google Scholar] [CrossRef]
- Alsadi, J.; et al. Optimization of Execution Microscopic Extrusion Parameter Characterizations for Color Polycarbonate Grading: General Trend and Box–Behnken Designs. Appl. Sci. 2024, 14(11), 4848. [Google Scholar] [CrossRef]
- AlSadi, J. Optimization and Simulation of Extrusion Parameters in Polymer Compounding: A Comparative Study Using BBD and 3LFFD. Polymers 2025, 17(13), 1719. [Google Scholar] [CrossRef] [PubMed]
- Al Sadi. J, Data-Driven Modeling and Simulation for Optimizing Color in Polycarbonate: The Dominant Role of Processing Speed on Pigment Dispersion and Rheology. MDPI-Materials 2026, 19(2), 366. [Google Scholar] [CrossRef] [PubMed]
- Plantz, P. E. Pigment Particle Size Using Microtrac Laser Technology," SL-AN-30 Revision A, 2009. Available online: www.microtrac.com (accessed on 28 March 2026).
- Wang, M.; Shen, J.; Thomas, J.C.; Mu, T.; Liu, W.; Wang, Y.; Pan, J.; Wang, Q.; Liu, K. Particle Size Measurement Using Dynamic Light Scattering at Ultra-Low Concentration Accounting for Particle Number Fluctuations. Materials 2021, 14(19), 5683. [Google Scholar] [CrossRef] [PubMed]
- Anderson, M.J.; Whitcomb, P.J. RSM Simplified: Optimizing Processes Using Response Surface Methods for Design of Experiments; CRC Press: New York, NY, USA, 2005. [Google Scholar]
- Yu, M.C.; Bisell, M.A.; Whitehouse, R.S. The Effect of Carbon Black Dispersion on Polymer Performance. In Proceedings of the Society of Plastics Engineers Annual Technical Conference, Boston, MA, USA, 7–11 May 1995; pp. 3246–3250. [Google Scholar]
- Mangesana, N.; Chikuku, R.; Mainza, A. The effect of particle sizes and solids concentration on the rheology of silica sand based suspensions. J. South Afr. Inst. Min. Metall. SAIMM 2008, vol. 108(no. 4), 237–243. [Google Scholar]
- Xu, Z.; Hou; Li, T. Novel Sample Preparation Method of Polymer Emulsion for SEM Observation. Microsc. Res. Tech. 2007, vol. 70, 847–850. [Google Scholar] [CrossRef]
Figure 1.
Representing 2009 modification of the lots’ percentage.
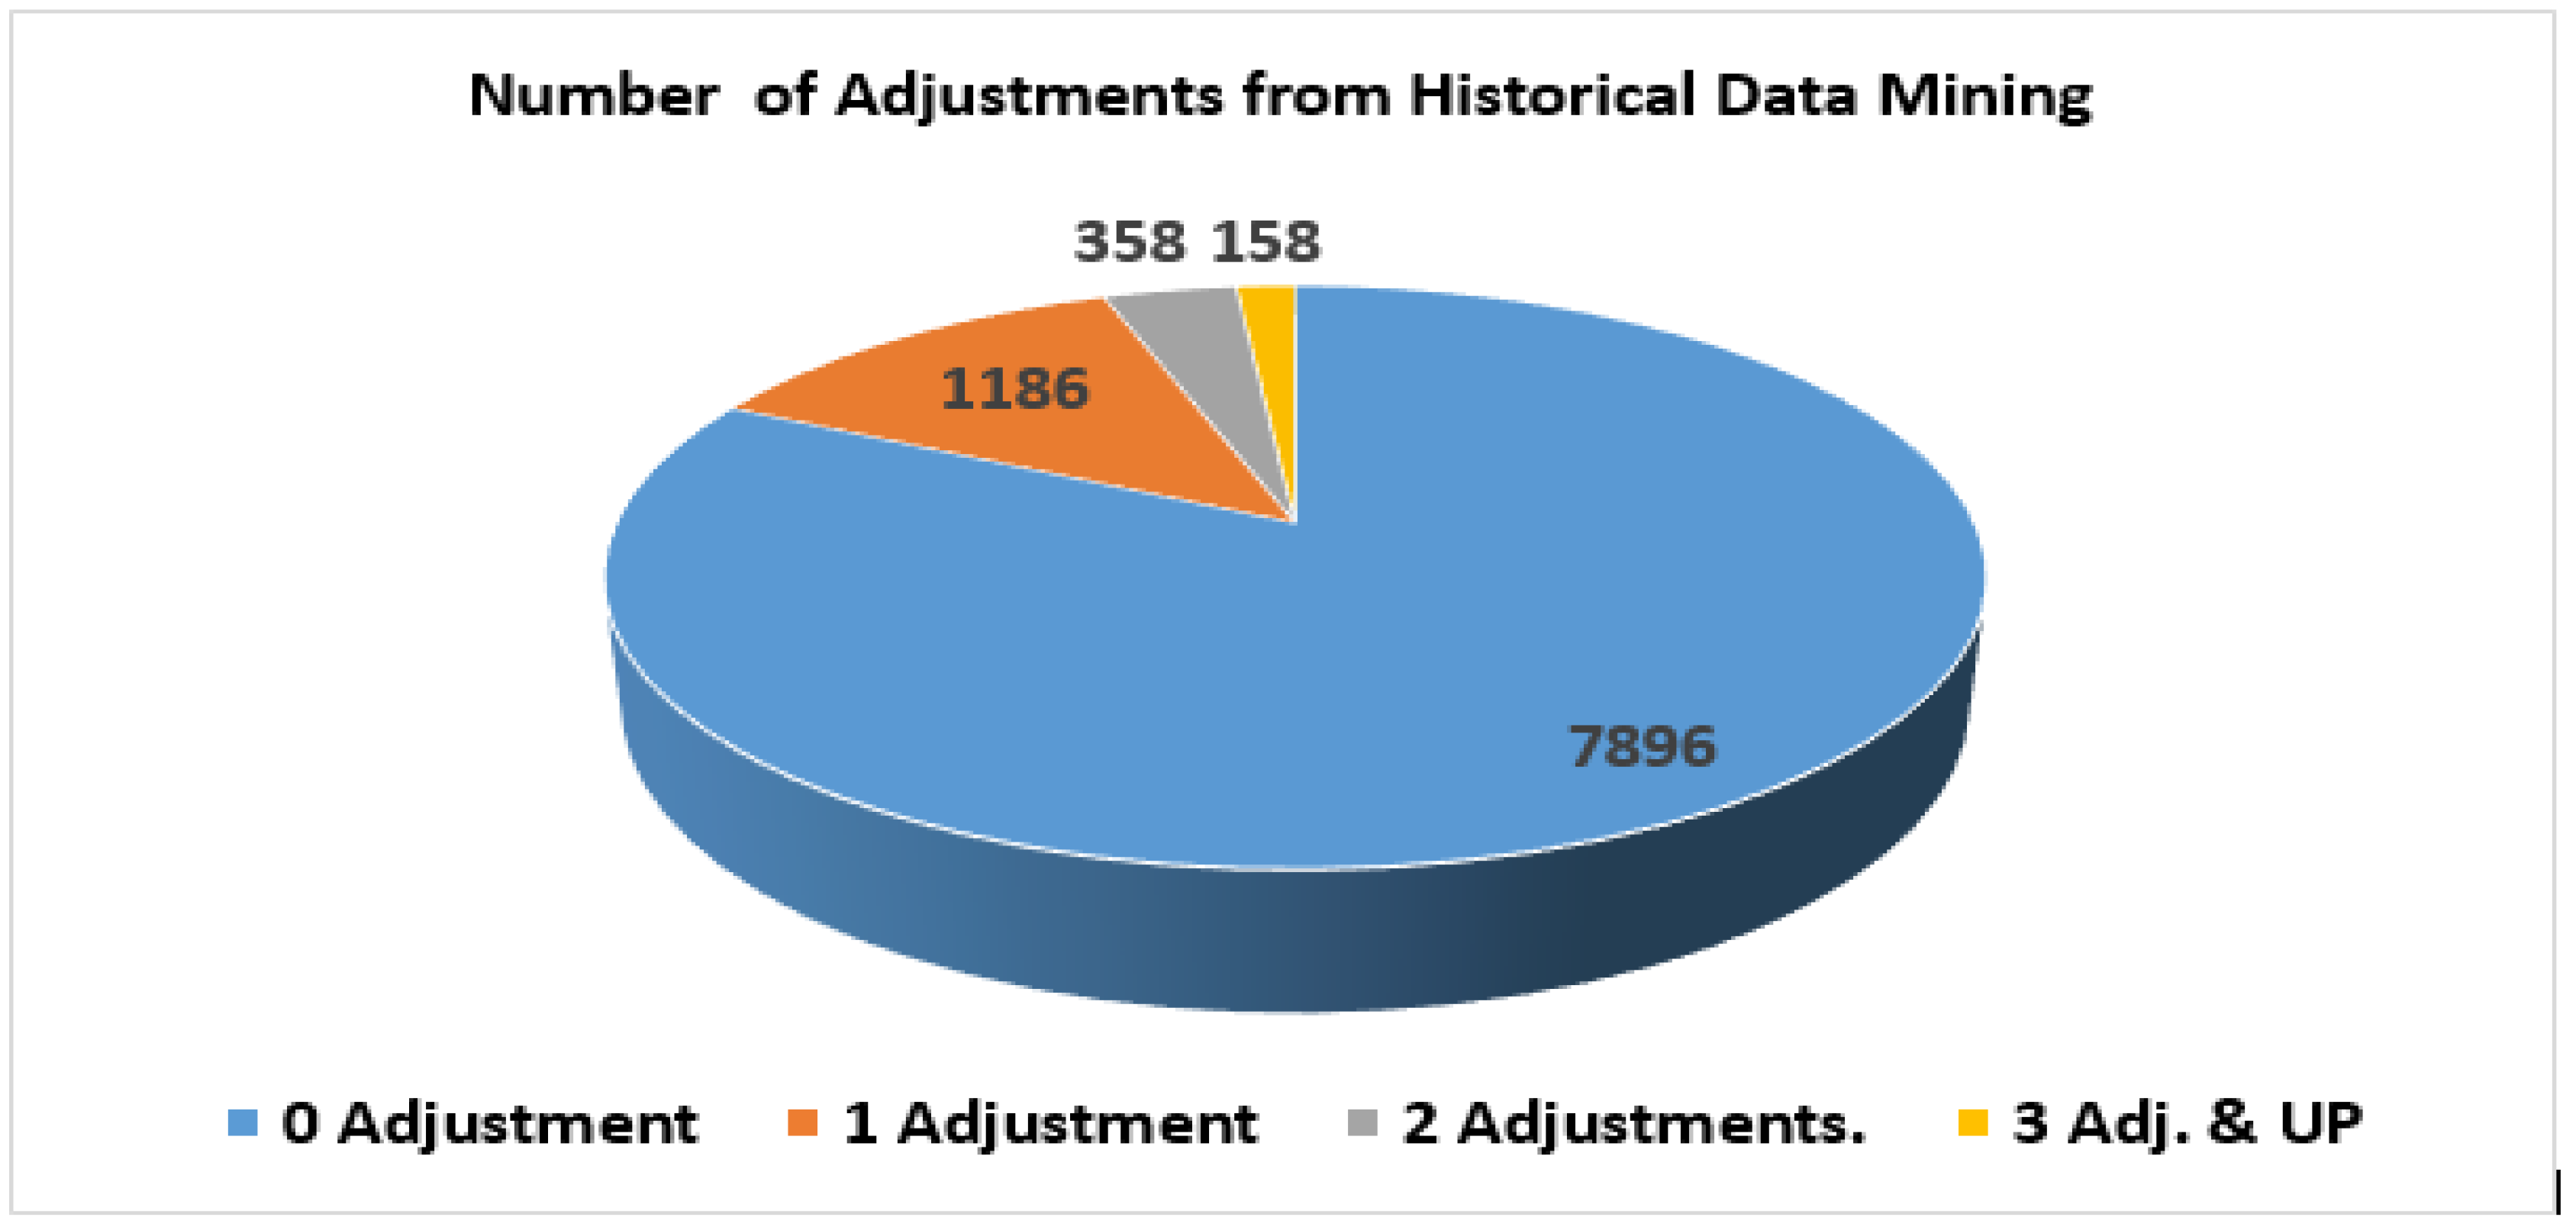
Figure 2.
Different Grades adjusted had different colors during 2009/2010.
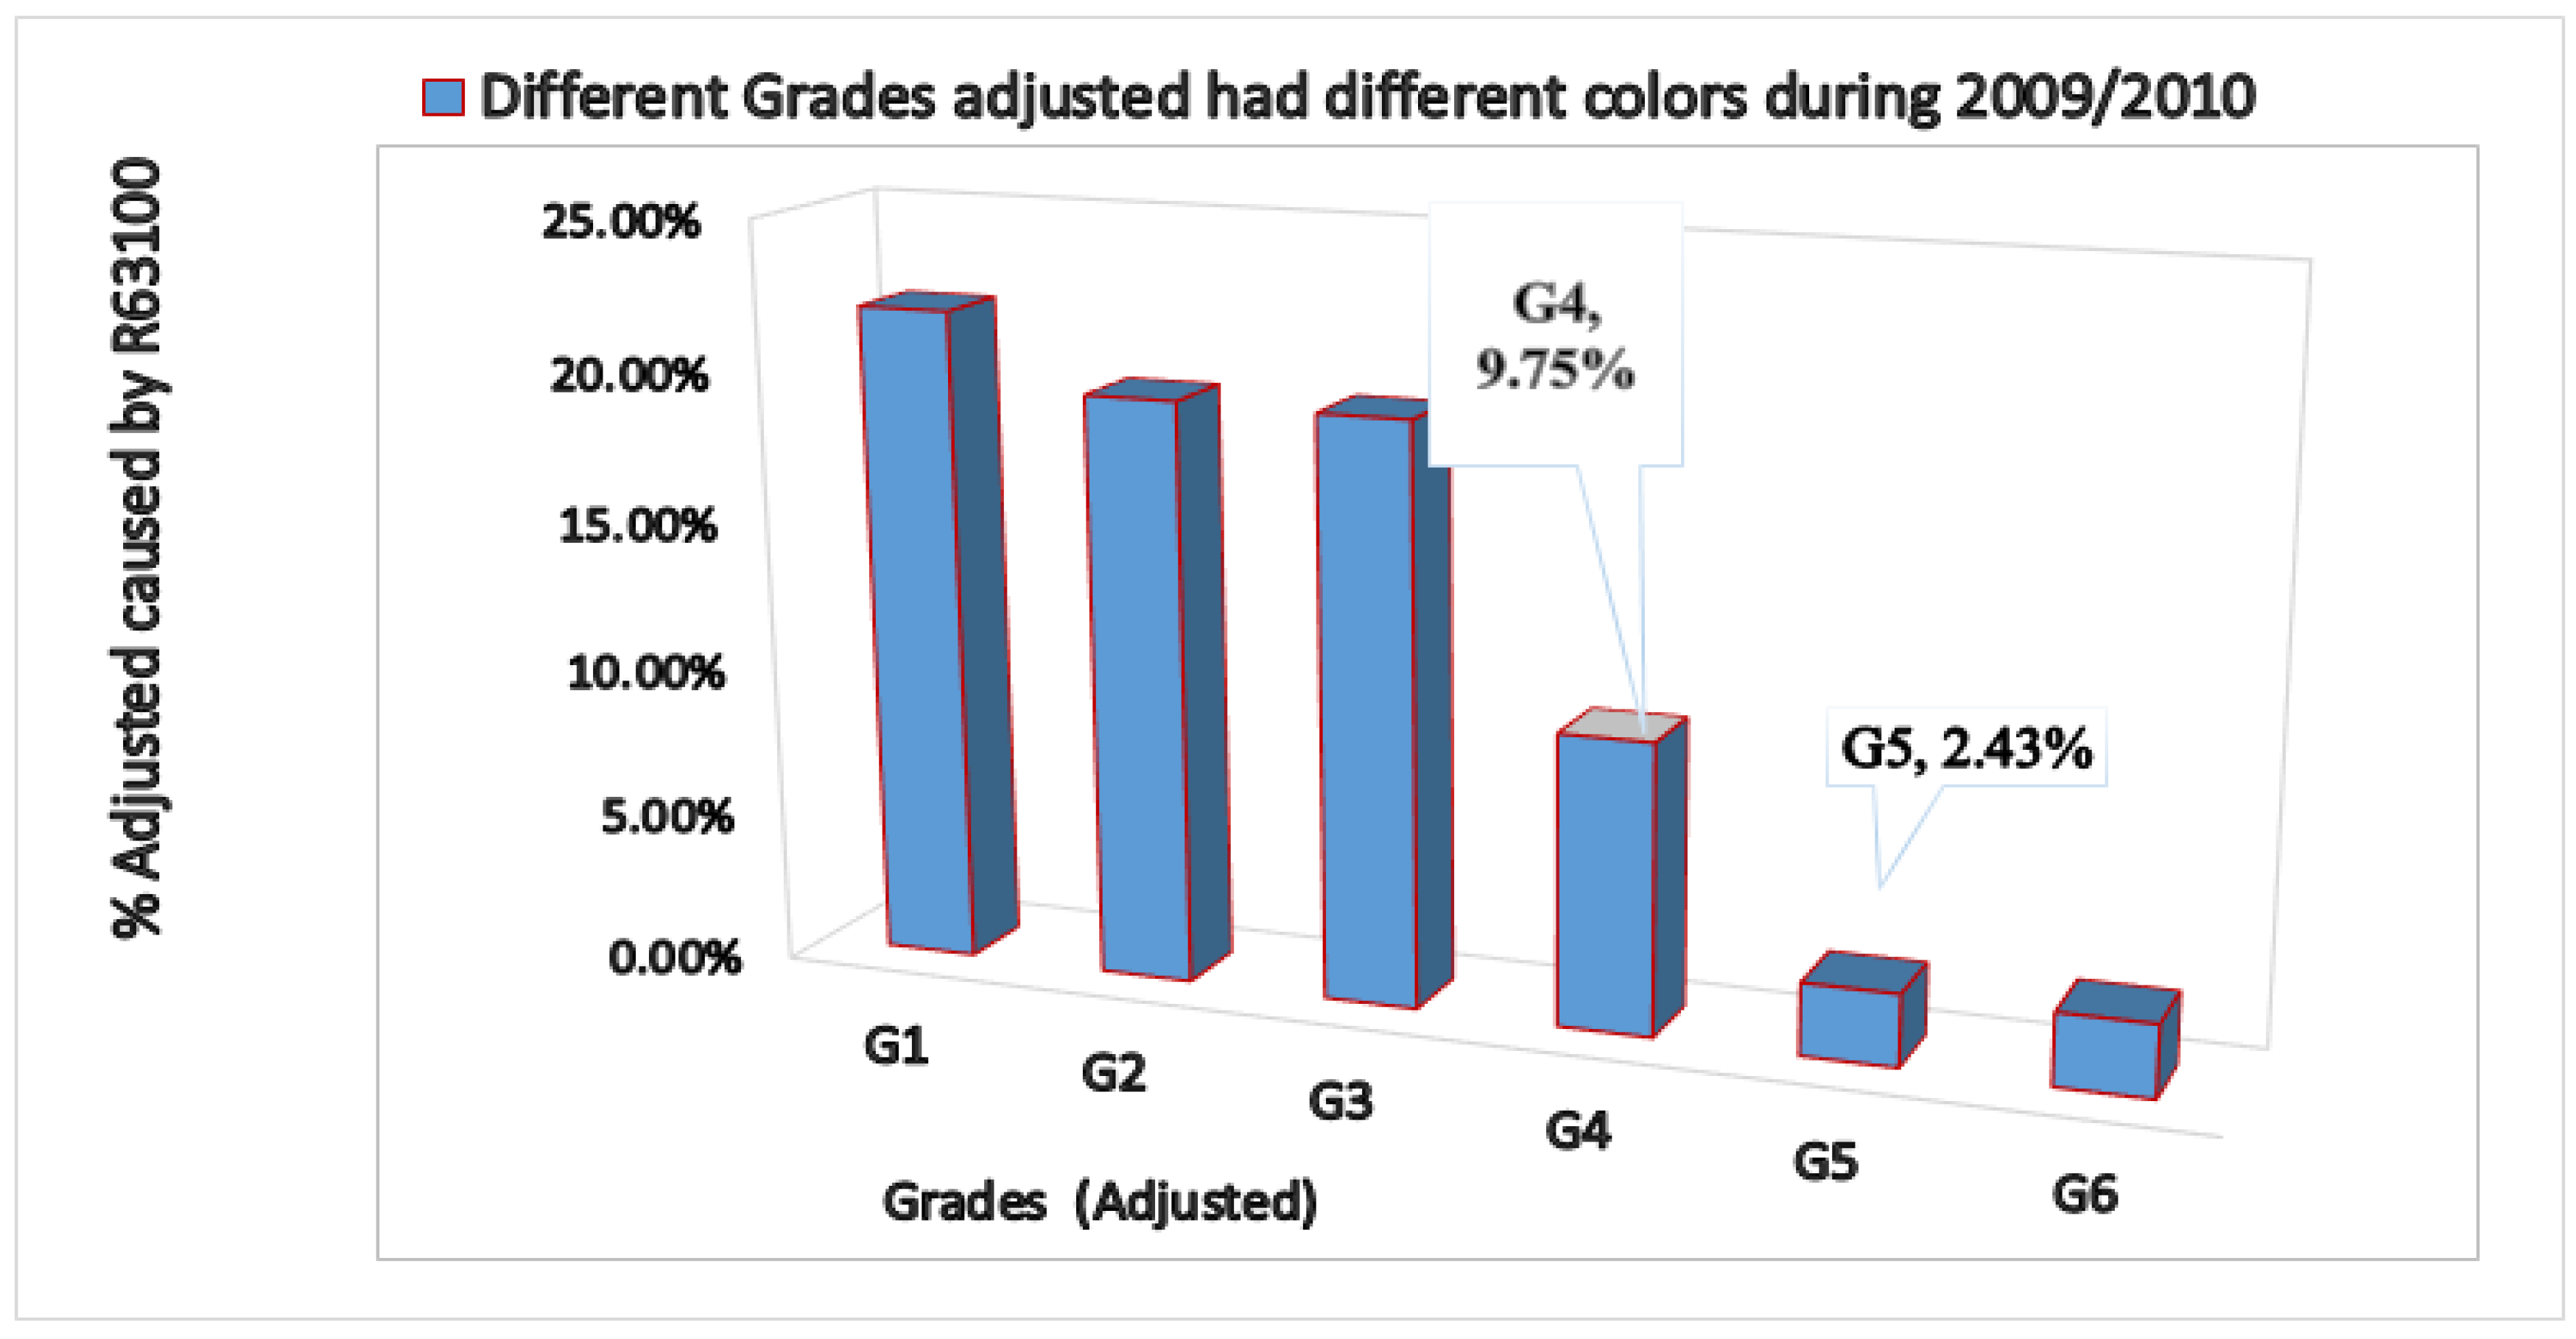
Figure 3.
Impact of T on color output (dE*).
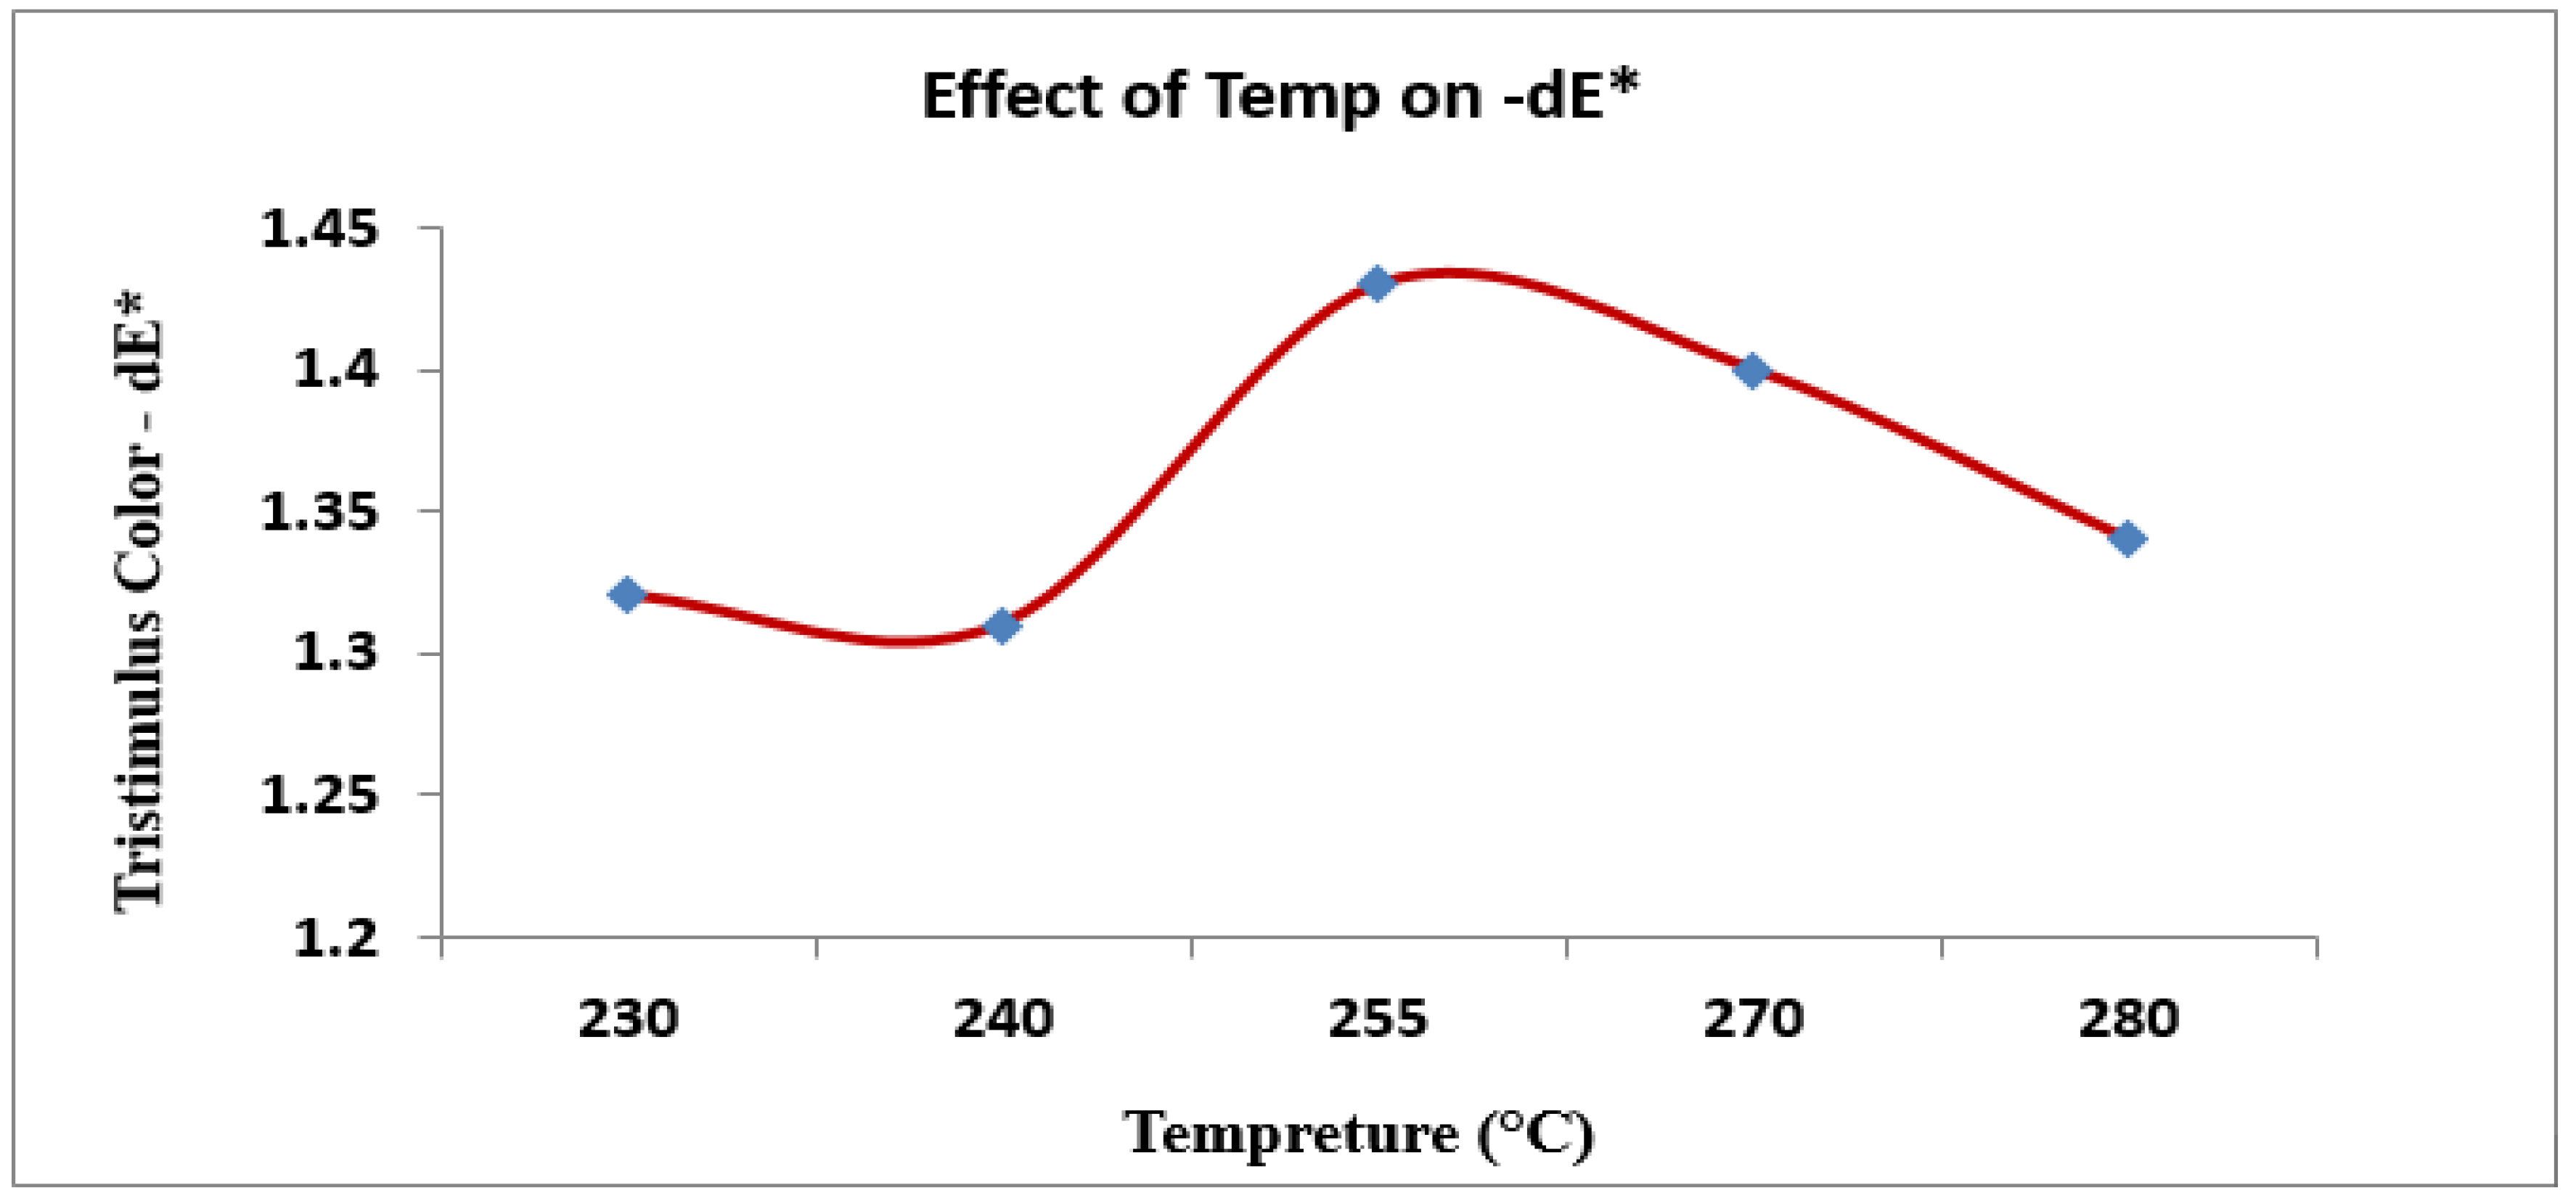
Figure 4.
Impact of Ts on Tristimulus (color- lightness (L*).
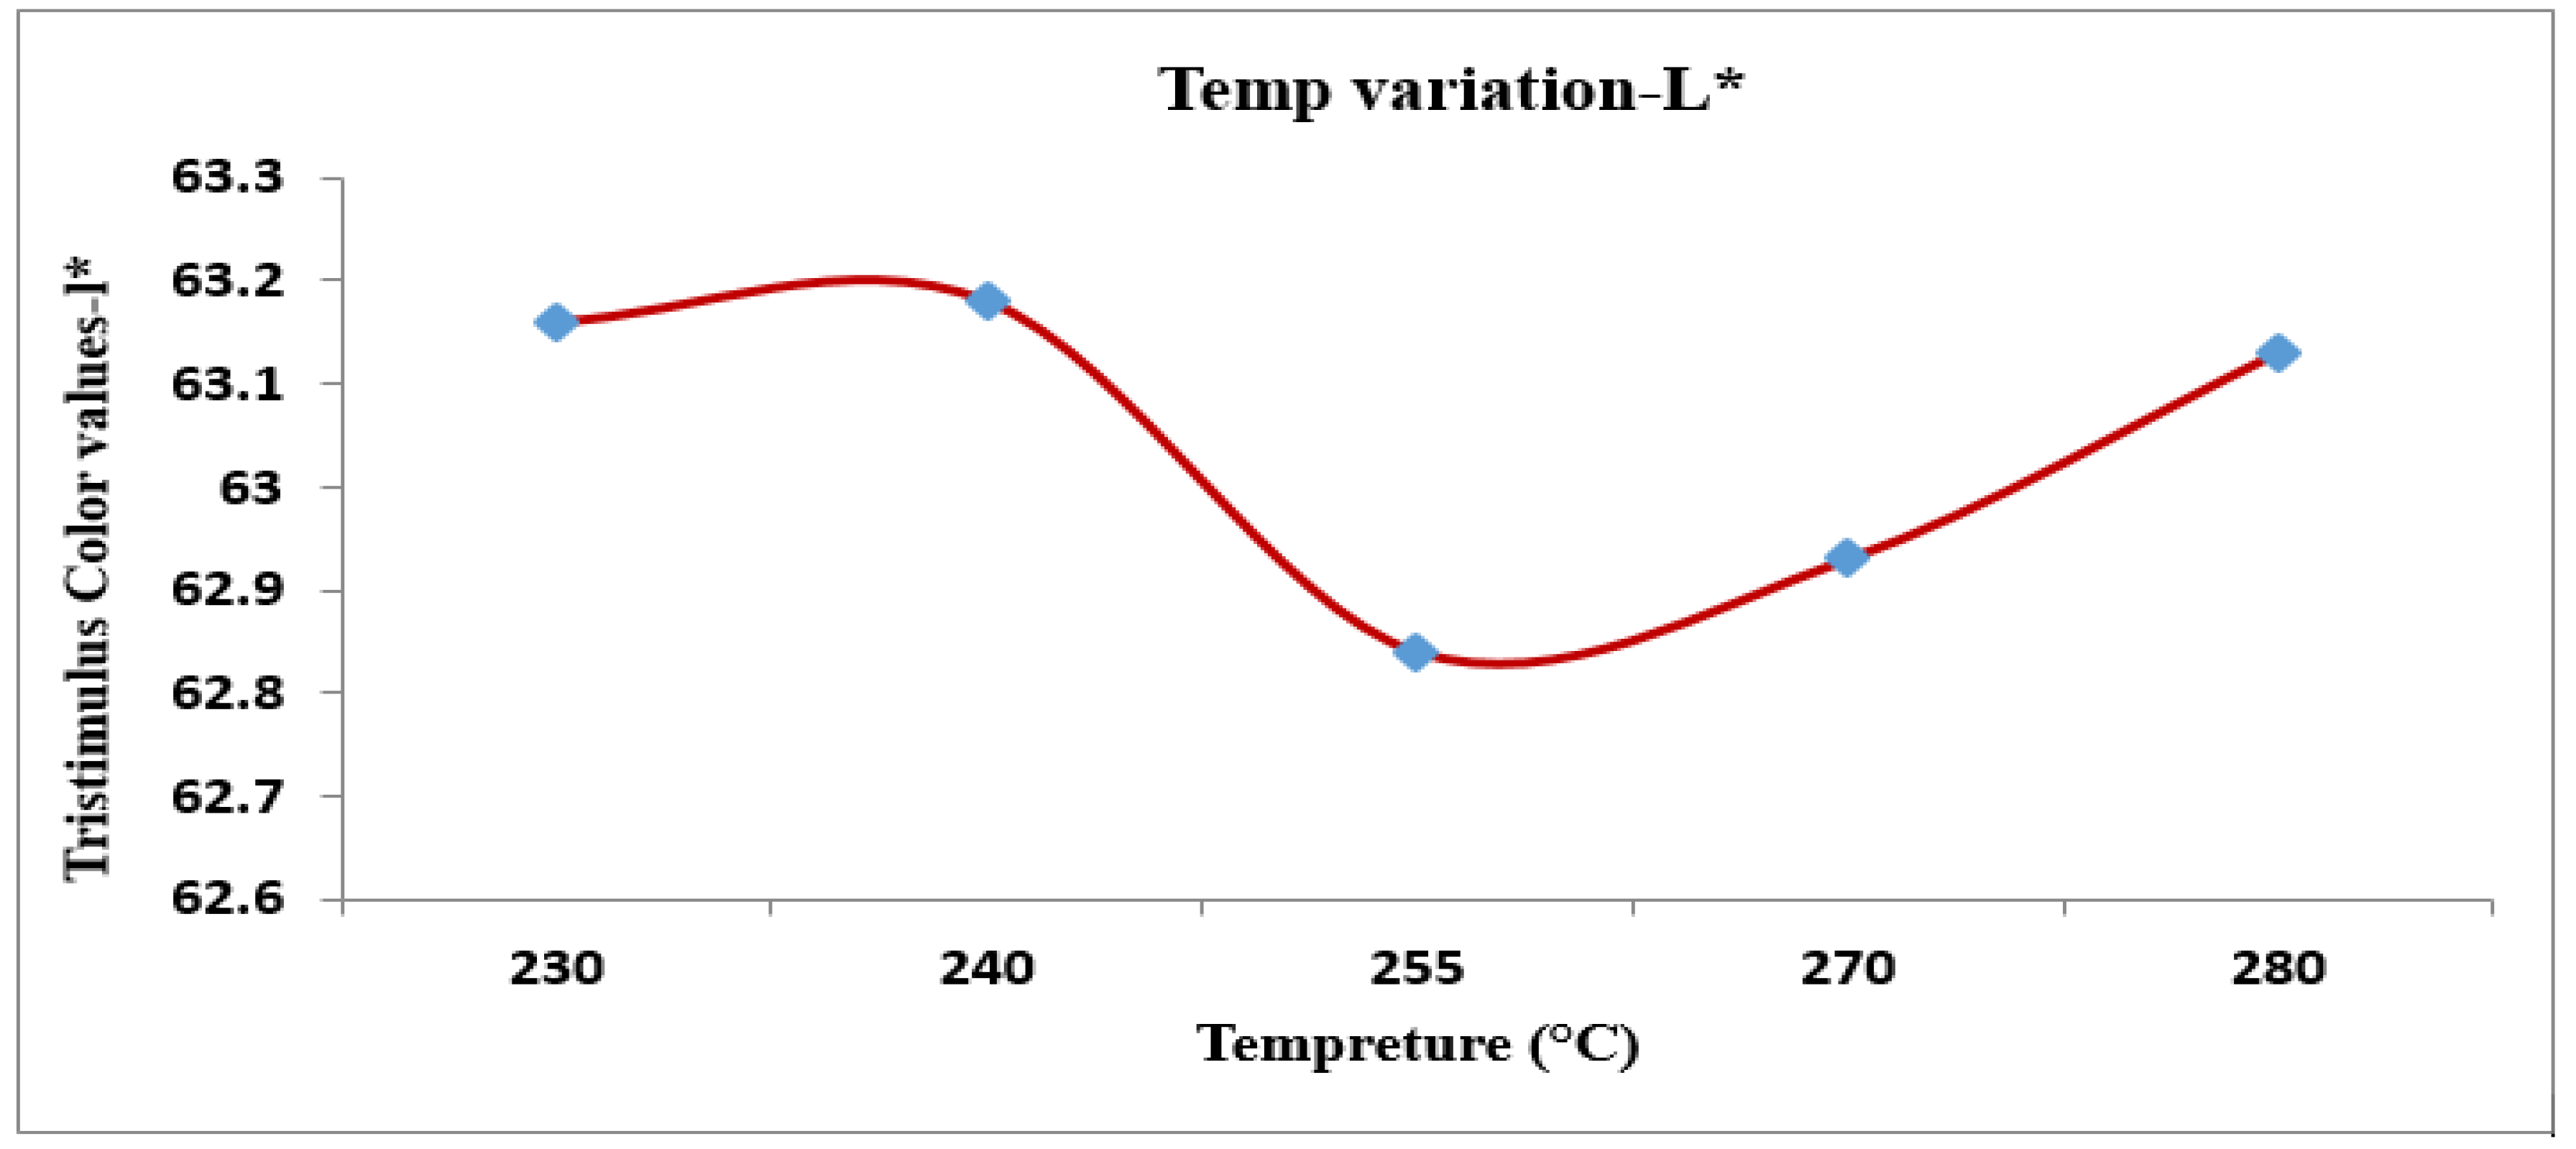
Figure 5.
Impact of Temps- on Tristimulus color Redness-Greenish-(a*).
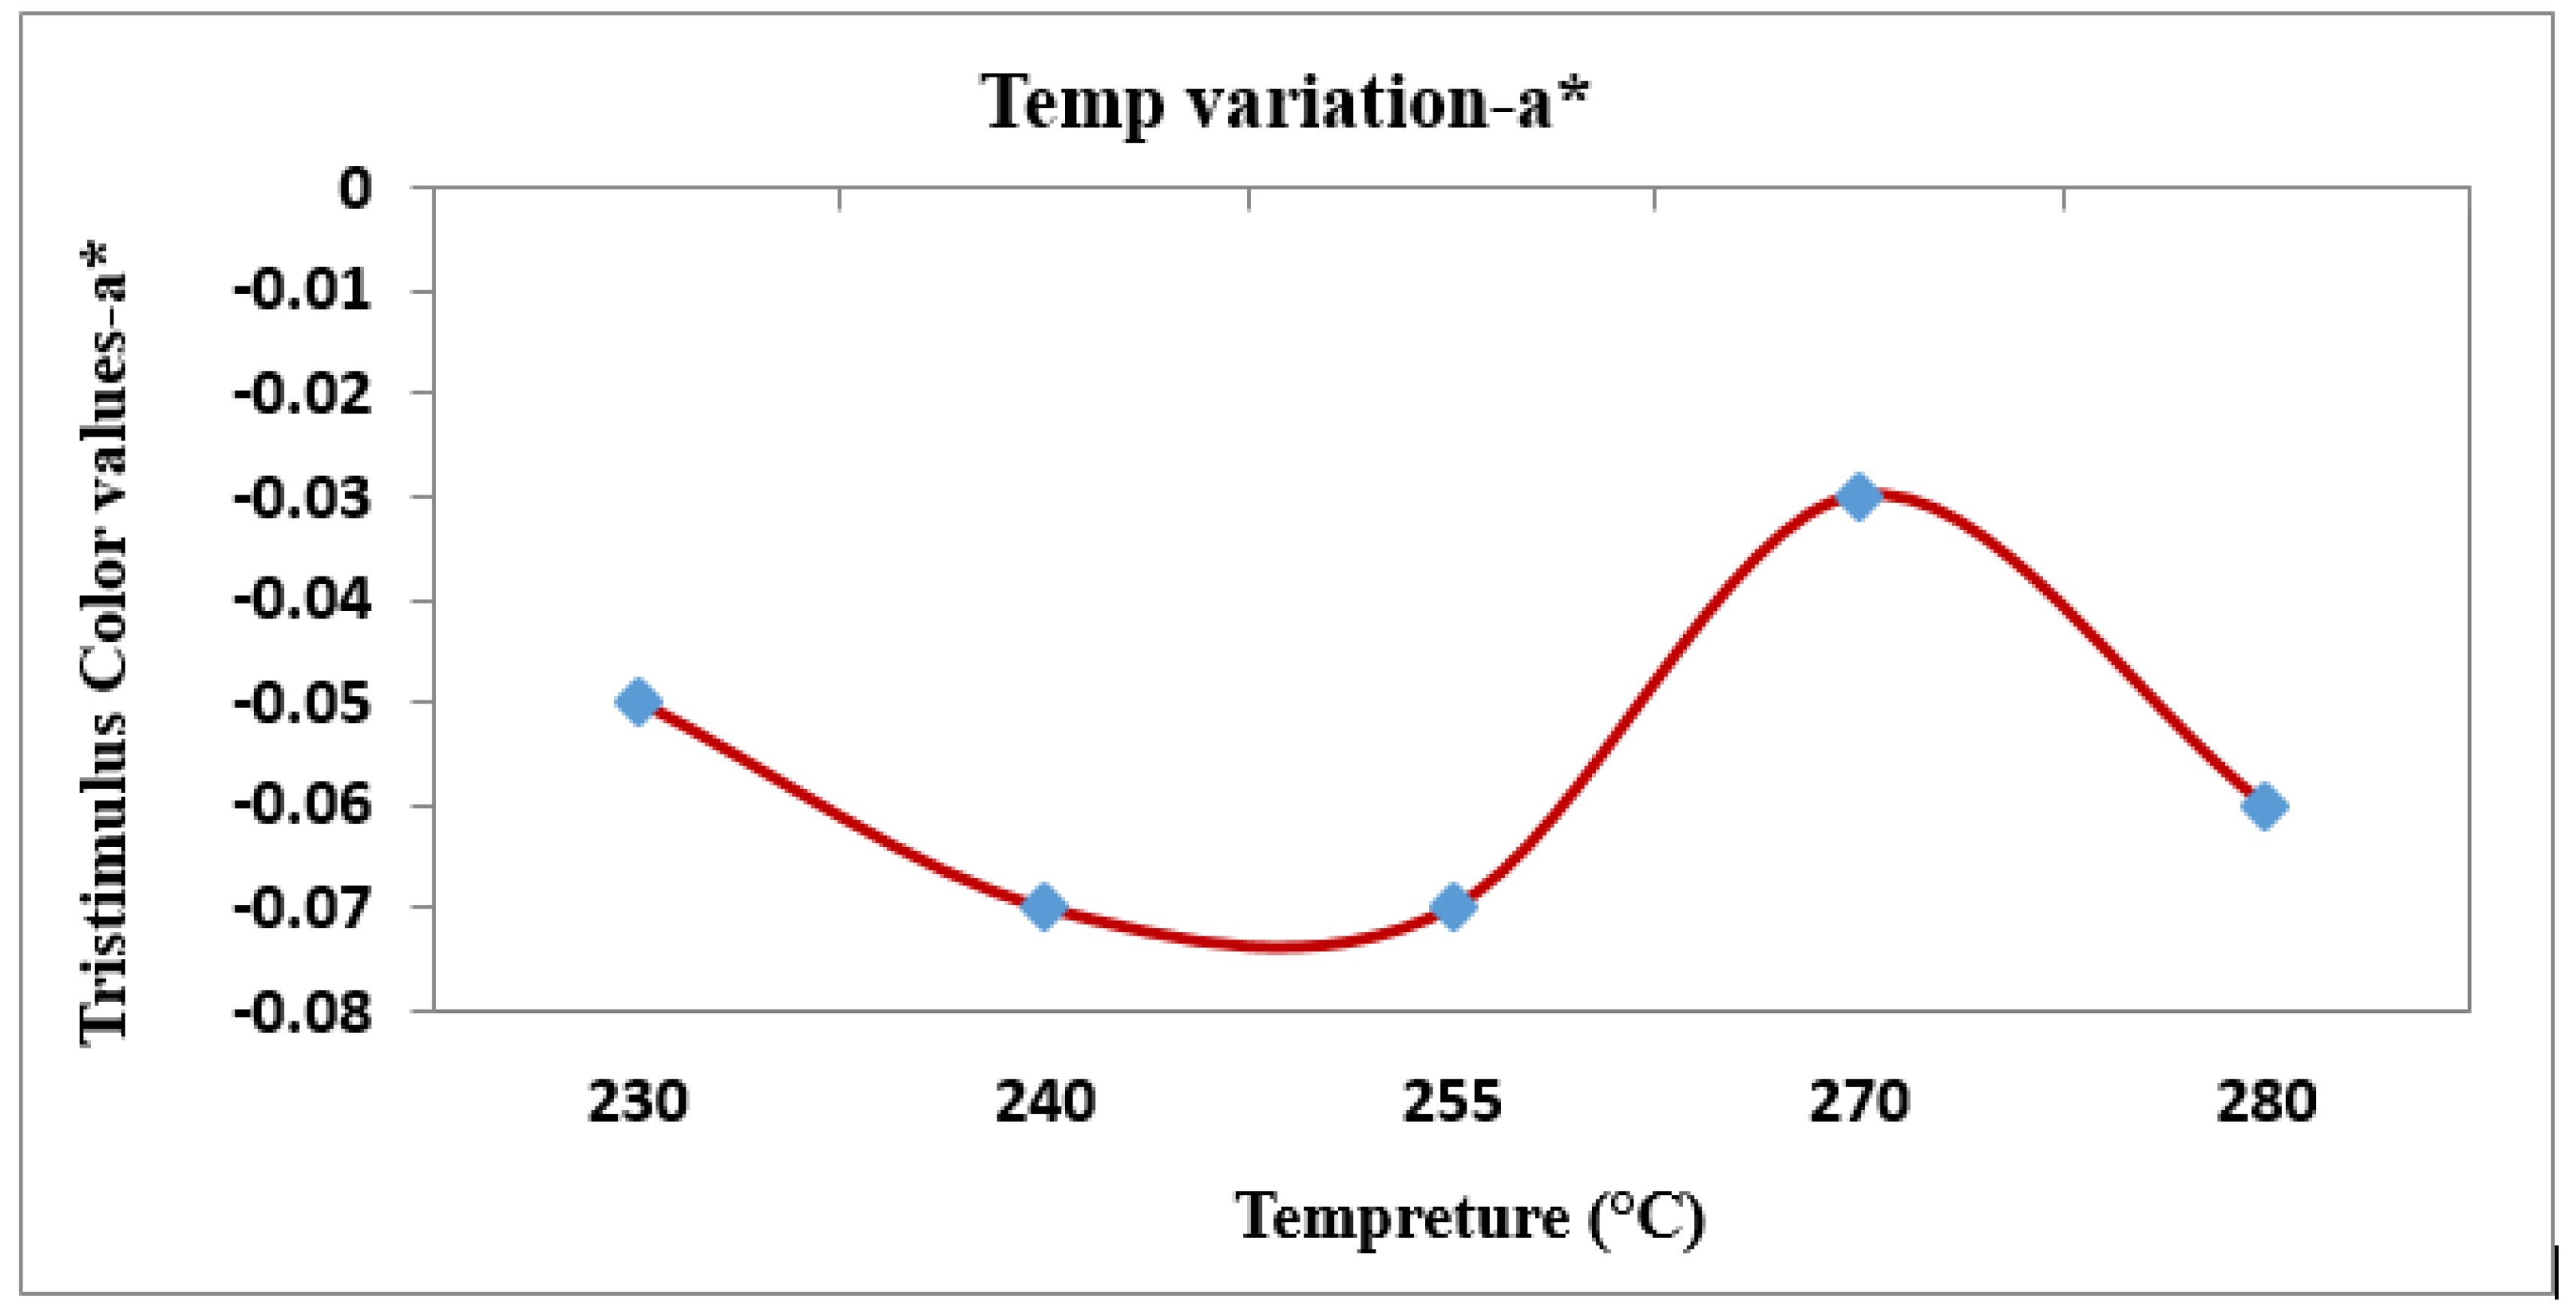
Figure 6.
Temps’ impact (Yellowish bluish color on b*).
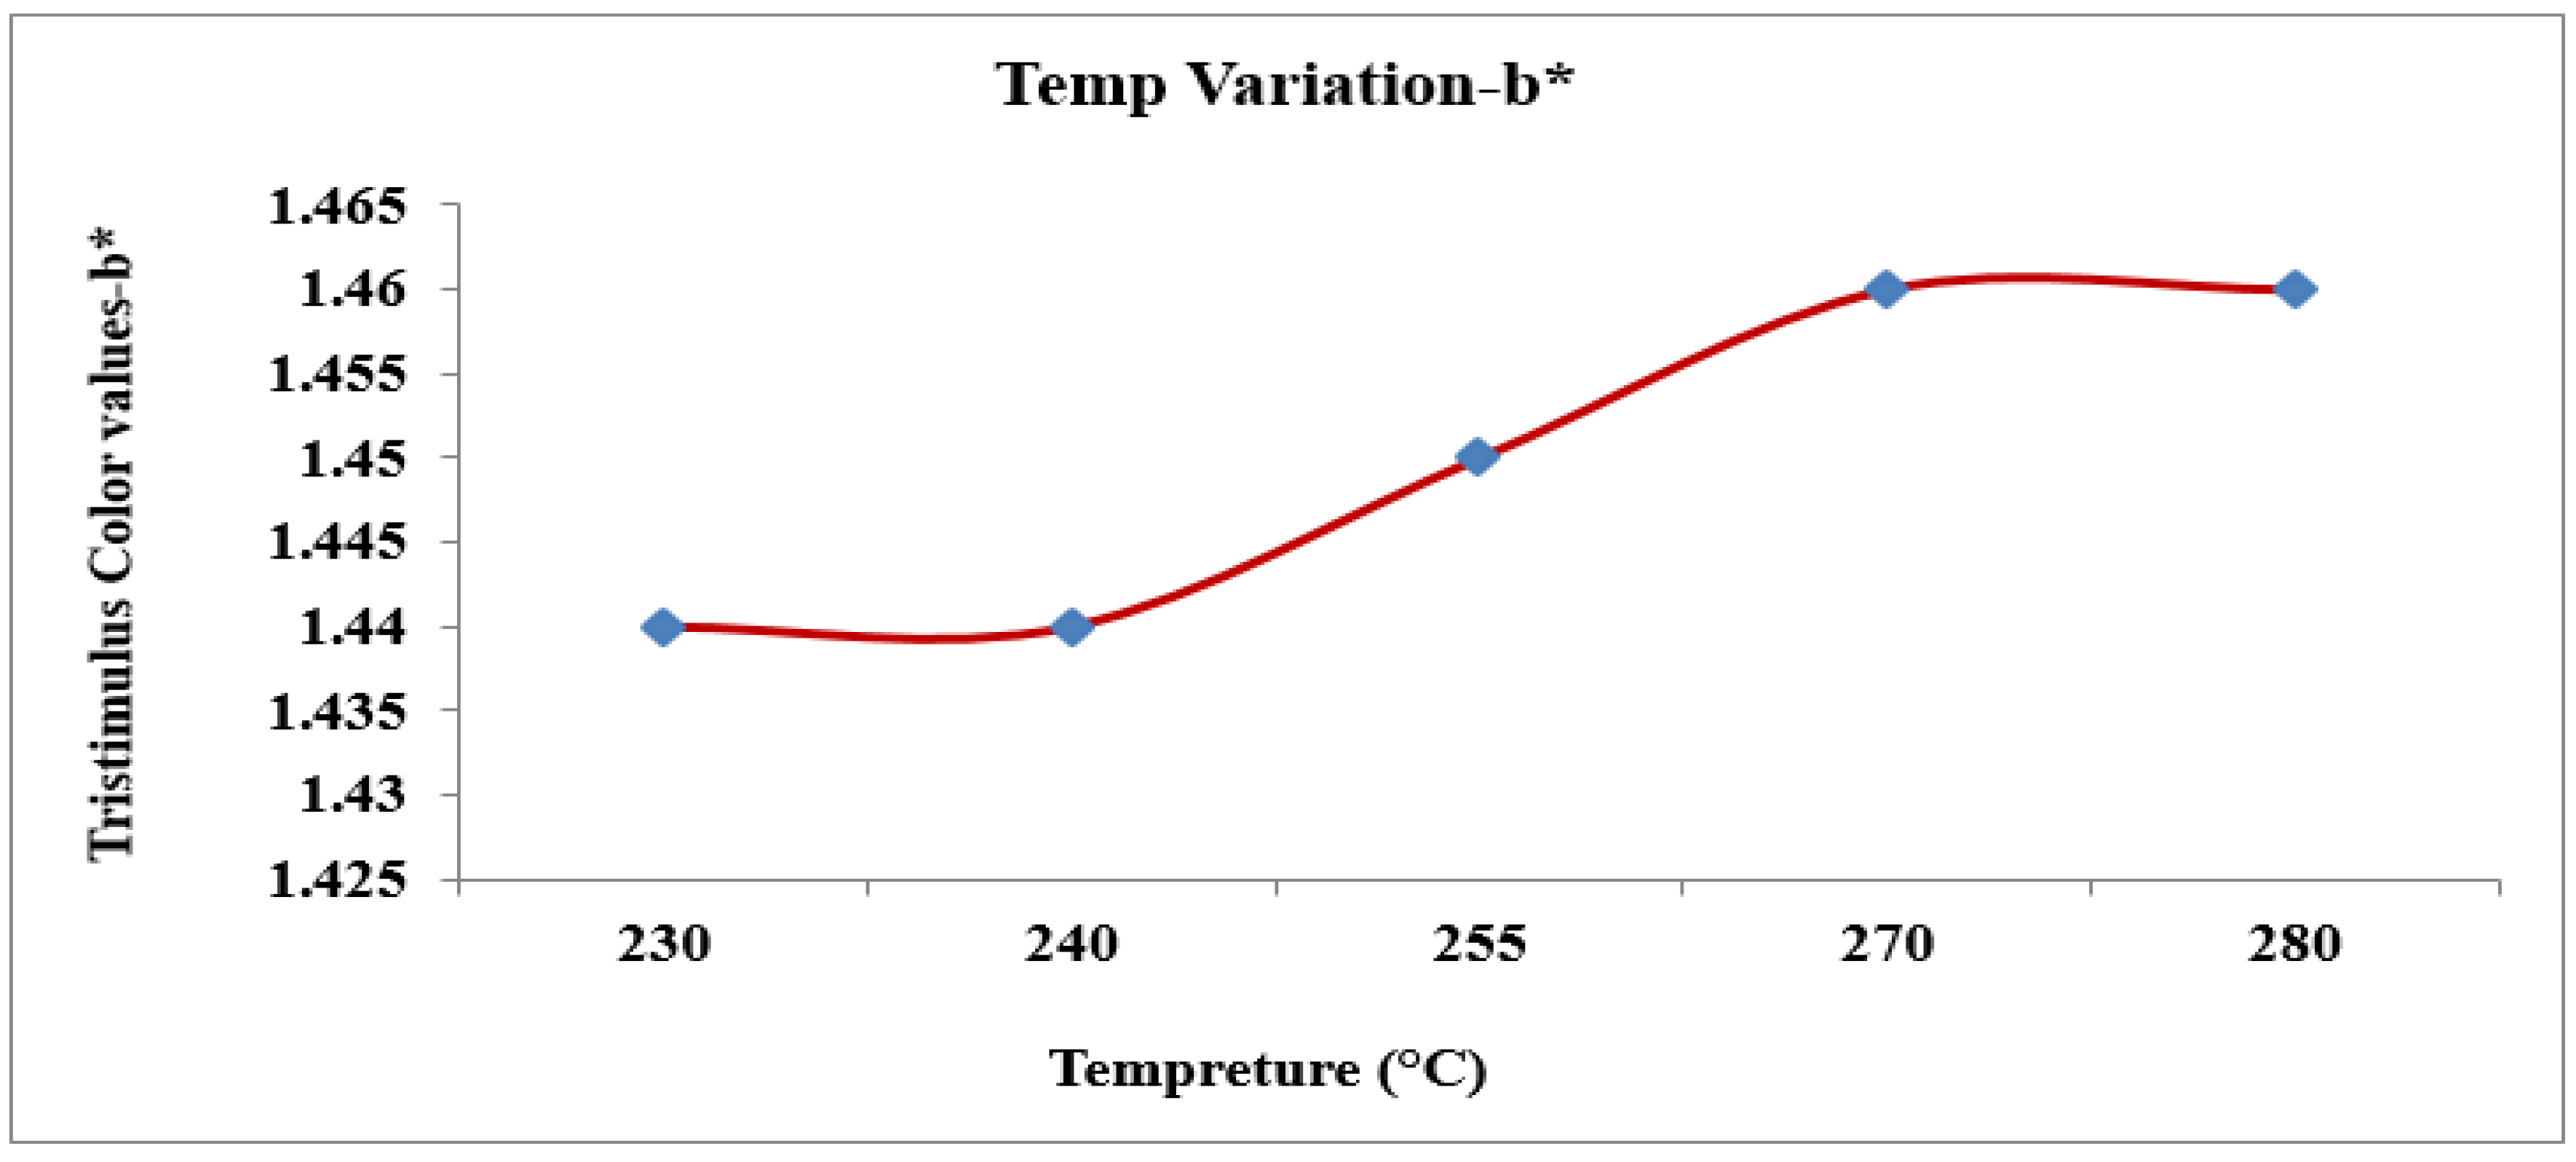
Figure 7.
Impact of Temperature (T) on Tristimulus Color Values.
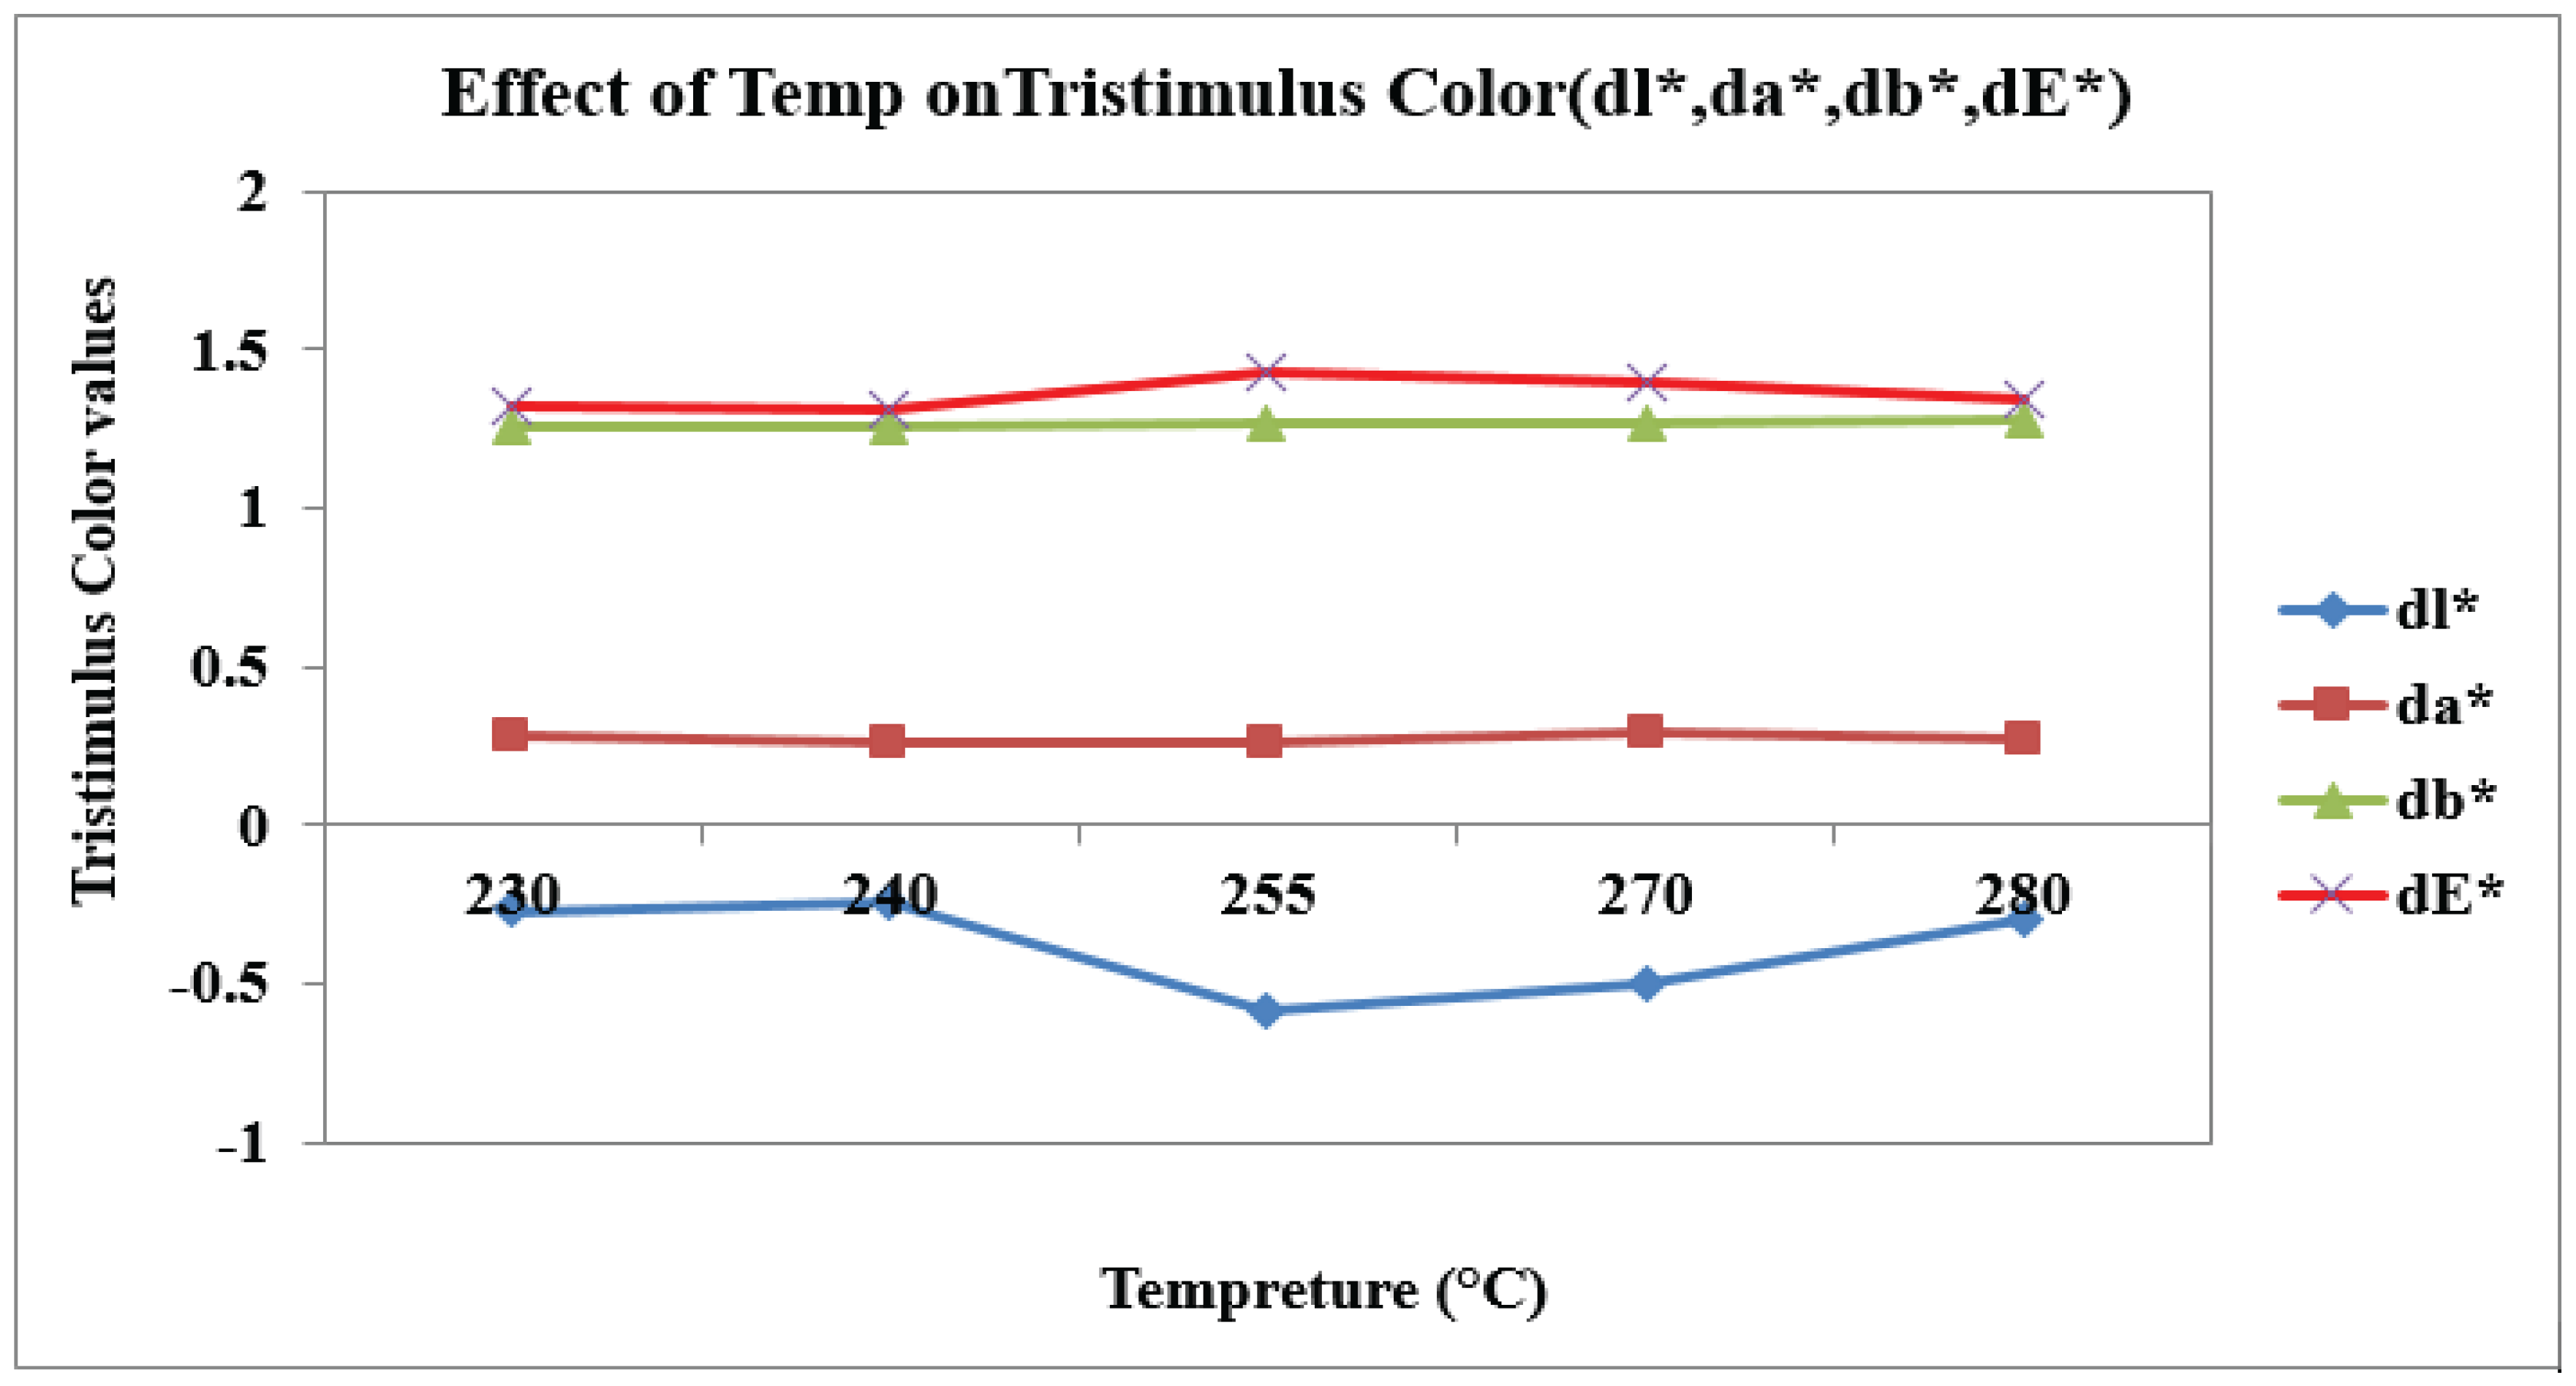
Figure 8.
Effect of PPs on Tristimulus Color(db*).
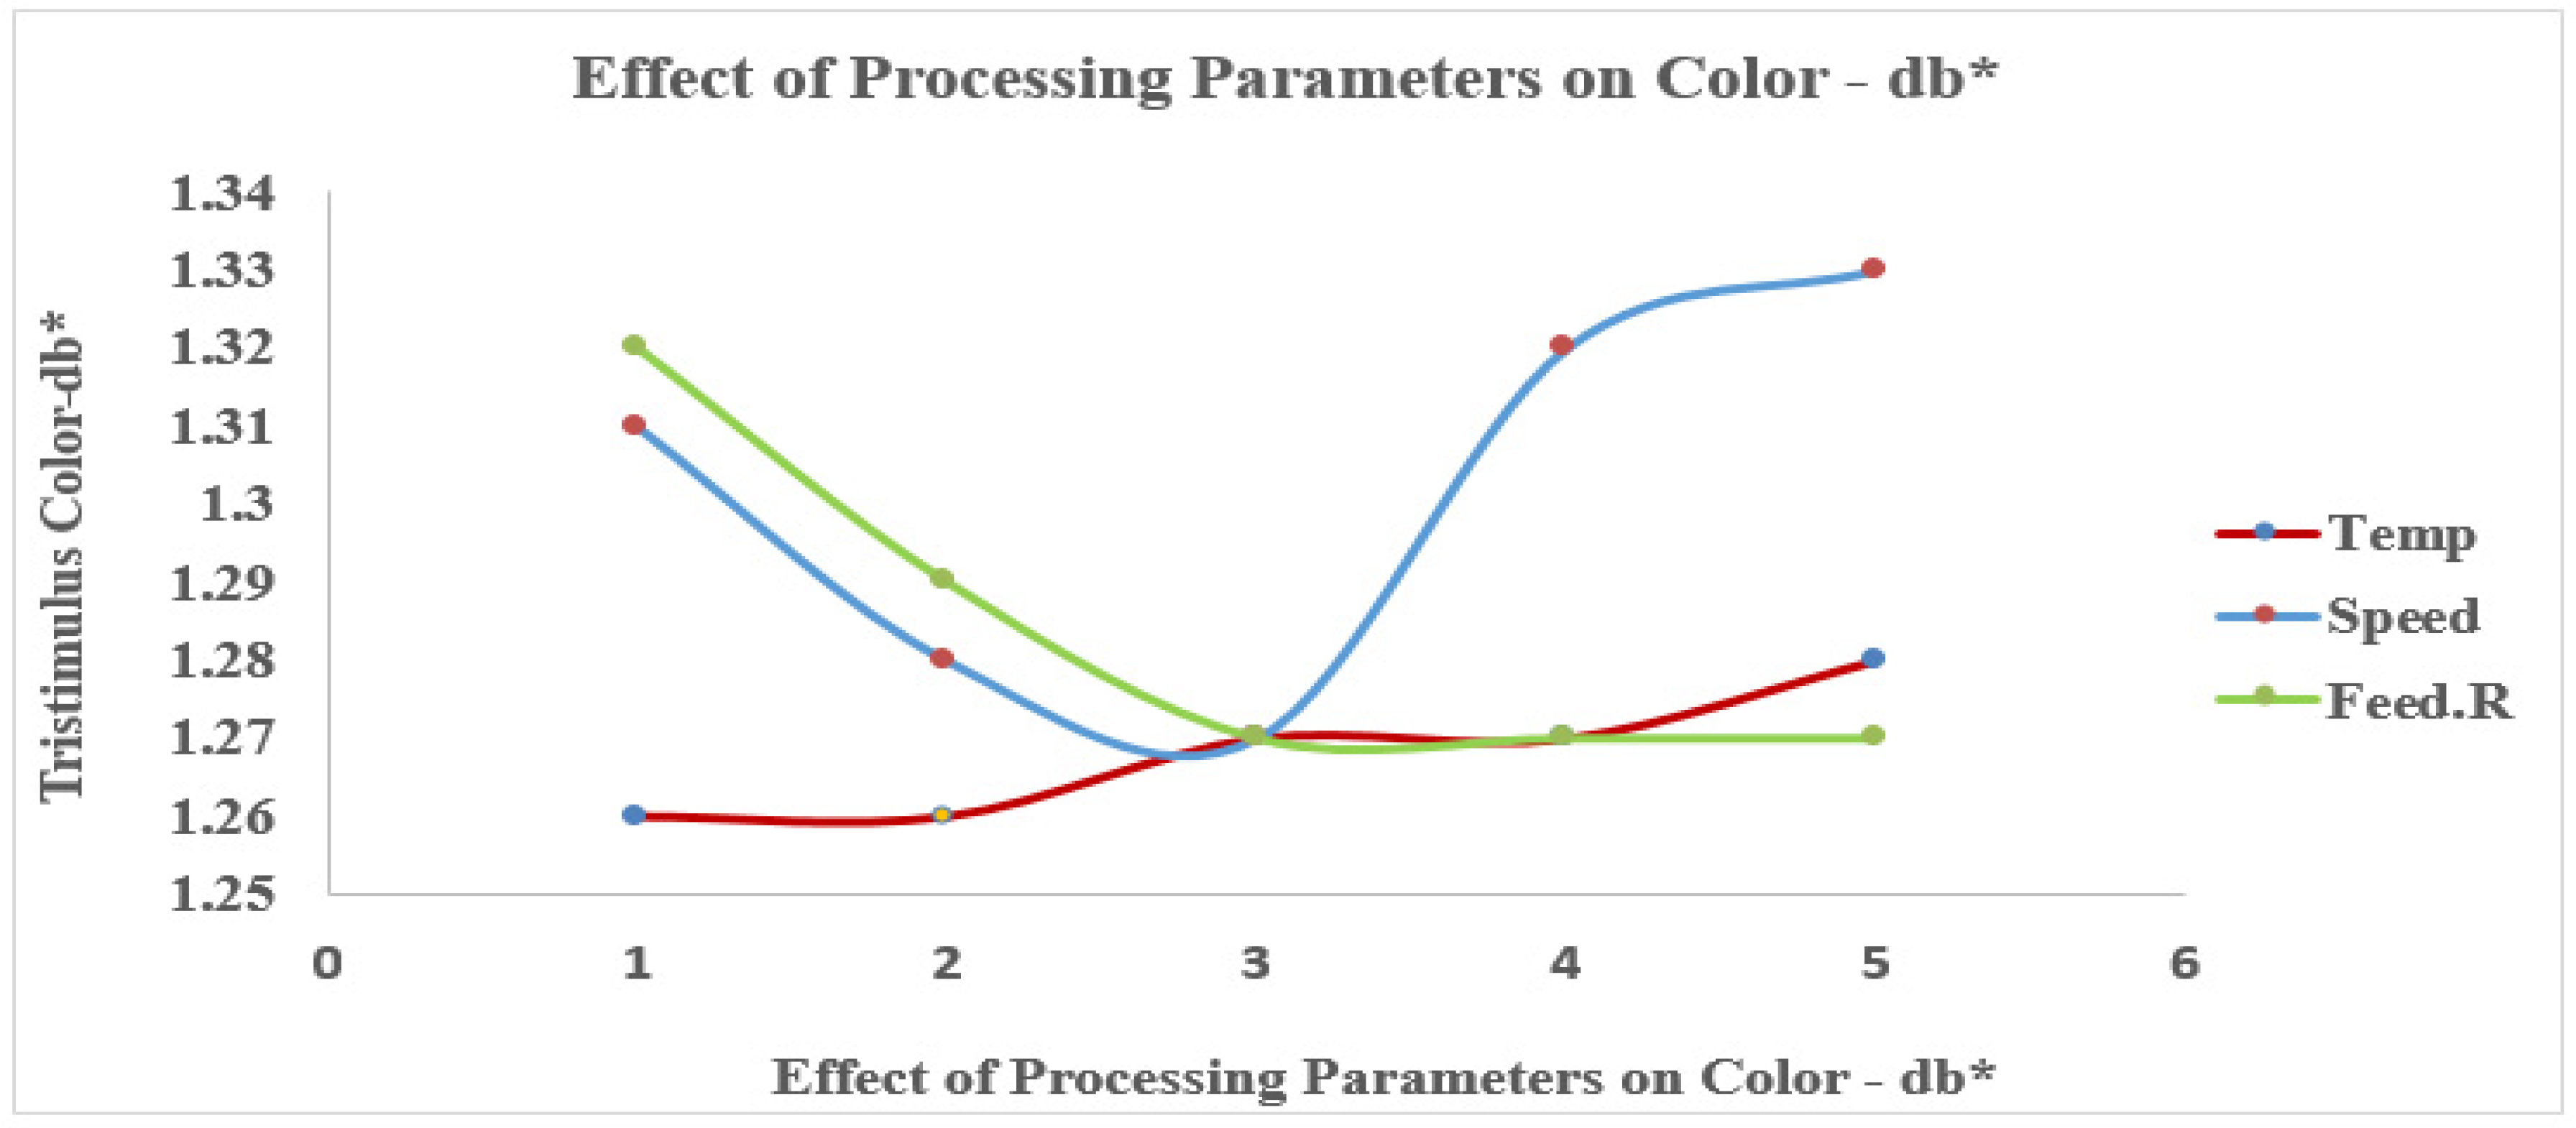
Figure 9.
Speed–Temperature Interaction vs ΔE*.
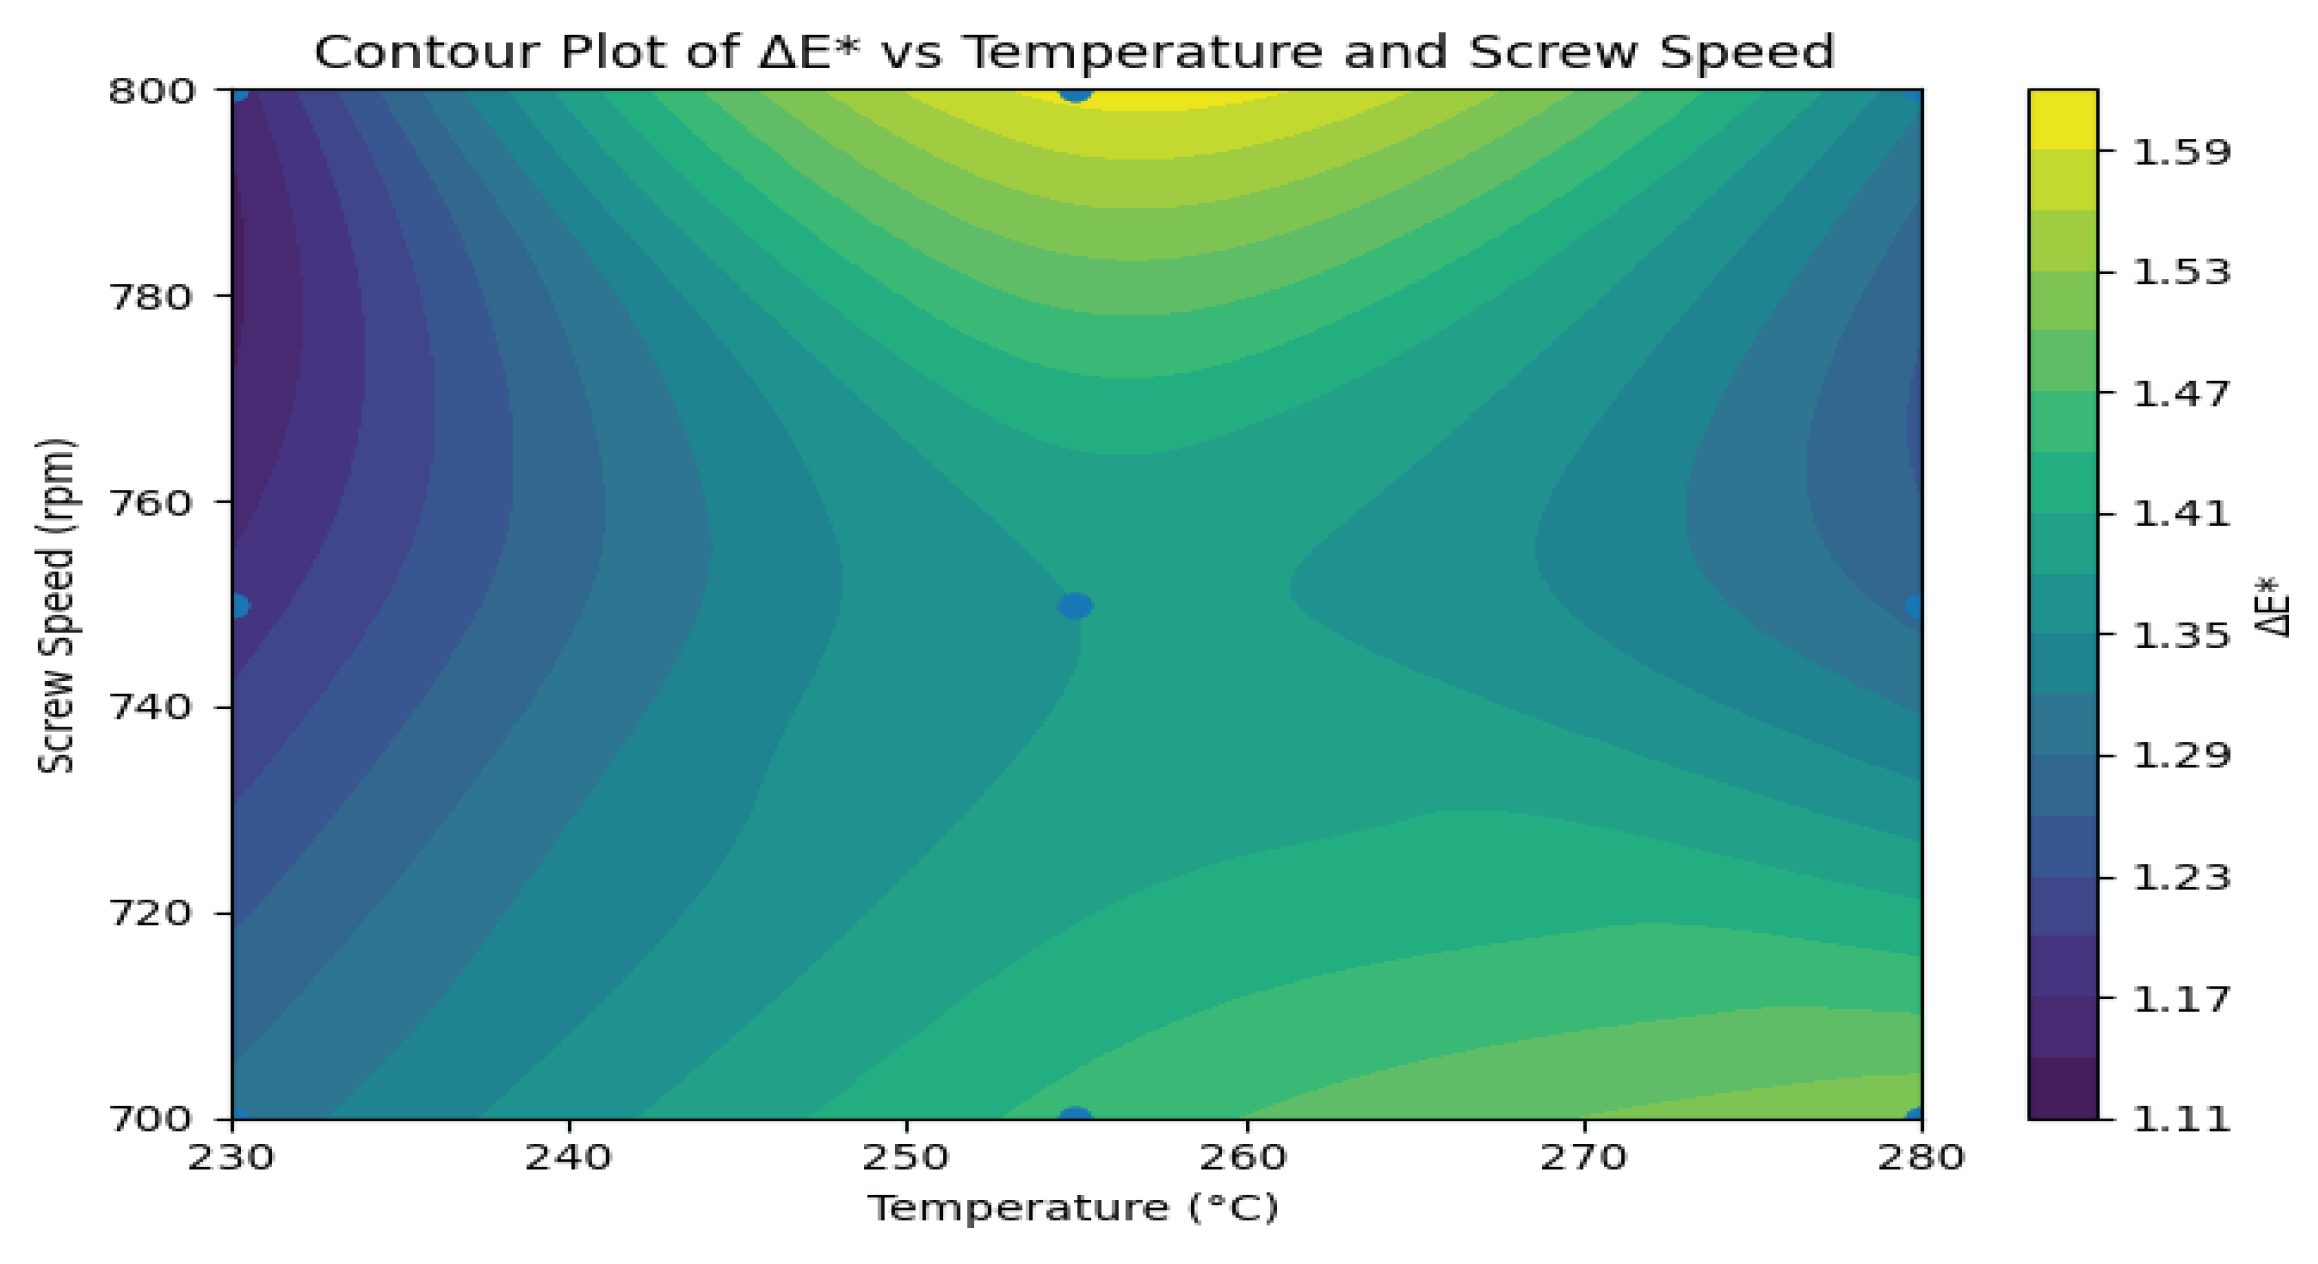
Figure 10.
3D Response Surface of Desirability as a Function of Screw Speed and Temperature.
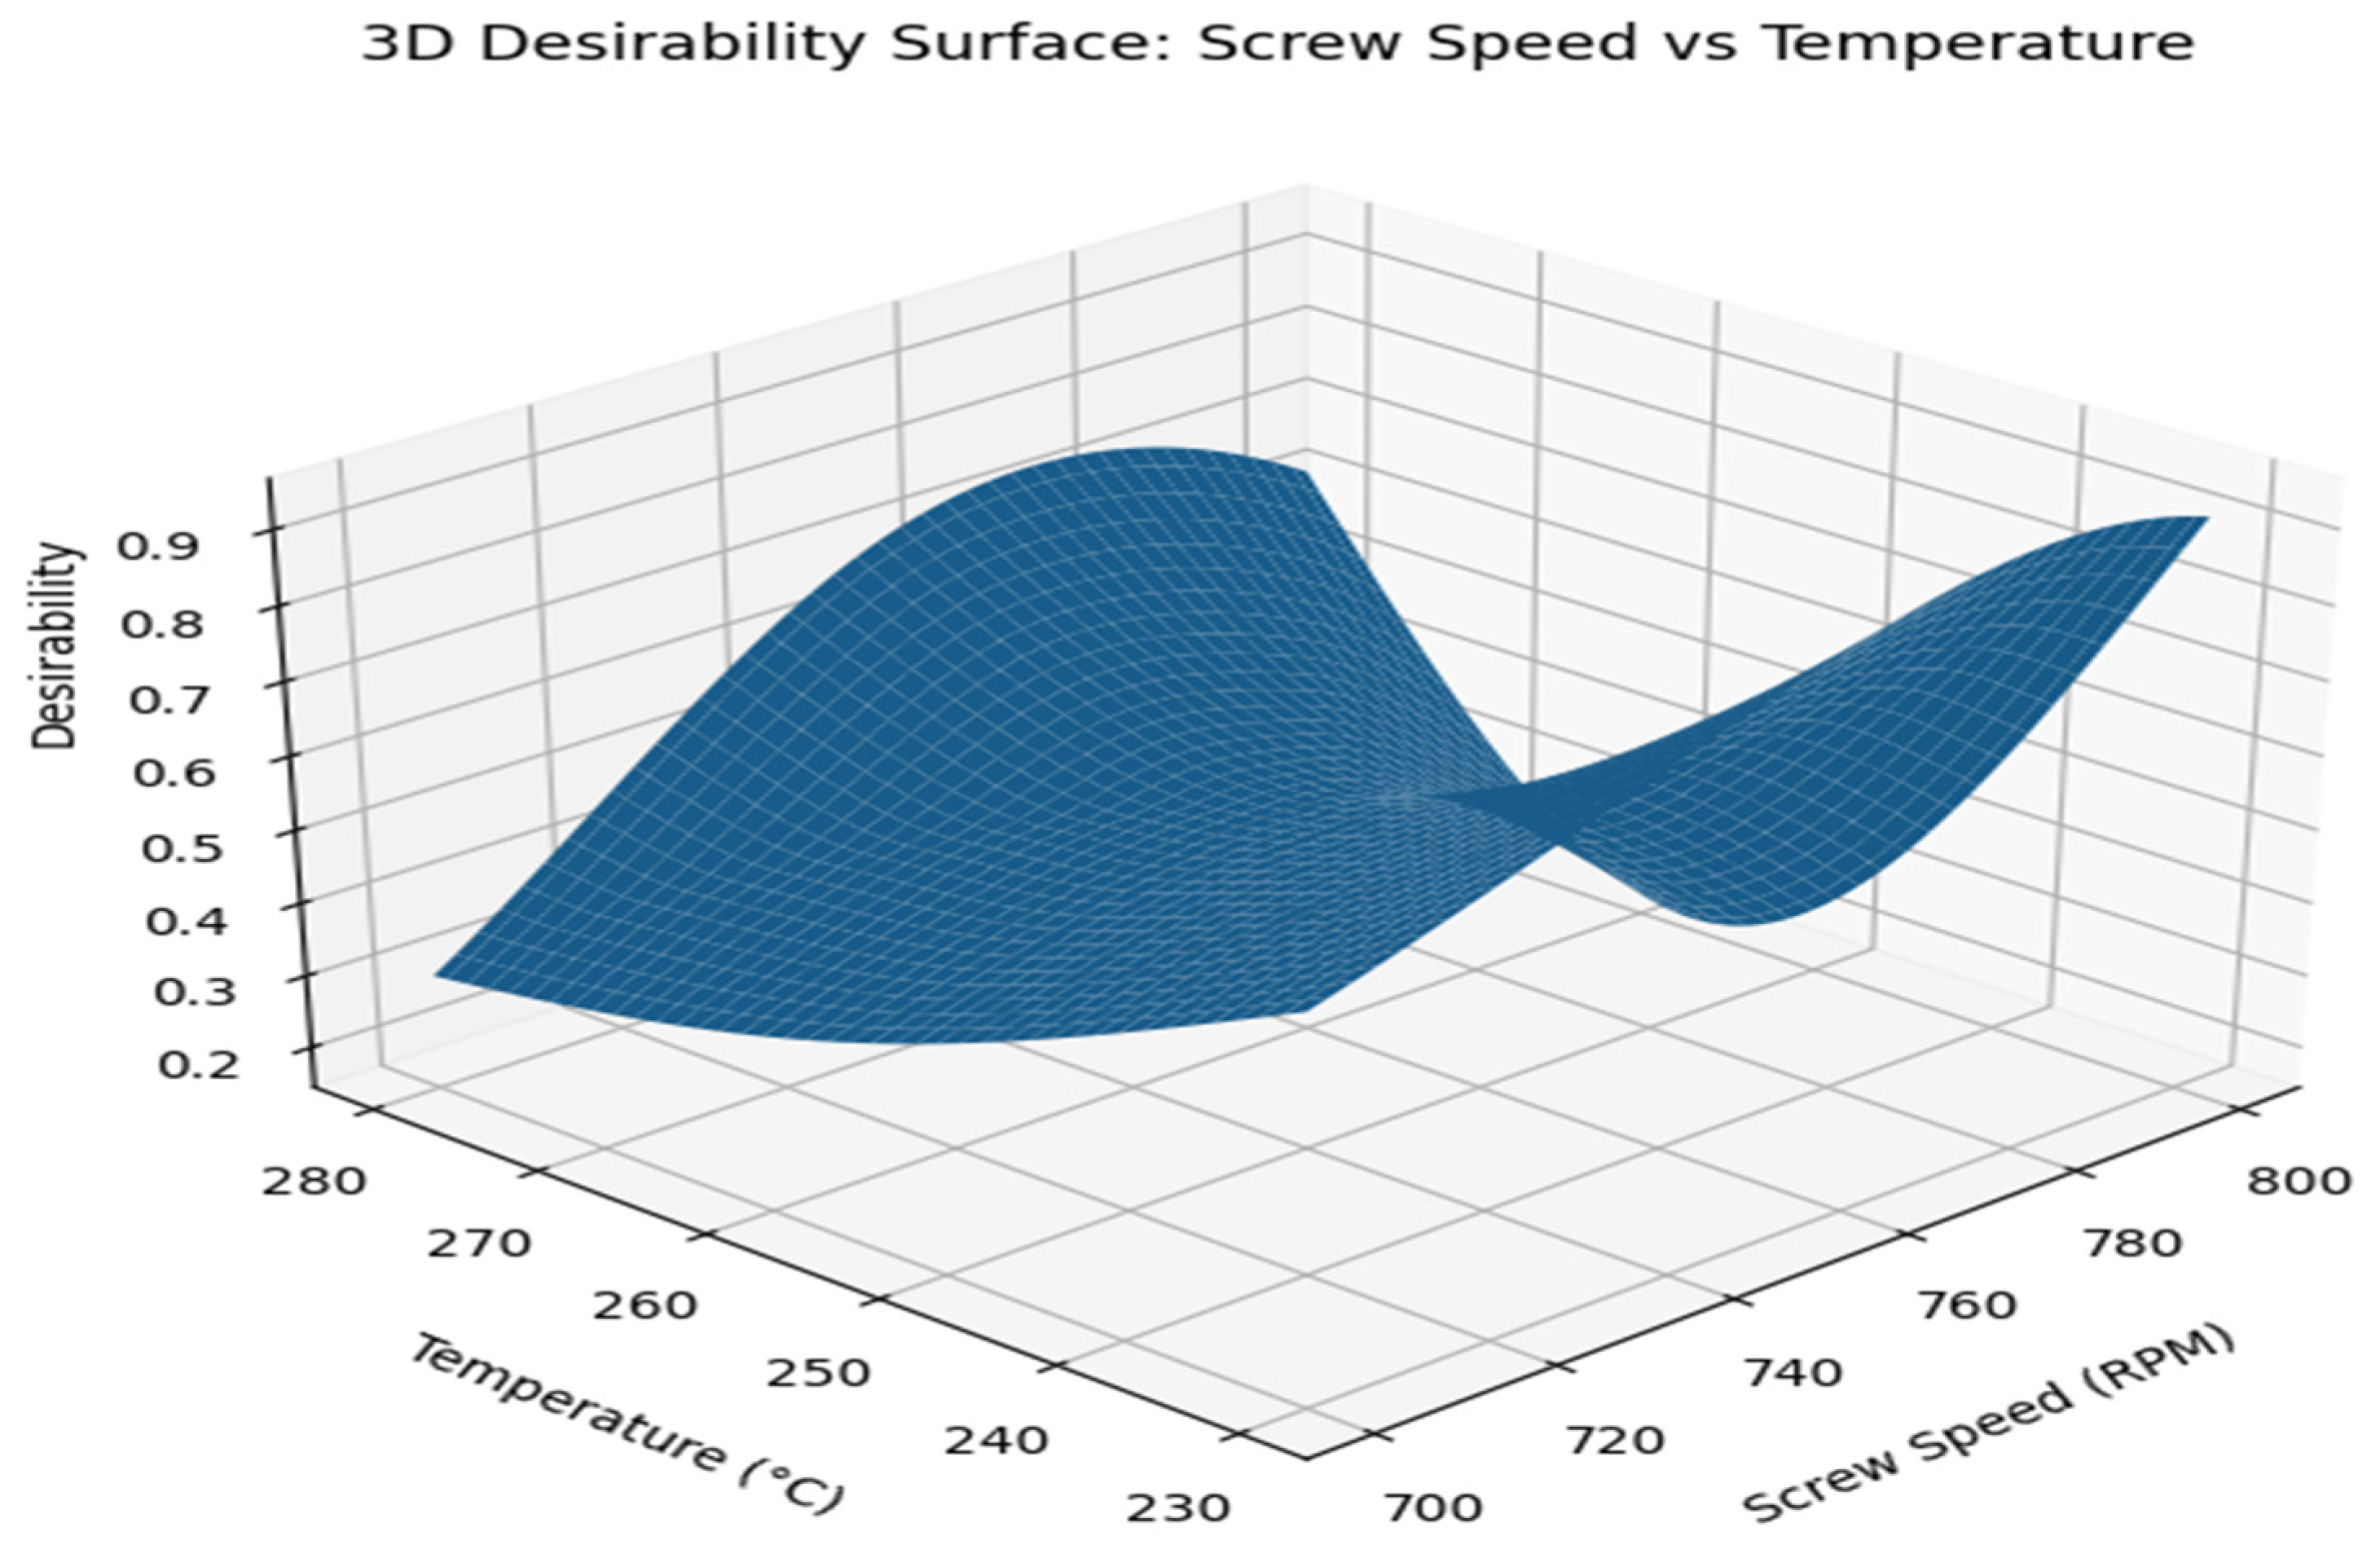
Figure 11.
Impact of Dynamic Frequency on Grade B Viscosity at 230°C, 255°C, and 280°C.
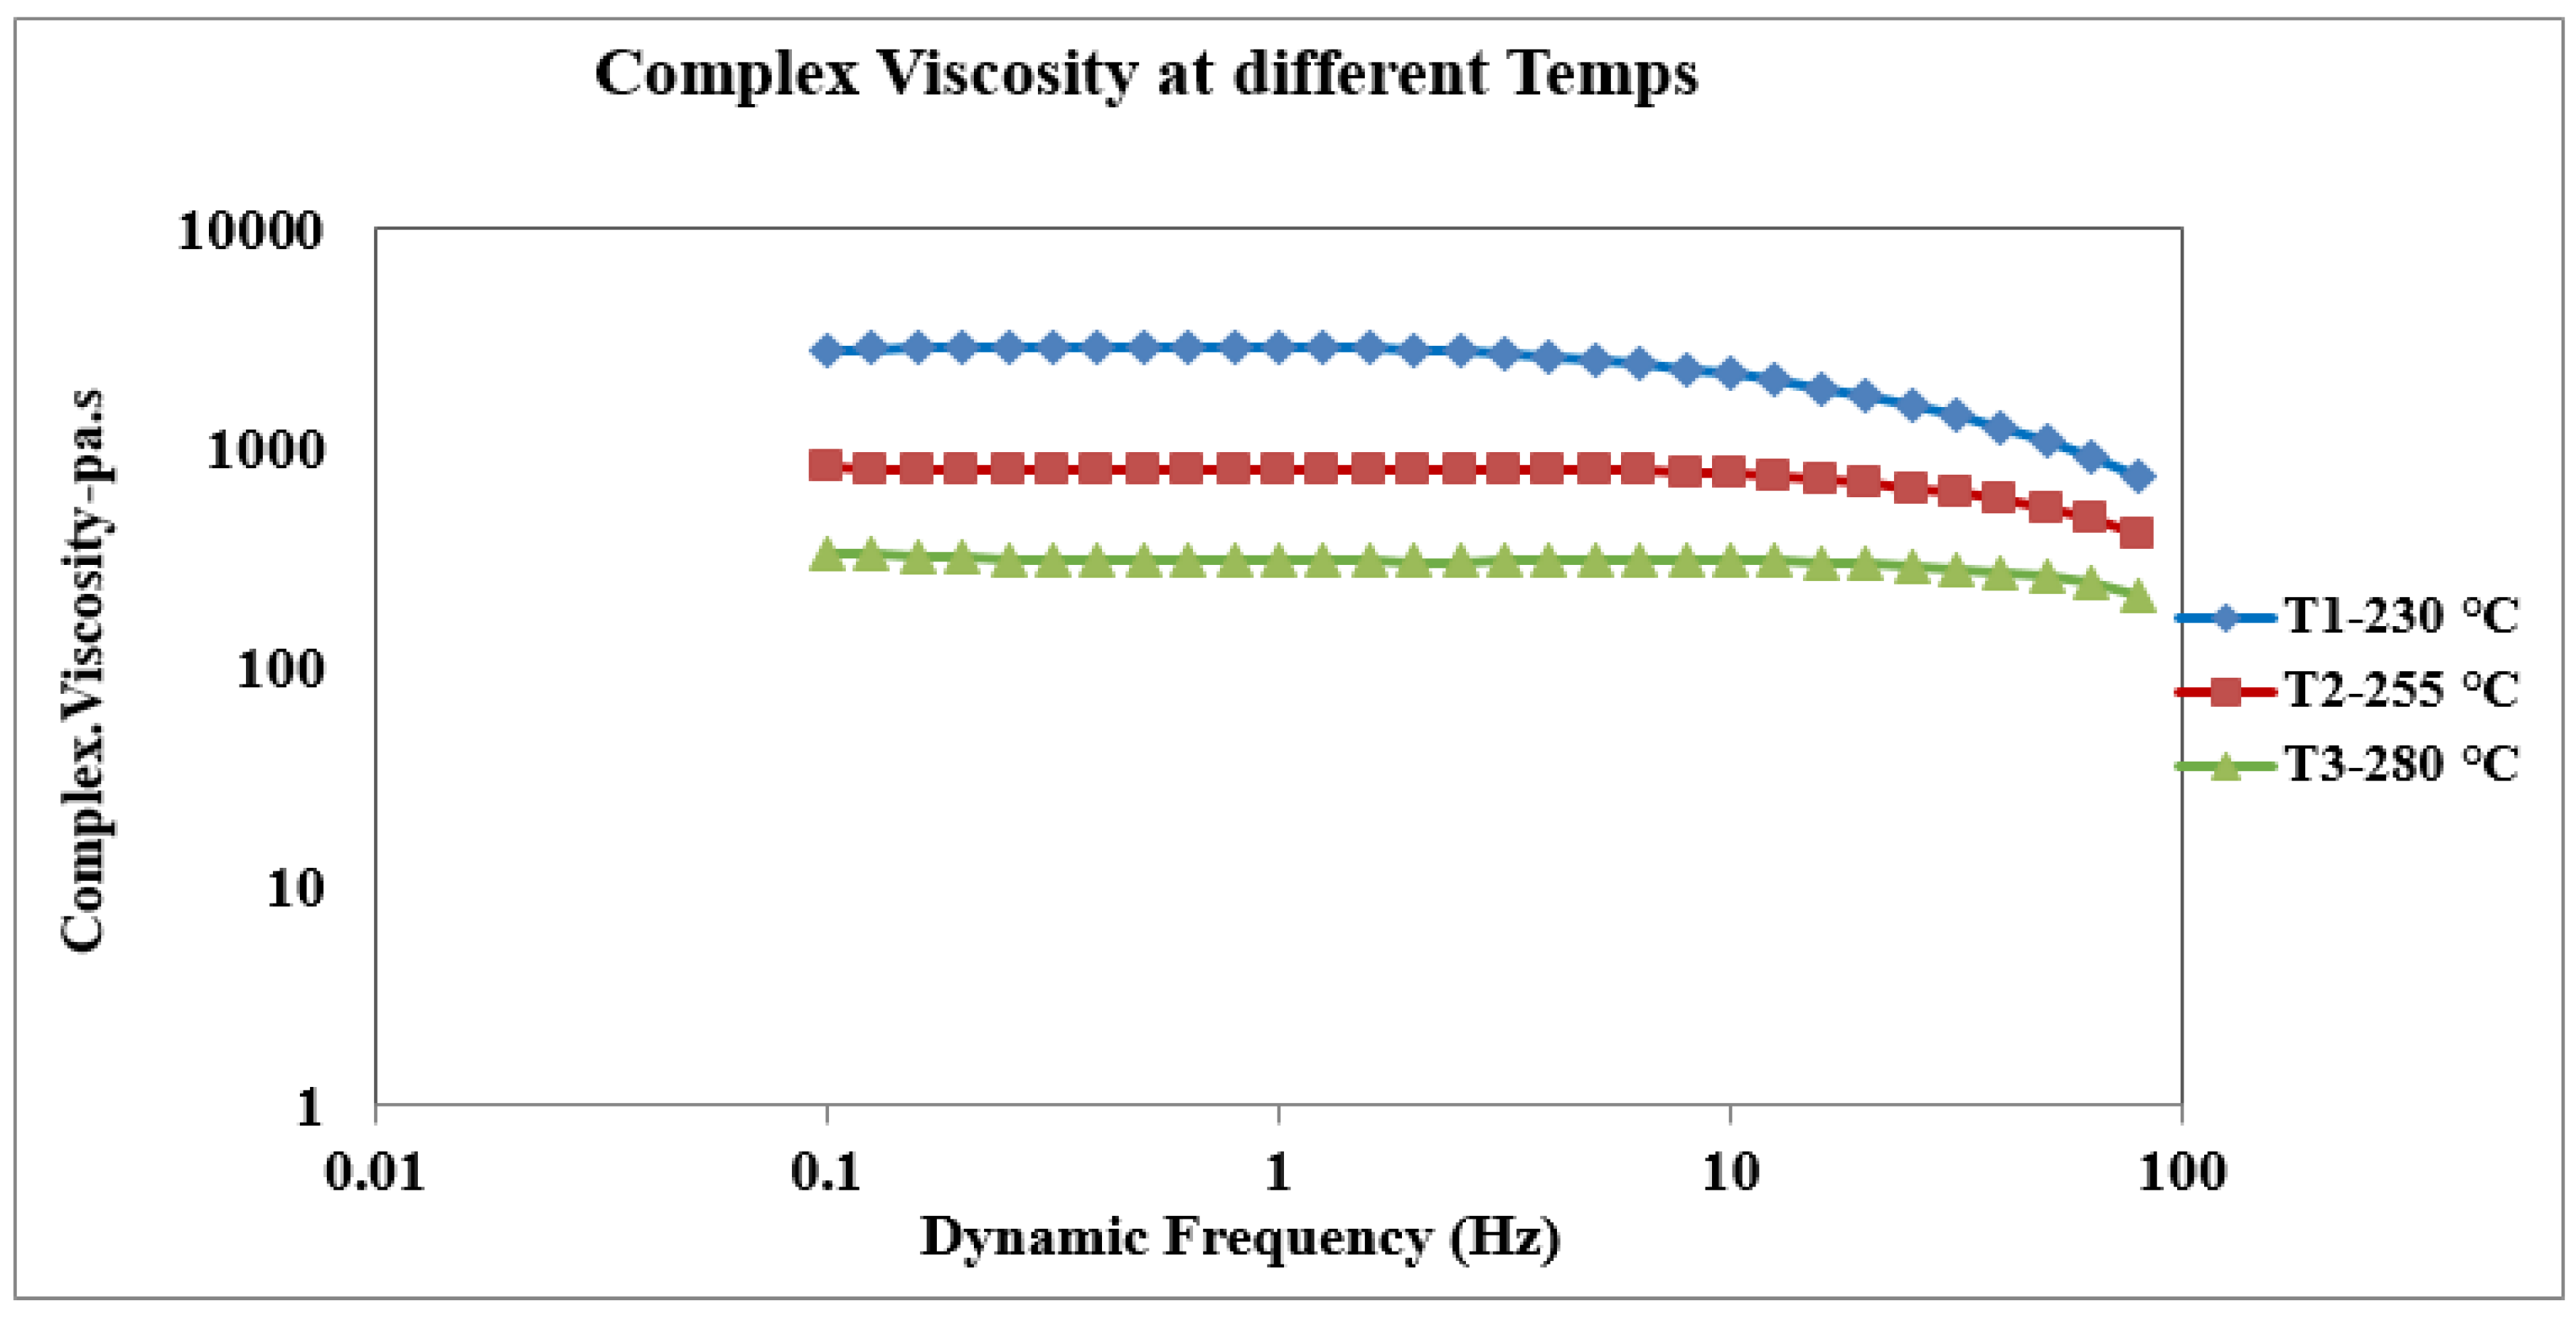
Figure 12.
The distribution of particle sizes and the total number of particles at various temps.
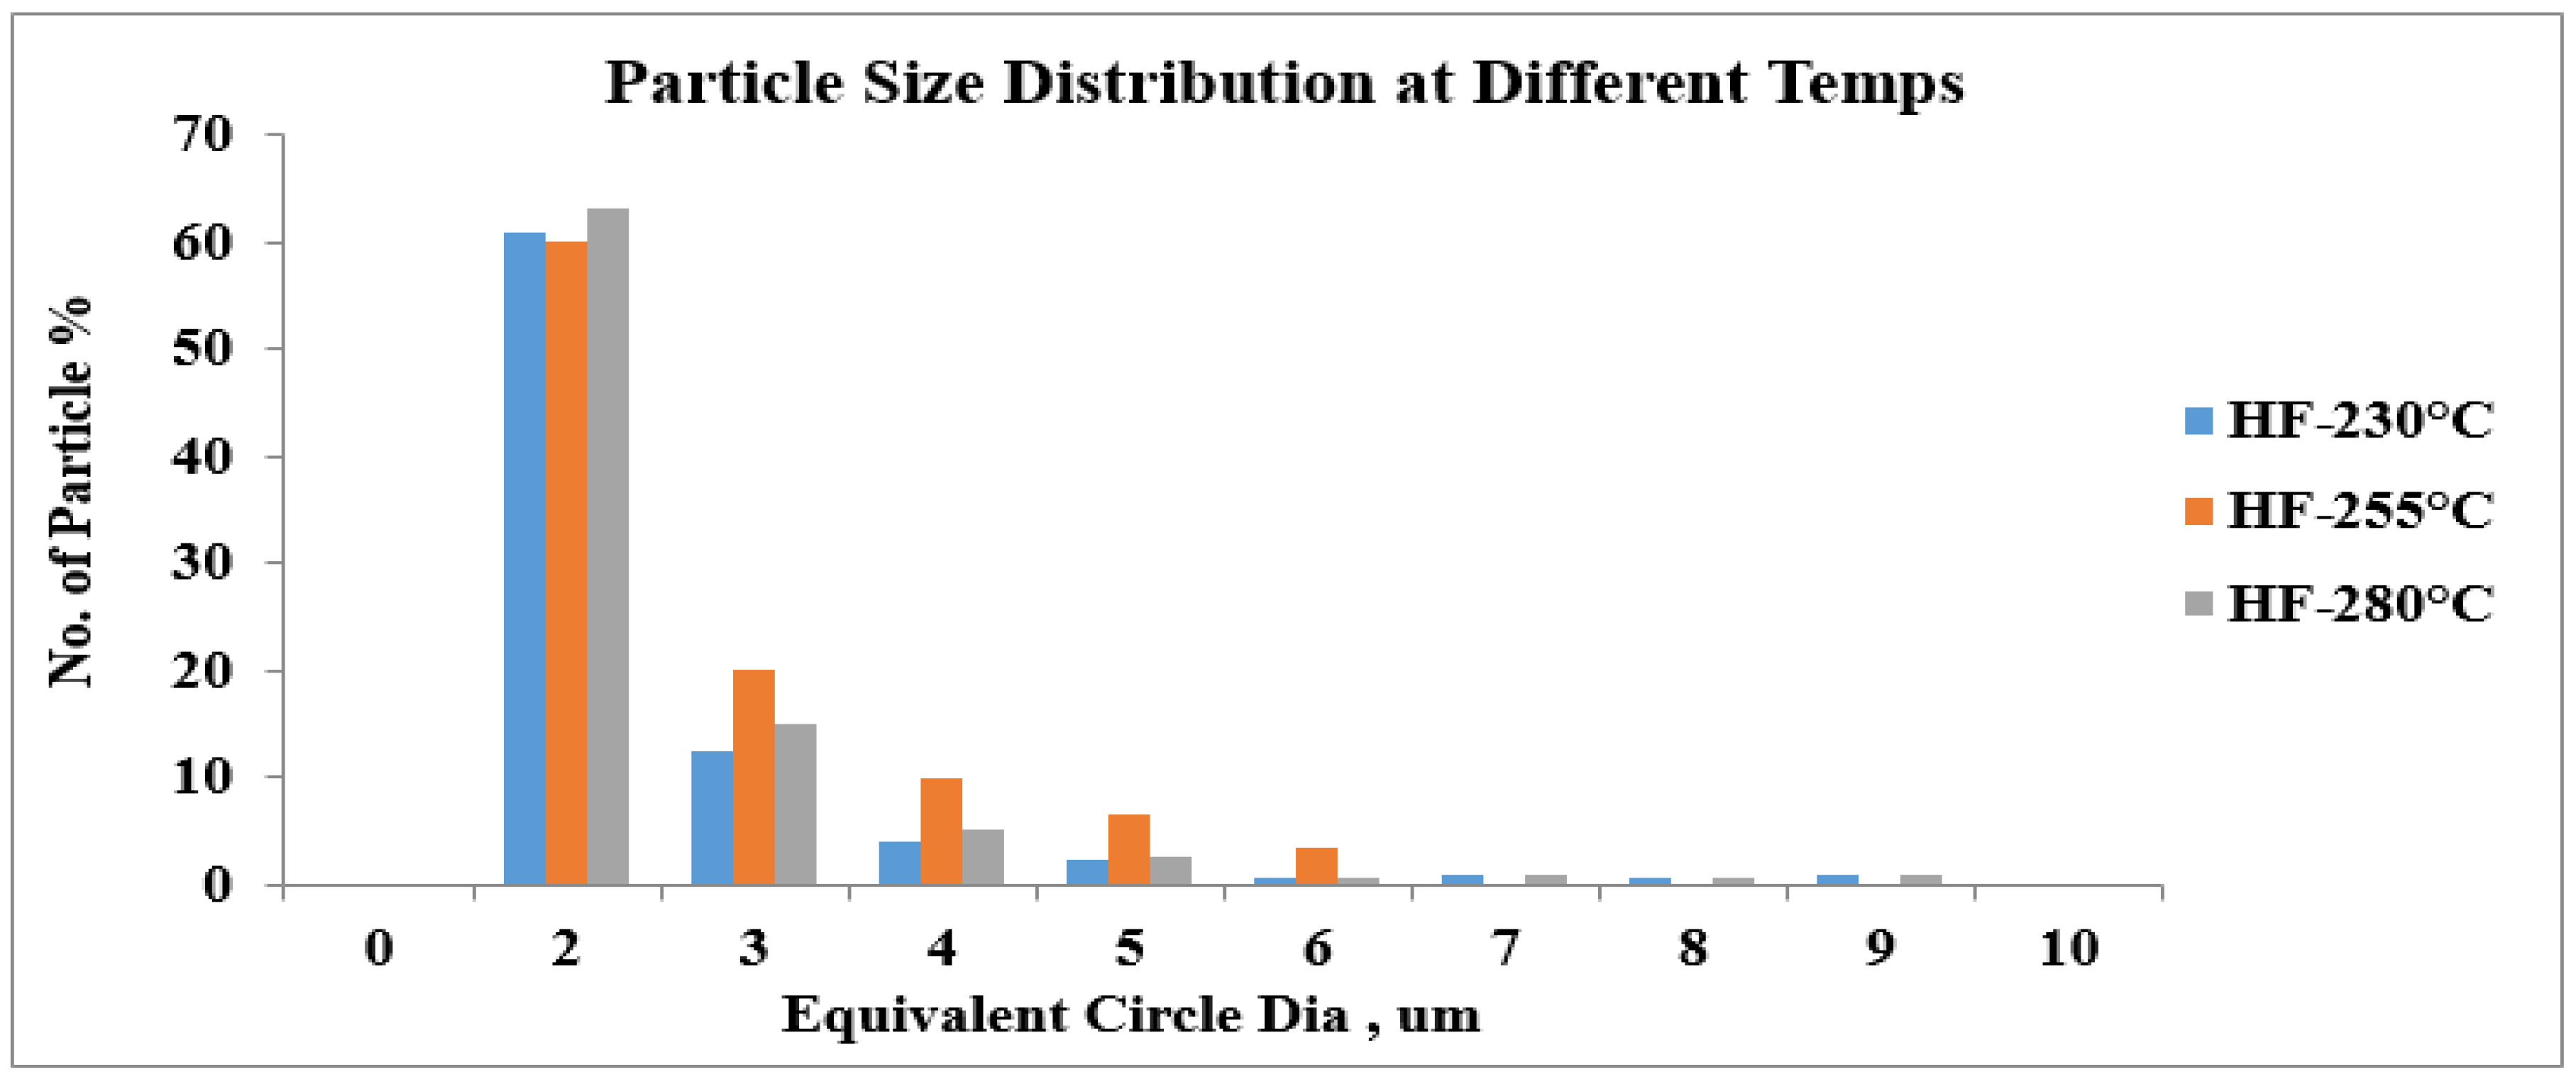
Figure 13.
DOM at temp 230°C.
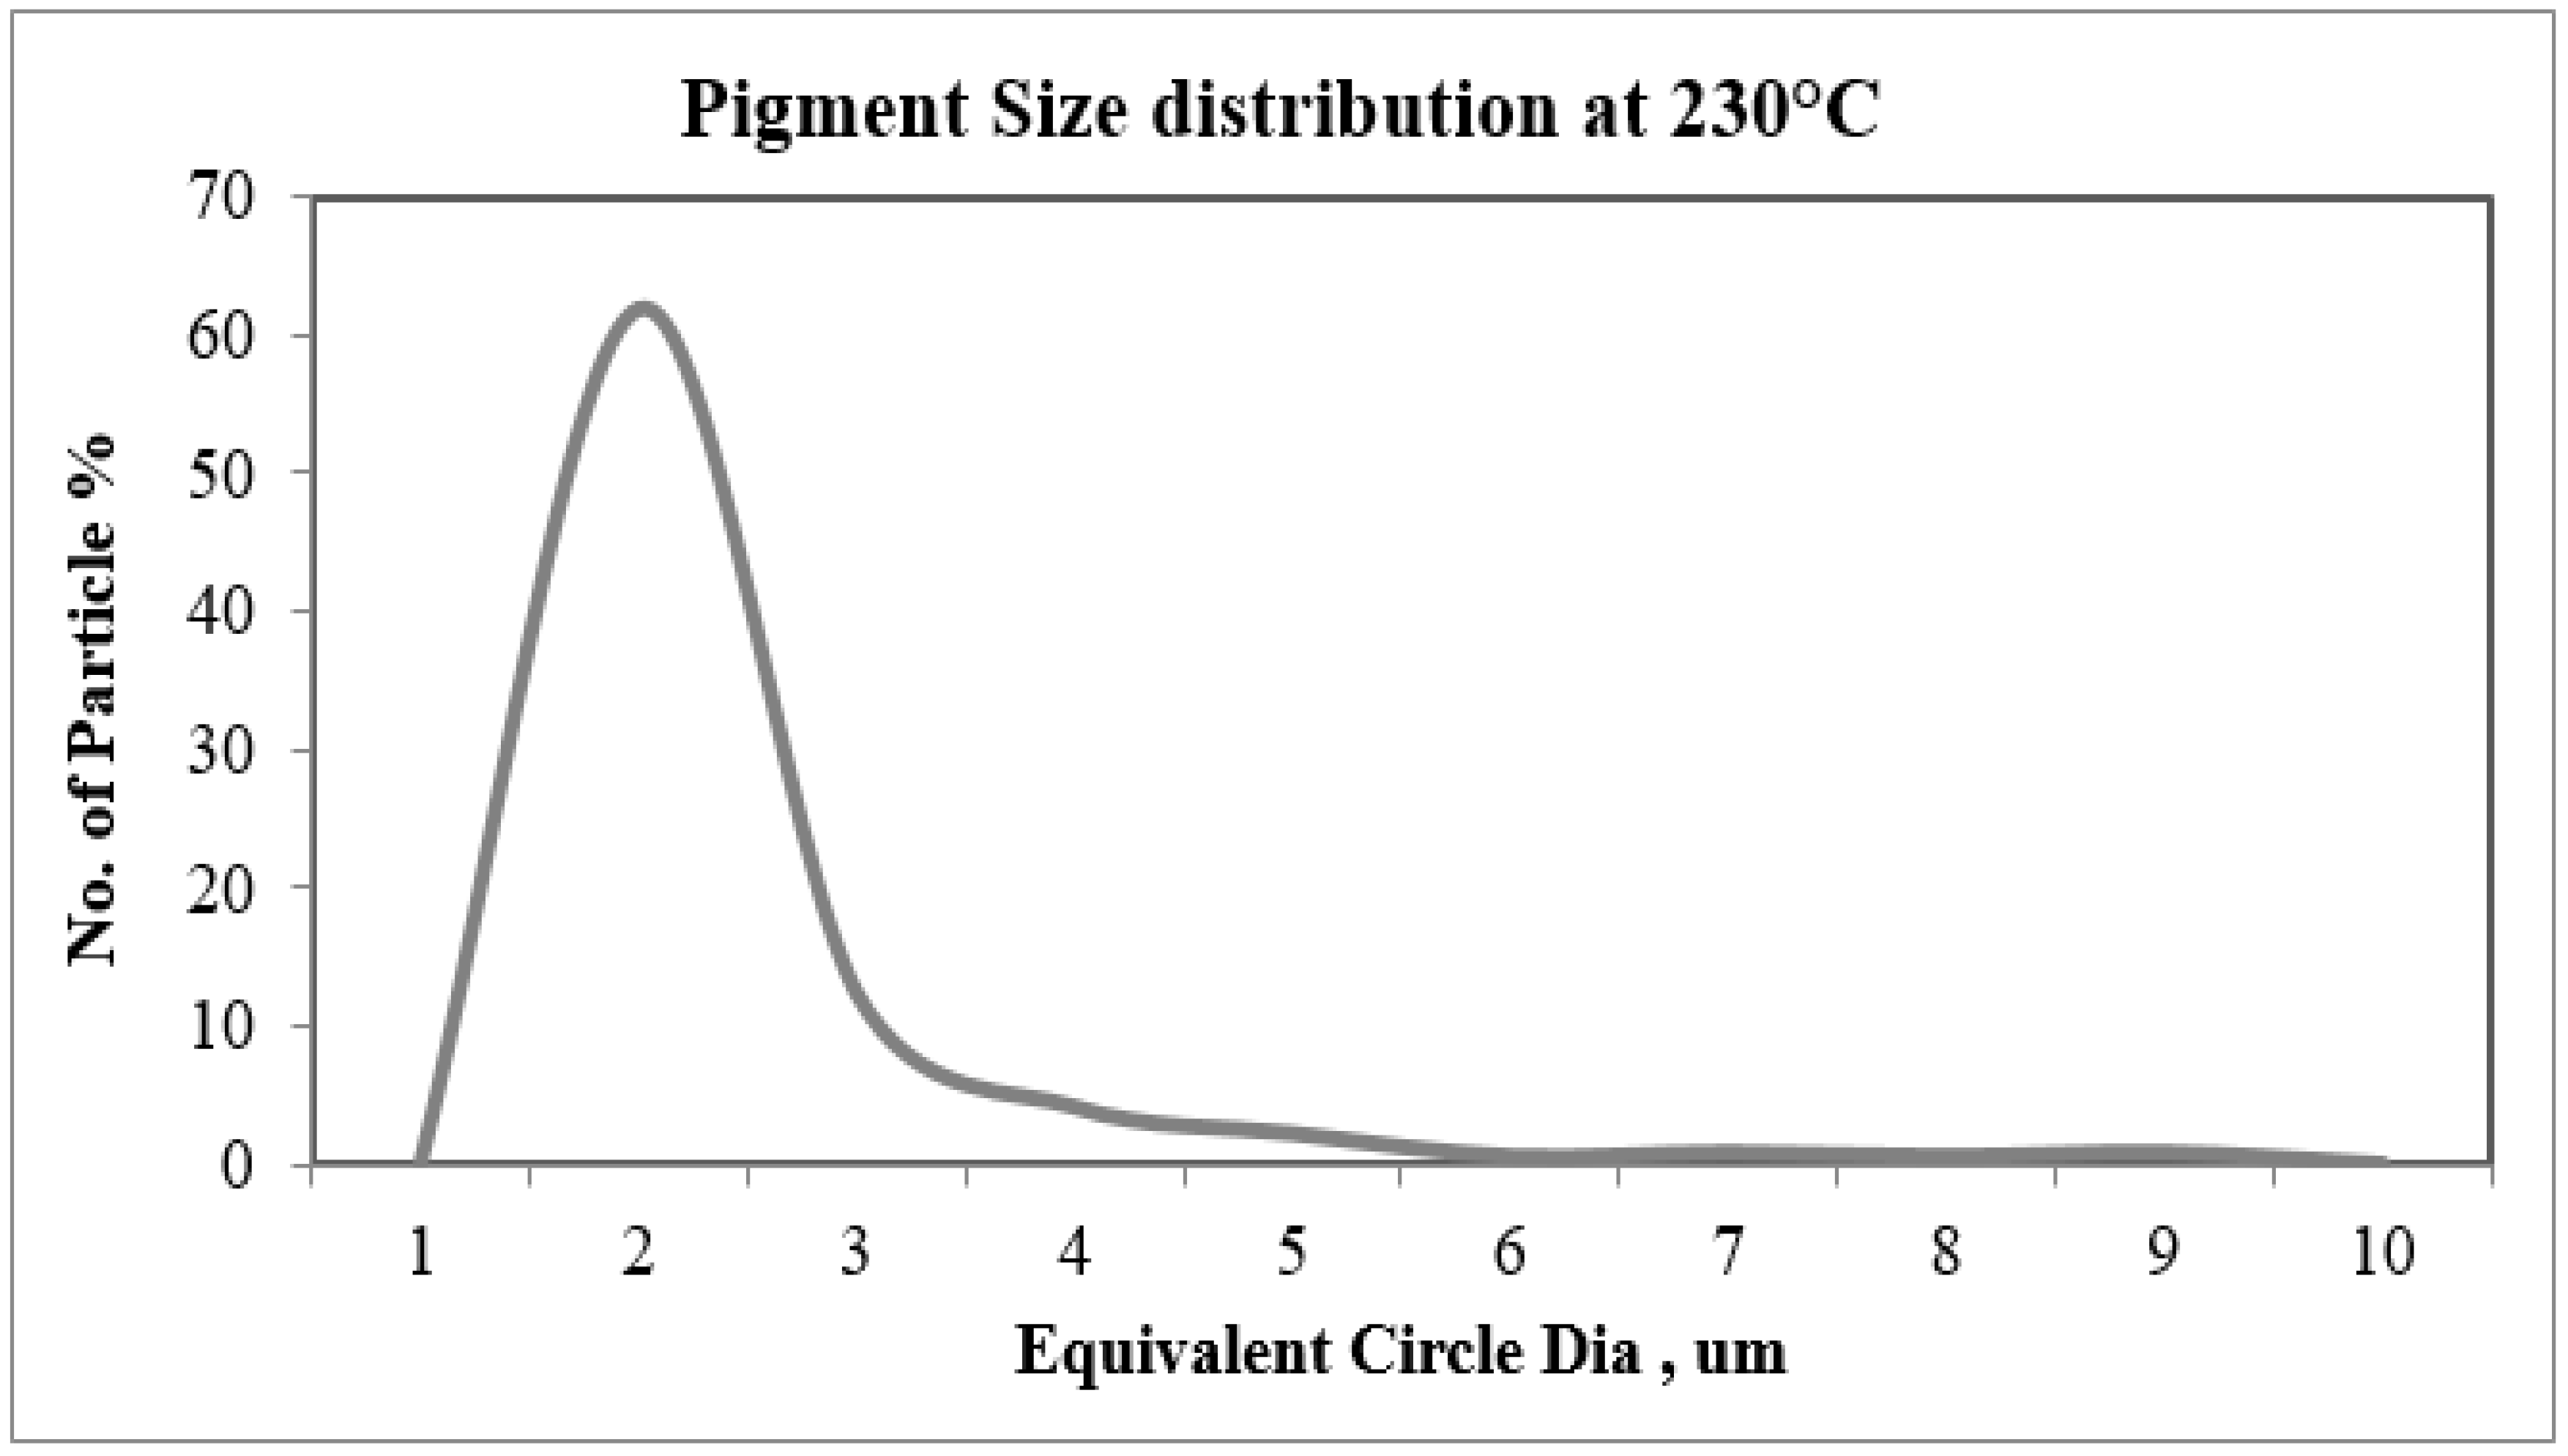
Figure 14.
DOM at temp 255°C.
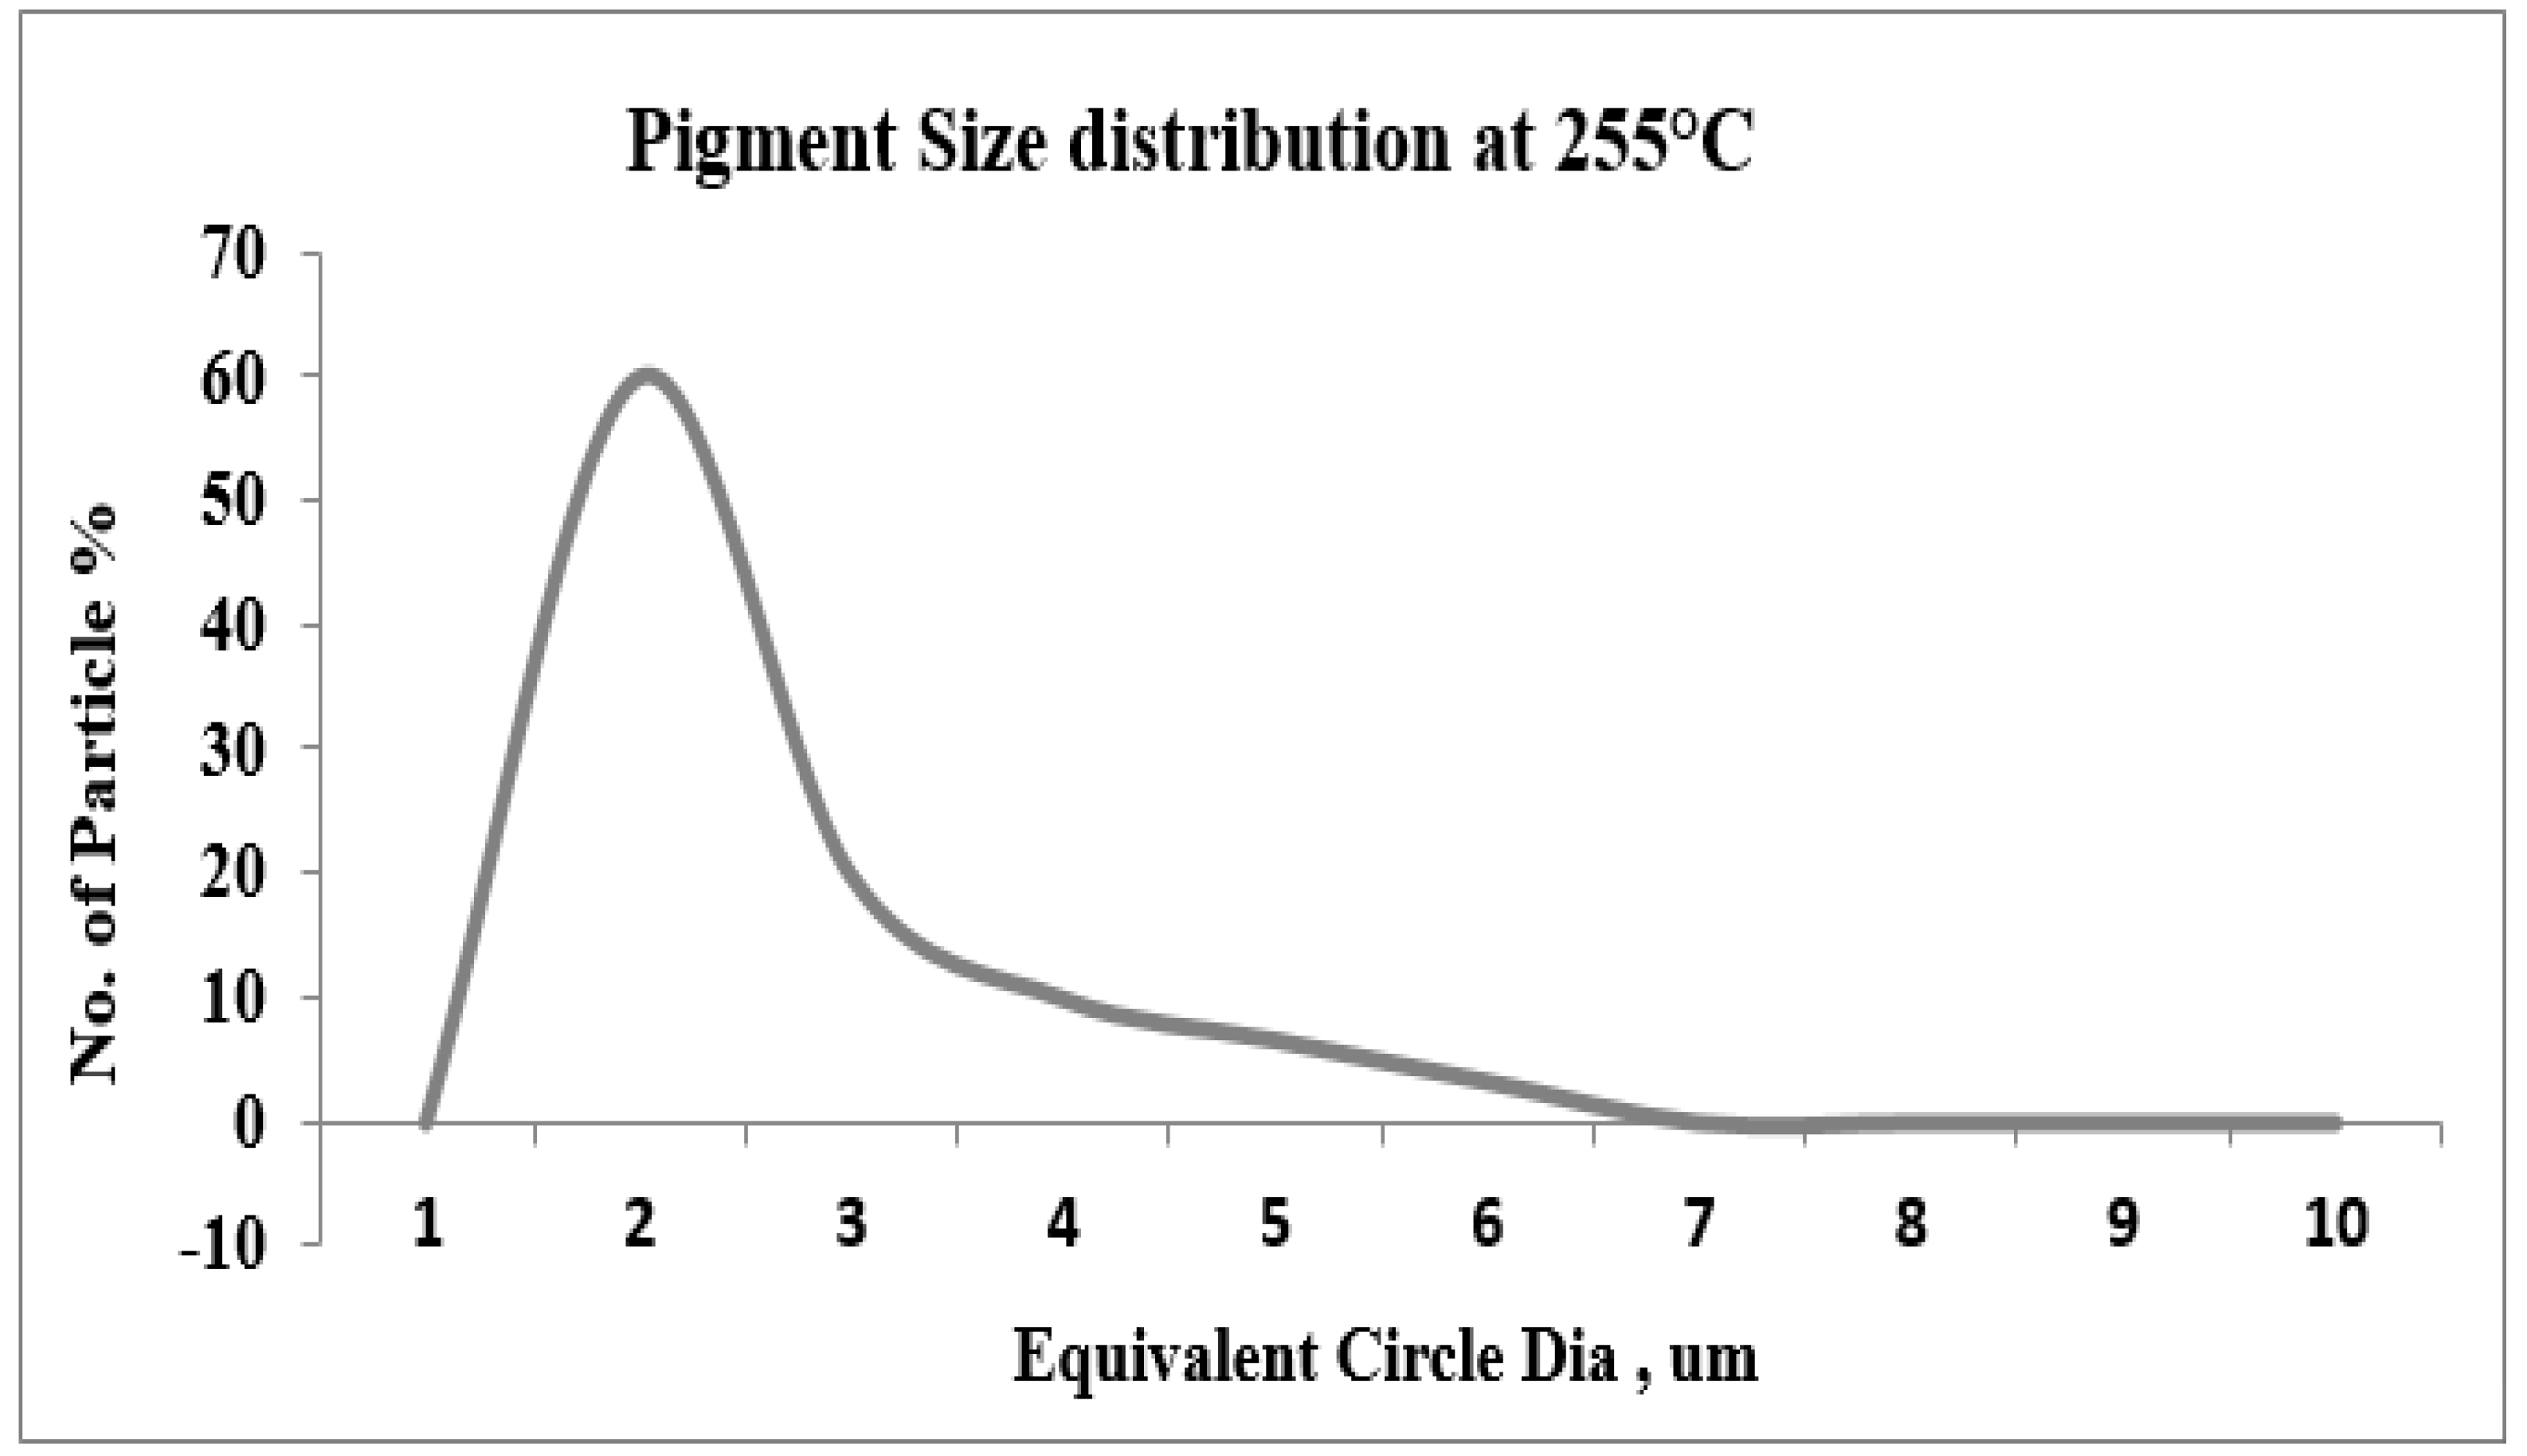
Figure 15.
DOM at temp 280°C.
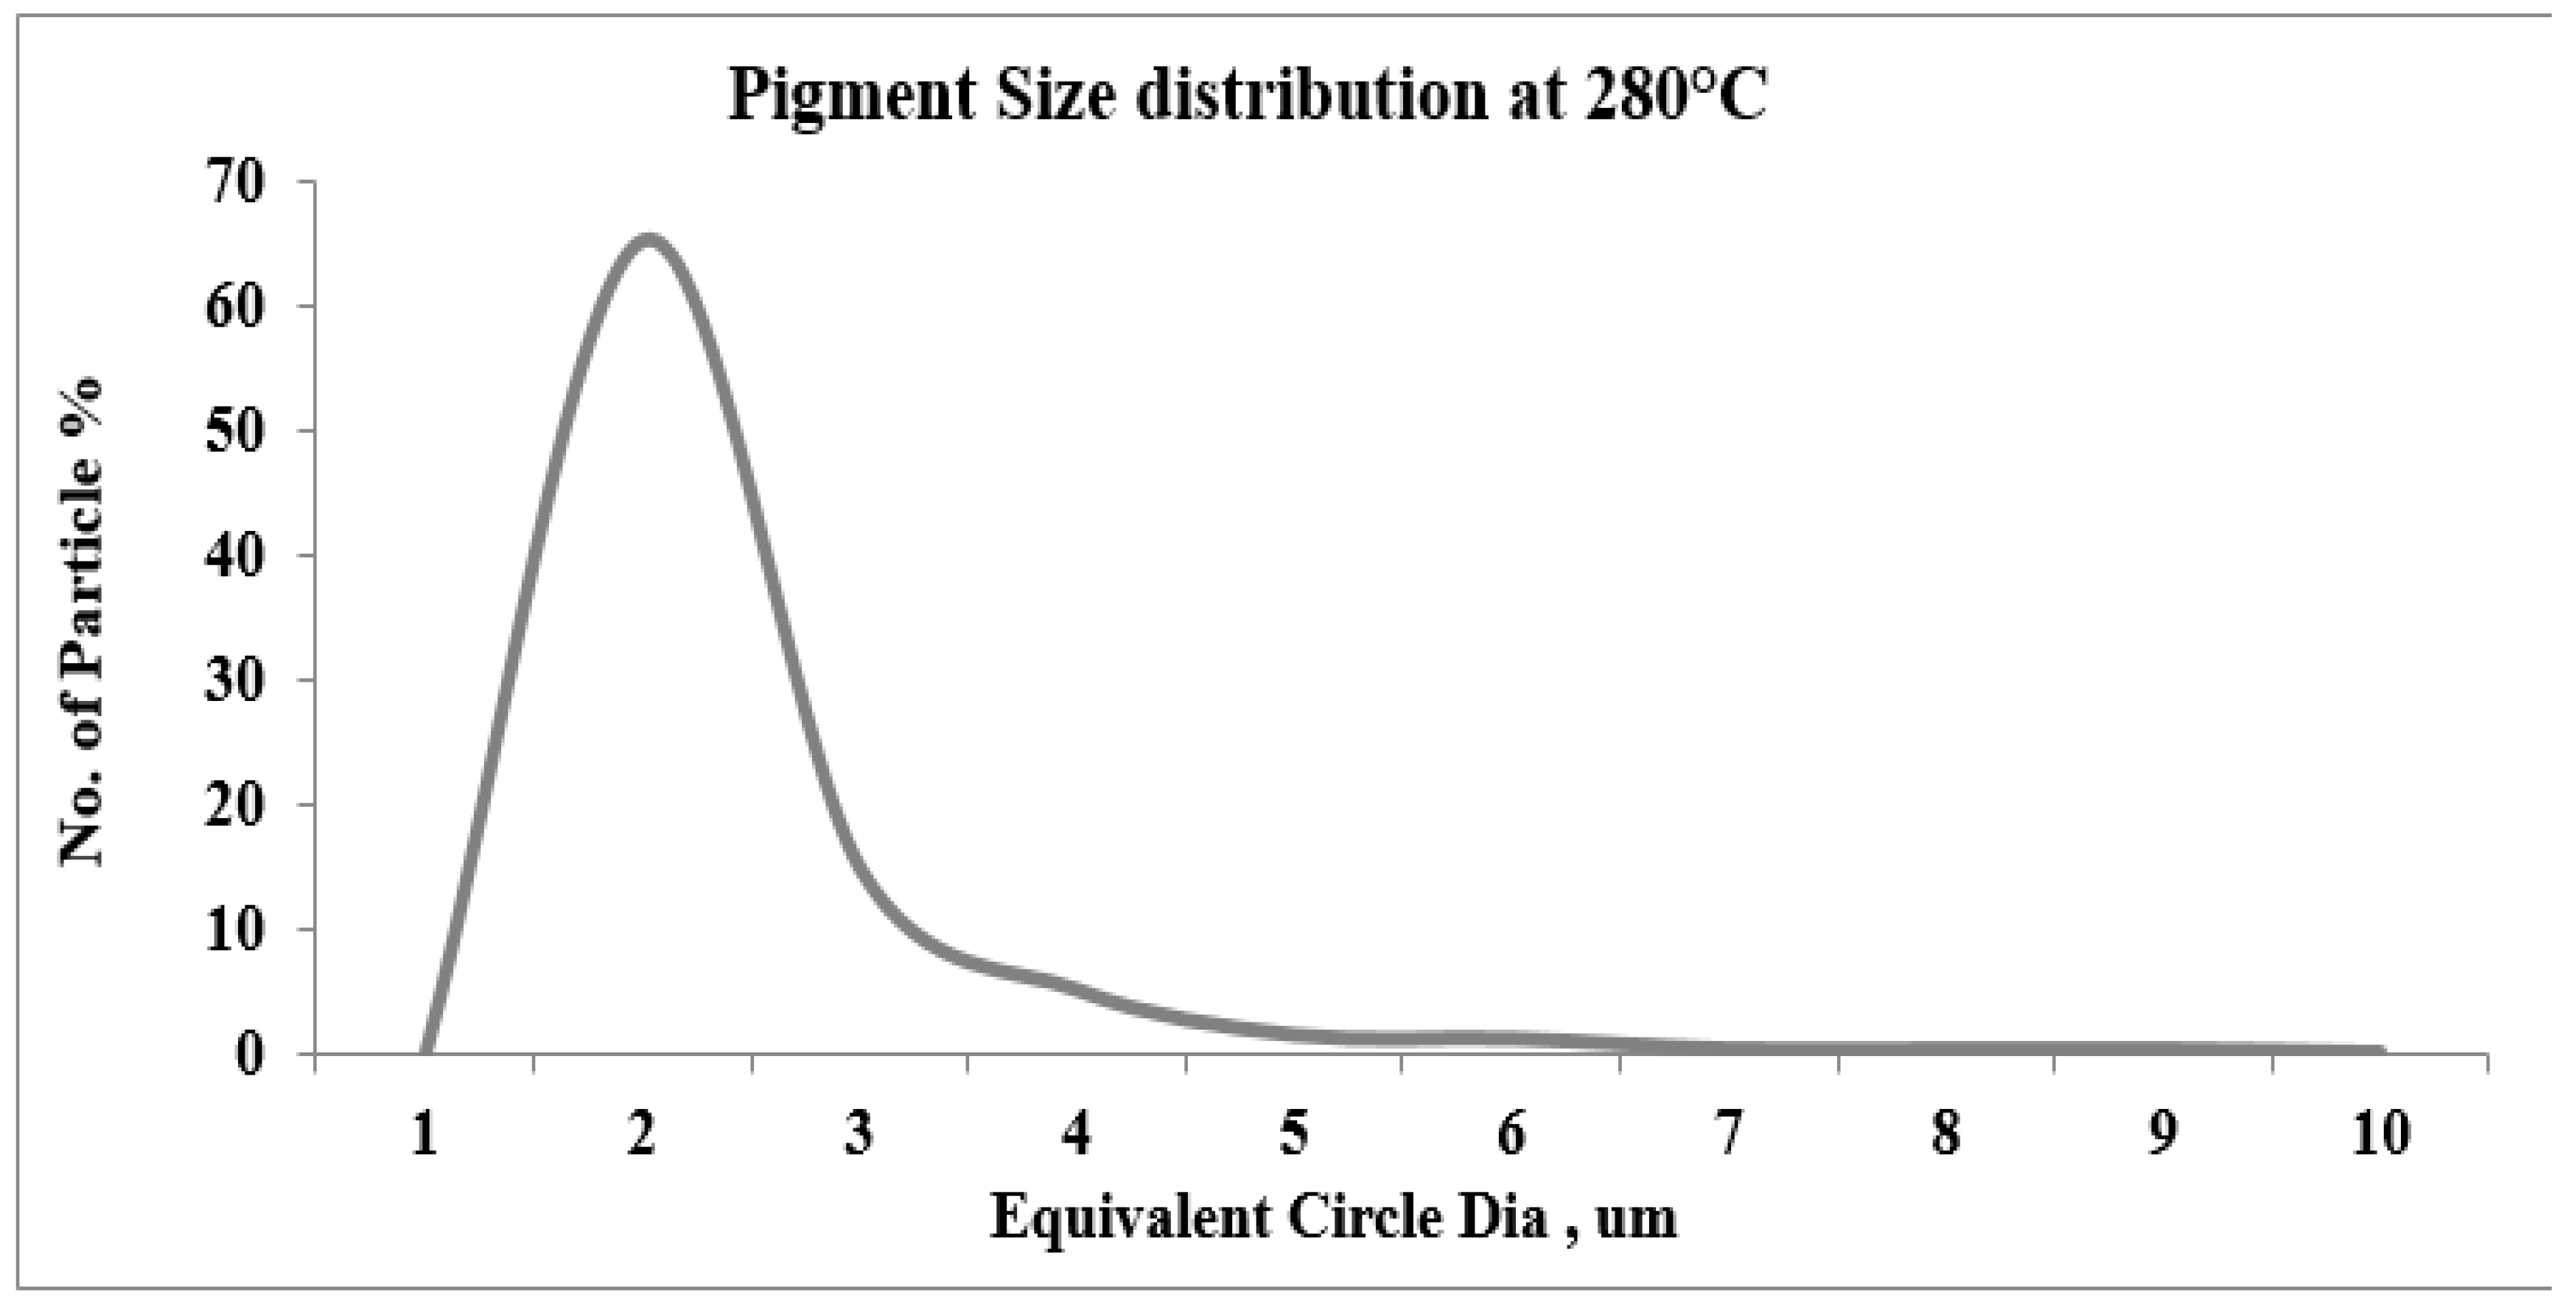
Figure 16.
Compounded PC micrograph (DOM) at Ts (230°C, 255°C, and 280°C (scale100 µm).
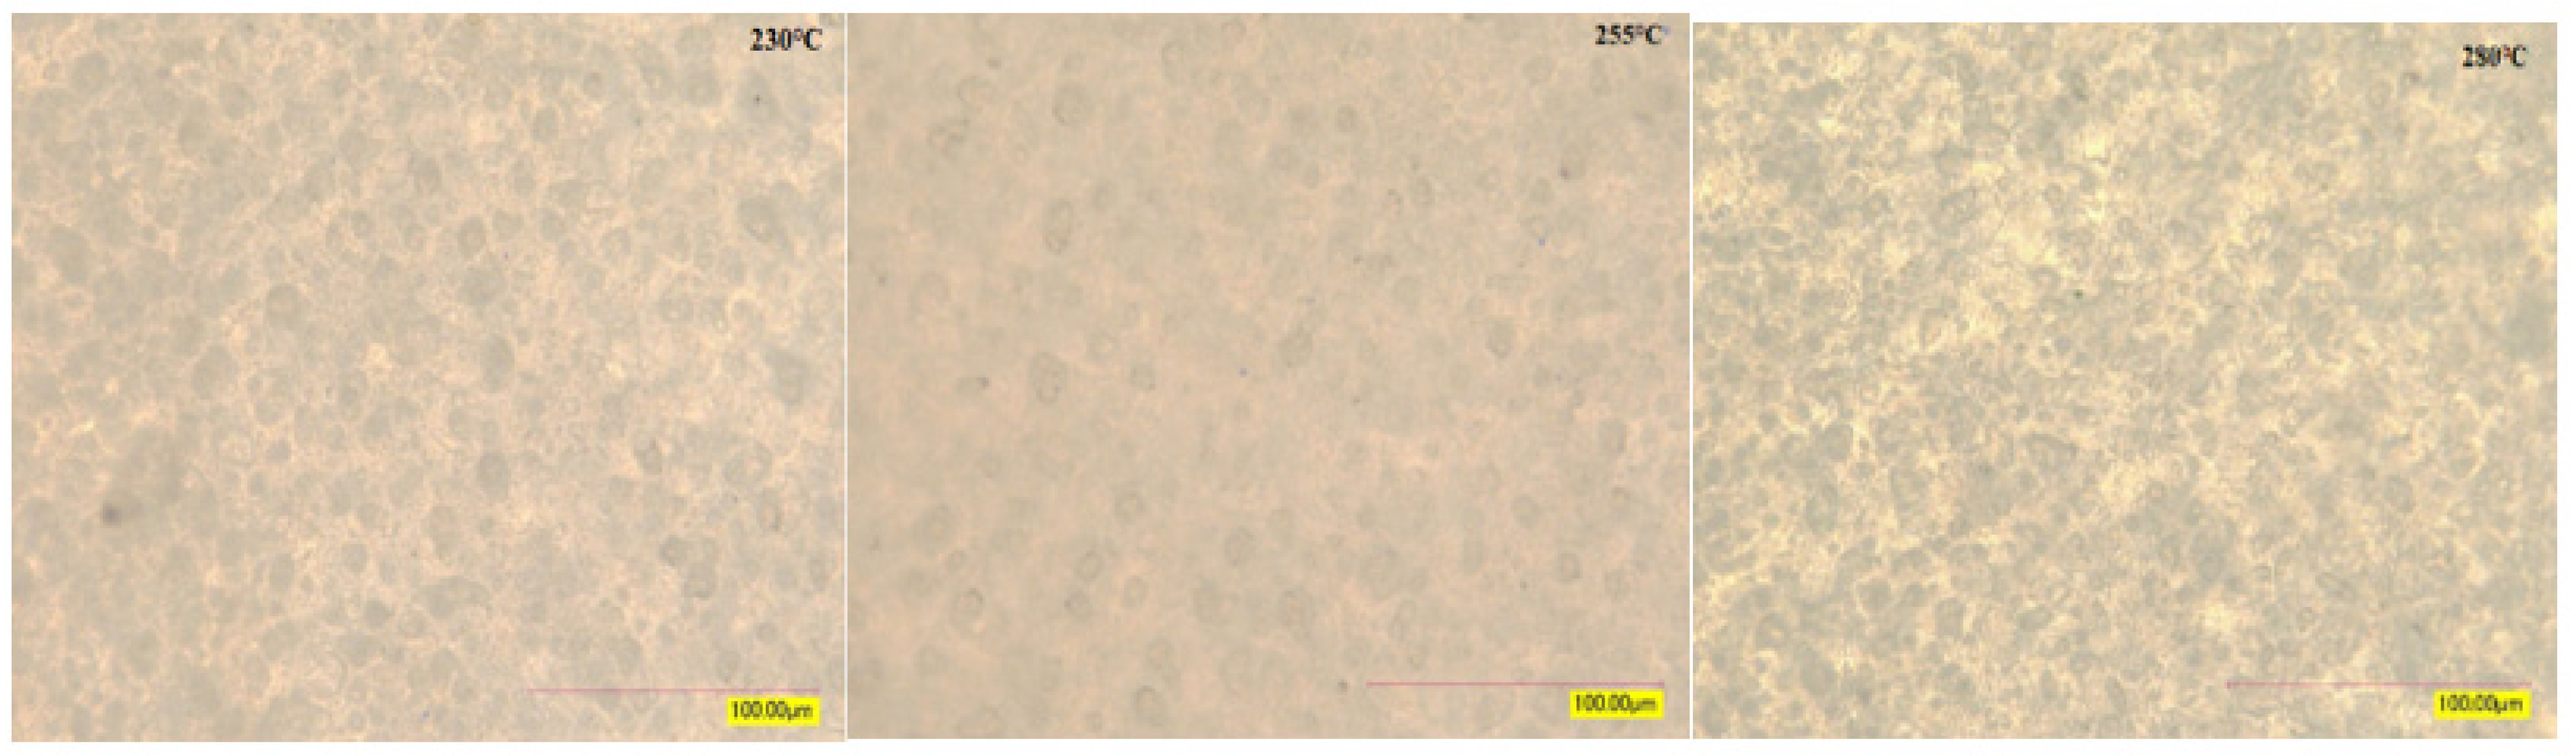
Figure 17.
DOM at Temps (230°C, 255°C, 280°C) rpm (scale 5 µm).
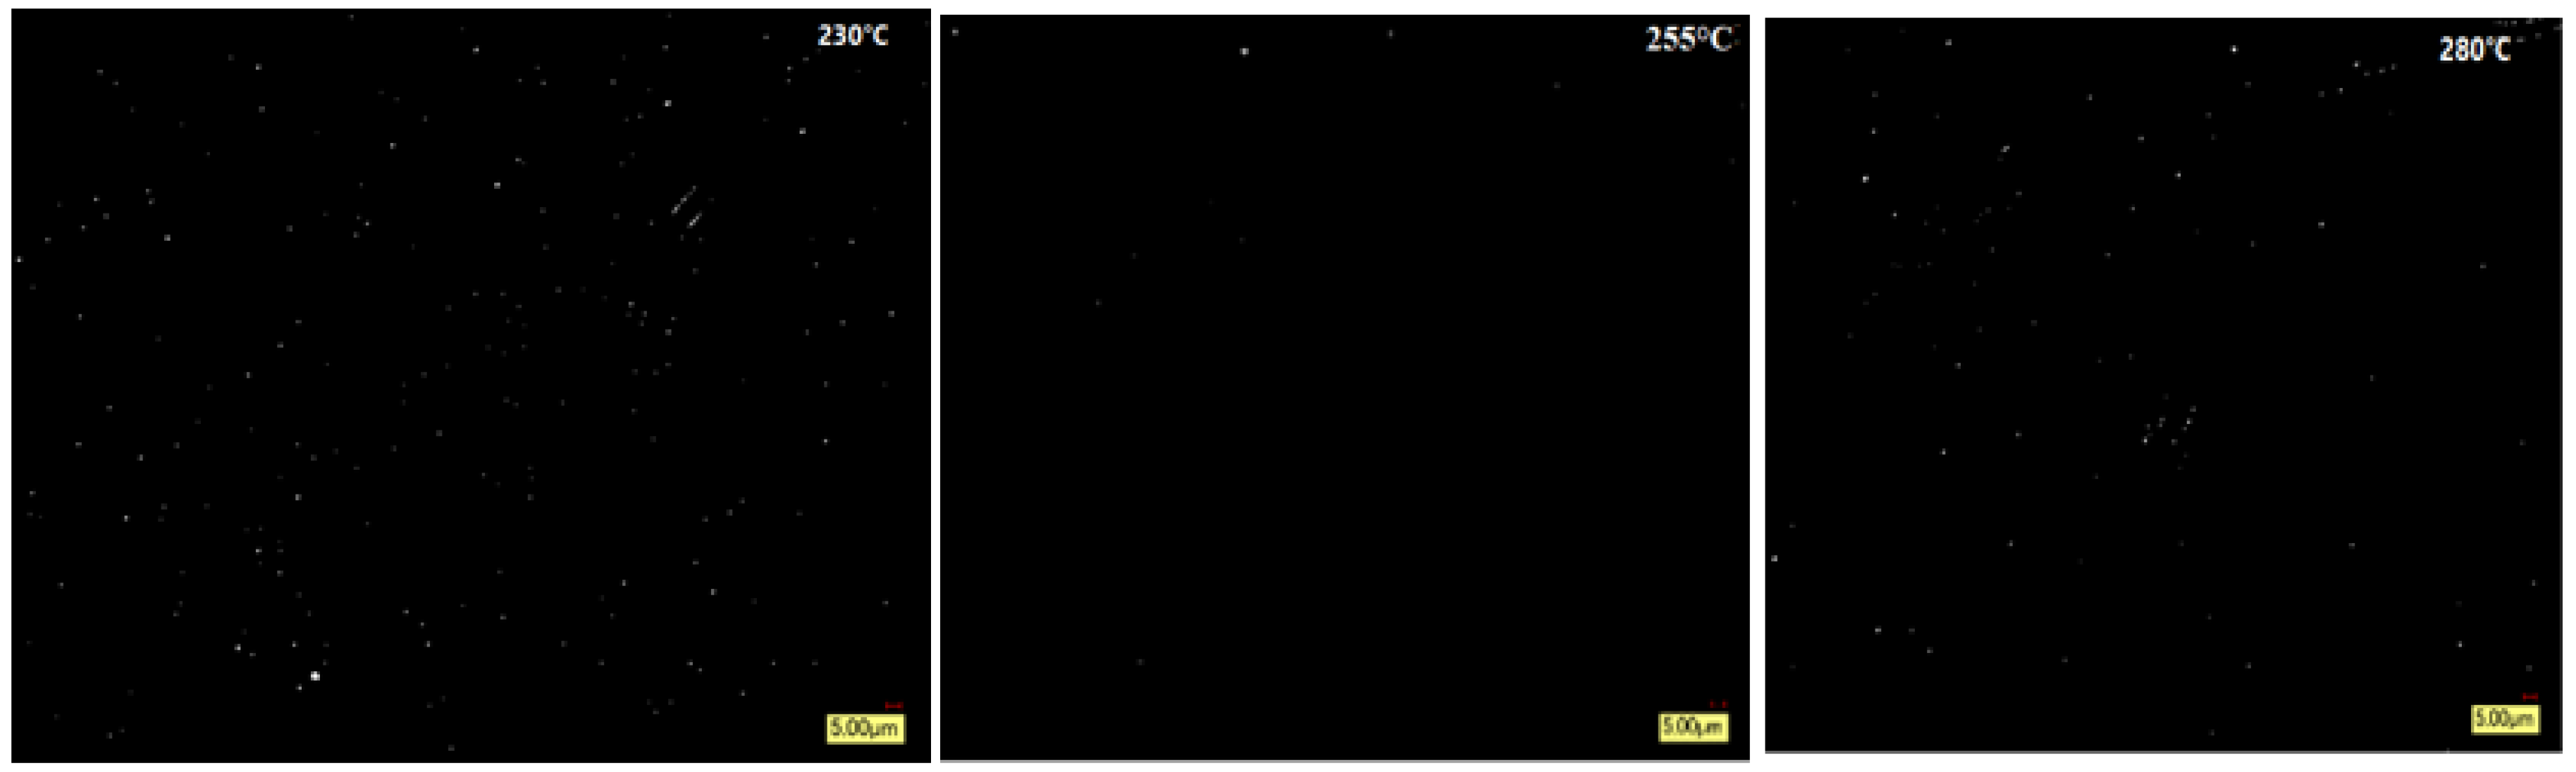
Figure 18.
Red pigments shown in scanning electron micrographs A- (pigment agglomerates, 50 nm) and B- (pigment particles, 200 nm) for clarity.
Figure 18.
Red pigments shown in scanning electron micrographs A- (pigment agglomerates, 50 nm) and B- (pigment particles, 200 nm) for clarity.
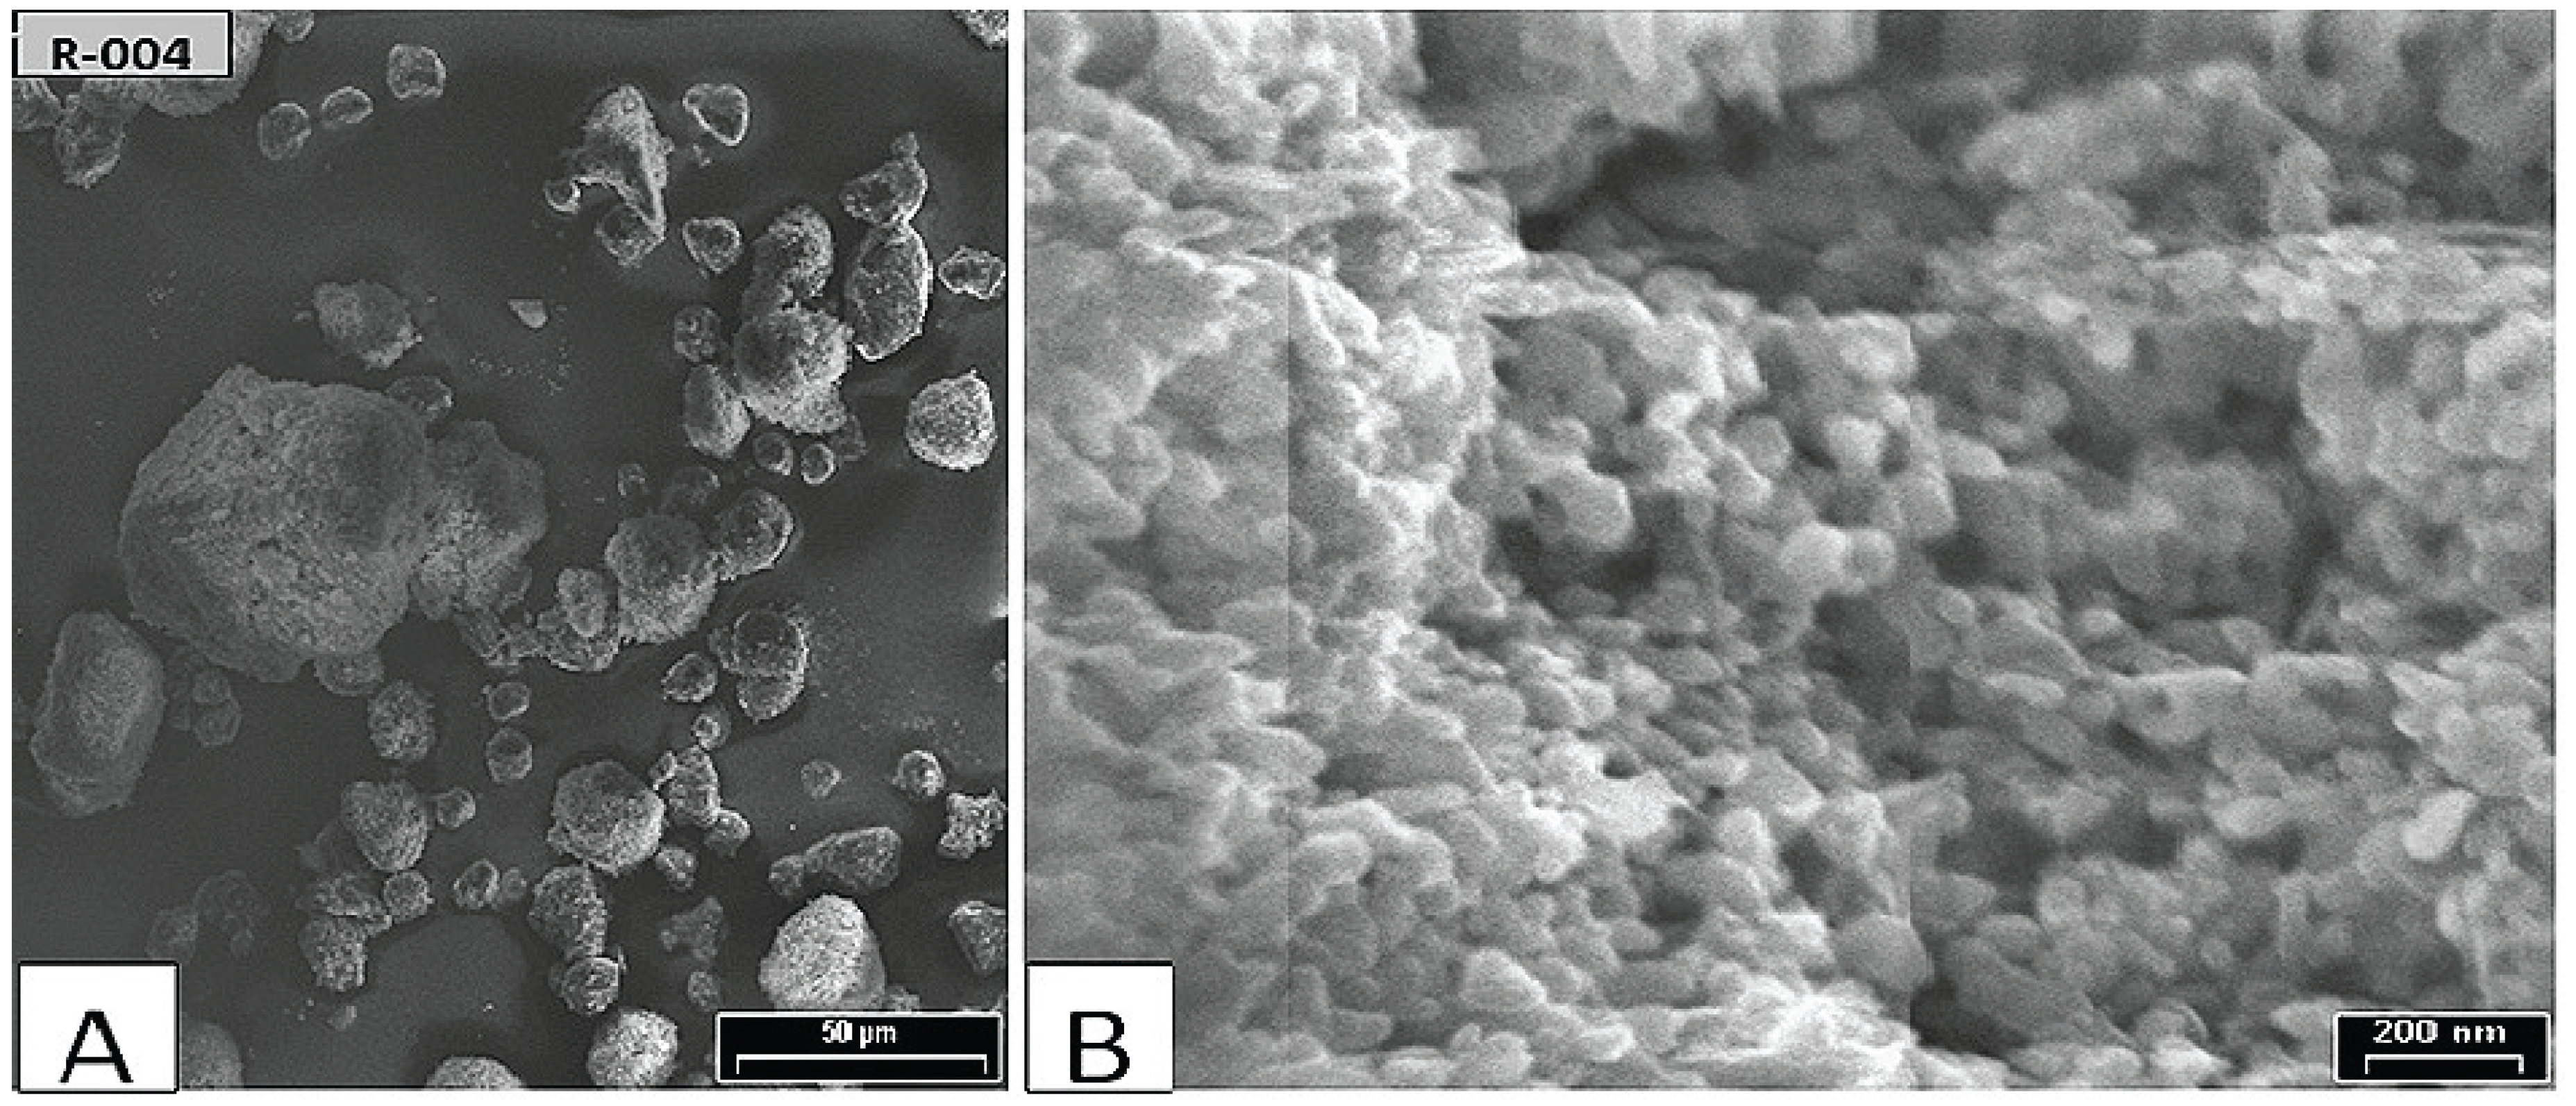

Table 1.
Color formulation for Grade A.
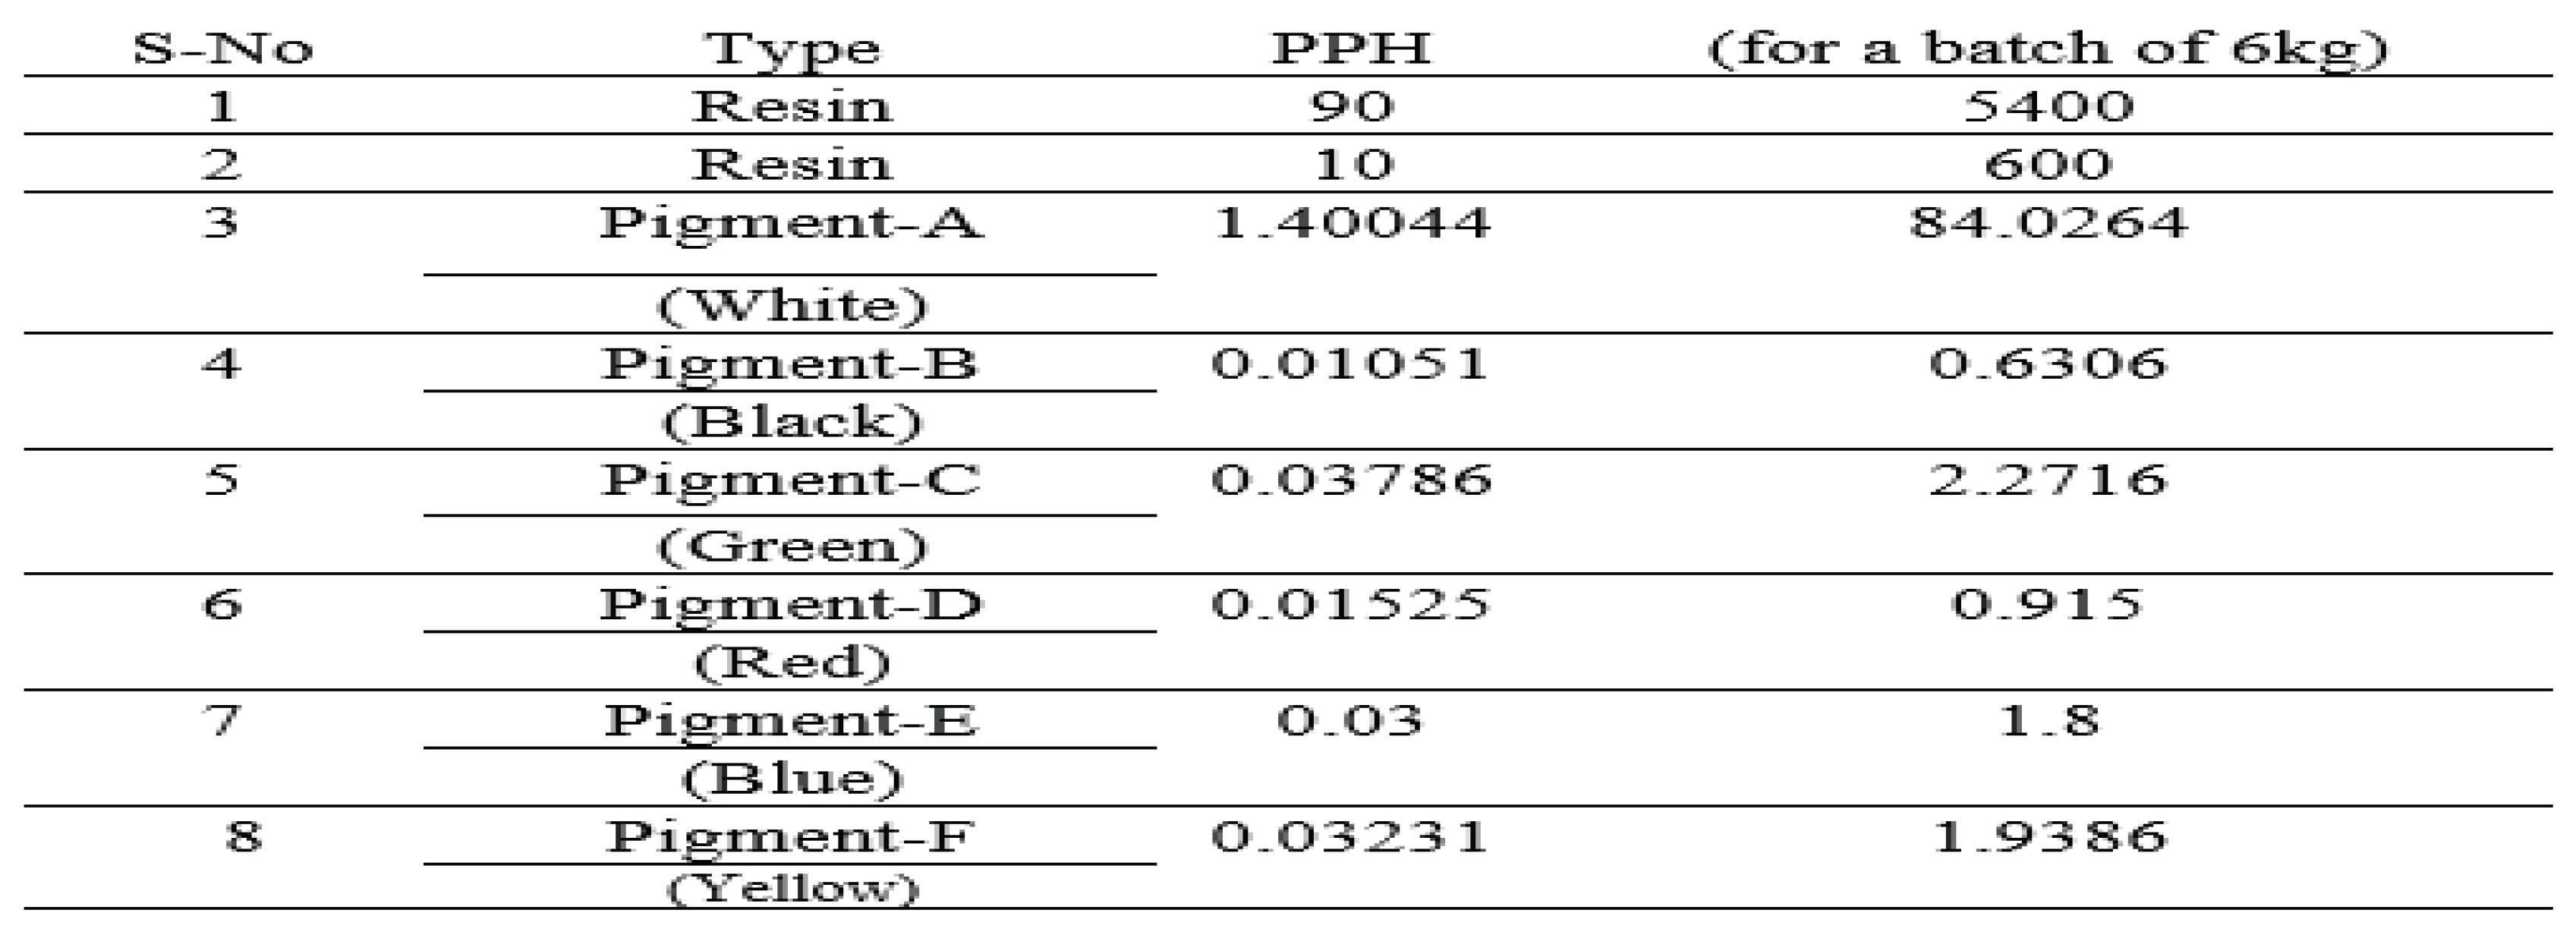 |
Table 2.
Identification of the ‘Bad’ Pigments.
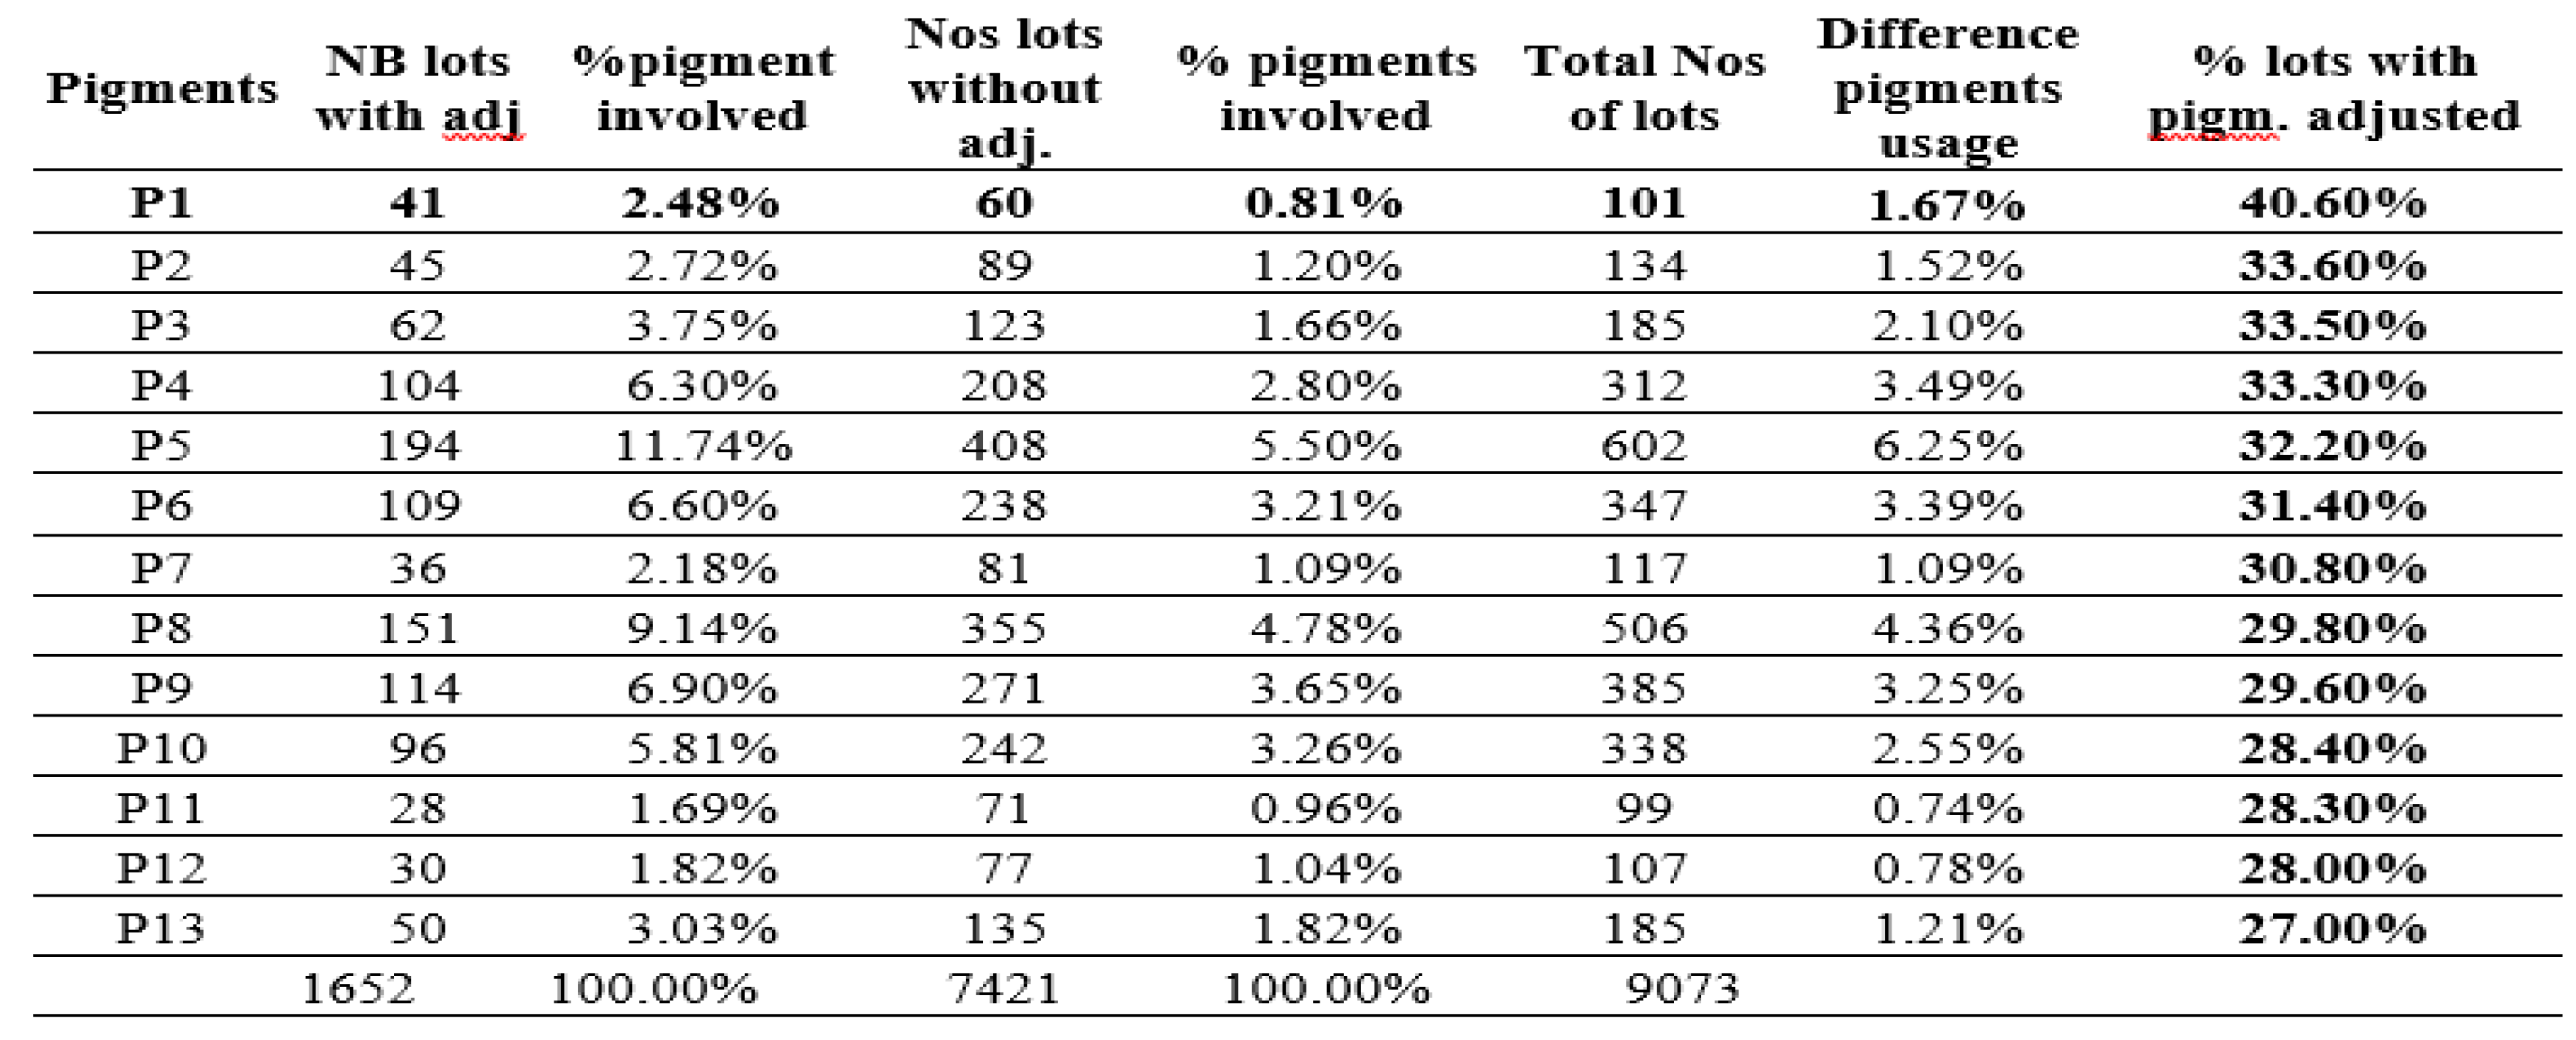 |
Table 3.
Diameter and Ultrasound time/sec of raw pigments powder.
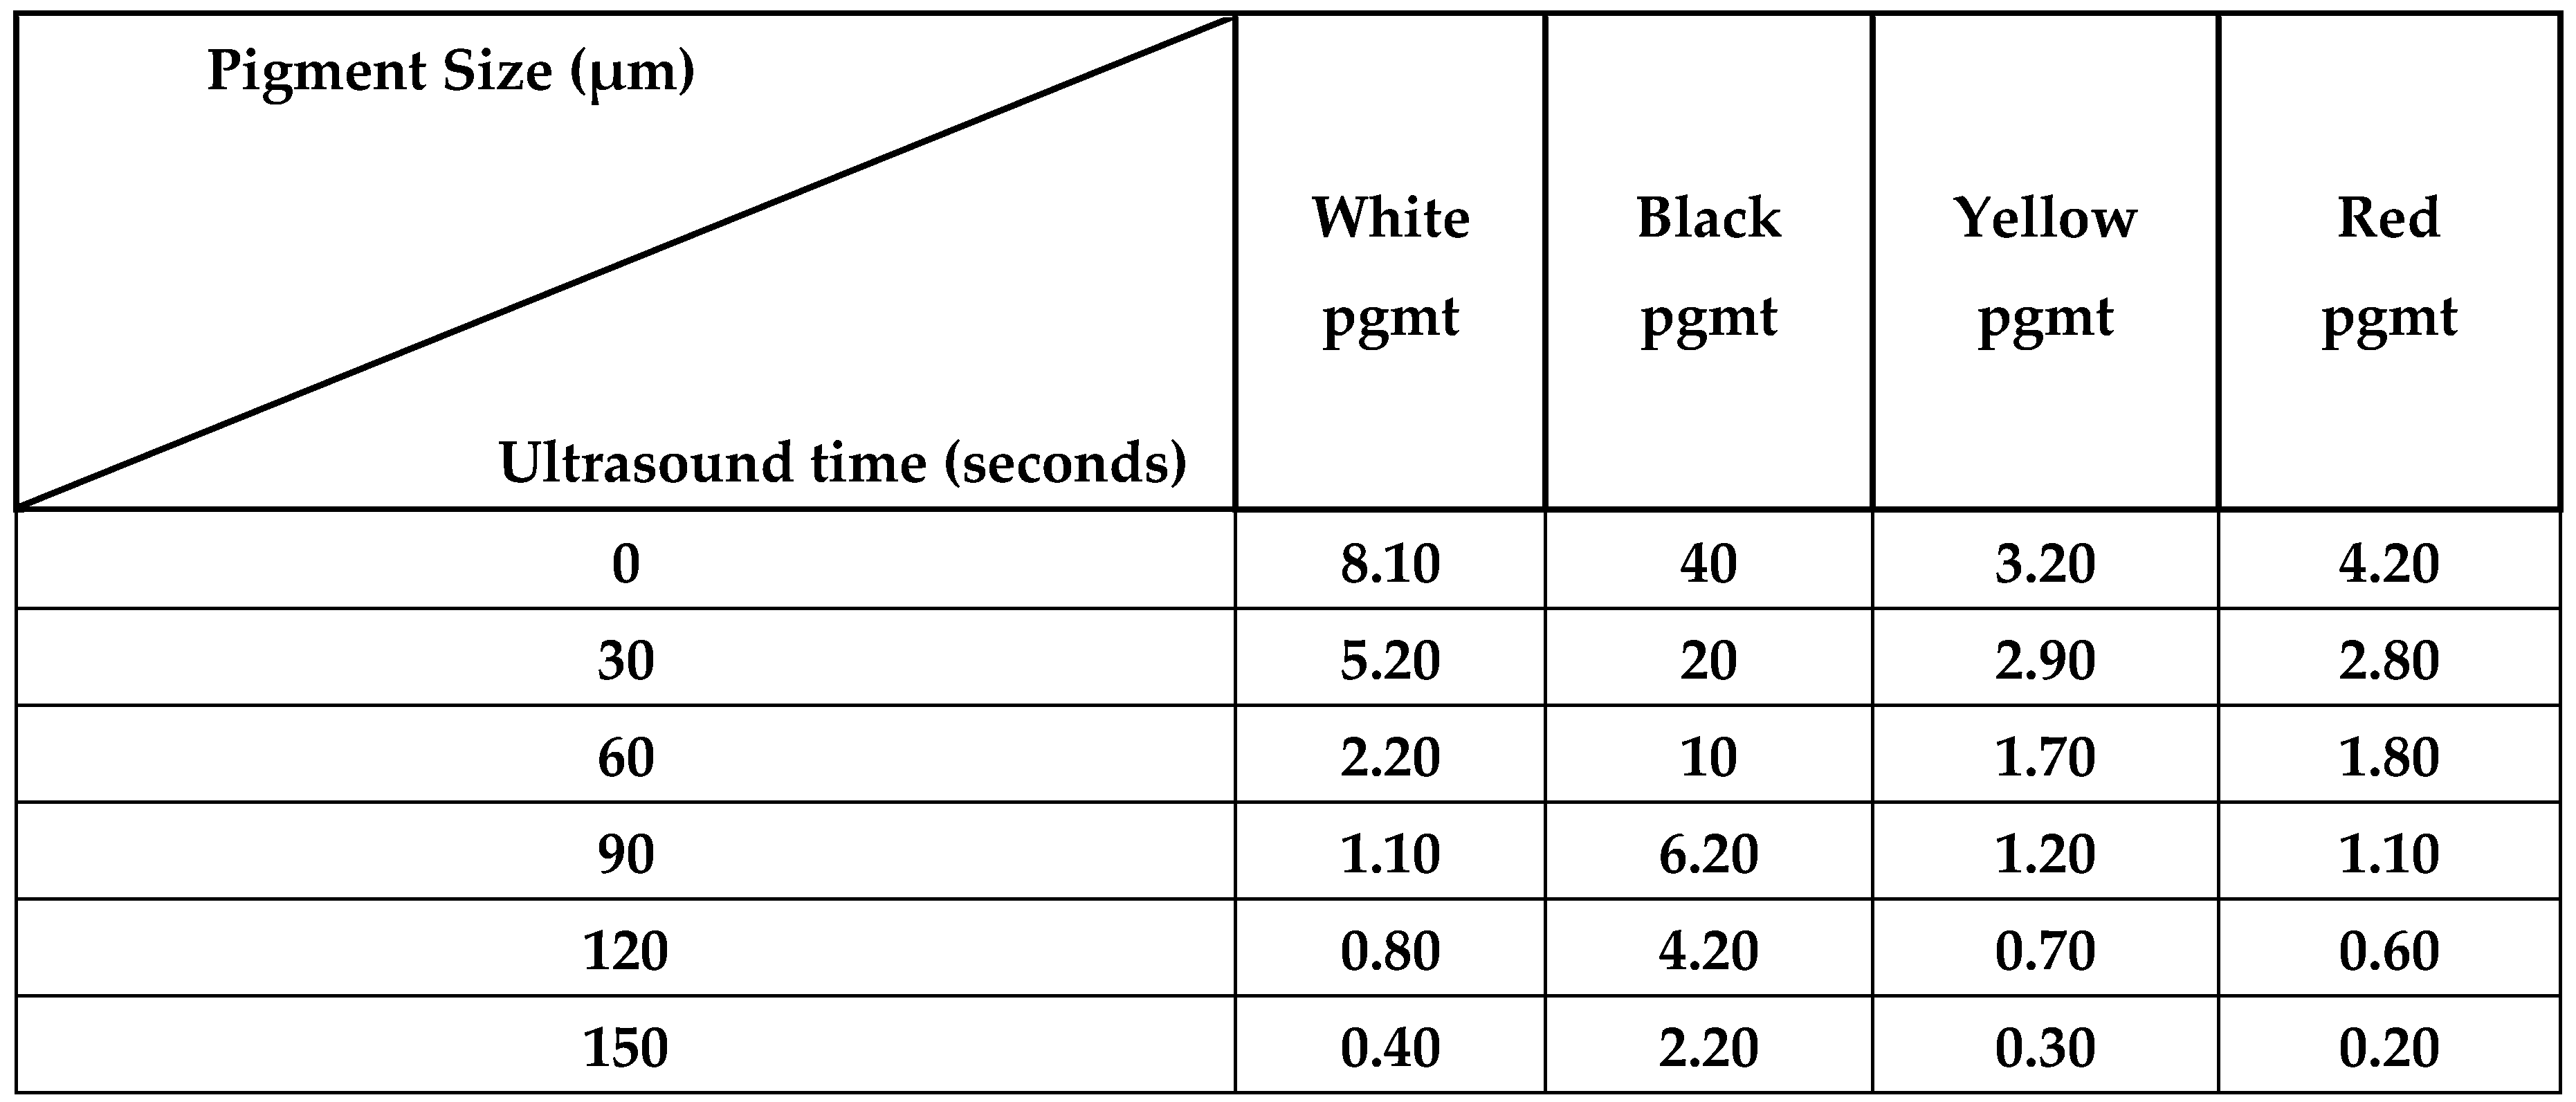 |
Table 4.
Speciation data of the operating extruder screw line.
 |
Table 5.
Fix two PPs, vary the third one ( processing Ts).
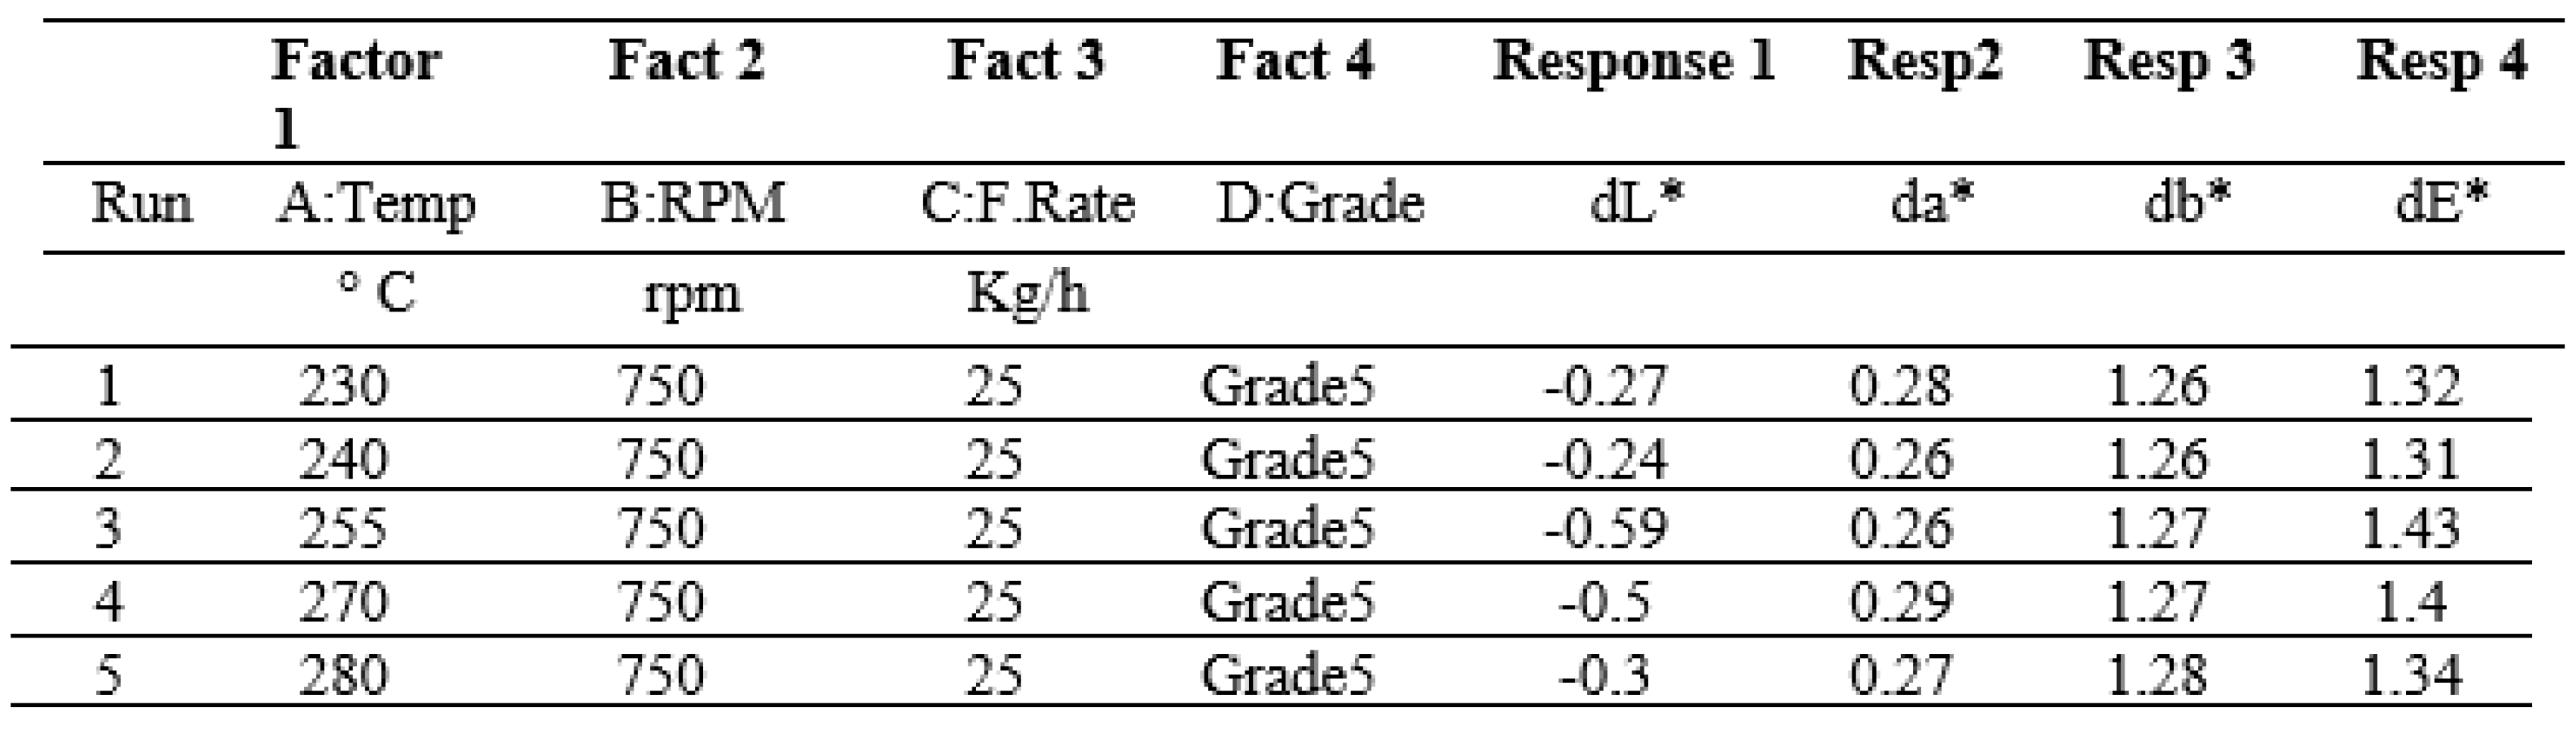 |
Table 6.
Observations for the variation of Temp Parameters.
 |
Table 7.
Impact of Process Conditions on Yellow-Blue (db*) color shift Value.
 |
Table 8.
3 levels and parameters Experimental designs.
| Parameters for Processing | Various measuring system |
Three levels of coding | ||
| -1.0 | 0.0 | +1.0 | ||
| Temp. | degrees Celsius | 230 | 255 | 280 |
| Speed. | revolutions per minute | 700 | 750 | 800 |
| Feed. Rate. | kilogram per hour | 20 | 25 | 30 |
Table 9.
Design of Experiments (DOE) Using A Factorial Design with Three Levels.
| Factor-1 | Factor-2 | Factor- 3 | R1 | R2 | R3 | R4 | |
| Run | A:Temp | B:speed | C: F-rate | L* | a* | b* | dE* |
| 1 | 255 | 750 | 30 | 64.01 | 0.11 | 1.38 | 1.38 |
| 2 | 280 | 750 | 30 | 62.96 | 0.05 | 1.4 | 1.28 |
| 3 | 255 | 800 | 25 | 64.22 | 0.1 | 1.48 | 1.6 |
| 4 | 255 | 700 | 20 | 63.73 | 0.12 | 1.38 | 1.45 |
| 5 | 280 | 750 | 20 | 63 | 0.06 | 1.44 | 1.33 |
| 6 | 255 | 800 | 30 | 62.75 | 0.016 | 1.29 | 1.29 |
| 7 | 280 | 700 | 25 | 62.87 | 0.06 | 1.5 | 1.52 |
| 8 | 230 | 750 | 30 | 62.93 | 0.1 | 1.37 | 1.18 |
| 9 | 255 | 750 | 20 | 64.15 | 0.13 | 1.46 | 1.47 |
| 10 | 280 | 700 | 20 | 63.24 | 0.08 | 1.4 | 1.46 |
| 11 | 230 | 750 | 20 | 62.858 | 0.128 | 1.52 | 1.39 |
| 12 | 280 | 800 | 30 | 63.14 | 0.06 | 1.44 | 1.328 |
| 13 | 230 | 700 | 20 | 62.92 | 0.11 | 1.38 | 1.30 |
| 14 | 230 | 800 | 30 | 63.31 | 0.09 | 1.4 | 1.15 |
| 15 | 255 | 750 | 25 | 62.9 | -0.086 | 1.3 | 1.535 |
| 16 | 230 | 800 | 20 | 63.9 | 0.038 | 1.6 | 1.44 |
| 17 | 255 | 800 | 20 | 61.69 | -0.195 | 1.24 | 1.67 |
| 18 | 255 | 700 | 30 | 62.05 | -0.04 | 1.21 | 1.58 |
| 19 | 230 | 700 | 25 | 63.77 | 0.09 | 1.48 | 1.38 |
| 20 | 230 | 800 | 25 | 63.6 | 0.09 | 1.375 | 1.14 |
| 21 | 280 | 700 | 30 | 63.09 | 0.08 | 1.42 | 1.36 |
| 22 | 230 | 700 | 30 | 63.55 | 0.1 | 1.39 | 1.25 |
| 23 | 280 | 800 | 25 | 63.07 | 0.046 | 1.45 | 1.348 |
| 24 | 280 | 750 | 25 | 62.83 | 0.083 | 1.47 | 1.425 |
| 25 | 230 | 750 | 25 | 63.38 | 0.088 | 1.475 | 1.225 |
| 26 | 255 | 700 | 25 | 64.165 | 0.136 | 1.44 | 1.565 |
| 27 | 280 | 800 | 20 | 62.91 | 0.11 | 1.4 | 1.33 |
Table 10.
Analysis of Variance (ANOVA) Summary for Color Response.
| Sources | (SS) | (df) | (MS) | F-values | p-values | Significance results |
| Models | 0.820 | 5 | 0.164 | 18.5 | <0.00010 | Significant |
| A (Temps) | 0.360 | 1 | 0.36 | 40.2 | <0.00010 | Highly -significant |
| C (Feed) | 0.090 | 1 | 0.09 | 10.1 | 0.004 | Significant |
| AC | 0.14 | 1 | 0.14 | 15.8 | 0.001 | Significant |
| A² | 0.18 | 1 | 0.18 | 20.3 | <0.001 | Significant |
| C² | 0.05 | 1 | 0.05 | 5.6 | 0.02 | Moderate |
| Residual | 0.19 | 21 | 0.009 | — | — | — |
| Lack of Fit | NS | — | — | — | >0.05 | Not significant |
Table 11.
Model Quality Validation Metrics.
| Metric | Value | Interpretation |
| R² | 0.91 | Excellent fit |
| Adjusted R² | 0.88 | Strong model reliability |
| Predicted R² | 0.85 | Good predictive power |
| Std Dev | Low | Small residual error |
| Lack of Fit | Not significant | Model valid |
| Adeq Precision | > 4 | Adequate signal |
Disclaimer/Publisher’s Note: The statements, opinions and data contained in all publications are solely those of the individual author(s) and contributor(s) and not of MDPI and/or the editor(s). MDPI and/or the editor(s) disclaim responsibility for any injury to people or property resulting from any ideas, methods, instructions or products referred to in the content. |
© 2026 by the authors. Licensee MDPI, Basel, Switzerland. This article is an open access article distributed under the terms and conditions of the Creative Commons Attribution (CC BY) license (http://creativecommons.org/licenses/by/4.0/).
Copyright: This open access article is published under a Creative Commons CC BY 4.0 license, which permit the free download, distribution, and reuse, provided that the author and preprint are cited in any reuse.


