

Submitted:
06 July 2026
Posted:
08 July 2026
You are already at the latest version
Abstract
The expansion of sustainable timber harvesting on peatland forests is important for forest owners, contractors, and the forest industry. This study investigated the effects of site-specific conditions on summer-time harvesting operations and modeled the influence of a light nine-ton forwarder on rut formation. Three logistic mixed-effects models predicted peat surface disturbance (ROC = 0.60, 0.63, and 0.67), while a linear mixed model predicted rut depth when rutting occurred (R² = 0.35). Rut formation was associated with the number of machine passes, cumulative load, groundwater table depth, peat layer thickness, and interactions between stand and harvesting variables. The results indicate that timber can be successfully forwarded from peatlands with limited bearing capacity when operations are adapted to local site conditions. The findings highlight the importance of road-network planning, load management, and operator decision-making in reducing rut formation. This modeling approach also supports operator training, thereby contributing to more sustainable timber harvesting on low-bearing-capacity sites.
Keywords:
environmental sustainability
; forwarder
; planning
; road network
; rut formation
; tacit knowledge
1. Introduction
Climate change is expected to shorten the winter season in northern coniferous forests, including southern Lapland, by about one month by 2050 [1]. Consequently, the period suitable for winter timber harvesting is shrinking, increasing the importance of harvesting on peatlands with low bearing capacity and seasonally fluctuating groundwater levels.
Current forest management trends in Europe emphasize environmental sustainability and climate-resilient continuous cover forestry supported by advanced harvest planning tools [2,3,4,5]. In peatlands, this has led to less intensive drainage practices, as maintaining forest cover and higher groundwater levels can reduce greenhouse gas emissions from peat decomposition [6]. During the growing season, a groundwater depth of 30–40 cm is generally sufficient for tree growth [7,8], and this can often be achieved with relatively shallow ditches, depending on site conditions [9].
Soil moisture strongly affects load-bearing capacity and rut formation in peatlands [10,11]. Shallower ditches and reduced ditch network maintenance raise groundwater levels and increase soil moisture, thereby decreasing bearing capacity. This trend is evident in southern Lapland, where ditch network maintenance has declined markedly since the early 2000s [12]. Because tree-mediated groundwater regulation and evapotranspiration are lower in northern than in southern Finland [8], maintaining critical ditch networks remains important for water management and trafficability [7,13,14,15,16].
Timber harvesting on peatlands is gaining importance in Finland because of increasing wood demand and reduced imports [17]. In southern Lapland, drained peatlands are expected to provide about 25% of all harvested timber within the next decade, highlighting the need for effective summertime harvesting methods [12]. For planning purposes, sustainable timber harvesting operations are governed by standards for rut depth, tree damage, strip road spacing and width, thinning intensity, and tree selection [18].
The decades-long trend towards heavier forwarders may not support sustainable summer harvesting on drained peatlands. The operating weight of forwarders has increased from 10–13 tons in the 1980s to approximately 18–19 tons today, resulting in a fully loaded machine mass of 35–40 tons. Although track equipment can improve load-bearing performance [19,20], development has largely focused on adapting machinery designed for mineral soils to peatland conditions [21].
The load-bearing capacity classification was developed for southern Finland to support the planning of timber harvesting on peatlands [22]. The load-bearing capacity classification defines the site conditions under which a forest machine with specific equipment can operate on peatlands outside the ground-frost period. The classification considers the initial volume of a stand per hectare before harvesting, the type of harvesting machinery, the average forest haulage distance, the groundwater level, the rainfall over the previous four weeks, peat layer thickness, and the road network at the harvesting site. In addition to these conditions, the distribution of logging residues on forwarding trails can substantially improve bearing capacity and reduce rut formation during forwarding operations [23,24,25].
Forest road network planning affect timber harvesting costs [26]. Although spatial data and decision-support systems are increasingly available [27], successful timber harvesting on low-bearing-capacity peatlands still depends heavily on operators’ experience in adjusting routes, load sizes and harvesting sequences to local conditions [28]. Apart from terrain slope and carrying capacity, which are known to influence route selection, the factors affecting road network planning remain poorly understood. Inadequate planning may lead to soil disturbance, compaction, and rut formation, thereby damaging forest soils [29]. In peatlands, rutting is the most significant form of damage because it affects shallow root systems and can reduce tree growth for up to ten years after harvesting [30,31]. Although wider road networks may reduce rutting by allowing alternative machine routes [32], they can also increase growth losses [31].
Recent EU biodiversity, soil, and forestry initiatives are expected to affect future timber harvesting practices and costs [33]. Together with national forest management recommendations, these policies increase the need for precise harvest planning on peatlands to minimize environmental damage [34], particularly as forest machinery continues to become heavier. A potential drawback of lighter forwarders is that they require a greater number of trips, which may increase the risk of rut formation. Rutting is influenced not only by machine traffic but also by site conditions, harvesting practices, road layout, and load management [21]. However, the relative importance of site conditions, harvesting practices, road layout, and machine loading in explaining rut formation remains insufficiently understood, particularly under operational harvesting conditions where most rutting occurs during the first machine passes. This study aimed to address this knowledge gap by developing statistical models to identify the key factors associated with rut formation on drained peatlands.
2. Materials and Methods
The study site (5.8 ha) was a typical drained peatland with ditch spacing ranging from 37 to 49 m and was harvested by thinning during the summer (Figure 1). Ditch condition was classified as below average or poor according to [35], representing a common condition in drained peatlands with limited maintenance drainage.
The peat thickness on the plot was determined as an average based on five measurement points. In the center of the sample plots, excavation was used to measure the water table level weekly. Stand volumes were measured on these plots, which were divided into three categories: 75–120 m3ha−1 (V120, n = 23), 120–150 m3ha−1 (V150, n = 21), and 150–181 m3ha−1 (V180, n = 13). This classification was carried out, in principle, as outlined by [22], considering, however, that the average stand volume (m³ha⁻¹) is significantly lower in northern Finland.
The road network was planned after the sample plots had been established so that the forest haulage (forwarding) distance would be as short as possible considering prevailing site and stand characteristics. Due to the experimental design, road spacing was approximately 32 m, leaving some unthinned space between the roads. The roads went straight through the center of the plot. The objective was to position the main roads in areas where the stand volume mainly represented groups V150 and V180, although some parts of the main roads passed through area belonging to group V120. The network design of all roads was aimed at keeping the number of passes on the collection road between 2 and 5. The average forest haulage distance was 310 m, of which approximately 260 m was on drained peatland.
2.1. Implementation of Timber Harvesting
Timber harvesting was carried out from August 11 to August 17, 2017, using a six-wheeled Komatsu 901TX harvester. The machine was equipped with Clark TXL 24-mm tracks and front chains. The track shoe width was 930 mm. The total operating weight of the harvester, including equipment, was 20.4 tons, and the nominal ground pressure (NGP, 8%) was 43 kPa. The average harvesting removal was 66 m3ha−1.
Forwarding was carried out from August 17 to August 20, 2017, using an eight-wheeled John Deere 810E forwarder with a payload capacity of 9 tons. The forwarder was equipped with Clark TXCL 24-mm tracks on the front wheels and Clark TXL 24-mm tracks on the rear wheels, both with a track shoe width of 930 mm. The total operating weight of the forwarder, including equipment, was 17.1 tons.
The mean load weight was 9.7 tons for coniferous timber and 6.2 tons for birch pulpwood, with corresponding mean log lengths of 402 cm and 302 cm, respectively. Depending on the load weight during loading (1.1–10.3 tons), the nominal ground pressure (NGP, 8%) exerted by the forwarder varied between 28 and 43 kPa among the sample plots.
During the forwarding period, total rainfall amounted to 17.9 mm, corresponding to an average of 4.5 mm day⁻1. For comparison, the mean daily rainfall in August 2017 was 1.7 mm day⁻1.
In the forwarding analysis, the cumulative machine load (tons per sample plot) was used as the classification criterion. The cumulative machine load was calculated as the sum of the harvester weight and the forwarder weight, including timber loads, for all machine passes within a sample plot. Based on the cumulative machine load after all passes, the plots were classified into three categories:
• Class 100: cumulative machine load < 100 tons (n = 22);
• Class 200: cumulative machine load ≥ 100 tons and < 200 tons (n = 26);
• Class 400: cumulative machine load ≥ 200 tons (n = 9).
The machine operator had more than 15 years of experience in both harvesting and forwarding operations. A harvesting plan was provided to the operator before the operation. During harvesting, the operator assessed site conditions and subsequently determined the forwarding routes, driving sequence, and load sizes.
Harvesting was conducted first throughout the entire study area, after which the timber was forwarded to the roadside landing. Based on observations made during harvesting, the operator identified areas where the load-bearing capacity of the peatland was likely to restrict the size of forwarding loads or the number of machine passes.
2.2. Timber Harvesting Measurements
Prior to harvesting, stand volume, tree height, and crown base height were measured in each sample plot. Tree-species-specific stand volumes were calculated using height curves and volume equations [36]. After harvesting, stand volume was remeasured, and the harvested volume was calculated as the difference between the pre-harvest and post-harvest stand volumes. In addition, all harvested timber was measured using the forwarder’s onboard weighing system.
The amount of crown biomass was estimated separately for each tree species using the biomass models developed by [37,38], based on the dry mass of living and dead branches. Biomass values (kg) were converted to solid wood volume using the logging-residue chip density values reported by [39], including needles: 395 kg m⁻³ for Scots pine, 425 kg m⁻3 for Norway spruce, and 500 kg m⁻3 for birch. The volume of stem wood remaining in treetops was estimated using the volume tables of [36]. The minimum top diameter was assumed to be 6 cm for conifers and 7 cm for birch. Small trees (DBH ≤ 8 cm) were classified as crown biomass. Thus, crown biomass included branches, foliage, and stem biomass not recovered during harvesting. The amount of crown biomass removed from each plot (dm3 m⁻2) was calculated as the difference between the estimated crown biomass of the pre-harvest stand and that of the residual stand after harvesting.
For each forwarder load, travel routes and distances were recorded separately for loaded and unloaded travel, and harvester routes were documented during harvesting. These data were used to determine the number of harvester and forwarder passes within each sample plot, as well as the load associated with each pass and the cumulative machine load.
Forwarding trail width was measured according to the inspection guidelines of the Finnish Forest Centre [40]. Rut-length measurements deviated from the guideline, which records only one rut when both wheel tracks are rutted at the same location. In this study, both wheel-track ruts were measured, resulting in greater reported rut lengths than would be obtained using the standard procedure.
Rutting occurred within the sample plots during both loaded and unloaded forwarding. After each forwarder pass, the total rut length and maximum rut depth were measured and subsequently calculated for each sample plot [38]. Rut depth was measured at the deepest point of each rut. The mean rut depth for a sample plot was calculated as a rut-length-weighted average. In addition, the causes of rut formation were classified into nine categories based on field measurements and visual observations.
2.3. Modeling Rut Formation and Rut Depth
Prior to model fitting, differences in timber harvesting variables among the three cumulative machine-load classes were evaluated using the Kruskal–Wallis (K–W) test based on measurements from the final forwarding pass (n = 57). Because the data did not meet the assumptions of parametric tests and group sizes were unequal, pairwise comparisons between main trails (n = 16) and secondary trails (n = 41) were performed using the Mann–Whitney U (M–W) test [41].
Rutting was analyzed using a two-part (hurdle-type) modeling approach. In the first stage, rut formation was treated as a binary response variable. A plot was classified as unrutted when the peat surface remained intact and rut depth could not be measured (0); plots exhibiting rutting were coded as 1. The probability of rut formation was analyzed using logistic mixed-effects models. In the second stage, only observations with measurable rutting (rut depth > 0 cm) were included, and rut depth was analyzed using linear mixed-effects models.
The logistic models were fitted using the glmmPQL function in the MASS package [42], allowing the inclusion of a first-order autoregressive [AR(1)] correlation structure. Model predictions were generated and visualized using the effects package [43,44], and model discrimination was evaluated using the area under the receiver operating characteristic (ROC) curve calculated with the pROC package [45].
Rut depth was analyzed using the lme function in the nlme package [46]. Fixed-effect predictions and 95% confidence intervals were generated using the effects package, and the coefficient of determination (R2) was calculated using the performance package [47]. All analyses were conducted in R [48]. The structure of the logistic autoregressive mixed-effects model (Models 1 and 2) fitted to the longitudinal dataset can be expressed as follows:
A linear mixed-effects model (Gaussian distribution; Model 3) was used to analyze rut depths > 0 cm. Rut depth was log-transformed to improve normality. The model included a random sample plot effect and repeated measurements within plots:
Here, is the rut depth in sample plot at measurement occasion , represents fixed effects, the random plot effect, and the residual error. Residuals were assumed to follow an AR(1) correlation structure to account for temporal dependence among repeated measurements.
3. Results
Rutting occurred in 39 of the 57 sample plots and was more frequent during loaded than unloaded passes (Table 1). The number of rut formation events averaged two per plot, ranging from one to seven. Thirteen plots belonged to the 100-ton load class (mean cumulative load 71 t), 17 to the 200-ton class (143 t), and nine to the 400-ton class (442 t).
Eighteen sample plots remained free of rutting, almost all of which were located on collecting roads. On average, each plot was traversed five times: three times by an unloaded machine and twice by a loaded forwarder. Nine plots belonged to the 100-ton load class, with an average cumulative load of 52 t, and nine plots belonged to the 200-ton load class, with an average cumulative load of 134 t. Across all rut-free plots, the mean cumulative load was 93 t, ranging from 40 to 186 t.
Site variables did not differ between plots with and without rutting. However, total cumulative load (p = 0.014), total number of passes (p = 0.018), and number of loaded passes (p = 0.006) were significantly higher in plots where rutting occurred.
3.1. Analysis of Rut Formation
Deep ruts (>20 cm) represented only 5.3% of the trail length. Both average rut depth and rut length increased with cumulative load, and rut length approximately doubled between the 200-ton and 400-ton load classes (Table 2). However, road width, maximum rut depth, and the length of deep ruts (>20 cm) did not differ significantly among load classes (K–W, p > 0.05). In contrast, the number of ruts differed significantly between load classes (K–W, p = 0.011), whereas differences in total rut length were marginally non-significant (K–W, p = 0.11). All sample plots in the 400-ton load class were located on main roads, while most plots in the 100-ton load class were located on collecting roads.
3.2. Analysis of Stand and Timber Harvesting Variables
Figure 2 shows that load classes differed primarily in traffic intensity and average load weight, while groundwater level, harvesting removal, and crown biomass remained similar across classes.
Compared with main-road plots, collecting-road plots had thicker peat layers, shallower groundwater tables, lower stand volumes, and higher pine crown mass (Table 3). In contrast, spruce crown mass was greater along main roads. Despite substantial differences in traffic intensity and cumulative load, the length of deep rutting (>20 cm) did not differ significantly between road types.
3.3. Modeling
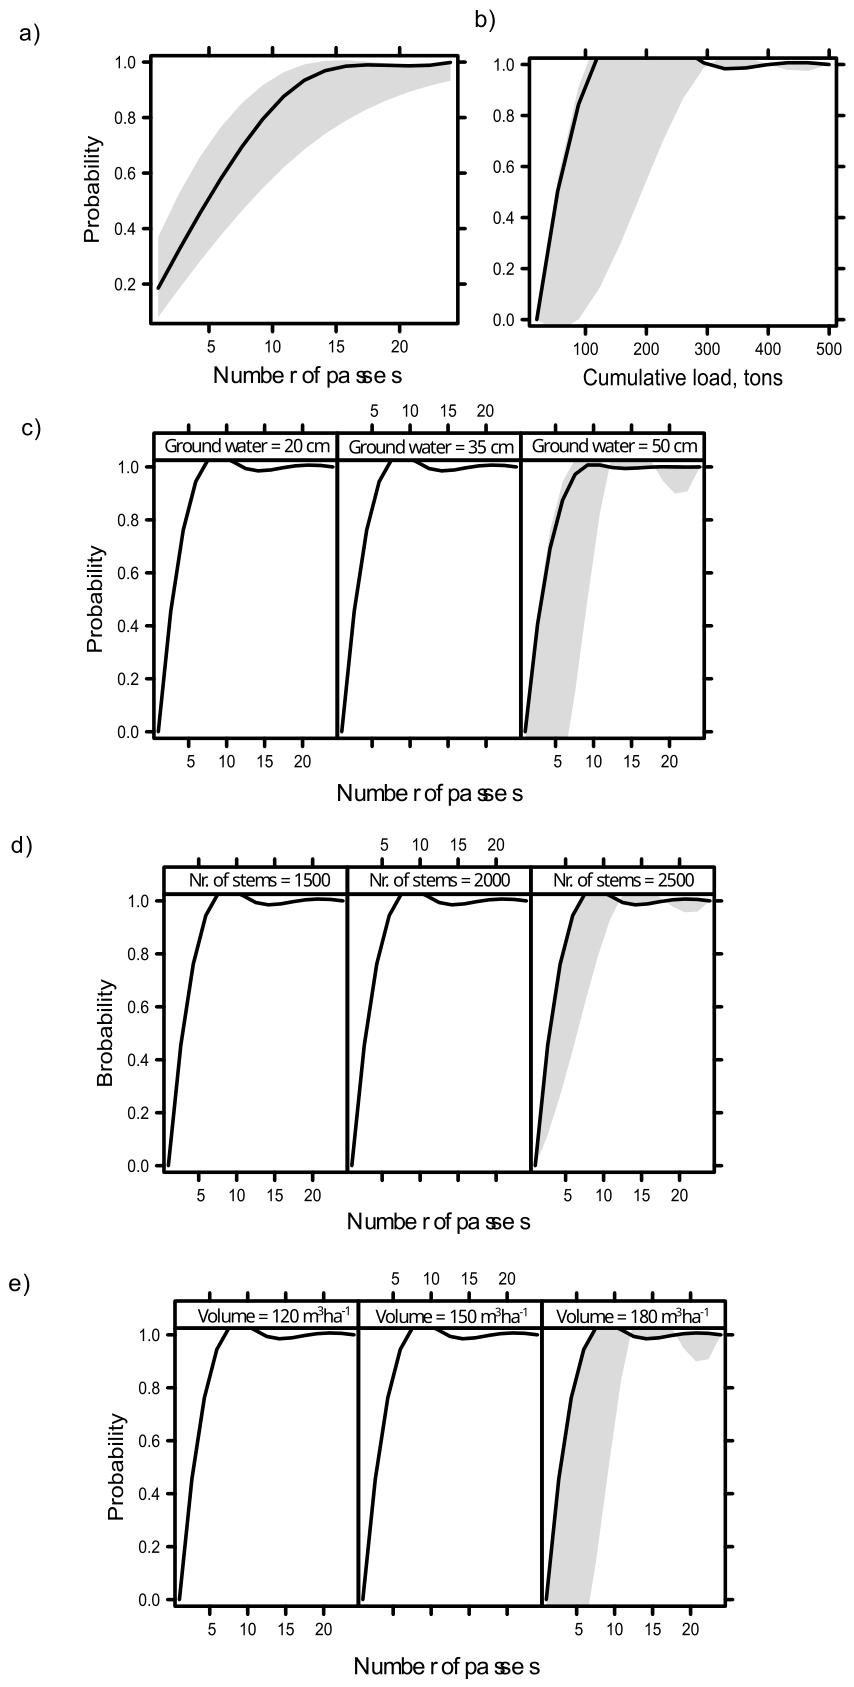
The probability of peat surface disturbance increased with both the number of forwarder passes and cumulative load (Models 1 and 2; Table 4). In addition, groundwater depth was a significant stand predictor of disturbance probability in Model 3. It significantly modified the effect of traffic intensity, whereas stand volume and stem density became significant only through their interactions with the number of passes (Table 4). Disturbance probability increased markedly with increasing traffic intensity, particularly at lower groundwater depths and higher stand volumes. Under these conditions, peat surface disturbance became highly likely after approximately 7–10 machine passes (Figure 3c–e).
Figure 3.
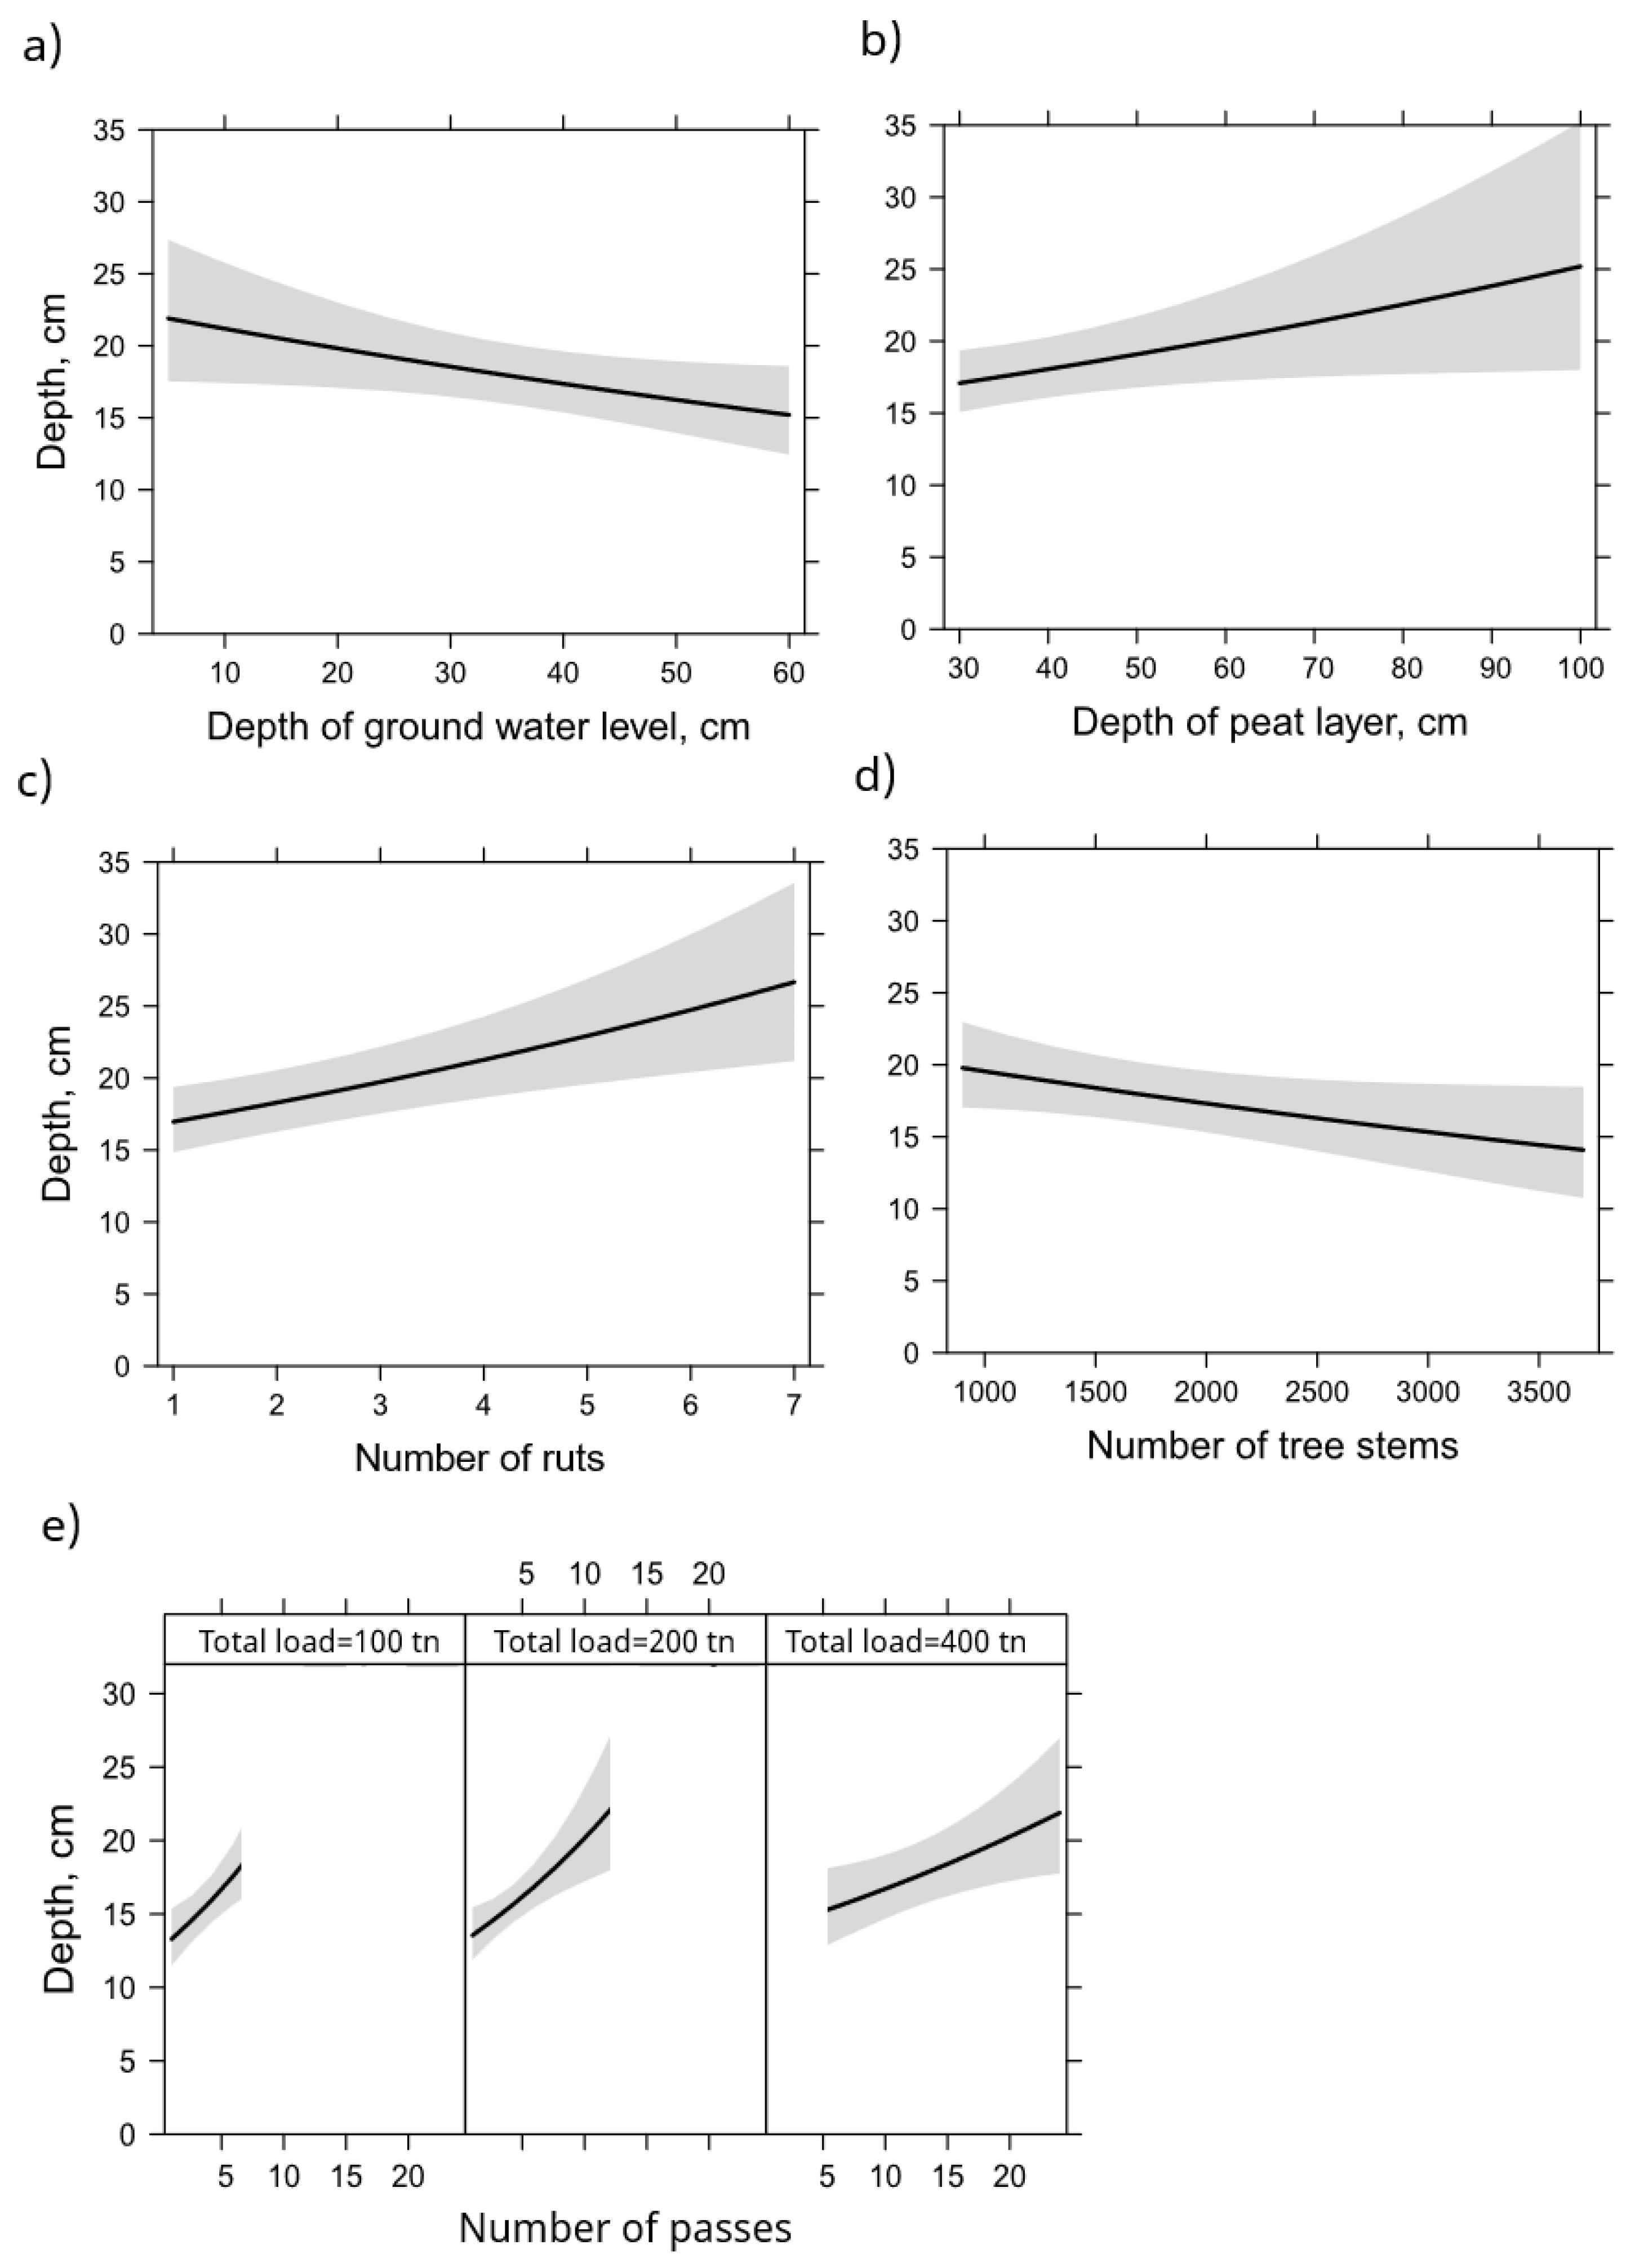
Predicted rut depth from the linear mixed model in relation to (a) groundwater depth, (b) peat layer thickness, (c) number of ruts, (d) stem density, and (e) the interaction between cumulative load and number of passes. Predictions were calculated at the mean values of the other predictors. Shaded areas represent 95% confidence interval.
Figure 3.
Predicted rut depth from the linear mixed model in relation to (a) groundwater depth, (b) peat layer thickness, (c) number of ruts, (d) stem density, and (e) the interaction between cumulative load and number of passes. Predictions were calculated at the mean values of the other predictors. Shaded areas represent 95% confidence interval.
Rut depth was significantly affected by both stand and harvesting variables (Table 5). Among the stand variables, groundwater depth and peat layer thickness were significant predictors of rut depth. Among the harvesting variables, the number of passes and the number of ruts had significant effects. Because cumulative load was strongly correlated with the number of passes, their interaction term was used to account for multicollinearity.
Figure 4 illustrates the effects of stand and harvesting variables on rut depth in the 39 plots where rutting occurred. Rut depth decreased with increasing groundwater depth and increased with peat layer thickness (Figure 4a,b). Predicted rut depth also decreased as stem density increased, declining by approximately 5 cm between 1,000 and 3,000 stems ha⁻1 (Figure 4d). Among the harvesting variables, the interaction between cumulative load and number of passes had the strongest effect on rut depth (Figure 4e). In the 400-ton load class, rutting first appeared after approximately five passes, whereas rut depth increased more rapidly under lower cumulative loads.
Figure 3.
Predicted rut depth from the linear mixed model in relation to (a) groundwater depth, (b) peat layer thickness, (c) number of ruts, (d) stem density, and (e) the interaction between cumulative load and number of passes. Predictions were calculated at the mean values of the other predictors. Shaded areas represent 95% confidence interval.
Figure 3.
Predicted rut depth from the linear mixed model in relation to (a) groundwater depth, (b) peat layer thickness, (c) number of ruts, (d) stem density, and (e) the interaction between cumulative load and number of passes. Predictions were calculated at the mean values of the other predictors. Shaded areas represent 95% confidence interval.
4. Discussion
Rut formation modeling was used to identify stand and harvesting factors affecting rutting during logging and forwarding on drained peatlands. In addition, rut development was modeled in relation to increasing machine passes and cumulative load. The results provide new information on the effects of machinery, road network planning, and operator decisions on rut formation.
Rut depth measurements were conducted manually according to Finnish Forest Centre guidelines [40]. Although uncertainties were associated with determining ground level and rut depth, the measurements followed standard Finnish inspection procedures. Unlike controlled experiments [19,21,32], this study was conducted under real-world operational harvesting conditions, resulting in variation in load weights, machine passes, and site characteristics between sample plots.
Consequently, the results better represent practical forestry operations. The forwarder used was generally lighter than those reported in previous studies. In addition, the load weights of forwarder were lower, resulting in lower cumulative total load weights on the forwarding roads. Operator decisions regarding load size and forwarding strategy likely reduced rutting on sites with poor bearing capacity. While this may have reduced the explanatory power of some models, it also reflects realistic harvesting practices where operators adapt to local conditions.
Rut depths were generally lower than those reported in previous studies for comparable numbers of machine passes (29,33]. Poor bearing capacity was associated with high groundwater levels, thick peat layers, and low stand volumes. However, high stem density, birch-dominated stands, and abundant logging residues often improved bearing capacity and reduced rutting. The results indicate that peat thickness alone is not a sufficient predictor of bearing capacity [22]. Groundwater conditions, peat properties, vegetation, and logging residues also influenced trafficability [8,10,14].
Although crown biomass was not a statistically significant variable in the models, observations suggest that it contributed to reduced rut formation on several sites. These results are consistent with several previous studies [23,24,25]. The slower increase in rut depth observed in the highest cumulative load class was mainly explained by more favorable site conditions rather than load weight itself.
Previous studies have shown that rutting generally increases with the number of machine passes [29,33]. In this study, however, rut formation was influenced by a combination of site conditions, harvesting factors, road network planning, and operator decisions. The results suggest that successful forwarding on peatlands depends not only on limiting traffic but also on adapting operations to local bearing capacity conditions [26,34]. In this study, road network planning was based on stand information, site visits, and airborne laser scanning data.
The objective of planning was to enable summer harvesting while minimizing forwarding distances and environmental impacts. Knowledge of peat properties, groundwater conditions, stand volume, and ditch network conditions proved useful for planning road locations and orientations. Following logging, the operator used observations of site conditions to adjust load sizes, forwarding order, and driving routes [28]. This tacit knowledge helped maintain access to areas with limited bearing capacity and reduced the risk of excessive rut formation.
Logging residues played an important role in reducing rut depths. Where residues were evenly distributed and road surfaces were relatively even, rut depths remained moderate despite repeated passes. In contrast, natural depressions, wet areas, and uneven road surfaces increased rutting even when residue cover was good. Overall, harvesting quality met Finnish legal requirements [40]. The findings highlight the importance of road network preplanning, adaptive forwarding practices, and the effective use of logging residues in reducing environmental impacts on drained peatlands.
5. Conclusions
This study identified and modeled the key factors influencing rut formation and rut depth during summertime timber harvesting on peatland forests. The most important predictors of rutting were the number of forwarder passes, cumulative traffic load, groundwater level, peat thickness, and interactions between stand characteristics and harvesting variables. The results indicate that the risk of rutting is not determined solely by traffic intensity or forwarder’s track equipment. Bearing capacity, road-network planning, and operator decisions can substantially reduce the risk of rut formation, even under relatively high cumulative traffic loads. These findings highlight the importance of adapting operations to local site conditions through appropriate load management, forwarding strategies, and road-network planning. The results also emphasize the value of operators’ tacit knowledge in minimizing environmental impacts and enabling successful timber harvesting on peatlands. Such knowledge could be incorporated into forest machine operator training and peatland harvesting practices throughout northern coniferous forest regions.
Author Contributions
Conceptualization, O.H.; methodology, O.H.,V.H.; software, V.H.; validation, O.H., V.H. and T.P.; formal analysis, O.H., V.H. and T.P.; resources, O.H.; writing—original draft preparation, O.H.; writing—review and editing, T.P.; All authors have read and agreed to the published version of the manuscript.
Funding
This research was funded by University of Eastern Finland.
Data Availability Statement
Suggested Data Availability Statements are available in section “MDPI Research Data Policies” at https://www.mdpi.com/ethics.
Conflicts of Interest
The authors declare no conflicts of interest. The funders had no role in the design of the study; in the collection, analyses, or interpretation of data; in the writing of the manuscript; or in the decision to publish the results.
References
- Lehtonen, I.; Venäläinen, A.; Kämäräinen, M.; Asikainen, A.; Laitila, J.; Anttila, P.; Peltola, H. Projected decrease in wintertime bearing capacity on different forest and soil types in Finland under a warming climate. Hydrol. Earth Syst. Sci. 2019, 23, 1611–1631. [Google Scholar] [CrossRef]
- Seidl, R.; Lexer, M.J. Forest management under climatic and social uncertainty: trade-offs between reducing climate change impacts and fostering adaptive capacity. J. Env. Manag 2013, 114, 461–469. [Google Scholar] [CrossRef] [PubMed]
- Nieminen, M.; Hökkä, H.; Laiho, R.; et al. Could continuous cover forestry be an economically and environmentally feasible management option on drained boreal peatlands? Ecol. Manag. 2018, 424, 78–84. [Google Scholar] [CrossRef]
- Pardos, M.; del Río, M.; Pretzsch, H.; et al. The greater resilience of mixed forests to drought mainly depends on their composition: analysis along a climate gradient across Europe. Ecol. Manag. 2021, 481, 118687. [Google Scholar] [CrossRef]
- Pukkala, T.; Nuutinen, Y.; Muhonen, T. A two-level optimization approach to tree-level planning in continuous cover forest management. J. Res. 2025, 36, 79. [Google Scholar] [CrossRef]
- Ojanen, P.; Minkkinen, K. The dependence of net soil CO2 emissions on water table depth in boreal peatland drained for forestry. Mires Peat 2019, 24, 27. [Google Scholar] [CrossRef]
- Sarkkola, S.; Nieminen, M.; Koivusalo, H.; Ahti, E.; Launiainen, S.; Nikinmaa, E.; Marttila, H.; Laine, J.; Hökkä, H. Domination of growing-season evapotranspiration over runoff makes ditch network maintenance in mature peatland forests questionable. Mires Peat 2013, 11(2), 1–11. Available online: http://www.mires-and-peat.net/. [CrossRef]
- Laurén, A.; Palviainen, M.; Launiainen, S.; Leppä, K.; Stenberg, L.; Urzainki, I.; Nieminen, M.; Laiho, R.; Hökkä, H. Drainage and Stand Growth Response in Peatland Forests—Description, Testing, and Application of Mechanistic Peatland Simulator SUSI. Forests 2021, 12, 293. [Google Scholar] [CrossRef]
- Hökkä, H.; Laurén, A.; Stenberg, L.; Launiainen, S.; Leppä, K.; Nieminen, M. Defining guidelines for ditch depth in drained Scots pine dominated peatland forests. Silva Fenn. 2021, 55(3), 10494. [Google Scholar] [CrossRef]
- Allman, M.; Jankovský, M.; Messingerová, V.; Allmanová, Z. Soil moisture content as a predictor of soil disturbance caused by wheeled forest harvesting machines on soils of the Western Carpathians. J. Res. 2017, 28, 283–289. [Google Scholar] [CrossRef]
- Mohtashami, S.; Thierfelder, T.; Eliasson, L.; Lindström, G.; Sonesson, J. Use of Hydrological Models to Predict Risk for Rutting in Logging Operations. Forests 2022, 13, 901. [Google Scholar] [CrossRef]
- Anonymous (2024a) MELA Results Service – VMI12–VMI13 (2017–2021). Available online: http://mela2.metla.fi/mela/tupa/index.php (accessed on 15 June 2025).
- Haahti, K.; Koivusalo, H.; Hökkä, H.; Nieminen, M.; Sarkola, S. Factors affecting the spatial variability of water table depth within a drained peatland forest stand in northern Finland. Mires Peat 2012, 63(3–4), 107–121. Available online: http://www.suo.fi/article/9883.
- Stenberg, L.; Haahti, K.; Hökkä, H.; Launiainen, S.; Nieminen, M.; Laurén, A.; Koivusalo, H. Hydrology of Drained Peatland Forest: Numerical Experiment on the Role of Tree Stand Heterogeneity and Management. Forests 2018, 9, 645. [Google Scholar] [CrossRef]
- Leppä, K.; Hökkä, H.; Laiho, R.; Launiainen, S.; Lehtonen, A.; Mäkipää, R.; Peltoniemi, M.; Saarinen, M.; Sarkkola, S.; Nieminen, M. Selection Cuttings as a Tool to Control Water Table Level in Boreal Drained Peatland Forests. Front Earth Sci. 2020, 8, 576510. [Google Scholar] [CrossRef]
- Hiltunen, O.; Hallikainen, V.; Palander, T. Analysing the groundwater level and its determinants in a drained peatland forest: a case study in South Lapland, Finland. Silva Fenn. 2023, 57(1), 10752. [Google Scholar] [CrossRef]
- Anonymous (2024b) Transportation in International Trade 2023. Available online: https://tilastot.tulli.fi/documents/179508185/203434156/Ulkomaankaupan+kuljetukset+2023.pdf (accessed on 15 June 2025).
- Forest Act 1093/1996. Ministry of Agriculture and Forestry. Available online: https://www.finlex.fi/en/legislation/translations/1996/eng/1093.
- Ala-Ilomäki, J.; Högnäs, T.; Lamminen, S.; Sirén, M. Equipping a conventional wheeled forwarder for peatland operations. Int. J. Eng. 2011, 22(1), 7–13. [Google Scholar] [CrossRef]
- Ala-Ilomäki, J.; Lindeman, H.; Mola-Yudego, B.; Prinz, R.; Väätäinen, K.; Talbot, B.; Routa, J. The effect of bogie track and forwarder design on rut formation in a peatland. Int. J. Eng. 2021, 32(1), 12–19. [Google Scholar] [CrossRef]
- Lundbäck, M.; Lindroos, O.; Servin, M. Rubber-Tracked Forwarders—Productivity and Cost Efficiency Potentials. Forests 2024, 15, 284. [Google Scholar] [CrossRef]
- Högnäs, T.; Kärhä, K.; Lindeman, H.; Palander, T. Load capacity classification of peatland forest thinnings. Publication of Metsäteho 2009, 17. Available online: http://www.metsateho.fi/wpcontent/uploads/2015/02/Tuloskalvosarja_2009_17_Turvemaaharvennusten_kantavuusluokitus_kk.pdf.
- Ring, E.; Andersson, M.; Hansson, L.; Jansson, G.; Högbom, L. Logging Mats and Logging Residue as Ground Protection during Forwarder Traffic along Till Hillslopes. Croat. J. Eng. 2021, (42)3, 445–462. [Google Scholar] [CrossRef]
- Uusitalo, J.; Ala-Ilomäki, J. The significance of above-ground biomass, moisture content and mechanical properties of peat layer on the bearing capacity of ditched pine bogs. Silva Fenn. 2013, 47(3), 993. [Google Scholar] [CrossRef]
- Piskunov, M. Influence of Stump-Root System of Trees on Rut Formation During Forwarder Operation on Peat Soils. Croat. J. Eng. 2023, 44(2), 217–231. [Google Scholar] [CrossRef]
- Aruga, K.; Hiyamizu, G.; Nakahata, C.; Saito, M. Effects of aggregating forests, establishing forest road networks, and mechanization on operational efficiency and costs in a mountainous region in Japan. J. Res. 2013, 24(4), 747–754. [Google Scholar] [CrossRef]
- Ala-Ilomäki, J.; Salmivaara, A.; Launiainen, S.; Lindeman, H.; Kulju, S.; Finér, L.; Heikkonen, J.; Uusitalo, J. Assessing extraction trail trafficability using harvester CAN-bus data. Int. J. Eng. 2020, 31(2), 138–145. [Google Scholar] [CrossRef]
- Ovaskainen, H. Timber harvester operators’ working technique in first thinning and the importance of cognitive abilities on work productivity. Doctoral Thesis.;Dissertationes Forestales, University of Eastern Finland, Joensuu, Finland, 2009; p. 62 p. Available online: http://www.metla.fi/dissertationes/df79.htm.
- Jourgholami, M.; Majnounian, B. Effects of wheeled cable skidder on rut formation in skid trail — a case study in Hyrcanian forest. J. Res. 2011, 22, 465–469. [Google Scholar] [CrossRef]
- Finér, L. Fine root length and biomass in a pine, mixed birch-pine and spruce stand on a drained peatland. Mires Peat 1989, 40(4), 155–161. Available online: https://suo.fi/volume/40.
- Kokko, P.; Sirén, M. Success of thinnings, its consequences and the evaluation of them. Finn. For. Res. Inst. Res. Pap. 1996, 956. Available online: http://urn.fi/URN:ISBN:951-40-1501-0.
- Uusitalo, J.; Salomäki, M.; Ala-Ilomäki, J. The Effect of Wider Logging Trails on Rut Formations in the Harvesting of Peatland Forests. Croat. J. Eng. 2015, 36(1), 125–130. Available online: https://hrcak.srce.hr/136144.
- Väätäinen, K.; Mutanen, A.; Anttila, P.; Laitila, J.; Routa, R.; Kniivilä, M.; Ahtikoski, A.; Lindblad, J. Potential impacts of EU policies on timber harvesting costs: development of a costing model and scenario analysis. Nat. Resour. Bioeconomy Stud. 2023, 37. Available online: https://jukuri.luke.fi/server/api/core/bitstreams/68fbe325-4862-4c67-9065-f27e65940cc9/content.
- Salmivaara, A.; Launiainen, S.; Perttunen, J.; Nevalainen, P.; Pohjankukka, J.; Ala-Ilomäki, J.; Sirén, M.; Laurén, A.; Tuominen, S.; Uusitalo, J.; Pahikkala, T.; Heikkonen, J.; Finér, L. Towards dynamic forest trafficability prediction using open spatial data, hydrological modelling and sensor technology. Forestry 2020, 93(5), 662–674. [Google Scholar] [CrossRef]
- Korhonen, K.T. Fieldwork instructions of NFI 11 for Finland. National Forest Inventory (NFI). 2009. Available online: http://urn.fi/URN:NBN:fi-fe201603038534.
- Laasasenaho, J.; Snellman, C.G. Volume tables of pine, spruce and birch. Finn. For. Res. Inst. Res. Pap. 1983, 113. Available online: https://jukuri.luke.fi/handle/11111/94552.
- Repola, J. Biomass equations for birch in Finland. Silva Fenn. 2008, 42(4), 236. [Google Scholar] [CrossRef]
- Repola, J. Biomass equations for Scots pine and Norway spruce in Finland. Silva Fenn. 2009, 43(4), 184. [Google Scholar] [CrossRef]
- Hakkila, P. Harvesting small-sized wood for fuel. Folia For. 1978, 342. Available online: https://urn.fi/URN.
- Anonymous (2023) Field inspection instructions. Finnish Forestry Center. Ministry of Agriculture and Forestry, Helsinki. 2023. 85 p. Available online: https://www.metsakeskus.fi/sites/default/files/document/tarkastusohje.pdf (accessed on 15 June 2025).
- Hollander, M.; Wolfe, D.A. Nonparametric statistical methods; John Wiley and Sons: New York, 1973. [Google Scholar]
- Venables, W.; Ripley, B. Modern applied statistics with S. Fourth edition; Springer: New York, 2002. [Google Scholar]
- Fox, J. Effect displays in R for Generalized Linear Models. J. Stat. Softw. 2003, 8(15), 1–27. [Google Scholar] [CrossRef]
- Fox, J.; Weisberg, S. Visualizing Fit and Lack of Fit in Complex Regression Models with Predictor Effect Plots and Partial Residuals. J. Stat. Softw. 2018, 87(9), 1–27. [Google Scholar] [CrossRef]
- Robin, X.; Turck, N.A.; Tiberti, N.; Lisacek, F.; Sanchez, J.C.; Müller, M. pROC: an open-source package for R and S+ to analyze and compare ROC curves. BMC Bioinform. 2011, 12, 77. [Google Scholar] [CrossRef] [PubMed]
- Pinheiro, J.; Bates, D.; DebRoy, S.; Sarkar, D.; R Core Team. _nlme: Linear and Nonlinear Mixed Effects Models. R package version 3. 2025. Available online: https://cran.r-project.org/web/packages/nlme/nlme.pdf.
- Lüdecke, D.; Ben-Shachar, M.S.; Patil, I.; Waggoner, P.; Makowski, D. Performance: An R Package for Assessment, Comparison and Testing of Statistical Models. J. Open Source Softw. 2021, 6(60), 3139. [Google Scholar] [CrossRef]
- R Core Team. (2016) R: A language and environment for statistical computing. R Foundation for Statistical Computing, Vienna, Austria. Vienna, Austria, 2016; Available online: https://www.R-project.org/.
Figure 1.
The basic map displaying the ditch network and altitude lines (ETRS-TM35FIN 7368023,425587). Area-based laser scanning data with a resolution of 16 × 16 meters is overlaid on the map, with sample plots marked in red along with the road network. The cumulative total load (in tons) is indicated at the location of each sample plot.
Figure 1.
The basic map displaying the ditch network and altitude lines (ETRS-TM35FIN 7368023,425587). Area-based laser scanning data with a resolution of 16 × 16 meters is overlaid on the map, with sample plots marked in red along with the road network. The cumulative total load (in tons) is indicated at the location of each sample plot.
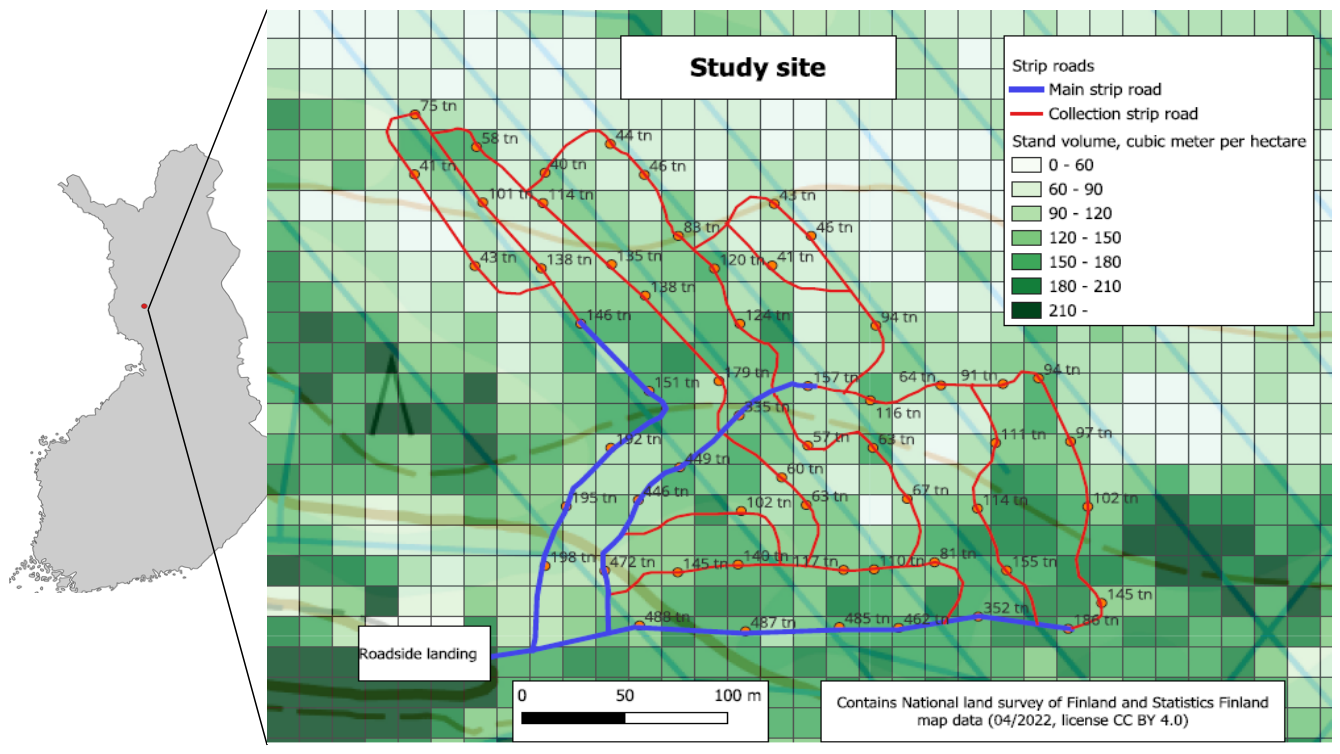
Figure 2.
Stand and timber harvesting variables across the 100-ton (Class 1), 200-ton (Class 2), and 400-ton (Class 3) cumulative load classes. Differences among classes were tested using the Kruskal–Wallis test.
Figure 2.
Stand and timber harvesting variables across the 100-ton (Class 1), 200-ton (Class 2), and 400-ton (Class 3) cumulative load classes. Differences among classes were tested using the Kruskal–Wallis test.
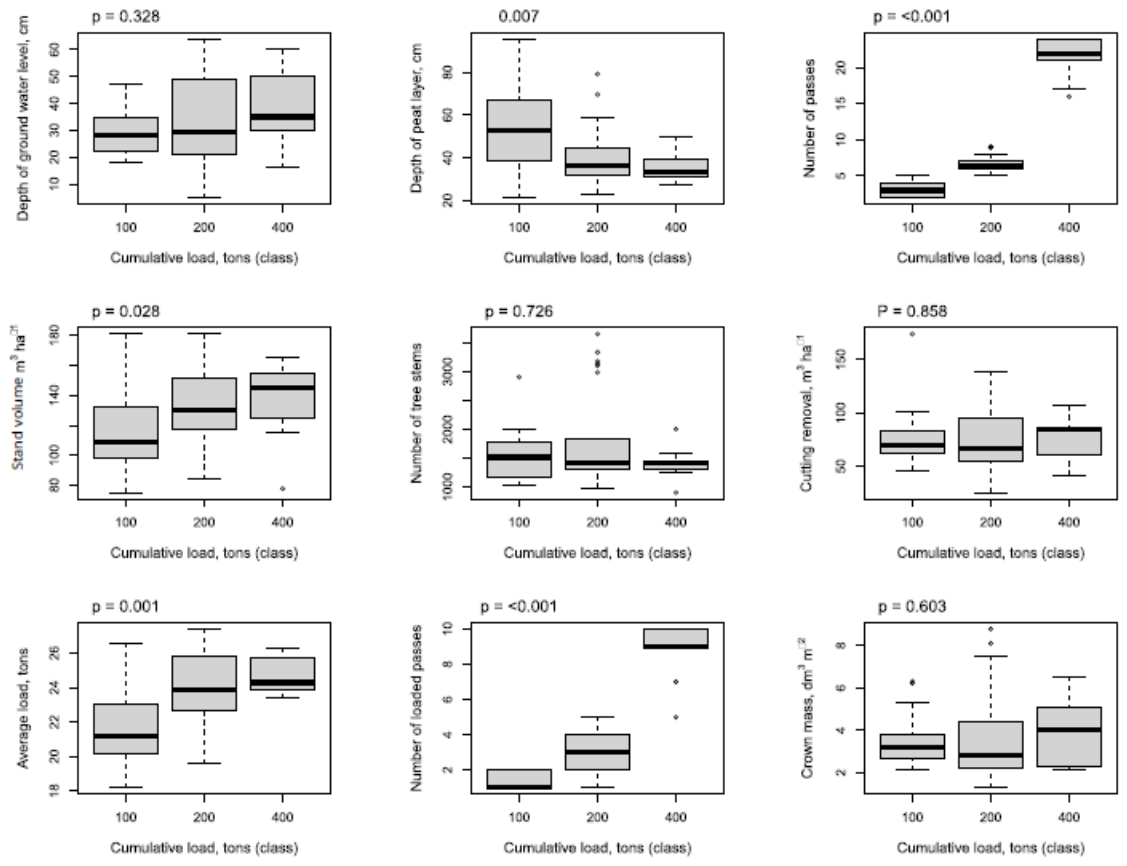

Table 1.
Rut formation observed during timber harvesting machine passes. Rut status was classified as unchanged (A), increased (B), or decreased (C) during unloaded (U) and loaded (L) machine passes. Values represent the total number of observations and the number of sample plots.
Table 1.
Rut formation observed during timber harvesting machine passes. Rut status was classified as unchanged (A), increased (B), or decreased (C) during unloaded (U) and loaded (L) machine passes. Values represent the total number of observations and the number of sample plots.
| Observations | Mean | Minimum | Maximum | Total | Plots |
|---|---|---|---|---|---|
| AU | 4.7 | 1 | 14 | 169 | 36 |
| AL | 2.9 | 1 | 8 | 57 | 20 |
| BU | 1.2 | 1 | 2 | 16 | 13 |
| BL | 2 | 1 | 5 | 74 | 37 |
| CU | 1.4 | 1 | 3 | 10 | 7 |
| CL | 1.5 | 1 | 3 | 24 | 16 |
Table 2.
Rutting characteristics across cumulative load classes. N = number of sample plots; A = number of passes; B = road width; C = number of ruts; D = maximum rut depth; E = total rut length; F = rut length with a depth > 20 cm; G = cumulative load. Values are arithmetic means, except for maximum rut depth, which is a rut-length-weighted mean.
Table 2.
Rutting characteristics across cumulative load classes. N = number of sample plots; A = number of passes; B = road width; C = number of ruts; D = maximum rut depth; E = total rut length; F = rut length with a depth > 20 cm; G = cumulative load. Values are arithmetic means, except for maximum rut depth, which is a rut-length-weighted mean.
| Load Class | N | A | B | C | D | E | F | G |
|---|---|---|---|---|---|---|---|---|
| t | n | n | m | n | cm | m | m | t |
| 100 | 22 | 3.1 | 5.5 | 1.1 | 10.3 | 2.7 | 1.4 | 63 |
| 200 | 26 | 6.7 | 5.1 | 1.6 | 11.6 | 3.3 | 1.9 | 140 |
| 400 | 9 | 21.3 | 5.2 | 3.2 | 18.0 | 6.5 | 3.0 | 442 |
| All | 57 | 7.6 | 5.2 | 1.7 | 12.2 | 3.6 | 1.9 | 158 |
Table 3.
Comparison of stand and timber harvesting variables between main-road (A) and collecting-road (B) plots using the Mann–Whitney U test. Values are arithmetic means s.
Table 3.
Comparison of stand and timber harvesting variables between main-road (A) and collecting-road (B) plots using the Mann–Whitney U test. Values are arithmetic means s.
| Variables | Unit | A | B | p–value |
|---|---|---|---|---|
| Thickness of peat layer | cm | 33.8 | 49.2 | 0.000*** |
| Depth of ground water table | cm | 38.1 | 30.8 | 0.066 |
| Number of ruts | n | 2.6 | 1.3 | 0.006** |
| Total length of the rut | m | 5.3 | 2.9 | 0.009** |
| The rut length when rut depth > 20 | cm | 2.4 | 1.7 | 0.094 |
| Number of passes | n | 15.6 | 4.5 | 0.000*** |
| Number of loaded passes | n | 6.7 | 2.1 | 0.000*** |
| Cumulative load | t | 325 | 93 | 0.000*** |
| Average load | t | 25 | 22.5 | 0.000*** |
| Stand volume | m3ha−1 | 140 | 122 | 0.022* |
| Removal of timber harvesting | m3ha−1 | 69.7 | 67.8 | 0.790 |
| Crown mass | dm3m−2 | 3.7 | 3.8 | 0.382 |
| • Crown mass of pine | dm3m−2 | 0.96 | 1.74 | 0.012* |
| • Crown mass of spruce | dm3m−2 | 1.38 | 0.80 | 0.034* |
| • Crown mass of birch | dm3m−2 | 1.33 | 1.21 | 0.569 |
Table 4.
Logistic autoregressive mixed models describe the probability of peat surface disturbance. ROC represents the area under the receiver operating characteristic curve and indicates model classification performance. VIF (variance inflation factor) was used to assess multicollinearity among predictors.
Table 4.
Logistic autoregressive mixed models describe the probability of peat surface disturbance. ROC represents the area under the receiver operating characteristic curve and indicates model classification performance. VIF (variance inflation factor) was used to assess multicollinearity among predictors.
| Variable | Estimate | Stand. error | df | t-/chi-squared value |
p-value | VIF |
|---|---|---|---|---|---|---|
| Model 1, ROC = 0.63 | ||||||
| Fixed effects | ||||||
| (Intercept) | −1.838E+00 | 5.581E-01 | 376 | −3.293 | 0.001 | – |
| Number of passes | 3.558E-01 | 1.029E-01 | 376 | 3.458 | 0.001** | – |
| Random effects | ||||||
| Sample plot variance | 7.616E-08 | |||||
| Phi | 7.540E-01 | |||||
| Dispersion | 2.457E+00 | |||||
| Model 2, ROC = 0.60 | ||||||
| Fixed effects | ||||||
| (Intercept) | −2.727E+01 | 2.991E+00 | 376 | −9.117 | < 0.001 | – |
| Cumulative total weight load, tons | 2.978E-01 | 1.073E-03 | 376 | 277.570 | 0.000** | – |
| Random effects | ||||||
| Sample plot variance | 5.070E+02 | |||||
| Phi | −6.074E-01 | |||||
| Dispersion | 1.210E-03 | |||||
| Model 3, ROC = 0.67 | ||||||
| Fixed effects | ||||||
| (Intercept) | 6.614E+00 | 2.159E+01 | 372 | 0.306 | 0.760 | – |
| Stand volume, m3ha−1 (ref. V120 m3ha−1) | 2 | 1.836 | 0.399 | 1.14 | ||
|
5.048E+00 | 1.100E+01 | 52 | 0.459 | 0.648 | |
|
−1.156E+01 | 1.285E+01 | 52 | −0.900 | 0.373 | |
| Depth of ground water level, cm | −1.018E+00 | 3.969E-01 | 52 | −2.566 | 0.013* | 1.31 |
| Number of passes | 1.312E+01 | 1.630E-02 | 372 | 804.559 | < 0.001** | 1.00 |
| Number of tree stems ha−1 | −1.339E-02 | 8.152E-03 | 52 | −1.642 | 0.107 | 1.27 |
| Depth of ground water level: Number of passes | −8.447E-02 | 2.910E-04 | 372 | −290.634 | < 0.001 | |
| Number of passes: Number of tree stems | 3.170E-04 | 7.000E-06 | 372 | 44.993 | < 0.001 | |
| Stand volume: Number of passes | 2 | 110370.000 | < 0.001 | |||
|
2.739E+00 | 1.021E-02 | 372 | 268.170 | < 0.001 | |
|
−1.465E-01 | 8.145E-03 | 372 | −17.980 | < 0.001 | |
| Random effects | ||||||
| Sample plot variance | 1.201E+03 | |||||
| Phi | −6.707E-01 | |||||
| Dispersion | 2.079E-06 |
Table 5.
General linear mixed model of rut depth (>0 cm) fitted using a log-normal distribution. VIF (variance inflation factor) indicates the degree of multicollinearity among the fixed effects. The marginal R2 of the model was 0.35.
Table 5.
General linear mixed model of rut depth (>0 cm) fitted using a log-normal distribution. VIF (variance inflation factor) indicates the degree of multicollinearity among the fixed effects. The marginal R2 of the model was 0.35.
| Variable Fixed effects |
Estimate | Standard error | df | t–/value | p–value | VIF |
|---|---|---|---|---|---|---|
| (Intercept) | 2.46E+00 | 2.69E-01 | 177 | 9.159 | < 0.001 | – |
| Depth of ground water, cm | −6.64E-03 | 3.27E-03 | 34 | −2.029 | 0.050* | 1.56 |
| Depth of peat layer, cm | 5.55E-03 | 2.63E-03 | 34 | 2.105 | 0.043* | 1.54 |
| Number of passes | 6.91E-02 | 2.17E-02 | 177 | 3.181 | 0.002** | 3.03 |
| Total cumulative load, tons | 3.09E-04 | 4.40E-04 | 34 | 0.703 | 0.487 | 3.07 |
| Number of ruts | 7.54E-02 | 2.26E-02 | 177 | 3.335 | 0.001** | 1.23 |
| Number of tree stems ha−1 | −1.21E-04 | 6.14E-05 | 34 | −1.975 | 0.056 | 1.19 |
| Number of passes: Total load | −1.25E-04 | 4.79E-05 | 177 | −2.597 | 0.010 | – |
| Random effects | ||||||
| Random part | ||||||
| Sample plot variance | 1.730E-02 | |||||
| Residual | 5.573E-02 | |||||
| Phi | 0.698 |
Disclaimer/Publisher’s Note: The statements, opinions and data contained in all publications are solely those of the individual author(s) and contributor(s) and not of MDPI and/or the editor(s). MDPI and/or the editor(s) disclaim responsibility for any injury to people or property resulting from any ideas, methods, instructions or products referred to in the content. |
© 2026 by the authors. Licensee MDPI, Basel, Switzerland. This article is an open access article distributed under the terms and conditions of the Creative Commons Attribution (CC BY) license (http://creativecommons.org/licenses/by/4.0/).
Copyright: This open access article is published under a Creative Commons CC BY 4.0 license, which permit the free download, distribution, and reuse, provided that the author and preprint are cited in any reuse.


