

Submitted:
07 July 2026
Posted:
08 July 2026
You are already at the latest version
Abstract
Since 1993, vegetation monitoring of alpine plant communities (snow-bed grassland and alpine tundra) has been performed at the Velino-Duchessa LTER site in the Central Apennines (https://deims.org/12c79ecb-7890-4b75-9655-0883dacd8a29), through phytosociological relevés and abundance and cover estimation of the vascular flora at fine scale. Air and soil temperatures, rainfall, snowfall, snow cover persistence and soil chemistry have also been monitored, following the Long-Term Ecosystem Research network’s distinctive integrated and ecological approach. Separately for both plant communities, we tested changes in taxonomic diversity (species richness and Shannon diversity) and functional composition (proportion of life form, morpho-functional types, Grime’s strategies, root types and root depth) using descriptive statistics and generalized additive mixed models. A trend of variation forced by increasing drought and snow shortage was recorded in both plant communities, with 30% change per year in species composition. Whereas there was no significative change in the total number of species, some sensitive species completely disappeared and a number of invader species appeared, with an increase in more thermophilic and drought-tolerant species and a parallel decrease in more mesic and cryophilic species. The phenomena described may be linked to the observed climate change occurring during the last 100 years in the Apennines, consisting mainly of a strong reduction in the duration of snow cover and an increase in mean and minimum annual temperatures in the mountains.
Keywords:
alpine plant communities
; Apennines
; Braun-Blanquet approach
; climate change
; Grime’s strategies
; LTER
; plant traits
1. Introduction
Recent IPCC assessments [1,2,3] indicate that, by the end of this century, the ongoing climate change is likely to lead to an increase in global average temperature ranging between 1.8 and 4.0°C. These changes are expected to be particularly pronounced in Southern Europe, especially in the central-southern part of the Italian peninsula [4], where projections suggest a substantial decline in precipitation (20-30% ca.) alongside a marked rise in temperature (3.0-4.0°C ca.) over the next 80 years. For Italy, high-resolution climate projections under the IPCC scenario RCP4.5 (stabilization without overshoot pathway) forecast, by 2100, a significant reduction in summer precipitation (June-August) of about 24%, together with a shortening of the snow cover period (h>1 cm) of 21 days per year [5,6]. Long-term observational data from Central Italy spanning roughly the last century [7,8,9] confirm this trend, showing a decrease in rainfall of about 15% and an increase of temperatures 1°C above average values. These trends indicate a shift from a Mediterranean-mountain climate toward a more typically Mediterranean regime, characterized by precipitation concentrated in winter and increasingly infrequent snowfall. Moreover, a strong increasing trend in the number of extreme temperature episodes (heat waves and warm spells), in particular in summer and spring, has been recorded in the Apennines, considering 61 years from 1962 to 2022, with clear critical points in 1994, 2011, 2016 and 2020 ([10], Figure 1); in the last 30-year reference period (1991–2020), the number of extreme heat events increased by 134% in summer and 102% in spring compared to the 1961-1990 period [10]. Consistent with these patterns, remote sensing data [1,2,3,11] reveal a decline of approximately 10% in annual snow cover extent across the Northern Hemisphere over the past 50 years. Ground-based observations from meteorological stations in the Italian Alps further confirm a long-term decrease in snowfall, snow depth and duration over the last three decades [12].
Observed global climate warming in the 20th century (+1.6°C over land in the last 100 years, +0.1°C per decade in the same period) has caused substantial damage and increasingly irreversible losses in terrestrial ecosystems, with evident impacts on ecosystem structure, species’ geographic ranges and the timing of seasonal life cycles [2,3]. Several studies show a clear alteration of the vascular plant diversity at many high-elevation sites in the Alps [13,14,15,16,17,18,19,20,21,22,23,24,25,26,27,28,29,30] and in other European mountain ranges [31,32,33,34,35]. Various modelling studies conducted at both broad spatial scale [36] and at finer, regional scales within the Alps and Apennines have consistently highlighted the potential impacts of rising temperatures on alpine vegetation. These approaches indicate that climate warming may pose substantial risks to alpine plant communities, potentially resulting in a decline in species diversity [37,38,39,40,41,42]. A significant decrease in vegetation cover and an increase in species richness, with the associated lack of half of the original species and cover decline of the most dominant species, have been documented in subalpine, alpine and nival plant communities in the Central Alps during the last 50 years [12,43]. A general (although not statistically significant) increase in the plant cover of most species has been recognized in some alpine and subalpine LTER sites in Austria, Switzerland and Italy in the montane, subalpine and alpine belts in the last 20 years [44].
In the Central Apennines (Italy), observations from key meteorological stations indicate a marked decline in precipitation (especially in spring and autumn) and a small increase in average temperature [34]. Long-term snowfall records [45,46] support this pattern, showing a consistent reduction over approximately the last 80 years. Comparable trends have been reported in other areas, reinforcing the evidence for an overall shift towards drier conditions across central and southern Italy. Both observed and projected climatic changes are already exerting measurable effects on ecosystems within the Mediterranean bioclimatic region, where drought is becoming increasingly pervasive. In Mediterranean high mountains, the most endangered plants are the cryophilic species with a distribution range centred above the timberline in the alpine belt, showing morphological and functional adaptations to the severe physical environment of high elevation mountains [47]. Consequently, alpine plant communities in these regions are widely regarded as effective indicators of climate change [48]. Despite their ecological relevance, relatively few studies have addressed these dynamics in the Central Apennines and field-based investigations remain particularly limited. Early efforts to assess potential vegetation shifts in Italy [49] relied primarily on theoretical models derived from bioclimatic maps. Subsequent syntheses have suggested that many sensitive terrestrial ecosystems in Italy may undergo progressive degradation in the short to medium term, followed by longer-term transitions towards communities dominated by drought-tolerant species [50]. Other studies, focusing specifically on vulnerable ecosystems such as subalpine shrublands and alpine tundra [51,52], have predicted similar trajectories, with a medium-term degeneration followed by long-term regression processes. Since the early 1990s, a trend of variation forced by increasing drought has been recorded in all plant communities above the timberline, normally within a dynamic fluctuation process. Over a nine-year period, species composition changed by approximately 10–20% relative to the total species pool [34]. Initial signs of a degeneration process were already evident after seven years, particularly in snow-dependent communities. These changes include an increase in thermophilic and drought-tolerant species, alongside a decline in mesic, cold-adapted, and competitive species. In particular, the following phenomena have been recorded in alpine tundra and high-mountain mesic and snow-bed grassland, in agreement with predicted or observed phenomena in other alpine or Arctic areas [39,53,54]: (a) expansion or increased cover of chamaephytic, drought- and stress-tolerant species; (b) reduction or local disappearance of hemicryptophytic, cryophilic, mesic and competitive species. Another well documented effect of global warming on high elevation plant diversity is also the shift of some species from lower to higher altitudinal ranges. In the alpine belt of the Majella massif in the Central Apennines, the warmer eastern slopes are the first to be affected by the colonization of thermophilic species, whereas north-facing slopes, with a shorter frost-free period, are the most conservative, showing greater inertia to the invasion process [55]. This species invasion process is able to modify the ecosystem functions, increasing fragmentation of habitats suitable for the survival of cryophilic species. Prediction models in the Central Apennines [41] indicate a decline of alpine tundra affecting 75% of its current area, associated with an increase in mean temperature of 1°C. Such changes are expected to significantly alter biodiversity patterns in high-elevation habitats, increasing the extinction risk for endemic cryophilic species. Long-term observations further support these trends. Over the last four decades, a significant increase in the frequencies of thermophilic, meso-nitrophilic, caespitose hemicryptophytes and suffruticose chamaephytes has been detected in the alpine belt at an LTER site in the Central Apennines [56,57]. Moreover, in the Northern Apennines a degeneration process was observed in chionophilic species [58]. Finally, a quantitative increase in more thermophilic and stress- and drought-tolerant species and a parallel decrease in more mesic, cold adapted and competitive species have been detected at the sister LTER site “Appennino Centrale: Gran Sasso d’Italia” [59], where drought, associated with the combined action of temperature increase, precipitation decrease and lack of snow cover and precipitation, has been identified as key factors.
This paper is based on continuous ecological observations performed at an alpine research site (Sevice station of LTER site “Appennino Centrale: Velino-Duchessa”, https://deims.org/12c79ecb-7890-4b75-9655-0883dacd8a29) established in 1993 and part of the Long-Term Ecological Research (LTER) Italy network since 2007. One of the longest vegetation data series in the Apennines is available at this research station, including up to 33 years of observations at community level. A longer data series is available only for the sister LTER site “Appennino Centrale: Gran Sasso d’Italia” [59]. At European level, in the case of primary alpine plant communities, only species level data are available for such a long period of time, except for an area in the Italian Alps (Stelvio National Park) where a 50-year vegetation data series is available [12]. The soil microclimate has also been monitored at the study site since 2014, with a significative time series of 11 years. The site is part of the “Apennines: high elevation ecosystems” LTER macro-site, which consists of “orographic islands” of alpine biocenoses along the Apennine chain in the central Mediterranean basin, where many endemic and rare taxa occur. The species pool of this macro-site is critically endangered by climate warming, as reported in several studies [18,29,34,41,50,51,52,60,61].
Preliminary results on the changes recorded over time at the study site, but with no statistical analysis, were published in [34,62,63,64], based on species occurrence and their relative cover, life forms and strategies. The first 18 years of observations at this site have shown a clear tendency of the high-elevation plant communities to adapt to aridity [62]. A current process of gradual degeneration has been recognized, with a marked reduction in rare species adapted to colder climates and the invasion of more thermophilic species. While in the resistant and stress-tolerant plant communities of the alpine tundra the dynamic stage of fluctuation appears constant over time [51], the evident turnover of species observed in the snow-bed grasslands in the first 25 years is considered to be attributable to the quantitative increase in the most thermophilic, stress-tolerant and xerophytic plant species and parallel decrease in the more mesic, competitive and microthermal species [63].
This paper follows the Long-Term Ecosystem Research network’s distinctive integrated and ecological approach, exploring the connections between vegetation, macro- and micro-climate and soil. Plant functional traits have been investigated, as they considered as good predictors of community changes [65]. While the aboveground functional traits of the plant species have been investigated, including in the Apennines [66,67], the belowground component has remained almost completely unexplored until now, even though in temperate grassland and tundra the biomass allocation can largely be attributed to the belowground organs [47,68]. In this paper, we studied and analysed the main root traits of the plant communities, with the hypothesis that the belowground component of the biocenosis is strongly negatively affected by the increased frequency and duration of frost periods, associated with the increased discontinuity of snow cover in winter. The soil profile and chemical analysis carried out in 2024 [64] at the research station confirmed that, together with the aboveground component, the belowground component of the biocenosis also seems negatively affected by the increased frequency and duration of frost periods, associated with the increased discontinuity of snow cover in winter and with the different soil types of the two communities (shallow and basic the former, deep and acidic the latter).
The main purpose of the LTER research site is to investigate and monitor the structure and composition changes in the primary plant communities (considered stable and free of direct influence) in relation to climate change. A statistically significant analysis of the correlation between the ecological features and climate is not yet possible, due to the assumed late and slow response of these primary plant communities and related species (33 years of data) to rapidly changing climate drivers (for which only 11 years of data are available to date). For example, the pronounced interannual fluctuations dependant on weather conditions in the previous two years, found by [69], are not comparable, as they are based on less stable secondary grassland with 30% of annual species. Within this constraint, this study explores the potential of this long time series of vegetation data to highlight important ecological critical points. The aim of this paper is to attempt to answer three main questions: a) has there been a turnover, with long-term directional changes, in the species composition over time of the plant communities, even though primary and assumed to be in a dynamical stage of fluctuation? b) have the ecological space of the plant communities been modified, through changes in species composition and in the aboveground and belowground traits? c) is there a relationship between the changes in the features of the communities and the observed changes in climate and soil microclimate?
2. Materials and Methods
2.1. Study Area
The Sevice station of the LTER site EU IT 01-003-T “Appennino Centrale: Velino-Duchessa” (https://deims.org/12c79ecb-7890-4b75-9655-0883dacd8a29), established in 1993, covers an area of ca. 0.5 km2, with an elevation range from 2125 to 2486 m a.s.l. (approximate latitude 42° 09’ N and longitude 13° 22’ E, suppl. file 1 – LTER site map). In 2005, an additional 55 plots along two elevation transects (SW slope of Mount Velino and Mount Morrone) were established and included into the LTER site (not considered in this work). Almost in the centre of the Italian peninsula and about 70 km west of Rome, the Velino massif is part of the Central Apennines, with Mount Velino (2486 m a.s.l.) representing one of the highest peaks in the range. One of the highest in Italy, the research site is situated in a protected area both at national level (as a State Nature Reserve) since 1987 and European level (as part of the EU Natura 2000 Network) since 1997. Land use in the site has remained unchanged over the last 50-100 years (personal observations, [70]): the only relevant activities are based on mountaineering and, more recently, nature tourism, all with a very low impact on the plant communities. In the past, land use was based on transhumant sheep farming, in progressive and rapid abandonment after the major political and economic change affecting Italy at the end of the 19th century [71]. As a result, land management has not changed significantly, at least not since 1993, the year when ecological research at the site began.
Like almost all the other massifs in the Central Apennines, the Velino massif is made up almost entirely of well stratified, very permeable, compact limestones with gastropods, Chondrodon and rudists of the Cretaceous. At the alpine tundra station subject of this research, this substrate is overlaid by a very superficial and primitive soil, with abundant calcareous skeleton. A small area north of Mount Sevice, including the snow-bed grassland site, is instead characterized by less compact and less permeable marly limestones, formed more recently in the Miocene and overlaid by a deeper, more developed soil.
The climate is Mediterranean mountain (sensu [72] and [34]) with an average annual temperature of ca. 5°C, average annual precipitation of ca. 1200 mm, maximum rainfall in spring and autumn, no drought period in summer, but an extreme and prolonged five-month long frost period in winter, with prolonged snow cover for more than 5 months a year. The average monthly maximum temperature is not excessively high (20°C, exceptionally 25°C), whereas the average monthly minimum temperature is very low (- 5°C, exceptionally -10°C).
Since 1993, the vegetation has been surveyed at two very close research stations (Mount Sevice research stations, Mount Velino, 2125-2225 m a.s.l., WGS84: 42.160350°N, 13.369500°E and 42.156850°N, 13.368050°E), representative of two different plant communities (covering a larger area of ca. 0.5 km2). Structure and composition changes are studied in two ecologically contrasting primary alpine plant communities (Table 1, Figure 2), both above the timberline in the alpine and Mediterranean high-mountain altitudinal belts (Petriccione and Persia 1995): snow-bed grassland (Trifolio thalii-Festucetum microphyllae) and alpine tundra (Saxifrago speciosae-Silenetum cenisiae), both characterized by perennial species particularly well adapted to cold conditions. Both communities are also characterized by high resistance but very low resilience, extreme below zero temperatures all year round and frozen soil for 5 months per year, but with very different snow cover duration. Snow bed grassland (corresponding to the priority EU habitat 6230* “Species-rich Nardus grasslands, on siliceous substrates in mountain areas and submountain areas in Continental Europe”), with continuous plant cover, occurs between 2000 and 2400 m a.s.l. throughout the Central Apennines, in flat wind-free zones with snow cover for ca. 5-6 months a year, below zero night temperatures for ca. 5 months a year and the absence of cryonival phenomena (due to the prolonged snow cover); soil is deep (ca. 35-55 cm) and pH is acid (4.50-5.90, [73,74]). Alpine tundra (corresponding to EU habitat 8240 “Limestone pavements”), with non-continuous plant cover, occurs between 2000 and 2300 m a.s.l. in the Central and Southern Apennines, in wind-swept peak and ridge zones with spatially limited and temporally discontinuous snow cover, below zero night temperatures for ca. 6 months a year and intensive cryonival phenomena (ice needles) in all seasons (except for the summer); soil is shallow (ca. 20 cm) and pH is basic (7.20-7.50, [73]). Both plant communities are classified according to the UE Directive 92/43/CEE, according to [75].
From the very beginning, the same ecologists (first from Rome University, then the National Forest Service - Corpo Forestale dello Stato from 1999 and, since 2017, the Carabinieri Biodiversity and Park Protection Department) have been continuously studying the state of the alpine vegetation, analysing all the plant species present in permanent plots where surveys are carried out once a year. Since 2015, the soil microclimate has also been studied directly using data from automatic temperature measurement devices installed in the soil.
2.2. Soil Data
Soil profiling and chemical analysis were carried out in 2024 [64] at comparable sites located a few metres outside the snow-bed grassland and alpine tundra plots. Chemical analysis of samples for each stratum (pH water, Ca-e, K-e, Mg-e, Na-e, Ca-BaCl2, K-BaCl2, Mg-BaCl2, Na-BaCl2, P-Olsen, TC, TOC, TN, CSC, clay %, silt %, sand %) was performed courtesy of the Italian National Council of Research (Consiglio Nazionale delle Ricerche).
2.3. Climate Data
Due to the lack of meteorological stations in the alpine belt of the Velino massif, climate data are referred to that of Campo Imperatore (2135 m a.s.l.), located in the Gran Sasso d’Italia mountains, ca. 35 km NNE from the Velino research site and just a few metres from the sister LTER site Gran Sasso d’Italia. This has very comparable ecological conditions and plant communities and provides over 70 years of standard precipitation and temperature observations from 1947 to 2013 [59]. Additional and most recent data for the same site are available from the new meteorological station installed by AQ Caput Frigoris in January 2020.
More comparable climate data were collected by the new Sevice meteorological station, installed just a few metres from the Velino research site by AQ Caput Frigoris in September 2022: unfortunately, due to several failure events, the three-year time series is affected by data missing for 42 days in 2023, 37 days in 2024 and 108 days in 2025.
Continuous soil microclimate observations were made at the site from 2015 to 2025, by means of two/four data loggers in the soil (-10 cm depth), one for each community, according to the GLORIA methodology [76]. Near-surface ground temperature is a good proxy for the presence/absence of snow cover and therefore for tracking the related no-frost winter days [77,78]. Despite the considerable eleven-year time series, several failure events unfortunately affected the loggers and therefore data are missing for the snow-bed grassland for 11 months (including 2020-2021 winter) and for the alpine tundra for 15 months (including 2019-2020 winter).
2.4. Root Traits Data Collection
A feasibility study was carried out to interpret time changes through the root traits of the most sensitive and locally invasive species [79]. Root types (Rp: reptant/creeping; Fs: fasciculate; Ft: taproot; Tb: tuberous) and depth of all species were identified by sampling three plants per species in both communities: average values are in suppl. files 2 – Snow-bed grassland tab. and 3 – Alpine tundra tab.. Simplifying the comparison, a depth of under 10 cm is considered “shallow”, while values over 10 cm are considered as “deep”, assuming that beyond this depth generally no frost episodes occur.
2.5. Vegetation Data Collection
For each of the survey plots measuring 100 m2 (minimum area assessed in the field as representative of the species composition of the plant communities, sensu [80,81], a phytosociological relevé was performed according to the Braun-Blanquet approach. One plot per community was surveyed in 1993 and repeated 6, 8 and 15 years later (in 1999, 2001 and 2008) on the same fixed surface area of the entire plot. Since 2008, data collection has been yearly, including two replicates (three plots per community). Data from 1993 to 2023 were released in 2024 [82]. A complete set of data (1993-2025), including all attributes per species, is provided in suppl. files 2 – Snow-bed grassland tab. and 3 – Alpine tundra tab.. The cover scale is according to [80,81], as modified by [83]. Species nomenclature is according to [84].
To investigate changes over time at community level, the species cover value for each plot [83] and for each year was transformed into percentage values (+: 1%, 1: 10%, 2: 30%, 3: 50%, 4: 70% and 5: 90%).
The ecology and distribution range of each plant community are described according to [73,85]. The current dynamical tendencies (according to [86,87]) in each community were identified by indicator species (as reported by [51]). Description of the communities was based on species diversity and functional structure, including life strategies [88] and ecological features.
A temporal trend investigation of species composition, life forms [84,89], life strategies [90,91] and morpho-functional types (expert based, according to an inductive approach [92]) was performed for each community, based on the relative number of species per type. A multivariate analysis based on an ad hoc quali-quantitative checklist of easily recognizable morphological characteristics (occurring on leaves and stems) helped define four morpho-functional groups, named after their key characteristics: reptant (Rp), graminoid hemicryptophytes (Hgr), scapose and rosulate hemicryptophytes (Hsr) and crassulent (Cr). The average values of all traits (sclerophylly or malacophylly, evergreen/graminoid/complete/lobated/compound leaves, erect/reclinate/reptant stems, hair density, leaf width and plant height, all directly measured in the field by sampling three plants per species in both communities) are reported in supplementary files 2 – Snow-bed grassland tab. and 3 – Alpine tundra tab..
Finally, an investigation of the change over time of the community’s ecological features was performed using the ecological bioindicator values for the Italian flora [93], to analyse changes in environmental conditions separately for both communities, according to the method proposed by [93].
The main features and temporal trends of the two plant communities were both investigated by means of descriptive statistics (based on average annual values of all parameters) and predictive models (based also on replicates, when available), to improve understanding of the results.
2.6. Species Level Changes
At species level, changes in the cover of selected species were descripted for both communities along a continuous temporal gradient (as performed by [56], although along a non-continuous temporal gradient), based on average annual cover values. For the alpine tundra the analysis was performed mainly on Alchemilla alpigena and Campanula scheuchzeri (in progressive decrease and local extinction) and on Helianthemum oelandicum subsp. incanum, Anthyllis montana subsp. jaquinii and Anthyllis vulneraria subsp. nana (new arrivals in the last ten years); for the snow-bed grassland, on Trifolium thalii and Sagina glabra (in progressive decrease), on Campanula scheuchzeri (in progressive decrease and local extinction), on Nardus stricta, Carex caryophyllea subsp. caryophyllea and Trifolium pratense subsp. semipurpureum (in progressive increase) and on Gymnadenia conopsea (new arrival in the last ten years).
2.7. Modelling Temporal Changes
All data management and statistical analyses were conducted in the R environment (R Core Team 2025, version 4.5.2). A complete list of R packages used is provided in Suppl. file 4 - Statistical data analysis. For taxonomic diversity, we calculated species richness and Shannon diversity using the specnumber and diversity functions from the vegan package [94]. Functional composition was quantified using the community-weighted mean (CWM [95]) for the following categorical traits: (i) life forms [84,89]; (ii) morpho-functional types, including reptant (Rp), graminoid hemicryptophytes (Hgr), scapose and rosulate hemicryptophytes (Hsr), and crassulent types [92]; (iii) Grime’s strategies, including competitive (C), stress-tolerant (S), and ruderal (R) species [90]; and (iv) root types, including reptant/creeping (Rp), fasciculate (Fs), taproot (Ft), and tuberous (Tb). When categorical traits are used, the CWM returns the relative frequencies of each trait’s state. CWMs were calculated using the cwm function in the weimea package [96]. Temporal changes in species richness, Shannon diversity, and CWMs of life form, morpho-functional group, Grime’s strategies and Rot types, were analysed using generalized additive mixed models (GAMMs; assuming a Gaussian distribution [97]) using the function gamm in the mgvc package. Time was included as a smooth term to account for potential non-linear temporal trends typical when dealing with long-time series analysis [98, while Site was incorporated as a random intercept to account for replicates. Models were fitted separately for each community type (snow-bed grassland and alpine tundra). Given that long-term vegetation dynamics may exhibit non-linear or fluctuating patterns, the flexibility of GAMMs allowed us to capture complex trajectories without imposing a priori linear or parametric assumption. To avoid overfitting, the number of knots (k) was set to a moderate value (k = 10 [97]). Temporal autocorrelation was assessed and, when present, a first-order autoregressive correlation structure (AR1) was included in the models. Model assumptions, including normality and homoscedasticity of residuals, were checked visually [99] For chamaephytes in alpine tundra, heteroscedasticity arising from between-site variation was detected; to account for this, the GAMM was replaced with a GAM in which temporal trends were evaluated separately for each of the three sites.
Changes in species composition over time were evaluated using partial distance-based redundancy analysis (dbRDA), with Time as the predictor and Site as a conditioning factor to account for replicates. Analyses were conducted separately for each community type using the capscale function in vegan package, with square-root transformed species cover data and Bray–Curtis dissimilarity as the distance metric. To visualize the temporal trajectory in species composition, the dbRDA site scores were extracted and a generalized additive model (GAM) was fitted to model time as a smooth function of the first two dbRDA axes (CAP1 and MDS1).
To assess temporal changes in ecological bioindicator values (EIVs) for the Italian flora [93], we calculated community mean values (CMEIV) for each plot based on species presence–absence data. To avoid false positives arising from the dependence between species attributes and community composition, we integrated generalized additive mixed models (Time as fixed effect, Site as random effect) with a column-permutation procedure [100]. Specifically, we calculated the observed marginal R² of the model and compared it against a null distribution of 999 marginal R² values generated by randomly shuffling EIVs across species prior to CMEIV calculation. The significance of temporal trends was then expressed as the proportion of permuted marginal R² values exceeding the observed marginal R² [100,101].
3. Results
3.1. Soil
Analysis of the soil profile (Suppl. file 5 – Soil analysis) enabled three layers to be distinguished for each community, both completely lacking in an organic layer 0: one layer A (0-15 cm deep) and two layers B (B1: 15-30 cm; B2: 30-50 cm) in the grassland snow-bed, where the almost absent slope allows for moderate pedogenesis; two layers A (A1: 0-15 cm; A2: 15-30 cm) and one only slightly altered mineral layer C (30-50 cm) in the alpine tundra, where the steep slope and great abundance of coarse clasts prevent good pedogenesis. A large part of the material in almost all layers consists of glacial silt, which in the snow-bed grassland increases from 73% to 84% from the most superficial layer to the deepest. In the alpine tundra only, the amount of silt decreases from 78% to 37% from layers A to C, where sand prevails (62%). In all layers and in both communities, the amount of clay is negligible (1-3%), with a slight increase only in the deeper layers of the snow-bed grassland (5%). The amount of humus present in the different layers is never high (4-8% in the snow-bed grassland and 1-3% in the alpine tundra) and decreases from the most superficial to the deepest layers, reaching almost zero in the alpine tundra.
The soil pH is very different in the two communities, with values of weak acidity (5.5-6.0) in the snow-bed grassland and strong basicity (7.9-8.2) in the alpine tundra, decisively conditioning the specific composition and ecology of the two communities. The total nitrogen content is very low in both communities, with values ranging from 0.07% to 0.95%, higher in the uppermost layers (A). The same is true for the organic carbon content, with values ranging from 0.63% to 7.87%, higher in layer A of the snow-bed grassland. The assimilable phosphorus content also has very low values, higher only in layers A of the two communities, with 13 mg/kg in the snow-bed grassland and 8 mg/kg in the alpine tundra. The amount of exchangeable calcium reaches high values, especially in the layers A of the two communities, with 4.0 g/kg in the alpine tundra and 2.1 g/kg in the snow-bed grassland. The potassium, sodium and magnesium exchange capacity of the soil is, on the other hand, very low, with higher values limited to layer A of the snow-bed grassland (118-243 mg/kg) but dropping to 39-93 mg/kg in the deeper layers.
3.2. Climate
Analysis of precipitation and temperature in the period 1950-2014 (65 years) at the comparable Gran Sasso d’Italia LTER site shows [59] an important and significant increase in mean annual temperature (+1.7°C) and a small and not significant decrease in the annual precipitation amount (-30 mm), especially in spring and autumn. Although the temperature trend seems very clear (with an average of 3.7°C), the precipitation regime, on the other hand, is very variable year by year (with an average of 1170 mm), ranging from a minimum of 568 mm (year 1977) to a maximum of 1612 mm (year 1969), increasing the drought stress in very dry years. In recent decades, this has occurred in 2002, 2010 and 2011, with very low values of 700-800 mm. The most recent data for the years 2020-2025 for the same site, collected at the new meteorological station installed by AQ Caput Frigoris in January 2020, confirm these trends. Mean annual temperature has risen to 4.8°C, mean annual precipitation for the last six years has barely reached 818 mm and dry years with low values of precipitation (700-800 mm per year) have occurred repeatedly in 2020, 2021, 2022, 2024 and 2025.
Analysis of precipitation and temperature at the AQ Caput Frigoris Sevice meteorological station is feasible for three years only, from September 2022 to August 2025, due to several limitations linked to failure events (data are missing for more than one month during summer 2023, one month during autumn 2004 and for more than three months during spring 2025). Despite this, the annual precipitation amounts for 2023 and 2024 (900 and 1200 mm) at this station (Figure 5) are comparable or slightly lower than the 65-year Gran Sasso average (1170 mm, but only 1100 mm considering the latest data for 2000-2014) and slightly higher than the Gran Sasso for the most recent years 2020-2025 (818 mm). Conversely, mean annual temperatures are apparently higher than the 65-year Gran Sasso average (3.7°C): 4.3°C in 2023 and 5.2°C in 2024 at Sevice. However, if the rapid temperature increase recorded at the Gran Sasso site in the last 15 years is considered (4.6°C for the period 2000-2014 and 4.8°C for 2020-2025), the Sevice data become very comparable. Mean daily temperatures are available only for 790 days out of 1095 days in years 2023-2025 (Suppl. file 6 - Meteorological data at the Sevice meteorological station), but these data seem sufficient to define the year 2024 as warmer and drier than 2023: prolonged aridity periods occur in spring and autumn, in agreement with the well-known change of climate regime in the Apennines, losing the typical solstitial precipitation peaks (Petriccione 2005).
The continuous soil microclimate observations recorded at the site from 2015 to 2025 show marked differences between the two communities (Figure 3, Suppl. file 7 - Soil microclimate observations).
Whereas at the snow-bed grassland site, seven out of ten winters are characterized by discontinuous snow cover (with temperature below 0°C), at the alpine tundra site, there is discontinuous snow cover during all winters. Considering that winter days with soil temperature below zero correspond to lack of soil snow cover, the sensitive snow-bed grassland was exposed to frost (Figure 4, Suppl. file 7 - Soil microclimate observations). Soil microclimate observations) for more than 100 days per winter in the years 2014-2017 and for 20-80 days per winter in the years 2021-2024: the snow cover preserved the biocenoses from very dangerous frost stress for the whole winter during only three winters out of ten (the typical winter was that of 2024-2025, with soil temperature never under zero due to continuous snow cover, but with minimum absolute air temperature reaching -9.6°C). The worst winters were those of 2014-2015 and 2016-2017, when the snow-bed grassland was exposed to frost for 120-130 days (in other words, the full winter season, with minimum absolute soil temperature reaching -2.4°C). In addition, mean annual soil temperature at the snow-bed grassland site has increased progressively from 2016, with a critical point in 2018, while during the last four observation summers (2022-2025), maximum hourly temperature was over 20°C for more than 30 days, due to a strong increase of heat wave frequency (Suppl. file 7 - Soil microclimate observations).
In the case of the alpine tundra, where there is discontinuous snow cover during all winters, the biocenosis was exposed to frost (Suppl. file 7 - Soil microclimate observations) every year for more than 120 days. In this case, the biocenosis is well adapted to this kind of ecological stress, through morpho-functional traits (cushion forms and sclerophyllous leaves).
In addition, at the snow-bed grassland site, mean annual soil temperature has been progressively increasing since 2017, with a critical point in 2018 (Suppl. file 7 - Soil microclimate observations) and a maximum hourly temperature of over 20°C for more than 30 days during the last five observation summers (2021-2025).
Comparing the soil microclimate during 2016-2025 and macroclimate of the site during 2022-2025, a high interannual variability is evident, more pronounced in winter. In winter 2023-2024 (Figure 5, Suppl. file 6 – Meteorological data at the Sevice meteorological station), almost continuous snow cover prevented frost damage to the snow-bed grassland (thermal insulation), except for short periods in January and February; at the beginning and end of winter, the soil and vegetation reacted to the air temperature changes with noticeable thermal inertia. In winter 2024-2025, the snow cover was continuous throughout the winter. In the alpine tundra, a lack of snow cover throughout the winter months, except for short periods, leaves the biocenosis with no protection from frost; in this case, soil and vegetation follow the air temperature changes with less thermal inertia.
Figure 5.
Minimum daily temperature at the Sevice meteorological station (red) and at the snow-bed grassland (a) and alpine tundra (b) research stations (green and purple), in winter 2023-2024 (November-May).
Figure 5.
Minimum daily temperature at the Sevice meteorological station (red) and at the snow-bed grassland (a) and alpine tundra (b) research stations (green and purple), in winter 2023-2024 (November-May).
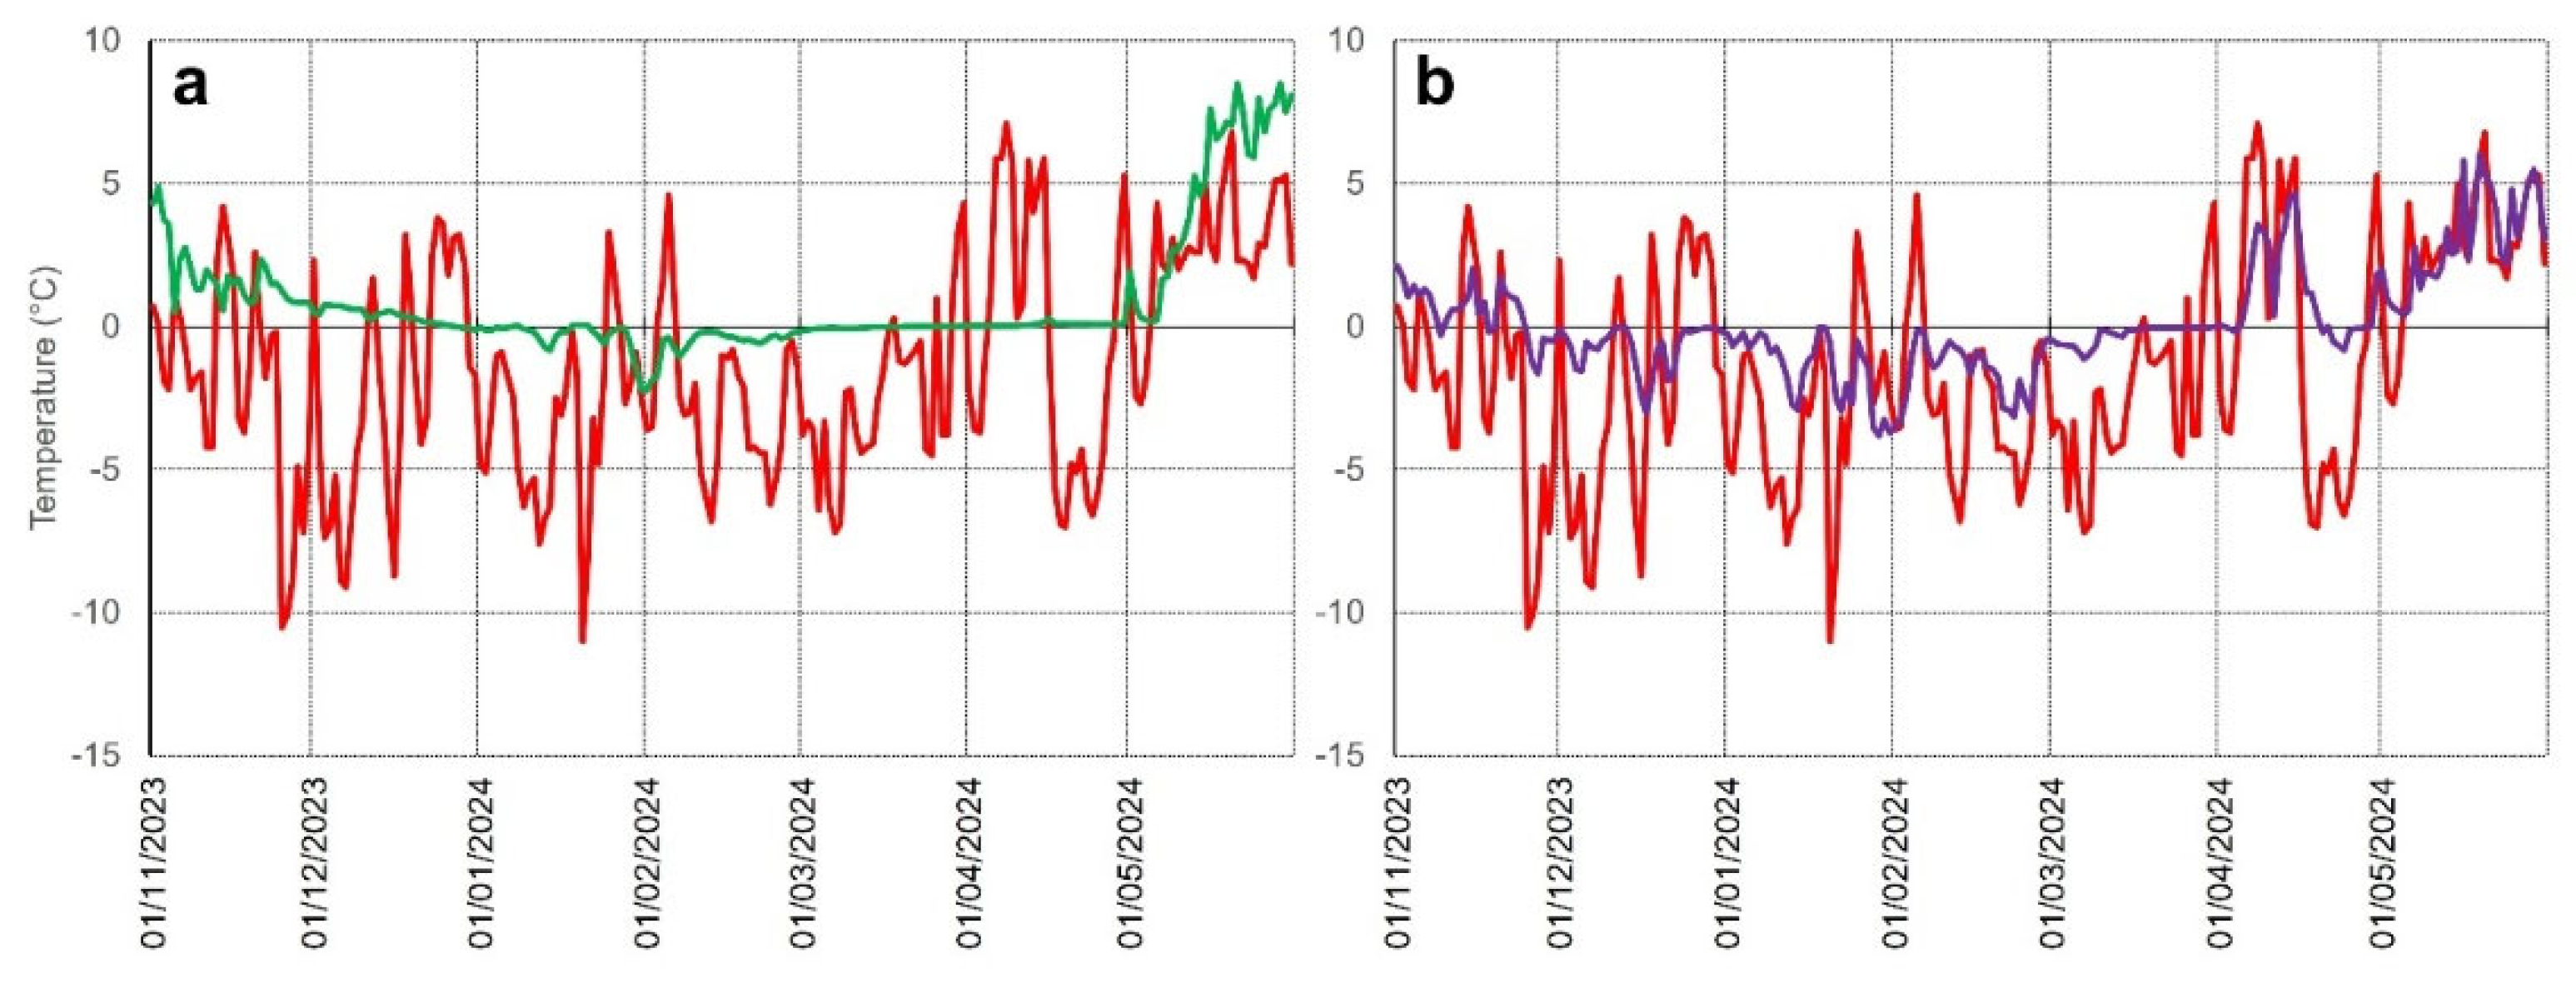
A comparison of the number of winter days with a minimum soil temperature below zero for the two communities with data from the Sevice meteorological station (Figure 6) from 2022 to 2025 shows how snow cover of the soil in the snow-bed grassland site provided this plant community with thermal insulation for more than 100 days in the first winter, 60 days in the second and more than 140 in the last. Due to the exposure and very steep slope of the alpine tundra site, the almost complete lack of snow cover leaves this community undefended from frost throughout the winter.
3.3. Community Level: Descriptive Statistics
Summarizing the main features and temporal trends of the two plant communities, a preliminary investigation was performed on the average annual values of all parameters for each community (Table 2). Species composition changed by ca. 30-35% per year in the period 1993-2025 (33 years) in both communities, with a critical point in 2014-2015. The snow-bed grassland gradually gained 13 new species (2-4 per year) in the period 2011-2014 and 5 new species (0-1 per year) in the period 2015-2025 (thermophiles and geophytes), while it lost 3-4 species in 2018-2023. In the alpine tundra, three new species joined the community from 2014 to 2018 (stress-tolerant and reptant) and four disappeared in 2021-2022. Despite these substantial changes in species composition, both communities maintained the same total number of species (27-30 in average), with no significative trends, and the total plant cover values were preserved over time (100% for snow-bed grassland and 10-20% for alpine tundra).
In the snow-bed grassland, after an initial period of decrease, the strong dominance of hemicryptophyte species slowly increased from 2010 and 2015, with a clear decrease of chamaephytes from 2010. Four new geophyte species have appeared since 2013. In the alpine tundra, the strong co-dominance of hemicryptophyte and chamaephyte species remained unaltered during the 33 years of observation, except for a very slow decrease in hemicryptophytes since 2011. One new therophyte species has appeared since 2012, probably linked to a slow transition to the more stable Pediculari elegantis-Seslerietum tenuifoliae dry grassland community (Sesleria juncifolia dominated).
As far as the Grime’s life strategy description is concerned, competitive species (mostly graminoid) are dominant in the snow-bed grassland, whereas stress-tolerant species (mostly chamaephytes) are dominant in the alpine tundra. A slow decrease in competitive species is discernible from 2009 (snow-bed grassland) and 2013 (alpine tundra), with a very slow increase in ruderal species from 2011 in snow-bed grassland and a slow decrease from 2013 in alpine tundra.
As regards morpho-functional features, both communities show a slow increase in the proportion of graminoid hemicryptophyte species (Hgr) from 2010-2011. There is also a slow but noticeable decrease in the proportion of reptant species (Rp) from 2008 (alpine tundra) and 2012 (snow-bed grassland). Hgr species (Nardus stricta in the snow-bed grassland and Carex kitaibeliana in the alpine tundra) are better adapted to surviving frost periods, due to their deep root structure; on the contrary, Rp are very sensitive to frost periods, due to their shallow root structure.
In both communities, the cumulate cover values of species with deep roots (> 10 cm) increase over time (Figure 7), with a critical point in 2016 (snow-bed grassland) and in 2014 (alpine tundra).
Conversely, species with shallow roots (> 10 cm) decrease over time, with the same critical point in 2016, but only for the snow-bed grassland. No relevant variation occurs in the alpine tundra, except for a gap in the period 2009-2012.
As regards ecological indicators, generating ecograms of the two plant communities (Suppl. file 8 – Ecological indicators) makes it possible to obtain a graphic image of the ecological space of each community, narrower in the snow-bed grassland (with high values of light intensity and low values of thermophile behaviour and soil moisture) and larger in the alpine tundra (with very high values of light intensity, high values of soil reaction and low values of nitrogen availability, due to very poor and basic soil). Both communities show medium values for continentality. The results might indicate a possible increase in the values of the ecological indicators of continentality in relation to the other indicators in the snow-bed grassland, more discernible from 2015. There was a very slow increase in the heat indicator (T) and soil nutrients (N) from 2013 in the alpine tundra only.
3.4. Community Level: Statistics by Predictive Models
From the models, we observed temporal changes in both taxonomic diversity (species richness and Shannon diversity) and functional composition (life forms, morpho-functional types, Grime’s strategies, root type, and root depth) across both plant communities. Predicted temporal changes from 1992 to 2025, based on mixed-effects models (Figure 8), show differences between the two communities: alpine tundra exhibits an overall decline over time for both taxonomic indicators, whereas snow-bed grassland shows no significant change. Analysis of life forms revealed contrasting patterns: the proportion of chamaephytes increased in alpine tundra but decreased in snow-bed grassland. Additionally, hemicryptophytes declined in alpine tundra. Detailed examination of morpho-functional types showed that hemicryptophytes with a graminoid functional type increased in both plant communities, but with different trends: gradually in snow-bed grassland and markedly in the last years in alpine tundra. In alpine tundra only, scapose and rosulate types declined gradually, whereas reptant types showed fluctuations. With respect to Grime’s strategies, we documented a decrease in competitive and ruderal strategies over time, coupled with an increase in stress-tolerant species in alpine tundra. In snow-bed grassland, we observed the opposite patterns: stress-tolerant species declined, and ruderals increased over time. Examination of root types in alpine tundra revealed an increase in fasciculate root types followed by a decrease, while reptant/creeping roots showed the opposite pattern. In snow-bed grassland, we documented a gradual increase in reptant/creeping root types, a very gradual decrease in tuberous root types and a decreasing trend in fasciculate root types in the last years. Finally, analysis of ecological indicators showed significant variation in values of the heat indicator with different trends in the two communities: a mostly linear increase in snow-bed grassland and an overall increase with more fluctuations in alpine tundra. All model details (e.g., degrees of freedom, marginal and conditional R², AIC, and temporal autocorrelation considerations) are provided in Suppl. file 4 – Statistical data analysis. A synthesis of the main changes over time for both plant communities are reported in Table 2.
3.5. Species Level
Investigation at species level highlighted greater changes in the cover values of the snow-bed grassland species, with important but lesser changes in the cover values for the selected alpine tundra species. Description of the variability due to variation of the most relevant species highlighted, on one hand, the role of species in sharp decline or local extinction, such as Campanula scheuchzeri subsp. scheuchzeri, Minuartia verna subsp. verna and Trifolium thalii (in snow-bed grassland), Linum alpinum, Potentilla crantzii and Arabis alpina subsp. caucasica (in alpine tundra) and, on the other, species that have appeared only in recent years, such as Gymnadenia conopsea and Erysimum majellense (in snow-bed grassland), Helianthemum oelandicum subsp. incanum, Anthyllis montana subsp. jaquinii, Anthyllis vulneraria subsp. nana, Thesium parnassi and Euphrasia salisburgensis (in alpine tundra).
In detail (Table 3, Suppl. file 9 - Species trends), in the case of the snow-bed grassland, a substantial decreasing trend was found for the former co-dominant species Trifolium thalii, together with a substantial increasing trend for the new co-dominant species Trifolium pratense subsp. semipurpureum, Nardus stricta and the invader Carex caryophyllea subsp. caryophyllea, which has only colonized the community since 2008. Another invader, Gymnadenia conopsea, appeared in the community in 2014. Conversely, several sensitive species have disappeared from the biocenosis, such as Sagina glabra and Campanula scheuchzeri. In the case of the alpine tundra, Campanula scheuchzeri and Alchemilla alpigena have decreased to the point of local extinction. At the same time, in 2014-2018, several species entered the community from the adjacent more stable Pediculari elegantis-Seslerietum tenuifoliae dry grassland community (Sesleria juncifolia dominated), such as Helianthemum oelandicum subsp. incanum, Anthyllis montana subsp. jaquinii and Anthyllis vulneraria subsp. nana.
Partial distance-based redundancy analysis (dbRDA) confirms these trends and detects more significant changes over time for the species composition for both plant communities (Figure 9), snow-bed grassland (Adjusted R2 =15%; pvalue <0.05) and alpine tundra (Adjusted R2 =9%; pvalue <0.05). For snow-bed grassland, we documented a decreasing trend in cover over time for Trifolium thalii, Poa alpina ssp. alpina, Plantago atrata ssp. atrata and Carex kitaibeliana. Conversely, we documented an increase trend from 2016 for Carex caryophyllea ssp. caryophyllea, Ranunculus apenninus, Trifolium pratense ssp. semipurpureum. For alpine tundra, we documented a decrease cover over time for Galium magellense, Scorzoneroides montana ssp. breviscapa and Erigeron epiroticus, whereas Cerastium tomentosum ssp. album, Sesleria juncifolia ssp. juncifolia and Edraianthus graminifolius ssp. graminifolius increased their cover over time.
4. Discussion
The increase in mean annual temperature and the very high inter-annual variability in the annual precipitation amount are able to produce strong drought stress in the biocenoses, in particular in very dry and warm years, more and more frequent during recent decades. Decreased snowfall and snow persistence (with increased variability), together with the variability of total precipitation, increase the ecological stress at the research site, as confirmed by interpretation of the soil microclimate data: the recorded frequent frost episodes, associated with the absence of protective snow cover, expose the biocenoses to very dangerous frost stress. The official meteorological station at the comparable location of Campo Imperatore (Gran Sasso d’Italia), with sensors well above the soil surface, confirms these data, with 167 frost days in winter 2013-2014 (almost six months) and 160 days in winter 2024-2025. This is only 20-30 days more than data from the Sevice meteorological station and for the alpine tundra in winters 2022-2025 (140-150 days), leaving it exposed to frost for almost the whole winter period, but 100-150 days more than data for the snow-bed grassland in the same period (0-80 days in winters 2022-2025; 0-130 days in winters 2014-2021), which retains the protective snow cover for much longer. The small decrease in the annual precipitation amount observed at the Campo Imperatore meteorological station [56] and Sevice meteorological station, more pronounced in spring and autumn, could be correlated to the decreased snowfall registered by previous observations in the Apennines [45,46,59] and in the Alps [43]. Years characterized by prolonged absence of snow cover even in winter at the Sevice research station (seven out of ten, Figure 3a) correspond to those with the highest frequency of extreme temperature episodes (Figure 1, [10]). The climate data are concordant with those presented by [56] and [59] for the Central Apennines. A number of extreme temperature events (heat waves and warm spells) have been identified in the Apennines (including at meteorological stations located very near the Sevice research station) during the 61 year period from 1962 to 2022, by [10]: the highest frequency of these events occurs precisely in the period 1993-2022 analysed in this paper (Figure 1).
The low yearly rate of species turnover observed at the site (confirming the preliminary results from [34] and comparable to the results obtained by [59] at the sister Gran Sasso LTER site) can be considered physiological in primary communities such as these in a dynamical stage of fluctuation, but the long-term analysis shows substantial changes in species composition, despite both communities maintaining the same total number of species and the total plant cover values with no evident trends. A small but important decrease in sensitive species is underway in both communities, with a parallel gain of new, more thermophilic, stress-tolerant and reptant species from the adjacent plant communities. In the snow-bed grassland, the “invasion” of species less sensitive to drought and reduced snow cover can be interpreted as an emergent dynamical tendency: early signs of a degeneration process, highlighted by an increase in invader species, are discernible after just 15 observation years (2008) and confirmed in subsequent years. In the alpine tundra, this can be interpreted as early signs of a primary succession underway, with a very slow transition to the more stable Pediculari elegantis-Seslerietum tenuifoliae dry grassland community (Sesleria juncifolia dominated), discernible after 20 observation years (2014) and confirmed in subsequent years.
Although both communities preserve the same values of total plant cover over time, in the case of the snow-bed grassland a substantial decreasing trend was found for the former co-dominant species Trifolium thalii, together with a substantial increasing trend for the new co-dominant species Trifolium pratense subsp. semipurpureum, as well as for Nardus stricta and Carex caryophyllea subsp. caryophyllea. The case of the progressive replacement of Trifolium thalii with Trifolium pratense subsp. semipurpureum, more marked from 2015 onwards, is an example of the dynamic trend towards community degeneration. In fact, while Trifolium thalii is a specialist stenoecious species with a very narrow ecological niche, specialized in living in habitats with low temperatures and high moisture and with distribution limited to the mountains of Western Europe and Morocco, Trifolium pratense subsp. semipurpureum is a generalist euryoecious species with a very large ecological niche, not specialized and distributed throughout the Northern Hemisphere and also (introduced) in large areas of the Southern Hemisphere.
These results agree closely with those found in the Gran Sasso d’Italia sister LTER site in the last 30 years [59], in the subalpine, alpine and nival belts of the Central Italian Alps over the last 50 years [12] and in a large part of Europe during the last 30 years [102]. The contrast of our results with the vegetation cover increase noted by [44] for many species in other alpine ranges and for other LTER sites in the Central Apennines during the last 20 years (including the Velino-Duchessa LTER site) can be explained by the fact that in these cases most of the data came from studies conducted on species and not at community level.
In snow-bed grassland, the increased dominance of tall hemicryptophyte and competitive species from 2010-2015, with a parallel slow decrease in low chamaephytes and also the new appearance of four geophyte species, can be explained by considering that hemicryptophyte, geophyte and competitive species are better adapted to surviving frost periods, due to their deep/resistant root structure, well developed in the deep and relatively rich soil of this community. In addition, tall species can benefit from the increase in mean annual temperature, with increased competition with low species [103].
The evident changes noted in both communities in some of the aboveground morpho-functional traits, such as the increase in graminoid hemicryptophyte species, are interpretable as the effects of a decrease in snow cover and an increase in temperature and drought stress [48]. Small leaves in fact reduce boundary layer resistance and help maintain favourable leaf temperatures and higher photosynthetic water-use efficiency, with high solar radiation and low water availability [104,105]. A clear decrease in reptant species has also been noted in the alpine tundra. Graminoid hemicryptophyte species (Nardus stricta in the snow-bed grassland and Carex kitaibeliana in the alpine tundra) are better adapted to surviving frost periods, due to their deep root structure; on the contrary, Rp are very sensitive to frost periods, due to their shallow root structure.
Root systems are the basis of a plant’s acquisition of water, phosphorus and nitrogen: in this context, the root characteristics of a plant make it resistant to drought [106] and frost. In both communities, the cover of species with deep roots has increased over time, to the detriment of those with shallow roots, with a critical point in 2014-2016. This crucial belowground root system trait is probably related to the higher fitness of species with deep roots in plant communities in which frequent frost periods occur. This is in accordance with the results obtained by [107], as regards the increase in root length along an elevation gradient (correlated to an increase of ecological stress) of the sub-arctic tundra plant communities of Northern Sweden. Frequent frost periods determine a possible increase of root and microbial fauna mortality [108].
The high values of the ecological indicator of light intensity are clearly related to the continuous exposure of both communities to open light. This indicator is higher in the alpine tundra with very discontinuous snow cover, where high values of soil reaction and low values of nitrogen availability are due to the very poor and basic soil. Our results exclude a possible effect of modified land use or nitrogen accumulation in the soil on changes in vegetation (as shown by the trend of the nitrogen availability indicator), in agreement with [59], but unlike the assumptions of [56]. The slow but substantial increase in the values of the ecological indicators of continentality in relation to the other indicators in both communities, more discernible from 2015, is probably connected to the increased frequency of frost periods. Finally, the significative and gradual increase of values of the heat indicator is in clear connection with the observed increase of average air temperatures.
Detailed analysis of the species trend in the snow-bed grassland shows that species with deep roots and scapose morphology, such as Trifolium pratense subsp. semipurpureum, have higher fitness in plant communities with frequent frost periods than species with shallow roots (20 cm) and reptant morphology, such as Trifolium thalii. Species with very shallow roots (5-10 cm), reptant morphology and lower heat indicator values (T=2), such as Sagina glabra and Campanula scheuchzeri, have very low fitness in plant communities with frequent frost periods and are disappearing. On the contrary, species with tuberous roots and scapose morphology, such as Gymnadenia conopsea, have higher fitness and have been colonizing this plant community from 2013: basophile species such as the latter, with higher reaction indicator values (R=7) seem advantaged, in relation to a possible increase of pH in shallow soil strata. Species with deep and fistulous roots (20-60 cm) and higher heat indicator values (T=5), such as Nardus stricta and Carex caryophyllea subsp. caryophyllea, have higher fitness in plant communities with frequent frost periods and a progressive increase in mean soil temperature.
As regards the alpine tundra, species with shallow and reptant roots (10-20 cm) and lower heat indicator values (T=2-3), such as Campanula scheuchzeri and Alchemilla alpigena, with lower fitness in plant communities with frequent frost periods and a progressive increase in mean soil temperature, decrease to the point of local extinction. Conversely, species with deep roots (30-40 cm), a chamaephytic form or a reptant morphology and higher heat indicator values (T=5-7), such as Helianthemum oelandicum subsp. incanum, Anthyllis montana subsp. jaquinii and Anthyllis vulneraria subsp. nana, have higher fitness in plant communities with frequent frost periods and a progressive increase in mean soil temperature: they appeared in the community in 2014-2018, from the adjacent more stable Pediculari elegantis-Seslerietum tenuifoliae dry grassland community (Sesleria juncifolia dominated). The same basophile species, with higher reaction indicator values (R=7-9), seem advantaged, in relation to a possible increase in the pH of the shallow soil strata.
5. Conclusions
The warming trend at global level, already confirmed and reinforced by long-term data relating to the sister LTER site “Gran Sasso d’Italia”, is endorsed by the climate short-term data collected at the Sevice research station: the mean annual temperature increased by 1.7°C in the period 1950-2013, corresponding to an average increase per decade of +0.26°C (Petriccione and Bricca 2019); a strong increasing trend in the number of extreme temperature episodes occurred in the Apennines in the period 1961-2022; a clear trend of increased temperature, decreased precipitation and snow discontinuity over time is also confirmed by the more recent short-term data collected at the Sevice station in the period 2015-2025.
This exceptional warming in alpine areas, together with a decrease in total precipitation (as recognized for the Apennines as a whole) and snowfall, an increase in inter-annual climate variability and extreme events, and a frequent lack of snow cover, are the combined drivers of the observed species turnover occurring over the last 33 years in all the biocenoses studied, although more marked in snow-dependent communities. The recorded frequent frost episodes, associated with the absence of protective snow cover, expose the biocenoses to very dangerous frost stress, with a possible reduction in carbon uptake in the soil. A quantitative increase in more thermophilic, drought-tolerant and competitive species and a parallel decrease in more mesic and cold-adapted species have been clearly detected. These results confirm the preliminary assumptions provided in Cutini et al. (2012) for the first 18 years of observation at the same LTER site.
A critical point in the species turnover is evident in both communities in the years 2014-2015, with important species substitutions and new species invasions occurring only in these years and consolidating from the years 2016-2017 onwards: the observed increasing trend in the number of extreme temperature episodes in the Apennines, with clear critical points in 2011 and 2016 seems a plausible explanation. Whereas there has been no substantial change in the total number of species in both communities, some sensitive species have completely disappeared and a number of invader species have appeared. The fluctuation stage typical of these primary alpine plant communities seems to be changing toward a dynamical tendency of degeneration, at least in the snow-bed grassland, with an important disaggregation of the community due to deterioration of the ecological connections. As in the Central Alps, this process can lead to an ecological vacuum or a disequilibrium state in the biocenoses. Early signs of a degeneration process were already discernible after fifteen years (2009): such signs are very evident in snow-dependent communities, with a quantitative increase in more thermophilic and drought-tolerant species and a parallel decrease in more mesic and cryophilic species. In particular, the following phenomena were recorded in the snow-bed grassland, in agreement with predicted or observed phenomena in other alpine or Arctic areas: (a) cover increase (or appearance) of drought-tolerant species; (b) cover decrease (or disappearance) of cryophilic and mesic species. As regards the alpine tundra, early signs of primary succession are discernible after twenty observation years (2014), with a very slow transition to the adjacent more stable dry grassland community. The evident increase in the values of the ecological indicators of continentality and heat in relation to the other indicators in both communities, more discernible from 2015, is probably related to the combined action of temperature increase, precipitation decrease and lack of snow cover (with consequent frost periods).
The two communities studied react in different ways to the abiotic drivers (Table 2): (1) the alpine tundra, highly resistant and well adapted to drought, frost and drastic temperature ranges, loses microthermal species with shallow and reptant roots, gaining thermophilic species with deep roots, chamaephyte form and reptant morphology; (2) the snow-bed grassland, with low resistance and not adapted to drought and soil frost, shows important and rapid changes, increasing dominance of hemicryptophyte, competitive and graminoid species with deep roots and a parallel decline in the former co-dominant microthermal species, showing the first signs of drought stress.
In conclusion, our results enable us to answer the three questions listed in the introduction: a) plant communities are changing substantially over time, with important critical points in 2009-2010 and in 2014-2015; b) species are responding in different ways, according to their ecological niche, altering the intra-community ecological connections toward a disequilibrium state; c) there is a relationship between the changes in the features of the communities and the predicted and observed changes in climate and soil climate.
In the medium or long term, these short-term changes could lead to a disaggregation process affecting the alpine plant communities of the Apennines (including the local extinction of most of the cold-adapted species), due to their very low resilience. The phenomena described may be linked to the observed climate change occurring during the last 100 years in the Apennines, consisting mainly, in the mountains, of a substantial reduction in the duration of snow cover and an increase in mean and minimum annual temperatures.
Additional long-term observations over the next decades are, in any case, required to confirm the hypothesis of a cause-effect relationship between climate change and changes in plant communities and to exclude natural and unknown fluctuations. The combined monitoring of vegetation (composition and structure) and temperature at high elevation will provide updated data on the processes currently underway on the high summits of the Apennines and will guide local in-situ policies to conserve the associated plant communities and threatened species.
Supplementary Materials
The following supporting information can be downloaded at Preprints.org: suppl. file 1: LTER site map; suppl. files 2: Snow-bed grassland tab.; suppl. files 3: Alpine tundra tab.; Suppl. file 4: Statistical data analysis; Suppl. file 5: Suppl. file 6: Meteorological data at the Sevice meteorological station; Suppl. file 7: Soil microclimate observations; Suppl. file 8: Ecological indicators; Suppl. file 9: Species trends.
Funding
this research received no external funding.
Data Availability Statement
data are available in listed supplementary files.
Acknowledgments
thanks to Sarah Gregg, Monia Marrone, Giuseppe Parisi and Samuele Spacca for their sharing and valued contribution in the field work, to Alessandro Bricca for formal analysis of data, to Alicia Acosta and Elena Cini for their help in analysis of phytosociological data and to Lodovico Vannicelli for his help in soil sampling. Special thanks to Berardo Tiberi, AQ Caput Frigoris and Gruppo Escursionisti del Velino for installation and management of Sevice meteorological station and for storing and providing data of Sevice and Campo Imperatore meteorological stations. Further thanks to Sarah Gregg for the mother tongue revision.
Conflicts of Interest
the author declare no conflicts of interest.
References
- Intergovernmental Panel on Climate change. Climate Change 2007: Impacts, Adaptation and Vulnerability.; Cambridge Univ. Press, UK, 2007; Available online: https://www.ipcc.ch/pdf/assessment-report/ar4/wg2/ar4_wg2_full_report.pdf.
- Intergovernmental Panel on Climate change. Climate Change 2014: Impacts, Adaptation and Vulnerability.; Cambridge Univ. Press, UK, 2014; Available online: http://www.ipcc.ch/report/ar5/wg2/.
- Intergovernmental Panel on Climate change. Climate Change 2022: Impacts, Adaptation and Vulnerability.; Cambridge Univ. Press, UK, 2022; Available online: https://www.ipcc.ch/report/sixth-assessment-report-working-group-ii/.
- Mathez, E.A. Climate Change. The Science of Global Warming and Our Energy Future.; Columbia University Press, 2009; Available online: https://cup.columbia.edu/book/climate-change/9780231146425.
- Bucchignani, E.; Montesarchio, M.; Zollo, A.L.; Mercogliano, P. High-resolution climate simulations with COSMO-CLM over Italy: performance evaluation and climate projections for the 21st century. Int. J. Climatol. 2016, 36, 735–756. [Google Scholar] [CrossRef]
- Zollo, A.L.; Rillo, V.; Bucchignani, E.; Montesarchio, M.; Mercogliano, P. Extreme temperature and precipitation events over Italy: assessment of high-resolution simulations with COSMO-CLM and future scenarios. Int. J. Climatol. 2016, 36, 987–1004. [Google Scholar] [CrossRef]
- Buffoni, L.; Maugeri, M.; Nanni, T. Precipitation in Italy from 1833 to 1996. Theor. Appl. Climatol. 1999, 63, 33–40. [Google Scholar] [CrossRef]
- Brunetti, M.; Maugeri, M.; Nanni, T. Variations of temperature and precipitation in Italy from 1866 to 1995. Theor. Appl. Climatol. 2000b, 65, 165–174. [Google Scholar] [CrossRef]
- Brunetti, M.; Buffoni, L.; Maugeri, M.; Nanni, T. Trend of minimum and maximum daily temperature in Italy from 1865 to 1996. Theor. Appl. Climatol. 66 2000b, 49–60. [Google Scholar] [CrossRef]
- Capozzi, V.; Di Bernardino, A.; Budillon, G. Changes in large-scale circulation behind the increase in extreme heat events in the Apennines (Italy). Atmos. Res. 2025, 319, 1–26. [Google Scholar] [CrossRef]
- Intergovernmental Panel on Climate change. Climate Change 2001: Impacts, Adaptation and Vulnerability.; Cambridge Univ. Press, UK., 2001; Available online: https://www.ipcc.ch/ipccreports/tar/wg1/pdf/WGI_TAR_full_report.pdf.
- Cannone, N.; Pignatti, S. Ecological responses of plant species and communities to climate warming: upward shift or range filling processes? Clim. Change 2014, 123, 201–214. [Google Scholar] [CrossRef]
- Braun-Blanquet, J. Die Vegetation des Piz Languard, ein Maßstab für Klimaänderungen. Sven. Bot. Tidskr. 1955, 49, 1–9. [Google Scholar]
- Braun-Blanquet, J. Ein Jahrhundert Florenwandel am Piz Linard (3414 m). Extr. Du. Bull. Jard.Botan. Brux. Vol. Jubil. W. Robyns Comm. S.I.G.M.A. 1957, 137, 221–232. [Google Scholar] [CrossRef]
- Hofer, H.R. Veränderungen in der Vegetation von 14 Gipfeln des Berninagebietes zwischen 1905 und 1985. Ber. Geobot. Inst. ETH. Stift. Rubel 1992, 58, 39–54. [Google Scholar]
- Grabherr, G.; Gottfried., M.; Pauli, H. Climate effects on mountain plants. Nature 1994, 369, 448–448. [Google Scholar] [CrossRef] [PubMed]
- Grabherr, G.; Gottfried, M.; Gruber, A. Patterns and current changes in alpine plant diversity. In Arctic and alpine biodiversity: patterns, causes and ecosystem consequences, 113; Chapin, I.I.I., Körner, F.S., C., Eds.; Springer: Berlin, 1995; pp. 167–181. [Google Scholar] [CrossRef]
- Grabherr, G.; Gottfried, M.; Pauli, H. Long-term monitoring of mountain peaks in the Alps. In Biomonitoring: General and applied aspects on regional and global scales, 35. Tasks for Vegetation Science.; Burga, C.A., Kratochwil, A., Eds.; Kluwer: Dordrecht, 2001; pp. pp. 153–177. [Google Scholar]
- Camenisch, M. Veränderungen der Gipfelflora im Bereich des Schweizerischen Nationalparks: Ein Vergleich über die letzen 80 Jahre. Jahresber. Nat.forsch. Ges. Graubünden 2002, 111, 27–37. [Google Scholar]
- Pauli, H.; Gottfried, M.; Dirnböck, T. Assessing the long-term dynamics of endemic plants at summit habitats. In Alpine biodiversity in Europe. A Europe-wide assessment of biological richness and change.; Nagy, L., Grabherr, G., Körner, C., Thompson, D.B., Eds.; Springer (Berlin), 2003a; pp. 195–207. [Google Scholar]
- Pauli, H.; Gottfried, M.; Grabherr, G. The Piz Linard (3411m), the Grisons, Switzerland - Europe's oldest mountain vegetation study site. In Alpine biodiversity in Europe. A Europe-wide assessment of biological richness and change.; Nagy, L., Grabherr, G., Körner, C., Thompson, D.B., Eds.; Springer (Berlin), 2003b; pp. 443–448. [Google Scholar]
- Walther, G.R.; Beißner, S.; Burga, C.A. Trends in upward shift of alpine plants. J. Veg. Sci. 2005, 16, 541–548. [Google Scholar] [CrossRef]
- Pauli, H.; Gottfried, M.; Reiter, K. Signals of range expansions and contractions of vascular plants in the high Alps: observations (1994-2004) at the GLORIA master site Schrankogel, Tyrol, Austria. Glob. Change Biol. 2007, 13, 147–156. [Google Scholar] [CrossRef]
- Holzinger, B.; Hülber, k.; Camenisch, M.; Grabherr, G. Changes in plant species richness over the last century in the eastern Swiss Alps: elevational gradient, bedrock effects and migration rates. Plant Ecol. 2008, 195, 179–196. [Google Scholar] [CrossRef]
- Parolo, G.; Rossi, G. Upward migration of vascular plants following a climate warming trend in the Alps. Basic Appl. Ecol. 2008, 9, 100–107. [Google Scholar] [CrossRef]
- Vittoz, P.; Bodin, J.; Ungricht, S. One century of vegetation change on Isla Persa, a nunatak in the Bernina massif in the Swiss Alps. J. Veg. Sci. 2008, 19, 671–680. [Google Scholar] [CrossRef]
- Erschbamer, B.; Kiebacher, T.; Mallaun, M.; Unterluggauer, P. Short-term signals of climate change along an altitudinal gradient in the South Alps. Plant Ecol. 2009, 202, 79–89. [Google Scholar] [CrossRef]
- Erschbamer, B.; Unterluggauer, P.; Winkler, E.; Mallaun, M. Changes in plant diversity revealed by long-term monitoring on mountain summits in the Dolomites (Italy). Preslia 2011, 83, 387–401. Available online: http://www.preslia.cz/P113Erschbamer.pdf.
- Gottfried, M.; et al. Continent-wide response of mountain vegetation to climate change. Nat. Clim. Chang. 2012, 2, 111–115. [Google Scholar] [CrossRef]
- Elmendorf, S.C.; Henry, G.H.R.; Hollister, R.D.; Fosaa, A.M.; Gould, W.A.; Hermanutz, L.; Hofgaard, A.; Jónsdóttir, I.S.; Jorgenson, J.C.; Lévesque, E.; Magnusson, B.; Molau, U.; Myers-Smith, I.H.; Oberbauer, S.F.; Rixen, C.; Tweedie, C.E.; Walker, M.D. Experiment, monitoring, and gradient methods used to infer climate change effects on plant communities yield consistent patterns. PNAS 2015, 112, 448–452. [Google Scholar] [CrossRef] [PubMed]
- Klanderud, K.; Birks, H.J.B. Recent increases in species richness and shifts in altitudinal distributions of Norwegian mountain plants. The Holocene 2003, 13, 1–6. [Google Scholar] [CrossRef]
- Moiseev, P.A.; Shiyatov, S.G. Vegetation dynamics at the treeline ecotone in the Ural highlands, Russia. In Alpine biodiversity in Europe. A Europe-wide assessment of biological richness and change. 167.; Nagy, L., Grabher, G., Körner, C., Thompson, D.B.A., Eds.; Springer (Berlin), 2003; pp. 423–435. [Google Scholar]
- Virtanen, R.; Eskelinen, A.; Gaare, E. Long-Term Changes in Alpine Plant Communities in Norway and Finland. In Alpine biodiversity in Europe. A Europe-wide assessment of biological richness and change.; Nagy, L., Grabherr, G., Körner, C., Thompson, D.B.A., Eds.; Springer (Berlin), 2003; pp. 411–422. [Google Scholar]
- Petriccione, B. Short-term changes in key plant communities of Central Apennines (Italy). Acta Botan. Gall. 2005, 152, 545–561. [Google Scholar] [CrossRef]
- Steinbauer, M.J.; et al. Accelerated increase in plant species richness on mountain summits is linked to warming. Nature 2018, 556, 231–234. [Google Scholar] [CrossRef] [PubMed]
- Thuiller, W.; Lavorel, S.; Araujo, M.B. Climate change threats to plant diversity in Europe. PNAS 2005, 102, 8245–8250. [Google Scholar] [CrossRef] [PubMed]
- Gottfried, M.; Pauli, H.; Reiter, K. A fine-scaled predictive model for changes in species distribution patterns of high mountain plants induced by climate warming. Divers. Distrib. 1999, 5, 241–251. [Google Scholar] [CrossRef]
- Guisan, A.; Theurillat, J.P. Assessing alpine plant vulnerability to climate change: a modelling perspective. Integr. Assess. 2000, 1, 307–320. [Google Scholar] [CrossRef]
- Theurillat; J, P.; Guisan, A. Potential impact of climate change on vegetation in the European Alps: a review. Clim. Change 2001, 50, 77–109. [Google Scholar] [CrossRef]
- Dirnböck, T.; Dullinger, S.; Grabherr, G. A regional impact assessment of climate and land-use change on alpine vegetation. J. Biogeogr. 2003, 30, 401–429. [Google Scholar] [CrossRef]
- Stanisci, A.; Pelino, G.; Guisan, A. Cambiamenti climatici ed effetti sulla flora d'alta quota nel Parco Nazionale della Majella. In La biodiversità vegetale nelle aree protette in Abruzzo: studi ed esperienze a confronto.; Di Cecco, M., Andrisano, T., Eds.; Parco Nazionale della Majella: Guardiagrele (Italy), 2006; pp. 192–209. ISSN ISBN 8890262206. [Google Scholar]
- Frate, L.; Carranza, M.L.; Evangelista, A.; Stinca, A.; Schaminée, J.H.J.; Stanisci, A. Climate and land use change impacts on Mediterranean high-mountain vegetation in the Apennines since the 1950s. Plant Ecol. Divers. 2018, 11, 85–96. [Google Scholar] [CrossRef]
- Cannone, N.; Sgorbati, S.; Guglielmin, M. Unexpected impacts of climate change on alpine vegetation. Front. Ecol. Environ. 2007, 5(7), 360–365. Available online: https://core.ac.uk/download/pdf/53546302.pdf. [CrossRef]
- Rogora, M.; Frate, L.; Carranza, M.L.; Freppaz, M.; Stanisci, A.; Bertani, I.; Bottarin, R.; Brambilla, A.; Canullo, R.; Carbognani, M.; Cerrato, C.; Chelli, S.; Cremonese, I.; Cutini, M.; Di Musciano, M.; Erschbamerm, B.; Godone, D.; Iocchi, M.; Isabellon, M.; Magnani, A.; Mazzola, L.; Morra di Cella, U.; Pauli, H.; Petey, M.; Petriccione, B.; Porro, S.; Psenner, R.; Rossetti, G.; Scotti, A.; Sommaruga, R.; Tappeiner, U.; Theurillat, J.P.; Tomaselli, M.; Viglietti, D.; Viterbi, R.; Vittoz, P.; Winkler, M.; Matteucci, G. Assessment of climate change effects on mountain ecosystems through a cross-site analysis in the Alps and Apennines. Sci. Total Environ. 2018, 624, 1429–1442. [Google Scholar] [CrossRef] [PubMed]
- Baldoni, M.; Biondi, E.; Frattaroli, A.R. Caratterizzazione bioclimatica del Gran Sasso d’Italia. Braun-Blanquetia 1999, 16, 7–20. [Google Scholar]
- Romeo, V.; Scarpelli, F. Le condizioni meteonivometriche negli Appennini. Linea Ecol. 2001, 4, 44–53. [Google Scholar]
- Körner, C. Alpine plant life. Functional plant ecology of high mountain ecosystems.; Springer (Berlin), 1999. [Google Scholar]
- Körner, C. Impact of atmospheric changes on high mountain vegetation. In Mountain Env.ironments in Changing Climates.; Beniston, M., Ed.; Routledge Publ. Co.: London, 1994. [Google Scholar]
- Blasi, C. Un approccio fitoclimatico allo studio dei cambiamenti climatici in Italia. Atti S.It.E. 1996, 17, 34–39. [Google Scholar]
- Petriccione, B. Land ecosystems sensitive to climate change (possible impact); Ministry of Environment. First Italian National Communication to the Framework Convention on Climate Change, 1995; pp. pp. 137–148. [Google Scholar]
- Petriccione, B.; Claroni, N. The dynamical tendencies in the vegetation of Velino massif (Abruzzo, Italy). Doc. Phytosoc. 1996, 16, 365–373. [Google Scholar]
- Petriccione, B.; Carotenuto, L.; Crisanti, L. Principali biocenosi terrestri vulnerabili al cambiamento climatico: stato attuale ed ipotesi sui cambiamenti a medio e lungo termine. Doc. Phytosoc. 1998, 28, 1097–1119. [Google Scholar]
- Chapin, F.S., III; Bret-Harte, M.S.; Hobbie, S.E.; Zhong, H. Plant functional types as predictors of transient responses of arctic vegetation to global change. J. Veg. Sci. 1996, 7, 347–358. Available online: www.jstor.org/stable/3236278. [CrossRef]
- Welker, J.M.; Bowman, W.D.; Seastedt, T.R. Environmental change and future directions in alpine research. In Structure and function of an alpine ecosystem: Niwot Ridge, Colorado.; Bowman, W.D., Seastedt, R., Eds.; Oxford Univ. Press: New York, USA, 2001. [Google Scholar]
- Stanisci, A.; Pelino, G.; Blasi, C. Vascular plant diversity and global change in central Apennine (Italy). Biodivers. Conserv. 2005, 14, 1301–1318. [Google Scholar] [CrossRef]
- Evangelista, A.; Frate, L.; Carranza, M.L.; Attorre, F.; Pelino, G.; Stanisci, A. Changes in composition, ecology and structure of high-mountain vegetation: A re-visitation study over 42 years. AoBPlants 2016, 8, 1–11. [Google Scholar] [CrossRef] [PubMed]
- Stanisci, A.; Frate, L.; Morra di Cella, U.; Pelino, G.; Petey, M.; Siniscalco, C.; Carranza, M.L. Short-term signals of climate change in Italian summit vegetation: observations at two GLORIA sites. Plant Biosyst. 2016, 150, 227–235. [Google Scholar] [CrossRef]
- Rossi, G.; Parolo, G.; Dellavedova, R. Gli organismi vegetali come bioindicatori dei cambiamenti climatici: il progetto GLORIA. Atti del convegno "Acque a Cremona", Museo civico di Storia Naturale di Cremona, 2004; pp. 81–94. [Google Scholar]
- Petriccione, B.; Bricca, A. Thirty years of ecological research at Gran Sasso d’Italia LTER sites: climate changes in action. Nat. Conserv. 2019, 34, 9–39. [Google Scholar] [CrossRef]
- Pauli, H.; Gottfried, M.; Grabherr, G. High summits of the Alps in a changing climate. In “Fingerprints” of Climate Change: Adapted Behaviour and Shifting Species Ranges.; Walther, G., Burg, a C.A., Edwards, P.J., Eds.; Kluwer Academic/Plenum: New York, 2001; pp. 139–149. [Google Scholar]
- Rossi, G.; Parolo, G.; Zonta, L.A.; Crawford, J.A.; Leonardi, A. Salix herbacea L. fragmented small population in the N-Apennines (Italy): response to human trampling disturbance. Biodivers. Conserv. 2006, 15, 3881–3893. [Google Scholar] [CrossRef]
- Cutini, M.; Iocchi, M.; Theurillat, J.P.; Petriccione, B. Appennino Centrale: Velino-Duchessa. In La Rete Italiana per la Ricerca Ecologica a Lungo Termine (LTER-Italia): situazione e prospettive dopo un quinquennio di attività (2006-2011); Bertoni, R., Ed.; ARACNE Editrice: Roma (Italy), 2012; pp. 38–40. Available online: http://www.vb.irsa.cnr.it/crypta/ebooks/La%20rete%20italiana%20LTER.pdf.
- Cutini, M.; Theurillat, J.P.; Petriccione, B.; Bricca, A.; Di Musciano, M.; De Toma, A.; Frattaroli, A.R.; Iocchi, M.; Malavasi, M.; Marzialetti, F.; Scolastri. A. Appennino Centrale: Velino-Duchessa, p. 74-79. In La Rete Italiana per la Ricerca Ecologica di Lungo Termine. Lo studio della biodiversità e dei cambiamenti.; Capotondi, L., Ravaioli, M., Acosta, A., Chiarini, F., Lami, A., Stanisci, A., Tarozzi, L., Mazzocchi, M.G., Eds.; CNR-Edizioni: Roma (Italy), 2021; p. 806. [Google Scholar] [CrossRef]
- Petriccione, B. 32 years of integrated habitat monitoring at the high-mountain station of Velino-Duchessa LTER site. In 58th International Congress of Italian Society of Vegetation Science, “Vegetation Ecology and Diversity for Habitat Monitoring and Conservation”. Book of abstracts and field trip guide; Musarella, C.M., Spampinato, G., Eds.; Reggio Calabria, Italy, 2025; p. p. 18. Available online: https://www.academia.edu/130120669/32_years_of_integrated_habitat_monitoring_at_the_high_mountain_station_of_Velino_Duchessa_LTER_siteISBN 9788899352929.
- Lavorel, S.; Garnier, E. Predicting changes in community composition and ecosystem functioning from plant traits: revisiting the Holy Grail. Funct. Ecol. 2002, 16, 545–556. [Google Scholar] [CrossRef]
- Bricca, A.; Carranza, M.; Varricchione, L.; Cutini, M.; Stanisci, M.; A. Exploring plant functional diversity and redundancy of mediterranean high-mountain habitats in the Apennines. Diversity 2021, 13(466), 1–16. [Google Scholar] [CrossRef]
- Varricchione, M.; Carranza, M.L.; Di Cecc, o V.; Di Martino, L.; Stanisci, A. Warmer and poorer: the fate of Alpine calcareous grasslands in Central Apennines (Italy). Diversity 2022, 14, e695. [Google Scholar] [CrossRef]
- Ottaviani, G.; Molina-Venegas, R.; Charles-Dominique, T.; Chelli, S.; Campetella, G.; Canullo, R.; Klimešová, J. The neglected belowground dimension of plant dominance. Trends Ecol. Evol. 2020, 35(9), 763–766. [Google Scholar] [CrossRef] [PubMed]
- Fischer, F.M.; Chytrý, K.; Těšitel, J.; Danihelka, J.; Chytrý, M. Weather fluctuations drive short-term dynamics and long-term stability in plant communities: a 25-year study in a Central European dry grassland. J. Veg. Sci. 2020, 31, 711–721. [Google Scholar] [CrossRef]
- Falcucci, A.; Maiorano, M.; Boitani, L. Changes in land-use/land-cover patterns in Italy and their implications for biodiversity conservation. Landsc. Ecol. 2007, 22, 617–631. [Google Scholar] [CrossRef]
- Clementi, A. L’evoluzione storica del territorio. In Progetto Parco. Tutela e valorizzazione dell’ambiente nel comprensorio del Gran Sasso d’Italia.; Rolli, G.L., Romano, B., Eds.; Andromeda Editrice: Teramo (Italy), 1995; pp. 176–196. [Google Scholar]
- Pignatti, S. Arealtypen und die antstehung der apenninischen gebirgsflora. In Mitt. Ostalp.-din.; Pfalnzensoz. Arbeitsgem.: Camerino (Italy), 1969. [Google Scholar]
- Petriccione, B.; Persia, G. Prodromo delle praterie di altitudine su calcare degli Appennini (classe Festuco-Seslerietea). Atti Conv. Lincei 1995, 115, 361–389. [Google Scholar]
- Furrer, E.; Furnari, F. Ricerche introduttive sulla vegetazione di altitudine del Gran Sasso d’Italia. Boll. Ist. Bot. Univ. Catania 1960, 2-2, 143–201. [Google Scholar]
- Biondi, E.; Blasi, C.; Burrascano, S.; Casavecchia, S.; Copiz, R.; Del Vico, E.; Galdenzi, D.; Gigante, D.; Lasen, C.; Spampinato, G.; Venanzoni, R.; Zivkovic, L. Manuale Italiano di interpretazione degli habitat della Direttiva 92/43/CEE.; Società Botanica Italiana, Ministero dell’Ambiente e della tutela del territorio e del mare, 2009; Available online: http://vnr.unipg.it/habitat.
- Pauli, H.; Gottfried, M.; Hohenwallner, D. The GLORIA field manual. Multi-Summit approach. In European Commission, DG Research, EUR 21213, Office for Official Publications of the European Communities; European Commission: Luxembourg, 2004; p. 85 pp. [Google Scholar]
- Lundquist, J.; Lott, D.; F. Using inexpensive temperature sensors to monitor the duration and heterogeneity of snow covered areas. Water Resour. Res. 2008, 44 . [Google Scholar]
- Schmid, M.O.; Gubler, S.; Fiddes, J.; Gruber, S. Inferring snowpack ripening and melt-out from distributed measurements of near-surface ground temperatures. The Cryosphere 2012, 6, 1127–1139. Available online: https://www.the-cryosphere.net/6/1127/2012/tc-6-1127-2012.pdf. [CrossRef]
- Petriccione, B.; Gregg, S. Belowground plant life: feasibility study on the use of root traits to explain time changes in vegetation at the Velino-Duchessa LTER site. Abstract presented to 56° International Congress of Italian Society of Vegetation Science, Siena, Italy, 2023. [Google Scholar] [CrossRef]
- Braun-Blanquet, J. Plant Sociology.; New York, 1932. [Google Scholar]
- Braun-Blanquet, J. Pflanzensoziologie. Grundzuge der Vegetationskunde.; Springer: Wien and New York, 1964. [Google Scholar]
- Petriccione, B. Vegetation samples at the permanent plots of LTER site “Appennino Centrale: Velino-Duchessa” (1993-2023). In Zenodo; 2024. [Google Scholar] [CrossRef]
- Pignatti, S. Fitogeografia. In Trattato di Botanica.; Cappelletti, C., Ed.; UTET: Torino (Italy), 1952. [Google Scholar]
- Pignatti, S. Flora d’Italia.; Edagricole-New Business Media: Bologna (Italy); 3 voll. pp. 2017–2018.
- Petriccione, B. Ecologia e fitogeografia delle praterie di altitudine a Sesleria tenuifolia degli Appennini (Italia). Rev. Valdotaine Hist. Nat. 1994, 48, 287–296. [Google Scholar]
- Falinski, B. Vegetation dynamics in temperate lowland primeval forest. Ecological studies in Bialowieza forest. Geobotany 1986, 8, 1–537. [Google Scholar]
- Falinski, B. Le temp et l'éspace dans les recherches écologiques sur le dynamisme de la végétation. Giorn. Bot. Ital. 1989, 123, 81–107. [Google Scholar] [CrossRef]
- Grime, J.P. Plant strategies, vegetation processes, and ecosystem properties.; John Wiley and Sons: Toronto, 2006. [Google Scholar]
- Raunkiær, C. Life forms of plants and statistical plant geography; Oxford, 1934. [Google Scholar]
- Grime, J.P. Evidence for the existence of three primary strategies in plants and its relevance to ecological and evolutionary theory. Am. Nat. 1977, 3, 1169–1194. [Google Scholar] [CrossRef]
- Grime, J.P. Towards a functional description of vegetation. In Population Structure of Vegetation.; White, J., Beeftink, J., Eds.; Junk: The Hague, 1984. [Google Scholar]
- Woodward, F.I.; Cramer, W. Plant functional types and climatic changes: Introduction. J. Veg. Sci. 1996, 7, 306–308. [Google Scholar] [CrossRef]
- Pignatti, S. Valori di bioindicazione delle piante vascolari della flora d’Italia. Braun-Blanquetia 2005, 39, 3–97. Available online: http://www.scienzadellavegetazione.it/sisv/libreria/braun-blanquetia/BRBL39.pdf.
- Oksanen, J. Vegan: Community Ecology Package. R package version 2.6–4,2022. Available online: https://CRAN.R-project.org/package=vegan.
- Ricotta, C.; Moretti, M. CWM and Rao's quadratic diversity: a unified framework for functional ecology. Oecologia 2011, 167, 181–188. [Google Scholar] [CrossRef] [PubMed]
- Zelený, D. Weimea Weight. Mean. Anal. (Version 0.1.18) [R package] , 2020. [CrossRef]
- Wood, S.N. Generalized Additive Models: An Introduction with R (2nd edition).; CRC Press: Boca Raton, FL (USA), 2017. [Google Scholar]
- Bricca, A.; Tardella, F.M.; Ferrara, A.; Panichella, T.; Catorci, A. Exploring assembly trajectories of abandoned grasslands in response to 10 years of mowing in sub-mediterranean context. Land 2021, 10, e1158. [Google Scholar] [CrossRef]
- Zuur, A.F.; Ieno, E.N.; Elphick, C.S. A protocol for data exploration to avoid common statistical problems. Methods Ecol. Evol. 2010, 1, 3–14. [Google Scholar]
- Zelený, D. Which Results of the Standard Test for Community-Weighted Mean Approach Are Too Optimistic? J. Veg. Sci. 2018, 29, 953–966. [Google Scholar] [CrossRef]
- Zelený, D.; Schaffers, A.P. Too Good to Be True: Pitfalls of Using Mean Ellenberg Indicator Values in Vegetation Analyses. J. Veg. Sci. 2012, 23, 419–431. [Google Scholar] [CrossRef]
- Pilotto, F.; Kühn, I.; Adrian, R.; Alber, R.; Alignier, A.; Andrews, C.; Bäck, J.; Barbaro, L.; Beaumont, D.; Beenaerts, N.; Benham, S.; Boukal, D.S.; Bretagnolle, V.; Camatti, E.; Canullo, R.; Cardoso, P.G.; Ens, B.J.; Everaert, G.; Evtimova, V.; Feuchtmayr, H.; García-González, R.; Gómez Garcí, a D.; Grandin, U.; Gutowski, J.M.; Liat, H.; Halada, L.; Halassy, M.; Hummel, H.; Huttunen, K.L.; Jaroszewicz, B.; Jensen, T.C.; Kalivoda, H.; Kappel Schmidt, I.; Kröncke, I.; Leinonen, R.; Martinho, F.; Meesenburg, H.; Meyer, J.; Minerbi, S.; Monteith, D.; Nikolov, B.P.; Oro, D.; Ozolinš, D.; Padedda, B.M.; Pallett, D.; Pansera, M.; Pardal, M.A.; Petriccione, B.; Pipan, T.; Pöyry, J.; Schäfer, S.M.; Schaub, M.; Schneider, S.C.; Skuja, A.; Soetaert, K.; Springe, G.; Stanchev, R.; Stockan, J.A.; Stoll, S.; Sundqvist, L.; Thimonier, A.; Van Hoey, G.; Van Ryckegem, G.; Visser, M.E.; Vorhauser, S.; Haase, P. Meta-analysis of multidecadal biodiversity trends in Europe. Nat. Commun. 2020, 11(3486), 1–11. [Google Scholar] [CrossRef] [PubMed]
- Di Nuzzo, L.; Vallese, C.; Benesperi, R.; Giordani, P.; Chiarucci, A.; Di Cecco, V.; Di Martino, L.; Di Musciano, M.; Gheza, G.; Lelli, C.; Spitale, D.; Nascimbene, J. Contrasting multitaxon responses to climate change in Mediterranean mountains. Nat. Sci. Rep. 2021, 11, e4438. [Google Scholar] [CrossRef] [PubMed]
- Givnish, T.J. Comparative studies of leaf form: assessing the relative roles of selective pressures and phylogenetic constraints. New Phytol. 1987, 106, 131–160. [Google Scholar] [CrossRef]
- Knight, C.A.; Ackerly, D.D. Evolution and plasticity of photosynthetic thermal tolerance, specific leaf area and leaf size: congeneric species from desert and coastal environments. New Phytol. 2003, 160(2), 337–347. [Google Scholar] [CrossRef] [PubMed]
- Freschet, G.T.; et al. Root traits as drivers of plant and ecosystem functioning: current understanding, pitfalls and future research needs. New Phytol. 2021, 232, 1123–1158. [Google Scholar] [CrossRef] [PubMed]
- Spitzer, C.M.; Sundqvist, M.K.; Wardle, D.A.; Gundale, M.J.; Kardol, P. Root trait variation along a sub-arctic tundra elevational gradient. Oikos 2022, 1(e08903), 1–14. [Google Scholar] [CrossRef]
- Edwards, A.C.; Scalenghe, R.; Freppaz, M. Changes in the seasonal snow cover of alpine regions and its effect on soil processes: A review. Quat. Int. 2007, 162-163, 172–181. [Google Scholar] [CrossRef]
Figure 1.
Extreme temperature events in the Apennines. Number of extreme temperature events identified per year in the Apennine region in the period 1962-2022 (original processing, data from [10]).
Figure 1.
Extreme temperature events in the Apennines. Number of extreme temperature events identified per year in the Apennine region in the period 1962-2022 (original processing, data from [10]).
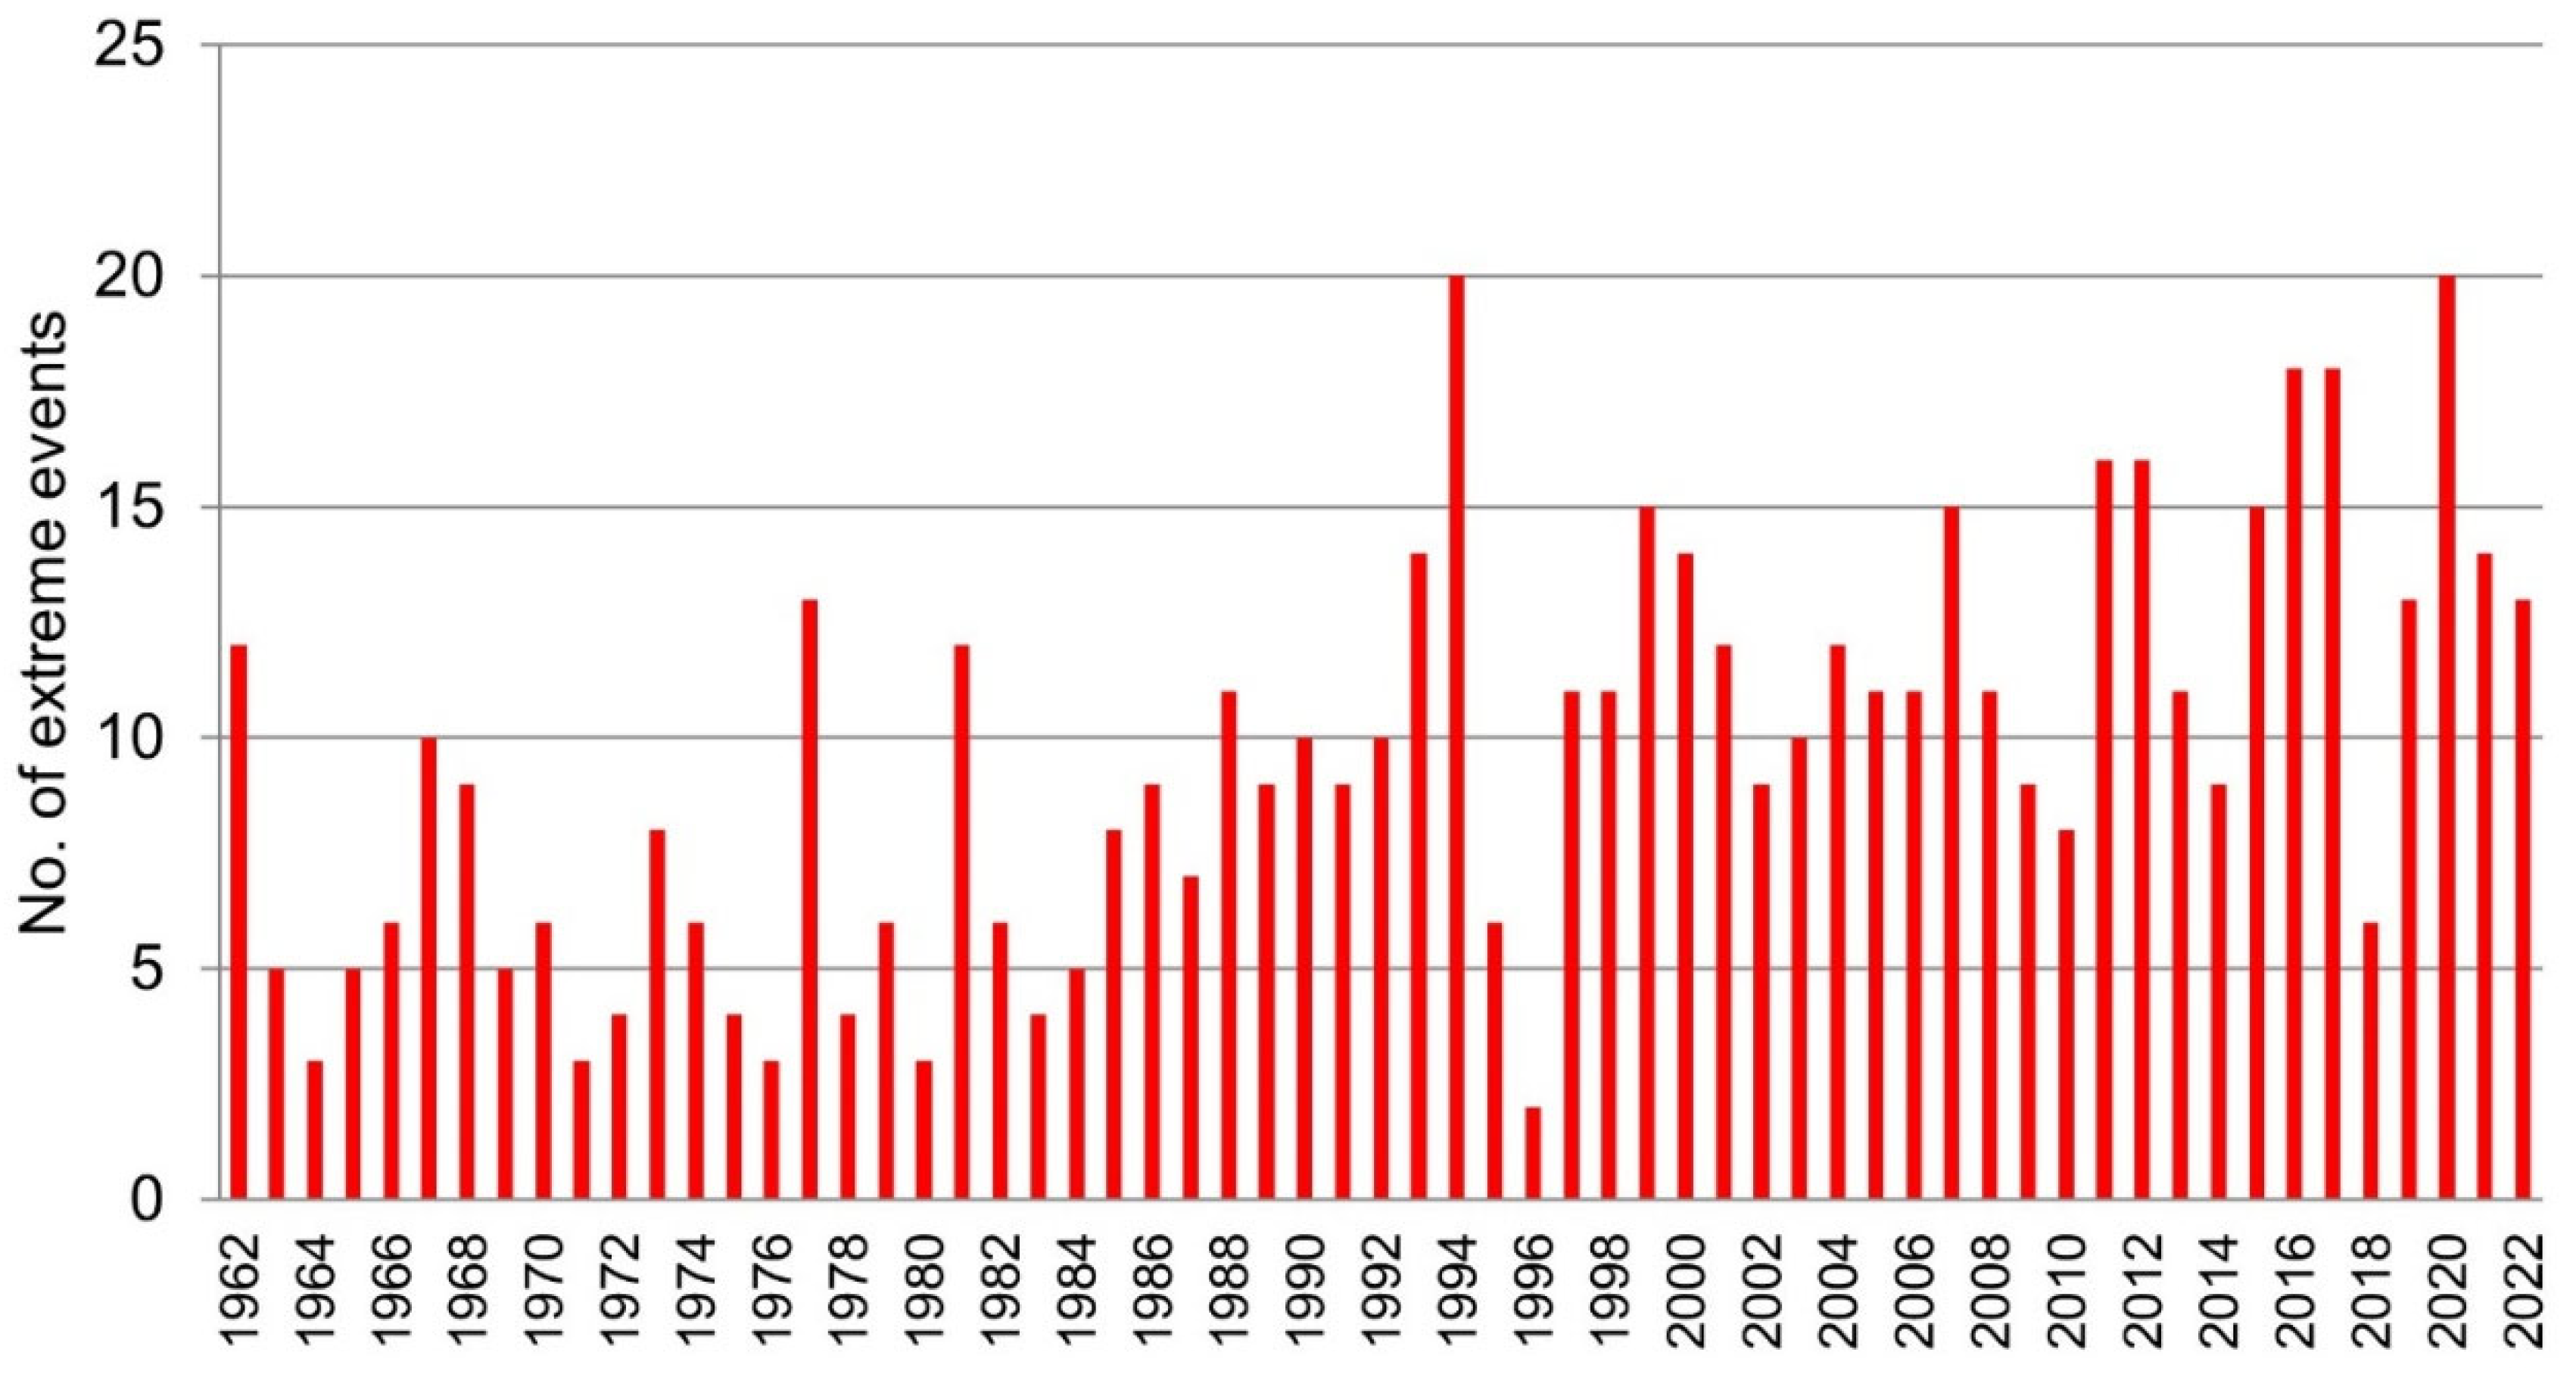
Figure 2.
Snow-bed grassland at 30/07/2014 (a) and at 31/07/2017 (b). Recognizable species (flowering): Festuca rubra subsp. commutata, Trifolium pratense subsp. semipurpureum, Taraxacum apenninum (Photo credits Bruno Petriccione). Alpine tundra at 30/07/2014 (c) and at 31/07/2017 (d). Recognizable species: Silene exscapa, Dryas octopetala and (flowering) Edraianthus graminifolius subsp. graminifolius, Matthiola italica and Arenaria grandiflora (Photo credits: c: Bruno Petriccione; d: Sarah Gregg).
Figure 2.
Snow-bed grassland at 30/07/2014 (a) and at 31/07/2017 (b). Recognizable species (flowering): Festuca rubra subsp. commutata, Trifolium pratense subsp. semipurpureum, Taraxacum apenninum (Photo credits Bruno Petriccione). Alpine tundra at 30/07/2014 (c) and at 31/07/2017 (d). Recognizable species: Silene exscapa, Dryas octopetala and (flowering) Edraianthus graminifolius subsp. graminifolius, Matthiola italica and Arenaria grandiflora (Photo credits: c: Bruno Petriccione; d: Sarah Gregg).
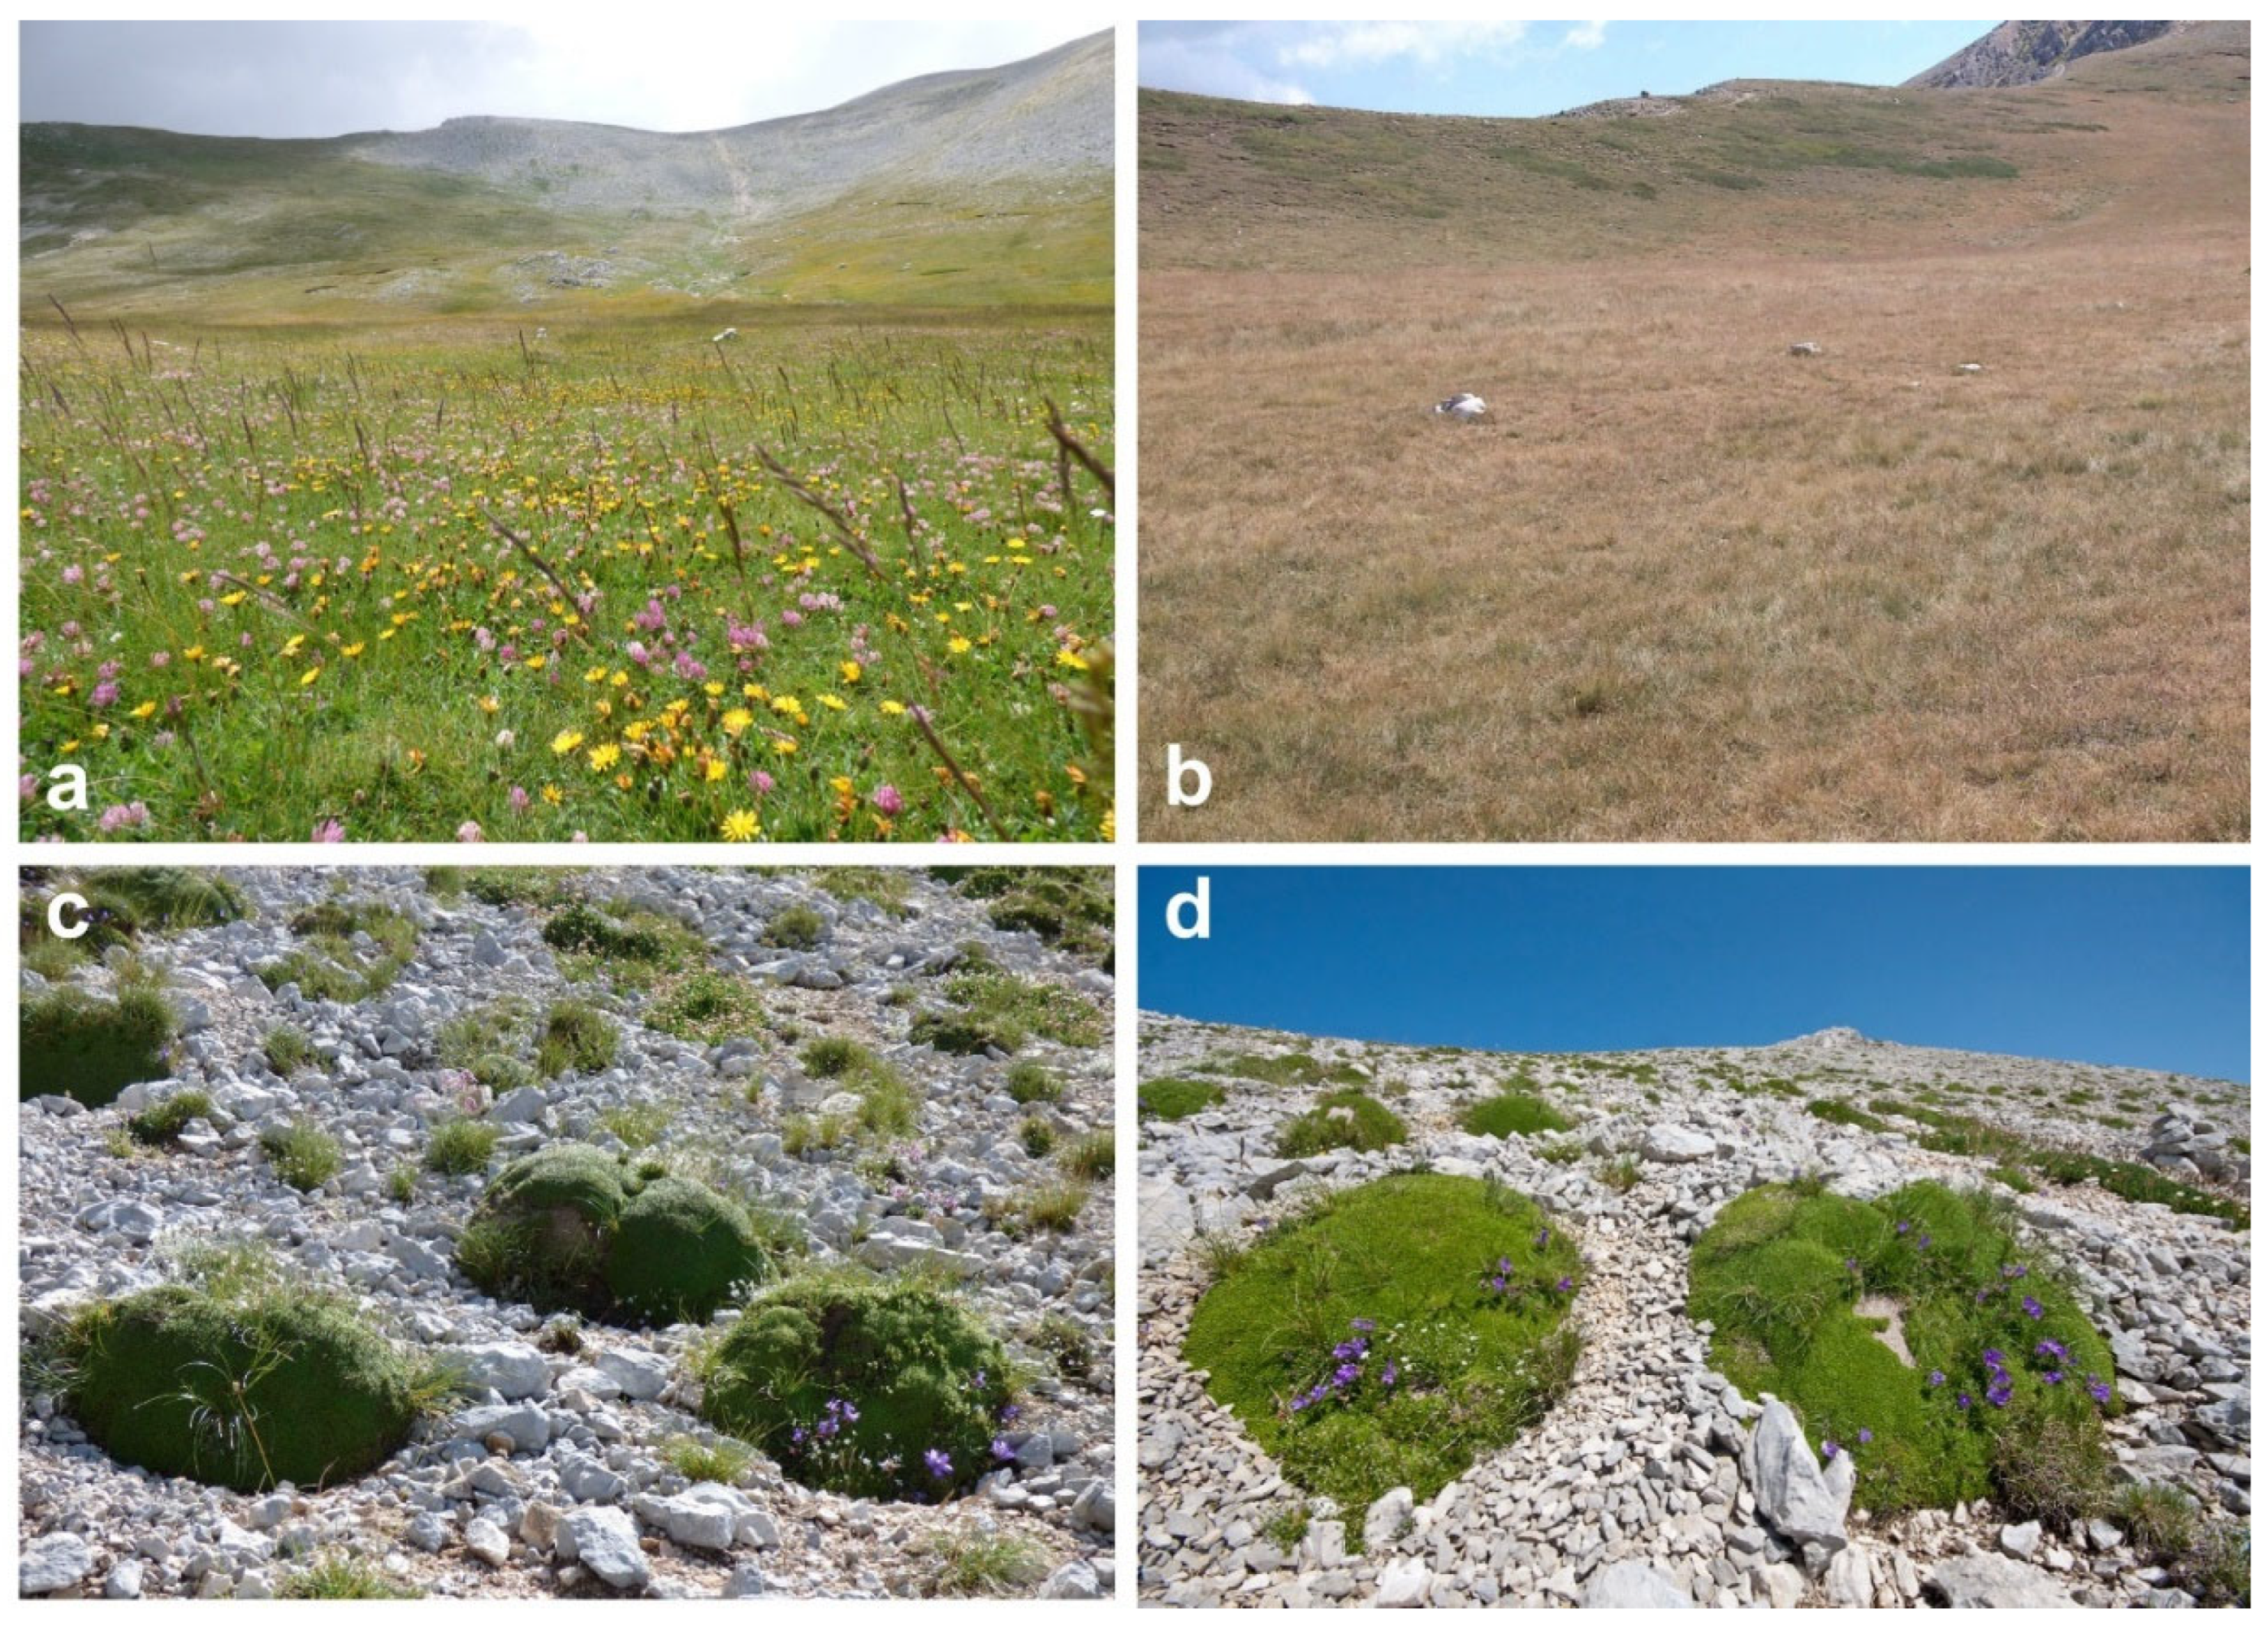
Figure 3.
Mean daily soil temperature at the snow-bed grassland (a) and alpine tundra (b) research stations from 2014 to 2025.
Figure 3.
Mean daily soil temperature at the snow-bed grassland (a) and alpine tundra (b) research stations from 2014 to 2025.
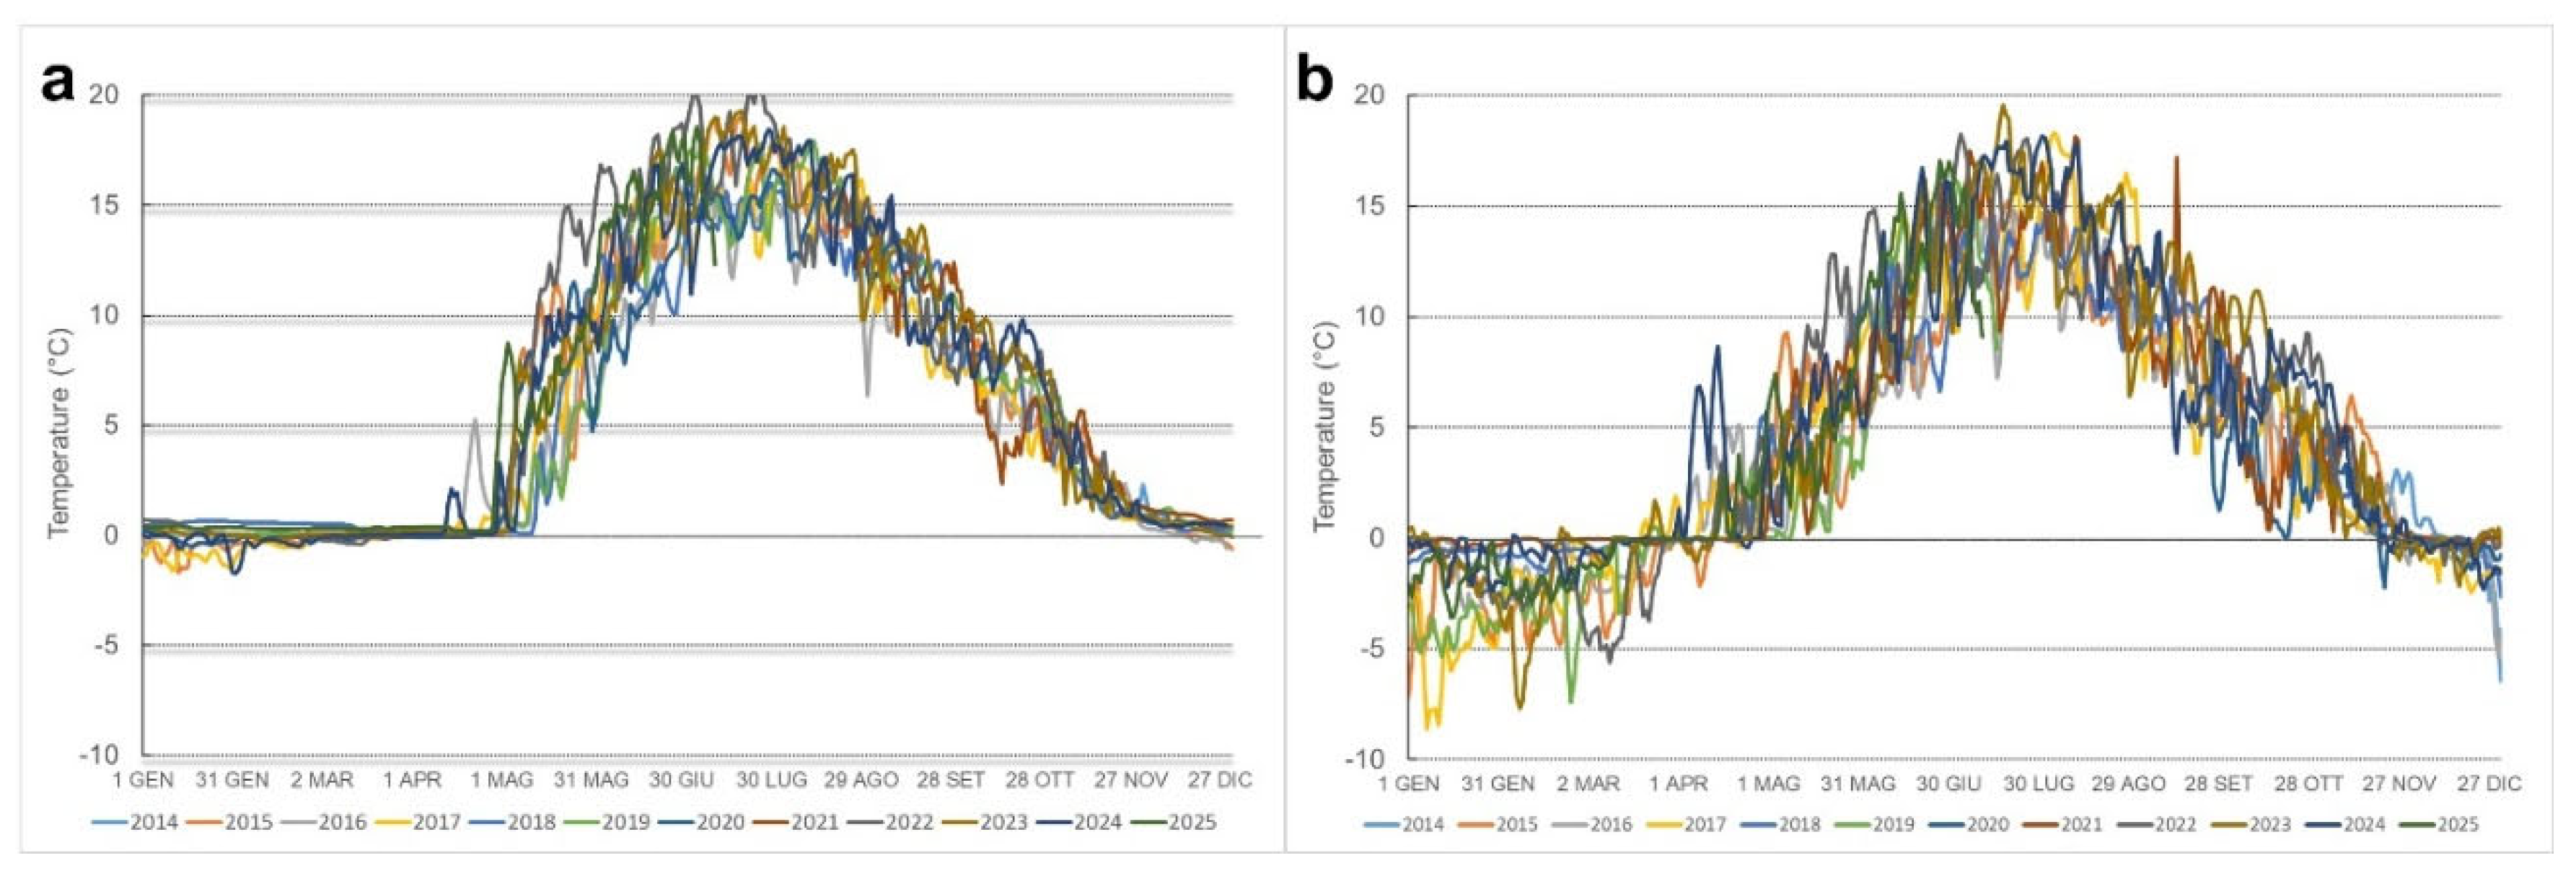
Figure 4.
Winter days with minimum temperature below zero at the snow-bed grassland (a) and alpine tundra research stations (b) from 2014 to 2025. Data for winters 2020/2021 (a) and for 2019/2020 (b) are missing.
Figure 4.
Winter days with minimum temperature below zero at the snow-bed grassland (a) and alpine tundra research stations (b) from 2014 to 2025. Data for winters 2020/2021 (a) and for 2019/2020 (b) are missing.
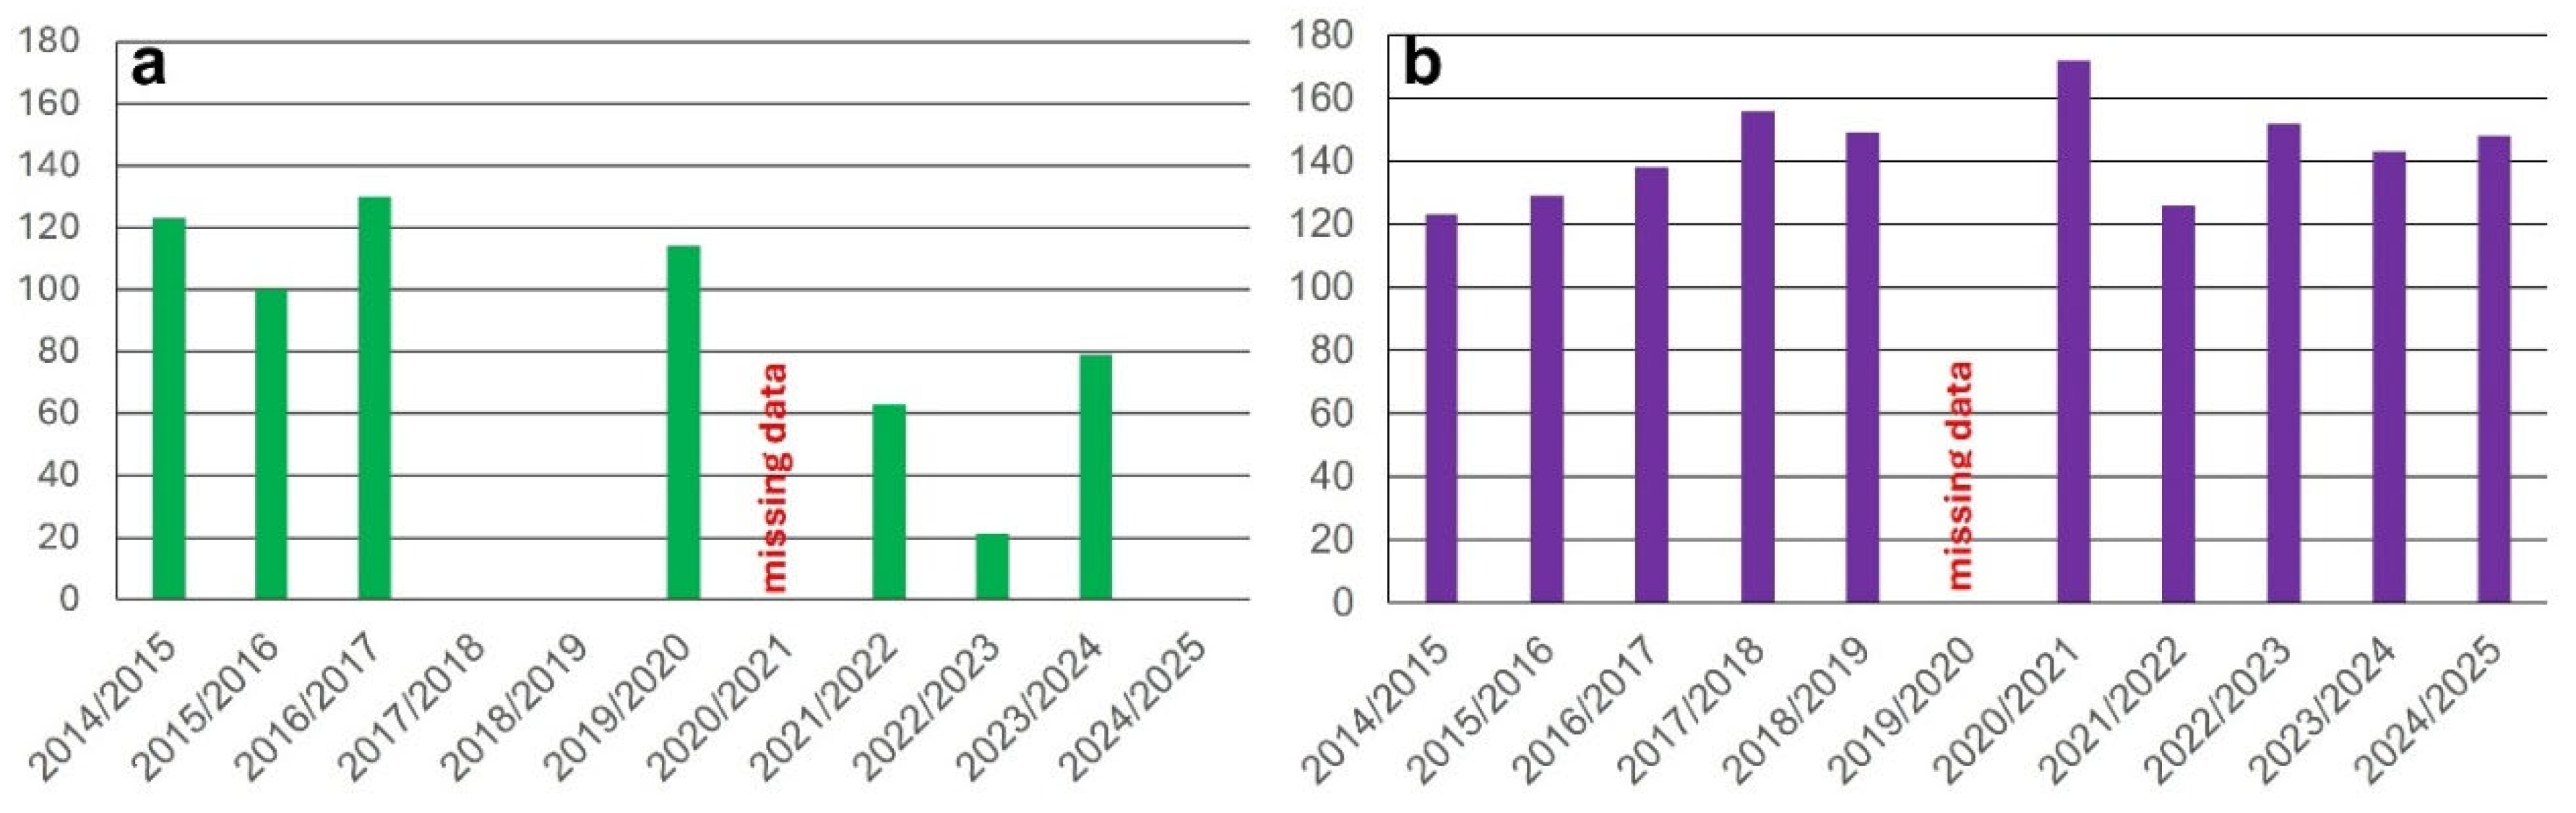
Figure 6.
No. of winter days with minimum temperature below zero from 2022 to 2025. Sevice meteorological station (red), alpine tundra (purple) and snow-bed grassland (green) research stations.
Figure 6.
No. of winter days with minimum temperature below zero from 2022 to 2025. Sevice meteorological station (red), alpine tundra (purple) and snow-bed grassland (green) research stations.
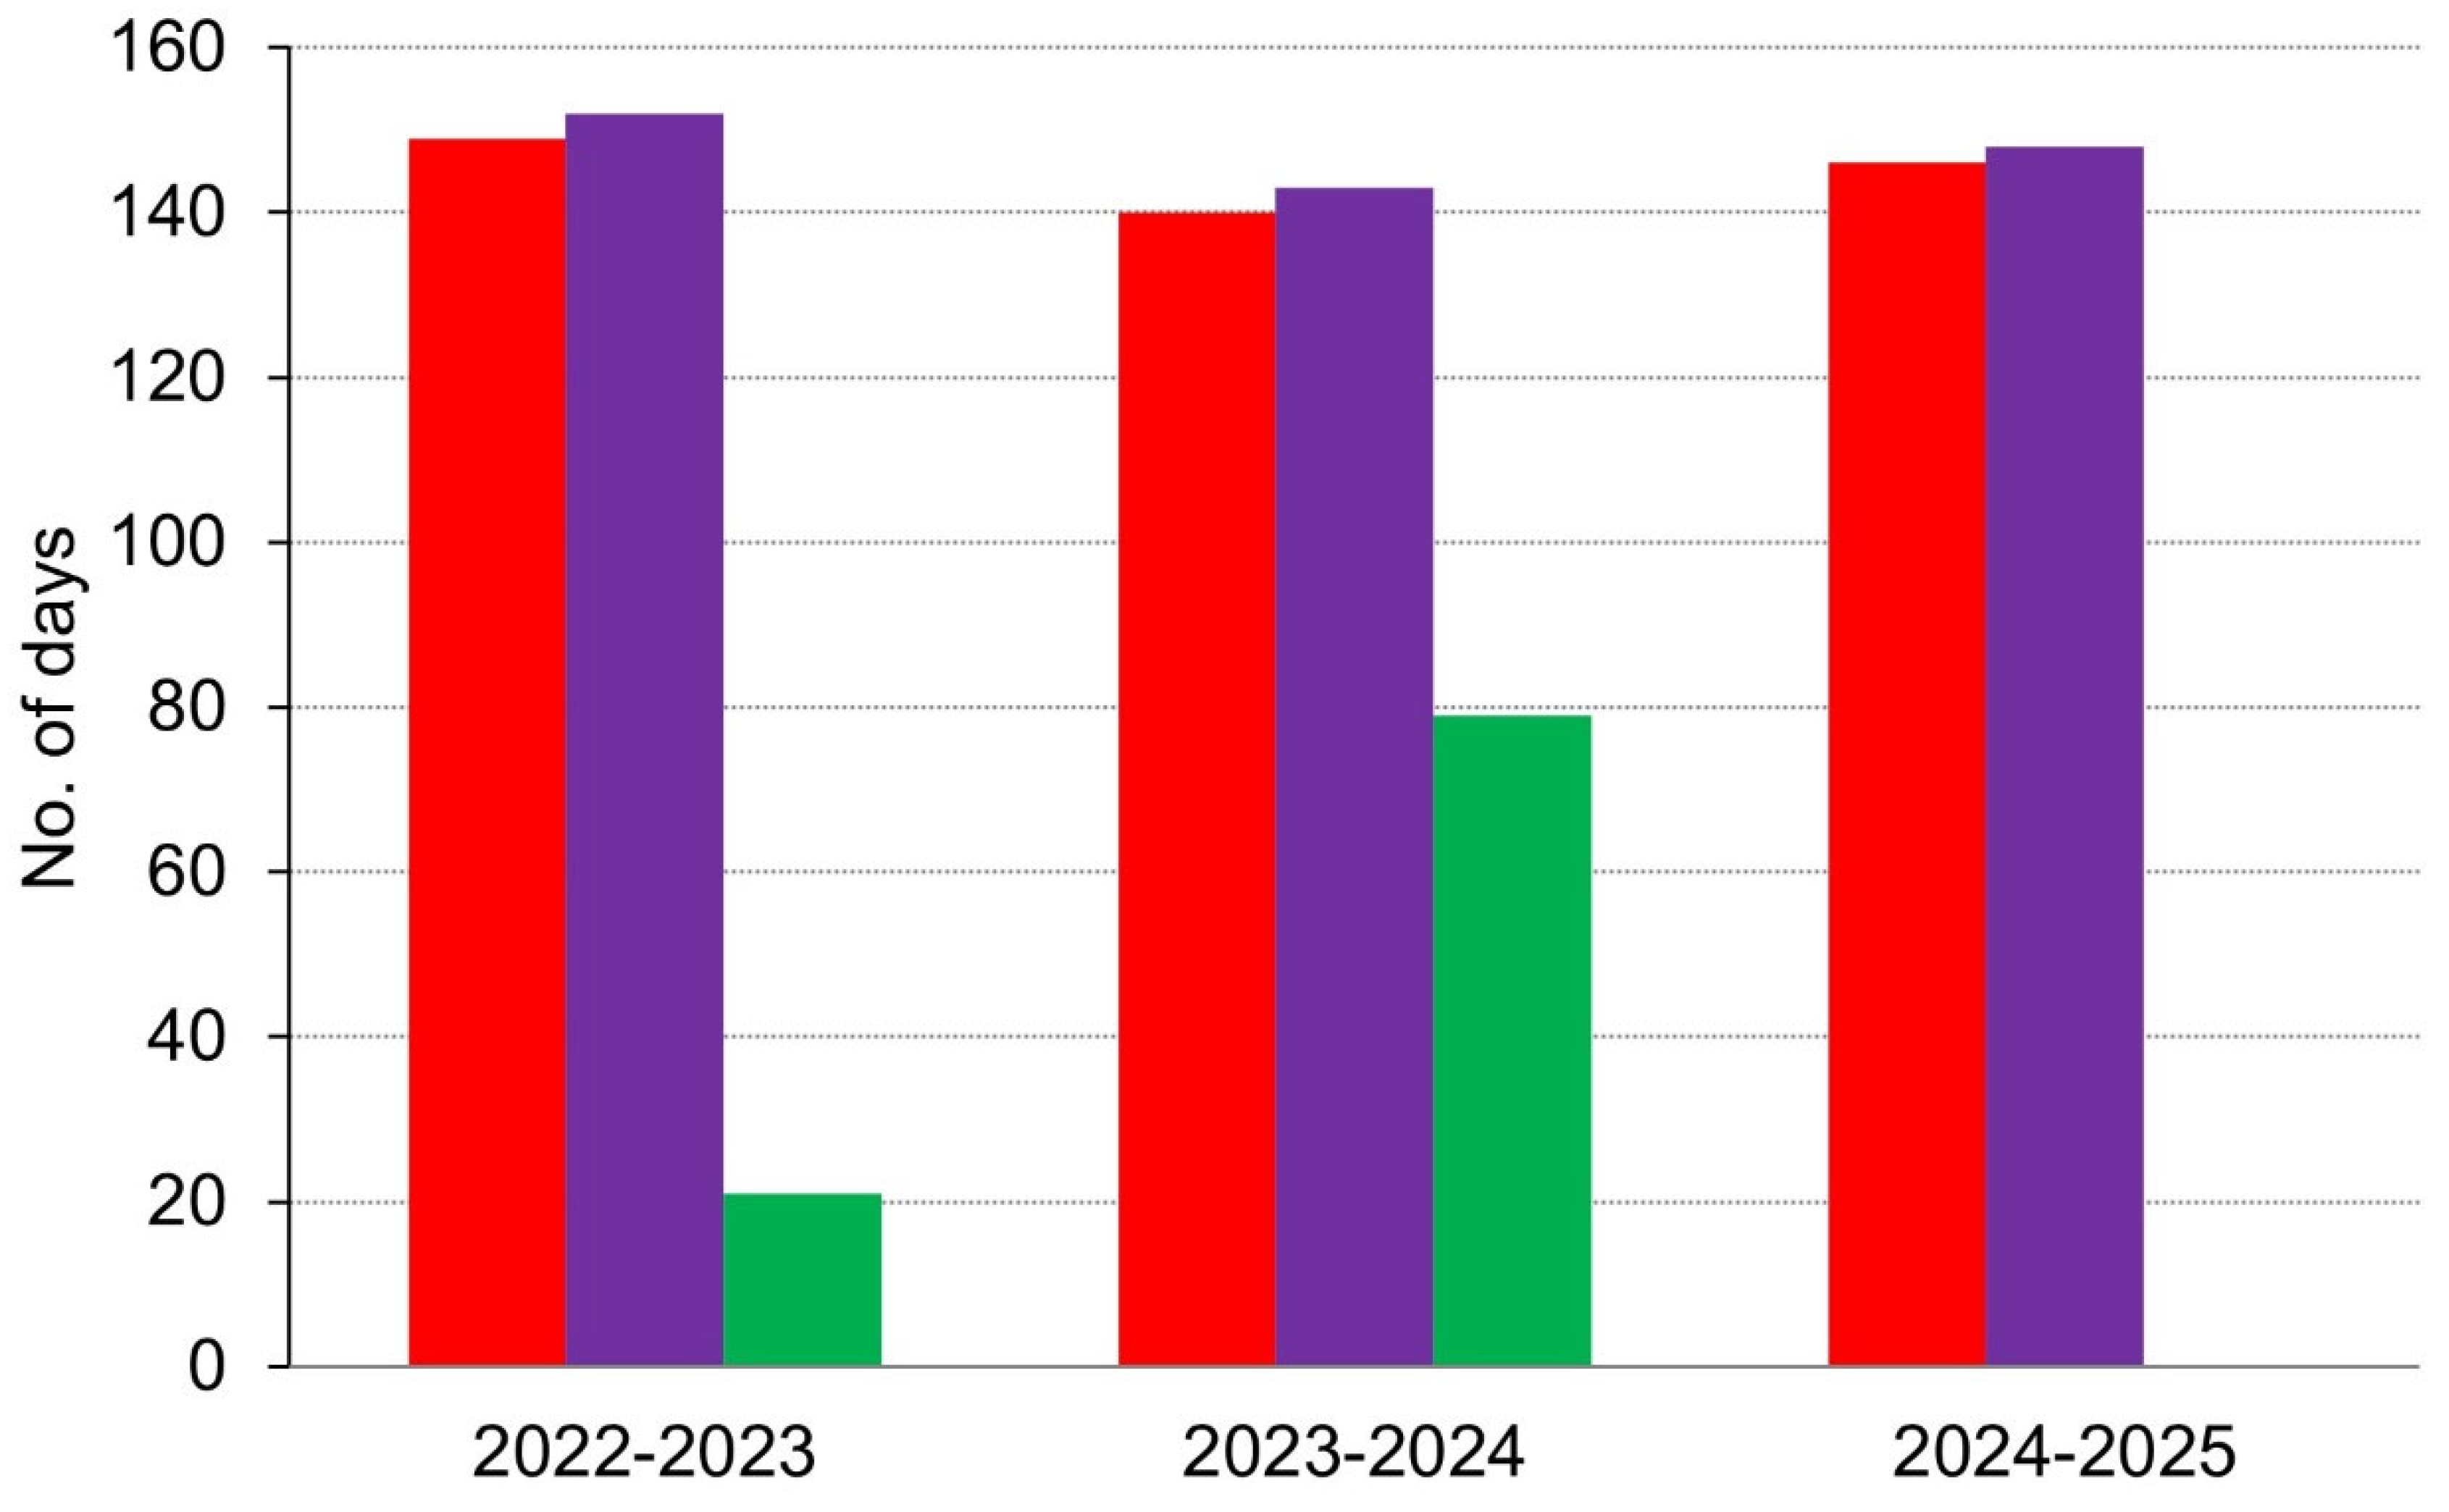
Figure 7.
Cumulate percentage cover values of species with deep roots (> 10 cm) (a) and shallow roots (< 10 cm) (b) at the snow-bed grassland (green) and alpine tundra (purple) research stations, from 1993 to 2025.
Figure 7.
Cumulate percentage cover values of species with deep roots (> 10 cm) (a) and shallow roots (< 10 cm) (b) at the snow-bed grassland (green) and alpine tundra (purple) research stations, from 1993 to 2025.
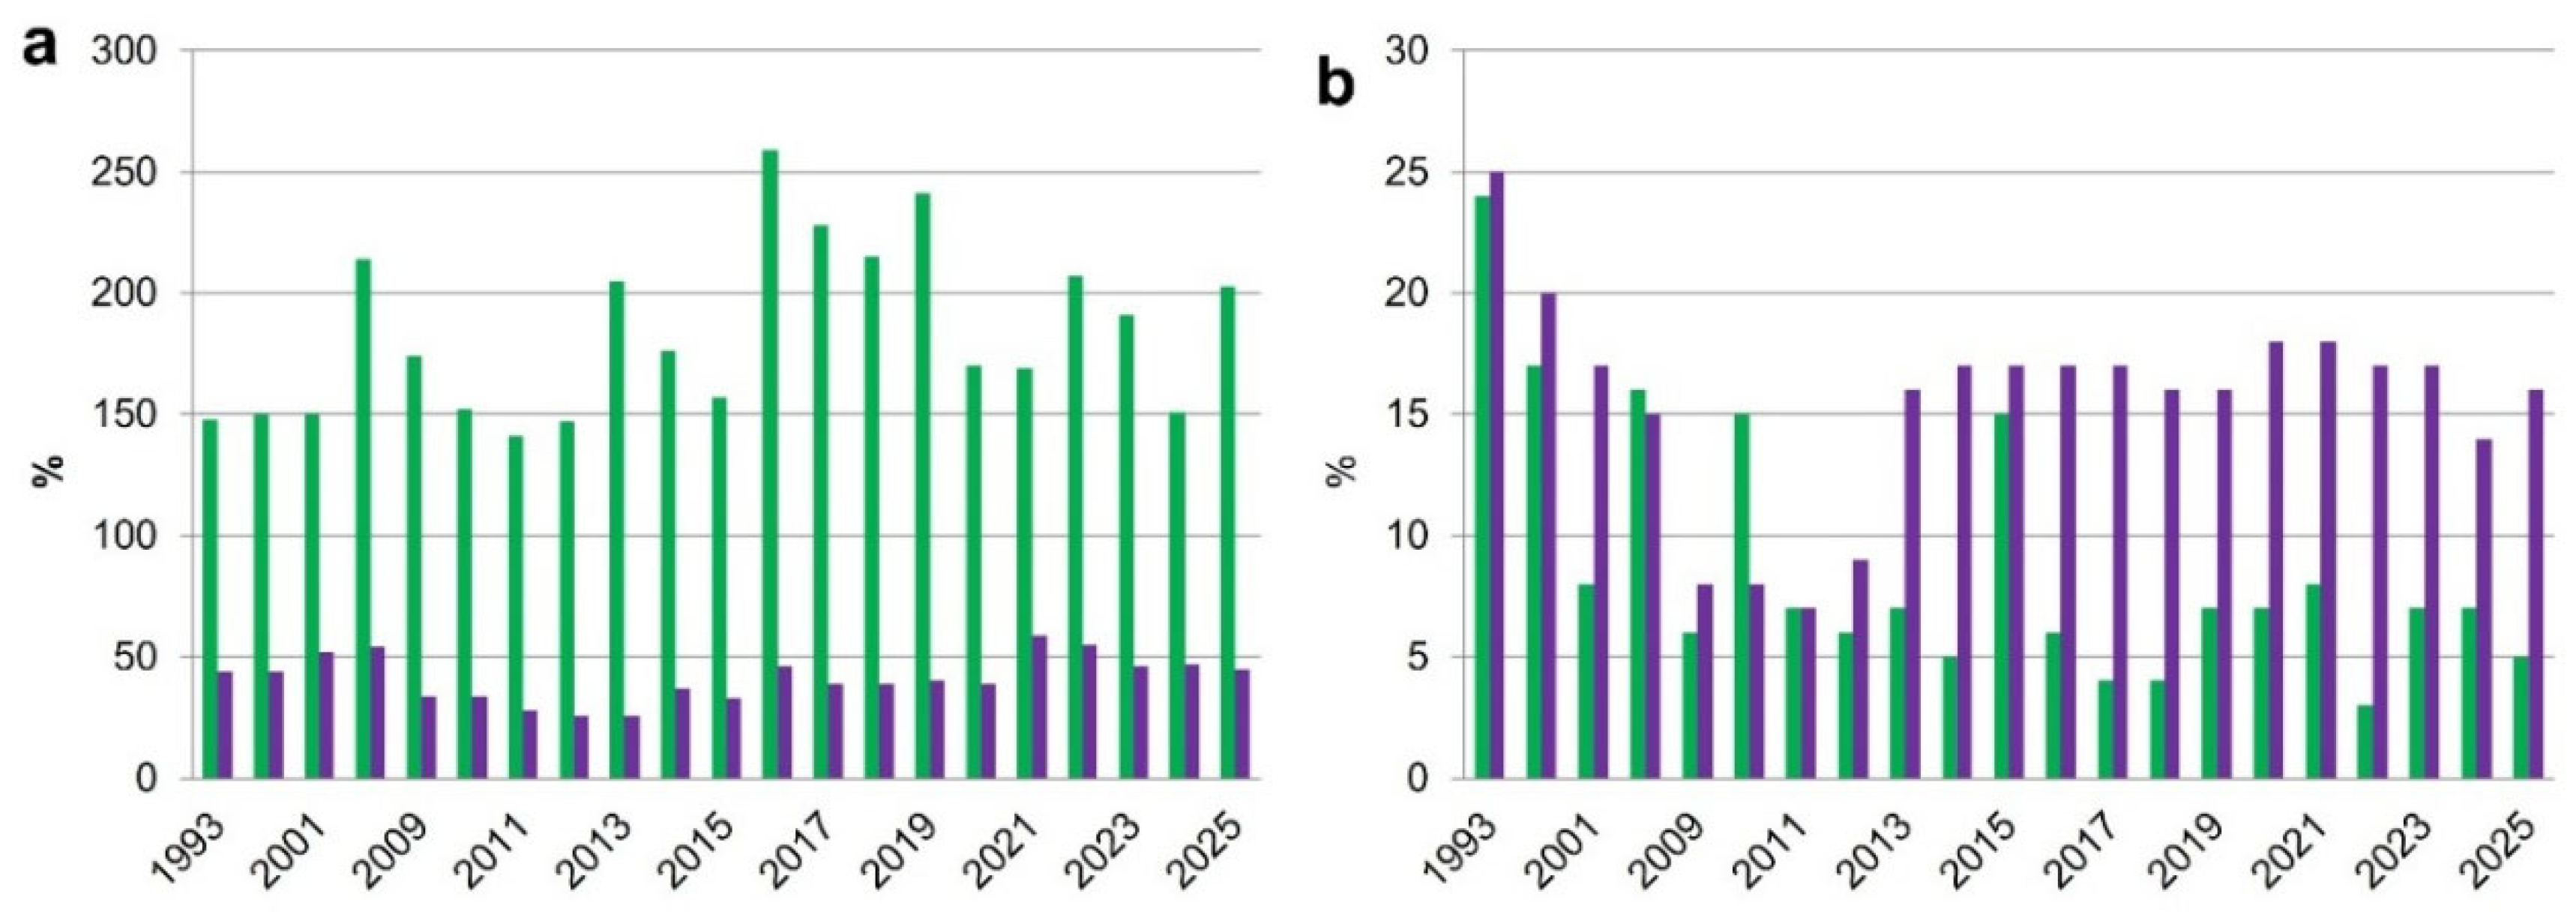
Figure 8.
Predicted temporal changes from 1992 to 2025 based on mixed-effects models for: a) species richness, b) Shannon diversity, c) community-weighted mean (CWM) of life forms, d) CWM of morpho-functional types, e) CWM of Grime’s strategies, f) CWM of root types, and g) community mean (CM) of ecological indicator values for heat. Colours indicate plant communities (green: alpine tundra; orange: snow-bed grassland), and different line types within each panel represent distinct trait states.
Figure 8.
Predicted temporal changes from 1992 to 2025 based on mixed-effects models for: a) species richness, b) Shannon diversity, c) community-weighted mean (CWM) of life forms, d) CWM of morpho-functional types, e) CWM of Grime’s strategies, f) CWM of root types, and g) community mean (CM) of ecological indicator values for heat. Colours indicate plant communities (green: alpine tundra; orange: snow-bed grassland), and different line types within each panel represent distinct trait states.
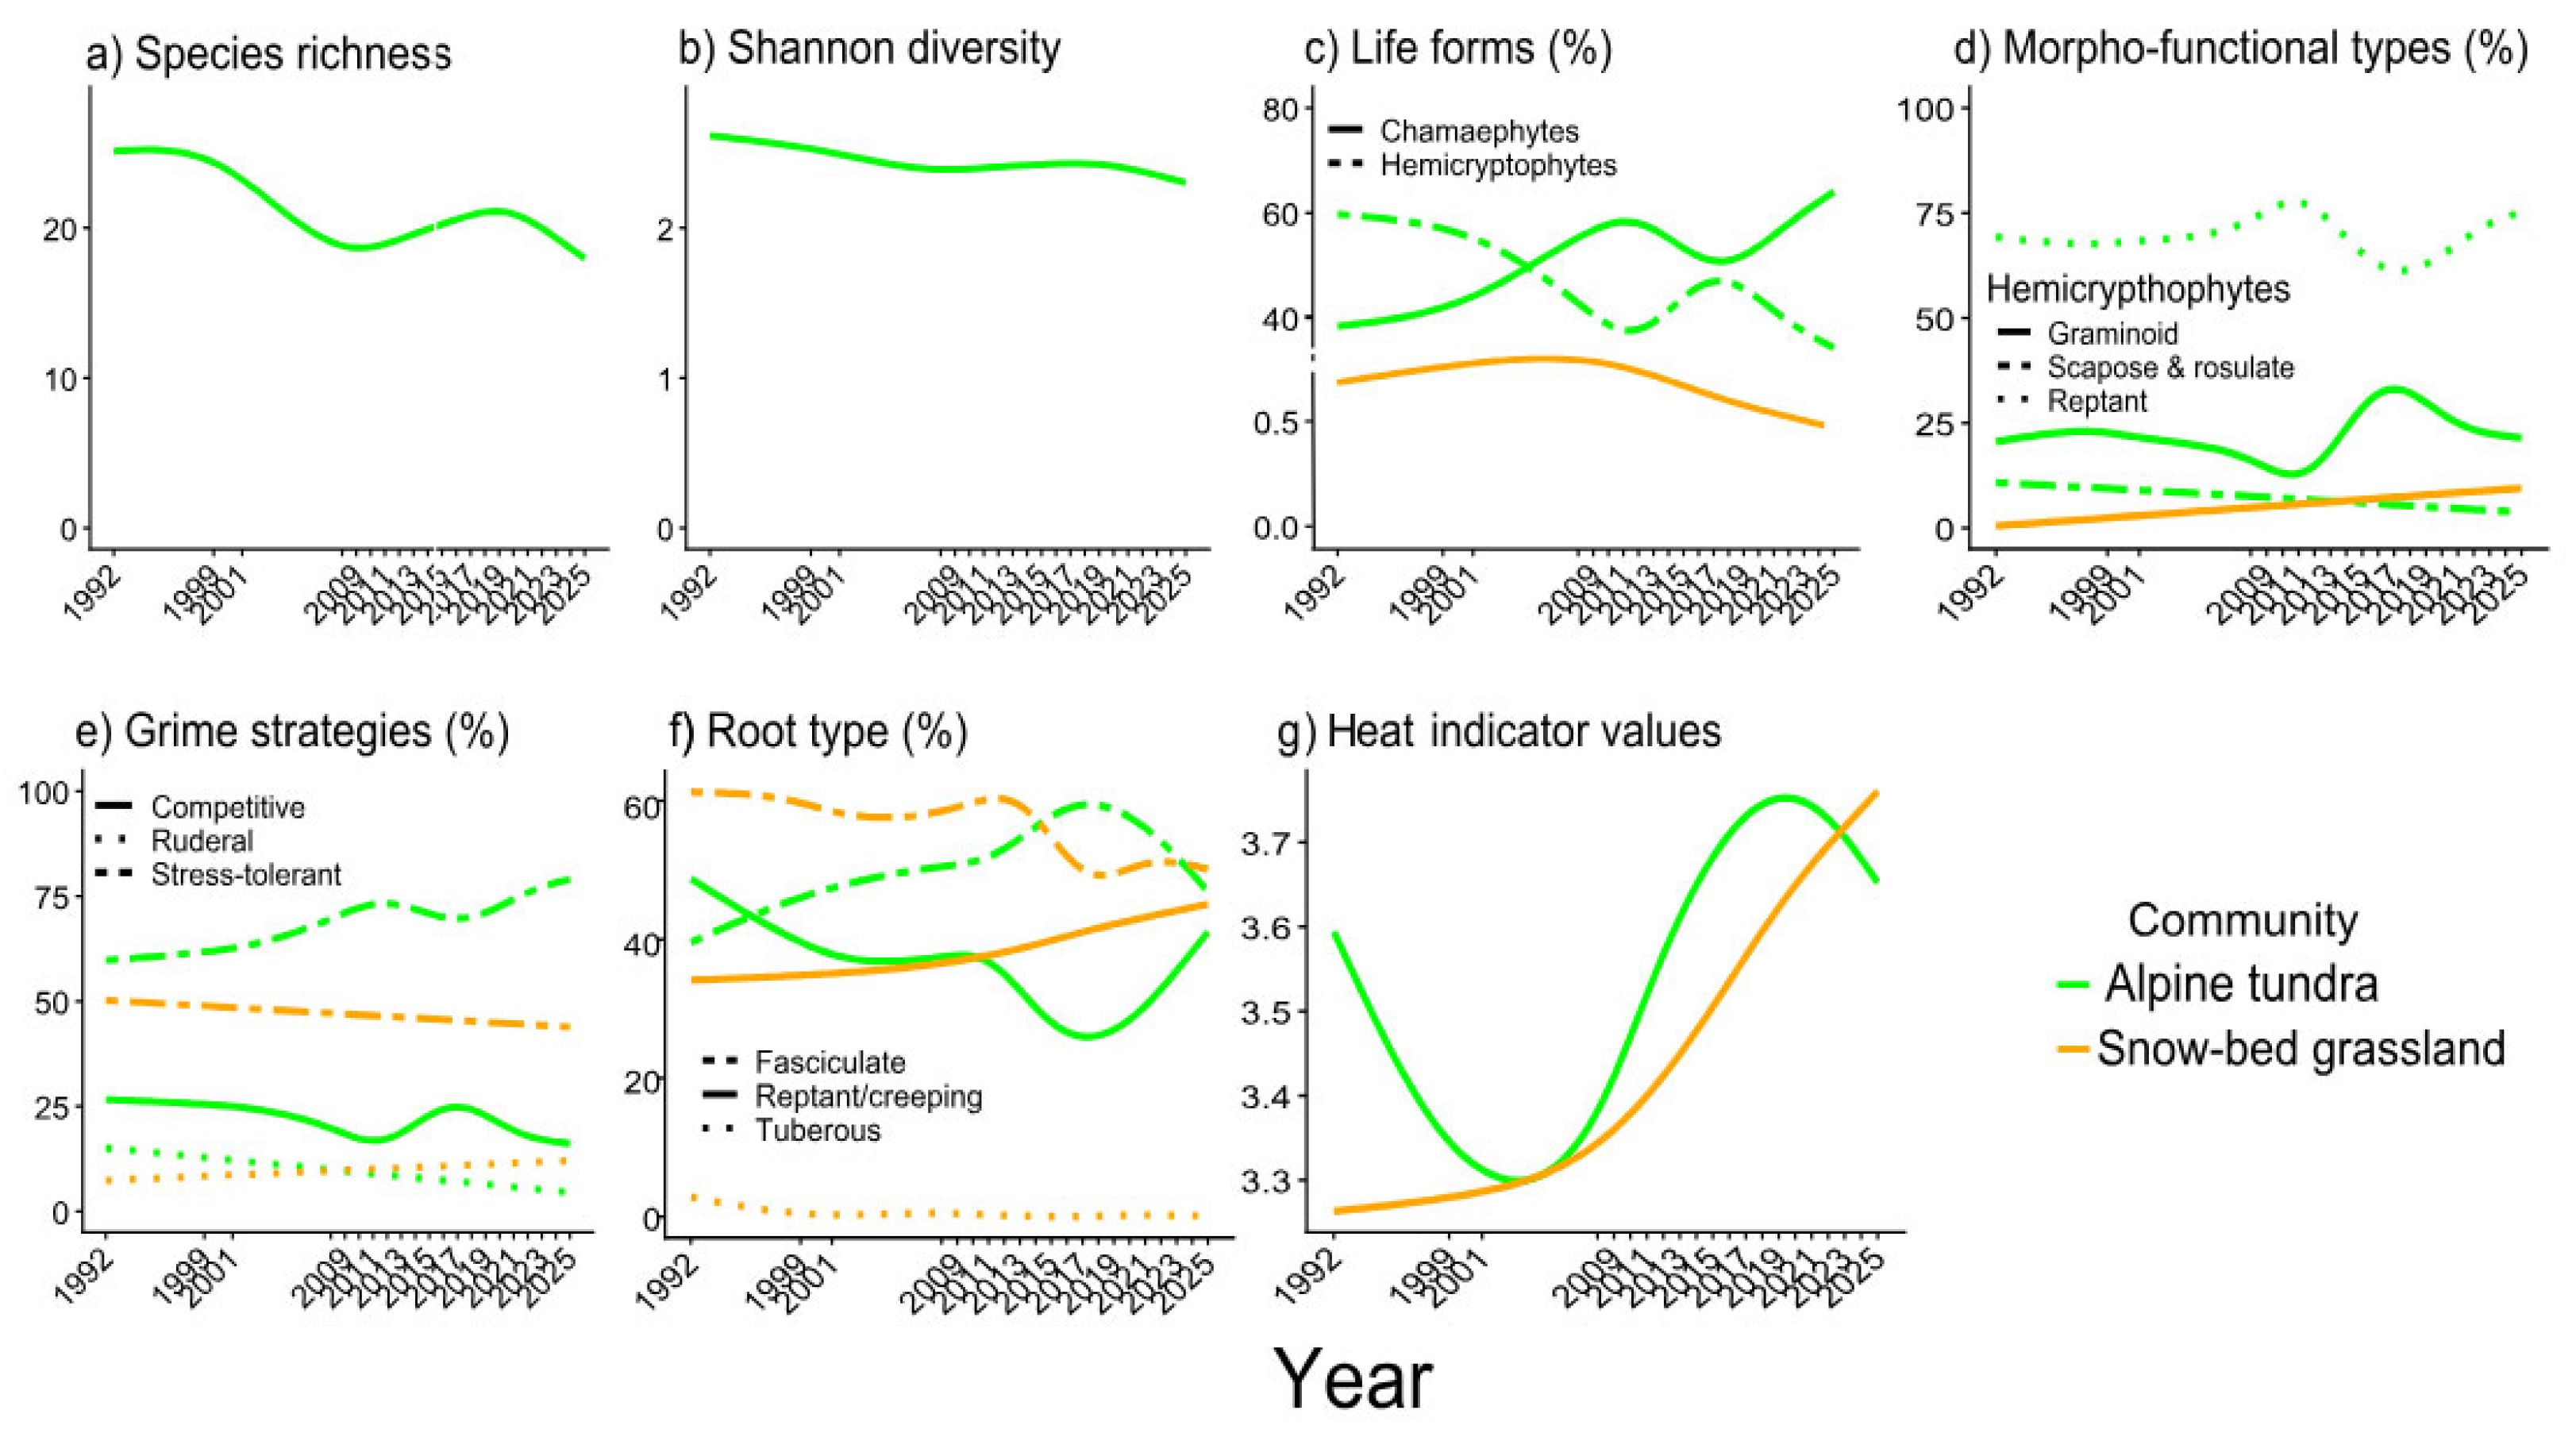
Figure 9.
Changes in species composition over time for both plant communities according to dbRDA (a: snow-bed grassland; b: alpine tundra). Only the ten most abundant species were included. For snow-bed grassland: Carcar = Carex caryophyllea ssp. caryophyllea; Carkit = Carex kitaibeliana; Galani = Galium anisophyllon; Pillac = Pilosella lactucella ssp. nana; Plaatr = Plantago atrata ssp. atrata; Poaalp = Poa alpina ssp. alpina; Ranape = Ranunculus apenninus; Tarape = Taraxacum apenninum; Tripra = Trifolium pratense ssp. semipurpureum; Tritha = Trifolium thalii. For alpine tundra: Aregra = Arenaria grandiflora ssp. grandiflora; Certom = Cerastium tomentosum ssp. album; Edrgra = Edraianthus graminifolius ssp. graminifolius; Eriepi = Erigeron epiroticus; Galmag = Galium magellense; Potcra = Potentilla crantzii; Scomon = Scorzoneroides montana ssp. breviscapa; Sesjun = Sesleria juncifolia ssp. juncifolia; Silexs = Silene exscapa; Valsal = Valeriana saliunca.
Figure 9.
Changes in species composition over time for both plant communities according to dbRDA (a: snow-bed grassland; b: alpine tundra). Only the ten most abundant species were included. For snow-bed grassland: Carcar = Carex caryophyllea ssp. caryophyllea; Carkit = Carex kitaibeliana; Galani = Galium anisophyllon; Pillac = Pilosella lactucella ssp. nana; Plaatr = Plantago atrata ssp. atrata; Poaalp = Poa alpina ssp. alpina; Ranape = Ranunculus apenninus; Tarape = Taraxacum apenninum; Tripra = Trifolium pratense ssp. semipurpureum; Tritha = Trifolium thalii. For alpine tundra: Aregra = Arenaria grandiflora ssp. grandiflora; Certom = Cerastium tomentosum ssp. album; Edrgra = Edraianthus graminifolius ssp. graminifolius; Eriepi = Erigeron epiroticus; Galmag = Galium magellense; Potcra = Potentilla crantzii; Scomon = Scorzoneroides montana ssp. breviscapa; Sesjun = Sesleria juncifolia ssp. juncifolia; Silexs = Silene exscapa; Valsal = Valeriana saliunca.
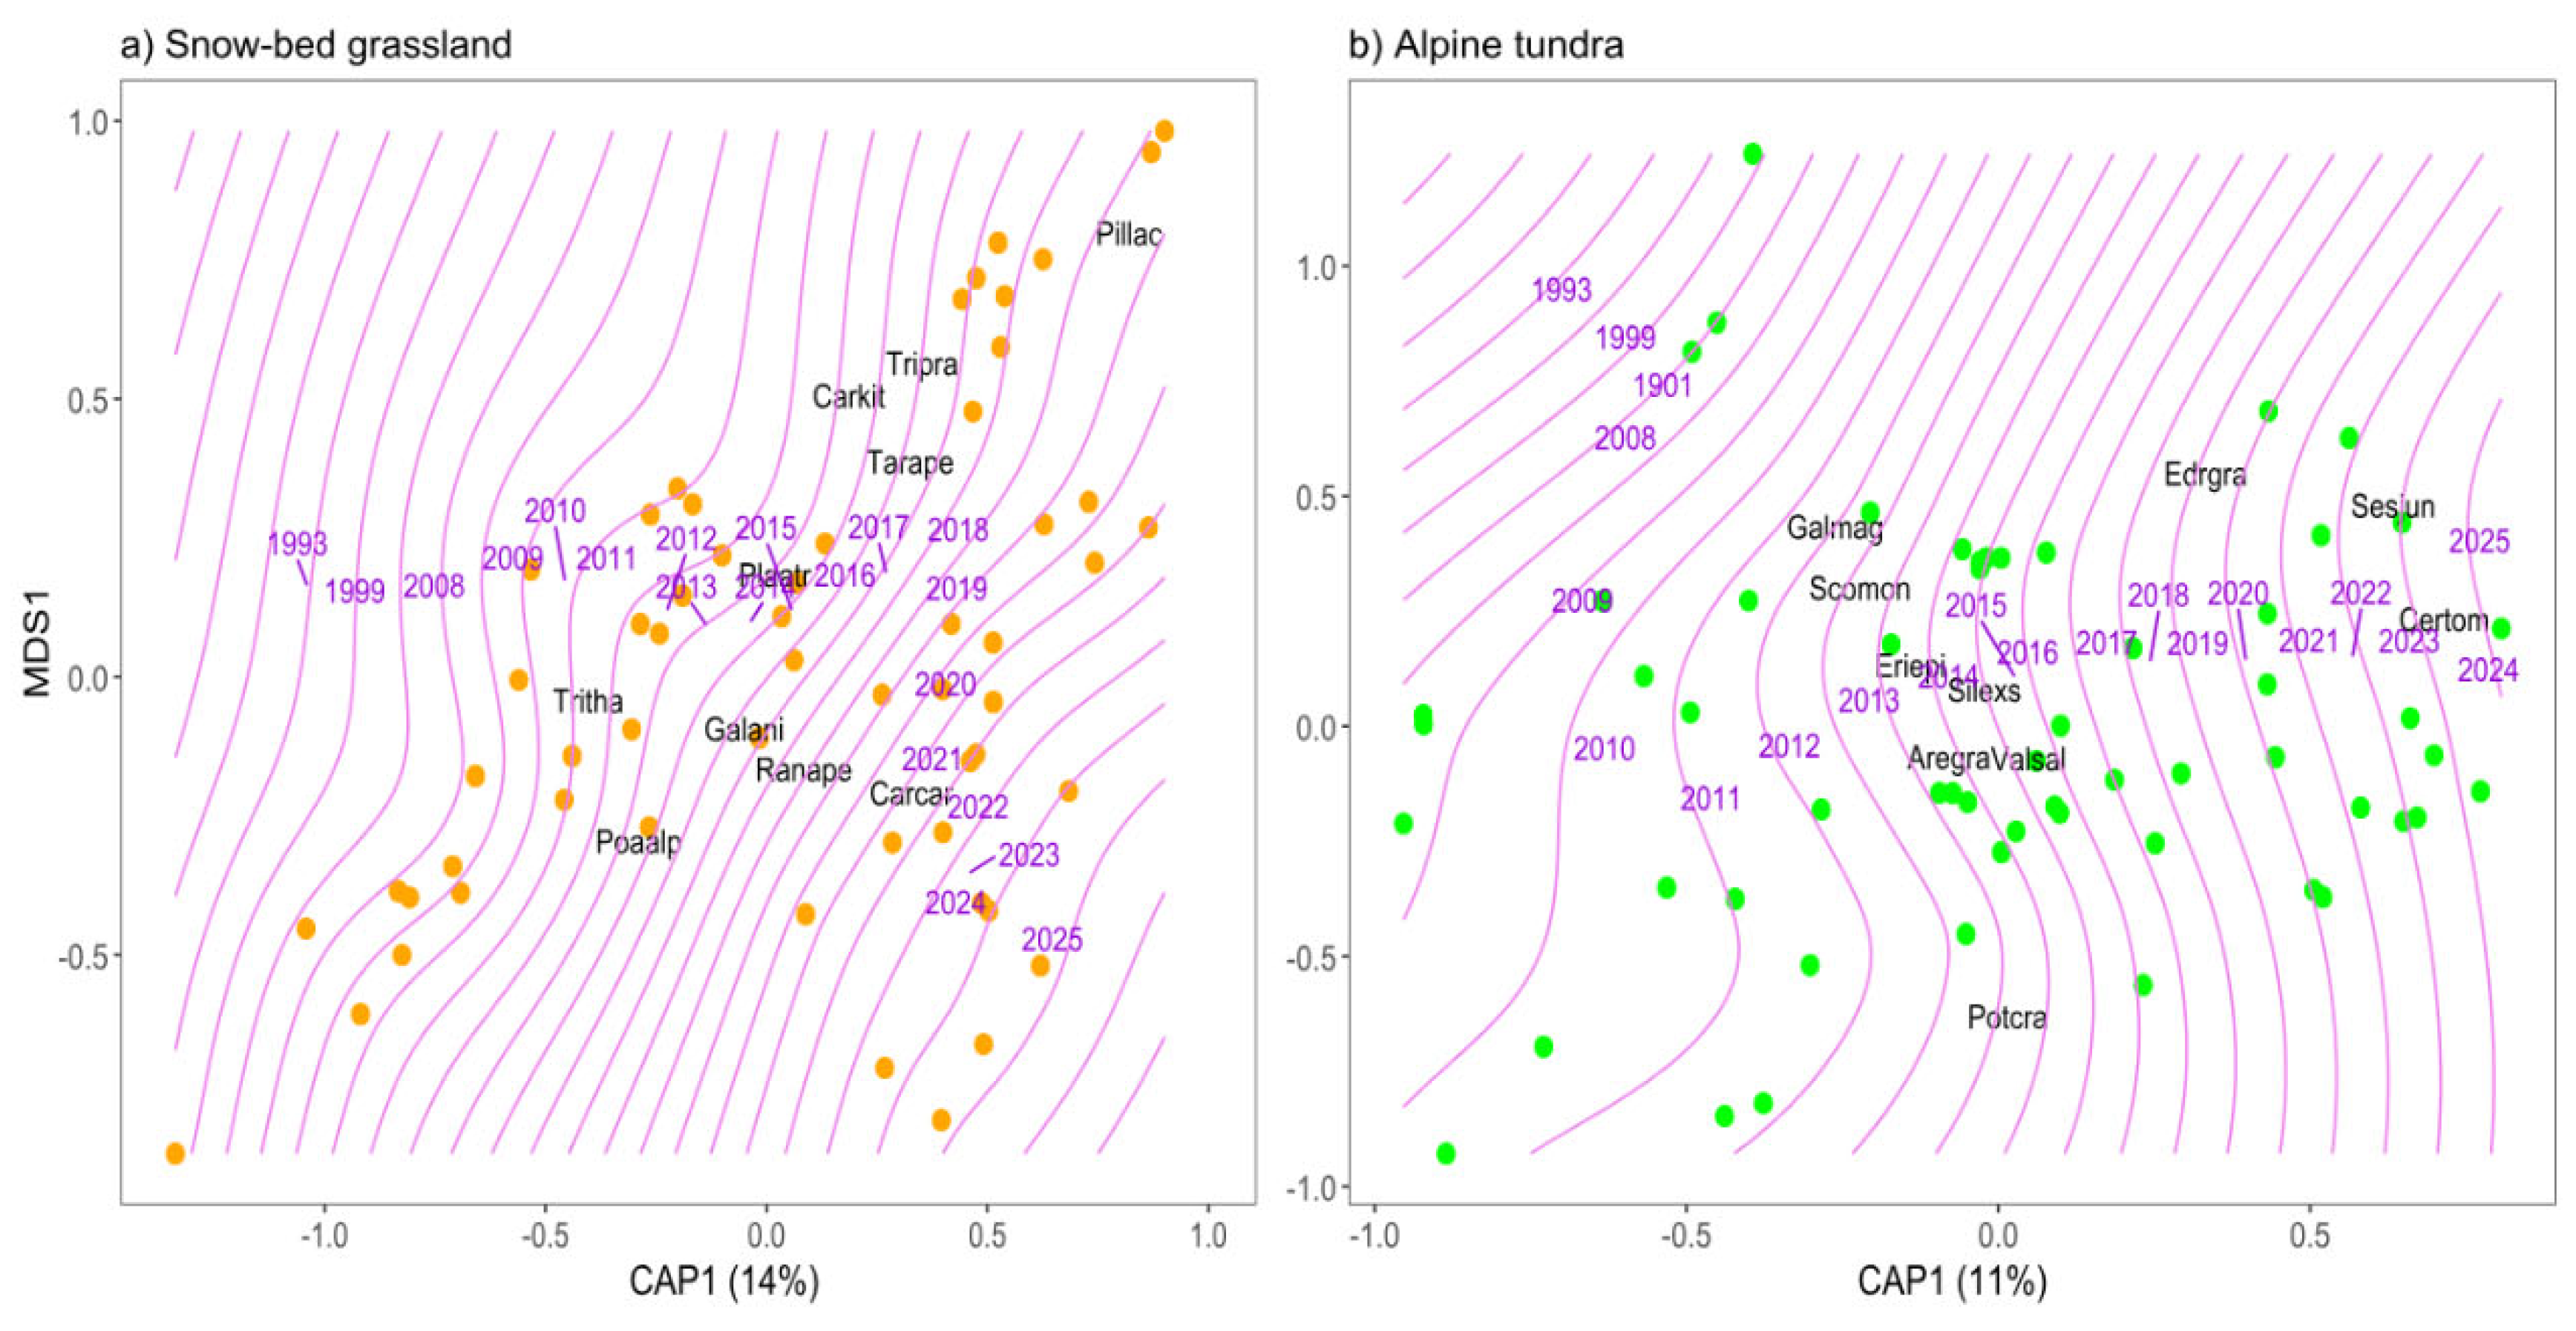

Table 1.
Main descriptors of snow-bed grassland and alpine tundra research stations.
| DESCRIPTORS | SNOW-BED GRASSLAND | ALPINE TUNDRA |
| Elevation (m a.s.l.) | 2125 | 2225 |
| Topography | flat wind-free zone | wind-swept ridge |
| Lithological features | Miocene marly limestones | Cretaceous stratified limestones |
| Soil pH | 5.5-6.0 | 7.9-8.2 |
| Total plant cover (%) | 100 | 10-20 |
| No. of plant species (average) | 24-35 (30) | 23-32 (26) |
| Dominant plant species | Festuca rubra subsp. commutata, Plantago atrata subsp. atrata |
Silene exscapa, Dryas octopetala |
| Life form dominance | Hemicryptophyte | Hemicryptophyte/Chamaephyte |
| Mean annual soil temperature (°C) | 6.0 | 4.7 |
| Absolute min/max soil temperature and range (°C) | -1.7/20.5 (22.2) | -8.6/18.3 (26.9) |
| No. of days per year with temperature below zero (average) | 0-130 (63) | 123-172 (144) |
| Trend in extreme temperature events in the Apennines 1962-2022 [10] | Strong increase, with critical points in 2011 and 2016 | |
Table 2.
Main observed trends at community level for snow-bed grassland and alpine tundra (*significant in predictive models).
Table 2.
Main observed trends at community level for snow-bed grassland and alpine tundra (*significant in predictive models).
| TRENDS | SNOW-BED GRASSLAND | ALPINE TUNDRA |
| Plant species turnover per year % | 30-35 (critical point in 2014-2015) | |
| Species richness | No trend | Decreasing* |
| Shannon diversity | No trend | Decreasing* |
| Graminoid hemicryptophyte species | Increasing* (critical point in 2010) |
Increasing* (critical point in 2011) |
| Chamaephyte species | Decreasing* (critical point in 2010) |
Increasing* |
| Competitive strategy species | Decreasing* (critical point in 2009) |
Decreasing* (critical point in 2013) |
| Ruderal strategy species | Increasing* | Decreasing* |
| Stress-tolerant strategies species | Decreasing* | Increasing* |
| Cover of species with deep roots (> 10 cm) | Increasing (critical point in 2016) |
Increasing (critical point in 2014) |
| Cover of species with shallow roots (< 10 cm) | Decreasing (critical point in 2016) |
No trend |
| Ecological indicator of continentality | Increasing (critical point in 2015) |
|
| Ecological indicator of heat | Increasing* | |
| Dynamical tendency in vegetation | Fluctuation (degeneration signs in 2009) |
Fluctuation (primary succession signs in 2014) |
Table 3.
Statistical trend analysis of species cover for all species in both plant communities, derived from generalized additive models (GAMs), fitted between each species cover and the dbRDA site scores. Temporal trends of species cover (increasing, ↑; decreasing, ↓) are modelled as smooth functions of the first two dbRDA axes (CAP1 and MDS1).
Table 3.
Statistical trend analysis of species cover for all species in both plant communities, derived from generalized additive models (GAMs), fitted between each species cover and the dbRDA site scores. Temporal trends of species cover (increasing, ↑; decreasing, ↓) are modelled as smooth functions of the first two dbRDA axes (CAP1 and MDS1).
| Species | Trend | Species | Trend | ||
| Snow-bed grassland | Alchemilla glaucescens | ↑ | Alpine tundra | Anthyllis montana ssp. atropurpurea | ↑ |
| Alchemilla alpigena | ↑ | Anthyllis vulneraria ssp. nana | ↑ | ||
| Anthemis cretica ssp. alpina | ↑ | Bromiopsis erecta | ↑ | ||
| Anthyllis vulneraria ssp. nana | ↑ | Cerastium tomentosum ssp. album | ↑ | ||
| Asperula neglecta | ↑ | Dryas octopetala | ↑ | ||
| Blitum bonus-henricus | ↑ | Edraianthus graminifolius ssp. graminifolius | ↑ | ||
| Botrychium lunaria | ↑ | Euphrasia salisburgensis | ↑ | ||
| Carduus carlinifolius | ↑ | Festuca alfrediana ssp. ferrariniana | ↑ | ||
| Carex caryophyllea ssp. caryophyllea | ↑ | Globularia meridionalis | ↑ | ||
| Carex kitaibeliana | ↑ | Helianthemum nummularium ssp. glabrum | ↑ | ||
| Carum heldreichii | ↑ | Helianthemum oelandicum ssp. incanum | ↑ | ||
| Cerastium hankeanum | ↑ | Isatis apennina | ↑ | ||
| Crocus neapolitanus | ↑ | Koeleria splendens | ↑ | ||
| Erysimum majellense | ↑ | Minuartia verna ssp. verna | ↑ | ||
| Euphrasia salisburgensis | ↑ | Potentilla crantzii | ↑ | ||
| Gnaphalium diminutum | ↑ | Saxifraga paniculata ssp. paniculata | ↑ | ||
| Helictochloa praetutiana ssp. praetutiana | ↑ | Sesleria juncifolia ssp. juncifolia | ↑ | ||
| Luzula spicata.ssp. bulgarica | ↑ | Thesium parnassi | ↑ | ||
| Nardus stricta | ↑ | Valeriana montana | ↑ | ||
| Pilosella lactucella ssp. nana | ↑ | Valeriana saliunca | ↑ | ||
| Pilosella officinarum | ↑ | Achillea mucronulata | ↓ | ||
| Potentilla rigoana | ↑ | Alchemilla alpigena | ↓ | ||
| Pulsatilla alpina ssp. millefoliata | ↑ | Arabis alpina ssp. caucasica | ↓ | ||
| Taraxacum apenninum | ↑ | Arenaria bertolonii | ↓ | ||
| Taraxacum officinale | ↑ | Arenaria grandiflora ssp. grandiflora | ↓ | ||
| Thymus praecox subsp. polytrichus | ↑ | Campanula scheuchzeri ssp. scheuchzeri | ↓ | ||
| Trifolium montanum ssp. rupestre | ↑ | Carex kitaibeliana | ↓ | ||
| Trifolium pratense ssp. semipurpureum | ↑ | Erigeron epiroticus | ↓ | ||
| Viola eugeniae ssp. eugeniae | ↑ | Galium magellense | ↓ | ||
| Astragalus depressus ssp. depressus | ↓ | Gentiana dinarica | ↓ | ||
| Campanula scheuchzeri ssp. scheuchzeri | ↓ | Helictochloa praetutiana subsp. praetutiana | ↓ | ||
| Coeloglossum viride | ↓ | Linum alpinum | ↓ | ||
| Festuca rubra ssp. commutata | ↓ | Matthiola italica | ↓ | ||
| Galium anisophyllon | ↓ | Poa alpina ssp. alpina | ↓ | ||
| Gentiana verna ssp. verna | ↓ | Potentilla apennina | ↓ | ||
| Gentianella columnae | ↓ | Pulsatilla alpina ssp. millefoliata | ↓ | ||
| Gymnadenia conopsea | ↓ | Ranunculus brevifolius | ↓ | ||
| Hippocrepis comosa ssp. comosa | ↓ | Robertia taraxacoides | ↓ | ||
| Hypericum richeri | ↓ | Saxifraga speciosa | ↓ | ||
| Minuartia verna ssp. verna | ↓ | Scorzoneroides montana ssp. breviscapa | ↓ | ||
| Phyteuma orbiculare | ↓ | Silene exscapa | ↓ | ||
| Plantago atrata ssp. atrata | ↓ | Thymus praecox ssp. polytrichus | ↓ | ||
| Poa alpina ssp. alpina | ↓ | ||||
| Potentilla crantzii | ↓ | ||||
| Ranunculus apenninus | ↓ | ||||
| Rhinanthus alectorolophus | ↓ | ||||
| Sagina glabra | ↓ | ||||
| Silene exscapa | ↓ | ||||
| Trifolium thalii | ↓ |
Disclaimer/Publisher’s Note: The statements, opinions and data contained in all publications are solely those of the individual author(s) and contributor(s) and not of MDPI and/or the editor(s). MDPI and/or the editor(s) disclaim responsibility for any injury to people or property resulting from any ideas, methods, instructions or products referred to in the content. |
© 2026 by the authors. Licensee MDPI, Basel, Switzerland. This article is an open access article distributed under the terms and conditions of the Creative Commons Attribution (CC BY) license (http://creativecommons.org/licenses/by/4.0/).
Copyright: This open access article is published under a Creative Commons CC BY 4.0 license, which permit the free download, distribution, and reuse, provided that the author and preprint are cited in any reuse.


