
Submitted:
07 July 2026
Posted:
08 July 2026
You are already at the latest version
Abstract
Industrial process safety systems are predominantly reactive: alarms activate after limits are crossed, faults are diagnosed after deviations develop, and HAZOP knowledge remains offline during operation. This paper proposes Predictive Operational Safety Engineering (POSE) as an emerging research paradigm in which operational safety is treated as a continuously forecastable state rather than a post-event classification, shifting the operational question from what has gone wrong? to how much safe operating time remains, and which intervention is most urgent? Four integrated predictive safety metrics anchor the framework: Remaining Safety Margin (RSM), quantifying the normalized distance between the predicted process trajectory and the nearest safety boundary; Remaining Safe Operating Time (RSOT), estimating when that boundary will be crossed under the current trajectory; the Operational Vulnerability Index (OVI), combining margin depletion rate, safeguard availability, and consequence severity into a single intervention-urgency signal; and Predictive Safety Confidence (PSC), the probability that a specific named operator intervention can be executed to completion before the predicted safety boundary is crossed, coupling prediction uncertainty with action execution time. The Predictive Operational Safety Twin (POST) is proposed as a three-layer reference architecture implementing POSE through predictive process intelligence, predictive safety intelligence, and human safety intelligence. The paper synthesizes six research streams, positions POSE against seven adjacent disciplines, states ten guiding principles, and formulates a research agenda. As a conceptual narrative review, the paper does not claim empirical validation of POSE. Instead, it establishes the foundational vocabulary, reference architecture, and research agenda required to advance predictive operational safety from an emerging concept toward benchmarked and industrially validated practice.
Keywords:
predictive operational safety
; digital twin
; process safety
; alarm management
; HAZOP
; operator decision support
; dynamic risk assessment
; process monitoring
; industrial artificial intelligence
1. Introduction
Industrial process plants are becoming increasingly complex due to higher production capacities, tighter operating constraints, advanced automation systems, plant-wide integration, and extensive sensor networks. Modern facilities continuously generate large volumes of operational data from distributed control systems (DCS), advanced process control (APC), safety instrumented systems (SIS), process historians, and industrial Internet of Things (IIoT) platforms [1,2]. These developments have significantly improved plant visibility and enabled the widespread adoption of data-driven analytics, process monitoring, artificial intelligence, and digital twins.
Despite these technological advances, the dominant philosophy of industrial process safety remains largely reactive. Most existing safety technologies are designed to detect abnormalities after they have already developed [3,4]. Alarm management systems notify operators when predefined thresholds are exceeded, fault detection and diagnosis algorithms identify abnormal operating conditions after measurable deviations occur, and HAZOP studies provide structured hazard knowledge during plant design, modification, or periodic review rather than during real-time operation. Digital twins increasingly predict process behavior, but many implementations remain focused on monitoring, optimization, predictive maintenance, or asset performance rather than forecasting future operational safety.
Alarm floods illustrate the practical consequence of this reactive paradigm. International standards such as ISA-18.2 and EEMUA 191 have substantially improved alarm rationalization, prioritization, and lifecycle management [5,6]. However, alarm management improves alarm quality after alarms occur; it does not provide a framework for estimating how much safe intervention time remains before safe operation is lost.
A similar limitation appears in fault detection and diagnosis. Statistical process monitoring methods such as PCA, PLS, CUSUM, EWMA, and related multivariate techniques have made major contributions to abnormal event detection and process monitoring [7,8,9,10]. More recent machine learning and deep learning methods have improved diagnostic accuracy across benchmark processes such as the Tennessee Eastman Process [11]. Yet the main outputs of fault diagnosis remain fault indicators, fault classes, diagnostic delays, and classification accuracy. These outputs are important, but they do not directly answer the broader safety question: how will the future safety state of the plant evolve if no intervention occurs?
In parallel, digital twin technology has emerged as one of the most transformative developments in Industry 4.0. A digital twin can synchronize with real-time plant measurements, estimate hidden states, predict future process trajectories, and support decision making [12,13,14,15]. In process industries, digital twins have been increasingly applied to monitoring, optimization, predictive maintenance, and safety risk management [16,17,18]. Nevertheless, comparatively little attention has been devoted to using digital twins as proactive safety reasoning systems capable of continuously forecasting the future operational safety state of an industrial process. Recent work has also examined how digital twin and artificial intelligence technologies may support the evolution of HAZOP from a periodic, document-centered activity toward a dynamic, lifecycle-oriented safety-management layer [19].
This observation reveals an important conceptual gap: the six disciplines reviewed have advanced largely independently, and none has adopted the future operational safety state as the primary object of continuous estimation [20]. Figure 1 illustrates this gap and the conceptual position of POSE relative to the six contributing research streams. Section 9 maps this gap in detail across all six research streams and identifies the specific scientific problems that remain unresolved.
This review argues that the next generation of industrial process safety should transition from reactive abnormal-event management toward predictive operational safety reasoning. Rather than merely identifying alarms or classifying faults after abnormalities become observable, future safety systems should continuously estimate the future safety condition of the operating process, forecast alarm evolution before alarm floods develop, quantify the remaining time available for safe operator intervention, and provide interpretable safety guidance that supports timely decision making.
To address this emerging need, this paper introduces Predictive Operational Safety Engineering (POSE) as a unifying research paradigm1 for future industrial process safety. POSE is defined as the discipline concerned with continuously estimating, interpreting, and forecasting the future operational safety state of industrial processes through the integration of process prediction, alarm intelligence, safety knowledge, operational vulnerability assessment, and human-centered decision support. Unlike existing reviews that independently summarize developments in alarm management, digital twins, or fault diagnosis, this review synthesizes these research streams to establish a coherent scientific foundation for predictive operational safety. POSE is not proposed as a replacement for existing safety systems, alarm management, FDD, digital twins, HAZOP, or operator decision support; rather, it provides an integrating predictive layer that connects these capabilities around future operational safety-state estimation.
Furthermore, a conceptual implementation referred to as the Predictive Operational Safety Twin (POST) is proposed as one possible realization of this paradigm. Rather than representing another digital twin architecture, POST illustrates how predictive process modeling, future alarm forecasting, operational vulnerability assessment, Remaining Safe Operating Time (RSOT), safety-aware alarm prioritization, and HAZOP-informed operator decision support can be integrated into a unified predictive safety framework.
The paper makes five conceptual contributions. First, it identifies a unifying gap in current process safety research: the absence of a framework that makes the future operational safety state the primary object of continuous estimation. Second, it introduces an integrated vocabulary for predictive safety reasoning, including Remaining Safety Margin (RSM), Remaining Safe Operating Time (RSOT), Operational Vulnerability Index (OVI), Predictive Safety Confidence (PSC), a probabilistic confidence measure associated with RSOT and RSM estimates rather than a competing safety index, Safety Horizon, and Operational Safety State. Third, it positions POSE relative to adjacent disciplines, including alarm management, fault detection and diagnosis, digital twins, HAZOP, dynamic risk assessment, prognostics, and model predictive control, distinguishing what each provides and what an integrated predictive safety paradigm is designed to deliver. Fourth, it proposes the Predictive Operational Safety Twin (POST) as a reference architecture illustrating how process prediction, safety-state estimation, vulnerability assessment, and human-centered safety reasoning may be integrated into a unified operational system. Fifth, it formulates a research agenda including benchmark systems, validation criteria, scientific challenges, and open questions required to mature POSE from a conceptual paradigm into an operational engineering discipline.
The remainder of this review is organized as follows. Section 2 reviews the transition from reactive safety toward predictive operational safety. Section 3, Section 4, Section 5, Section 6, Section 7 and Section 8 examine the current state of the art in alarm management, fault detection and diagnosis, digital twins, process safety knowledge, operator decision support, and prognostics. Section 9 synthesizes the major research gaps across these disciplines and positions the novelty of POSE relative to adjacent research areas. Section 10, Section 11 and Section 12 define POSE, formalize its core vocabulary, and present the Predictive Operational Safety Twin as a reference architecture. Section 13 states ten guiding principles. Section 14 presents the research agenda, validation criteria, and future challenges. Section 15 concludes the paper.
2. Evolution of Industrial Process Safety: From Reactive Protection to Predictive Operational Safety
2.1. Historical Development of Process Safety
Industrial process safety has evolved considerably over the past five decades [22]. Early safety systems relied primarily on mechanical protection devices such as relief valves, emergency shutdown systems, and operator intervention to prevent catastrophic failures. As distributed control systems became widely adopted during the 1980s and 1990s, continuous process monitoring enabled operators to observe large numbers of process variables in real time. This technological shift introduced computerized alarm systems that rapidly became one of the primary mechanisms for detecting abnormal operating conditions.
During the following decades, increasing process complexity exposed significant limitations in conventional alarm systems. Numerous industrial incidents demonstrated that excessive alarm rates, nuisance alarms, alarm floods, and poor alarm rationalization can reduce operator effectiveness during abnormal situations. Consequently, considerable international efforts were devoted to improving alarm system performance through standardized alarm philosophies, alarm lifecycle management, rationalization, prioritization, shelving, and alarm performance assessment [5,6].
At approximately the same time, advances in process monitoring introduced statistical process control, multivariate monitoring techniques, model-based residual analysis, and later machine learning approaches capable of identifying abnormal operating conditions from historical process data [7,8,9,10]. These methods substantially improved fault detection and diagnosis but remained primarily focused on recognizing abnormal conditions after deviations became measurable.
The emergence of Industry 4.0 subsequently brought digital twins, industrial AI, and continuous data infrastructure to process plants, further improving visibility and predictive capability [12,13,14,16]. Nevertheless, most implementations continue to emphasize monitoring and diagnosis of the current plant condition rather than forecasting its future operational safety.
2.2. Current Safety Paradigm
Although the technologies supporting industrial safety have evolved dramatically, the underlying temporal philosophy has changed much more slowly. Most current safety architectures follow a reactive sequence, as illustrated in Figure 2 (panels 1A and 1B); panels 2A and 2B of the same figure contrast this with the proactive philosophy of POSE, developed in Section 9.
Within this paradigm, alarms serve primarily as indicators that a process has already departed from its intended operating region. Fault diagnosis algorithms similarly identify abnormal conditions after sufficient evidence has accumulated within measured variables. HAZOP studies, while highly valuable, are typically performed offline during design or periodic safety reviews rather than continuously during plant operation. Consequently, many important safety decisions are made only after the abnormal situation has already developed [3,4].
2.3. Limitations of Reactive Safety
The reactive nature of current safety systems creates several important challenges. First, valuable intervention time may be lost while disturbances propagate through interconnected process units before any alarm or fault indicator activates.
Second, alarm floods substantially increase operator cognitive workload, making prioritization increasingly difficult despite improvements from alarm management standards [5,6].
Third, many existing monitoring methods treat alarms, fault diagnosis, digital twins, and safety assessment as independent research problems. The absence of a unified predictive framework limits their ability to estimate how future process evolution, future alarm behavior, and future safety degradation interact over time [20].
Finally, current systems rarely quantify the amount of safe operating time remaining before intervention becomes critical. Instead, operators must infer urgency from individual alarms, fault labels, or trend displays without explicit information regarding future safety evolution.
2.4. A Control-Theoretic Perspective on Safety Paradigms
The evolution of industrial safety mirrors a well-established progression in control theory: from feedback to feedforward to predictive control. Applied to operational safety, this analogy provides a precise characterization of what each generation of safety system can and cannot do, as elaborated in Section 9.
This analogy is not merely pedagogical. It clarifies the temporal logic underlying different safety paradigms. Feedback-style safety systems respond after an observable deviation, alarm, or error has appeared. Feedforward-style reasoning improves anticipation when a disturbance or precursor can be directly measured. Predictive operational safety extends this logic by using dynamic state estimation, forward prediction, and safety-boundary reasoning to estimate how the future safety state may evolve. In this sense, POSE is analogous in philosophy to model predictive control [23,24], but it is not itself a controller. Its purpose is to support earlier safety reasoning by forecasting safety-margin depletion, remaining safe operating time, and intervention urgency before hazardous conditions fully develop.
POSE does not replace regulatory control, advanced process control, safety instrumented systems, alarms, or operator judgment. It provides a predictive layer that estimates the future operational safety state and supports earlier human or supervisory intervention.
2.5. Toward Predictive Operational Safety
These observations suggest that industrial process safety is approaching another major transition. Rather than asking only What abnormal condition exists now?, future intelligent safety systems should answer What will the operational safety state of this process become in the near future if no intervention occurs?
This shift fundamentally changes the objective of process safety monitoring. Instead of reacting to observed abnormal events, predictive safety systems continuously estimate future process trajectories, anticipate alarm evolution, quantify remaining operational safety margins, and provide interpretable guidance before hazardous situations fully develop [13,14].
This motivates a shift from event-centered safety to state-centered safety. In event-centered safety, the focus is on discrete occurrences: an alarm activates, a fault is detected, a trip occurs, or an abnormal event is classified. In state-centered safety, operational safety is viewed as a continuously evolving dynamic condition influenced by process trajectories, control actions, equipment condition, disturbances, safeguards, and operator decisions.
Four recent technological developments make POSE feasible today in a way that was not achievable a decade ago. First, industrial digital twins have matured to the point where real-time process prediction at operational fidelity is achievable across chemical, refining, and energy applications [13,16]. Second, the widespread deployment of IIoT sensors, process historians, and edge computing has made high-frequency operational data continuously available for safety reasoning [1,2]. Third, machine learning and physics-informed models now support real-time trajectory prediction under uncertainty with sufficient speed for online safety estimation [25,26]. Fourth, systematic efforts to digitize HAZOP knowledge, safety barriers, and consequence models have created machine-interpretable safety knowledge bases that can be queried during online operation [27]. The convergence of these four capabilities removes the principal barriers that previously prevented the integration POSE proposes.
The following sections examine the existing literature that motivates this transition and identify the scientific gaps that remain unresolved.
3. Alarm Management and Alarm Flood Analytics
3.1. Evolution of Alarm Management
Alarm systems constitute one of the most important layers of protection in modern industrial process plants. Their primary objective is to notify operators whenever process variables deviate beyond predefined operating limits, allowing timely corrective action before abnormal situations escalate into hazardous events. Over the past three decades, alarm management has evolved from simple threshold-based annunciation toward a mature engineering discipline supported by international standards, systematic lifecycle management, and increasingly sophisticated analytical methods [5,6,28,29].
Early industrial alarm systems were frequently characterized by excessive alarm rates, duplicated alarms, nuisance alarms, chattering alarms, and poor prioritization. During major plant disturbances, operators were often presented with hundreds of alarms within only a few minutes, creating alarm floods that exceeded human cognitive capacity and substantially reduced situation awareness. Investigations of several major industrial incidents identified poor alarm management as a contributing factor, motivating the development of comprehensive alarm management standards such as ISA-18.2 and EEMUA 191 [5,6].
These standards introduced structured alarm lifecycle management, including alarm philosophy development, rationalization, detailed design, implementation, operation, maintenance, monitoring, and continuous improvement. Their adoption significantly improved alarm quality by encouraging the elimination of unnecessary alarms, consistent prioritization, systematic documentation, and continuous performance assessment.
As industrial automation continued to advance, alarm management research expanded beyond alarm rationalization toward increasingly sophisticated analytical techniques. Researchers developed methods for bad actor identification, alarm flood detection, alarm sequence mining, root-cause analysis, alarm correlation, causal reasoning, dynamic alarm suppression, and operator decision support. More recently, machine learning, probabilistic reasoning, graph-based methods, word embeddings, few-shot learning, and data-driven analytics have further enhanced the capability to extract information from large historical alarm databases [30,31,32,33,34,35].
Collectively, these developments have transformed alarm management into one of the most mature research areas within industrial automation.
3.2. Major Research Themes
The contemporary alarm management literature can be broadly classified into several complementary research directions.
3.2.1. Alarm Rationalization
Alarm rationalization focuses on determining whether an alarm is necessary, defining its purpose, assigning appropriate priorities, and establishing suitable alarm limits. Quantitative frameworks for optimal alarm design have demonstrated how statistical criteria and process knowledge can guide limit selection and priority assignment [36]. Dynamic risk analysis methods have further shown how alarm databases can be mined to reveal recurring abnormal patterns and support proactive safety management [37]. This area has significantly improved alarm system quality by reducing unnecessary operator notifications and improving alarm consistency.
3.2.2. Alarm Performance Assessment
A second major research stream evaluates alarm system performance using quantitative metrics such as alarm rates, standing alarms, chattering alarms, stale alarms, alarm floods, and operator workload indicators. Multivariate statistical methods have been applied to identify bad actors and correlate alarm generation with underlying process variability [38]. These metrics provide objective measures of alarm system effectiveness and support continuous performance improvement.
3.2.3. Alarm Sequence Analysis
3.2.4. Alarm Correlation and Root-Cause Analysis
Rather than considering alarms independently, correlation-based approaches attempt to identify causal relationships among alarms originating from the same process disturbance. Various statistical, graph-theoretic, Bayesian, and knowledge-based methods have been proposed to identify initiating events and distinguish root-cause alarms from consequential alarms [33,35].
3.2.5. Alarm Propagation Analysis
Industrial disturbances rarely affect a single process variable. Instead, abnormal conditions propagate through interconnected equipment, producing cascades of related alarms. Alarm propagation studies seek to reconstruct these propagation pathways in order to improve operator understanding of disturbance evolution [32].
3.2.6. Intelligent Alarm Management
Recent advances in artificial intelligence have introduced machine learning, deep learning, reinforcement learning, word embedding, few-shot learning, and knowledge graph techniques into alarm management. These approaches improve alarm classification, dynamic prioritization, adaptive alarm suppression, root-cause identification, and operator assistance under complex operating conditions [34,39].
3.3. Achievements of Alarm Management Research
Alarm management has produced substantial industrial benefits. Research over the past three decades has significantly reduced nuisance alarms, improved alarm prioritization, enhanced operator situation awareness, enabled systematic alarm lifecycle management, and provided increasingly sophisticated methods for alarm sequence interpretation and disturbance diagnosis. Modern alarm management systems are considerably more effective than the threshold-based annunciation systems originally deployed in early distributed control systems.
These achievements represent major advances in industrial process safety and have established alarm management as a mature discipline.
3.4. Remaining Scientific Challenges
Despite these advances, several important scientific challenges remain unresolved.
First, the majority of alarm management methods remain fundamentally reactive. Alarm analysis generally begins only after alarms have already been activated or after an alarm flood has emerged. Consequently, valuable intervention time may already have been lost before diagnostic algorithms become effective.
Second, many existing approaches analyze alarm logs independently from the future dynamic evolution of the physical process. While alarm propagation and root-cause methods improve interpretation of ongoing disturbances, they typically do not estimate how the process itself is expected to evolve in the near future.
Third, alarm management research rarely provides explicit estimates of future operational safety. Operators may receive information regarding alarm priority, alarm frequency, likely root causes, or predicted alarm sequences, but they are seldom informed how operational vulnerability is changing, how much safe operating time remains, or which safety margin is being depleted.
Finally, although alarm management increasingly incorporates machine learning and data-driven analytics, comparatively few studies explicitly integrate predictive process simulation, future alarm evolution, process topology, operational vulnerability, and structured process safety knowledge into a unified predictive framework.
3.5. Emerging Research Opportunity
The evolution of alarm management suggests that the discipline is approaching another important transition. Historically, alarm management has evolved from alarm annunciation to alarm rationalization, from alarm rationalization to alarm analytics, and from alarm analytics to intelligent operator support.
The Abnormal Situation Management (ASM) Consortium, formed in the 1990s by leading process industry companies, recognized that reducing the impact of abnormal situations requires moving beyond alarm annunciation toward proactive operator support [5,29]. Current alarm management standards and best practice guidelines reflect this vision [6]. Yet even the most advanced implementations of this tradition remain centered on how operators respond to alarms and abnormal events; they do not provide a quantified forecast of the future safety state before any alarm occurs.
The next logical step is no longer simply improving alarm interpretation after alarms occur. Instead, future alarm management systems should anticipate how alarm behavior, process dynamics, and operational safety will jointly evolve before critical situations fully develop. Even predictive alarm methods often focus on forecasting future alarm messages or identifying likely alarm sequences during an already developing flood [39]. This is valuable, but it remains alarm-centered rather than safety-state-centered. Thus, the limitation is not that alarm management lacks sophistication, but that its primary object remains the alarm event rather than the future operational safety state.
This observation motivates a broader scientific question: Can future operational safety be predicted before alarm floods emerge, enabling proactive rather than reactive operator intervention?
The following sections examine complementary research fields, namely fault diagnosis, digital twins, process safety knowledge, and operator decision support, to determine whether existing technologies collectively provide this capability or whether a new research paradigm is required.
4. Fault Detection and Diagnosis in Process Systems
4.1. Evolution of Fault Detection and Diagnosis
Fault Detection and Diagnosis (FDD) has become one of the most extensively studied research areas in chemical process systems engineering. Its primary objective is to identify abnormal process behavior, determine whether a fault has occurred, and, when possible, diagnose its underlying cause. The importance of FDD has increased with the growing complexity of modern process plants, where early identification of abnormal operating conditions is essential for maintaining product quality, reliability, environmental performance, and operational safety.
Early FDD methods were predominantly model-based, relying on first-principles models, analytical redundancy, residual generation, and consistency checks [10,40,41,42]. As industrial data became increasingly available, statistical process monitoring emerged as a powerful alternative, enabling abnormality detection without complete physical models [7,8,9]. More recently, machine learning and deep learning have substantially improved fault classification accuracy, particularly on benchmark processes such as the Tennessee Eastman Process [7,10,43]. The specific methods within each of these streams are reviewed in the following subsections.
Consequently, FDD has evolved into a mature discipline capable of identifying complex process faults using physics-based, statistical, and data-driven methodologies. This maturity makes FDD an essential foundation for POSE, but it also clarifies where conventional diagnostic reasoning ends.
4.2. Major Research Directions
The FDD literature can be broadly categorized into several complementary research themes.
4.2.1. Statistical Process Monitoring
Statistical monitoring techniques identify abnormal operating conditions by detecting deviations from normal process behavior using multivariate models. PCA, PLS, ICA, canonical variate analysis, and related techniques remain widely adopted because they offer computational efficiency, mathematical transparency, and practical interpretability [7,8,9,44,45]. These methods are especially valuable when large historical datasets are available but complete first-principles models are impractical.
4.2.2. Model-Based Fault Detection
Model-based approaches compare measured variables with predictions generated by mathematical process models or state observers. Significant discrepancies, commonly represented as residuals, indicate potential faults requiring diagnosis [10]. The strength of these methods lies in their ability to encode physical understanding, although their performance depends on model fidelity, disturbance representation, and robustness to uncertainty.
4.2.3. Machine Learning and Deep Learning
Artificial intelligence has significantly expanded FDD capabilities. Supervised learning methods classify predefined fault classes, whereas unsupervised and semi-supervised methods identify abnormal operating conditions that may not have been labeled in advance. Deep learning architectures have shown strong diagnostic performance for high-dimensional and nonlinear industrial datasets [8,26,44,46]. However, their success in benchmark classification does not automatically imply reliable prediction of future safety consequences.
4.2.4. Fault Isolation and Root-Cause Identification
Beyond fault detection, considerable research has focused on determining the origin of process disturbances. Graph-based reasoning, Bayesian networks, causal inference, process topology, and contribution analysis have been used to distinguish initiating faults from secondary process responses [35,43,47]. This distinction is important for operator support because the first detected abnormality is not always the initiating cause of the unsafe trajectory.
4.2.5. Explainable Fault Diagnosis
Growing interest in trustworthy artificial intelligence has motivated research into explainable FDD methods that provide interpretable diagnostic evidence rather than only fault classifications [48,49,50]. Explainability is especially important in safety-critical operations, where operators must understand why a diagnosis has been issued before acting on it. Nevertheless, explanation of a fault class is not equivalent to prediction of remaining safety margin or remaining safe operating time.
4.3. Achievements of Fault Diagnosis Research
The contributions of FDD research to industrial process engineering have been substantial. Modern diagnostic systems can detect abnormal operating conditions, classify multiple fault types, identify likely root causes, and support predictive maintenance strategies [40,44]. The integration of machine learning has improved diagnostic performance for nonlinear and high-dimensional industrial processes, while hybrid and physics-informed approaches have enhanced robustness under varying operating conditions.
These advances have strengthened industrial process monitoring and have become essential components of intelligent manufacturing systems.
4.4. Scientific Limitations
Despite these achievements, the objectives of conventional FDD remain fundamentally different from those required for predictive operational safety.
First, most FDD methods are designed to determine whether a fault has already occurred. Their primary output is a fault indicator, fault probability, or fault class rather than an estimate of future operational safety. Second, diagnostic algorithms often treat fault identification as the endpoint of the analysis. Once a fault has been detected and classified, less attention is devoted to predicting how the disturbance will evolve, how alarm behavior will develop, or how rapidly safety margins may deteriorate if corrective action is delayed.
Third, many benchmark studies evaluate algorithms primarily using classification accuracy, fault detection rate, false alarm rate, or diagnostic delay. These metrics are appropriate for assessing diagnostic performance, but they provide limited information regarding remaining operational safety, intervention urgency, operator workload, alarm flood likelihood, or future loss of safety margin. Finally, although recent explainable AI methods improve diagnostic transparency, they rarely integrate process safety knowledge such as HAZOP deviations, safeguard effectiveness, operating envelopes, and vulnerability metrics into a unified predictive reasoning framework.
Therefore, the conceptual gap is not simply a lack of detection accuracy. It is the absence of a safety-state-centered layer that converts diagnostic evidence into predictions of operational vulnerability, remaining safety margin, and remaining safe operating time.
4.5. From Fault Diagnosis to Predictive Operational Safety
The distinction between fault diagnosis and predictive operational safety extends beyond algorithmic implementation; it reflects two different scientific objectives. Fault diagnosis seeks to answer whether a fault has occurred, which fault is present, and where the disturbance originated. Predictive operational safety asks broader questions: how will the process evolve if no intervention occurs, how will alarms develop over time, how rapidly are safety margins decreasing, how much safe operating time remains, and which intervention should be prioritized before the process reaches a hazardous operating condition?
These questions extend conventional FDD from event recognition toward continuous prediction of future operational safety. Predictive operational safety does not replace fault diagnosis; rather, fault diagnosis becomes an upstream intelligence layer within it. Fault indicators, residuals, contribution plots, or fault-class probabilities become inputs to a safety-state estimator that evaluates how the diagnosed abnormality affects future safety margins, alarm evolution, safeguard demand, and intervention urgency.
4.6. Research Opportunity
The evolution of FDD demonstrates that industrial process monitoring has progressed from simple fault detection toward increasingly intelligent diagnostic reasoning. Nevertheless, a significant gap remains between identifying abnormalities and predicting their future safety consequences.
Bridging this gap requires methodologies capable of integrating process dynamics, alarm evolution, operational vulnerability, safety knowledge, and operator decision support into a unified predictive framework.
5. Digital Twins for Industrial Process Monitoring and Safety
5.1. Emergence of Digital Twins
Digital Twin (DT) technology has become one of the defining technologies of Industry 4.0. Originally developed within aerospace and manufacturing contexts, the concept has rapidly expanded into industrial process systems, where virtual representations of physical assets are continuously synchronized with operational data. Modern digital twins combine process models, sensor measurements, historical data, and computational intelligence to provide continuously updated representations of physical processes [12,13,14,51,52,53].
Unlike conventional simulation models, digital twins operate throughout the lifecycle of industrial assets. They assimilate operational measurements, estimate hidden process states, support optimization, and provide predictive capabilities that improve operational efficiency and reliability. The deployment of industrial Internet of Things (IIoT), cloud computing, edge computing, advanced sensing, and artificial intelligence has further accelerated digital twin development across chemical plants, refineries, power systems, carbon capture facilities, hydrogen production plants, and advanced manufacturing environments [16,54,55].
As a result, digital twins are increasingly regarded as enabling technologies for next-generation intelligent process industries.
5.2. Current Applications of Digital Twins
The contemporary digital twin literature can generally be classified into several application domains. In process monitoring, digital twins estimate process variables, reconcile measurements, detect sensor abnormalities, and improve visibility of plant operation through synchronization with physical assets. In process optimization, they support energy management, production scheduling, and efficiency improvement by evaluating alternative operating strategies before implementation. In predictive maintenance, digital twins combine degradation models with operational measurements to estimate equipment condition, predict failures, and optimize maintenance scheduling [13,14].
Digital twins also support model-based fault detection by comparing predicted process behavior with measured plant responses. Hybrid digital twins that combine first-principles models with machine learning can improve robustness under varying operating conditions. Dynamic twins are additionally used for operator training, abnormal situation management, and emergency response exercises, allowing operators to experience complex disturbances without risking physical equipment [16,52].
5.3. Digital Twins and Process Safety
Recent research has begun exploring digital twins for process safety. Proposed applications include hazard visualization, abnormal situation monitoring, emergency response planning, consequence analysis, safety performance assessment, and integration with safety management systems [17,18,56,57]. Several studies have connected digital twins with HAZOP analyses, risk assessment methods, leak detection, cyber-physical security, and resilience analysis. These developments demonstrate that digital twins have significant potential to enhance industrial safety. A closely related concept is the Digital Risk Twin, which embeds probabilistic hazard models within a digital twin to produce time-dependent risk metrics [58]; POSE extends this direction by defining a formal metric vocabulary (RSM, RSOT, OVI, PSC) and a three-layer reference architecture (POST) oriented specifically toward operator intervention support.
However, most safety-oriented digital twin applications still emphasize representation, visualization, scenario analysis, or current-state monitoring rather than explicitly forecasting the future operational safety state of the plant.
5.4. Current Limitations
Despite their capabilities, most existing digital twins remain centered on process representation rather than safety reasoning. First, digital twins predominantly estimate the current or near-future process state. Variables such as temperature, pressure, flow, composition, equipment condition, and product quality are monitored or predicted, but relatively few digital twins explicitly estimate how the overall operational safety condition of the plant will evolve [13,14].
Second, safety-related information is typically distributed across multiple independent systems. Alarm management systems monitor alarms, HAZOP studies provide structured safety knowledge, fault diagnosis algorithms classify abnormal conditions, and digital twins estimate process behavior. These systems often operate in parallel rather than as components of a unified predictive safety architecture [17,18].
Third, current digital twins generally provide process predictions without translating these predictions into quantities directly useful for operator safety decision making. Operators may receive forecasts of process variables, but not estimates of future alarm evolution, remaining intervention time, operational vulnerability, or anticipated safety degradation. Finally, although artificial intelligence has enhanced predictive capabilities, many implementations remain difficult to interpret from a process safety perspective because their predictions lack explicit connections to HAZOP deviations, safeguard performance, safety margins, or operational risk.
Thus, the limitation is not the absence of prediction in digital twins, but the absence of safety-state translation. A digital twin may forecast future temperatures, pressures, flows, or equipment conditions, but POSE requires these forecasts to be transformed into safety-relevant quantities such as boundary proximity, safety-margin depletion, remaining safe operating time, safeguard demand, and intervention priority.
5.5. From Process Twins to Safety Twins
The rapid evolution of digital twin technology raises an important question: should future digital twins predict only process behavior, or should they predict future operational safety?
Conventional digital twins primarily answer what is happening within the process, what variables are expected to change, and how plant performance will evolve. A safety-oriented digital twin should instead answer how operational safety will evolve, which barriers are approaching their limits, how alarm behavior will develop, how rapidly operational vulnerability is increasing, and how much intervention time remains before safe operation is lost.
These questions extend digital twins beyond process prediction toward continuous safety reasoning. Accordingly, this review proposes that future digital twins should be viewed not merely as virtual representations of industrial processes, but as Predictive Operational Safety Twins capable of estimating future safety states rather than only future process states.
5.6. Emerging Research Opportunity
The digital twin community has already established many computational foundations required for predictive operational safety, including dynamic process simulation, state estimation, hybrid modeling, machine learning, and real-time synchronization. The next major research challenge is not only the development of increasingly accurate digital twins, but the integration of these capabilities with alarm management, process safety knowledge, operational vulnerability assessment, and operator decision support.
This integration represents a missing scientific link between digital twin technology and industrial process safety.
6. Process Safety Knowledge: From Static HAZOP Studies to Dynamic Safety Reasoning
6.1. Evolution of Process Safety Analysis
Process safety has traditionally relied upon systematic engineering methodologies designed to identify hazards before industrial facilities enter operation. Among these methodologies, Hazard and Operability Studies (HAZOP) have become the most widely adopted qualitative hazard analysis technique within the chemical, petrochemical, pharmaceutical, and energy industries.
Since its introduction, HAZOP has provided engineers with a structured methodology for identifying process deviations, investigating their possible causes, evaluating potential consequences, assessing existing safeguards, and recommending additional protective measures where necessary. Its systematic guideword approach has made HAZOP an indispensable component of process design and regulatory compliance [4,59,60,61].
Today, virtually every major chemical processing facility performs HAZOP studies during design, plant modification, or Management of Change (MOC) activities.
6.2. Strengths of HAZOP
The remarkable success of HAZOP arises from several important characteristics.
First, it organizes process safety knowledge into a structured cause–consequence framework that remains understandable to engineers decades after its completion.
Second, HAZOP explicitly links process variables such as temperature, pressure, flow, composition, and level to engineering deviations that represent meaningful safety concerns.
Third, HAZOP captures expert knowledge that cannot easily be extracted from process measurements alone. Experienced operators and process engineers often identify abnormal scenarios that may occur only rarely during normal operation but nevertheless represent significant hazards.
Finally, HAZOP naturally supports interdisciplinary collaboration among process engineers, operators, instrumentation specialists, maintenance engineers, and safety professionals.
6.3. Complementary Risk Assessment: LOPA and Safety Barriers
Layers of Protection Analysis (LOPA) is a semi-quantitative risk assessment methodology that complements HAZOP by evaluating whether the safeguards identified during hazard studies collectively provide sufficient risk reduction [62]. While HAZOP identifies what could go wrong and what safeguards exist, LOPA estimates whether those safeguards reduce risk to an acceptable level.
LOPA quantifies residual risk by combining the frequency of each initiating event with the probability of failure on demand of each independent protection layer. These layers typically include the basic process control system, high-integrity alarms with operator response, safety instrumented systems [63], physical protection devices such as pressure relief valves and rupture disks, and emergency response procedures. When the residual risk estimate exceeds a tolerable criterion, LOPA identifies the requirement for additional safeguards, often specifying a Safety Instrumented Function with a defined Safety Integrity Level.
From a predictive operational safety perspective, LOPA provides information of direct operational relevance. The probability of failure on demand assigned to each protection layer implicitly defines how much risk reduction that safeguard provides under normal conditions. When a safeguard is unavailable during operation, due to bypass, preventive maintenance, failure, or testing, the residual risk for the affected scenario increases in a quantifiable way. A POSE framework that monitors safeguard availability in real time and propagates changes in safeguard status into the Operational Vulnerability Index would operationalize LOPA knowledge continuously, connecting the static risk assessment to the evolving operational safety state.
Safety barriers complement LOPA by providing a structured representation of the layers standing between an initiating event and its consequence. When predicted process trajectories indicate that a hazardous deviation is becoming more probable, a POSE-informed system can evaluate which barriers remain active, whether remaining protection is sufficient given predicted process evolution, and communicate this assessment to operators before the scenario fully develops.
6.4. Current Limitations
Despite its widespread industrial acceptance, HAZOP possesses important limitations that have become increasingly evident in the era of Industry 4.0. Critiques have noted that HAZOP studies may miss non-obvious failure combinations, depend heavily on team expertise and facilitator quality, and become outdated as plant configurations change [64,65,66]. Process safety management more broadly requires integrating hazard identification results with quantitative risk assessment, safeguard evaluation, and operational monitoring [4,65].
In most industrial implementations, HAZOP exists as engineering documentation covering deviations, causes, consequences, safeguards, and recommendations, and is rarely connected to continuously operating digital systems. Process measurements evolve continuously, alarm management systems generate alarms, and digital twins estimate process states, yet all three operate independently of the static HAZOP knowledge. This separation limits operators’ ability to understand not only what is happening but what the observed process evolution means from a safety perspective.
6.5. Existing Attempts to Integrate Safety Knowledge
Recent years have witnessed increasing interest in combining traditional process safety methodologies with digital technologies.
Several researchers have investigated digital HAZOP frameworks, ontology-based safety models, knowledge graphs, expert systems, and semantic reasoning approaches [27,67,68]. Other studies have explored automated HAZOP generation, AI-assisted hazard identification, and integration of HAZOP with digital twins or cyber-physical systems. A recent critical review further organized this direction into four complementary pathways, namely AI-assisted HAZOP, digital twin-based monitoring, hybrid physics–data modeling, and explainable AI, while emphasizing that these technologies should augment expert-led HAZOP rather than replace human judgment [19]. Dynamic risk assessment similarly attempts to update risk profiles using operational data, accident precursors, event trees, and Bayesian updating [37,69,70,71,72].
These efforts are important because they demonstrate that process safety knowledge need not remain entirely static, and they represent important advances toward intelligent safety management.
However, most existing approaches continue to employ HAZOP primarily as a static knowledge base rather than as an active reasoning mechanism capable of interpreting continuously evolving process trajectories. In most published studies, HAZOP knowledge remains disconnected from dynamic prediction of future operational safety. Thus, the unresolved challenge is not whether safety knowledge can be digitized, but whether digitized safety knowledge can be connected continuously to predicted process trajectories, alarm evolution, safeguard status, and time-to-boundary estimates in a form that supports operational intervention.
6.6. Dynamic Safety Reasoning
The emergence of predictive digital twins creates an opportunity to fundamentally rethink the role of HAZOP.
Rather than functioning solely as a design-stage hazard identification methodology, HAZOP knowledge can become an active reasoning layer within intelligent operational safety systems. Under this perspective, predicted process trajectories are continuously interpreted through engineering safety knowledge.
For example, a predicted increase in reactor temperature is no longer viewed simply as an increasing process variable. Instead, it immediately activates a structured engineering reasoning chain, as illustrated in Figure 3.
The digital twin therefore predicts not only future process behavior but also future engineering interpretation. This transformation converts HAZOP from a static engineering document into a continuously operating knowledge engine.
6.7. Toward Predictive Safety Knowledge
Future industrial safety systems should not merely display predicted temperatures, pressures, or alarm sequences. Instead, they should continuously answer engineering questions such as:
- Which HAZOP deviation is becoming increasingly likely?
- Which safeguards are expected to become critical?
- Which consequences are becoming more probable?
- Which operator intervention provides the greatest reduction in future operational risk?
These questions extend digital process prediction toward continuous safety reasoning. Importantly, this does not replace conventional HAZOP studies. Instead, it continuously operationalizes their engineering knowledge during plant operation [69].
6.8. Research Opportunity
The integration of dynamic digital twins with structured process safety knowledge represents one of the least explored intersections within industrial process engineering.
Current literature has developed sophisticated process prediction models, advanced alarm management systems, and comprehensive HAZOP methodologies. Nevertheless, these components remain largely independent.
A major research opportunity therefore exists in developing methodologies capable of transforming static process safety knowledge into dynamic operational reasoning. Such methodologies would allow predicted process evolution, predicted alarm behavior, and established engineering safety knowledge to operate within a unified framework that continuously estimates the future operational safety state of industrial processes.
This capability represents one of the fundamental building blocks required for the emergence of Predictive Operational Safety Engineering.
7. Operator Decision Support and Human Safety Intelligence
7.1. Evolution of Operator Decision Support
Industrial safety ultimately depends on effective human decision making. Even highly automated plants rely on operators to interpret abnormal situations, prioritize actions, and coordinate responses. During alarm floods or rapidly evolving disturbances, cognitive workload increases sharply and situation awareness may deteriorate. Intelligent decision support systems therefore play an essential role in translating complex process data into actionable information.
The theoretical basis for operator decision support draws on several foundational frameworks. Rasmussen’s skills–rules–knowledge model identified three qualitatively different modes of human performance in process control and influenced the design of interface support systems for abnormal events [73,74,75]. Situation awareness research subsequently demonstrated that many industrial accidents arise not from insufficient data but from incomplete or incorrect understanding of how observed process conditions relate to an unfolding safety scenario [76]. Situation awareness comprises three levels: perception of process states, comprehension of their safety significance, and projection of future states. This framework has become widely adopted in the design of control room interfaces and abnormal situation management programs [76,77].
7.2. Major Research Directions
7.2.1. Situation Awareness and Cognitive Workload
Research on situation awareness and cognitive workload has produced frameworks for evaluating human performance under abnormal operating conditions. These studies consistently demonstrate that alarm floods and information overload degrade operator decision-making quality, particularly during early stages of disturbance development when intervention would be most effective [6,78].
7.2.2. Human–Machine Interface Design
Human-machine interface research has investigated graphical displays, alarm visualization, trend presentation, and ecological interface design [77]. Ecological interface design principles propose that process displays should represent the underlying physical and functional constraints of the process rather than raw measurement values, enabling operators to perceive abnormal situations through perceptual structure rather than analytical reasoning alone.
7.2.3. Explainable Artificial Intelligence for Operators
As AI-based monitoring has matured, explainability has emerged as a critical requirement for safety-critical operator interfaces. Fault classifiers and anomaly detectors that provide classification labels without explaining their reasoning are insufficiently transparent for high-stakes operational decisions. Trust calibration research has demonstrated that operators tend to over-rely on automated systems that are confident but opaque, and under-rely on systems they do not understand [48,49]. Research in operator decision support has addressed alarm visualization, root-cause guidance, cognitive workload, explainable AI, human-machine interfaces, and abnormal situation management. However, many AI-based systems still output classifications, confidence scores, or visual dashboards rather than intervention-centered safety reasoning. Operators may be informed that a fault is likely or that a future alarm sequence is expected, yet still lack the safety interpretation required to decide which action matters most.
7.3. Achievements of Decision Support Research
Operator decision support research has substantially improved the design of control room environments, alarm displays, and operator training programs. Alarm visualization methods, interface design guidelines, situation awareness evaluation tools, and cognitive workload assessment techniques have collectively improved the human-machine interface in modern process control rooms [73,76,77]. Explainable AI methods are increasingly enabling operators to understand AI-generated alerts rather than treating them as opaque outputs.
7.4. Scientific Limitations
Despite these advances, several important limitations remain relevant to predictive operational safety. First, most operator support systems are designed to help operators respond to abnormal events that have already been detected. Research has focused primarily on improving information quality during developing disturbances rather than providing proactive safety forecasts before alarm limits are violated. Second, situation awareness frameworks are rarely integrated with quantitative process predictions; operators may have excellent data visualization without receiving structured estimates of future safety state, remaining intervention time, or anticipated alarm evolution [76]. Third, current explainability methods are primarily post-hoc: they explain what an AI system decided rather than what will happen next and why that trajectory is safety-relevant [48].
7.5. Research Opportunity
This body of evidence motivates Human Safety Intelligence as a required pillar of POSE. Predictive safety systems that are accurate but uninterpretable are unlikely to improve operator decisions under abnormal conditions. Operators need to understand not only that a future alarm flood is predicted, but why it matters, how much time remains, which consequence is credible, which safeguard is involved, and which action to consider first. Human-centered design is consequently a foundational requirement of POSE, not an optional enhancement.
8. Prognostics, Remaining Useful Life, and the Safety Horizon Concept
8.1. Emergence of Prognostics and Health Management
Prognostics and Health Management (PHM) has emerged as a mature engineering discipline concerned with estimating the current health state of physical assets and forecasting their remaining operational life. Unlike fault detection and diagnosis, which identifies whether and what type of abnormality has occurred, prognostics aims to predict when degradation will lead to failure and how much useful life remains before that point.
The primary prognostic output is the Remaining Useful Life (RUL), defined as the time remaining from the present moment until an asset can no longer perform its intended function at an acceptable level. PHM was originally developed within aerospace and defense contexts, where component reliability directly determines mission safety. The discipline has since expanded to rotating machinery, bearings, gearboxes, batteries, structural components, and increasingly to process plant equipment. Foundational reviews have established the methodological basis for condition-based maintenance and prognostics, demonstrating that data-driven, model-based, and hybrid approaches each contribute to RUL estimation depending on available information and operating context [79,80,81,82,83].
8.2. Methods for Remaining Useful Life Estimation
8.2.1. Model-Based Prognostics
Model-based prognostics use physics-based degradation models to describe how component condition evolves over time under operational loading. By fitting degradation models to observed condition indicators and extrapolating the fitted trajectory forward, the time until a predefined failure threshold is crossed can be estimated. The principal strength of model-based prognostics is interpretability and the ability to generalize to operating conditions not previously observed in data [79,81].
8.2.2. Data-Driven Prognostics
Data-driven prognostics learn degradation patterns from historical condition monitoring data without requiring explicit physics models. Methods include recurrent neural networks, long short-term memory networks, Gaussian process regression, support vector regression, convolutional neural networks, and transformer-based architectures trained on run-to-failure datasets. These approaches have demonstrated strong RUL prediction accuracy on benchmark datasets across multiple industrial domains [80,82,84,85].
8.2.3. Hybrid Prognostics
Hybrid prognostics combine physics knowledge with data-driven learning to improve both accuracy and interpretability. Physics-informed models constrain learned representations to respect known degradation dynamics, reducing overfitting and improving extrapolation beyond training data. Hybrid approaches increasingly represent the state of the art in industrial prognostics, particularly for processes where degradation mechanisms are partially understood [82,83].
8.3. From Equipment Remaining Useful Life to Process Remaining Safe Operating Time
Prognostics research has produced powerful methods for estimating when individual assets will fail. However, the prognostic paradigm is fundamentally equipment-centered: it estimates the health of a physical component relative to its own degradation trajectory and individual failure threshold.
Process operational safety introduces a fundamentally different and broader problem. The safety of an operating process depends not only on the condition of individual equipment items but on the dynamic state of the entire process system, including temperatures, pressures, compositions, flow rates, inventories, alarm states, control responses, and operator readiness, and on how this collective state is evolving relative to safety boundaries.
A reactor approaching thermal runaway, a distillation column approaching hydraulic flooding, or a pressurized vessel approaching its relief valve set pressure represents a process-level safety threat that cannot be fully characterized by monitoring the RUL of any single equipment component. The process as a whole has a remaining safety margin and a remaining time before the collective operating state becomes hazardous.
This distinction motivates a conceptual extension from equipment-centered Remaining Useful Life to process-centered Remaining Safe Operating Time (RSOT). While RUL asks how long before this component fails?, RSOT asks how long before this process reaches an unsafe operating state? RSOT depends not only on equipment condition but on evolving process trajectories, developing disturbances, control system responses, safeguard availability, and HAZOP-derived safety knowledge. This extension is central to the POSE paradigm and represents the key conceptual bridge between equipment-level prognostics and process-level operational safety. Thus, RSOT should not be interpreted as a direct re-labeling of RUL. It is a process-level safety-time metric that depends on the predicted evolution of the operating state relative to safety boundaries, rather than on the degradation trajectory of a single asset. Figure 4 illustrates this conceptual contrast.
8.4. Safe Operating Envelope and Safety Horizon
The safe operating envelope defines the region of process state space within which operation is considered safe and controllable. Its boundaries may include high and low alarm limits, equipment design limits, reaction hazard thresholds, environmental release limits, regulatory operating constraints, and human response-time constraints. Operation within the safe operating envelope ensures that available safeguards remain effective and that operators retain sufficient time and ability to intervene before hazardous conditions develop.
A Safety Horizon can then be defined as the future time interval over which the operational safety state can be predicted with acceptable confidence. As predictive uncertainty grows, due to model error, measurement noise, or unobserved disturbances, the Safety Horizon shortens. A process with high predictive uncertainty near its safety boundaries has a short Safety Horizon and demands conservative early intervention. Conversely, a process operating far from boundaries with low predictive uncertainty has a long Safety Horizon and permits more deliberate operator response. The Safety Horizon is therefore not a fixed property of the process but a dynamic quantity that depends on the current operating condition and the quality of available predictive models. This concept also motivates Predictive Safety Confidence, because a predicted RSOT value is only operationally meaningful when the confidence in the underlying trajectory forecast is sufficient for decision support.
8.5. Achievements and Limitations of Prognostics for Process Safety
The prognostics community has produced substantial contributions directly relevant to POSE. Time-to-failure estimation methodologies, uncertainty quantification frameworks for RUL prediction, condition monitoring approaches, early warning indicator design, and degradation model identification all provide transferable concepts for process safety horizon estimation [79,80,82].
However, direct application of PHM methods to operational process safety faces important limitations. First, RUL methods are calibrated to specific degradation modes of specific assets and do not naturally generalize to the multi-variable, multi-unit dynamic phenomena that characterize process safety disturbances. Second, most prognostics methods do not incorporate process safety knowledge such as HAZOP deviations, safeguard availability, consequence severity, or alarm limit structures. Third, the definition of failure in PHM is typically a clearly defined component threshold, whereas the boundary between safe and unsafe process operation is often a complex, multi-dimensional condition that depends on operating mode, production load, and the simultaneous state of multiple interacting variables.
8.6. Research Opportunity
The transition from Remaining Useful Life to Remaining Safe Operating Time represents a conceptual expansion that opens significant research opportunities. RSOT estimation requires integrating trajectory prediction from process digital twins, safety boundary knowledge from HAZOP and LOPA, uncertainty quantification from probabilistic methods, and human decision support from operator interface design. This integration cannot be achieved by extending single-asset PHM methods alone. These gaps motivate the need for an integrated predictive operational safety paradigm, and establishing that paradigm is one of the central motivations for Predictive Operational Safety Engineering.
9. Toward Predictive Operational Safety Engineering: Synthesis of the Literature
9.1. Review Design and Scope
This paper is a narrative conceptual review. It does not follow a pre-registered systematic or scoping review protocol, and it does not apply formal study selection criteria, PRISMA flow screening, or quantitative risk-of-bias appraisal. The literature surveyed was purposively assembled to represent foundational contributions, widely cited frameworks, and recent methodological developments across six research domains, namely alarm management, fault detection and diagnosis, digital twins, HAZOP and LOPA, operator decision support, and prognostics, that collectively motivate the predictive operational safety objective. Selection emphasized peer-reviewed journal articles, recognized standards, and established reference texts; no bibliometric or meta-analytic pooling was performed.
Synthesis is organized by thematic convergence across domains rather than by pooled quantitative estimates. Each domain is reviewed for its main achievements and its remaining gap relative to the unified predictive safety objective of POSE. The synthesis conclusions are interpretive and conceptual: they identify patterns in the literature and use them to motivate a new paradigm, not to establish empirical effect sizes. Readers should interpret the findings as evidence-informed proposals and research hypotheses. The operational effectiveness of POSE and POST on real industrial data remains to be established through future empirical work.
9.2. Fragmentation of Current Research
The preceding sections reviewed mature research domains that collectively define the current state of industrial process safety. Alarm management has evolved into a comprehensive discipline for alarm lifecycle management and operator support. FDD has achieved substantial success in identifying abnormal operating conditions through physics-based, statistical, and data-driven approaches. Digital twins have transformed process monitoring by enabling continuous synchronization between physical assets and virtual models. HAZOP and LOPA provide structured repositories of safety knowledge. Operator decision support has improved human interaction with increasingly complex industrial systems. Prognostics has established rigorous methods for estimating remaining life, providing the conceptual foundations for RSOT. Figure 5 summarizes how these six streams converge toward Predictive Operational Safety Engineering.
Individually, each discipline has achieved substantial scientific and industrial success. Collectively, however, they reveal a common observation: each discipline addresses only part of the operational safety problem.
The evidence reviewed identifies a systematic gap: the absence of an overarching framework capable of integrating these technologies into a coherent predictive safety architecture. The fragmentation is not a failure of individual disciplines but a structural consequence of their independent development. Table 1 summarizes the gap across each domain.
9.3. The Missing Scientific Link
The literature consistently demonstrates that industrial systems are becoming increasingly capable of answering questions regarding the current operating condition. Alarm management asks which alarms are active. Fault diagnosis asks which fault has occurred. Digital twins ask what the current or future process state may be. HAZOP asks what hazards exist under specific deviations. Operator decision support asks how information should be presented.
Although these questions are individually important, they do not directly answer the question that ultimately determines operational safety: what will be the future operational safety state of the plant if the current trajectory continues?
This question remains largely absent from the existing literature. It motivates a shift from reactive abnormal-event management toward predictive operational safety reasoning.
9.4. Positioning and Novelty of POSE
POSE does not replace alarm management, FDD, digital twins, HAZOP, dynamic risk assessment, operator support, or prognostics. Its novelty lies in redefining the primary object of operational safety intelligence as the future operational safety state and organizing existing capabilities around that object. Table 2 makes this concrete: for each established paradigm it shows what that discipline provides, where it stops, and what POSE adds.
The defining distinction is that POSE treats operational safety as a dynamic state variable that can be estimated and forecast. Existing methods may predict alarms, classify faults, simulate process variables, or update risk. POSE requires these outputs to be composed into a safety-state forecast: a structured statement about the future acceptability of operation, the margins being depleted, the time available for action, and the safety rationale for intervention.
This leads to three novelty claims that cannot be reduced to extensions of existing individual disciplines.
- Paradigm novelty: POSE proposes the formalization of operational safety as a trajectory estimation problem, a framing not adopted as the primary objective by any of the six disciplines reviewed. Existing disciplines produce alarms, fault labels, risk probabilities, or optimized control actions. POSE is designed to produce a forecast of the future safety state: a structured answer to how margins are depleting, when boundaries will be reached, and which action is most urgent, as the primary engineering output.
- Metric novelty: RSM, RSOT, and OVI constitute an integrated class of safety signal qualitatively distinct from existing outputs. RSM is multi-variable and trajectory-based rather than single-sensor and threshold-based. RSOT is a time-to-boundary estimate derived from a predicted process trajectory and HAZOP-informed safety boundaries, not a linear extrapolation to an alarm limit. OVI aggregates margin, rate, safeguard availability, and consequence severity into a single decision-support metric. Together they are proposed as the primary operands of predictive safety reasoning, complementing rather than replacing existing alarm and diagnostic outputs during the transition to POSE-based practice.
- Architecture novelty: POST is proposed as a reference architecture whose distinguishing design objective is to estimate the future operational safety state rather than the future process state. Unlike conventional digital twins (which forecast process variables), safety-constrained controllers (which enforce limits rather than inform humans), and dynamic risk assessment systems (which update risk probability scalars), POST is designed to produce a time-resolved, HAZOP-linked, uncertainty-aware safety-state trajectory communicated to an operator before any alarm is activated.
POSE as an engineering obligation, not a terminology restatement.
A legitimate concern is whether RSM, RSOT, OVI, and PSC are genuinely new constructs or merely existing concepts (safety margins, time-to-alarm estimates, risk indices, confidence intervals) restated under new labels. The answer lies in the implementation obligations each metric imposes, which are qualitatively different from those of their apparent analogues.
RSM is required to be continuously estimated from a predicted multi-variable process trajectory, normalized against HAZOP-informed safety boundaries, and updated in real time as the process evolves. These requirements demand a digital twin or predictive process model, a formalized safety boundary representation, and an online computation architecture. An existing safety margin defined at design time, such as a SIL-derived safe operating limit, an MPC constraint bound, or a process capability index, carries none of these obligations. It is a fixed scalar assigned offline; RSM is a dynamic state variable that must be estimated continuously.
RSOT is not a renamed time-to-alarm. A trend-based time-to-alarm extrapolates a linear trajectory in a single measured variable to a preset threshold, requiring no process model, no safety knowledge, and no uncertainty quantification. RSOT is the first-passage time of a predicted multi-variable process trajectory through a HAZOP-informed safety envelope, represented as a conditional probability distribution with calibrated predictive bounds. Its implementation requires a digital twin, an uncertainty propagation method, and a structured safety boundary definition, which is a substantively different engineering task from setting an alarm setpoint.
OVI is not a renamed Risk Priority Number. RPN is assigned offline to failure modes and remains constant between design reviews. OVI is continuously updated as process margins evolve, safeguard availability changes, and prediction uncertainty grows or shrinks during an unfolding situation. Implementing OVI requires real-time integration of outputs from the process model, the safeguard monitoring system, and the uncertainty propagation layer, infrastructure that a static risk index does not require.
PSC has no direct predecessor in the process safety literature. Confidence intervals in prognostics quantify uncertainty about component remaining useful life. PSC quantifies the probability that a specific, named operator intervention can be executed to completion before the predicted safety boundary crossing, coupling prediction uncertainty with an action execution model, a required completion time, and a HAZOP-derived boundary definition. The question of whether sufficient time remains to complete a specific named action is not answered by any existing process safety metric.
These four metrics do not rename existing outputs. They collectively define a set of engineering obligations, specifically process prediction, safety knowledge formalization, uncertainty quantification, safeguard state monitoring, and action-time modeling, that no existing discipline presently fulfills as a unified design objective. POSE is the discipline that names, integrates, and takes responsibility for those obligations. Table 3 places six commonly cited analogues side by side to make these distinctions concrete.
The ambition is not to claim that prediction, safety knowledge, or decision support are new individually. It is to establish the engineering discipline that integrates them around a single objective: making the future operational safety state visible, quantified, interpretable, and actionable before hazardous conditions develop.
Having established that the unresolved gap lies at the integration boundary of these disciplines rather than within any single one, the following sections define the POSE paradigm, formalize its core metrics, and present POST as a reference architecture for practical implementation.
Distinction from dynamic risk assessment.
Dynamic risk assessment (DRA) uses Bayesian networks, bow-tie models, or fault trees continuously updated from real-time operational evidence, including sensor readings, safeguard status, and near-miss reports, to estimate the conditional event probability [20,69,70,86,87,88]. Its primary output is a dimensionless probability scalar or a risk rank updated as evidence accumulates. POSE produces qualitatively different information: a safety-state trajectory represented as a vector evaluated from the predicted process path against HAZOP-defined safety boundaries. The distinction is both mathematical and operational. An operator confronting a DRA output of and a POSE output of receives categorically different engineering guidance. The first is a statistical likelihood appropriate for regulatory reporting and design review; the second is an assessment of the intervention window available before corrective action is no longer feasible. DRA asks how likely?; POSE asks how long? and which action first? These approaches are complementary: updated safeguard failure probabilities from DRA can inform the OVI computation within POSE. However, DRA alone does not produce margin depletion rates, RSOT estimates, or HAZOP-linked ranked intervention guidance; those constitute the layer POSE adds.
Distinction from safety-constrained model predictive control.
Advanced process control systems using model predictive control optimize operational objectives subject to safety limits treated as hard constraint bounds that must never be violated. MPC acts on the process: it computes and implements control moves to stay within bounds. POSE diagnoses the safety state and informs humans: it estimates how margins are evolving and advises operators on interventions before limits are approached. MPC is most effective within its normal operating envelope under routine disturbances; POSE addresses the abnormal event regime where MPC may be inactive, overridden, or operating near the boundary of its validity. The two systems are complementary: MPC provides constraint-aware optimal control, while POSE provides the safety-state intelligence that operators need when the process evolves outside normal patterns.
Distinction from digital twins and process simulation.
Conventional industrial digital twins are designed to achieve process fidelity: they replicate plant behavior by estimating and predicting state variables (temperature, pressure, composition, flow) and equipment conditions, and are validated by how accurately the simulated trajectory matches measured plant behavior [13,14,51,52]. POST adopts a fundamentally different design objective. It uses the predicted process trajectory as input to a safety-state estimator whose terminal output is not process variables but the future safety-state vector (RSM, RSOT, OVI, and PSC), derived by continuously evaluating the predicted path against the HAZOP-defined safety envelope. A digital twin that perfectly predicts reactor temperature provides no direct answer to whether that temperature trajectory is approaching a safety boundary, how rapidly the margin is depleting, or how much intervention time remains. POST is designed to answer precisely those questions. The two architectures share predictive modeling infrastructure but differ in their design objective and output: process fidelity (digital twin) versus safety-state trajectory (POST).
Distinction from early warning and incipient fault detection.
Early warning systems and incipient fault detection methods, including multivariate statistical process monitoring, abnormal situation management programs, and predictive alarm forecasting, aim to identify developing abnormalities before alarm limits are crossed [6,29,39]. These contributions are valuable and are incorporated within the POSE framework. However, early warning methods address the question is something going wrong before the alarm fires? POSE addresses the qualitatively different questions that follow: how much safety margin remains across all binding boundaries? (RSM), how long before the nearest safety boundary is crossed under the current trajectory? (RSOT), which intervention is most urgent given consequence severity, safeguard status, and prediction uncertainty? (OVI), and is there sufficient confidence that the chosen intervention can be completed before the boundary is reached? (PSC). Early warning detection provides the signal that something is developing; POSE provides the time-resolved, HAZOP-informed safety reasoning and ranked operator guidance that must follow to make that signal actionable. In this sense, POSE begins where early warning ends. Table 4 summarizes this distinction.
9.5. An Engineering Analogy: From Feedback Control to Predictive Operational Safety
Note: The following analogy is intended to provide engineering intuition and should not be interpreted as a strict equivalence between control algorithms and safety management systems.
An intuitive way to understand the philosophy of Predictive Operational Safety Engineering is through its analogy with classical process control. Although process control and process safety address different engineering objectives, their underlying operational philosophies exhibit notable similarities.
Conventional industrial safety systems operate primarily in a reactive manner. An alarm is generated only after a process variable exceeds a predefined limit, a fault diagnosis algorithm identifies an abnormal condition after measurable deviations become evident, and operator intervention follows the occurrence of these events. This sequence closely resembles the operation of a classical feedback controller, where corrective action is initiated only after the controlled variable deviates from its desired value.
In contrast, feedforward control anticipates the effect of measurable disturbances before they significantly influence the controlled variable. Rather than waiting for an error to develop, the feedforward controller predicts the future process response and applies corrective action proactively.
Predictive Operational Safety Engineering adopts an analogous philosophy at the safety-management level. Instead of waiting for alarms, fault classifications, or safety limit violations, POSE continuously predicts the future operational safety state by integrating process dynamics, alarm evolution, operational vulnerability, and engineering safety knowledge. The objective is to provide sufficient time for informed operator intervention before hazardous operating conditions fully develop. Figure 2 (panels 2A and 2B) illustrates this parallel.
It is important to emphasize that this analogy is conceptual rather than algorithmic. POSE is not a feedforward controller, nor is it intended to replace existing control or protection systems. Instead, it represents a higher-level predictive safety decision framework that complements conventional feedback-based regulatory control and safety instrumented systems. While regulatory control maintains process variables within operating limits, and SIS protects against defined failure scenarios, POSE monitors the predicted evolution of the operational safety state and supports earlier, safety-oriented operator decision making across the full range of developing abnormal situations.
This analogy highlights the fundamental paradigm shift proposed in this paper: from reacting to observed safety deviations toward anticipating future safety degradation and enabling proactive intervention. The following sections formalize this paradigm by proposing a taxonomy, an integrated set of operational safety metrics, and a reference architecture for practical implementation.
10. Definition and Taxonomy of Predictive Operational Safety Engineering
Predictive Operational Safety Engineering (POSE) is defined as the engineering discipline that treats operational safety as a continuously forecastable dynamic state and makes future safety-state estimation the primary objective of industrial process monitoring. In this context, the operational safety state refers to the evolving condition of the process relative to safety boundaries, safeguard availability, credible consequences, operator response time, and prediction uncertainty. The central claim of POSE is that the future operational safety state, like temperature, pressure, or composition, can be estimated and forecast with useful confidence over a finite safety horizon. A safety system that waits for a limit to be crossed before acting has already forfeited part of the intervention time that prediction could have provided.
POSE is premised on the availability of digital twins, process models, safety knowledge, and human-centered reasoning sufficient to estimate RSM, RSOT, and OVI continuously, and to convert those estimates into timely operator guidance before safety boundaries are approached.
Table 5 contrasts current practice with the POSE paradigm across six operational dimensions.
The paradigm shift described in Table 5 is realized through three foundational pillars, each addressing a distinct layer of the predictive safety objective.
10.1. Predictive Process Intelligence
This pillar includes digital twins, hybrid models, process simulators, first-principles models, state estimation, and AI methods that forecast future process behavior. Its input is the evolving plant state, including process measurements, controller outputs, equipment condition, disturbance information, and operating context. Its output is not yet a safety judgment; it is a set of plausible future process trajectories with uncertainty [13,52].
10.2. Predictive Safety Intelligence
This pillar converts process forecasts into safety-state indicators. Key concepts include Operational Safety State, Operational Vulnerability, Remaining Safety Margin, Remaining Safe Operating Time, Safety Horizon, Alarm Flood Horizon, and safety-weighted alarm prioritization. Its role is to map future process trajectories onto safety boundaries, alarm limits, safeguard activation thresholds, and consequence regions.
10.3. Human Safety Intelligence
This pillar translates predictive safety information into interpretable, actionable decision support using HAZOP, process topology, safeguard knowledge, explainable AI, and operator-centered interfaces. Its output should be suitable for operational action: what is likely to happen, why it matters, how urgent it is, which safeguard or barrier is relevant, and which intervention should be considered first [48,76]. Figure 6 shows how the three pillars interact within the POSE framework.
Table 6 provides a functional breakdown of each pillar, mapping representative inputs, core functions, and outputs.
The operational metrics that underpin Predictive Safety Intelligence are formalized in the following section.
11. Core Scientific Vocabulary
The equations in this section are intended as generic formalizations rather than universal fixed implementations. Practical applications may define boundary functions, normalization constants, confidence thresholds, and vulnerability weights according to process-specific hazards, safeguards, operating modes, and safe operating envelopes.
11.1. Operational Safety State
The Operational Safety State is the dynamic condition of an operating process describing its ability to remain within acceptable safety boundaries under current and predicted future conditions. Let denote the estimated process state, the control or operator action, disturbances, and the set of safety boundaries. The operational safety state can be represented conceptually as
where represents safety knowledge such as HAZOP deviations, consequences, safeguards, and operating procedures. The function may be implemented using rules, hybrid models, probabilistic inference, machine learning, or combinations of these methods. In this paper, operational safety state is used as an umbrella term: it may be represented either quantitatively, by margins and times-to-boundary (RSM, RSOT), or categorically, by regimes such as normal, vulnerable, critical, and unsafe, as formalized in the following subsection.
11.2. Safety State Space
The Safety State Space represents possible safety regimes of the process, such as normal, vulnerable, critical, and unsafe. A minimal state partition may be written as
The boundaries between these regimes are not only alarm limits. They may include safe operating limits, equipment design limits, safeguard activation thresholds, environmental release thresholds, quality-related safety constraints, and human response-time constraints.
11.3. Remaining Safety Margin
Remaining Safety Margin is a generalized measure of the distance between the current or predicted process trajectory and the nearest defined safety boundary. Let denote the index set of safety-relevant boundaries in . For a predicted trajectory , a boundary function , and prediction horizon , the margin to boundary can be represented as
where denotes remaining safe margin and denotes predicted boundary violation. The overall Remaining Safety Margin can be defined as the minimum normalized margin over relevant boundaries:
where j ranges over , and is the reference margin for boundary j, measured at the selected nominal reference condition. This normalization expresses remaining margin as a fraction of the margin available at that reference condition, so that corresponds to the selected nominal reference condition and indicates a predicted boundary violation.
11.4. Remaining Safe Operating Time
Remaining Safe Operating Time is the time-based projection of Remaining Safety Margin. Let denote the stochastic future process trajectory at lead time , conditional on the information available at time t. Its random safety-margin trajectory is
The first-passage time to the governing safety boundary set, equivalently the first time at which this minimum normalized margin reaches zero, is
with . In a finite-horizon implementation, failure to observe a crossing means that is right-censored beyond the prediction horizon, not that the process is safe indefinitely. For a deterministic nominal trajectory , the point estimate is
Uncertainty is represented by the conditional distribution of the first-passage time,
where is the p-quantile of predicted boundary-crossing time for . A conservative one-sided lower bound with predictive coverage , , is therefore
subject to the usual quantile convention and equality for a continuous predictive distribution. Thus a 90 % lower predictive bound uses the 10th percentile , whereas the 90th percentile answers the different question of when 90 % of predicted crossings have occurred. Reporting the median, a central predictive interval, and the conservative lower bound avoids the ambiguity of attaching a single “confidence level” to RSOT.
RSOT is conceptually distinct from the time-to-alarm concept sometimes computed in DCS trend analysis. Time-to-alarm typically extrapolates a linear trend in a single measured variable to a predefined alarm limit, and does so independently of prediction uncertainty, safeguard availability, and safety consequence severity. RSOT, as defined here, differs in four respects. First, it is multi-variable: it is derived from the minimum normalized margin across all boundaries indexed by , not from a single sensor trend. Second, it is trajectory-based: it depends on predicted future process evolution produced by a digital twin or process model, not on a linear extrapolation. Third, it is uncertainty-aware: it is represented by a conditional first-passage-time distribution and associated predictive bounds. Fourth, it is HAZOP-informed: the boundary set reflects engineering safety knowledge including safeguard activation thresholds, equipment design limits, consequence severity, and HAZOP deviation mappings, not only the alarm setpoint of the measured variable. These properties constitute a substantive methodological advance beyond univariate DCS trend extrapolation.
The central practical value of RSOT is the intervention window it reveals: the time between when a boundary crossing becomes predictable and when it actually occurs. Figure 7 illustrates this window, showing how RSM, RSOT, and OVI relate to the process safety state trajectory and the safety boundary.
11.5. Safety Horizon
Computational tractability of RSOT. The first-passage-time distribution is generally not available in closed form for nonlinear multi-variable processes. Three families of approximation are compatible with real-time industrial deployment. First, ensemble trajectory methods propagate a set of N model trajectories (e.g., –1000 particles or Monte Carlo draws) forward in time and estimate empirically from the fraction of trajectories that cross by each horizon q; for moderate-dimensional systems, this may be computationally feasible at industrial process-control timescales [25,26]. Second, linearization-based bounds propagate first- and second-order uncertainty through the process model to obtain Gaussian or ellipsoidal approximations to the safety-margin distribution, from which conservative RSOT bounds can be derived analytically. Third, data-driven surrogate models, including recurrent neural networks, Gaussian processes, and physics-informed neural networks, can be trained offline and evaluated online at millisecond timescales, making them suitable for high-frequency safety monitoring [25]. The appropriate approximation depends on the process dimensionality, model fidelity, and required update frequency; selecting and validating a tractable RSOT estimator for a given industrial application is itself a research challenge addressed in the research agenda (Section 14).
Safety Horizon is the future interval over which the safety-state forecast remains sufficiently reliable for operational use. It concerns forecast validity, not whether a predicted state belongs to the state space. Let
denote confidence that the future state lies within a safety-relevant tolerance of the predicted state, using a process-specific weighted norm . For prediction horizon , the Safety Horizon is
where is the minimum acceptable forecast-confidence level and the weighting matrix W scales heterogeneous process variables into a dimensionally consistent norm. If the admissible set is empty, is defined as zero. This definition prevents an isolated later increase in confidence from extending the horizon across an intervening interval of unreliable prediction. Alternative implementations may replace the state-error event in Equation (10) with a calibrated safety-regime classification criterion, but they must evaluate predictive validity rather than the tautological event .
11.6. Predictive Safety Confidence
Predictive Safety Confidence (PSC) is the conditional probability that sufficient time remains to complete a specified intervention before the first safety-boundary crossing. If is the time required to diagnose, authorize, and complete feasible action a, including an engineering buffer, then
PS indicates complete predictive confidence, under the adopted model and uncertainty assumptions, that action a can be completed in time; PS indicates that timely completion is predicted to be impossible. Values between zero and one quantify the available intervention-time confidence. PSC is action-dependent: a rapid automated action and a slower operator procedure can have different PSC values under the same predicted process trajectory.
PSC is not intended to replace OVI or to represent consequence severity. OVI captures the overall urgency of a developing scenario, whereas PSC measures confidence that a particular intervention remains feasible in time. A low PSC may occur well before any conventional alarm activates when the predicted intervention window is shorter than the required response time; conversely, alarm activation does not imply PSC is zero if effective action time remains. Facility-specific PSC decision thresholds must therefore be calibrated against prediction performance, intervention durations, and acceptable missed-warning and false-warning rates rather than assigned universally.
11.7. Operational Vulnerability
Operational Vulnerability describes the degree to which the process is approaching a condition where safety margins may be lost under predicted future evolution. It is not equivalent to risk probability alone; rather, it combines proximity to a safety boundary, rate of margin depletion, consequence severity, safeguard unavailability, and predictive uncertainty. The following bounded weighted model provides a computable reference implementation:
where , , and is a process-specific reference rate of normalized margin depletion. Because RSM is the minimum of boundary-specific margins, it may be nondifferentiable when the governing boundary changes; at such points, denotes a conservative one-sided derivative or an equivalent backward finite-difference estimate. The quantities , , and are normalized to : denotes maximum credible consequence severity, denotes full availability of credited safeguards, and denotes maximum admissible predictive uncertainty. The weights satisfy
so that , with larger values denoting greater intervention urgency. Weights and decision bands should be elicited from hazard analysis and then calibrated using scenario data; they are not universal constants. For multiple credible scenarios or active boundaries, Equation (13) should be evaluated separately for each scenario, with the maximum reported as the plant-level OVI together with the identity of the governing scenario. This preserves interpretability and prevents aggregation from hiding the binding safety boundary.
OVI should be distinguished from the Risk Priority Number (RPN) used in Failure Mode and Effects Analysis (FMEA) [66]. RPN is a static, failure-mode-centered index (the product of severity, occurrence, and detectability) assigned offline during design review to rank corrective actions across failure modes. OVI is a continuously updated, trajectory-based signal: its inputs (RSM depletion rate, predicted margin, safeguard availability, consequence severity, and predictive uncertainty) evolve at the timescale of the monitored process, not at the timescale of engineering review cycles. OVI therefore characterizes the time-varying urgency of intervention during a developing operational scenario, whereas RPN characterizes the relative design-time priority of failure modes for maintenance and engineering corrective action. OVI is accordingly not proposed as a universal risk score; it is a scenario-specific intervention-urgency signal whose weights, normalization conventions, and decision bands must be justified by plant-specific hazard analysis and calibrated against operational experience before use.
RSM, RSOT, OVI, and PSC together constitute the core quantitative vocabulary of POSE. Table 7 summarizes their definitions and intended interpretations. These metrics constitute the output specification for the POST reference architecture described in the following section.
12. A Reference Architecture for Predictive Operational Safety Engineering: The Predictive Operational Safety Twin
12.1. Introduction
The previous sections introduced POSE as an emerging research paradigm concerned with forecasting the future operational safety state of industrial processes. However, a scientific discipline requires practical implementations capable of translating conceptual principles into operational systems. To illustrate how POSE may be realized in practice, this section proposes the Predictive Operational Safety Twin (POST) as a reference architecture.
POST is presented as an example implementation rather than the only possible realization of POSE. Future researchers may develop alternative architectures based on different computational techniques, artificial intelligence models, industrial applications, or degrees of automation while remaining consistent with the fundamental principles of POSE. Accordingly, POST should be interpreted as a reference framework demonstrating how predictive process intelligence, predictive safety intelligence, and human safety intelligence can operate within a unified operational safety system.
12.2. Design Philosophy
Conventional industrial digital twins are primarily designed to estimate and predict process variables such as temperature, pressure, flow, composition, equipment condition, and production performance [13,52]. POST adopts a different objective. Rather than estimating only the future process state, POST continuously estimates the future operational safety state of the process.
Within POST, alarms, process variables, equipment conditions, safety boundaries, and safety knowledge are not treated as independent information sources. Instead, they collectively contribute to a continuously evolving representation of operational safety. The primary output of POST is therefore not a collection of predicted measurements but an engineering assessment of future operational safety.
POST should therefore be understood as a safety-reasoning architecture rather than a standalone automation system. Its purpose is not to replace DCS, APC, SIS, alarm systems, HAZOP, or operator authority, but to connect their outputs into a predictive safety-state estimate that can support earlier and better-informed intervention.
12.3. Reference Architecture
The proposed POST architecture consists of three interacting intelligence layers.
12.3.1. Layer I: Predictive Process Intelligence
The first layer represents the physical process using dynamic process models, hybrid digital twins, first-principles simulations, or artificial intelligence. Its objective is to continuously estimate future process trajectories under current operating conditions or candidate interventions. Representative outputs include predicted temperatures, pressures, flowrates, compositions, equipment states, inventories, and constraint distances.
12.3.2. Layer II: Predictive Safety Intelligence
The second layer transforms predicted process trajectories into quantitative measures describing future operational safety. Typical outputs include predicted alarm evolution, predicted alarm sequences, alarm flood horizon, Remaining Safe Operating Time (RSOT), Operational Vulnerability Index (OVI), Remaining Safety Margin (RSM), safety-aware alarm prioritization, and dynamic operational safety margins. Rather than simply reporting process deviations, this layer evaluates how future process evolution influences overall safety.
12.3.3. Layer III: Human Safety Intelligence
The third layer converts predictive safety information into engineering reasoning that supports human decision making. This layer integrates HAZOP knowledge, process topology, safeguard information, explainable artificial intelligence, operator guidance, and recommended intervention strategies [27,60]. Consequently, POST provides operators not only with predicted abnormalities but also with engineering interpretation and recommended operational responses.
The key architectural principle is that no single layer is sufficient: process prediction without safety interpretation is incomplete, safety metrics without human-readable explanation are unactionable, and decision support without an accurate underlying model is unreliable. Figure 8 shows how the three layers compose into a system whose output, operator guidance, emerges from the combination of all three, not from any one layer independently.
12.4. Operational Workflow
The operational workflow of POST consists of six sequential stages. First, real-time process measurements are acquired from industrial sensors, distributed control systems, process historians, laboratory systems, and advanced process control platforms. Second, the digital twin estimates future process trajectories over a predefined prediction horizon. Third, predicted trajectories are translated into expected alarm evolution, safety margin reduction, and operational vulnerability. Fourth, engineering knowledge, process topology, and HAZOP relationships interpret predicted abnormalities to identify probable causes, credible consequences, and safeguard involvement. Fifth, the framework prioritizes operator actions according to predicted safety evolution, intervention urgency, feasibility, and expected effectiveness. Sixth, following operator or controller intervention, plant measurements update the twin so that the predictive safety assessment evolves with the physical process.
12.5. Representative Safety Metrics
Predictive Operational Safety Engineering introduces safety-oriented performance indicators that differ from conventional process monitoring metrics because they describe future operational safety rather than current process conditions. Illustrative examples include RSOT, OVI, Alarm Flood Horizon, Predictive Alarm Sequence Confidence, Safety-aware Alarm Priority Index, Dynamic Safety Margin, Predicted Consequence Severity, and Expected Operator Intervention Window. The exact mathematical definitions of these quantities may vary by implementation and industrial application, but their common purpose is to make future safety degradation visible, interpretable, and actionable.
12.6. Relationship to Existing Technologies
POST integrates existing industrial technologies rather than replacing them: digital twins provide process prediction, alarm management provides alarm intelligence, fault diagnosis identifies abnormal conditions, HAZOP contributes structured safety knowledge, and operator support provides human-centered decision making. The key difference is that POST combines these capabilities into a continuously evolving estimate of the future operational safety state, an output that none of these disciplines produces individually. Table 8 maps each POST reference function to its purpose and illustrative output, showing how the six functions span from state estimation to decision support.
Regulatory compliance positioning. POST is conceived as a decision-support layer that operates above, and is consistent with, existing functional safety standards. IEC 61511 (Functional Safety: Safety Instrumented Systems for the Process Industry Sector) governs the design, installation, and operation of Safety Instrumented Systems (SIS) [63]; POST does not modify SIS logic or safety integrity levels. Instead, it provides early warning and operator guidance before SIS demand conditions are reached, thereby reducing the frequency of SIS demands, which is itself a recognized IEC 61511 objective. Similarly, ANSI/ISA-18.2 (Management of Alarm Systems for the Process Industries) [5] defines rationalization, prioritization, and performance metrics for alarm systems; POST is complementary to ISA-18.2 compliance in that RSM and RSOT estimates can inform alarm rationalization by quantifying the safety significance of individual alarm setpoints in terms of their proximity to safety boundaries. Future validation work should explicitly demonstrate that POSE implementations do not introduce unauthorized modifications to SIS logic, comply with Management of Change procedures, and satisfy the human factors requirements of ISA-18.2 for alarm presentation and operator workload.
12.7. Scientific Significance
The proposed architecture represents a conceptual transition in industrial safety. Traditional industrial systems estimate what is happening now. POST estimates what is likely to happen to operational safety in the near future if no intervention occurs. This distinction changes the objective of digital twins from process representation toward predictive safety reasoning. Consequently, POST should be viewed not simply as another digital twin architecture but as an operational realization of the broader POSE paradigm.
12.8. Illustrative Application Scenario
To illustrate the proposed POSE vocabulary without claiming empirical validation, the following hypothetical scenario considers a fixed-bed catalytic reactor in which temperature is monitored at multiple axial bed positions. A digital twin continuously estimates the peak bed temperature trajectory using an energy balance with online catalyst activity updating. At time , the twin predicts that the peak bed temperature will rise from 380 ∘C toward the high-high alarm limit of 430 ∘C over approximately 18 minutes if no intervention occurs.
Remaining Safety Margin. The reference margin is the gap between the nominal operating temperature of 350 ∘C and the alarm limit of 430 ∘C, giving ∘C. The currently predicted gap is ∘C, so . The process retains 62.5 % of its reference safety margin, but it is decreasing at an accelerating rate.
Remaining Safe Operating Time. The nominal trajectory gives min. Assume that uncertainty propagation across the digital-twin ensemble produces first-passage-time quantiles min, min, and min. The 90 % conservative lower predictive bound is therefore min: conditional on the model and uncertainty assumptions, the boundary-crossing time is predicted to be at least 14 minutes away with 90 % probability. The interval min is the central 80 % predictive interval; it should not be confused with the one-sided lower bound.
Operational Vulnerability Index. For illustration, let , , normalized consequence severity , safeguard availability , and predictive uncertainty . With , Equation (13) gives , , and . Under an illustrative advisory threshold of 0.50, POST identifies elevated intervention urgency. The threshold and weights would require process-specific calibration before operational use.
Predictive Safety Confidence. Suppose the selected cooling intervention requires min, including diagnosis, authorization, execution, and an engineering buffer. If the first-passage ensemble gives , then Equation (12) gives . POST therefore reports high confidence that this action can still be completed, while the declining RSM and OVI of 0.56 indicate that delaying intervention is undesirable.
HAZOP-informed reasoning. The POST safety reasoning layer retrieves the HAZOP entry for HIGH TEMPERATURE in the reactor. The deviation is More Temperature; the probable cause is catalyst activity increase or cooling circuit fault; the credible consequence is thermal runaway; the critical safeguard is the cooling water control valve. POST presents the operator with the recommended action: verify and increase cooling water flow, confirm control valve position, and monitor the rate of change of peak bed temperature.
Contrast with conventional alarm response. A conventional alarm management system activates the high-high alarm when the measured temperature reaches ∘C. In this simplified example, that setpoint is used as the selected operational boundary for demonstrating the metric calculations; an industrial implementation should distinguish advisory, alarm, trip, equipment-design, and hazardous-condition boundaries. POST forecasts the approach to the selected boundary before alarm activation and reports a 14-minute conservative lower intervention window, an OVI of 0.56, and action-specific PSC of 0.98. This operational difference, specifically reasoning about intervention feasibility before versus after alarm activation, is the central practical value of predictive operational safety reasoning. The numerical values throughout this scenario (RSM, RSOT quantiles, OVI, and PSC) are illustrative only; they are not derived from real plant data, validated process models, or experimental measurements, and should not be interpreted as engineering thresholds or performance results. The following section distills the scientific arguments of this review into ten guiding principles for Predictive Operational Safety Engineering.
13. Ten Principles of Predictive Operational Safety Engineering
Table 9 presents the ten principles that synthesize the core scientific arguments of this review. Each is grounded in the evidence examined in Section 3, Section 4, Section 5, Section 6, Section 7 and Section 8.
The research agenda required to validate these principles and mature POSE into an operational engineering discipline is presented in the following section.
14. Research Agenda for Predictive Operational Safety Engineering
14.1. Grand Research Challenge
Industrial process safety has reached an important transition point. Alarm management, FDD, digital twins, process safety analysis, and operator decision support have each matured into successful research disciplines, yet they have largely progressed independently. POSE provides a conceptual framework for integrating these disciplines into a unified predictive safety paradigm, but its development is only beginning.
The central scientific challenge can be summarized by a single question: how can industrial systems continuously estimate, interpret, and improve the future operational safety state of a process before hazardous operating conditions develop?
Unlike conventional questions that focus on fault detection, alarm reduction, or process optimization independently, this challenge places future operational safety at the center of intelligent industrial decision making [71]. Addressing it requires contributions from process systems engineering, artificial intelligence, process safety, human factors, automation, and control engineering.
14.2. Future Research Directions
14.2.1. Physics-Informed Predictive Safety Twins
Future POST implementations should combine first-principles process models with machine learning and data-driven digital twins. Physics-informed predictive safety twins may improve prediction accuracy, robustness under previously unseen operating conditions, and engineering interpretability [13,25,52,89].
14.2.2. Uncertainty-Aware Operational Safety
Future predictive safety systems should quantify uncertainty associated with predicted process trajectories, operational vulnerability, and remaining intervention time. Rather than producing deterministic predictions alone, they should communicate prediction confidence in a form that supports risk-informed operator decisions [80,82].
14.2.3. Human-Centered Predictive Safety
Operators remain central to industrial safety. Future research should investigate how predictive safety information can be presented without increasing cognitive workload. Key topics include adaptive human-machine interfaces, explainable artificial intelligence, workload estimation, trust calibration, operator learning, and adaptive decision support [48,49,73,75,76,78].
14.2.4. Dynamic Safety Knowledge
Current HAZOP studies are largely static. Future investigations should develop methods capable of continuously updating and operationalizing engineering safety knowledge using operational data, digital twins, and expert reasoning [27]. Dynamic HAZOP represents an important research opportunity for combining engineering knowledge with predictive operational intelligence.
14.2.5. Multi-Unit and Plant-Wide Safety Twins
Most existing digital twins focus on individual process units. Future research should investigate plant-wide predictive safety frameworks capable of evaluating interactions among reactors, separation systems, utilities, storage facilities, environmental protection systems, and shared safeguards. Plant-wide operational safety remains largely unexplored.
14.2.6. Cyber-Physical Operational Safety
The increasing integration of industrial communication networks introduces new interactions between cybersecurity and operational safety [1,90]. Future predictive safety systems should evaluate process disturbances, cyber attacks, sensor failures, communication failures, and control system degradation within a unified operational safety framework.
14.2.7. Edge Computing and Real-Time Deployment
Deploying POSE in industrial environments requires safety reasoning to operate at the time scales of the process being monitored. For fast processes or emergency response scenarios, RSOT and OVI estimates must be updated within seconds. Future research should investigate lightweight model architectures, edge-deployable digital twins, and online learning methods capable of sustaining predictive safety reasoning on industrial hardware with limited computational resources, including DCS-integrated edge nodes operating close to process equipment.
14.2.8. Autonomous Safety Intelligence
Current safety systems mainly support operator decisions. Future systems may actively recommend optimized intervention strategies, evaluate multiple response alternatives, and cooperate with advanced process control or safety instrumented systems. Such systems would represent an important step toward autonomous operational safety management while maintaining appropriate human oversight.
14.3. Validation and Evaluation Agenda
For POSE to mature from a conceptual paradigm into an engineering discipline, it must be evaluated with metrics that go beyond fault classification accuracy or alarm count reduction [91]. A POSE system should be assessed on whether it predicts safety degradation early enough, whether its predicted safety state is correct, whether its time-to-boundary estimates are calibrated, and whether its recommendations improve operator response.
Five evaluation dimensions are proposed.
- 1.
- Safety-state prediction accuracy: agreement between predicted and realized safety regimes over a defined horizon.
- 2.
- Intervention-time accuracy: error and calibration of RSOT estimates relative to actual or simulated boundary-crossing times.
- 3.
- Margin reliability: consistency between predicted RSM and observed approach to safety boundaries under disturbances and control actions.
- 4.
- Explanation fidelity: correctness of the link between predicted deviations, plausible causes, consequences, safeguards, and recommended interventions.
- 5.
- Human performance impact: improvement in operator prioritization, response time, workload, and abnormal-situation outcome compared with conventional alarm or FDD displays.
These criteria imply that benchmark development is a major research need. Existing process monitoring benchmarks often provide fault labels and process variables but do not provide explicit safety-state labels, dynamic HAZOP mappings, safeguard states, operator action windows, or ground-truth intervention-time metrics. Future benchmarks for POSE should therefore include process trajectories, alarm logs, safety boundaries, HAZOP-style consequence knowledge, safeguard availability, and scenario outcomes under alternative interventions.
14.4. Scientific Challenges and Open Questions
It is important to distinguish between the conceptual novelty of POSE and its empirical validation. POSE and POST are proposed frameworks. The metrics RSM, RSOT, OVI, and PSC have been formally defined here and their properties argued from synthesis of the literature, but their accuracy, calibration, and practical utility on real industrial systems have not yet been demonstrated. No field study, controlled experiment, or simulation benchmark has been used to evaluate the operational effectiveness of any POSE implementation. The contributions of this paper are conceptual and should be interpreted as a research paradigm and a set of hypotheses awaiting experimental confirmation, not as validated engineering tools ready for industrial deployment.
This situation is consistent with how foundational engineering paradigms have historically been established. Model predictive control was proposed as a conceptual framework by Richalet et al. [92] and subsequently validated and refined over more than a decade before becoming the dominant advanced control methodology in the process industries. The digital twin concept was introduced by Grieves [12] as a formal conceptual definition without empirical demonstration; it is now a major industrial and research discipline. HAZOP was formalized as a structured methodology and disseminated widely for years before systematic comparative studies were conducted. These precedents do not reduce the obligation to validate POSE experimentally; they confirm that establishing a conceptual framework, a formal vocabulary, and a coherent set of research hypotheses is a recognized scientific contribution that precedes, and is necessary for, organized empirical investigation. This paper fulfills the first of those two obligations; the validation agenda in Section 14 defines the second.
Maturing POSE from a conceptual framework into a validated engineering discipline requires resolving several interconnected scientific and technical challenges.
14.4.1. Data Availability and Benchmark Limitations
Validating POSE methods requires process datasets that include not only measured variables and fault labels but also alarm logs, safety boundary definitions, HAZOP-derived consequence knowledge, safeguard availability records, and ground-truth operator action timelines. Such datasets are rarely available in the open literature. Building POSE-specific benchmark datasets that include safety-annotated trajectories, dynamic HAZOP mappings, and outcome labels is itself a major research contribution.
14.4.2. Model Uncertainty and Prediction Reliability
Predictive safety systems must produce trustworthy forecasts under conditions that may deviate substantially from training data. Uncertainty accumulates over prediction horizons and may render RSOT estimates unreliable precisely when they are most needed. Methods for uncertainty quantification, conformal prediction, and reliable extrapolation beyond the training distribution are therefore essential for safety-critical applications.
14.4.3. False Warning and Missed Warning Tradeoffs
A predictive safety system that generates excessive false warnings will be discarded or overridden by operators. One that misses genuine safety events provides no protection. Managing the tradeoff between false alarm rate and missed warning rate in safety-critical applications requires consequence-weighted cost functions and operating characteristic analysis specific to process safety contexts, going beyond standard classification metrics.
14.4.4. HAZOP Quality and Knowledge Currency
POSE depends on access to accurate, comprehensive, and current HAZOP and LOPA knowledge [27,60]. In practice, documentation quality varies substantially across facilities and may not reflect plant modifications made under Management of Change procedures. Methods for detecting when HAZOP knowledge has become stale and for updating safety knowledge representations from process topology changes represent important engineering challenges.
14.4.5. Computational Speed and Real-Time Deployment
Safety reasoning algorithms must produce RSOT, OVI, and operator guidance within the time scales relevant to the monitored process. Physics-based models, uncertainty propagation methods, and HAZOP reasoning engines must each be optimized for real-time deployment on industrial computing hardware, including edge devices with constrained resources and latency constraints imposed by DCS communication architectures.
14.4.6. Operator Trust and Explainability
Operators will not act on safety predictions they do not understand or trust. Methods for explaining RSOT estimates, OVI trends, and recommended actions in terms of familiar process engineering concepts, such as HAZOP deviations, safeguard status, and variable trends, are necessary for operational acceptance. Calibrating operator trust to avoid both over-reliance and under-reliance on AI-generated warnings requires dedicated human factors research.
14.4.7. Integration with DCS, APC, and SIS
Deploying POSE in industrial facilities requires integration with distributed control systems, advanced process control platforms, safety instrumented systems, process historians, and maintenance management systems. Technical challenges include data latency, communication reliability, cybersecurity, vendor interoperability, and the validation requirements imposed by safety lifecycle standards for software used in safety-related applications.
14.4.8. Regulatory Acceptance and Safety Lifecycle Governance
Safety-critical AI systems in process industries must satisfy regulatory expectations for reliability, auditability, and explainability. Existing process safety management frameworks and safety instrumented system standards were not designed with predictive AI in mind. Developing guidance for the validation, certification, and ongoing governance of POSE systems within existing regulatory frameworks represents a significant challenge at the intersection of safety engineering and regulatory policy.
14.5. Potential Industrial Applications
Although this review focuses on general process systems, POSE is broadly applicable. Representative application areas include chemical manufacturing, petroleum refining, sulfuric acid production, carbon capture, hydrogen production, ammonia synthesis, polymer manufacturing, pharmaceutical production, LNG processing, offshore production, power generation, water treatment, food processing, and mining and mineral processing. This diversity demonstrates that POSE should be regarded as a general engineering discipline rather than a technology developed for a single benchmark process. The ongoing energy transition, encompassing hydrogen production, battery systems, and process electrification, introduces new process safety challenges that further motivate the development of predictive safety frameworks [93].
Table 10 lists candidate benchmark systems for POSE validation, characterizing each by process type, key safety challenge, and relevance to POSE evaluation criteria.
14.6. Grand Challenges
POSE introduces several grand challenges for future research:
- Mathematical representation of operational safety: developing state-space, graph-based, probabilistic, and hybrid representations that can express safety boundaries, barriers, consequences, and operating context.
- Reliable prediction of future safety states: forecasting not only process variables but safety regimes under uncertainty, nonlinear dynamics, and changing operating modes.
- Uncertainty-aware RSOT estimation: estimating intervention time with calibrated uncertainty and communicating it in a form that supports action.
- Dynamic HAZOP and online safety knowledge reasoning: converting static deviation-cause-consequence tables into machine-interpretable, online reasoning structures.
- Plant-wide predictive operational safety: scaling from unit-level monitoring to interconnected plant-wide propagation of disturbances and alarms.
- Human-AI collaborative safety decision making: designing interfaces that preserve operator authority while improving anticipation, prioritization, and explanation.
- Cyber-physical operational safety: accounting for cyber faults, sensor manipulation, controller compromise, and degraded data integrity in safety-state forecasts.
- Transferable safety models across process industries: adapting POSE methods across reactors, separation systems, utilities, pipelines, and batch processes without excessive re-engineering.
- Standard benchmarks and evaluation metrics: creating datasets that include safety boundaries, safeguard status, HAZOP knowledge, alarm logs, and outcome labels.
- Regulatory and industrial acceptance: demonstrating reliability, explainability, auditability, and lifecycle governance sufficient for safety-critical deployment.
14.7. Limitations of This Review
Four limitations of this paper should be stated explicitly. First, the literature review is a purposive narrative review, not a systematic or scoping review; source selection was guided by relevance to the six identified research streams and is not claimed to be exhaustive. Second, the proposed metrics RSM, RSOT, OVI, and PSC are formal definitions and mathematical frameworks, not validated performance indicators; their accuracy, calibration, and practical utility on real industrial systems have not yet been demonstrated. Third, POST is a reference architecture, not an implemented software system; no prototype, simulation, or pilot study has been conducted to evaluate its technical feasibility or operational effectiveness. Fourth, the illustrative reactor scenario in Section 12 is a hypothetical worked example whose numerical values are not derived from real plant data, validated models, or experimental measurements. These four limitations collectively define the boundary between what this paper claims, namely a conceptual paradigm and formal vocabulary, and what remains to be established through future experimental, computational, and industrial research.
14.8. Ethical and Societal Considerations
The deployment of predictive safety systems in industrial environments raises ethical and societal considerations that should be addressed as POSE matures from a conceptual paradigm toward operational practice. Three issues are particularly important.
Automation bias and skill degradation. Operators who routinely receive POSE-generated guidance may become progressively dependent on algorithmic safety reasoning, reducing their capacity to diagnose abnormal situations independently when the system is unavailable, miscalibrated, or operating outside its training distribution [48,75]. This “irony of automation” is well-documented in aviation, nuclear, and process control contexts. POSE systems should therefore be designed to support and develop operator competence, not substitute for it: guidance should be accompanied by transparent HAZOP-linked reasoning that reinforces the operator’s own mental model, and periodic scenarios without POSE support should be incorporated into operator training programs.
Liability and accountability. When a POSE system recommends an intervention that is subsequently judged to have been incorrect, or fails to recommend an intervention before a safety boundary is crossed, questions of liability and accountability arise. The legal and regulatory frameworks governing software-assisted safety decision support in process industries are still evolving. Until these frameworks are established, POSE should be positioned as advisory rather than directive, and its outputs should be clearly distinguished from the recommendations of a certified Safety Instrumented System [63]. Governance documentation should record the basis for each POSE recommendation, the uncertainty bounds communicated to the operator, and the operator’s final decision.
Workforce and organizational implications. Introducing POSE into an operating plant requires not only technical integration but organizational change: operator training, role redefinition, alarm rationalization, and Management of Change procedures under IEC 61511 and ISA-18.2 [5]. Early stakeholder engagement with operators, safety engineers, and regulators is essential to ensure that POSE is perceived as a tool that enhances operator authority rather than a system that erodes human judgment. These societal dimensions of POSE deployment are as important to its long-term success as its technical performance.
14.9. POSE Research Roadmap
Figure 9 illustrates a phased research roadmap for the POSE discipline across three sequential phases.
14.10. Toward the Next Generation of Industrial Safety
The history of industrial process safety demonstrates a continuous evolution from mechanical protection toward intelligent operational support. The next stage of this evolution is expected to emphasize continuous prediction of future operational safety rather than reactive interpretation of abnormal events. Whether implemented through digital twins, hybrid artificial intelligence, first-principles modeling, or future computational technologies, the central objective remains unchanged: to provide operators with sufficient predictive safety intelligence to intervene before hazardous operating conditions fully develop.
The following section distills the contributions of this review into a set of conclusions and identifies the conditions under which POSE can be expected to mature into a validated engineering discipline.
15. Conclusions
Industrial process safety is entering a new stage. Alarm management, fault diagnosis, digital twins, HAZOP, prognostics, and operator decision support have each produced major advances. What they have not yet produced, individually or as an integrated ensemble, is a discipline whose primary objective is to continuously estimate and forecast the future operational safety state of an operating process. POSE is proposed to fill that role.
The central contribution of this paper is conceptual: operational safety can be treated as a forecastable dynamic state. Remaining Safety Margin, Remaining Safe Operating Time, Operational Vulnerability Index, and Predictive Safety Confidence are not merely renamings of existing metrics. They constitute an integrated class of predictive safety signals (multi-variable, trajectory-based, HAZOP-informed, uncertainty-aware, and intervention-oriented) that existing disciplines have not yet produced as a unified primary output. The Predictive Operational Safety Twin demonstrates how these signals can be integrated into a reference architecture whose output is interpretable operator guidance before safety boundaries are crossed, and in some cases before alarm activation.
The scientific tasks that follow from this paper are concrete. Benchmark datasets and simulation environments capable of evaluating RSM depletion rates and RSOT accuracy are the immediate research priority; without them, the framework remains conceptual. Physics-informed process twins that propagate uncertainty into safety-state trajectories, operator interface studies that test whether RSOT and OVI improve intervention timing under realistic cognitive load, and HAZOP-linked safety-boundary formalizations for multi-variable envelope definition are the three areas where investment will most directly determine whether POSE advances from paradigm to validated engineering practice.
The foundational hypothesis of POSE is simple and directly testable: a safety system that continuously estimates remaining safe operating time and communicates it to an operator with ranked action guidance should enable earlier and more effective intervention than a system that notifies only after a limit has already been crossed. Demonstrating that hypothesis, on real industrial processes, under realistic operating conditions, and against safety outcome metrics that matter in practice, is the task to which this review calls the next generation of process safety researchers.
Author Contributions
Conceptualization, F.A.; methodology, F.A.; writing—original draft preparation, F.A.; writing—review and editing, F.A. The author has read and agreed to the published version of the manuscript.
Funding
This research received no external funding.
Institutional Review Board Statement
Not applicable.
Informed Consent Statement
Not applicable.
Data Availability Statement
No new data were created or analyzed in this study. Data sharing is not applicable to this article.
Conflicts of Interest
The author declares no conflicts of interest.
References
- Lee, J.; Bagheri, B.; Kao, H.A. A Cyber-Physical Systems architecture for Industry 4.0-based manufacturing systems. Manuf. Lett. 2015, 3, 18–23. [Google Scholar] [CrossRef]
- Xu, L.D.; Xu, E.L.; Li, L. Industry 4.0: state of the art and future trends. Int. J. Prod. Res. 2018, 56, 2941–2962. [Google Scholar] [CrossRef]
- Kletz, T.A. What Went Wrong? Case Histories of Process Plant Disasters and How They Could Have Been Avoided, 5th ed.; Gulf Professional Publishing: Oxford, UK, 2009. [Google Scholar]
- Mannan, S. (Ed.) Lees’ Loss Prevention in the Process Industries: Hazard Identification, Assessment and Control, 4th ed.; Butterworth-Heinemann: Oxford, UK, 2012. [Google Scholar]
- International Society of Automation. ANSI/ISA-18.2: Management of Alarm Systems for the Process Industries. ISA, Research Triangle Park, NC, USA, 2016.
- Engineering Equipment and Materials Users’ Association. EEMUA Publication 191: Alarm Systems—A Guide to Design, Management and Procurement. In EEMUA, London, UK, 4th ed.; 2024. [Google Scholar]
- Qin, S.J. Survey on data-driven industrial process monitoring and diagnosis. Annu. Rev. Control 2012, 36, 220–234. [Google Scholar] [CrossRef]
- Yin, S.; Ding, S.X.; Xie, X.; Luo, H. A review on basic data-driven approaches for industrial process monitoring. IEEE Trans. Ind. Electron. 2014, 61, 6418–6428. [Google Scholar] [CrossRef]
- MacGregor, J.F.; Kourti, T. Statistical process control of multivariate processes. Control Eng. Pract. 1995, 3, 403–414. [Google Scholar] [CrossRef]
- Chiang, L.H.; Russell, E.L.; Braatz, R.D. Fault Detection and Diagnosis in Industrial Systems; Springer: London, UK, 2001. [Google Scholar] [CrossRef]
- Downs, J.J.; Vogel, E.F. A plant-wide industrial process control problem. Comput. Chem. Eng. 1993, 17, 245–255. [Google Scholar] [CrossRef]
- Grieves, M. Digital Twin: Manufacturing Excellence through Virtual Factory Replication, 2014. White paper.
- Tao, F.; Zhang, H.; Liu, A.; Nee, A.Y.C. Digital twin in industry: State-of-the-art. IEEE Trans. Ind. Inform. 2019, 15, 2405–2415. [Google Scholar] [CrossRef]
- Fuller, A.; Fan, Z.; Day, C.; Barlow, C. Digital twin: Enabling technologies, challenges and open research. IEEE Access 2020, 8, 108952–108971. [Google Scholar] [CrossRef]
- Jones, D.; Snider, C.; Nassehi, A.; Yon, J.; Hicks, B. Characterising the Digital Twin: A systematic literature review. CIRP J. Manuf. Sci. Technol. 2020, 29, 36–52. [Google Scholar] [CrossRef]
- Pal, P.K.; Hens, A.; Behera, N.; Lahiri, S.K. Digital twins: Transforming the chemical process industry—A review. Can. J. Chem. Eng. 2025. [Google Scholar] [CrossRef]
- Virando, G.E.; Lee, B.; Kee, S.H.; Yee, J.J. Digital twin simulation and implementation in safety risk management process. IEEE Access 2024, 12, 190483–190494. [Google Scholar] [CrossRef]
- Correa, O.C.; Mariano, J.L.S.; Amaro, E.P.; Santos, E.N. Process Safety Management in Oil and Gas Operating Units Through Digital Twin Platform. In Proceedings of the Proceedings of the Offshore Technology Conference, 2023. [CrossRef]
- Alrowaie, F. Digital Twins and Artificial Intelligence for HAZOP Enhancement in Process Safety: A Critical Literature Review. Preprints, Preprint (not peer-reviewed). 2026. [Google Scholar] [CrossRef]
- Villa, V.; Paltrinieri, N.; Khan, F.; Cozzani, V. Towards dynamic risk analysis: A review of the risk assessment approach and its limitations in the chemical process industry. Saf. Sci. 2016, 89, 77–93. [Google Scholar] [CrossRef]
- Kuhn, T.S. The Structure of Scientific Revolutions; University of Chicago Press: Chicago, IL, USA, 1962. [Google Scholar]
- Abedsoltan, H.; Abedsoltan, A. Future of process safety: Insights, approaches, and potential developments. Process Saf. Environ. Prot. 2024, 185, 651–668. [Google Scholar] [CrossRef]
- Mayne, D.Q.; Rawlings, J.B.; Rao, C.V.; Scokaert, P.O.M. Constrained model predictive control: Stability and optimality. Automatica 2000, 36, 789–814. [Google Scholar] [CrossRef]
- Seborg, D.E.; Edgar, T.F.; Mellichamp, D.A.; Doyle, F.J. Process Dynamics and Control, 4th ed.; John Wiley & Sons: Hoboken, NJ, USA, 2016. [Google Scholar]
- Raissi, M.; Perdikaris, P.; Karniadakis, G.E. Physics-informed neural networks: A deep learning framework for solving forward and inverse problems involving nonlinear partial differential equations. J. Comput. Phys. 2019, 378, 686–707. [Google Scholar] [CrossRef]
- Ge, Z.; Song, Z.; Ding, S.X.; Huang, B. Data mining and analytics in the process industry: The role of machine learning. IEEE Access 2017, 5, 20590–20616. [Google Scholar] [CrossRef]
- Elhosary, E.; Moselhi, O. Automation for HAZOP study: A state-of-the-art review and future research directions. J. Inf. Technol. Constr. 2024, 29, 665–697. [Google Scholar] [CrossRef]
- International Electrotechnical Commission. IEC 62682: Management of Alarm Systems for the Process Industries. IEC: Geneva, Switzerland, 2014.
- Hollifield, B.R.; Habibi, E. Alarm Management: A Comprehensive Guide, 2nd ed.; ISA: Research Triangle Park, NC, USA, 2011.
- Varga, T.; Szeifert, F.; Abonyi, J. Detection of safe operating regions: A novel dynamic process simulator based predictive alarm management approach. Ind. Eng. Chem. Res. 2010, 49, 3658–3669. [Google Scholar] [CrossRef]
- Rodrigo Marco, V. Alarm Flood Reduction Using Multiple Data Sources. Master’s thesis, Lund University, 2014.
- Manca, G.; Fay, A. Off-line analysis of dynamic causal dependencies in evolving industrial alarm floods. In Proceedings of the Proceedings of the IEEE International Conference on Industrial Cyber-Physical Systems, 2022, pp. 1–6. [CrossRef]
- Alinezhad, H.S.; Roohi, M.H.; Chen, T. A review of alarm root cause analysis in process industries: Common methods, recent research status and challenges. Chem. Eng. Res. Des. 2022, 188, 846–868. [Google Scholar] [CrossRef]
- Hu, W.; Yang, G.; Wu, M. Root cause identification of industrial alarm floods using word embedding and few-shot learning. IEEE Trans. Ind. Inform. 2023, 19, 9841–9851. [Google Scholar] [CrossRef]
- Roohi, M.H.; Ramazi, P.; Chen, T. Towards accurate root-alarm identification: The causal Bayesian network approach. In Proceedings of the Proceedings of the Conference on Control and Fault-Tolerant Systems, 2021, pp. 7–12. [CrossRef]
- Izadi, I.; Shah, S.L.; Shook, D.S.; Kondaveeti, S.R.; Chen, T. A framework for optimal design of alarm systems. IFAC Proc. Vol. 2009, 42, 651–656. [Google Scholar] [CrossRef]
- Pariyani, A.; Seider, W.D.; Oktem, U.G.; Soroush, M. Dynamic risk analysis using alarm databases to improve process safety and product quality: Part I—Data compaction. AIChE J. 2012, 58, 812–825. [Google Scholar] [CrossRef]
- Kondaveeti, S.R.; Shah, S.L.; Izadi, I. Application of multivariate statistics for efficient alarm generation. IFAC Proc. Vol. 2009, 42, 657–662. [Google Scholar] [CrossRef]
- Jiang, W.; Hu, W.; Liu, Z.; Wang, F. An informer based alarm early prediction method over consecutive alarm monitoring periods. In Proceedings of the Proceedings of the IEEE International Conference on Industrial Informatics, 2024, pp. 1–6. [CrossRef]
- Venkatasubramanian, V.; Rengaswamy, R.; Yin, K.; Kavuri, S.N. A review of process fault detection and diagnosis: Part I: Quantitative model-based methods. Comput. Chem. Eng. 2003, 27, 293–311. [Google Scholar] [CrossRef]
- Venkatasubramanian, V.; Rengaswamy, R.; Kavuri, S.N. A review of process fault detection and diagnosis: Part II: Qualitative models and search strategies. Comput. Chem. Eng. 2003, 27, 313–326. [Google Scholar] [CrossRef]
- Isermann, R. Model-based fault-detection and diagnosis—status and applications. Annu. Rev. Control 2005, 29, 71–85. [Google Scholar] [CrossRef]
- Venkatasubramanian, V.; Rengaswamy, R.; Kavuri, S.N.; Yin, K. A review of process fault detection and diagnosis: Part III: Process history based methods. Comput. Chem. Eng. 2003, 27, 327–346. [Google Scholar] [CrossRef]
- Ge, Z.; Song, Z.; Gao, F. Review of recent research on data-based process monitoring. Ind. Eng. Chem. Res. 2013, 52, 3543–3562. [Google Scholar] [CrossRef]
- Ding, S.X. Data-driven design of monitoring and diagnosis systems for dynamic processes: A review of subspace technique based schemes and some recent results. J. Process Control 2014, 24, 431–449. [Google Scholar] [CrossRef]
- Zhang, Z.; Zhao, J. A deep belief network based fault diagnosis model for complex chemical processes. Comput. Chem. Eng. 2017, 107, 395–407. [Google Scholar] [CrossRef]
- Pearl, J. Causality: Models, Reasoning, and Inference; Cambridge University Press: Cambridge, UK, 2000. [Google Scholar]
- Lee, J.D.; See, K.A. Trust in automation: Designing for appropriate reliance. Hum. Factors 2004, 46, 50–80. [Google Scholar] [CrossRef] [PubMed]
- Arrieta, A.B.; Díaz-Rodríguez, N.; Del Ser, J.; Bennetot, A.; Tabik, S.; Barbado, A.; Herrera, F. Explainable Artificial Intelligence (XAI): Concepts, taxonomies, opportunities and challenges toward responsible AI. Inf. Fusion 2020, 58, 82–115. [Google Scholar] [CrossRef]
- Cação, J.; Santos, J.; Antunes, M. Explainable AI for industrial fault diagnosis: A systematic review. J. Ind. Inf. Integr. 2025, 47, 100905. [Google Scholar] [CrossRef]
- Grieves, M.; Vickers, J. Digital Twin: Mitigating Unpredictable, Undesirable Emergent Behavior in Complex Systems. In Transdisciplinary Perspectives on Complex Systems; Kahlen, F.J., Flumerfelt, S., Alves, A., Eds.; Springer: Cham, Switzerland, 2017; pp. 85–113. [Google Scholar] [CrossRef]
- Rasheed, A.; San, O.; Kvamsdal, T. Digital Twin: Values, Challenges and Enablers from a Modeling Perspective. IEEE Access 2020, 8, 21980–22012. [Google Scholar] [CrossRef]
- Liu, M.; Fang, S.; Dong, H.; Xu, C. Review of digital twin about concepts, technologies, and industrial applications. J. Manuf. Syst. 2021, 58, 346–361. [Google Scholar] [CrossRef]
- Kritzinger, W.; Karner, M.; Traar, G.; Henjes, J.; Sihn, W. Digital Twin in manufacturing: A categorical literature review and classification. IFAC-PapersOnLine 2018, 51, 1016–1022. [Google Scholar] [CrossRef]
- Bevilacqua, M.; Bottani, E.; Ciarapica, F.E.; Costantino, F.; Di Donato, L.; Ferraro, A.; Mazzuto, G.; Monteriù, A.; Nardini, G.; Ortenzi, M.; et al. Digital Twin Reference Model Development to Prevent Operators’ Risk in Process Plants. Sustainability 2020, 12, 1088. [Google Scholar] [CrossRef]
- Mane, S.; Dhote, R.R.; Sinha, A.; Thirumalaiswamy, R. Digital twin in the chemical industry: A review. Digit. Twins Appl. 2024, 1, 118–130. [Google Scholar] [CrossRef]
- Zio, E.; Miqueles, L. Digital twins in safety analysis, risk assessment and emergency management. Reliab. Eng. Syst. Saf. 2024, 246, 110040. [Google Scholar] [CrossRef]
- Kabashkin, I. Mathematical Framework for Digital Risk Twins in Safety-Critical Systems. Mathematics 2025, 13, 3222. [Google Scholar] [CrossRef]
- Seider, W.D.; Soroush, M.; Arbogast, J.E.; Oktem, U.G. Design for process safety—A perspective. In Computer Aided Chemical Engineering; Elsevier, 2014; Vol. 33, pp. 457–462. [CrossRef]
- Dunjó, J.; Fthenakis, V.; Vílchez, J.A.; Arnaldos, J. Hazard and operability (HAZOP) analysis: A literature review. J. Hazard. Mater. 2010, 173, 19–32. [Google Scholar] [CrossRef] [PubMed]
- Crowl, D.A.; Louvar, J.F. Chemical Process Safety: Fundamentals with Applications, 3rd ed.; Prentice Hall: Upper Saddle River, NJ, USA, 2011. [Google Scholar]
- Center for Chemical Process Safety. Layer of Protection Analysis: Simplified Process Risk Assessment; American Institute of Chemical Engineers: New York, NY, USA, 2001. [Google Scholar]
- International Electrotechnical Commission. IEC 61511: Functional Safety – Safety Instrumented Systems for the Process Industry Sector. IEC, Geneva, Switzerland, 2016.
- Baybutt, P. A critique of the Hazard and Operability (HAZOP) study. J. Loss Prev. Process Ind. 2015, 33, 52–58. [Google Scholar] [CrossRef]
- Khan, F.; Rathnayaka, S.; Ahmed, S. Methods and models in process safety and risk management: Past, present and future. Process Saf. Environ. Prot. 2016, 98, 116–147. [Google Scholar] [CrossRef]
- Marhavilas, P.K.; Koulouriotis, D.; Gemeni, V. Risk analysis and assessment methodologies in the work sites: On a review, classification and comparative study of the scientific literature of the period 2000–2009. J. Loss Prev. Process Ind. 2011, 24, 477–523. [Google Scholar] [CrossRef]
- Robinson, C.; Brown, S.; Cordiner, J. Towards automated HAZOPs. In Computer Aided Chemical Engineering; Elsevier, 2021; Vol. 50, pp. 491–496. [CrossRef]
- Nehal, N.; Mekkakia-Mehdi, M.; Lounis, Z.; Guetarni, I.H.M.; Lounis, Z. HAZOP, FMECA, monitoring algorithm, and Bayesian network integrated approach for an exhaustive risk assessment and real-time safety analysis: Case study. Process Saf. Prog. 2024, 43, 784–813. [Google Scholar] [CrossRef]
- Khakzad, N.; Khan, F.; Amyotte, P. Safety analysis in process facilities: Comparison of fault tree and Bayesian network approaches. Reliab. Eng. Syst. Saf. 2011, 96, 925–932. [Google Scholar] [CrossRef]
- Khakzad, N.; Khan, F.; Amyotte, P. Dynamic safety analysis of process systems by mapping bow-tie into Bayesian network. Process Saf. Environ. Prot. 2013, 91, 46–53. [Google Scholar] [CrossRef]
- Zio, E. The future of risk assessment. Reliab. Eng. Syst. Saf. 2018, 177, 176–190. [Google Scholar] [CrossRef]
- Amin, M.T.; Khan, F. Dynamic Process Safety Assessment Using Adaptive Bayesian Network with Loss Function. Ind. Eng. Chem. Res. 2022, 61, 16799–16814. [Google Scholar] [CrossRef]
- Rasmussen, J. Skills, rules, and knowledge; signals, signs, and symbols, and other distinctions in human performance models. IEEE Trans. Syst. Man. Cybern. 1983, SMC-13, 257–266. [Google Scholar] [CrossRef]
- Reason, J. Human Error; Cambridge University Press: Cambridge, UK, 1990. [Google Scholar]
- Bainbridge, L. Ironies of automation. Automatica 1983, 19, 775–779. [Google Scholar] [CrossRef]
- Endsley, M.R. Toward a theory of situation awareness in dynamic systems. Hum. Factors 1995, 37, 32–64. [Google Scholar] [CrossRef]
- Vicente, K.J. Cognitive Work Analysis: Toward Safe, Productive, and Healthy Computer-Based Work; Lawrence Erlbaum Associates: Mahwah, NJ, USA, 1999. [Google Scholar]
- Wickens, C.D. Multiple resources and performance prediction. Theor. Issues Ergon. Sci. 2002, 3, 159–177. [Google Scholar] [CrossRef]
- Jardine, A.K.S.; Lin, D.; Banjevic, D. A review on machinery diagnostics and prognostics implementing condition-based maintenance. Mech. Syst. Signal Process. 2006, 20, 1483–1510. [Google Scholar] [CrossRef]
- Si, X.S.; Wang, W.; Hu, C.H.; Zhou, D.H. Remaining useful life estimation—A review on the statistical data-driven approaches. Eur. J. Oper. Res. 2011, 213, 1–14. [Google Scholar] [CrossRef]
- Sikorska, J.Z.; Hodkiewicz, M.; Ma, L. Prognostic modelling options for remaining useful life estimation by industry. Mech. Syst. Signal Process. 2011, 25, 1803–1836. [Google Scholar] [CrossRef]
- Lei, Y.; Li, N.; Guo, L.; Li, N.; Yan, T.; Lin, J. Machinery health prognostics: A systematic review from data acquisition to RUL prediction. Mech. Syst. Signal Process. 2018, 104, 799–834. [Google Scholar] [CrossRef]
- Peng, Y.; Dong, M.; Zuo, M.J. Current status of machine prognostics in condition-based maintenance: a review. Int. J. Adv. Manuf. Technol. 2010, 50, 297–313. [Google Scholar] [CrossRef]
- Saxena, A.; Goebel, K.; Simon, D.; Eklund, N. Damage propagation modeling for aircraft engine run-to-failure simulation. In Proceedings of the Proceedings of the 2008 International Conference on Prognostics and Health Management. IEEE, 2008, pp. 1–9. [CrossRef]
- Zhao, R.; Yan, R.; Chen, Z.; Mao, K.; Wang, P.; Gao, R.X. Deep learning and its applications to machine health monitoring. Mech. Syst. Signal Process. 2019, 115, 213–237. [Google Scholar] [CrossRef]
- Wang, Y.; Ji, Z.; Cao, Y.; Yang, S.H. Dynamic risk assessment for process operational safety based on reachability analysis. Reliab. Eng. Syst. Saf. 2025, 253, 110564. [Google Scholar] [CrossRef]
- Kalantarnia, M.; Khan, F.; Hawboldt, K. Dynamic risk assessment using failure assessment and Bayesian theory. J. Loss Prev. Process Ind. 2009, 22, 600–606. [Google Scholar] [CrossRef]
- Paltrinieri, N.; Khan, F. (Eds.) Dynamic Risk Analysis in the Chemical and Petroleum Industry; Butterworth-Heinemann, 2016.
- Wu, Y.; Sicard, B.; Gadsden, S.A. Physics-informed machine learning: A comprehensive review on applications in anomaly detection and condition monitoring. Expert Syst. With Appl. 2024, 255, 124678. [Google Scholar] [CrossRef]
- Humayed, A.; Lin, J.; Li, F.; Luo, B. Cyber-physical systems security—A survey. IEEE Internet Things J. 2017, 4, 1802–1831. [Google Scholar] [CrossRef]
- Reiman, T.; Pietikäinen, E. Leading indicators of system safety—monitoring and driving the organizational safety potential. Saf. Sci. 2012, 50, 1993–2000. [Google Scholar] [CrossRef]
- Richalet, J.; Rault, A.; Testud, J.L.; Papon, J. Model predictive heuristic control: Applications to industrial processes. Automatica 1978, 14, 413–428. [Google Scholar] [CrossRef]
- Pasman, H.; Sripaul, E.; Khan, F.; Fabiano, B. Energy transition technology comes with new process safety challenges and risks—What does it mean? Process Saf. Prog. 2024, 43, 226–230. [Google Scholar] [CrossRef]
| 1 | The term paradigm is used here in the sense of a coherent research programme: a shared vocabulary, a set of guiding principles, and an agenda of open problems that define a recognizable field of inquiry [21]. It does not claim a Kuhnian incommensurable break with prior work; existing safety disciplines are explicitly incorporated into POSE rather than displaced by it. |
Figure 1.
Conceptual motivation for Predictive Operational Safety Engineering (POSE). Left: six established research streams (alarm management, fault detection and diagnosis, digital twins, HAZOP/LOPA, operator support, and prognostics/PHM) each address a partial reactive question but do not collectively produce a continuous estimate of the future operational safety state. Centre: the missing link is future operational safety-state estimation, reframing the operational question from what happened? to what will safety become? Right: POSE addresses four sequential predictive questions (what future safety state is emerging, how much safe operating time remains, which safety margin is being depleted, and which intervention has the highest safety value), implemented through Predictive Process Intelligence, Predictive Safety Intelligence, and Human Safety Intelligence.
Figure 1.
Conceptual motivation for Predictive Operational Safety Engineering (POSE). Left: six established research streams (alarm management, fault detection and diagnosis, digital twins, HAZOP/LOPA, operator support, and prognostics/PHM) each address a partial reactive question but do not collectively produce a continuous estimate of the future operational safety state. Centre: the missing link is future operational safety-state estimation, reframing the operational question from what happened? to what will safety become? Right: POSE addresses four sequential predictive questions (what future safety state is emerging, how much safe operating time remains, which safety margin is being depleted, and which intervention has the highest safety value), implemented through Predictive Process Intelligence, Predictive Safety Intelligence, and Human Safety Intelligence.
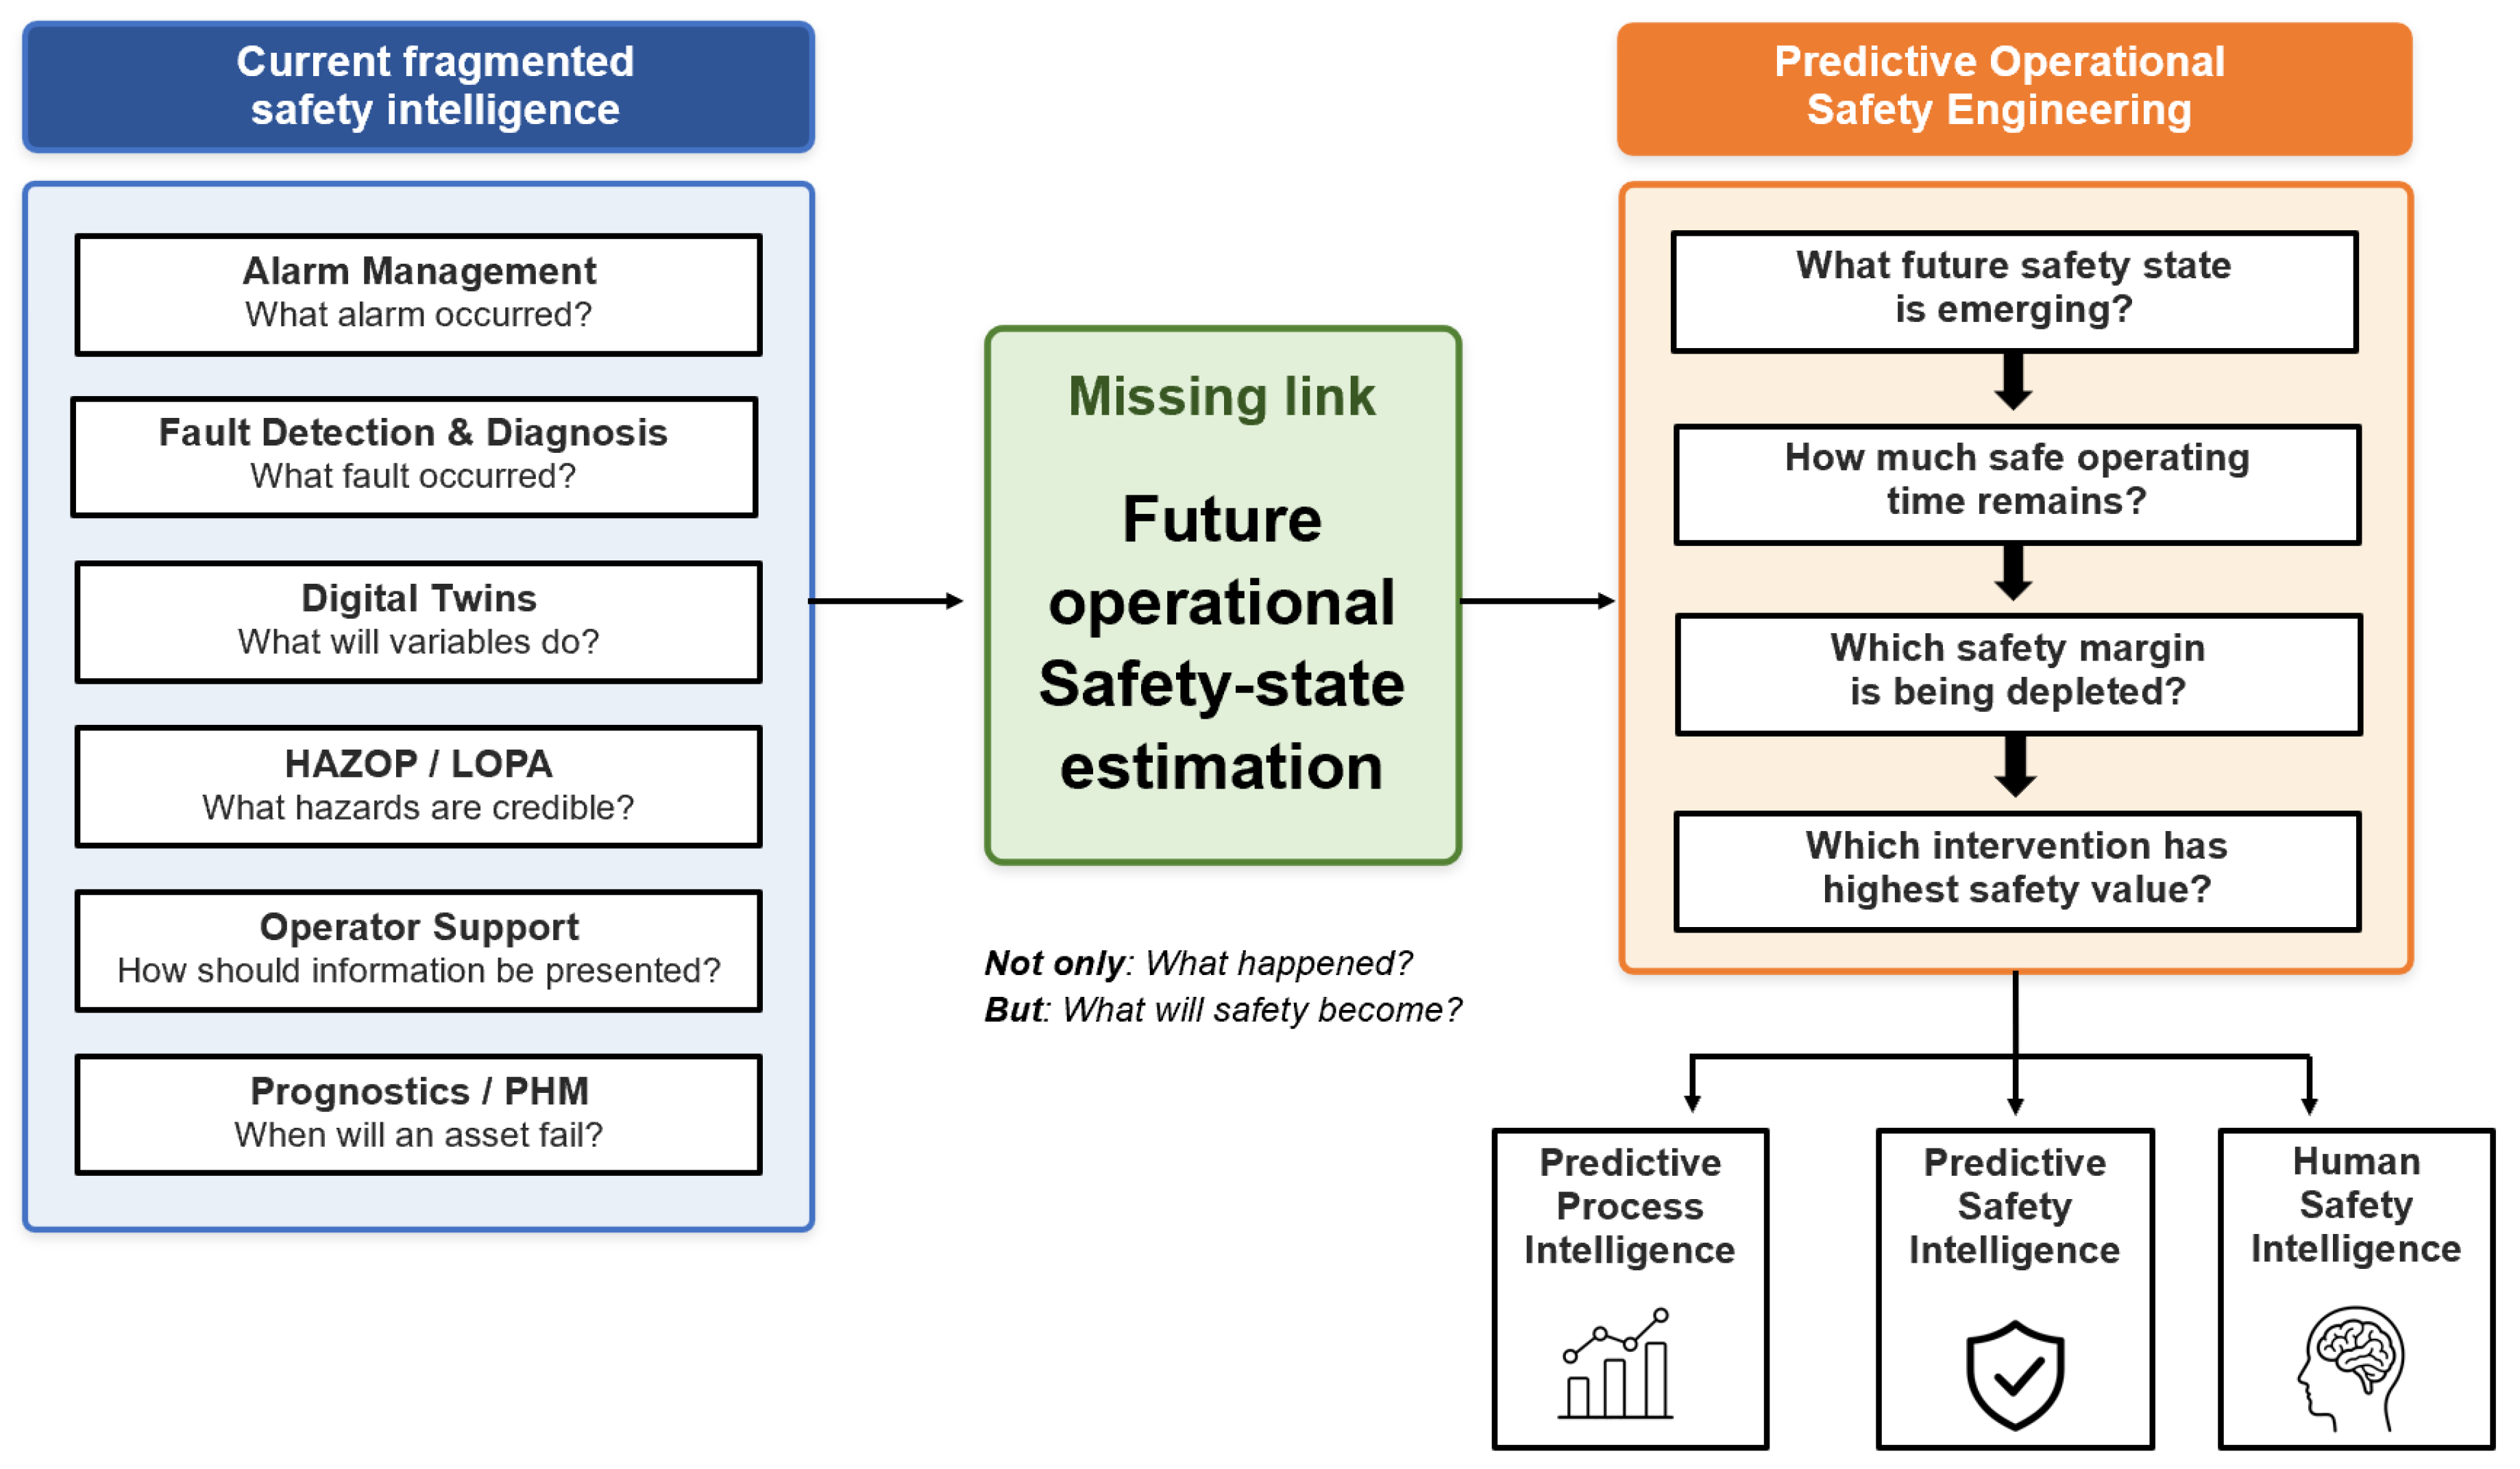
Figure 2.
Conceptual analogy between classical process control and industrial process safety. Feedback control (1A) and conventional safety (1B) share a reactive logic in which corrective or protective action follows an observed deviation. Feedforward control (2A) and Predictive Operational Safety Engineering (2B) share a proactive logic in which the system reasons ahead of deviations and intervenes early by estimating RSOT and RSM before safety boundaries are reached. This analogy is conceptual rather than algorithmic; POSE is a safety-reasoning paradigm, not a control algorithm.
Figure 2.
Conceptual analogy between classical process control and industrial process safety. Feedback control (1A) and conventional safety (1B) share a reactive logic in which corrective or protective action follows an observed deviation. Feedforward control (2A) and Predictive Operational Safety Engineering (2B) share a proactive logic in which the system reasons ahead of deviations and intervenes early by estimating RSOT and RSM before safety boundaries are reached. This analogy is conceptual rather than algorithmic; POSE is a safety-reasoning paradigm, not a control algorithm.
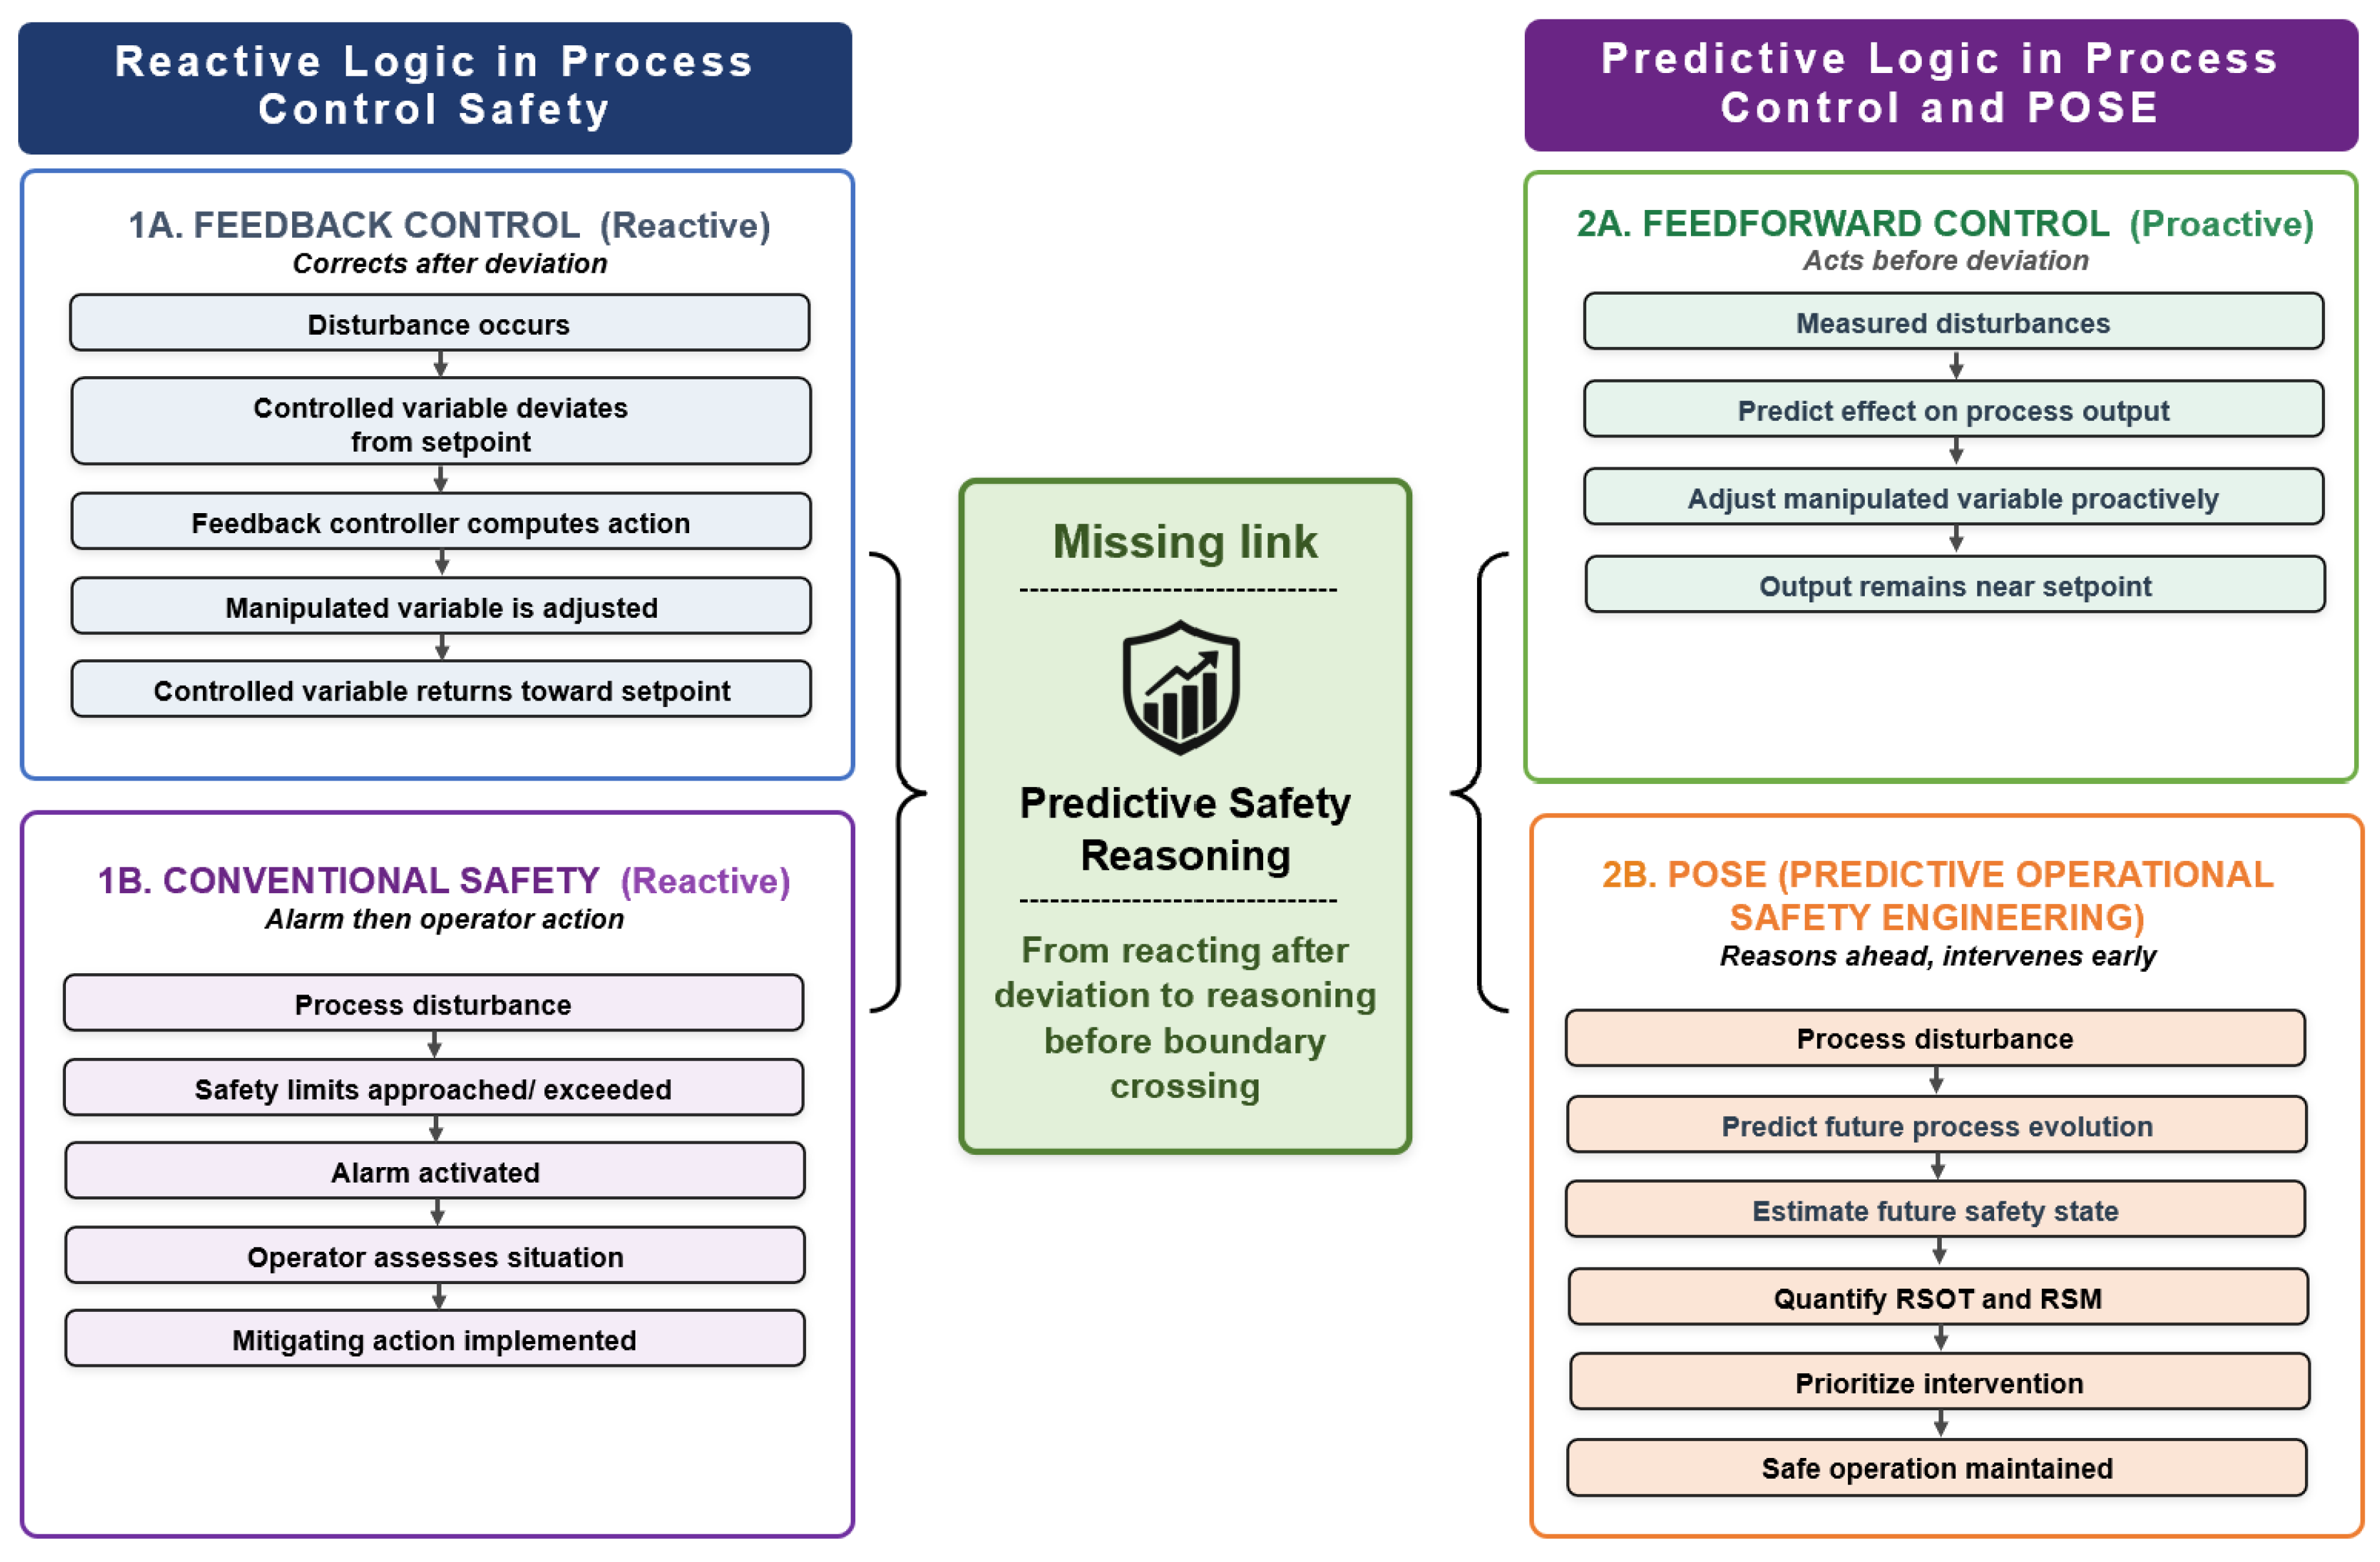
Figure 3.
Dynamic HAZOP-informed safety reasoning chain activated by a predicted process deviation. Static HAZOP knowledge (deviations, causes, consequences, safeguards, and recommended actions) feeds a seven-step reasoning sequence: (1) models and data predict a future process deviation before limits are reached; (2) a dynamic HAZOP knowledge engine transforms static documentation into an online reasoning layer; (3) HAZOP reasoning identifies the relevant deviation, infers probable causes, and infers potential consequences; (4) safeguard assessment evaluates the status and effectiveness of existing safeguards; (5) risk prioritization ranks scenarios by OVI, RSM, and RSOT to identify the most critical situation; (6) recommended operator action provides prioritized, actionable guidance before safety boundaries are crossed; and (7) the future safety state is updated to reflect the intervention or continued trajectory, closing the predictive reasoning loop. The three operator-facing output metrics span complementary dimensions: Remaining Safe Operating Time (RSOT, time dimension), Remaining Safety Margin (RSM, margin dimension), and Operational Vulnerability Index (OVI, overall vulnerability dimension).
Figure 3.
Dynamic HAZOP-informed safety reasoning chain activated by a predicted process deviation. Static HAZOP knowledge (deviations, causes, consequences, safeguards, and recommended actions) feeds a seven-step reasoning sequence: (1) models and data predict a future process deviation before limits are reached; (2) a dynamic HAZOP knowledge engine transforms static documentation into an online reasoning layer; (3) HAZOP reasoning identifies the relevant deviation, infers probable causes, and infers potential consequences; (4) safeguard assessment evaluates the status and effectiveness of existing safeguards; (5) risk prioritization ranks scenarios by OVI, RSM, and RSOT to identify the most critical situation; (6) recommended operator action provides prioritized, actionable guidance before safety boundaries are crossed; and (7) the future safety state is updated to reflect the intervention or continued trajectory, closing the predictive reasoning loop. The three operator-facing output metrics span complementary dimensions: Remaining Safe Operating Time (RSOT, time dimension), Remaining Safety Margin (RSM, margin dimension), and Operational Vulnerability Index (OVI, overall vulnerability dimension).
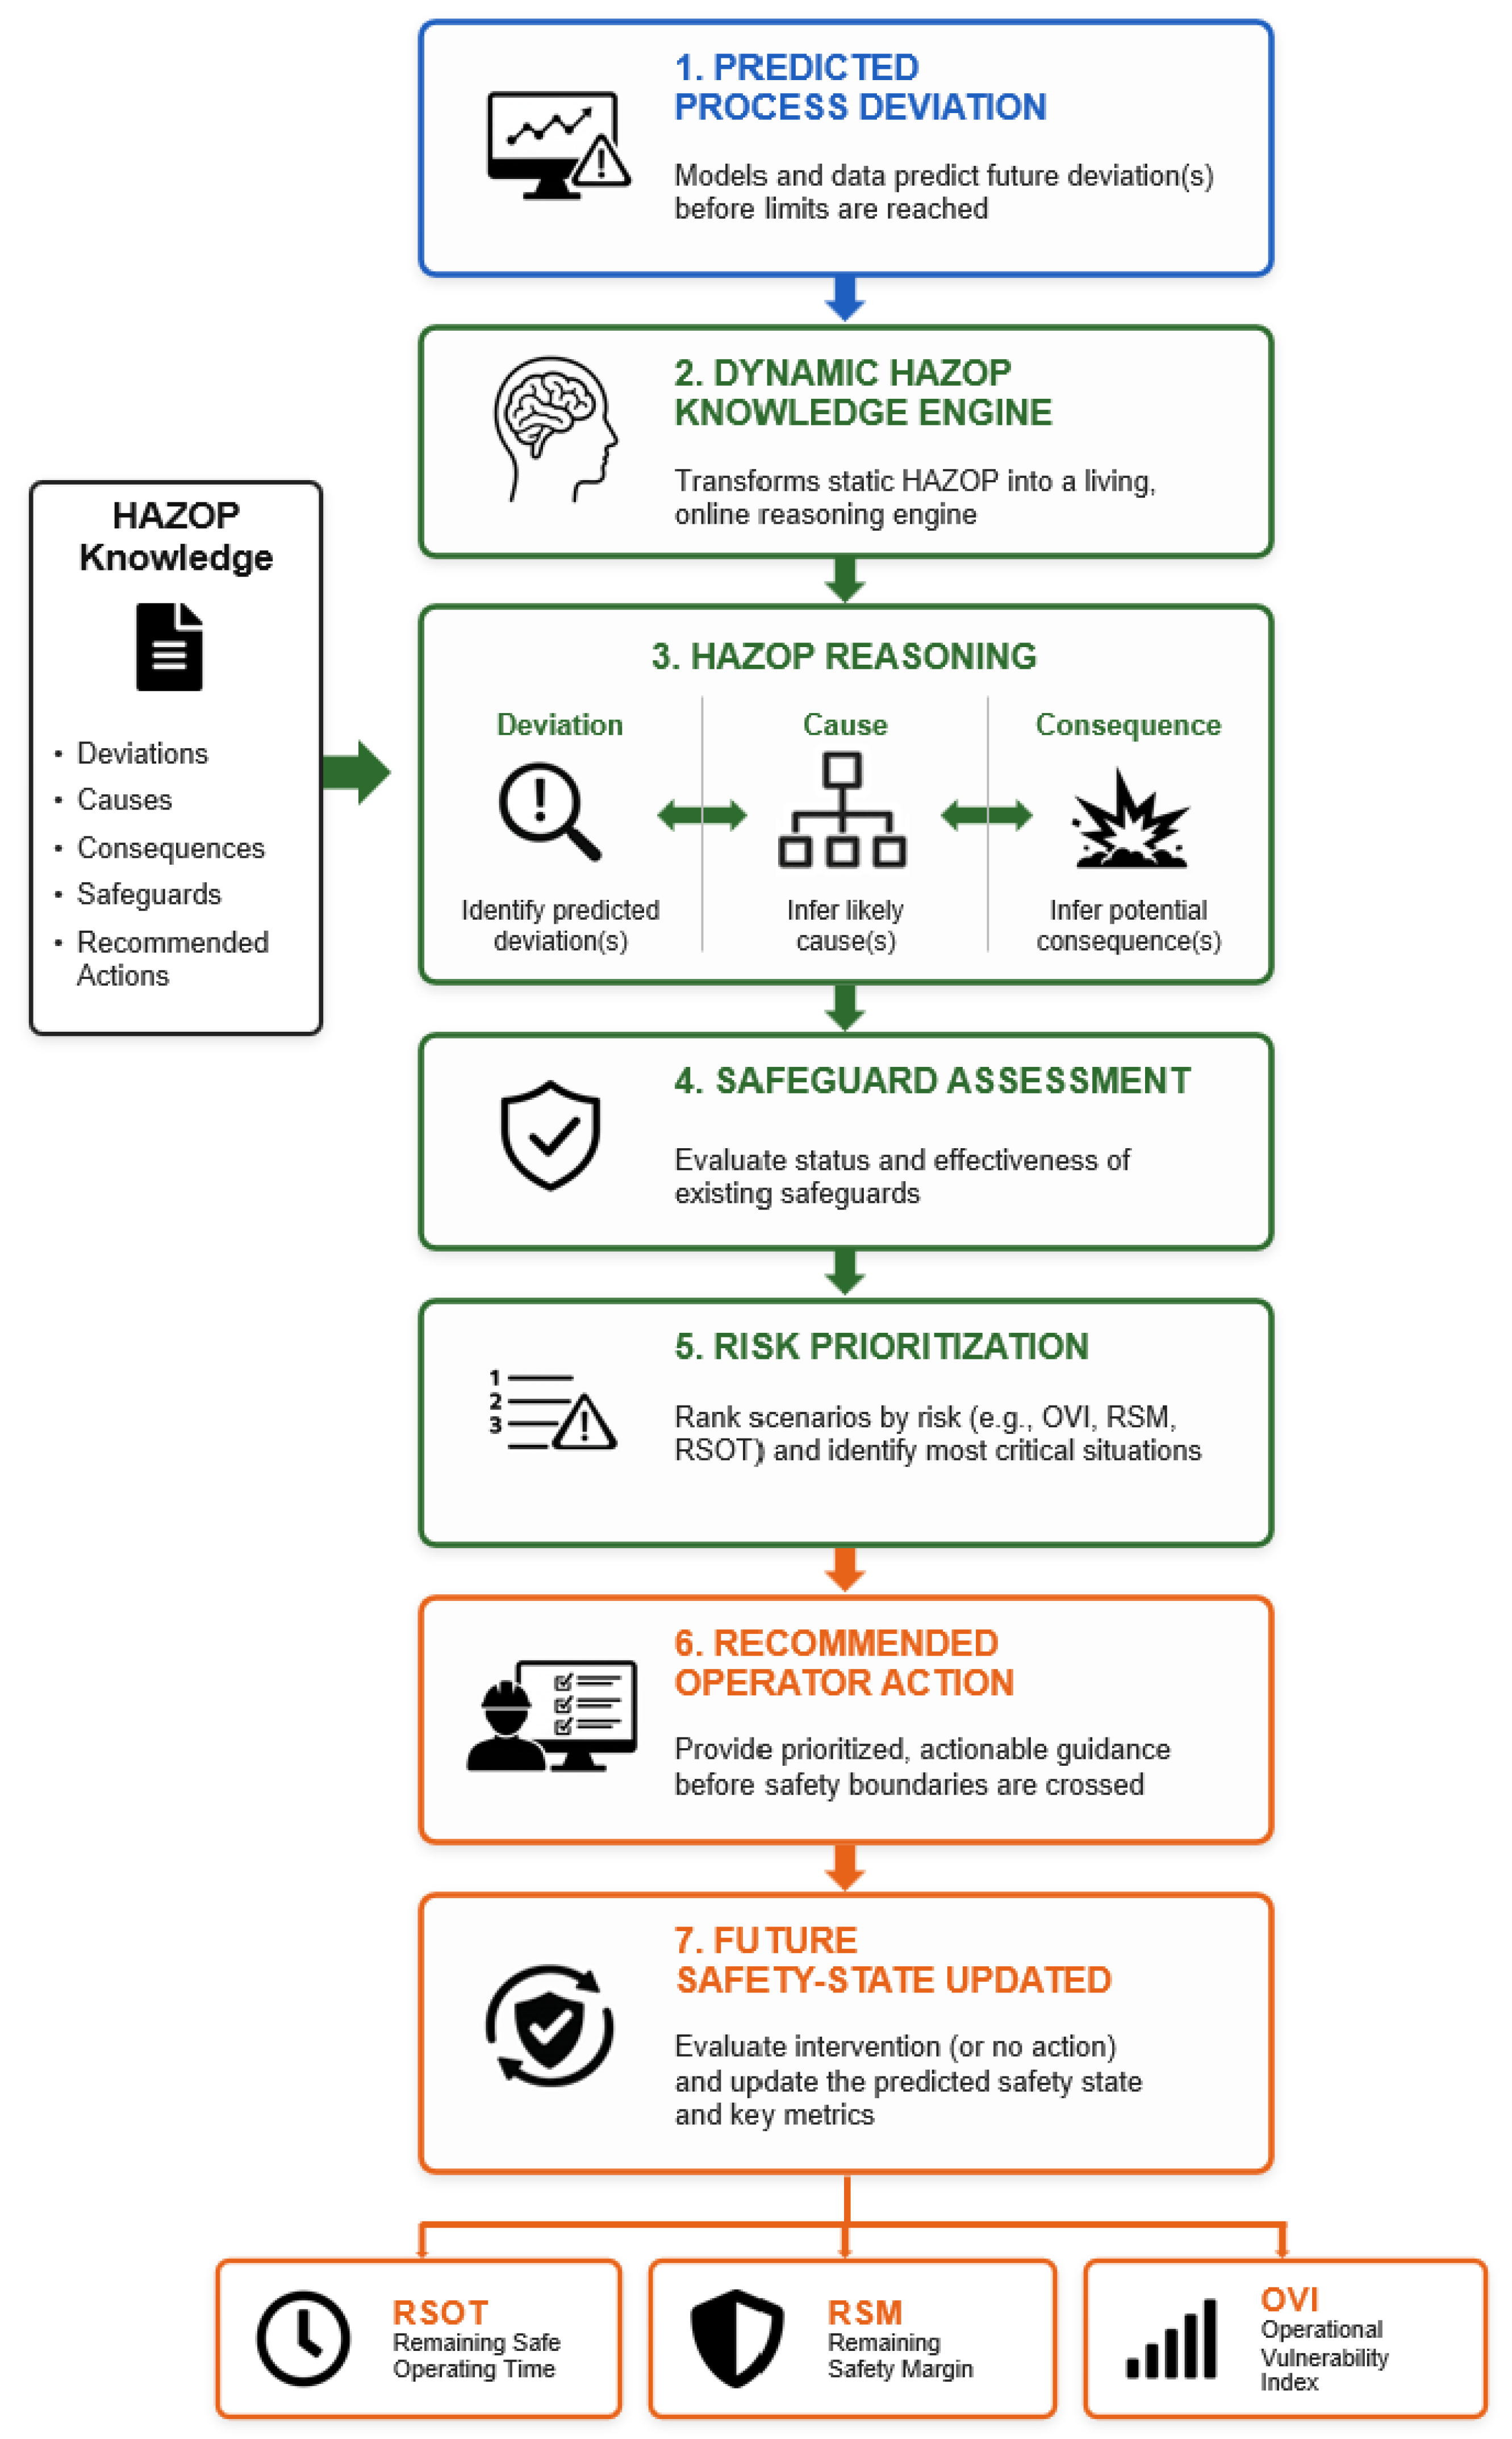
Figure 4.
Conceptual contrast between traditional prognostics and POSE. Left panel (blue): Remaining Useful Life (RUL) is an equipment-centered metric that estimates how long before a single asset’s health index crosses a failure threshold. Right panel (orange): Remaining Safe Operating Time (RSOT) is a process-safety-centered metric that estimates how long before the collective operational safety state crosses a safety boundary. The key distinction is that RSOT depends on predicted process trajectories relative to multi-variable safety boundaries, not on the degradation of any individual component. Two complementary concepts that extend this framework, Safety Horizon (the future interval over which the safety-state forecast remains sufficiently reliable for operational use) and Predictive Safety Confidence (PSC, the probability that a specified intervention can be completed before boundary crossing), are formally defined in Section 11.
Figure 4.
Conceptual contrast between traditional prognostics and POSE. Left panel (blue): Remaining Useful Life (RUL) is an equipment-centered metric that estimates how long before a single asset’s health index crosses a failure threshold. Right panel (orange): Remaining Safe Operating Time (RSOT) is a process-safety-centered metric that estimates how long before the collective operational safety state crosses a safety boundary. The key distinction is that RSOT depends on predicted process trajectories relative to multi-variable safety boundaries, not on the degradation of any individual component. Two complementary concepts that extend this framework, Safety Horizon (the future interval over which the safety-state forecast remains sufficiently reliable for operational use) and Predictive Safety Confidence (PSC, the probability that a specified intervention can be completed before boundary crossing), are formally defined in Section 11.
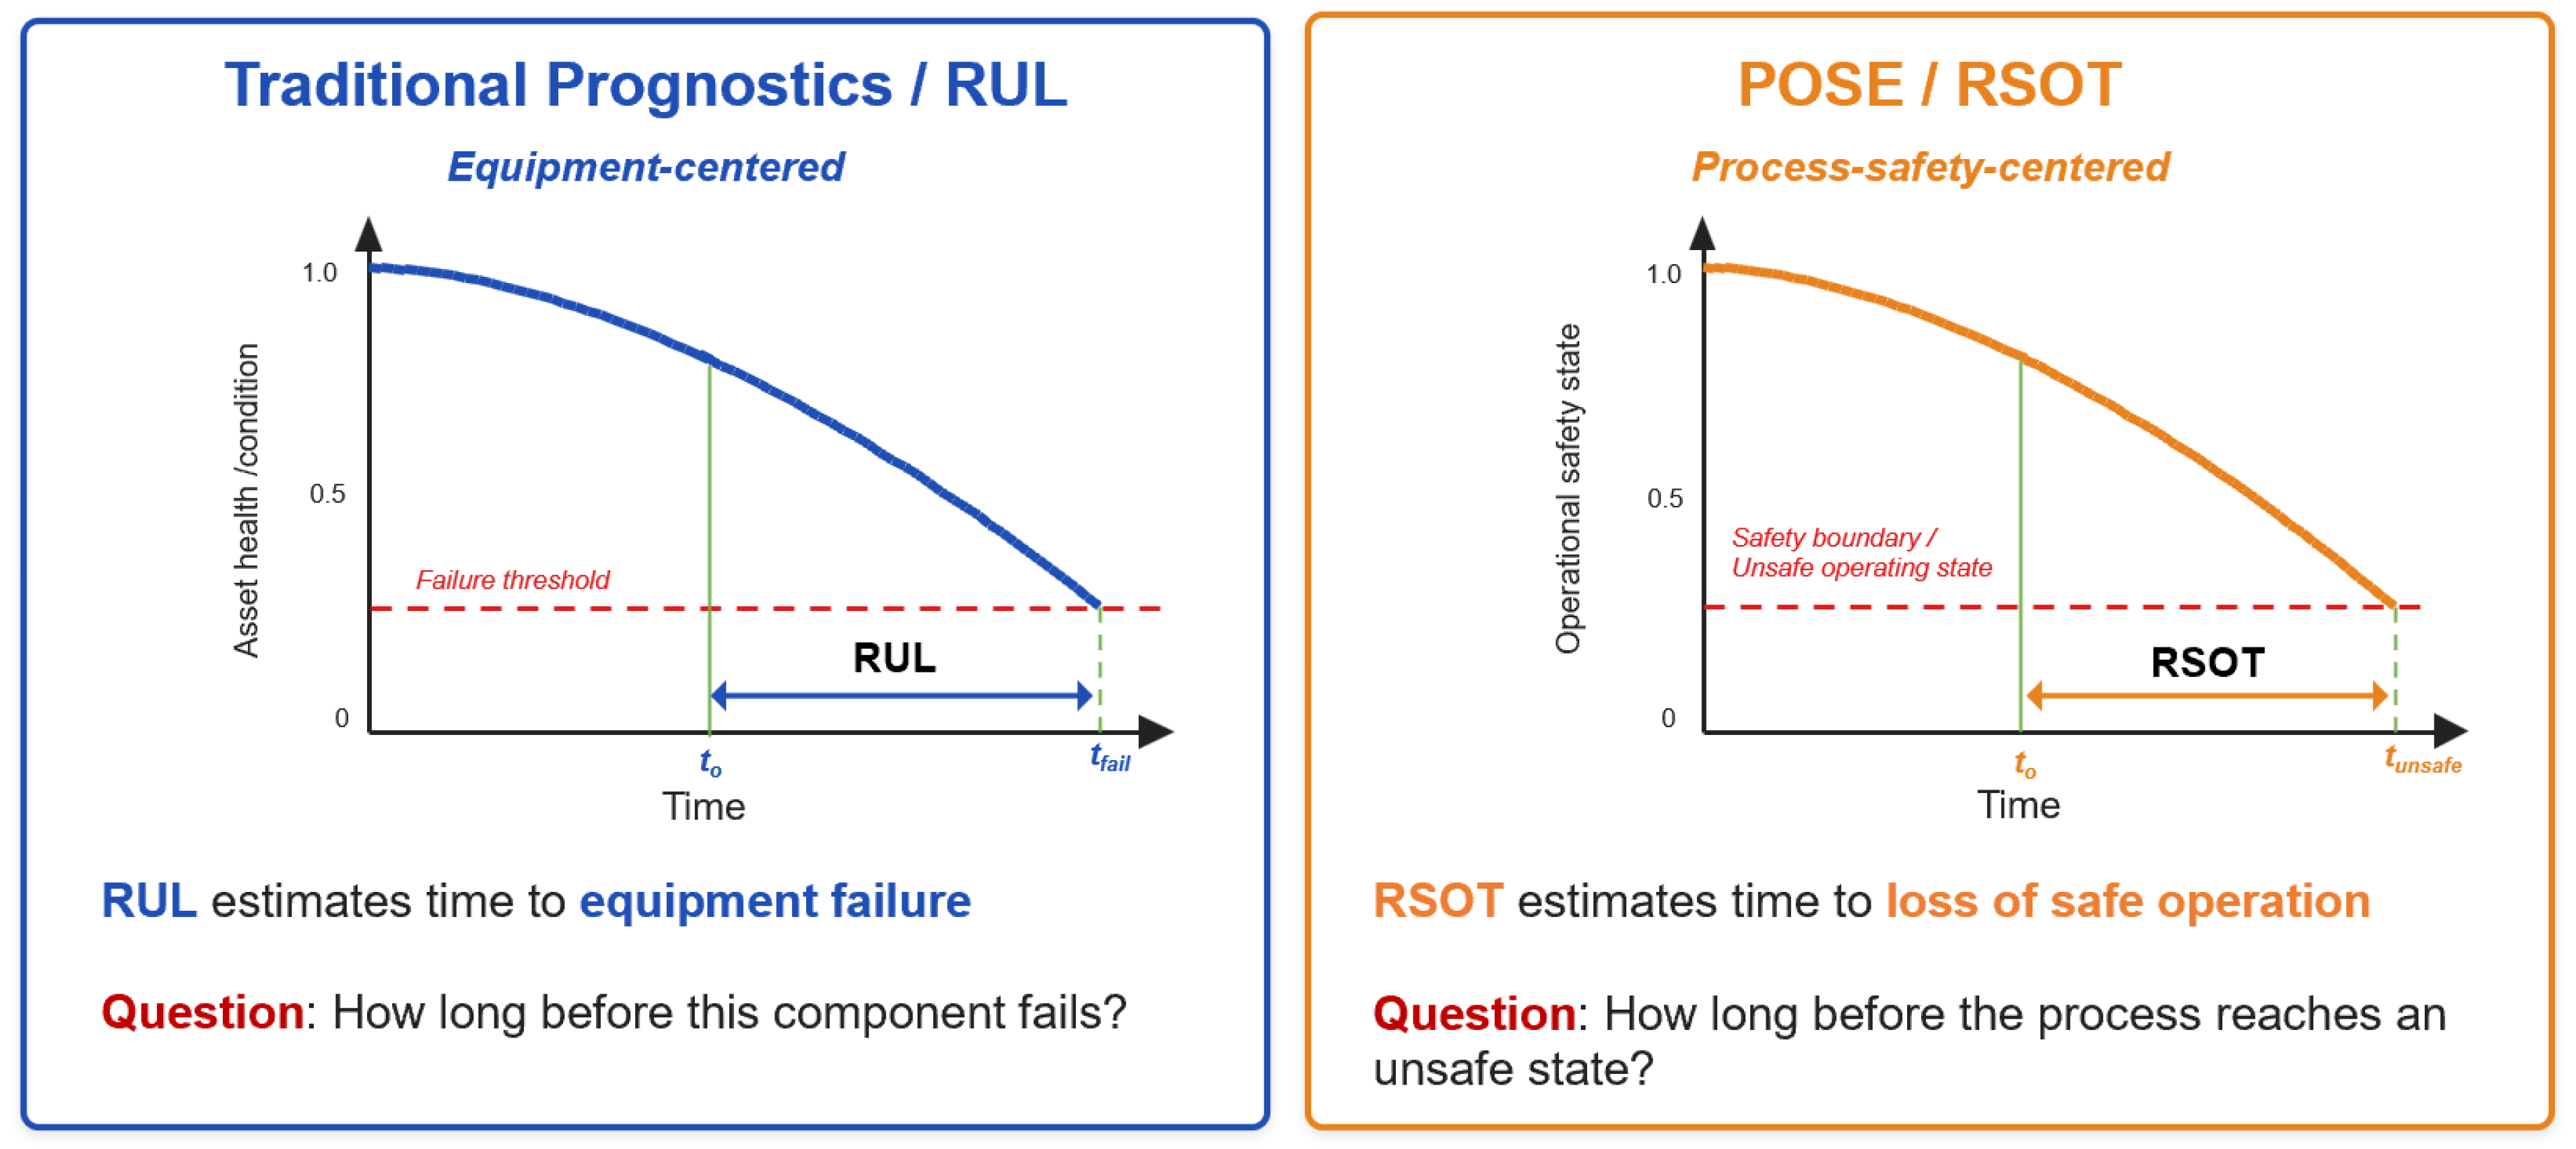
Figure 5.
Synthesis of the six reviewed research streams and the critical research gap they collectively expose. Each stream (Alarm Management, Fault Detection and Diagnosis, Digital Twins, HAZOP/LOPA, Operator Support, Prognostics/RUL) provides a partial view of the operational safety problem. No unified framework presently makes the future operational safety state the central object of continuous estimation. POSE addresses this gap by integrating process prediction, safety-state estimation, safety reasoning, and operator guidance around the POSE metrics: RSOT, RSM, OVI, PSC, and Safety Horizon.
Figure 5.
Synthesis of the six reviewed research streams and the critical research gap they collectively expose. Each stream (Alarm Management, Fault Detection and Diagnosis, Digital Twins, HAZOP/LOPA, Operator Support, Prognostics/RUL) provides a partial view of the operational safety problem. No unified framework presently makes the future operational safety state the central object of continuous estimation. POSE addresses this gap by integrating process prediction, safety-state estimation, safety reasoning, and operator guidance around the POSE metrics: RSOT, RSM, OVI, PSC, and Safety Horizon.
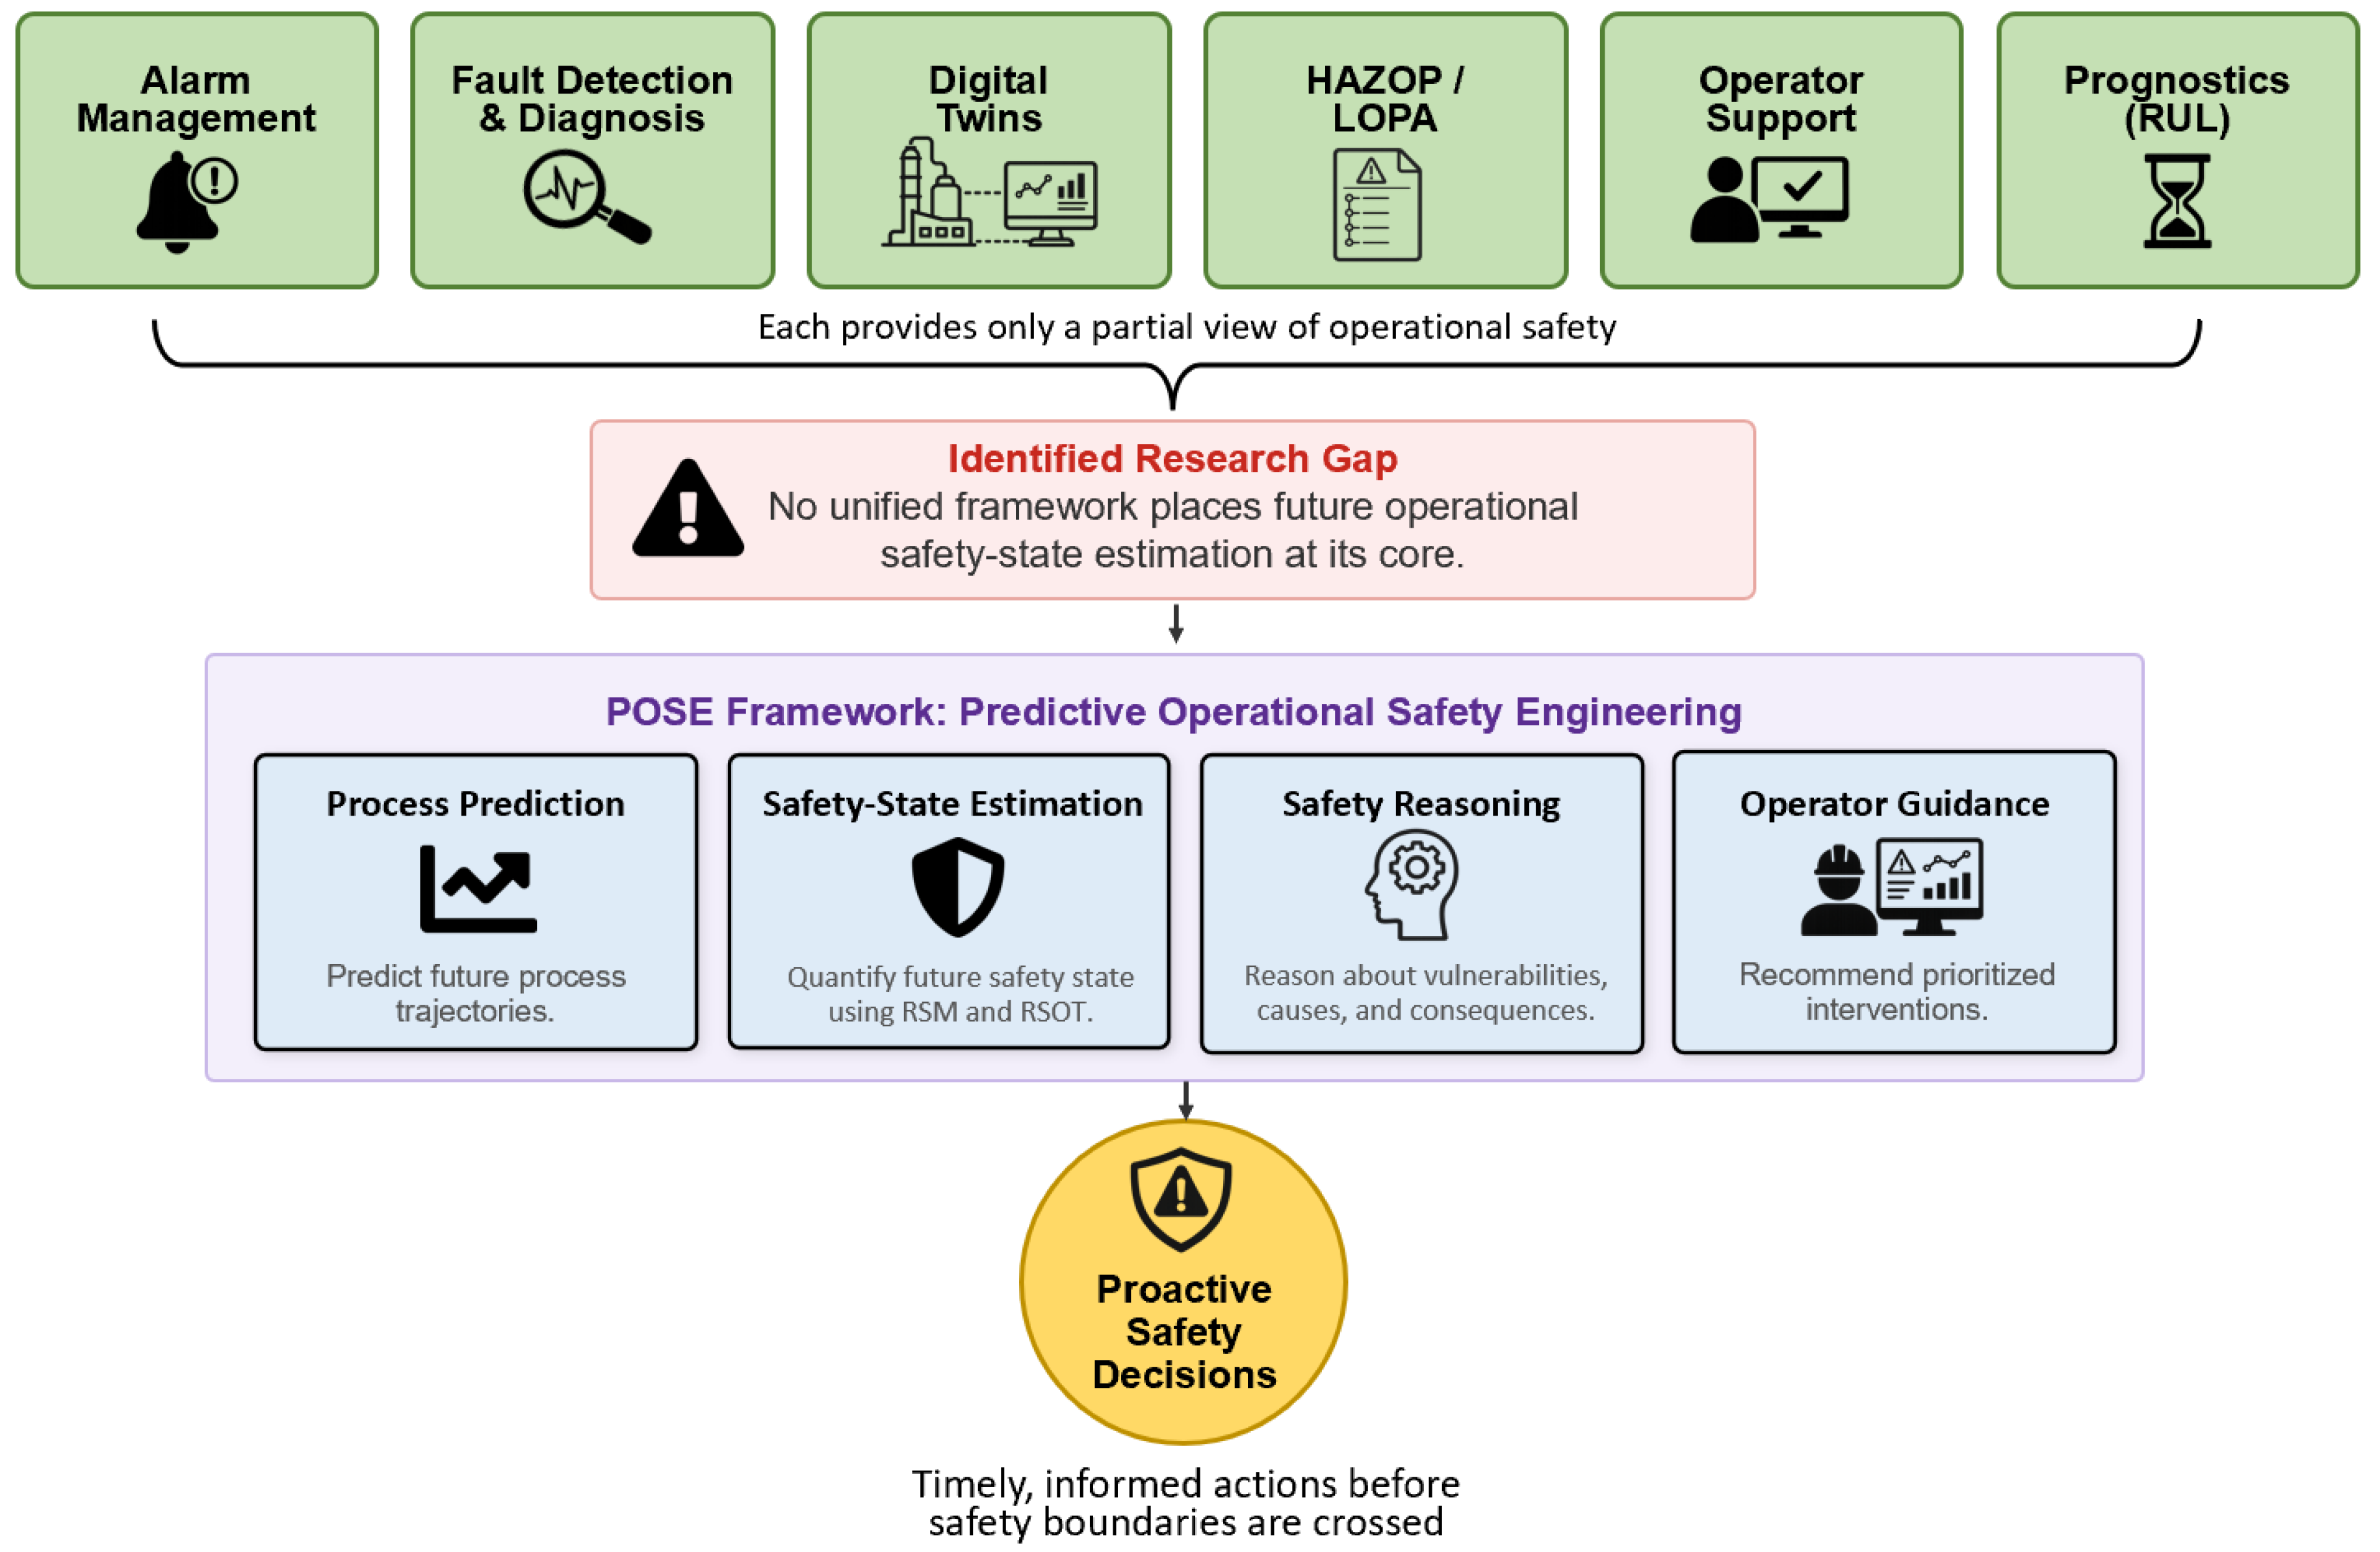
Figure 6.
The three-pillar architecture of Predictive Operational Safety Engineering (POSE). Plant data, process models, and safety knowledge feed into Predictive Process Intelligence, which generates predicted trajectories, hidden-state estimates, and uncertainty bounds. Predictive Safety Intelligence translates these forecasts into safety-state indicators (RSM, RSOT, OVI, PSC, Safety Horizon). Human Safety Intelligence converts these indicators into HAZOP-informed, safeguard-aware, ranked operator guidance. The bottom panel contrasts current practice (alarms, fault labels, reactive response) with the POSE paradigm (safety-state forecast, time-to-unsafe-state, predictive intervention).
Figure 6.
The three-pillar architecture of Predictive Operational Safety Engineering (POSE). Plant data, process models, and safety knowledge feed into Predictive Process Intelligence, which generates predicted trajectories, hidden-state estimates, and uncertainty bounds. Predictive Safety Intelligence translates these forecasts into safety-state indicators (RSM, RSOT, OVI, PSC, Safety Horizon). Human Safety Intelligence converts these indicators into HAZOP-informed, safeguard-aware, ranked operator guidance. The bottom panel contrasts current practice (alarms, fault labels, reactive response) with the POSE paradigm (safety-state forecast, time-to-unsafe-state, predictive intervention).
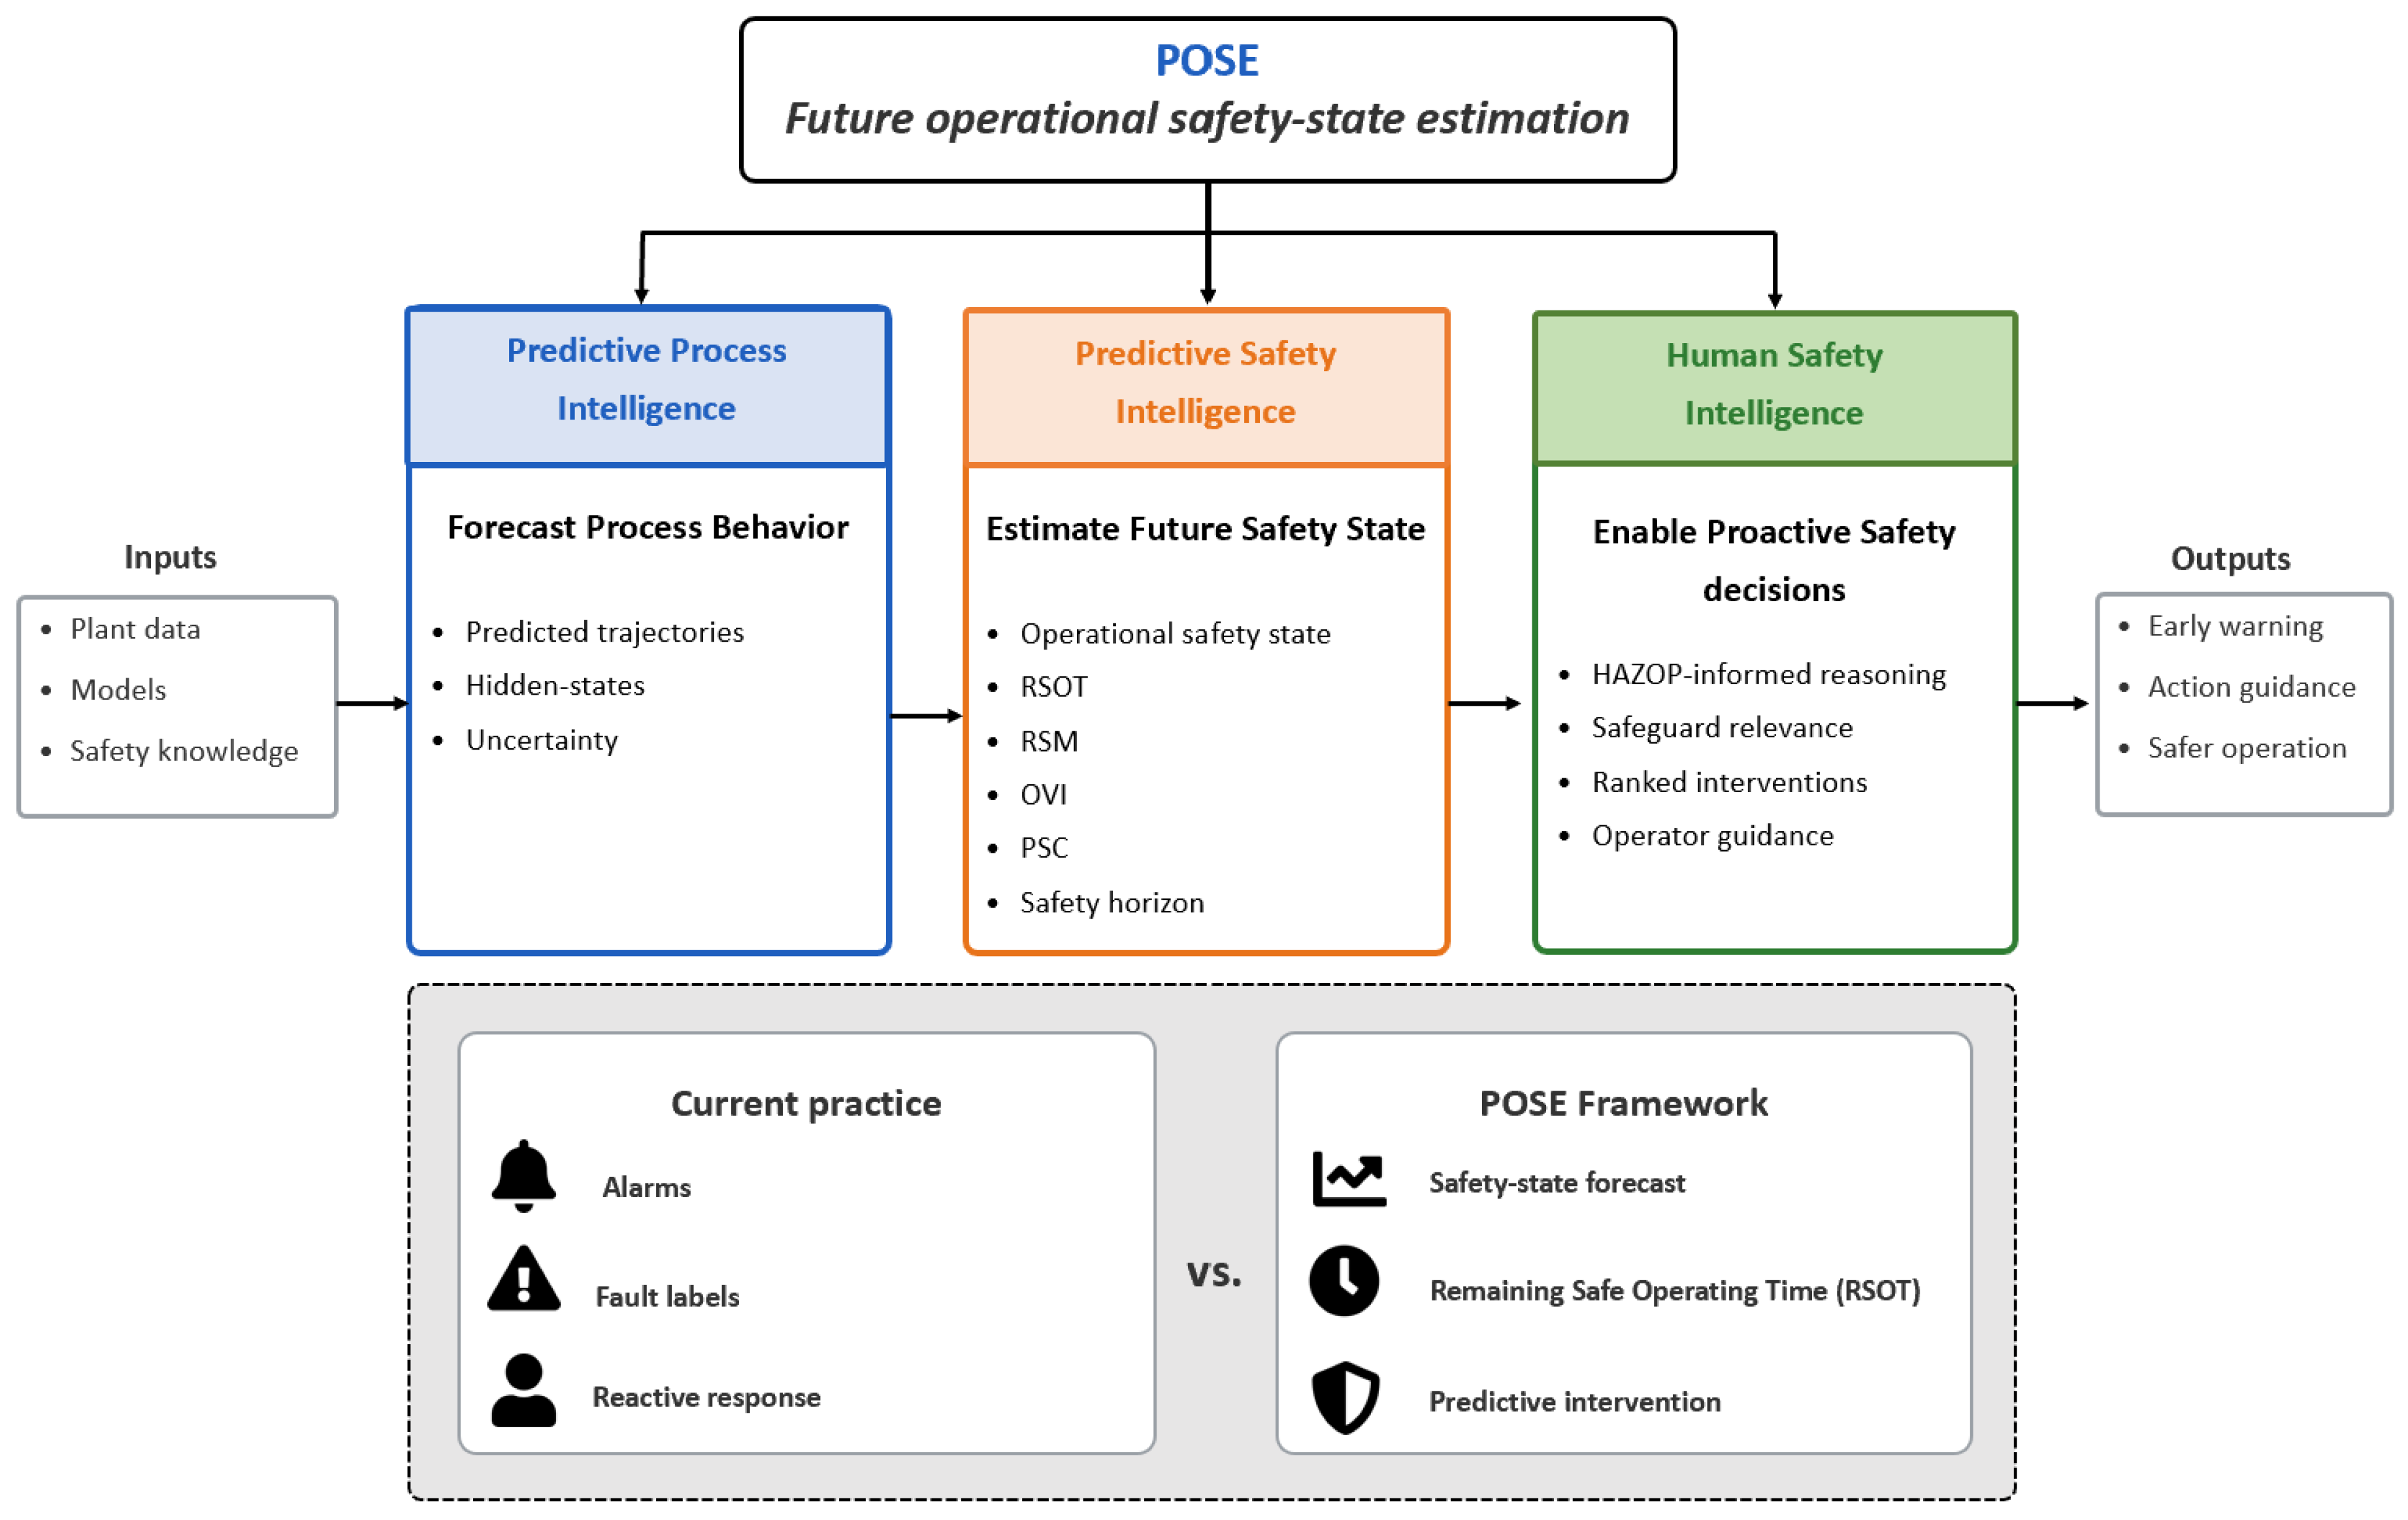
Figure 7.
Relationship among Remaining Safety Margin (RSM), Remaining Safe Operating Time (RSOT), Operational Vulnerability Index (OVI), and the intervention window. The predicted safety-state trajectory (blue, with uncertainty band) rises toward the safety boundary (red dashed line). RSM is the vertical distance remaining at the current time ; RSOT is the horizontal interval from to the predicted boundary crossing at ; OVI increases as the trajectory accelerates toward the boundary. The shaded green region is the intervention window available to the operator before safe operation is lost.
Figure 7.
Relationship among Remaining Safety Margin (RSM), Remaining Safe Operating Time (RSOT), Operational Vulnerability Index (OVI), and the intervention window. The predicted safety-state trajectory (blue, with uncertainty band) rises toward the safety boundary (red dashed line). RSM is the vertical distance remaining at the current time ; RSOT is the horizontal interval from to the predicted boundary crossing at ; OVI increases as the trajectory accelerates toward the boundary. The shaded green region is the intervention window available to the operator before safe operation is lost.
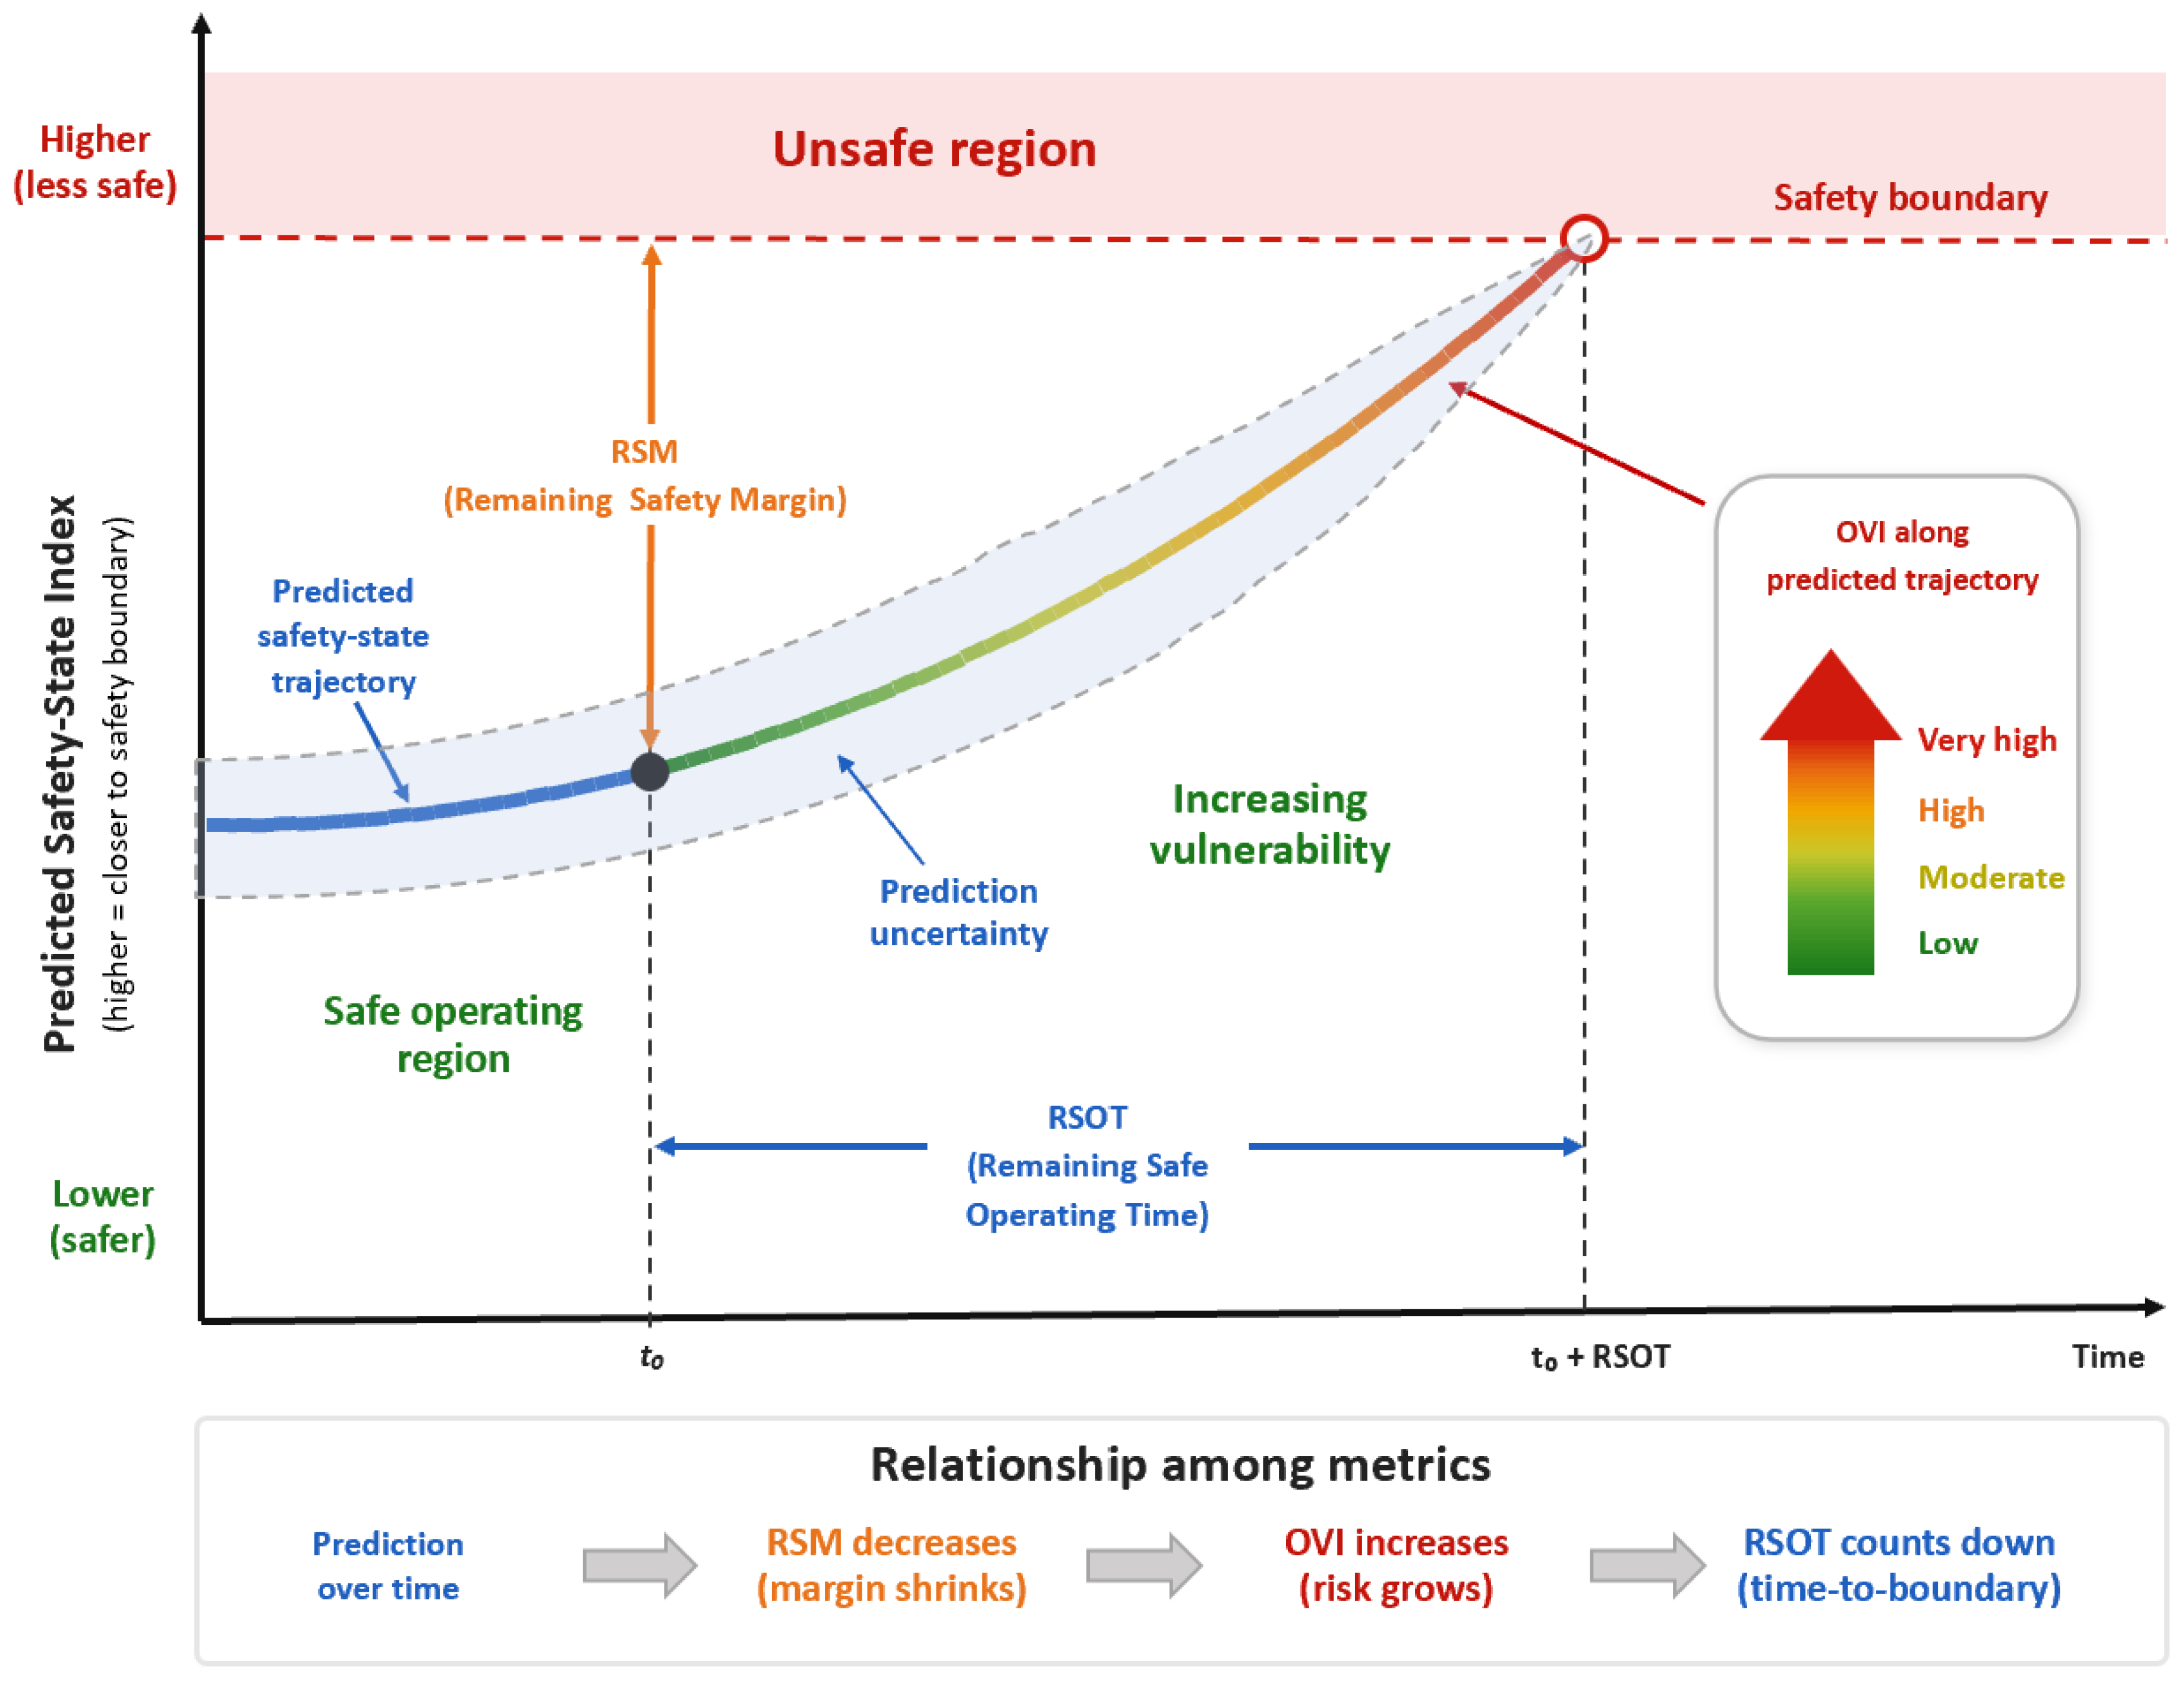
Figure 8.
Three-layer reference architecture of the Predictive Operational Safety Twin (POST). Real-time plant information (process measurements, historian data, alarm events, equipment state, and operating context) enters Layer I (Predictive Process Intelligence), which performs state synchronization, hybrid process modelling, future trajectory prediction, and uncertainty quantification. Layer II (Predictive Safety Intelligence) translates these trajectories into safety-state metrics: RSM, RSOT, OVI, PSC, Alarm Flood Horizon, and boundary-crossing forecasts. Layer III (Human Safety Intelligence) applies HAZOP/LOPA reasoning, safeguard status assessment, and explainable guidance to produce ranked interventions and operator decision support. Updated plant response closes the feedback loop. POST integrates process prediction, predictive safety metrics, and human-centered safety reasoning into a unified operational safety architecture.
Figure 8.
Three-layer reference architecture of the Predictive Operational Safety Twin (POST). Real-time plant information (process measurements, historian data, alarm events, equipment state, and operating context) enters Layer I (Predictive Process Intelligence), which performs state synchronization, hybrid process modelling, future trajectory prediction, and uncertainty quantification. Layer II (Predictive Safety Intelligence) translates these trajectories into safety-state metrics: RSM, RSOT, OVI, PSC, Alarm Flood Horizon, and boundary-crossing forecasts. Layer III (Human Safety Intelligence) applies HAZOP/LOPA reasoning, safeguard status assessment, and explainable guidance to produce ranked interventions and operator decision support. Updated plant response closes the feedback loop. POST integrates process prediction, predictive safety metrics, and human-centered safety reasoning into a unified operational safety architecture.
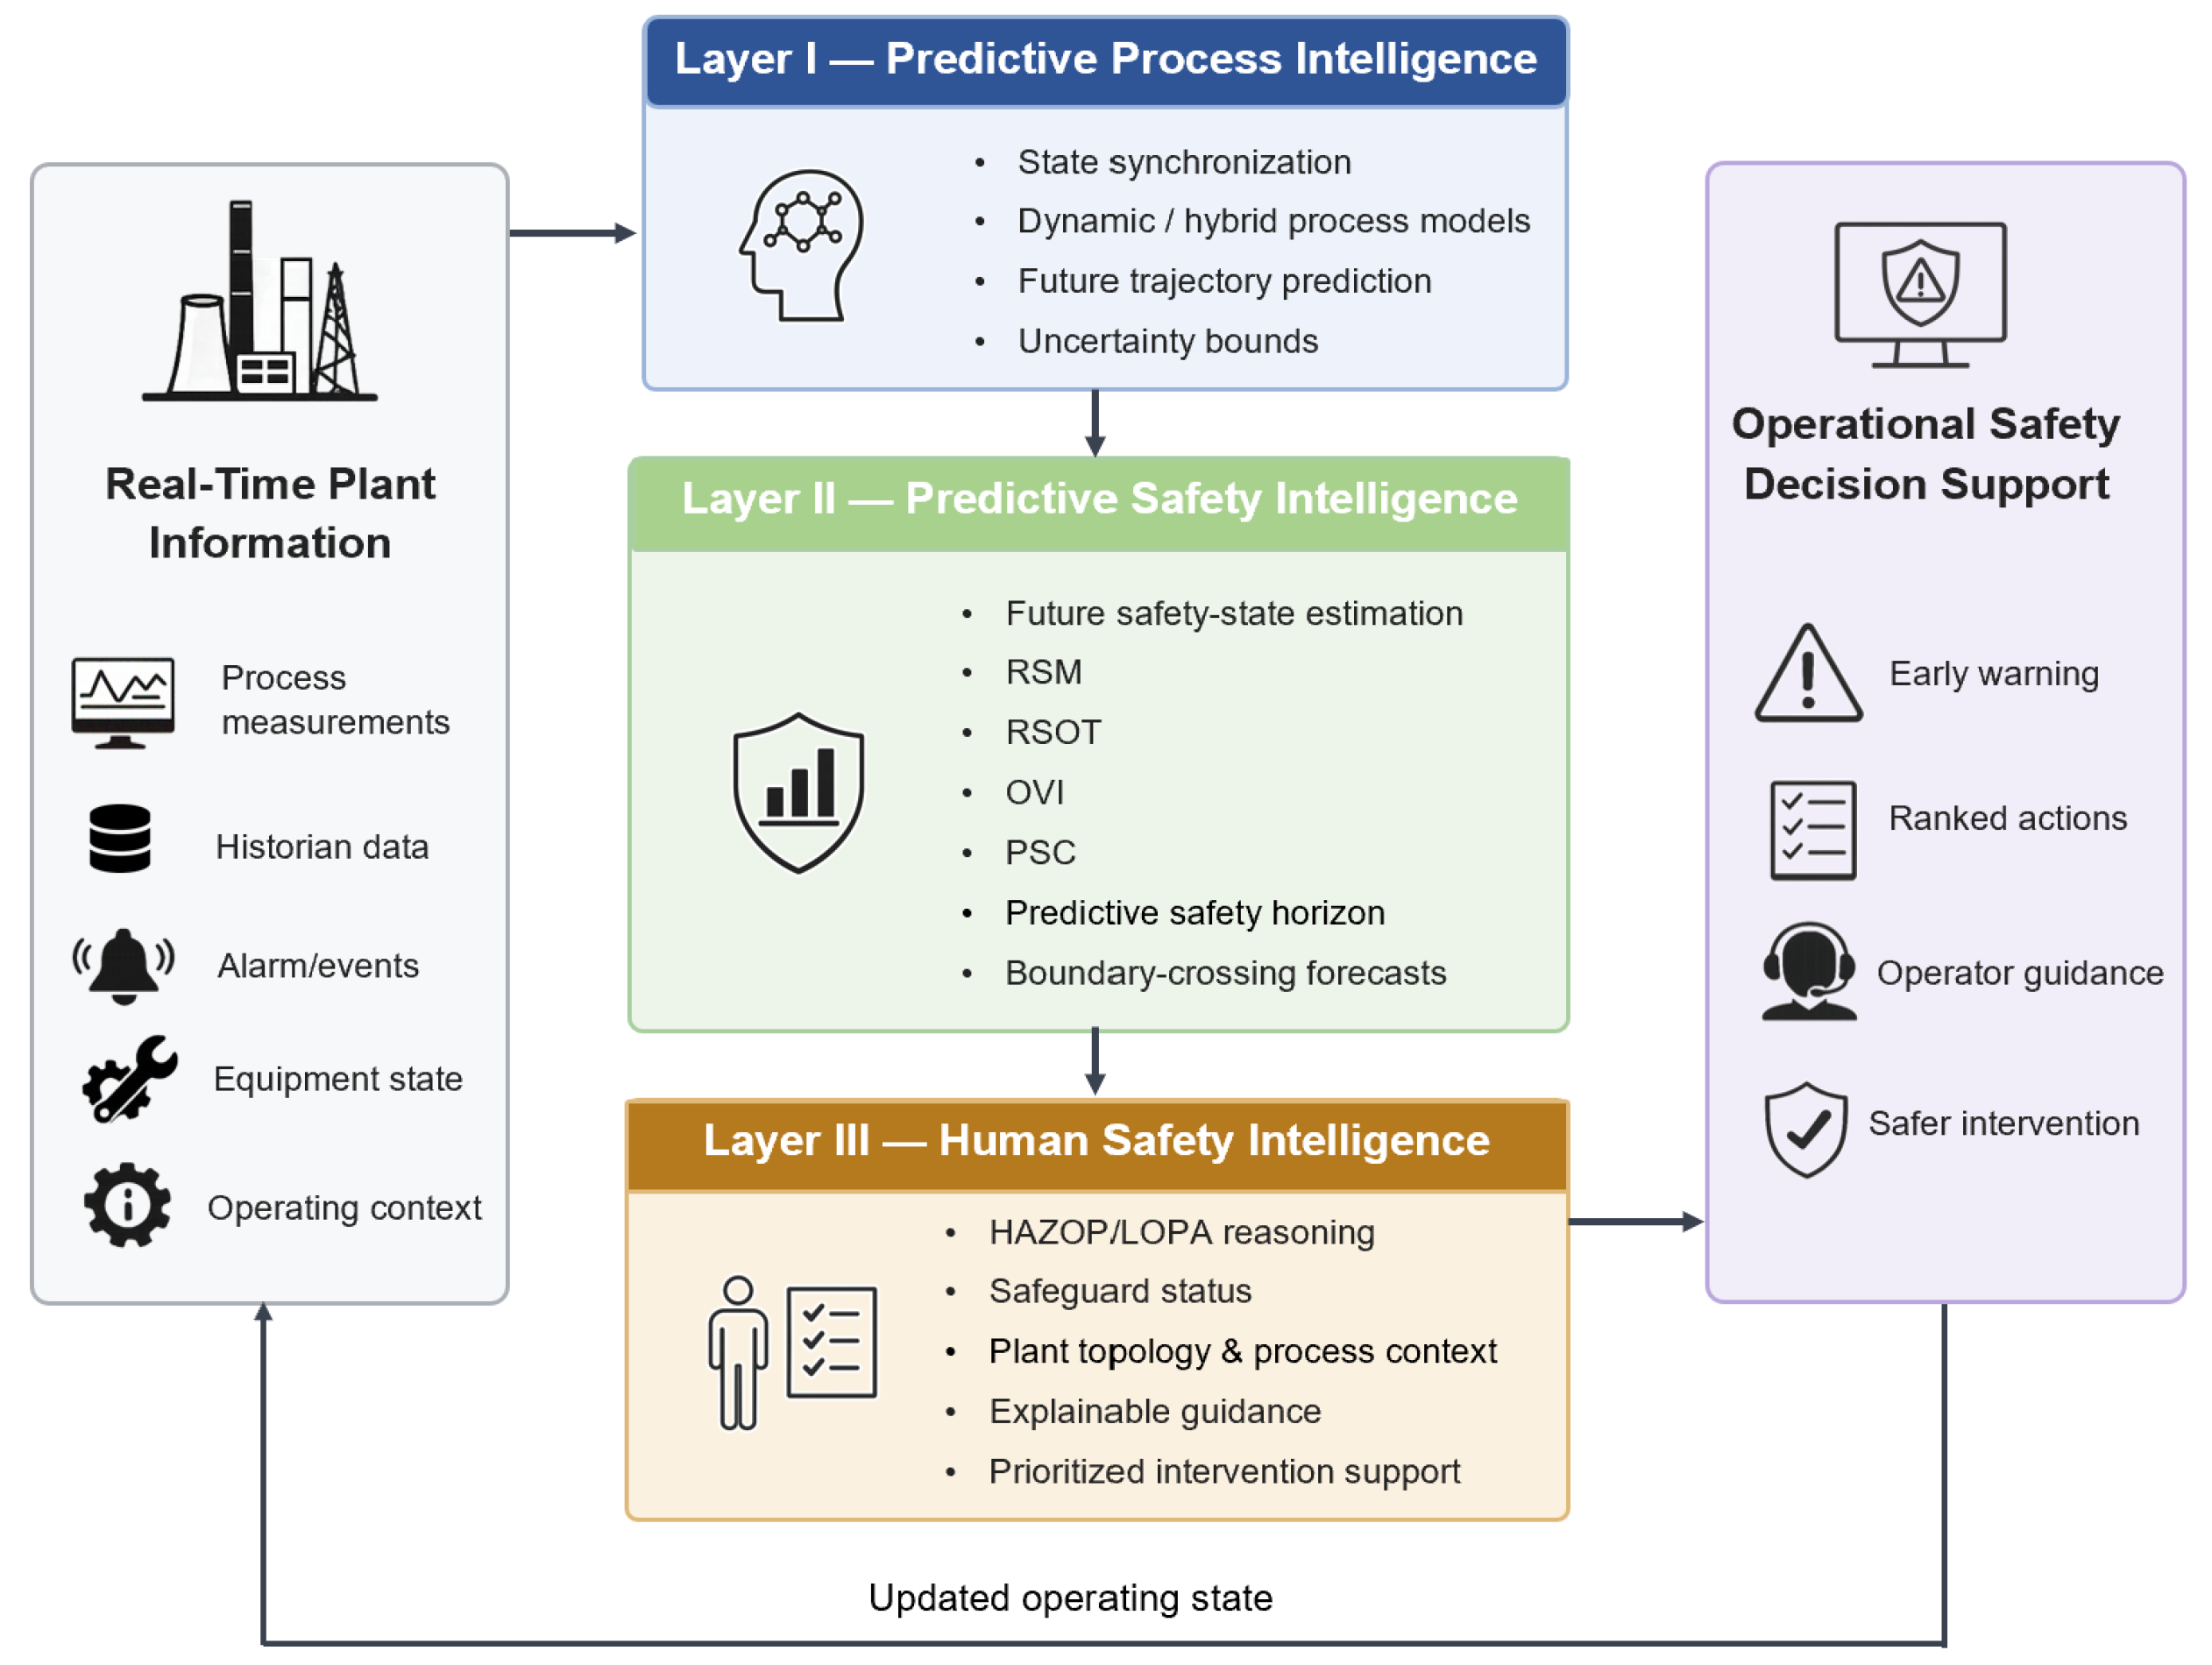
Figure 9.
Research roadmap for Predictive Operational Safety Engineering (POSE) across three sequential phases. Phase I (Foundation) establishes metric definitions for RSM, RSOT, OVI, and PSC, develops the POST reference architecture, and benchmarks the framework on representative processes including the Tennessee Eastman Process. Phase II (Validation) conducts industrial case studies, integrates dynamic HAZOP and safeguard reasoning, investigates real-time and edge deployment, and evaluates operator-interface and human-factors dimensions. Phase III (Application) pursues plant-wide safety twins, regulatory and governance acceptance, cross-industry transfer, and semi-autonomous safety intelligence under human oversight. Five cross-cutting themes (uncertainty and confidence, explainability, data quality and governance, human-centered design, and lifecycle model management) span all phases.
Figure 9.
Research roadmap for Predictive Operational Safety Engineering (POSE) across three sequential phases. Phase I (Foundation) establishes metric definitions for RSM, RSOT, OVI, and PSC, develops the POST reference architecture, and benchmarks the framework on representative processes including the Tennessee Eastman Process. Phase II (Validation) conducts industrial case studies, integrates dynamic HAZOP and safeguard reasoning, investigates real-time and edge deployment, and evaluates operator-interface and human-factors dimensions. Phase III (Application) pursues plant-wide safety twins, regulatory and governance acceptance, cross-industry transfer, and semi-autonomous safety intelligence under human oversight. Five cross-cutting themes (uncertainty and confidence, explainability, data quality and governance, human-centered design, and lifecycle model management) span all phases.
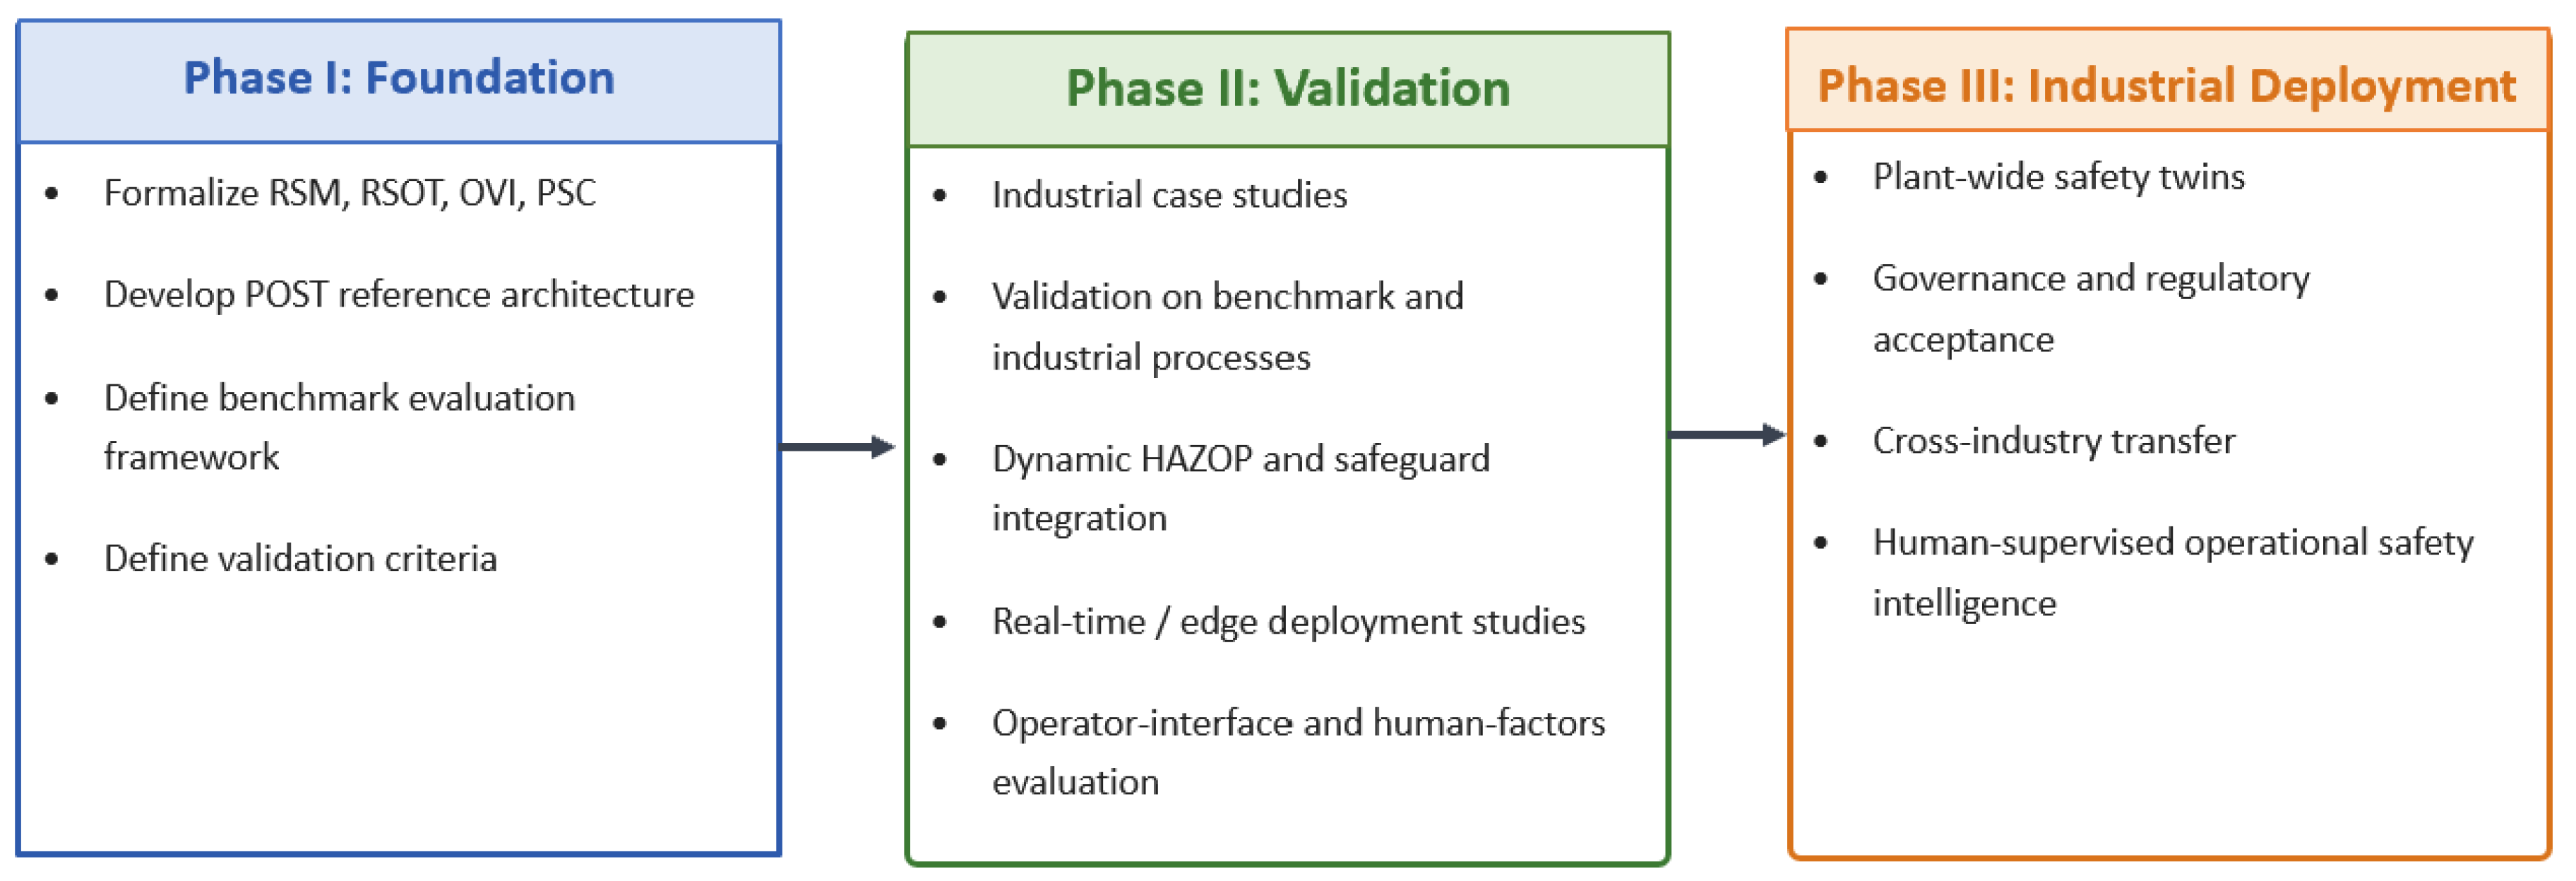

Table 1.
Research streams and remaining gaps motivating Predictive Operational Safety Engineering.
| Research stream | Primary object | Typical output | Remaining gap for POSE |
|---|---|---|---|
| Alarm management [5,6] | Alarm events | Alarm priority, sequences, floods | Does not estimate future safety-state trajectory |
| Fault diagnosis [40,44] | Fault class and occurrence | Fault label, residual, probability | Does not translate diagnosis into RSOT or RSM |
| Digital twins [13,14] | Process state | Predicted variables, virtual representation | Does not always translate prediction into safety state |
| HAZOP/LOPA [4,60] | Hazard scenarios/barriers | Deviations, causes, safeguards | Usually offline or periodically updated |
| Operator support [73,76] | Human decision quality | Displays, explanations, guidance | Lacks predictive safety-time reasoning |
| Prognostics/PHM [79] | Asset health | RUL, failure probability | Equipment-centered, not process-safety-centered |
Table 2.
What POSE adds beyond existing safety paradigms. Each row identifies what an established discipline provides, where it stops, and the specific layer POSE adds.
Table 2.
What POSE adds beyond existing safety paradigms. Each row identifies what an established discipline provides, where it stops, and the specific layer POSE adds.
| Existing paradigm | Primary purpose | Typical outputs | What it cannot provide | What POSE adds |
|---|---|---|---|---|
| Alarm management [5,6] | Detect and prioritize alarm events | Alarm state, priority rank, flood pattern | Safety-state forecast before alarm activation | RSM and RSOT as pre-alarm leading indicators; OVI ranks urgency before alarms fire |
| Fault detection & diagnosis [40,44] | Identify fault occurrence and type | Fault label, fault probability, root-cause rank | How safety margins evolve if no action is taken | Converts fault evidence into a safety-state trajectory; PSC estimates whether an action can be completed in time |
| Digital twins [13,14,52] | Replicate and predict process state | Predicted T, P, flow, composition | HAZOP-linked safety-boundary assessment; operator intervention guidance | POST: reorients twin output from process fidelity to RSM, RSOT, OVI evaluated against the HAZOP safety envelope |
| HAZOP / LOPA [4,60,63] | Identify hazard scenarios and assess safeguard sufficiency | Deviation lists, safeguard evaluations, SIL requirements | Continuous online trajectory interpretation during operation | Activates HAZOP knowledge dynamically; barrier status propagated into OVI in real time |
| Dynamic risk assessment [20,69,86] | Update event probability from evidence | Updated event probability | Time-to-safety-boundary; ranked intervention guidance | RSOT: translates probability language into intervention-window language; not how likely? but how long? and which action? |
| Prognostics & PHM [79,80,82] | Estimate remaining useful life of assets | RUL distribution; degradation trajectory | Multi-variable, HAZOP-linked process safety horizon | RSOT: generalizes RUL from single-asset thresholds to multi-variable, HAZOP-defined safety boundaries |
| Operator decision support [73,76] | Improve human response to process information | Alarm displays, XAI explanations | Proactive safety-state forecasts; intervention-time ranking | PSC and OVI: time-stamped, safety-ranked intervention guidance before alarms activate (Layer III of POST) |
Table 3.
Why six commonly cited analogues are not POSE: each concept addresses a different primary question and imposes qualitatively different obligations from RSM, RSOT, OVI, and PSC.
Table 3.
Why six commonly cited analogues are not POSE: each concept addresses a different primary question and imposes qualitatively different obligations from RSM, RSOT, OVI, and PSC.
| Concept | Primary question answered | Typical output | Why it is not POSE |
|---|---|---|---|
| Time-to-alarm | When will a single tag hit a preset alarm limit? | Extrapolated scalar time | Single-variable; no HAZOP linkage; no multi-variable trajectory; no uncertainty quantification |
| Remaining useful life (RUL) | When will an asset degrade to failure? | Asset-level life estimate | Equipment-centered; does not address safety-boundary proximity, safeguard status, or operator intervention windows |
| Risk Priority Number (RPN) | How severe, likely, and detectable is a failure mode? | Static ordinal score | Assigned offline at design time; not updated from the predicted process trajectory; no time-to-boundary output |
| Dynamic risk index | How has event likelihood changed given current evidence? | Updated probability or risk scalar | Probability-centered; does not produce margin depletion rates, RSOT estimates, or ranked operator-intervention guidance |
| Alarm priority | Which active alarm deserves the most immediate attention? | Priority class or rank | Reactive to alarm activation; does not forecast margin trajectories before alarms fire; no RSOT-equivalent output |
| MPC constraint margins | How close are process variables to control constraint bounds? | Constraint distance under active controller | Serves automatic control-enforcement; not designed for operator safety reasoning or HAZOP-linked intervention-time estimation |
Table 4.
Comparison of early warning / incipient fault detection and POSE.
| Aspect | Early warning / incipient fault detection | POSE |
|---|---|---|
| Primary question | Is an abnormality developing before the alarm fires? | How will safety margins evolve, and how much intervention time remains? |
| Main output to operator | Warning signal, fault precursor, or predictive alarm | RSM, RSOT, OVI, PSC, and ranked intervention guidance |
| Time logic | Before alarm activation or fault classification | Before safety boundary is approached |
| Safety knowledge | Detection thresholds or model-based signatures | HAZOP-informed safety boundaries, safeguard states, consequence severity |
| Operator value | Alerts operator to a developing situation | Quantifies urgency, ranks interventions, and estimates action feasibility |
Table 5.
Contrast between current industrial safety practice and the POSE paradigm.
| Dimension | Current practice | POSE |
|---|---|---|
| What is monitored? | Process variables and alarm threshold crossings | Operational safety state as a dynamic, predicted trajectory |
| When does the system respond? | After alarm limits are exceeded | Before safety boundaries are approached |
| Primary output to operator | Alarm activation, fault label, risk probability | RSM, RSOT, OVI, and ranked intervention guidance |
| Time orientation | Present and near past | Predicted future under the current operating trajectory |
| Safety knowledge application | Offline in HAZOP documents | Connected online to trajectory predictions and deviation reasoning |
| Safety boundary definition | Single-variable alarm setpoints | Multi-variable, HAZOP-informed safety envelope |
| Treatment of uncertainty | Often implicit or separate from alarms and diagnosis | Explicitly linked to safety horizon and predictive safety confidence |
Table 6.
Functional taxonomy of POSE.
| POSE pillar | Representative inputs | Core functions | Representative outputs |
|---|---|---|---|
| Predictive Process Intelligence | Process historian data, current measurements, control actions, equipment state, disturbances | State estimation, trajectory forecasting, uncertainty quantification | Predicted trajectories, estimated hidden states, uncertainty bounds |
| Predictive Safety Intelligence | Process trajectories, alarm limits, safe operating envelopes, safeguard thresholds, topology | Safety-state classification, margin estimation, time-to-boundary estimation, vulnerability scoring | RSM, RSOT, OVI, PSC, Safety Horizon, boundary-crossing forecasts |
| Human Safety Intelligence | Safety-state forecasts, HAZOP knowledge, procedures, safeguard status, operator context | Explanation, action ranking, consequence interpretation, interface design | Ranked interventions, HAZOP-linked explanations, safeguard status, operator guidance |
Table 7.
Core safety metrics of POSE and their operational interpretation.
| Metric | Definition | Operational question answered |
|---|---|---|
| Remaining Safety Margin (RSM) | Normalized remaining distance to the nearest binding safety boundary | How far is the process from a safety boundary? |
| Remaining Safe Operating Time (RSOT) | Predicted time until RSM reaches zero under current trajectory | How much time remains before a boundary is crossed? |
| Operational Vulnerability Index (OVI) | Bounded weighted composite of proximity, depletion rate, consequence, safeguard unavailability, and uncertainty | How urgent is intervention for the governing scenario? |
| Predictive Safety Confidence (PSC) | Probability that first-passage time exceeds the time required for a specified intervention | What is the probability that action can be completed in time? |
Table 8.
Reference functions of a Predictive Operational Safety Twin.
| POST layer | Purpose | Example output |
|---|---|---|
| State synchronization | Estimate the current process and safeguard state from online data | Current operating state, active constraints, available safeguards |
| Trajectory prediction | Forecast future process evolution under current or candidate actions | Predicted pressure, temperature, flow, composition, or inventory trajectories |
| Safety-state translation | Convert predicted trajectories into safety regimes and margins | Normal, vulnerable, critical, or unsafe forecast; RSM; OVI |
| Time-to-boundary estimation | Estimate when relevant safety boundaries may be reached | RSOT, alarm flood horizon, trip horizon, confidence interval |
| Safety reasoning | Link predicted deviations to causes, consequences, and safeguards | HAZOP-linked explanation and consequence pathway |
| Decision support | Rank interventions according to urgency, feasibility, and safety value | Prioritized action guidance with rationale and uncertainty |
Table 9.
Ten principles of Predictive Operational Safety Engineering and their meaning for POSE research and practice.
Table 9.
Ten principles of Predictive Operational Safety Engineering and their meaning for POSE research and practice.
| # | Principle | Meaning for POSE |
|---|---|---|
| 1 | Safety is a dynamic state, not merely an event | Forecast safety evolution continuously; systems that respond only to discrete events forfeit the prediction window available beforehand |
| 2 | Future safety-state prediction provides earlier intervention value than present alarm status alone | Predicting safety degradation before alarm limits are reached provides substantially greater intervention time [6] |
| 3 | Alarms are symptoms of an evolving safety state, not the safety state itself | Use alarms as evidence of safety-state change; alarms cannot describe how margins are evolving or when boundaries will be crossed [5,6] |
| 4 | Fault diagnosis is necessary but insufficient for safety reasoning | Convert diagnostic outputs into safety-state trajectories; detection accuracy alone does not quantify how rapidly safety margins are depleting [7,40] |
| 5 | For safety-critical applications, digital twins should predict safety meaning, not only process variables | Map process forecasts into RSM, RSOT, OVI, and PSC before they become actionable for operational safety [13,14] |
| 6 | Safety intelligence must integrate physics, data, knowledge, and human expertise | Combine first-principles models, data-driven methods, HAZOP/LOPA knowledge, safeguard states, and operator expertise; no single source is sufficient [3,22] |
| 7 | Prediction without interpretation does not improve safety | Apply HAZOP-informed consequence and safeguard reasoning to translate process forecasts into operator-relevant guidance [27,67] (Sections 6–7) |
| 8 | Operators remain central to industrial safety decisions | Design for situation awareness, trust, and action; predictive information must match human cognitive needs to improve rather than impair decision making [76] (Section 7) |
| 9 | Safety metrics must be predictive | RSM, RSOT, OVI, and PSC complement fault labels, alarm counts, and diagnostic outputs by translating them into predictive safety-state information that quantifies margin, intervention time, vulnerability, and confidence |
| 10 | Validation is mandatory | Benchmark, calibrate, explain, and test human impact; operators must understand and trust predictions for POSE to improve safety-critical decisions (Section 14) |
Table 10.
Candidate benchmark systems and industrial applications for POSE validation.
| System | Process type | Key safety challenge | POSE relevance |
|---|---|---|---|
| Tennessee Eastman Process [11] | CSTR with recycle | Multiple fault modes, sensor failures | De facto FDD benchmark with rich alarm and measurement data |
| CO2 capture plant | Absorption and stripping | Solvent flooding, column pressure deviation | Dynamic safety margins under varying load conditions |
| Sulfuric acid converter | Catalytic SO2 oxidation | Catalyst deactivation, bed temperature runaway | RSOT relevant to progressive temperature excursion |
| Distillation column | Vapor–liquid separation | Hydraulic flooding, weeping, product deviation | Multi-variable safety boundary estimation |
| Ammonia synthesis loop | High-pressure catalytic reaction | Pressure safety, catalyst activity loss | RSOT estimation under high-pressure upsets |
| Hydrogen production unit | Steam reforming | Reformer tube integrity, H2 composition | Equipment–process coupled safety horizon |
Disclaimer/Publisher’s Note: The statements, opinions and data contained in all publications are solely those of the individual author(s) and contributor(s) and not of MDPI and/or the editor(s). MDPI and/or the editor(s) disclaim responsibility for any injury to people or property resulting from any ideas, methods, instructions or products referred to in the content. |
© 2026 by the authors. Licensee MDPI, Basel, Switzerland. This article is an open access article distributed under the terms and conditions of the Creative Commons Attribution (CC BY) license (http://creativecommons.org/licenses/by/4.0/).
Copyright: This open access article is published under a Creative Commons CC BY 4.0 license, which permit the free download, distribution, and reuse, provided that the author and preprint are cited in any reuse.


