

Submitted:
06 July 2026
Posted:
07 July 2026
You are already at the latest version
Abstract
A ratiometric electrochemical sensor based on poly(neutral red)-silver nanorods-carbon nanotubes (PNR-AgNRs/CNTs) composite was constructed for rapid, sensitive, and an-ti-interference detection of histamine in crayfish (Procambarus clarkii). Silver nanorods (AgNRs) were synthesized via a liquid-phase reduction method using 2-mercaptobenzoic acid (2-MBA) as both reducing and stabilizing agent, and subse-quently composited with carbon nanotubes (CNTs) through ultrasonic dispersion to form a three-dimensional conductive network. Poly(neutral red) (PNR) was electro-chemically polymerized onto the AgNRs-CNTs modified glassy carbon electrode (GCE) surface via cyclic voltammetry, serving as an electrochemical signal probe. The resulting PNR-AgNRs-CNTs/GCE exhibited significantly enhanced electrochemical performance with approximately 5-fold increase in electrochemically active surface area compared to bare GCE. Histamine competitively inhibited the electrochemical signal of PNR without affecting the AgNRs signal, enabling ratiometric detection based on the current signal ratio (IPNR/IAgNRs). Under optimized conditions (pH 6.0, adsorption time 6 min, material loading 0.08 mg/cm²), the IPNR/IAgNRs ratio exhibited a good linear relationship with the logarithm of histamine concentration in the range of 1–150 μmol/L, with a linear equa-tion of I/I = −0.3152 ln(C) + 5.0613, correlation coefficient R² = 0.995, and detection limit of 0.16 μmol/L (S/N = 3). The sensor demonstrated excellent anti-interference ability against common interfering substances such as Na⁺, Ca²⁺, K⁺, PO₄³⁻, and NO₃⁻. The relative standard deviations (RSD) for continuous 8-day detection and 8 parallel electrodes were 2.56% and 1.28%, respectively, indicating superior stability and reproducibility. The spiked recoveries in crayfish samples ranged from 95.9% to 102.3% with RSD < 3%, showing no significant difference from the national standard method (GB 5009.208-2016). The developed sensor effectively eliminated interference from complex biological ma-trices through the dual-signal ratio strategy and solved the detection problem of hista-mine lacking direct electrochemical response, providing a new approach for rapid on-site detection of histamine in aquatic products.
Keywords:
histamine
; ratiometric electrochemical sensor
; silver nanorods
; carbon nanotubes
; poly(neutral red)
; crayfish
; freshness detection
1. Introduction
Aquatic products represent a crucial component of the global food supply chain, providing abundant high-quality proteins, polyunsaturated fatty acids, vitamins, and minerals that contribute to dietary optimization and alleviation of food shortages [1]. The global aquatic industry has achieved an annual output value exceeding 400 billion USD, creating over 60 million employment opportunities in coastal countries and regions. China, as the world's largest producer and consumer of aquatic products, reported a total output value of aquatic industry surpassing 1.3 trillion RMB in 2023, with aquaculture production ranking first globally for 33 consecutive years [2]. Crayfish (Procambarus clarkii), as an important economic aquatic species in China, reached a total production of 2.89 million tons in 2022, with a comprehensive output value exceeding 458 billion RMB, encompassing complete industrial chains from ecological aquaculture, cold chain transportation, food deep processing to catering services [3].
However, aquatic products are highly susceptible to microbial contamination and enzymatic spoilage during harvesting, storage, transportation, and processing due to their high moisture content, rich protein composition, and active endogenous enzymes. This spoilage not only leads to nutrient loss and degradation of edible quality but also generates harmful substances, posing food safety risks to consumers and causing severe economic losses to enterprises [4,5]. Therefore, establishing scientific and reliable freshness evaluation methods for aquatic products is of great significance for ensuring food safety, protecting consumer rights, and promoting high-quality industrial development.
Freshness is a critical indicator for evaluating the quality of aquatic products, directly influencing sensory characteristics, nutritional composition, and processing performance. During the spoilage process, adenosine triphosphate (ATP) in aquatic products undergoes stepwise decomposition under enzymatic action, successively producing purine compounds such as hypoxanthine (Hx) and xanthine (Xa); histidine is decarboxylated by microbial histidine decarboxylase to generate histamine; and trimethylamine oxide is reduced to trimethylamine (TMA) and other volatile basic nitrogen compounds under microbial action [6,7,8]. Consequently, metabolites including xanthine, hypoxanthine, histamine, and trimethylamine exhibit significant correlations with spoilage degree and can serve as characteristic freshness biomarkers. Among these, histamine, as one of the most toxic biogenic amines, is particularly important for assessing the freshness and safety of aquatic products [9].
Histamine, chemically known as 2-(4-imidazolyl)ethylamine, is a common bioactive amine widely present in seafood, fermented foods, pickled products, and certain beverages [10]. During food spoilage, histamine is produced from histidine in proteins under the catalytic action of microbial histidine decarboxylase, with its generation significantly influenced by storage temperature and pH conditions [11]. As a potent foodborne toxin, high-dose histamine intake can cause severe histamine poisoning. Concentrations of 8–40 ppm may induce mild food poisoning, while levels exceeding 100 ppm can lead to headache, nausea, vomiting, migraine, palpitations, blood pressure fluctuations, and localized allergic reactions; in extreme cases, life-threatening conditions may occur [12,13]. The European Union food safety standard stipulates that histamine content in fresh fish must not exceed 200 mg/kg, and fish products are deemed spoiled when histamine concentration reaches 50 mg/kg (approximately 450 μmol/L), with concentrations exceeding 500 mg/kg (approximately 4500 μmol/L) posing potentially fatal risks [14]. China's national standard GB 2733-2015 specifies that histamine content in fresh and frozen aquatic products must not exceed 40 mg/kg [15]. Therefore, rapid and accurate detection of histamine is essential for ensuring food quality and protecting consumer health.
Currently, histamine detection methods mainly include high-performance liquid chromatography (HPLC), gas chromatography (GC), fluorescence analysis, molecular imprinting technology, and enzyme-linked immunosorbent assay (ELISA) [16,17,18,19]. Although these methods offer high detection precision, they generally suffer from expensive instrumentation, tedious sample pretreatment, high technical requirements for operation, and long detection cycles, making them unsuitable for on-site rapid screening and real-time monitoring. In recent years, electrochemical sensing technology has attracted widespread attention in food safety detection due to its advantages of simple operation, low cost, rapid response, and high sensitivity [20,21]. Electrochemical sensors can significantly enhance electron transfer rate and catalytic activity through electrode surface modification with nanomaterials, enabling highly sensitive detection of target analytes. However, histamine molecules inherently lack direct electrochemical activity and cannot be directly detected by electrochemical methods. Furthermore, aquatic products represent complex biological samples with severe matrix interference, which constitutes a critical bottleneck restricting the application of electrochemical detection for histamine in aquatic products [22].
Ratiometric electrochemical sensors, which employ dual-signal output mechanisms, can effectively eliminate or reduce interference from environmental factors such as temperature, pH, and ionic strength, as well as instrument fluctuations, thereby significantly improving the accuracy and reliability of detection results [23,24]. Compared with traditional single-signal sensors, ratiometric sensors introduce an internal reference signal that can effectively eliminate errors arising from electrode modification differences, instrument fluctuations, and environmental condition variations, while also reducing sample matrix interference in complex matrices such as biological and food samples [25].
In this study, we prepared a carbon nanotube-silver nanorod-poly(neutral red) composite material and constructed a ratiometric electrochemical sensor to address the limitations of existing rapid detection technologies for histamine in aquatic products. Since histamine molecules suppress the electrochemical signal of poly(neutral red) on the electrode without affecting the silver nanorod signal, changes in the ratio of the two electrochemical signals enable rapid electrochemical detection of histamine concentration (Scheme 1). The ratiometric detection strategy effectively excludes matrix interference from biological samples, achieving accurate detection of histamine under complex matrix conditions in aquatic products.
2. Materials and Methods
2.1. Reagents and Materials
Silver nitrate (AgNO₃, analytical grade), 2-mercaptobenzoic acid (2-MBA, analytical grade), ammonia solution (25%, analytical grade), carbon nanotubes (CNTs, purity > 95%), neutral red (analytical grade), sodium nitrate (NaNO₃, analytical grade), Nafion solution (5% wt), isopropanol (analytical grade), potassium dihydrogen phosphate, and disodium hydrogen phosphate (analytical grade, for PBS buffer preparation) were purchased from standard chemical suppliers. Histamine standard (purity ≥ 98%) was used for calibration. Potassium ferricyanide (K₃[Fe(CN)₆], analytical grade) and potassium chloride (KCl, analytical grade) were used for electrochemical characterization. Trichloroacetic acid (analytical grade), sodium hydroxide (analytical grade), and other reagents were of analytical grade. Ultrapure water (18.2 MΩ·cm) was used throughout all experiments.
2.2. Instrumentation
Electrochemical measurements were performed on a CHI760E electrochemical workstation (Chenhua Instrument, Shanghai, China) with a conventional three-electrode system: the modified glassy carbon electrode (GCE, diameter 3 mm) as the working electrode, a platinum wire as the counter electrode, and an Ag/AgCl (saturated KCl) electrode as the reference electrode. Scanning electron microscopy (SEM) with energy-dispersive X-ray spectroscopy (EDS) was employed for surface morphology and elemental analysis. X-ray diffraction (XRD) was conducted using an X-ray diffractometer. Raman spectroscopy was performed with a laser confocal micro-Raman system (532 nm laser, 10 mW power). Fourier transform infrared spectroscopy (FTIR) and thermogravimetric analysis (TGA) were used for compositional and thermal stability characterization. A UV-visible spectrophotometer (Yuanxi Instrument, Shanghai, China) was used for the national standard method validation.
2.3. Synthesis of Silver Nanorods (AgNRs)
AgNRs were synthesized via a liquid-phase reduction method with optimization based on literature procedures [26]. Briefly, 155 mg of 2-MBA and 170 mg of AgNO₃ were co-dissolved in 6 mL of deionized water and ultrasonicated for 10 min to ensure complete dissolution. Under continuous ultrasonication, 0.5 mL of concentrated ammonia solution (25%) was added dropwise at approximately 0.1 mL/min. The reaction continued for 20 min under ultrasonication until the solution turned into a yellow transparent liquid that did not fade within 30 s, indicating successful formation of AgNRs. The resulting AgNRs dispersion was transferred to a centrifuge tube and stored at 4 °C for subsequent use.
2.4. Fabrication of PNR-AgNRs-CNTs/GCE
Pretreatment of GCE: The glassy carbon electrode (diameter 3 mm) was sequentially polished on a microcloth with 0.3 μm and 0.05 μm alumina slurry in a figure-8 pattern until a mirror-like surface was achieved. The electrode was thoroughly rinsed with ultrapure water, then sequentially ultrasonicated in nitric acid (1:1, v/v), acetone, and absolute ethanol for 2 min each, followed by rinsing with ultrapure water and drying under nitrogen flow.
Preparation of AgNRs-CNTs/GCE: Accurately weighed 1 mg of CNTs was placed in a 1.5 mL centrifuge tube, followed by sequential addition of 1 mL isopropanol, 100 μL of freshly synthesized AgNRs dispersion, and 10 μL of 5% Nafion solution. The mixture was vortexed for 2 min and then ultrasonicated for 10 min to obtain a uniform AgNRs-CNTs suspension. The pretreated GCE was modified by dropping 2 μL of the suspension four times (8 μL total) onto the electrode surface, with each drop dried under an infrared lamp for 5 min before the next application. After complete drying, the AgNRs-CNTs/GCE was obtained.
Preparation of PNR-AgNRs-CNTs/GCE: A neutral red polymerization solution was prepared by dissolving 2.3 mg of neutral red in 20 mL of 0.1 M phosphate buffer saline (PBS, pH 6.0) containing 0.1 M NaNO₃, followed by 5 min ultrasonication to form a stable magenta solution. The AgNRs-CNTs/GCE was immersed in this solution, and cyclic voltammetry was performed in the potential range of −0.8 to 0.8 V at a scan rate of 50 mV/s for 20 cycles. During the scanning process, oxidation and reduction peaks of neutral red appeared at approximately −0.41 V and −0.36 V, respectively, indicating progressive electrochemical polymerization on the electrode surface. When the current curve gradually stabilized (after approximately 15 cycles), it indicated the formation of a stable polymer film. After polymerization, the electrode was rinsed with ultrapure water three times to remove residual neutral red monomers and dried at room temperature. The resulting PNR-AgNRs-CNTs/GCE was stored at 4 °C for subsequent use.
2.5. Sample Pretreatment
Crayfish samples were purchased from local markets. The pretreatment procedure was performed according to the standard T/QJCIPA 002-2023 "Quality Requirements for Frozen Crayfish Tails" with modifications [27]. Live crayfish were euthanized, and the heads, tails, and shells were removed. The muscle tissue was collected and homogenized using a homogenizer. Accurately weighed 5.0 g of the homogenized sample was transferred to a 50 mL centrifuge tube, and 20 mL of 10% trichloroacetic acid (TCA) solution was added. The mixture was thoroughly vortexed, then transferred to a 55 °C water bath for 10 min, followed by ultrasonic extraction for 20 min (with manual shaking every 5 min). The extract was filtered through filter paper, and the residue was washed with deionized water three times. The filtrates were combined, and the pH was adjusted to neutral using 250 g/L sodium hydroxide solution. The solution was transferred to a 100 mL volumetric flask and diluted to volume. The prepared sample solution was stored at 4 °C and analyzed within 24 h.
2.6. Electrochemical Measurements
All electrochemical measurements were conducted in 0.1 M PBS (pH 6.0) at room temperature. The electrochemical techniques employed included:
Cyclic voltammetry (CV): Potential window −0.8 to 0.8 V, scan rate 50–300 mV/s, used for electrode performance evaluation and PNR polymerization monitoring.
Differential pulse voltammetry (DPV): Potential window −0.8 to 0.6 V, pulse amplitude 50 mV, pulse width 0.05 s, pulse period 0.5 s, quiet time 2 s, used for histamine quantitative detection.
Electrochemical impedance spectroscopy (EIS): Frequency range 0.1 Hz to 100 kHz, amplitude 5 mV, in 5 mmol/L K₃[Fe(CN)₆]/0.1 M KCl solution, used for charge transfer resistance evaluation.
Chronocoulometry (CC): Potential step to 0.5 V, sampling interval 0.1 s, in 5 mmol/L K₃[Fe(CN)₆] solution, used for electrochemically active surface area determination.
2.7. National Standard Method Validation
To validate the accuracy of the proposed electrochemical method, the national standard method (GB 5009.208-2016) was employed as a reference [28]. Briefly, 10 g of crayfish sample was extracted with 20 mL of 10% TCA solution by oscillation for 2 min. The extract was filtered, and 3 mL of n-pentanol was added for liquid-liquid extraction (5 min shaking, repeated three times). The combined organic phase was back-extracted with 3 mL of hydrochloric acid solution (1:1, v/v) three times. The combined aqueous phase (2 mL) was transferred to a 10 mL colorimetric tube, and the absorbance was measured at 480 nm using a UV-visible spectrophotometer after azo-coupling reaction. The histamine concentration was quantified by the standard curve method.
2.8. Data Analysis
The recovery and relative standard deviation (RSD) were calculated according to the following equations:
Recovery (%)=(Cdetected – Cbackground)/Cspiked ×100%
RSD(%)=SD/Mean × 100%
All measurements were performed at least in triplicate, and data were expressed as mean ± standard deviation.
3. Results and Discussions
3.1. Characterization of PNR-AgNRs-CNTs Composite
The surface morphologies of AgNRs/GCE, AgNRs-CNTs/GCE, and PNR-AgNRs-CNTs/GCE were characterized by SEM. As shown in Figure 1A, AgNRs exhibited distinct rod-like structures with lengths of approximately 200–500 nm and diameters of approximately 50–100 nm, distributed relatively uniformly on the GCE surface. After compositing with CNTs (Figure 1B), the AgNRs-CNTs displayed a three-dimensional interlaced network structure where thread-like CNTs and rod-like AgNRs were interconnected, forming a dense conductive network favorable for electron transfer. Following PNR polymerization (Figure 1C), the PNR-AgNRs-CNTs/GCE retained the three-dimensional interlaced structure, indicating that the polymerization process did not disrupt the composite architecture. EDS elemental mapping (Figure 1D–F) revealed uniform distribution of nitrogen (N) and silver (Ag) elements across the composite surface, confirming the successful synthesis of the PNR-AgNRs-CNTs composite.
The XRD patterns of AgNRs, CNTs, AgNRs-CNTs, and PNR-AgNRs-CNTs are presented in Figure 2A. AgNRs and the composite materials exhibited three characteristic diffraction peaks at 38.0°, 41.5°, and 61.4°, corresponding to the (111), (200), and (220) crystal planes of face-centered cubic silver (JCPDS No. 04-0783), respectively, confirming the successful synthesis of AgNRs [29]. CNTs showed a characteristic carbon (002) peak near 26°. The AgNRs-CNTs composite displayed both silver and carbon characteristic peaks, indicating successful integration of the two materials. The XRD pattern of PNR-AgNRs-CNTs was similar to that of AgNRs-CNTs, with slightly reduced peak intensity, suggesting that PNR coating had minimal impact on the crystal structure.
As shown in Figure 2B, CNTs exhibited prominent carbon characteristic peaks at 1345 cm⁻¹ (D band, corresponding to disordered carbon structure) and 1575 cm⁻¹ (G band, corresponding to graphitic carbon structure). AgNRs displayed characteristic silver peaks in the 200–400 cm⁻¹ range. The AgNRs-CNTs composite showed both carbon and silver characteristic peaks, confirming the coexistence of both components. The PNR-AgNRs-CNTs spectrum retained the characteristic peaks of the composite without significant new peaks, indicating that PNR coating did not alter the essential structure of the material.
The FTIR spectra (Figure 2C) showed that CNTs exhibited characteristic peaks at 3400 cm⁻¹ (O–H stretching vibration) and 1630 cm⁻¹ (C=C stretching vibration). In the AgNRs-CNTs composite, the presence of AgNRs enhanced the intensity of CNTs characteristic peaks, indicating interaction between AgNRs and CNTs. PNR-AgNRs-CNTs displayed characteristic absorption peaks of poly(neutral red) in the 1500–1600 cm⁻¹ range, confirming successful PNR coating. The thermogravimetric curves (Figure 2D) revealed that CNTs began significant weight loss above 600 °C, while AgNRs exhibited excellent thermal stability with minimal weight loss. The AgNRs-CNTs composite showed intermediate weight loss behavior. Notably, PNR-AgNRs-CNTs exhibited a slightly higher initial decomposition temperature and reduced weight loss rate at high temperatures, indicating that the PNR coating improved the thermal stability of the composite by mitigating the high-temperature decomposition of silver and carbon components. This section may be divided by subheadings. It should provide a concise and precise description of the experimental results, their interpretation, as well as the experimental conclusions that can be drawn.
3.2. Electrochemical Performance Evaluation
CV and EIS analysis: The electrochemical performance of different electrodes was evaluated in 5 mmol/L K₃[Fe(CN)₆]/0.1 M KCl solution. As shown in Figure 3A, the PNR-AgNRs-CNTs/GCE exhibited the highest redox peak currents among all tested electrodes, indicating optimal electrochemical performance. Electrodes containing AgNRs (AgNRs/GCE, AgNRs-CNTs/GCE, and PNR-AgNRs-CNTs/GCE) displayed distinct silver oxidation-reduction peaks at approximately 0.1 V and −0.6 V, confirming successful loading of AgNRs and the prominent electrochemical signal of silver suitable for ratiometric sensor construction. The EIS Nyquist plots (Figure 3B) demonstrated that PNR-AgNRs-CNTs/GCE exhibited the smallest semicircle diameter, corresponding to the lowest charge transfer resistance (Rct) and best conductivity among all electrodes.
CC analysis: Chronocoulometry was employed to determine the electrochemically active surface area based on the Anson equation. As shown in Figure 3C and 3D, the PNR-AgNRs-CNTs/GCE exhibited the largest slope in the Q-t¹/² plot, indicating the largest electrochemically active surface area, approximately 5-fold greater than that of bare GCE. This significant enhancement in active surface area contributes to the superior electrochemical performance of the composite electrode.
These results collectively demonstrate that the PNR-AgNRs-CNTs/GCE possesses excellent electrochemical performance and generates dual current signals from both PNR and AgNRs, fulfilling the fundamental requirements for a ratiometric electrochemical sensor.
3.3. Ratiometric Detection of Histamine
Mechanism of ratiometric detection: Histamine molecules inherently lack direct electrochemical activity and cannot be directly detected by conventional electrochemical methods. In this study, the detection mechanism relies on the competitive inhibition effect of histamine on the PNR electrochemical signal. As illustrated in Figure 4A and 4B, when histamine (20 μmol/L) was introduced into the electrolyte, all current values decreased due to the non-conductive nature of histamine affecting solution conductivity. Notably, the current at the PNR characteristic peak (−0.41 V) decreased more significantly, attributed to the competitive interaction between histamine and PNR that inhibited the electrochemical reaction of PNR. In contrast, the AgNRs signal at approximately 0.1 V showed minimal change, as histamine did not significantly affect the silver redox process. This differential response forms the basis for ratiometric detection: the ratio of PNR to AgNRs current signals (IPNR/IAgNRs) can be used to indirectly quantify histamine concentration.
Optimization of experimental conditions: The experimental conditions were systematically optimized to achieve optimal sensor performance. The optimal parameters were determined as: electrolyte pH 6.0 (as shown in Figure 4B), adsorption time 6 min ((as shown in Figure 4C)), and material loading 0.08 mg/cm² (as shown in Figure 4D). At pH 6.0, the sensor exhibited the most sensitive response to histamine with optimal signal stability. The 6 min adsorption time allowed sufficient interaction between histamine and the PNR layer without excessive background interference. The 0.08 mg/cm² material loading provided adequate active sites while maintaining good electrode conductivity.
Analytical performance: Under the optimized conditions, DPV was employed for histamine detection. As shown in Figure 5A, with increasing histamine concentration from 1 to 150 μmol/L, the PNR characteristic peak current (I) exhibited a significant downward trend, while the AgNRs characteristic peak current (I) showed minimal variation. The I/I ratio was calculated and plotted against the natural logarithm of histamine concentration (ln C). As depicted in Figure 5B, a good linear relationship was obtained in the range of 1–150 μmol/L, with the linear equation: IPNR/IAgNRs (μA) = -0.3152 ln(CHis) (μmol/L) + 5.0613.
The correlation coefficient R² was 0.995, and the detection limit (LOD) was calculated to be 0.16 μmol/L (S/N = 3). A comparison with previously reported electrochemical methods for histamine detection (Table 1) reveals that the proposed ratiometric sensor exhibits competitive or superior performance in terms of linear range and detection limit.
3.4. Selectivity, Stability, and Reproducibility
Selectivity: The anti-interference capability of the sensor was evaluated by testing the response toward common interfering substances including Na⁺, Ca²⁺, K⁺, PO₄³⁻, and NO₃⁻ at concentrations of 1.5 mM, as well as a mixture of these ions. As shown in Figure 6C, the presence of these common interfering ions, either individually or in combination, did not significantly affect the I/I ratio for histamine detection (variation < 5%), demonstrating excellent selectivity and anti-interference ability of the proposed sensor.
Stability: The long-term stability of the sensor was assessed by continuous detection over 8 days using the same PNR-AgNRs-CNTs/GCE electrode under identical conditions (pH 6.0, histamine concentration 20 μmol/L). As shown in Figure 6A, the average peak current was 120.57 ± 3.09 μA with an RSD of 2.56%, indicating good stability of the electrode for histamine detection.
Reproducibility: The reproducibility was evaluated by preparing eight PNR-AgNRs-CNTs/GCE electrodes under identical conditions and testing their response to 20 μmol/L histamine. As shown in Figure 6B, the average peak current was 121.52 ± 1.56 μA with an RSD of 1.28%, demonstrating excellent batch-to-batch reproducibility of the electrode fabrication protocol.
3.5. Real Sample Analysis
The practical applicability of the developed sensor was demonstrated by detecting histamine in crayfish samples. Three different crayfish samples were analyzed using the standard addition method at three concentration levels (1, 5, and 10 μmol/L). The calculated recoveries ranged from 95.9% to 102.3% (Table 2). Moreover, compared with the standard method (referred with GB 5009.208-2016), the RSD values were presented as 1.23-2.64%, indicating high accuracy and precision of the method for real sample analysis.
4. Conclusions
In this study, a ratiometric electrochemical sensor based on PNR-AgNRs-CNTs composite was successfully constructed for the rapid detection of histamine in crayfish. The sensor leverages the competitive inhibition of histamine on the PNR electrochemical signal while maintaining the stability of the AgNRs signal, enabling ratiometric quantification through the IPNR/IAgNRs ratio. This dual-signal strategy effectively eliminated interference from complex biological matrices and addressed the challenge of detecting histamine, which lacks direct electrochemical activity. The composite electrode exhibited significantly enhanced electrochemical performance with approximately 5-fold increase in electrochemically active surface area. Under optimal conditions, the sensor demonstrated a linear detection range of 1–150 μmol/L, a detection limit of 0.16 μmol/L (S/N = 3), and excellent selectivity, stability (RSD = 2.56%), and reproducibility (RSD = 1.28%). The successful application to crayfish samples with recoveries of 95.9%–102.3% and good agreement with the national standard method validates the practical utility of the proposed sensor. This method provides a new approach for rapid on-site detection of histamine in aquatic products, with promising application prospects in food safety monitoring and quality control.
Author Contributions
Conceptualization, Shuo Duan and Chunyan Liao; methodology, Huang Dai; software, Qiao Wang; validation, Shuo Duan and Qiao Wang; formal analysis, Yunhan Liu and Huang Dai; investigation, Shuo Duan; resources, Yongjiang Zhang; data curation, Chunyan Liao and Huang Dai; writing—original draft preparation, Shuo Duan; writing—review and editing, Shuo Duan; visualization, Zhanming Li and Qiao Wang; supervision, Zhanming Li and Yongjiang Zhang; project administration, Shuo Duan; funding acquisition, Shuo Duan. All authors have read and agreed to the published version of the manuscript.
Funding
This research was founded by the Chongqing Natural Science Foundation (No. 2024NSCQ-MSX0774) and Scientific research project of Chongqing Education Committee (No. KJQN202404503).
Institutional Review Board Statement
None.
Informed Consent Statement
Not applicable.
Data Availability Statement
All the data are availability if anyone need it.
Acknowledgments
Acknowledgments for Professor Yuming Huang. The authors have reviewed and edited the output and take full responsibility for the content of this publication.”
Conflicts of Interest
The authors declare no conflicts of interest.
Abbreviations
The following abbreviations are used in this manuscript:
| PNR | Poly Neutral Red |
| NRs | Nanorods |
| GCE | Glassy carbon electrode |
| DPV | Differential Pulse Voltammetry |
| CNTs | Carbon nanotubes |
| XRD | X-ray diffraction |
| FTIR | Fourier transform infrared spectroscopy |
| SEM | Scanning electron microscopy |
| TGA | Thermogravimetric analysis |
| CV | Cyclic voltammetry |
| His | histamine |
References
- Li, X.; Wang, B.; Xie, T.; et al. Research progress on nondestructive testing technology for aquatic products freshness. J. Food Process Eng. 2022, 45(5), e14025. [Google Scholar] [CrossRef]
- FAO. The State of World Fisheries and Aquaculture 2022; FAO: Rome, 2022. [Google Scholar]
- National Fisheries Technology Extension Center; China Society of Fisheries. China Crayfish Industry Development Report (2024). China Fish. 2024, 584(7), 14–20. [Google Scholar]
- Ren, F. The Development Model of Japanese Cold Chain Logistics: The Example of Seafood Transportation. Asian Bus. Res. 2022, 7(2), 7. [Google Scholar] [CrossRef]
- Han, Q. L.; Lu, J. F.; Zhu, J. J.; et al. Non-destructive detection of freshness in crayfish (*Procambarus clarkii*) based on near-infrared spectroscopy combined with deep learning. Food Control 2025, 168, 110–118. [Google Scholar]
- Chang, W. C. W.; Wu, H. Y.; Yeh, Y.; et al. Untargeted foodomics strategy using high-resolution mass spectrometry reveals potential indicators for fish freshness. Anal. Chim. Acta 2020, 1127, 98–105. [Google Scholar] [CrossRef] [PubMed]
- Duan, S.; He, J. Y.; Zhan, K.; et al. Electrochemical detection of hypoxanthine in crayfish freshness using nano-cerium dioxide. J. Food Saf. Qual. 2022, 13(8), 2426–2432. [Google Scholar]
- Liao, C. Y. Research on electrochemical methods for rapid detection of freshness characteristic substances in crayfish. Master's Thesis, Wuhan Polytechnic University, 2023. [Google Scholar]
- Duan, N.; Ren, K.; Song, M.; et al. A dual-donor FRET based aptamer sensor for simultaneous determination of histamine and tyramine in fishes. Microchem. J. 2023, 191, 108801. [Google Scholar] [CrossRef]
- Dey, B.; Ahmad, M. W.; Kim, B. H.; et al. Manganese cobalt-MOF@carbon nanofiber-based non-enzymatic histamine sensor for the determination of food freshness. Anal. Bioanal. Chem. 2023, 415(17), 3487–3501. [Google Scholar] [PubMed]
- Brosnan, M. E.; Brosnan, J. T. Histidine Metabolism and Function. J. Nutr. 2020, 150, 2570S–2575S. [Google Scholar] [CrossRef] [PubMed]
- Kovacova-Hanuskova, E.; Buday, T.; Gavliakova, S.; et al. Histamine, histamine intoxication and intolerance. Allergol. Et. Immunopathol. 2015, 43(5), 498–506. [Google Scholar] [CrossRef]
- Durak-Dados, A.; Michalski, M.; Osek, J. Histamine and other biogenic amines in food. J. Vet. Res. 2020, 64(2), 281–288. [Google Scholar] [CrossRef] [PubMed]
- Senabut, J.; Praoboon, N.; Tangkuaram, T.; et al. Development of cloth-based microfluidic devices for rapid determination of histamine in fish and fishery products. Microchim. Acta 2023, 190(6), 213. [Google Scholar] [CrossRef]
- National Health Commission of the People's Republic of China. GB 2733-2015 National Food Safety Standard—Fresh and Frozen Animal Aquatic Products; Standards Press of China: Beijing, 2015. [Google Scholar]
- Liu, Y.; He, Y.; Li, H.; et al. Biogenic amines detection in meat and meat products: the mechanisms, applications, and future trends. J. Future Foods 2024, 4(1), 21–36. [Google Scholar]
- Mattisson, L.; Xu, J.; Preininger, C.; et al. Competitive fluorescent pseudo-immunoassay exploiting molecularly imprinted polymers for the detection of biogenic amines in fish matrix. Talanta 2018, 181, 190–196. [Google Scholar] [CrossRef]
- Gao, F.; Grant, E.; Lu, X. Determination of histamine in canned tuna by molecularly imprinted polymers-surface enhanced Raman spectroscopy. Anal. Chim. Acta 2015, 901, 68–75. [Google Scholar] [CrossRef] [PubMed]
- Antoine, F. R.; Wei, C. I.; Otwell, W. S.; et al. Gas Chromatographic Analysis of Histamine in Mahi-mahi (*Coryphaena hippurus*). J. Agric. Food Chem. 2002, 50(17), 4754–4759. [Google Scholar] [CrossRef] [PubMed]
- Kumar, N.; Goyal, R. N. Silver nanoparticles decorated graphene nanoribbon modified pyrolytic graphite sensor for determination of histamine. Sens. Actuators B Chem. 2018, 268, 383–391. [Google Scholar] [CrossRef]
- Butwong, N.; Khajonklin, J.; Thongbor, A.; et al. Electrochemical sensing of histamine using a glassy carbon electrode modified with multiwalled carbon nanotubes decorated with Ag-Ag₂O nanoparticles. Microchim. Acta 2019, 186(11), 714. [Google Scholar]
- Duan, S.; Zhan, K.; Dai, H.; et al. Carbon nanotube-poly(neutral red) electrochemical competitive sensor for putrescine detection in crayfish. J. Food Saf. Qual. 2025, 16(15), 110–117. [Google Scholar]
- Zhu, C. X.; Liu, D.; Li, Y. Y.; et al. Research progress of ratiometric electrochemical sensing technology for mycotoxin detection in agricultural products. Trans. Chin. Soc. Agric. Eng. 2022, 38(05), 259–268. [Google Scholar]
- Miao, J.; Du, K.; Li, X.; et al. Ratiometric electrochemical immunosensor for the detection of procalcitonin based on the ratios of SiO₂-Fc–COOH–Au and UiO-66-TB complexes. Biosens. Bioelectron. 2021, 171, 112713. [Google Scholar] [PubMed]
- Wang, M.; Liu, X. Y.; Zhao, L. X.; et al. Reliable electrochemical ratiometric sensing based on diazotization/Schiff base reaction for accurate detection of alpha-fetoprotein. Chem. Eng. J. 2025, 511, 161916. [Google Scholar] [CrossRef]
- Liu, L.; Zheng, S. J.; Chen, H.; et al. Tandem nitrate-to-ammonia conversion on atomically precise silver nanocluster/MXene electrocatalyst. Angew. Chem. 2024, 136(8), e202316910. [Google Scholar] [CrossRef]
- Qingjiang County Crayfish Industry Association. T/QJCIPA 002-2023 Quality Requirements for Frozen Crayfish Tails. 2023. [Google Scholar]
- National Health Commission of the People's Republic of China. GB 5009.208-2016 National Food Safety Standard—Determination of Biogenic Amines in Foods; Standards Press of China: Beijing, 2016. [Google Scholar]
- Gao, Y.; Xu, J.; Qu, S.; et al. Mussel-inspired self-assembly of silver nanoclusters into multifunctional silver aerogels for enhanced catalytic and bactericidal applications. Exploration 2025, 5(1), 20240034. [Google Scholar] [PubMed]
- Nakthong, P.; Kondo, T.; Chailapakul, O.; et al. Development of an unmodified screen-printed graphene electrode for nonenzymatic histamine detection. Anal. Methods 2020, 12(44), 5407–5414. [Google Scholar] [CrossRef] [PubMed]
- Liu, J.; Cao, Y. An electrochemical sensor based on an anti-fouling membrane for the determination of histamine in fish samples. *Anal. Methods* 2021, 13(5), 685–694. [Google Scholar] [CrossRef] [PubMed]
- Serrano, V. M.; Cardoso, A. R.; Diniz, M.; et al. In-situ production of histamine-imprinted polymeric materials for electrochemical monitoring of fish. Sens. Actuators B Chem. 2020, 311, 127902. [Google Scholar]
- Li, S.; Zhong, T.; Long, Q.; et al. A gold nanoparticles-based molecularly imprinted electrochemical sensor for histamine specific-recognition and determination. Microchem. J. 2021, 171, 106844. [Google Scholar]
- Butwong, N.; Khajonklin, J.; Thongbor, A.; et al. Electrochemical sensing of histamine using a glassy carbon electrode modified with multiwalled carbon nanotubes decorated with Ag-Ag₂O nanoparticles. Microchim. Acta 2019, 186(11), 714. [Google Scholar]
Scheme 1.
the brief schematic graph for the process of electrode-preparation and Electrochemical detection of Histamin.
Scheme 1.
the brief schematic graph for the process of electrode-preparation and Electrochemical detection of Histamin.
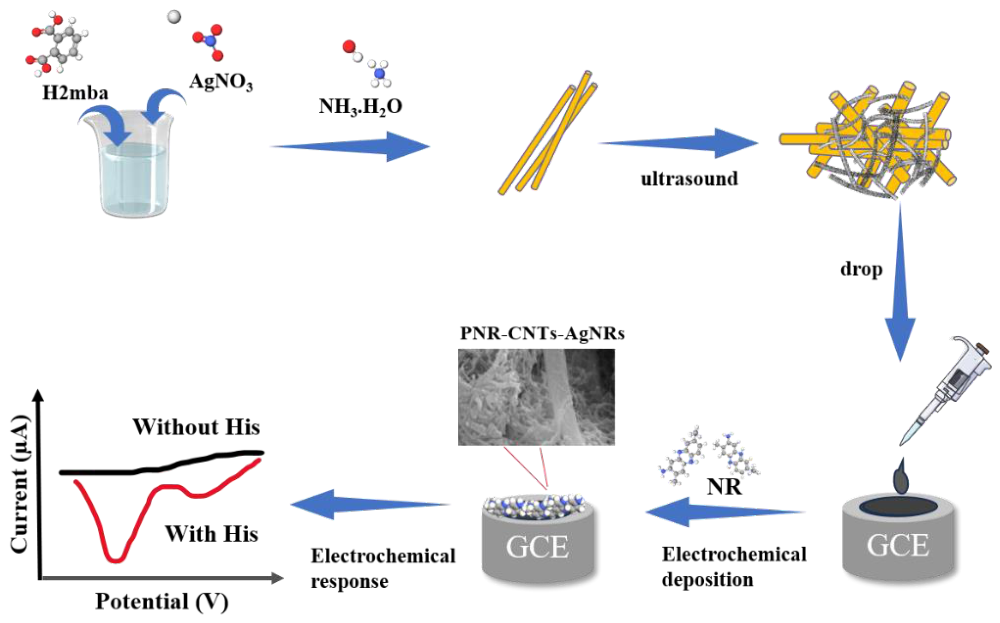
Figure 1.
the SEM images of AgNRs/GCE (A), AgNRs-CNTs/GCE (B), and PNR-AgNRs-CNTs/GCE (C); The EDS mapping (D) for PNR-AgNRs-CNTs/GCE; the N element mapping (E) and Ag element mapping (F) for PNR-AgNRs-CNTs/GCE.
Figure 1.
the SEM images of AgNRs/GCE (A), AgNRs-CNTs/GCE (B), and PNR-AgNRs-CNTs/GCE (C); The EDS mapping (D) for PNR-AgNRs-CNTs/GCE; the N element mapping (E) and Ag element mapping (F) for PNR-AgNRs-CNTs/GCE.
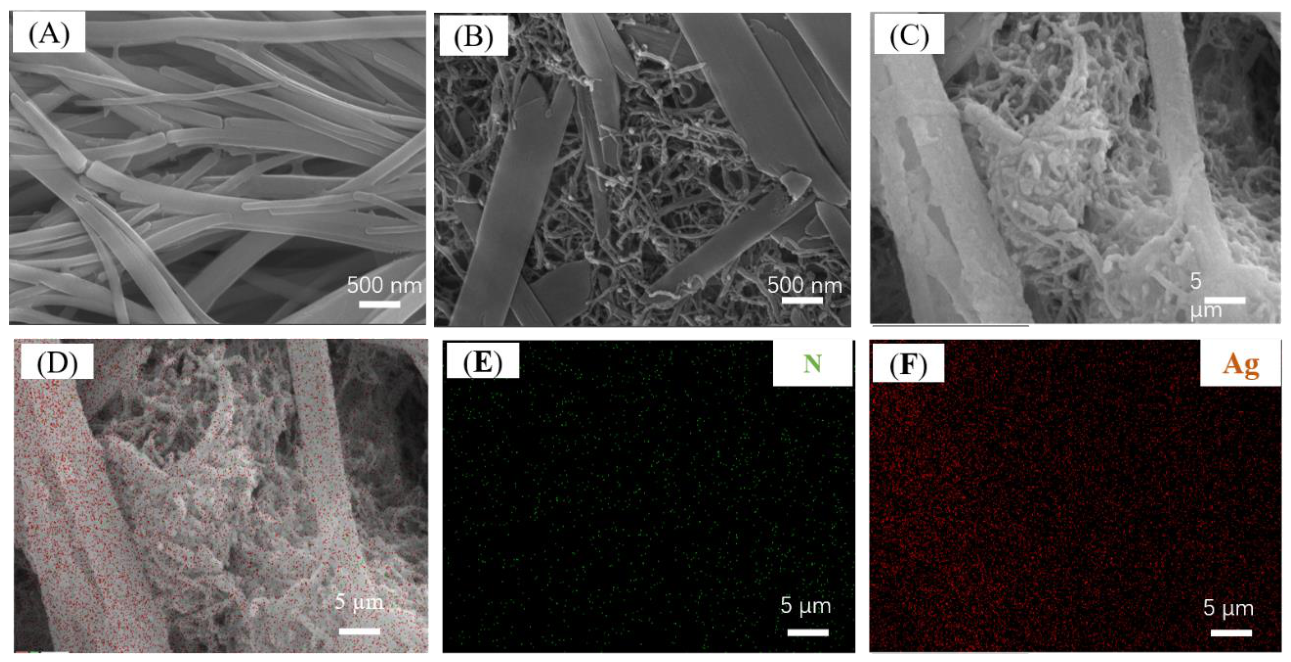
Figure 2.
the XRD (A), Raman spectrum (B), FTIR (C) and TGA (D) results for CNTs (the black line), AgNRs (the red line), AgNTs-CNTs (the blue line) and PNT-AgNRs-CNTs (the green line).
Figure 2.
the XRD (A), Raman spectrum (B), FTIR (C) and TGA (D) results for CNTs (the black line), AgNRs (the red line), AgNTs-CNTs (the blue line) and PNT-AgNRs-CNTs (the green line).
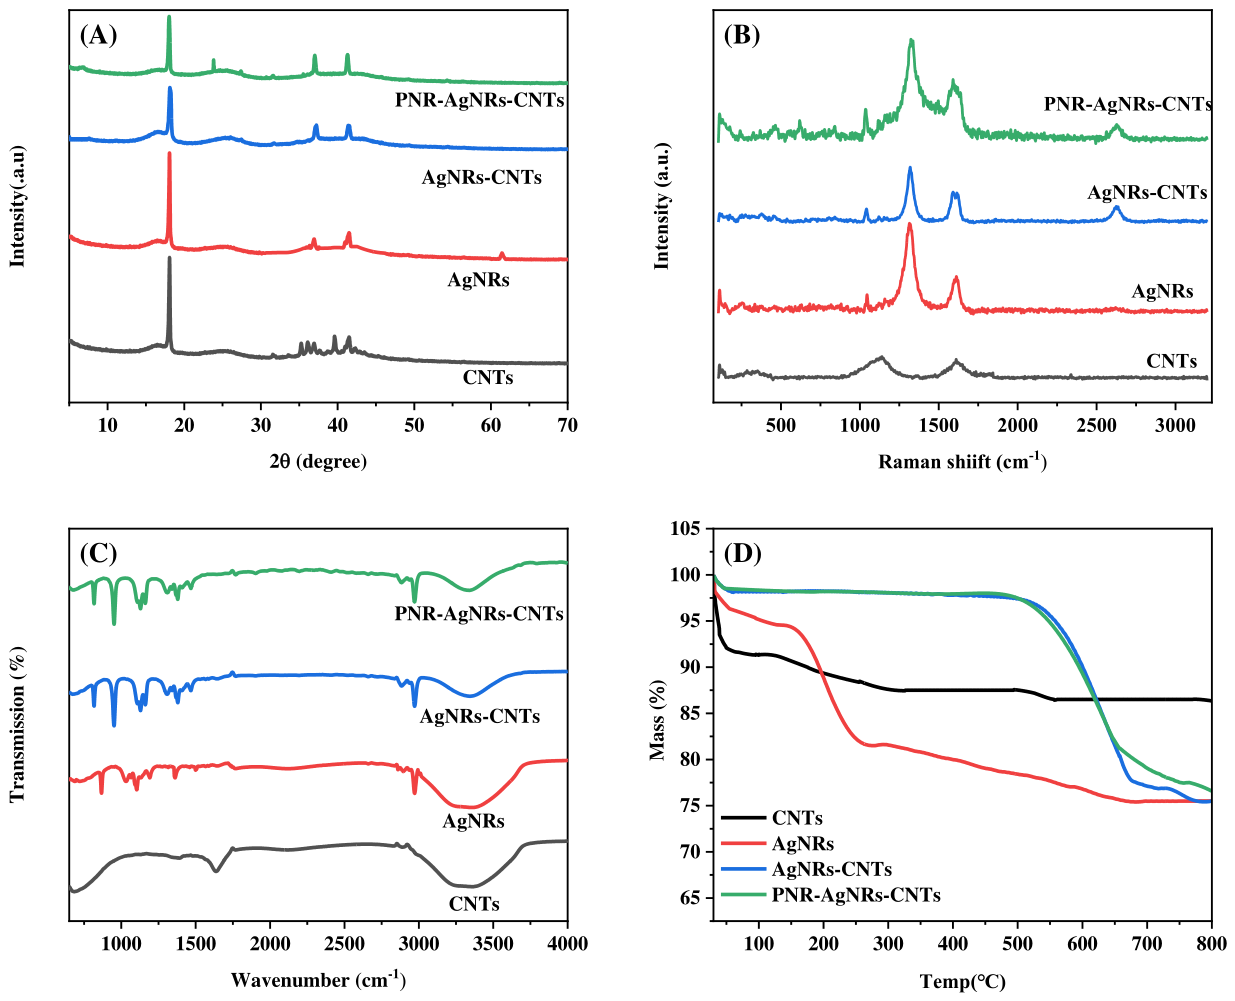
Figure 3.
the CVs (A), EIS results (B), i-t curves (C) and i-t1/2 curves (D) for the bare GCE (black line), CNTs/GCE (the red line), AgNRs/GCE (the blue line), AgNRs-CNTs/GCE (the green line) and the obtained PNR-AgNRs-CNTs/GCE (the pink line).
Figure 3.
the CVs (A), EIS results (B), i-t curves (C) and i-t1/2 curves (D) for the bare GCE (black line), CNTs/GCE (the red line), AgNRs/GCE (the blue line), AgNRs-CNTs/GCE (the green line) and the obtained PNR-AgNRs-CNTs/GCE (the pink line).
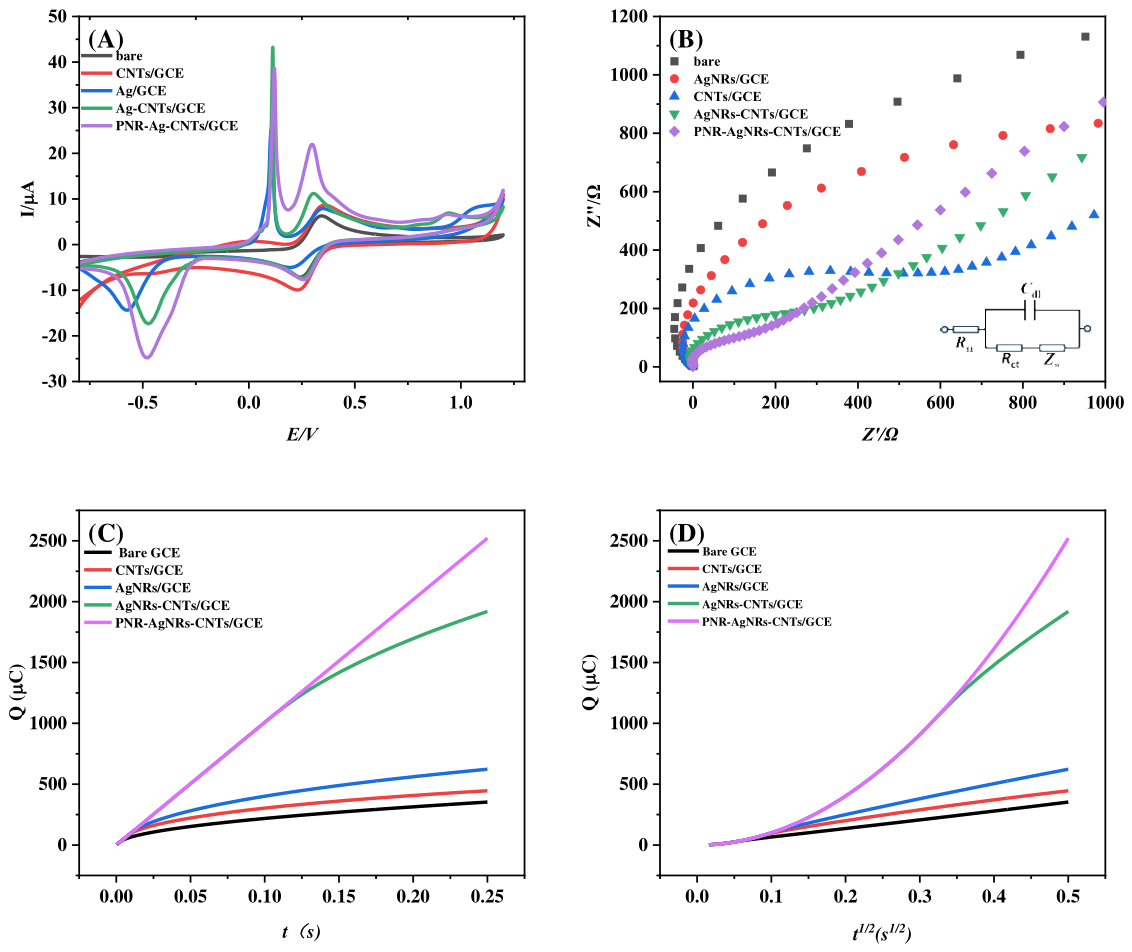
Figure 4.
the DPVs for histamine solution at PNR-AgNRs-CNTs/GCE with different electrolyte pH values (A); the optimization results for pH value (B), absorption time (C) and loading amount (D).
Figure 4.
the DPVs for histamine solution at PNR-AgNRs-CNTs/GCE with different electrolyte pH values (A); the optimization results for pH value (B), absorption time (C) and loading amount (D).
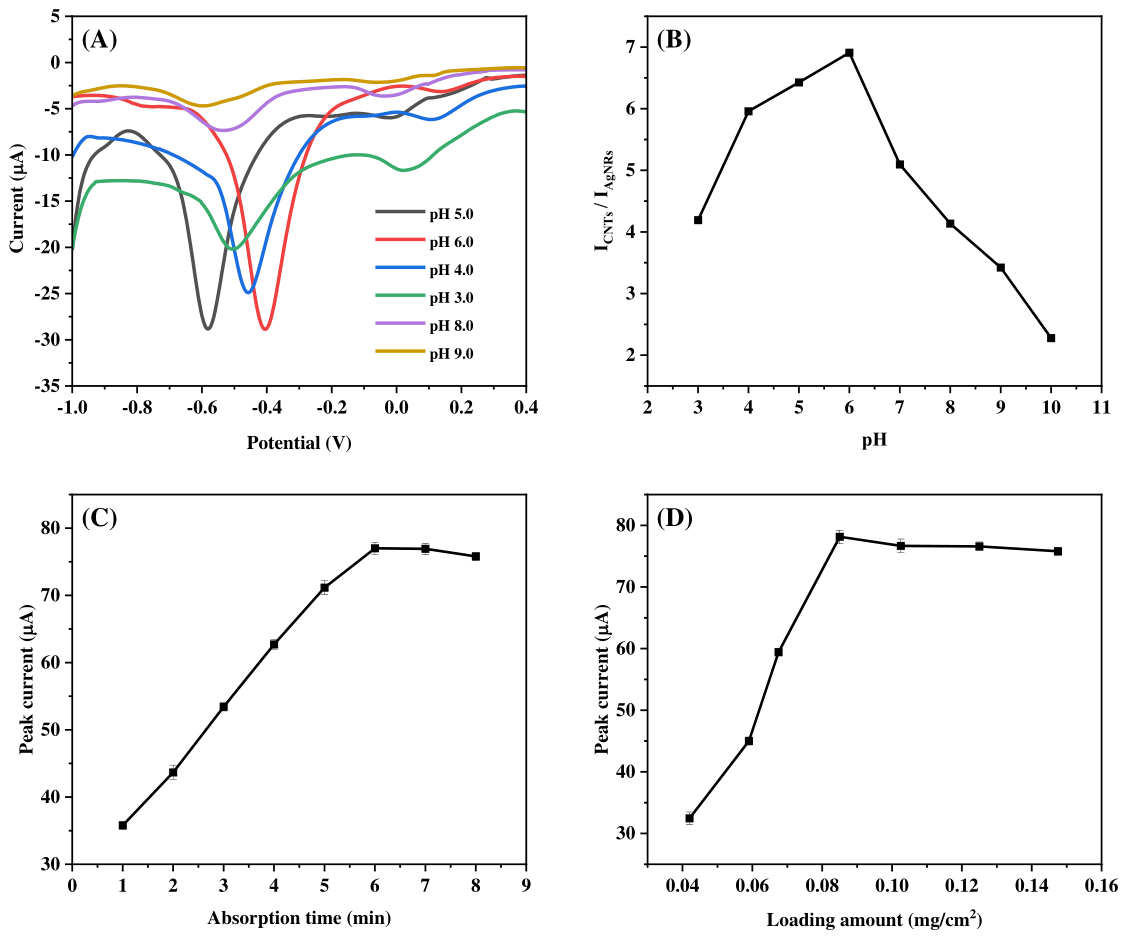
Figure 5.
the DPVs for histamine at PNR-AgNRs-CNTs/GCE with different concentrations (1 -15 μmol/L); the relationship between the I ratio and the ln values of the His concentration.
Figure 5.
the DPVs for histamine at PNR-AgNRs-CNTs/GCE with different concentrations (1 -15 μmol/L); the relationship between the I ratio and the ln values of the His concentration.
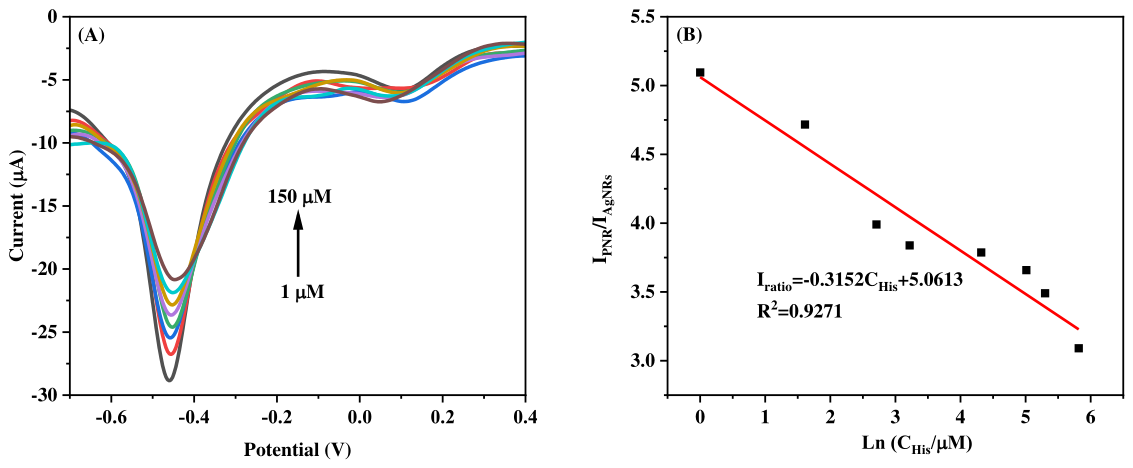
Figure 6.
the selectivity (A), stability (B) and reproducibility (C) measurement results for the obtained electrode.
Figure 6.
the selectivity (A), stability (B) and reproducibility (C) measurement results for the obtained electrode.
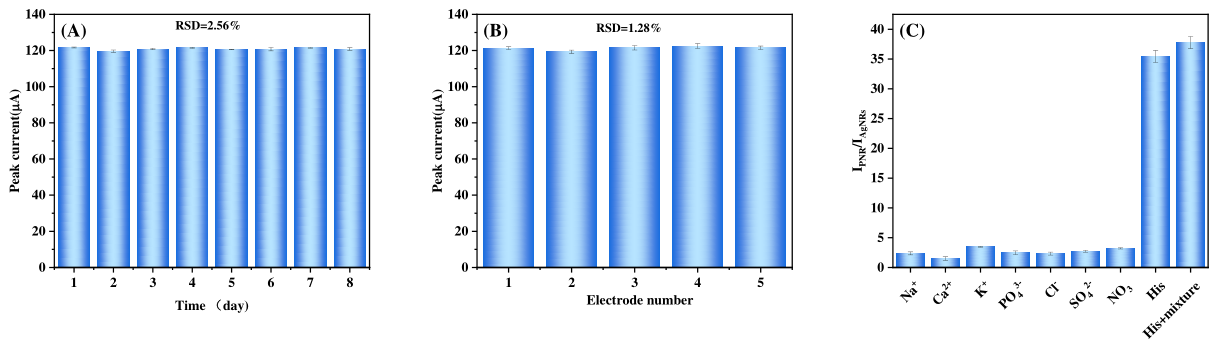

Table 1.
Comparison of His detected by different electrochemical methods.
| No. | Electrodes | Linear Range (μmol/L) | LOD (μmol/L) | Ref. |
| 1 | Unmodified SPGE | 5-100 | 0.62 | [30] |
| 2 | Nafion-CNTs/GCE | 20-200 | 0.39 | [31] |
| 3 | Au/Cys/MIP | 0.5-1000 | 0.21 | [32] |
| 4 | MIP//AuNPs/GCE | 1-107 | 0.6 | [33] |
| 5 | Ag-Ag2O/CNTs/GCE | 5-200 | 0.18 | [34] |
| 6 | PNR-AgNRs-CNTs/GCE | 1-150 | 0.16 | This work |
Table 2.
Results of Recovery Rate Measurement for real crayfish samples.
| Samples | Adding amount (μmol/L) | Detected amount (μmol/L) | Recovery (%) | Detected amount by standard method (μmol/L) | RSD with standard method (%) | |
| Crayfish sample 1 | 1 | 1.15±1.01 | 95.75 | 1.03±1.15 | 1.23 | |
| 5 | 5.37±1.28 | 96.39 | 5.24±1.11 | 2.15 | ||
| 10 | 10.2±2.09 | 99.27 | 10.19±2.21 | 1.77 | ||
| Crayfish sample 2 | 1 | 1.49±1.96 | 101.16 | 1.27±1.06 | 2.53 | |
| 5 | 5.24±1.32 | 96.84 | 5.28±1.27 | 1.7 | ||
| 10 | 10.0±2.28 | 99.37 | 10.25±2.14 | 2.03 | ||
| Crayfish sample 3 | 1 | 1.36±1.85 | 97.92 | 0.97±1.58 | 2.15 | |
| 5 | 5.14±1.53 | 98.41 | 4.96±1.33 | 2.64 | ||
| 10 | 10.9±2.06 | 99.28 | 10.01±2.19 | 2.23 | ||
Disclaimer/Publisher’s Note: The statements, opinions and data contained in all publications are solely those of the individual author(s) and contributor(s) and not of MDPI and/or the editor(s). MDPI and/or the editor(s) disclaim responsibility for any injury to people or property resulting from any ideas, methods, instructions or products referred to in the content. |
© 2026 by the authors. Licensee MDPI, Basel, Switzerland. This article is an open access article distributed under the terms and conditions of the Creative Commons Attribution (CC BY) license (http://creativecommons.org/licenses/by/4.0/).
Copyright: This open access article is published under a Creative Commons CC BY 4.0 license, which permit the free download, distribution, and reuse, provided that the author and preprint are cited in any reuse.


