

Submitted:
04 July 2026
Posted:
06 July 2026
You are already at the latest version
Abstract
Greenhouse microclimates exhibit substantial spatial heterogeneity, whereas conventional evaluations based on average measurements cannot adequately describe the environmental conditions experienced by crops. This study developed a spatial frequency analysis method to quantify long-term temperature and relative humidity heterogeneity and coupled it with cucumber yield and downy mildew models to evaluate the biological consequences of environmental variability. Four representative greenhouse types were monitored using distributed sensor networks under different weather conditions. The proposed method successfully identified persistent environmental hotspots. Greenhouse structure determined the spatial distribution of environmental heterogeneity, whereas solar radiation primarily controlled its intensity. Long-season monitoring data indicate that the maximum spatial variations in temperature and humidity within the brick-wall solar greenhouse, the assembled greenhouse, the glass greenhouse, and the plastic multi-span greenhouse reach up to 10℃ and 46%, 8.5℃ and 46%, 12℃ and 50%, and 7℃ and 32%, respectively. The assembled solar greenhouse and plastic greenhouse exhibited higher environmental uniformity, while the brick-wall solar greenhouse and glass multi-span greenhouse showed pronounced spatial gradients. Environmental heterogeneity resulted in significant within-greenhouse differences in simulated cucumber yield, with the smallest variation occurring in the assembled solar greenhouse (5.3%) and the largest in the glass multi-span greenhouse (39.2%). Disease simulations further revealed clear spatial aggregation of cucumber downy mildew risk, with the southern region of the solar greenhouse exhibiting 17-67% higher cumulative infection risk than other positions. This study establishes an integrated framework linking greenhouse environmental heterogeneity with crop productivity and disease risk, providing a practical basis for spatially differentiated precision greenhouse management and greenhouse structural optimization.
Keywords:
greenhouse microclimate
; spatial heterogeneity
; spatial frequency analysis
; cucumber yield
; downy mildew
; precision greenhouse management
1. Introduction
In recent years, protected horticulture has progressively become a central component of modern agriculture due to the large-scale and intensive production systems. Greenhouses can effectively extend crop growing periods, improve crop growth environments, substantially enhance crop yield and quality, and increase both solar energy utilization efficiency and land-use efficiency [1,2,3]. However, numerous studies have demonstrated that greenhouse microclimates exhibit pronounced spatial non-uniformity, with considerable variation under different temporal conditions [4]. This heterogeneity primarily arises from the combined effects of greenhouse structural design, ventilation configuration, crop canopy characteristics, and external meteorological conditions [5,6]. Whether the greenhouse environment satisfies crop growth requirements, particularly with respect to temperature and relative humidity, is critically important because of their direct impacts on crop productivity and disease risk.
Temperature and relative humidity are key environmental factors regulating crop physiological processes, directly influencing photosynthesis, transpiration, and disease development [7]. Recent studies have revealed pronounced temperature gradients within multi-span greenhouses, both horizontally and vertically. Mao et al. [8] reported that the highest temperatures occurred near the soil surface, whereas the lowest temperatures were observed at a height of 0.5 m, and that crop height significantly affected vertical temperature stratification. Similarly, Villagran and Bojacá demonstrated that daytime horizontal temperature differences in carnation greenhouses could reach 7.2 °C, while relative humidity differences reached 42.6% [9]. It confirms that the strong spatial heterogeneity of greenhouse microclimates exists under natural ventilation conditions and indicates that actual production environments remain far from optimal crop growth requirements. Regardless of greenhouse type, temperature and humidity heterogeneity is widely present and becomes significantly intensified under weak radiation and low ventilation conditions [10]. Wei et al. [11] further demonstrated that ventilation strategy is a critical factor affecting the spatial uniformity of greenhouse temperature and humidity. Although fan-pad ventilation systems improve cooling performance, they may simultaneously aggravate spatial heterogeneity. Li et al. [12] investigated the thermal environment and energy-saving strategies of three large-span greenhouse types and proposed an east-west zonal thermal insulation strategy based on spatial heterogeneity in temperature distribution.
For crop production, the spatial heterogeneity of greenhouse environments is a key factor influencing crop growth uniformity and yield stability. On the one hand, high-humidity zones can easily become hotspots for localized disease outbreaks [13]. Moreover, variations in temperature and humidity can result in uneven crop growth rates and physiological responses [14]. Gamboy et al. [15] demonstrated that lettuce cultivated in climate-controlled greenhouses reached harvest within 43 days, with an average fresh weight of 467 g per plant, whereas lettuce grown in conventional greenhouses required 48 days and achieved an average fresh weight of only 380 g per plant, representing a yield difference of 22.79% (p < 0.00012). These findings confirm the significant effects of temperature and humidity variations on crop growth rates and productivity. Nevertheless, most previous studies have focused on a single greenhouse type, employed relatively short experimental periods, and lacked comprehensive analyses. In addition, the limited number and distribution of sensors within greenhouses in many previous studies has constrained the comprehensive evaluation of multiple environmental factors. Traditional environmental regulation strategies based on single-point measurements or averaged environmental data are insufficient to accurately characterize the actual greenhouse microclimate and can no longer satisfy the requirements of precision agriculture. Multi-point monitoring has therefore become an essential approach for revealing the spatial distribution characteristics of greenhouse microclimates [16].
Although previous studies have preliminarily explored the spatial variability of greenhouse microclimates, significant limitations and challenges remain. In the present study, long-term analyses of temperature and humidity distribution patterns were conducted in four representative greenhouse types commonly used in northern and southern China. Based on greenhouse microclimatic heterogeneity, spatial differences in cucumber yield and cucumber downy mildew risk were simulated and evaluated across different greenhouse positions. This study illustrates the environmental heterogeneity associated with different greenhouse structures and weather conditions. The finds in this paper provides guidance in precision crop management, and in reducing disease risk in protected horticultural production systems [17,18].
2. Materials and Methods
2.1. Schematic Diagram of the Experimental Design
This study established a technical framework consisting of data acquisition-processing and analysis-model construction-coupled assessment (Figure 1). Four representative greenhouse types were selected, and distributed sensor networks were deployed to synchronously monitor temperature and relative humidity. The collected datasets were subsequently cleaned and standardized prior to analysis. Statistical and spatial interpolation methods were applied to characterize the spatial heterogeneity of temperature and humidity within the greenhouses. Yield and disease prediction models were then employed to simulate spatial variations in productivity and disease risk across different greenhouse zones. Finally, the effects of greenhouse structural characteristics on microclimate regulation and biological responses were comprehensively evaluated to provide a scientific basis for greenhouse structural optimization.
2.2. Experimental Greenhouses
This study investigated four different greenhouse types, as shown in Figure 2. Greenhouse A was located in Shihezi, Xinjiang Uygur Autonomous Region, China (85°51′ E, 44°15′ N), and environmental data were collected from April to June 2025. This greenhouse is a typical single-slope solar greenhouse cultivated with cucumber. The front roof was covered with polyethylene film and insulated using a cotton thermal blanket consisting of an external waterproof layer and an internal thick felt layer. The northern sidewall was constructed using a brick-concrete structure; Greenhouse B was located in Tumxuk, Xinjiang Uygur Autonomous Region, China (79°18′ E, 39°53′ N), where indoor and outdoor temperature and humidity data were collected from August to December 2024. This greenhouse is a typical assembled solar greenhouse cultivated with cucumber. The front roof was covered with polyethylene film and insulated using a cotton thermal blanket with an approximate thickness of 4 cm. The northern rear wall consisted of an approximately 7 cm thick cotton insulation layer combined with polyethylene film. Greenhouses C and D were both located in Hangzhou, Zhejiang Province, China (119°43′ E, 30°15′N). Indoor and outdoor environmental data were collected from May to September 2025. Both greenhouses were covered with external shading nets. The natural ventilation system combines side ventilation and roof ventilation. Greenhouse C was a Venlo-type glass multi-span greenhouse, and Greenhouse D was a four-span plastic film multi-span greenhouse. The longitudinal axes of the greenhouse A and B were oriented east-west. The longitudinal axes of the greenhouses C and D were oriented 30 degrees east of south.
2.3. Data Acquisition
Temperature and relative humidity sensors were installed in all four greenhouses to collect indoor environmental data, while outdoor meteorological stations were deployed to record outdoor environmental conditions (Table 1).
The spatial distributions of sensors in the four greenhouses are illustrated in Figure 2. In Greenhouses A and C, sensors were arranged using a grid-based sampling method. Nine uniformly distributed monitoring points were established on the horizontal plane of each greenhouse, and an indoor meteorological station was positioned at the center of each greenhouse. In Greenhouse B and D, temperature sensors were arranged according to a diagonal five-point and nine- point sampling method.
2.4. Data Analysis Methods
2.4.1. Data Preprocessing
To address duplicate records generated during sensor acquisition, multiple records occurring within the same time interval were regarded as duplicated data, and only the first record within each interval was retained. Subsequently, a complete temporal index covering all dates and time points was established for missing-data reconstruction. Cubic spline interpolation was preferentially applied during the interpolation process, whereas linear interpolation was adopted when data were insufficient or spline interpolation failed. For long-duration missing periods, spatial interpolation methods were employed, together with physical constraints to avoid unrealistic values, with temperature restricted to −30-50 °C, relative humidity constrained to 0-100%, and solar radiation intensity maintained at ≥ 0.
2.4.2. Analysis of High and Low Temperature and Humidity Positions in Greenhouses
At each time point, three highest and three lowest values of all measuring positions for both temperature and humidity were extracted. On this basis, a two-dimensional spatial coordinate system was established according to the sensor layout within each greenhouse, and the environmental variable values recorded by each sensor were mapped to their corresponding coordinates. Data at different temporal scales were aggregated to calculate the frequencies of high-temperature, low-temperature, high-humidity, and low-humidity events at each monitoring point during the study period, thereby generating spatial frequency distribution matrices. Corresponding spatial heatmaps were subsequently constructed for different greenhouse types and weather conditions (sunny, cloudy, and overcast days) to comparatively analyze variations in temperature and humidity distribution patterns under different structural configurations and meteorological conditions.
2.4.3. Spatial Heterogeneity Analysis of Temperature and Humidity
Two methods were adopted to analyze spatial heterogeneity. Method 1: The CV of temperature and humidity distributions within the greenhouse was calculated according to the following equation:
where CV represents the coefficient of variation of greenhouse temperature and humidity, %; σ represents the standard deviation; and μ represents the mean value. The σ and μ series are calculated based on the spatial sequence data of each monitoring site at the same time, representing the spatial standard deviation and mean deviation of temperature and humidity between sites, respectively; And CV is used to reflect the degree of heterogeneity of temperature and humidity in daily time series. Method 2: Spatial heterogeneity was directly quantified using temperature and humidity differences among monitoring positions at the same time. Boxplots of temperature and humidity differences among greenhouse positions were generated to present the minimum value (Q0), first quartile (Q1), median (Q2), third quartile (Q3), maximum value (Q4), potential outliers, and interquartile range (IQR),
where IQR represents the interquartile range and reflects differences in dispersion, with Q3 and Q1 corresponding to the third and first quartiles, respectively. These metrics were used to reveal absolute distribution differences in temperature and humidity indicators among different greenhouse environments.
2.5. Weather Classification Method
where kt represents the clearness index. When kt>0.6, the weather condition was classified as sunny; when 0.3≤kt≤0.6, it was classified as cloudy; and when kt<0.3, it was classified as overcast. n represents the day of the year; a represents longitude; b represents latitude; and G represents the measured solar radiation intensity (W/m2).
2.6. Disease Risk and Yield Assessment
To quantitatively evaluate the effects of the spatiotemporal heterogeneity of temperature and humidity on production outcomes, temperature and humidity data were used as driving variables and separately input into a crop growth model and a mechanistic disease model to simulate yield and disease severity, thereby quantifying the integrated production risks caused by climatic stress.
2.6.1. Crop Growth Model
A cucumber yield model was employed to simulate daily cucumber yield (Y). Temperature and humidity at different positions in the greenhouse were compared to evaluate their effects on local yield, thereby investigating the relationship between environmental variability and yield performance. Coefficients reported in the literature from regions with climatic conditions similar to those of the four greenhouse locations were adopted to simulate yields for the different greenhouse types. The average cucumber yield equation proposed by Ding et al. [19], based on temperature and solar radiation, was used as follows:
where Y represents the simulated potential cucumber yield; Tave represents the weekly 24 h average air temperature, ℃; Tday represents the weekly daytime average air temperature, ℃; Rsum represents the weekly accumulate solar radiation intensity, KJ/cm2.
2.6.2. Cucumber Downy Mildew Early Warning Model
A cucumber downy mildew warning model was adopted to simulate disease development and infection severity based on measured temperature and relative humidity data.
Occurrence of infection by Pseudoperonospora cubensis sporangia is calculated by fitting the data of Cohen [20] to the general model proposed by Magarey et al. [21]. An infection period occurs when the following expression is true:
where WD is the duration of the wet period (i.e., number of hours with uninterrupted LW or LW interrupted by a maximum of 3 h) calculated by accumulating leaf wetness (LW), which was a binary variable (0 or 1) and defined by judging if RH ≥ 90%; and WD(T) is the wetness duration (in hours) for the infection to occur at any temperature. WD(T) is calculated as follows:
where WDmin= shortest wetness duration (in hours) for infection at optimal temperature (= 2 h); TWD=mean temperature during the wet period; Tmin=minimum temperature for infection (=1 °C); Tmax=maximum temperature for infection (=28 °C); and Topt=optimal temperature for infection (=20 °C).
When an infection has occurred based on equation [4], its risk (Z) is calculated as follows:
where Z is the relative infection risk (on a 0-1 scale). Teq is an equivalent of temperature, calculated as Teq = (T − Tmin)/(Tmax − Tmin), in which T is the mean temperature during the wet period (℃), and Tmin and Tmax are the minimum and maximum temperature, which were estimated as 1 and 35 °C, respectively; WD is the duration of the wet period (hours). Equation [4,5] was developed and parameterized using the data of Neufeld and Ojiambo [22] and Sun et al. [23].
3. Results
3.1. Missing Data Imputation
During the data collection and preprocessing stage, duplicate and missing records were identified across different orientations within each greenhouse. Following the procedure described in Section 2.3, only the first record at each timestamp was retained for duplicate entries, while the remaining records were removed, and missing values were subsequently imputed. Due to space limitations, Figure 3 presents sensor data from only five orientations within the assembled solar greenhouse, namely the southeast, northeast, center, southwest, and northwest positions. The red mark in the figure represents interpolated data, reconstructing information for missing periods, with temporal variation patterns closely matching those of the original sequences. The indoor environmental data exhibited pronounced diurnal fluctuations and high variability. The interpolation approach employed in this study effectively reduced distortions caused by missing data while preserving local noise resistance and maintaining the stability of the overall temporal trend.
3.2. Spatial Heterogeneity Patterns of Greenhouse Environmental Factors
To comprehensively characterize the spatial heterogeneity of the greenhouse environment, two-dimensional spatial patterns were first visualized using heat maps (Figure 4, Figure 5, Figure 6 and Figure 7). Subsequently, the temporal dynamic characteristics were quantified using the CV analysis (Figure 8 and Figure 9). Finally, statistical comparisons of environmental parameters among different monitoring points were conducted using boxplots (Figure 10 and Figure 11).
3.2.1. Spatial Heterogeneity of the Temperature Field
The spatial distribution of high-temperature frequency exhibited pronounced directional patterns among the different greenhouse types (Figure 4). These patterns were only marginally affected by weather conditions but were strongly influenced by greenhouse structural characteristics and the prevailing airflow regime. In the brick wall solar greenhouse, high-temperature occurrences were primarily concentrated in the northern section, particularly in the northeast and due north areas, where the probability generally ranged from 15% to 22%. In contrast, the southern position consistently exhibited the lowest probability. The assembled solar greenhouse displayed the most homogeneous temperature distribution, with high-temperature frequencies predominantly ranging between 10% and 16%; only under cloudy conditions did the northeastern area exhibit a relatively elevated probability (22.7%). The glass multi-span greenhouse demonstrated the strongest directional heterogeneity, with high-temperature events persistently concentrated in the southwestern sector (The left side corresponds to the orientation of the greenhouse coordinates shown). The three monitoring locations on the left side maintained high-temperature frequencies of 23–32% throughout the observation period, whereas most locations on the opposite side remained below 2%. In the plastic film multi-span greenhouse, the thermal hotspot consistently located in the central position. Under cloudy and overcast conditions, the probability of high-temperature occurrence at the center reached 13.9–15.6% and gradually declined toward both sides.
Collectively, the Brick wall solar greenhouse and the glass multi-span greenhouse exhibited pronounced spatial temperature heterogeneity, with the latter showing the greatest degree of non-uniformity. The assembled solar greenhouse maintained the most uniform thermal environment, whereas the plastic film multi-span greenhouse was characterized by a stable central heat-accumulation zone. The locations of the high-temperature hotspots remained largely unchanged across different weather conditions, with only minor fluctuations in occurrence probability, indicating that greenhouse structure and airflow organization are the primary determinants of the spatial distribution of high-temperature events
As illustrated in Figure 5, in the brick-wall solar greenhouse, except under overcast conditions, low-temperature hotspots were primarily concentrated on the southwestern side (14.8–17.9%), while the central position showed the lowest frequencies (0.0–1.3%). Under overcast conditions, low-temperature frequency decreased from the northwest toward the southeast, opposite to the high-temperature distribution pattern. The northwestern and southern positions exhibited the highest frequencies (25.9%), whereas the central point adjacent to the core area remained at 0.0%. Overall, low-temperature frequency ranged from 0.0% to 25.9%, with relatively higher values in the southern and northwestern positions (18.5%). In the assembled solar greenhouse, low-temperature distribution transitioned from the southwest toward the northeast under all-weather and sunny conditions, whereas under cloudy weather the gradient shifted from northwest to southeast. During overcast conditions, low-temperature frequency was relatively uniform across the greenhouse, except for the southeastern position (0.0%).
In the glass multi-span greenhouse, low-temperature frequency decreased from the northeast toward the southwest, exhibiting an inverse spatial pattern relative to high-temperature distribution. In the plastic film multi-span greenhouse, low-temperature frequency varied from south to north under all-weather and sunny conditions, while relatively uniform distributions were observed during cloudy and overcast weather.
3.2.2. Spatial Heterogeneity of the Humidity Field
Distinct spatial aggregation patterns of high-humidity zones were observed among the greenhouse types (Figure 6). In the brick wall solar greenhouse and glass multi-span greenhouse, high-humidity area6s were predominantly located on the northern side of the greenhouse. In the brick wall solar greenhouse, the occurrence frequency of high humidity generally exceeded 20% under all weather conditions, and the spatial distribution pattern remained relatively stable under both sunny and overcast conditions. In the glass multi-span greenhouse, the frequency of high-humidity occurrence increased progressively from the southwest to the northeast, with the eastern side consistently serving as the high-humidity hotspot across all weather conditions. The occurrence frequency of high humidity in this position reached 26–33%.
In contrast, the assembled solar greenhouse exhibited a relatively uniform distribution of high humidity, showing only a weak increasing trend from west to east with limited spatial variation among zones. In the plastic film multi-span greenhouse, high-humidity areas were consistently concentrated in the central-western part of the greenhouse, whereas lower frequencies were observed along both the eastern and western sides.
The spatial distribution of low-humidity zones (Figure 7) generally showed a complementary pattern to that of high-humidity zones. In the brick wall solar greenhouse, low-humidity areas were mainly distributed in the southern and central positions, forming relatively stable low-humidity hotspots under all weather conditions, while the northern side exhibited comparatively low occurrence frequencies. In the assembled solar greenhouse, the occurrence frequency of low humidity decreased from west to east, with the southwestern position showing relatively high frequencies and the eastern position maintaining consistently low values, resulting in a pronounced east–west gradient. In the glass multi-span greenhouse, low-humidity zones were highly concentrated on the southwestern side, where the occurrence frequency reached 27–33%, and decreased rapidly toward the northeast. In the plastic film multi-span greenhouse, low-humidity areas were mainly distributed along the western edge, central position, and localized southeastern zones, whereas the central-western area exhibited markedly lower frequencies.
Across different weather conditions, the locations of low-humidity zones remained largely stable, with variations occurring primarily in occurrence frequency. Under overcast conditions, the low-humidity frequency increased in several areas of the brick wall solar greenhouse, the assembled solar greenhouse, and the glass multi-span greenhouse, whereas the overall spatial distribution pattern changed only slightly. Under sunny and cloudy conditions, the location and extent of low-humidity zones remained generally consistent. Comparison with the high-humidity frequency maps revealed that low-humidity hotspots and high-humidity aggregation zones were spatially opposed in all greenhouse types, indicating a stable and pronounced spatial heterogeneity of the humidity environment within the greenhouses.
3.3. Daily Evolution of Spatial Temperature Differences and Spatial Heterogeneity
Figure 8 presents the daily evolution of the spatial temperature differences (ΔT) together with the spatial coefficient of variation (CV) for four greenhouse types during the experimental periods. The daily averaged (ΔT_mean), maximum (ΔT_max), and minimum (ΔT_min) spatial temperature differences were calculated from the hourly temperature distributions, while CV was used to quantify the daily spatial heterogeneity of the thermal environment.
Overall, distinct differences in thermal uniformity were observed among the four greenhouse types. The brick-wall solar greenhouse (Figure 8A) consistently exhibited the largest spatial temperature differences and the highest temporal variability. During several days, ΔT_max reached 8-10 °C, accompanied by sharp increases in CV to values above 8-9%, indicating severe spatial thermal stratification. Although these extreme events only occurred during specific periods, they substantially increased the average CV, reaching approximately 3.15% over the observation period. The pronounced fluctuations suggest that the thermal environment inside the brick-wall greenhouse was highly sensitive to transient meteorological conditions.
The assembled solar greenhouse (Figure 8B) showed improved temperature uniformity compared with the brick-wall greenhouse. Most daily ΔT_mean values remained below 2 °C, while ΔT_max generally ranged between 4 and 7 °C. As the monitoring period advanced into winter, the decline in mean ambient temperature led to an increase in the average CV, because CV is normalized by the hourly mean temperature. However, ΔT_mean values remained largely unchanged throughout this period, indicating that the overall thermal uniformity did not substantially degrade despite lower air temperatures. Moreover, the maximum daily ΔT_max recorded over the entire sampling duration was only about 9 °C, which is markedly lower than the value observed in the brick-wall solar greenhouse (approximately 16 °C). This comparison clearly demonstrates that the assembled solar greenhouse provides superior spatial temperature uniformity relative to the brick-wall greenhouse, likely owing to its lighter structural design and more effective air movement, both of which help suppress the persistent formation of localized hot zones.
Comparatively, the temperature distribution uniformity in the plastic-film multi-span greenhouse was better than that in the glass multi-span greenhouse. In the glass greenhouse, ΔT_mean was below 4 °C, while in the plastic-film multi-span greenhouse, ΔT_mean was generally below 2 °C, except on a few isolated days. Moreover, the ΔT_max in the plastic-film multi-span greenhouse (maximum 9 °C) was also smaller than that in the glass greenhouse (which mostly remained at 12–13 °C). Among the two types of multi-span greenhouses, the plastic-film structure consistently outperformed the glass one in terms of both average and maximum daily spatial temperature differences, indicating superior thermal homogeneity and fewer extreme thermal gradients. This suggests that, for applications where a stable and uniform canopy-level climate is critical—such as high-value crop production or precision environmental control—the plastic-film multi-span greenhouse may offer a more reliable solution. The glass greenhouse, while still maintaining moderate uniformity, exhibited notably larger fluctuations, which could pose additional challenges for climate management and crop consistency.
Furthermore, across all four greenhouse types examined, the spatial temperature differences followed a clear weather-dependent pattern: they were largest on sunny days, intermediate on cloudy days, and smallest on overcast days. This trend demonstrates that solar radiation is the dominant factor driving the spatial heterogeneity of temperature inside greenhouses. There exists a positive correlation between solar radiation intensity and the magnitude of temperature differences, and importantly, this correlation holds true irrespective of greenhouse type—indicating that the influence of solar radiation is universal and not modified by structural variations among the different greenhouse designs.
Figure 9 presents the daily evolution of the spatial relative humidity differences (ΔH) together with the spatial coefficient of variation (CV) for the four greenhouse types during the monitoring periods. The daily averaged (ΔH_mean), maximum (ΔH_max), and minimum (ΔH_min) spatial humidity differences were calculated from the hourly humidity distributions, while the CV was used to characterize the spatial heterogeneity of the humidity environment.
Overall, the spatial heterogeneity of relative humidity differed considerably among the four greenhouse types. The brick-wall solar greenhouse (Figure 9A) exhibited the largest humidity gradients and the strongest temporal fluctuations. During several periods, ΔH_max exceeded 40–50%, accompanied by rapid increases in CV to values above 15–20%, indicating the occurrence of pronounced spatial moisture stratification. These results suggest that the humidity environment inside the brick-wall greenhouse was highly susceptible to transient environmental disturbances and localized moisture accumulation.
Compared with the brick-wall greenhouse, the assembled solar greenhouse (Figure 9B) maintained a more spatially uniform humidity distribution. Most daily ΔH_mean values remained below approximately 15%, while ΔH_max generally ranged between 20% and 35%, with only a few isolated peaks approaching 50%. As the monitoring period advanced into winter, indicators of spatial humidity differences have decreased. It suggests that seasonal reduction in solar radiation and ventilation rates effectively suppressed local variations in evapotranspiration, leading to a more homogeneous humidity distribution. Compared with the brick-wall greenhouse, both the magnitude and frequency of extreme humidity gradients were substantially reduced, indicating that the assembled greenhouse provides a more homogeneous moisture environment, likely benefiting from enhanced natural ventilation and more effective internal air exchange.
The two multi-span greenhouses exhibited better humidity uniformity than the solar greenhouses. The plastic-film multi-span greenhouse (Figure 9D) consistently showed the smallest spatial humidity differences throughout the monitoring period. DailyΔH_mean generally remained below 6%, whileΔR_max rarely exceeded 20-25%, resulting in the lowest average CV among all greenhouse types (approximately 2-3%). In contrast, the glass multi-span greenhouse (Figure 9C) experienced larger day-to-day fluctuations. AlthoughΔH_mean was generally below 10%, several days exhibited ΔH_max values exceeding 40%, accompanied by distinct increases in CV. Overall, the plastic-film multi-span greenhouse demonstrated superior spatial humidity uniformity compared with the glass greenhouse, suggesting that its structural characteristics promote more effective moisture mixing and suppress the formation of localized humid zones.
Furthermore, despite the structural differences among greenhouse types, the spatial humidity differences exhibited a clear dependence on weather conditions. Larger humidity gradients generally occurred on sunny days, whereas cloudy or overcast conditions resulted in considerably more uniform humidity distributions. Strong solar radiation enhances plant transpiration while simultaneously increasing air temperature, thereby creating localized evaporation and vapor transport that amplify spatial humidity gradients. Conversely, under weak radiation conditions, both transpiration intensity and thermal convection are reduced, leading to more homogeneous humidity fields. This consistent trend across all greenhouse types indicates that solar radiation is the primary driving factor governing the spatial heterogeneity of humidity, although the extent of the resulting gradients is strongly modulated by greenhouse structure and ventilation characteristics.
3.4. Quantitative Comparison of Zone-Specific Environmental Characteristics
Figure 10 presents the distribution of hourly temperature differences for the four greenhouse types under three representative weather conditions. Overall, the temperature difference exhibited pronounced variations among greenhouse structures and weather conditions, indicating that both the greenhouse envelope and external solar radiation substantially influenced the temporal thermal heterogeneity.
Among all greenhouse-weather combinations, the brick-wall solar greenhouse under sunny conditions (AS) showed the largest temperature difference, with a median of approximately 1.5 °C and the widest interquartile range (IQR), accompanied by numerous high-value outliers exceeding 8 °C. Similarly, the glass multi-span greenhouse under sunny conditions (CS) exhibited a comparable median (≈1.3 °C) but displayed the largest dispersion and the highest extreme values, reaching nearly 13 °C. These results suggest that strong solar radiation substantially intensified transient temperature gradients within both greenhouse types. However, the underlying mechanisms were likely different. In the brick-wall solar greenhouse, the thermal storage and delayed heat release of the massive north wall enhanced spatial differences between sunlit and shaded positions, whereas in the glass multi-span greenhouse, the large transparent envelope promoted rapid solar heat gain and localized overheating around sun-exposed areas.
As cloud cover increased, the hourly temperature difference decreased consistently across all greenhouse types. Under cloudy conditions, the median temperature difference generally ranged from 0.8 to 1.2 °C, while under overcast conditions it further declined to approximately 0.6–0.9 °C. Meanwhile, both the IQR and the number of extreme values decreased markedly. Reduced solar radiation under cloudy and overcast skies weakened localized heating, resulting in a more homogeneous indoor thermal environment. This trend was particularly evident in the plastic film multi-span greenhouse (D), where the median temperature difference remained below 0.7 °C under both cloudy (DC) and overcast (DO) conditions, indicating excellent temperature uniformity when direct solar heating was limited.
Comparisons among greenhouse types further revealed distinct thermal responses. The two solar greenhouses (A and B) generally exhibited larger temperature differences than the plastic film greenhouse, particularly under sunny weather, reflecting the stronger influence of asymmetric solar heating and thermal mass. In contrast, the assembled solar greenhouse (B) maintained relatively moderate temperature differences, with median values between 0.7 and 1.2 °C across all weather conditions, suggesting that its structural design mitigated excessive temperature stratification. Although the glass greenhouse experienced substantial instantaneous temperature fluctuations under sunny conditions, its temperature distribution became considerably more uniform during cloudy and overcast periods, demonstrating a strong dependence on incoming solar radiation.
The large number of upper outliers observed under sunny conditions indicates that short-term localized overheating occurred frequently, despite relatively moderate median values. Therefore, relying solely on average temperature differences may underestimate the occurrence of transient thermal non-uniformity. The boxplot analysis demonstrates that both the magnitude and variability of temperature difference should be considered when evaluating greenhouse thermal performance, especially under high solar radiation conditions.
Figure 11 illustrates the distribution of hourly relative humidity (RH) differences under different greenhouse-weather combinations. Compared with temperature, the RH difference exhibited substantially larger variability, with median values ranging from approximately 2.8% to 10.5%, indicating that indoor humidity was more spatially heterogeneous and dynamically responsive to environmental conditions.
The largest RH differences were generally observed in the two solar greenhouse types (A and B). Under sunny conditions, the brick-wall solar greenhouse (AS) exhibited the highest median RH difference (approximately 9.5%), together with a broad IQR and numerous extreme values exceeding 40%. Similar characteristics were observed in the assembled solar greenhouse (BC), whose median RH difference exceeded 10%. These large humidity gradients can be attributed to the combined effects of uneven solar heating, crop transpiration, and localized evaporation. Strong radiation increased leaf transpiration in sunlit positions while simultaneously reducing local RH through air warming, thereby producing pronounced humidity contrasts between illuminated and shaded zones.
The glass multi-span greenhouse (C) showed a different response pattern. Although its median RH difference under sunny conditions (CS) was relatively modest (approximately 6.2%), it exhibited the largest number of extreme outliers, with maximum values exceeding 50%. This indicates that while the overall humidity distribution remained relatively stable, transient localized humidity gradients occasionally developed under intense solar radiation. Such behavior is likely associated with rapid fluctuations in ventilation-induced air exchange and localized moisture transport, which are more pronounced in highly transparent glass structures.
In contrast, the plastic film multi-span greenhouse (D) consistently exhibited the smallest RH differences across all weather conditions. The median RH difference remained close to 3% under both cloudy and overcast conditions and only increased slightly under sunny weather. Moreover, the IQR was considerably narrower than those of the other greenhouse types, indicating a more uniform humidity distribution. This suggests that the plastic-covered structure effectively buffered short-term fluctuations in moisture transport, thereby improving humidity uniformity.
Weather conditions also exerted a strong influence on RH distribution. For most greenhouse types, cloudy conditions generally produced the largest median RH differences, while overcast conditions yielded the smallest values. Although sunny weather generated numerous extreme humidity events, the median values did not always increase proportionally because enhanced natural or mechanical ventilation under strong solar radiation facilitated moisture redistribution. Conversely, the absence of sufficient solar heating under overcast conditions reduced both transpiration intensity and localized buoyancy-driven airflow, resulting in a more homogeneous humidity field.
Compared with the temperature boxplots, the RH boxplots displayed considerably wider distributions and a much larger number of upper outliers, highlighting that humidity was substantially more sensitive to localized evapotranspiration, condensation, and ventilation processes than temperature. These findings indicate that achieving spatially uniform humidity remains more challenging than temperature regulation in greenhouse environments. Consequently, greenhouse climate control strategies should prioritize humidity management under sunny conditions, particularly in solar and glass greenhouses where localized humidity gradients are most pronounced.
3.5. Estimation of Cucumber Growth and Yield Spatial Heterogeneity
Figure 12 illustrates the estimated cumulative yield at different sampling positions in the four greenhouse types. Since the monitoring periods differed among greenhouse types, resulting in different cumulative production durations, comparisons of absolute yield among greenhouse types are inappropriate. Therefore, the analysis focuses on the spatial variation of yield within each greenhouse.
The brick wall solar greenhouse (A) exhibited higher spatial variation in cumulative yield than assembled solar greenhouse, with an average difference of 1.03 kg m−2 (compared to 0.43 kg m−2 for assembled solar greenhouse). The highest yield was estimated at the north position (17.17 kg m−2), followed closely by the northwest (16.98 kg m−2), whereas the northeast and east position estimated the lowest yield (16.14 kg m−2). Most sampling locations remained close to the greenhouse average (16.61 kg m−2). This result agrees with the previously observed moderate spatial temperature heterogeneity in the brick wall solar greenhouse, suggesting that the north position has better thermal performance than the south in the solar greenhouse.
The assembled solar greenhouse (B) showed the smallest absolute yield difference among the four greenhouse types (0.43 kg m−2). The northeast position achieved the highest yield (8.28 kg m−2), while the southeast position produced the lowest yield (7.85 kg m−2), representing approximately 5.3% variation relative to the average yield (8.05 kg m−2). The relative yield variation of assembled solar greenhouse is lower than that for brick wall solar greenhouse (6.2%). This result is consistent with the optimal uniformity of the assembled solar greenhouse shown in the temperature distribution heatmap.
In the glass multi-span greenhouse (C), the largest spatial variation in yield was observed, with a difference of 2.31 kg m−2, corresponding to approximately 39.2% of the average yield (5.89 kg m−2). Yield increased markedly from the western and southern positions toward the northern side. The north position produced the highest cumulative yield (6.83 kg m−2), followed by the northeast (6.81 kg m−2), whereas the south position yielded only 4.52 kg m−2. In contrast to northern greenhouses, the yield variation distribution in the glass multi-span greenhouse is primarily driven by high temperatures (>33 °C) that restrict growth. This indicates that glass greenhouses require higher investment in control equipment, such as circulation fans, to maintain microclimate stability and crop growth uniformity.
The plastic film multi-span greenhouse (D) exhibited an intermediate level of spatial variability, with a maximum yield difference of 1.51 kg m−2 (approximately 10.8% of the average yield). The highest yield occurred at the south-southeast position (14.86 kg m−2), followed by the east (14.58 kg m−2), whereas the north-northwest position showed the lowest yield (13.34 kg m−2). Most locations were distributed close to the greenhouse average (13.97 kg m−2), indicating relatively stable productivity despite some localized differences.
3.6. Spatial Heterogeneity-Based Prediction of Disease Infection Risk
Cucumber downy mildew is a disease strongly associated with environmental temperature and humidity conditions. Under different greenhouse types, the temporal dynamics and spatial distribution of disease infection risk differed substantially, demonstrating pronounced temporal and spatial heterogeneity.
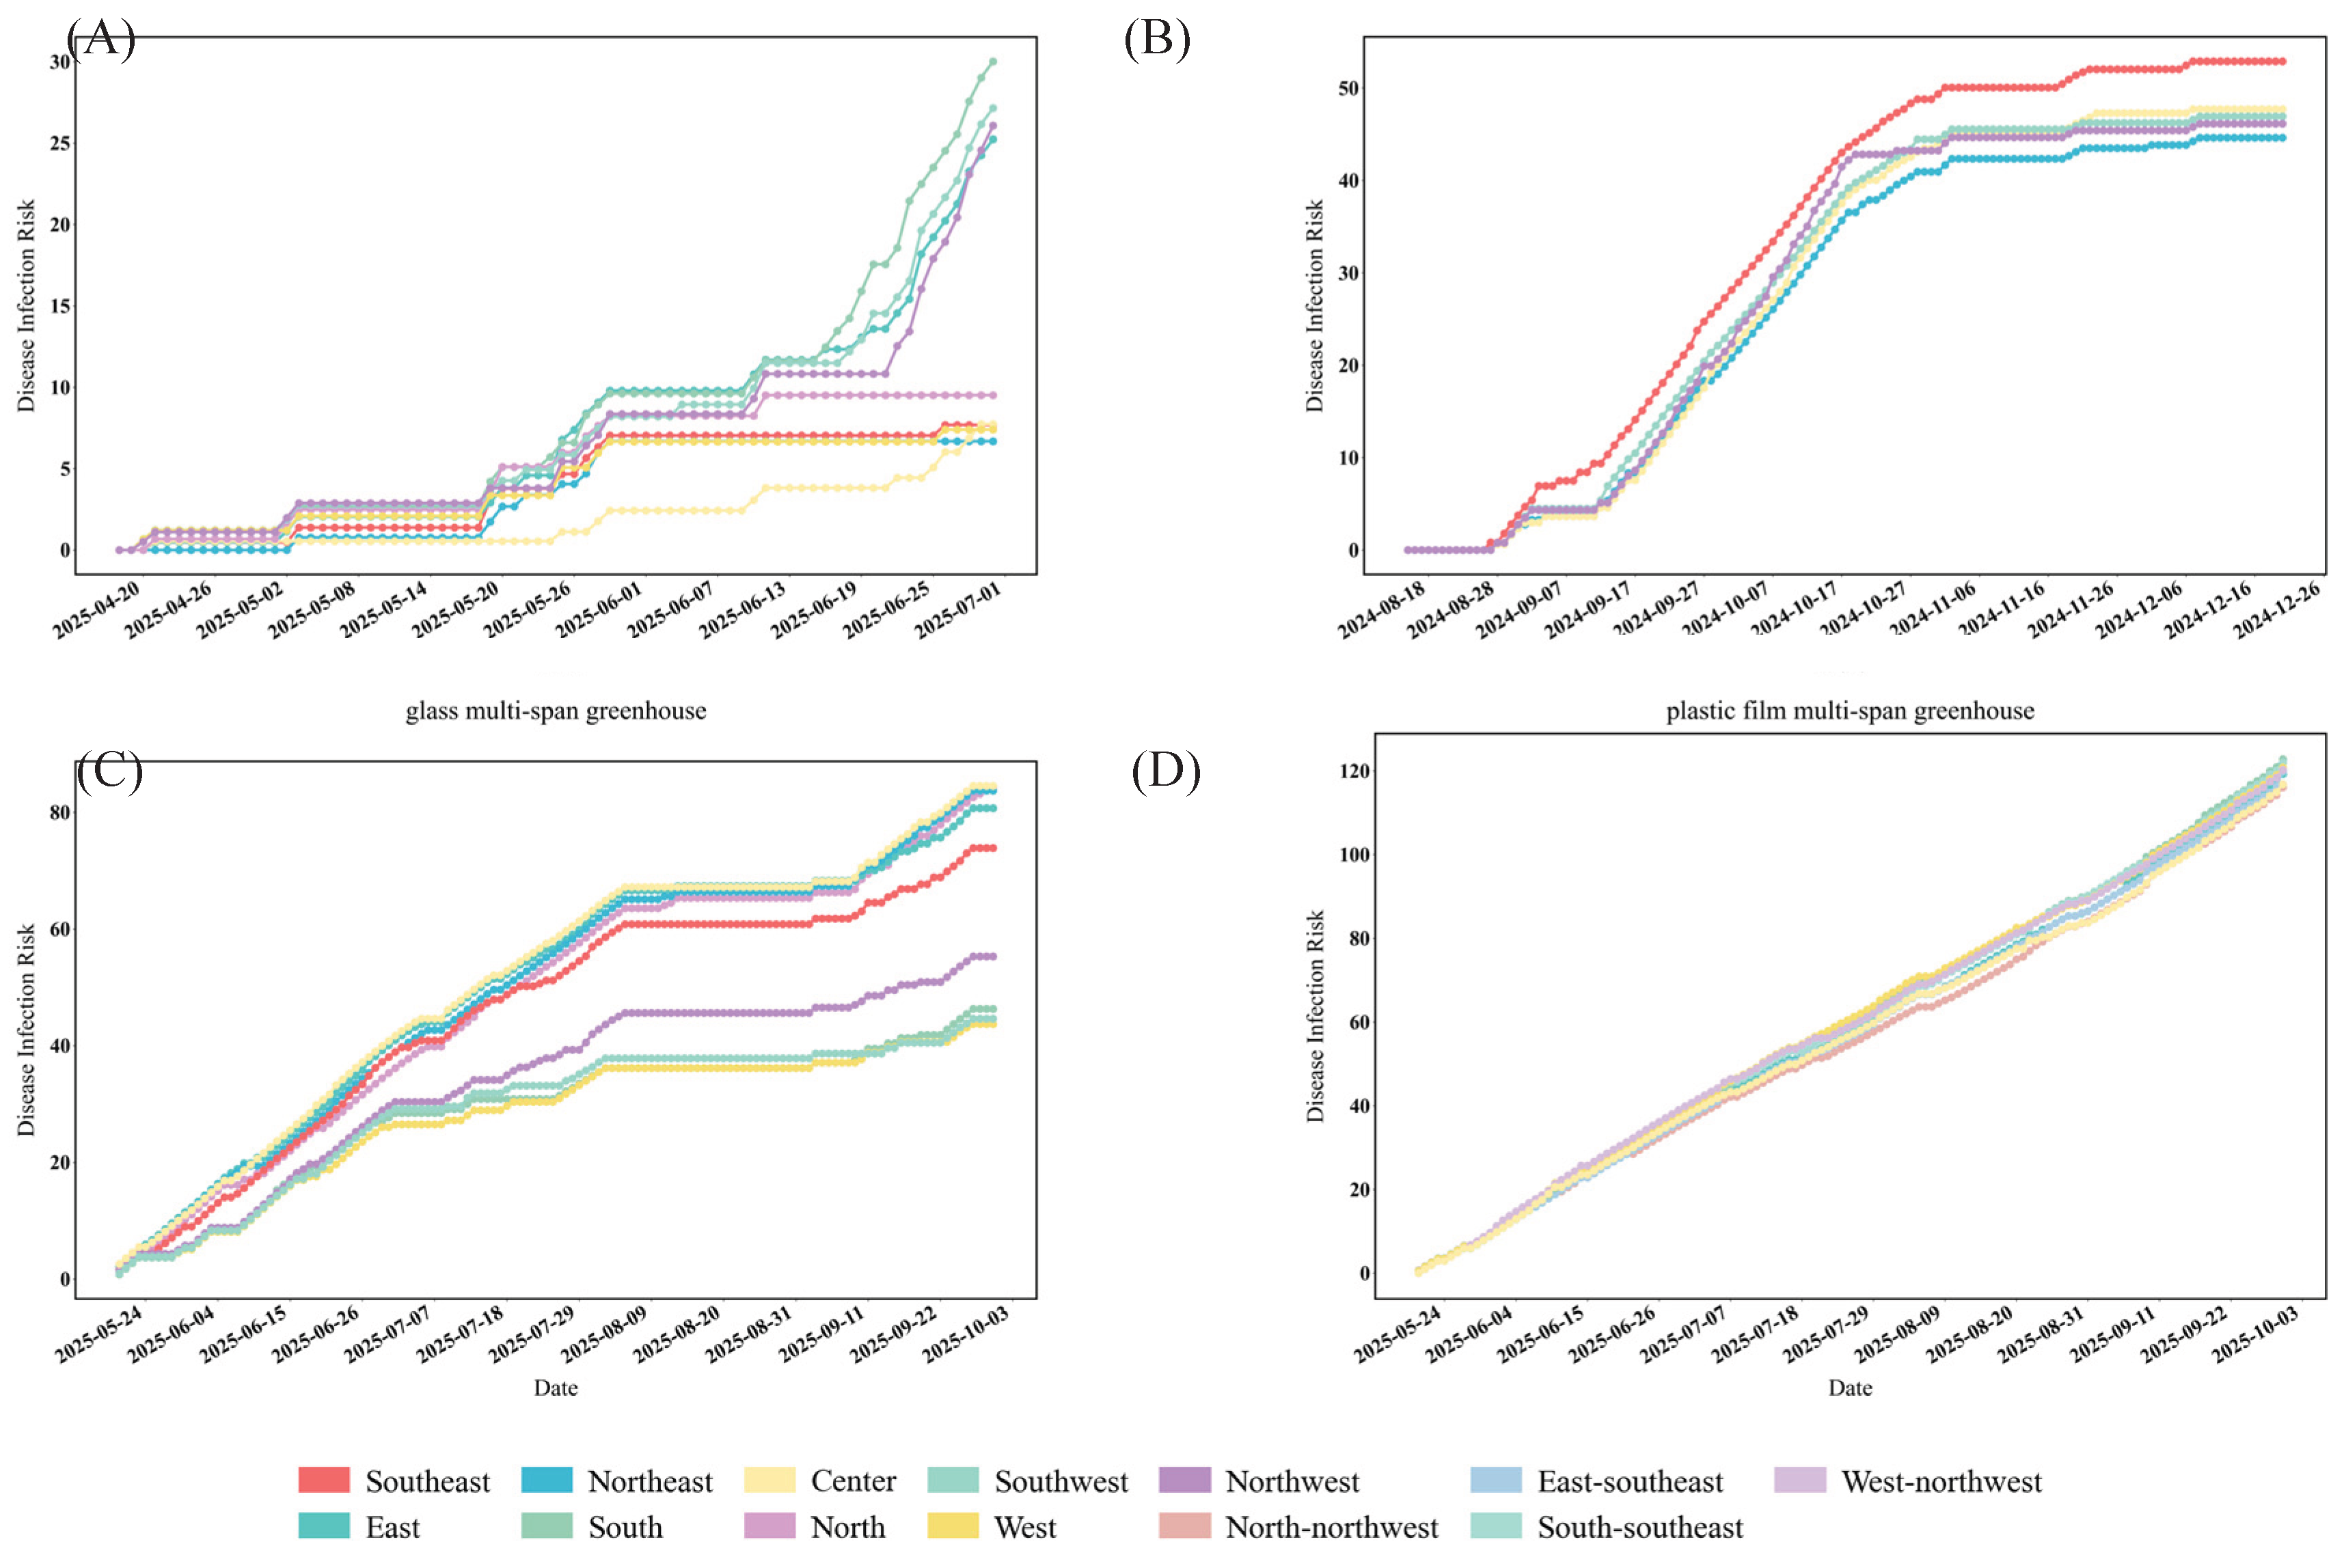
For the spatial distribution of disease infection risk, distinct patterns were observed among the different greenhouse types. In the brick-wall solar greenhouse, elevated infection risk was primarily concentrated in the southern, southwestern, and western positions, with the southern side exhibiting the highest cumulative infection risk value of 30.016. The differences in cumulative infection risk among orientations ranged from 5 to 20. The relative disease risk differences among various positions for the brick-wall solar greenhouse are therefore approximately 17–67%. In the assembled solar greenhouse, high-risk areas were mainly located in the southeastern position, which consistently maintained a higher infection risk throughout the monitoring period. The final cumulative infection risk in this area reached approximately 53, while differences among orientations remained below 5. In the glass multi-span greenhouse, the onset of infection risk occurred nearly simultaneously across all orientations. However, cumulative risk levels varied spatially. Most positions exhibited cumulative infection risk values exceeding 70, whereas the western side and adjacent areas showed relatively lower values, with regional differences ranging from 10 to 20. The relative disease risk differences among various positions for the glass greenhouse are therefore approximately 14–29%. In the plastic film multi-span greenhouse, infection risk initially appeared in localized areas, particularly in the west-northwestern and south-southeastern sectors, before expanding throughout the entire greenhouse. Similar temporal trends in infection risk were shown across all orientations, with highly overlapping risk curves and only minor differences in final cumulative infection risk values.
Figure 13.
Cumulative Risk Line Chart of Cucumber Downy Mildew. (A: Brick wall solar greenhouse; B: Assembled solar greenhouse; C: Glass multi-span Greenhouse; D: Plastic film multi-span greenhouse).
Figure 13.
Cumulative Risk Line Chart of Cucumber Downy Mildew. (A: Brick wall solar greenhouse; B: Assembled solar greenhouse; C: Glass multi-span Greenhouse; D: Plastic film multi-span greenhouse).
4. Discussion
4.1. Temperature and Humidity Differences in Greenhouses
Significant spatial heterogeneity exists within greenhouse environments. Previous studies have demonstrated that the spatial heterogeneity of temperature and humidity is jointly determined by greenhouse structural configuration, enclosure materials, orientation characteristics, and external weather conditions [24,25]. In the present study, a frequency heatmap-based approach was employed to systematically analyze environmental heterogeneity across different greenhouse types under multiple weather conditions. The overall trends obtained were highly consistent with previous findings; however, certain differences were observed in terms of spatial directional patterns and the detailed coupling characteristics between temperature and humidity.
Previous studies have generally reported that temperature distribution in solar greenhouses is characterized by pronounced heat accumulation in the northern position adjacent to the rear wall [26]. In the present study, both the brick-wall solar greenhouse and the assembled solar greenhouse exhibited distinct northeastern high-temperature enhancement zones, particularly under sunny and cloudy conditions, which strongly agrees with earlier observations. These findings further confirm that south-facing solar radiation interception and thermal storage by the rear wall remain the dominant factors governing the spatial thermal environment of solar greenhouses.
However, unlike previous studies primarily based on instantaneous temperature measurements or daily mean values [27], the present study evaluated temperature occurrence frequency and found that even under overcast conditions, the rear-wall and southern positions of solar greenhouses maintained relatively high probabilities of high-temperature occurrence. This indicates that heat-storage structures exert a long-term cumulative effect on thermal stability. These results expand the current understanding of thermal regulation mechanisms in solar greenhouses [28].
Regarding humidity distribution, previous studies have indicated that humidity in solar greenhouses tends to accumulate in low-temperature positions, particularly under restricted ventilation conditions [29]. In the present study, high-humidity frequencies showed substantial spatial overlap with low-temperature frequencies in the southern positions, confirming the widespread negative coupling relationship between temperature and humidity within solar greenhouses.
Overall, the results of the present study are generally consistent with previous investigations on greenhouse microclimate heterogeneity. However, by integrating frequency-based spatial heatmaps and orientation-corrected analyses, this study overcomes the limitations of conventional mean-value approaches, which are often unable to adequately capture internal spatial variability [5]. This spatial distribution-based analytical framework more realistically reflects the long-term microenvironment experienced by crops, particularly when considering the effects of structural parameters such as greenhouse orientation and covering materials on microclimatic conditions. Consequently, it provides a novel and effective perspective for microenvironment assessment and precision greenhouse management [30].
4.2. Factors Affecting Heterogeneity of Temperature and Humidity Spatial Distribution
Comparative analysis of the boxplots (Figure 10 and Figure 11) further demonstrated that the spatial distributions of temperature and humidity within greenhouses were strongly influenced by external microclimatic conditions, although the magnitude and response patterns differed substantially among greenhouse types [31,32].
Under strong radiation conditions, the brick-wall solar greenhouse exhibited the largest humidity and temperature differences on sunny days compared with other weather conditions, indicating that enhanced solar radiation not only increased transpiration rates but also intensified the spatial non-uniformity of thermal and moisture distribution within the greenhouse [33]. By comparison, the assembled Greenhouse displayed pronounced temperature and humidity differences under both sunny and cloudy conditions [34]. In particular, the median humidity difference in the BC group reached approximately 10.4%, accompanied by relatively high temperature differences. Zhang et al. [16] demonstrated that the lightweight structure and relatively weak ventilation capacity of prefabricated greenhouses render their internal microclimate more sensitive to external radiation forcing. The glass multi-span greenhouse exhibited the strongest spatial heterogeneity, particularly under sunny, cloudy, and overcast conditions, where the boxplot ranges of temperature and humidity differences were substantially broader. This suggests that the large spatial scale and highly transparent covering materials promoted the accumulation of heat and moisture [30].
4.3. Spatial Variation of Cucumber Yields in Greenhouses
From a spatial perspective, the distributions of high- and low-yield zones differed markedly among greenhouse types, although the overall patterns were generally consistent with previous findings regarding spatial heterogeneity in greenhouse microclimates. In the brick-wall solar greenhouse, the north position exhibited the highest yield, whereas the eastern position showed the lowest yield, indicating pronounced environmental non-uniformity within this greenhouse type. In the assembled solar greenhouse, yield differences among orientations were substantially reduced, indicating that structural consistency and relatively balanced environmental conditions effectively weakened spatial heterogeneity. This interpretation is supported by the findings of Zheng et al. [14].
Overall, although the magnitude and pattern of spatial variation differed among greenhouse types, all four greenhouses exhibited position-dependent differences in cumulative yield. These spatial differences generally corresponded to the previously identified temperature distribution patterns, indicating that long-term spatial heterogeneity in the greenhouse thermal environment can accumulate over the growing season and ultimately influence crop productivity. Positions experiencing more favorable thermal conditions consistently produced higher cumulative yields, whereas persistently cooler or thermally unstable areas exhibited reduced productivity. These findings highlight the importance of improving environmental uniformity through optimized ventilation, insulation design, and climate control strategies to reduce within-greenhouse yield variability and enhance overall production efficiency [35,36].
4.4. Spatiotemporal Distribution of Disease Risk in Greenhouses
The simulation results of cucumber downy mildew infection risk obtained in this study demonstrated significant differences in both disease development timelines and final disease pressure among greenhouse types. These differences were closely associated with the capacity of each greenhouse structure to regulate temperature and humidity under varying seasonal conditions. Numerous previous studies have reported that the causal pathogen of cucumber downy mildew, Pseudoperonospora cubensis, is highly sensitive to environmental conditions, with spore germination and infection processes strongly dependent on elevated relative humidity and prolonged leaf wetness duration. Disease development is particularly rapid under favorable temperature conditions [37].
The earlier onset of disease observed in solar greenhouses may therefore be associated with insufficient ventilation during the early spring period, which promotes the formation of highly humid microenvironments. Reza et al. [38] demonstrated that solar greenhouses are prone to developing high-humidity conditions during low-temperature seasons, thereby facilitating the early initiation of pathogen infection. In terms of spatial distribution, the risk of disease near the south roof is 17-67% higher, which is consistent with the find by Liu et al. [39,40].
These findings indicate that simply improving the overall level of greenhouse environmental control does not necessarily reduce disease risk. Instead, precise regulation of humidity and ventilation, aimed at actively disrupting environmental conditions favorable for pathogen development, may be more effective than maintaining a highly stable environment in suppressing the occurrence and spread of cucumber downy mildew. This conclusion provides an important theoretical basis for the differentiated management of disease risk among different greenhouse types.
5. Conclusions
This study systematically investigated the long-term spatial heterogeneity of temperature and relative humidity in four representative greenhouse types and quantified its effects on cucumber yield distribution and downy mildew infection risk. A spatial frequency-based analytical framework was developed to reveal persistent environmental hotspots that are difficult to identify using conventional average-value analyses. The principal conclusions are as follows.
(1) A spatial frequency analysis method was proposed to characterize long-term greenhouse environmental heterogeneity. Unlike conventional approaches based on mean values or instantaneous measurements, the proposed method successfully identified persistent high- and low-temperature/humidity hotspots and provided a more realistic description of the microenvironment experienced by crops throughout the growing season.
(2) Greenhouse structure primarily determined the spatial distribution of temperature and humidity heterogeneity, while solar radiation controlled its temporal intensity. The assembled solar greenhouse exhibited the most homogeneous thermal and humidity environment among all greenhouse types, whereas the brick-wall solar greenhouse and the glass multi-span greenhouse showed pronounced spatial gradients. Across all greenhouse types, environmental heterogeneity increased under sunny conditions and decreased under overcast conditions, demonstrating the dominant influence of solar radiation on greenhouse microclimate variability.
(3) Environmental heterogeneity produced significant spatial differences in cucumber productivity. The assembled solar greenhouse exhibited the smallest within-greenhouse yield variation (5.3%), indicating superior environmental uniformity and production stability. In contrast, the glass multi-span greenhouse exhibited the largest spatial yield variation (39.2%), suggesting that localized overheating substantially reduced crop productivity. These results demonstrate that improving environmental uniformity can effectively enhance yield consistency within greenhouses.
(4) The mechanistic disease simulations revealed clear spatial aggregation of cucumber downy mildew risk. The southern side of the brick-wall solar greenhouse consistently represented the highest-risk infection region, where cumulative disease risk was 17-67% higher than that of other positions because of persistent high-humidity conditions. This finding suggests that localized environmental heterogeneity, rather than greenhouse-average climate, governs disease development and should therefore become a priority target for precision environmental regulation.
Overall, this study establishes an integrated framework that links greenhouse environmental heterogeneity, crop productivity, and disease risk. The proposed methodology provides a practical approach for evaluating greenhouse environmental quality and demonstrates that future greenhouse climate control should shift from uniform average regulation to spatially differentiated precision management. The findings offer valuable guidance for greenhouse structural optimization, intelligent environmental control, targeted disease prevention, and the development of digital greenhouse management systems.
Author Contributions
Conceptualization, formal analysis and methodology, Y.S., R.L. and T.J.; investigation; data curation, Y.S., M.Y., J.Z., Q.L. H.H. and R.L.; writing—original draft preparation, Y.S. and R.L.; writing—review and editing, R.L. and M.D.; visualization, Y.S. and R.L.; funding acquisition, R.L., M.D. and T.J. All authors have read and agreed to the published version of the manuscript.
Funding
This work has been funded by the Youth Project of the National Natural Science Foundation of China (32302453), the National Talent Plan Project (KZ617201, CZ007101), and the Tianchi Talent Young Doctor Project (CZ007123).
Data Availability Statement
The original contributions presented in this study are included in the article. Further inquiries can be directed to the corresponding author.
Acknowledgments
The authors would like to thank the College of Horticulture, Zhejiang A&F University for the support and cooperation, without which this research would not be possible.
Conflicts of Interest
The authors declare no conflicts of interest.
References
- Tomar, A. Enhancing crop productivity in photovoltaic greenhouses using extended PAR-based photosynthesis. Sol. Energy 2024, 276, 112689. [Google Scholar] [CrossRef]
- Djibrilla, A.S.M.; Rabani, A.; Illyassou, K.M.; Issa, S.M.; Abdourahimou, K.N.; Abdoulkader, A.H.; Aissetou, D.Y. Improving tomatoes quality in the Sahel through organic cultivation under photovoltaic greenhouse as a climate change adaptation and mitigation strategy. Sci. Rep. 2024, 14, 19396. [Google Scholar] [CrossRef] [PubMed]
- Thakur, A.K.; Ahsan, T.A.; Islam, M.S.; Ahamed, M.S. Spectrally engineered greenhouse cool cover for energy and water efficiency in diverse climates. Adv. Energy Sustain. Res. 2025, 6, 2500217. [Google Scholar] [CrossRef]
- Cayli, A. Temperature and relative humidity spatial variability: an assessment of the environmental conditions inside greenhouse. Fresenius Environ. Bull. 2020, 29, 4954–4962. [Google Scholar]
- Brentarolli, E.; Locatelli, S.; Nicoletto, C.; Sambo, P.; Quaglia, D.; Muradore, R. A spatio-temporal methodology for greenhouse microclimatic mapping. PLoS ONE 2024, 19, e0310454. [Google Scholar] [CrossRef] [PubMed]
- Liu, R.; Bournet, P.E.; Guzmán, J.L.; Tingting, Q.; Li, M.; Yang, X. Variation analysis of natural ventilation and air temperature within a greenhouse cluster using a large-scale 3D CFD modelling. Comput. Electron. Agric. 2026, 240, 111220. [Google Scholar]
- Mohanapriya, S.; Vanitha, S.; Geethalakshmi, V.; Pazhanivelan, S.; Ragunath, K.P.; Sendhilvel, V.; Vanitha, G. Plant health dynamics in accordance with climate change. Physiol. Mol. Plant Pathol. 2025, 138, 102655. [Google Scholar] [CrossRef]
- Mao, Q.; Li, H.; Ji, C.; Peng, Y.; Li, T. Experimental study of ambient temperature and humidity distribution in large multi-span greenhouse based on different crop heights and ventilation conditions. Appl. Therm. Eng. 2024, 248, 123176. [Google Scholar] [CrossRef]
- Villagran, E.; Bojacá, C. Analysis of the microclimatic behavior of a greenhouse used to produce carnation (Dianthus caryophyllus L.). Ornam. Hortic. 2020, 26, 190–204. [Google Scholar] [CrossRef]
- Villagrán, E.; Flores-Velazquez, J.; Akrami, M.; Bojacá, C. Microclimatic evaluation of five types of Colombian greenhouses using geostatistical techniques. Sensors 2022, 22, 3925. [Google Scholar] [CrossRef] [PubMed]
- Wei, X.; Li, B.; Lu, H.; Guo, J.; Dong, Z.; Yang, F.; Lü, E.; Liu, Y. Distribution characteristics and prediction of temperature and relative humidity in a South China greenhouse. Agronomy 2024, 14, 1580. [Google Scholar] [CrossRef]
- Li, H.; Zong, C.; Lu, J.; Zhao, S.; Yang, D.; Song, W. Experimental study on spatiotemporal variation patterns of thermal environment in the large-span insulated greenhouse. Appl. Therm. Eng. 2025, 264, 125530. [Google Scholar] [CrossRef]
- Sokolidi, A.; Webster, R.; Milne, A.; Bielik, M.; Morley, P.; Clarkson, J.P.; West, J.S. Spatial characteristics of the fungus powdery mildew (Erysiphe neolycopersici) on tomatoes and its spread in industrial greenhouses. Biostat. Res. 2023, 1, 18–30. [Google Scholar] [CrossRef]
- Zheng, L.; Zhang, Q.; Zheng, K.; Zhao, S.; Wang, P.; Cheng, J.; Zhang, X.; Chen, X. Effects of diffuse light on microclimate of solar greenhouse, and photosynthesis and yield of greenhouse-grown tomatoes. HortScience 2020, 55, 1605–1613. [Google Scholar] [CrossRef]
- Carguachi Gamboy, L.I.; León, J.E.; Peralta Culcay, M.E.; Suárez Tapia, A.L. Differences in biomass accumulation in the cultivation of lettuce (Lactuca sativa L.) var. Batavia under two greenhouses: traditional and heated. ESPOCH Congr. 2024, 3, 146–158. [Google Scholar] [CrossRef]
- Zhang, C.; Mao, H.; Wu, D.; Liu, Y.; Yang, Q.; Deng, B.; Guan, Z.; Ding, B.; Chen, F. Climatic heterogeneity in a large chrysanthemum greenhouse resolved by a LoRa-based wireless sensor network. Sci. Hortic. 2025, 344, 114109. [Google Scholar]
- Liu, R.; Li, M.; Guzmán, J.L.; Rodríguez, F. A fast and practical one-dimensional transient model for greenhouse temperature and humidity. Comput. Electron. Agric. 2021, 186, 106186. [Google Scholar] [CrossRef]
- Liu, K.; Ji, T.; Li, M.; Yang, X.; Sun, J.; Liu, H.; Liu, R. Prediction of greenhouse temperature and humidity across growing seasons: Hybridization of process-based model and deep neural networks. Inf. Process. Agric. 2026, 13, 238–252. [Google Scholar]
- Ding, X.; Jiang, Y.; Hui, D.; He, L.; Huang, D.; Yu, J.; Zhou, Q. Model simulation of cucumber yield and microclimate analysis in a semi-closed greenhouse in China. HortScience 2019, 54, 547–554. [Google Scholar] [CrossRef]
- Cohen, Y. The combined effects of temperature, leaf wetness, and inoculum concentration on infection of cucumbers with Pseudoperonospora cubensis. Can. J. Bot. 1977, 55, 1478–1487. [Google Scholar] [CrossRef]
- Magarey, R.D.; Sutton, T.B.; Thayer, C.L. A simple generic infection model for foliar fungal plant pathogens. Phytopathology 2005, 95, 92–100. [Google Scholar] [CrossRef] [PubMed]
- Neufeld, K.N.; Ojiambo, P.S. Interactive effects of temperature and leaf wetness duration on sporangia germination and infection of cucurbit hosts by Pseudoperonospora cubensis. Plant Dis. 2012, 96, 345–353. [Google Scholar] [CrossRef] [PubMed]
- Sun, S.; Lian, S.; Feng, S.; Dong, X.; Wang, C.; Li, B.; Liang, W. Effects of temperature and moisture on sporulation and infection by Pseudoperonospora cubensis. Plant Dis. 2017, 101, 562–567. [Google Scholar] [CrossRef] [PubMed]
- Li, G.; Tang, L.; Zhang, X.; Dong, J.; Xiao, M. Factors affecting greenhouse microclimate and its regulating techniques: a review. IOP Conf. Ser. Earth Environ. Sci. 2018, 167, 012019. [Google Scholar] [CrossRef]
- Liu, H.; Meng, F.; Yan, Z.; Shi, Y.; Tian, S.; Yang, Y.; Li, X. Dynamic simulation of photothermal environment in solar greenhouse based on COMSOL multiple physical fields. Agriculture 2025, 15, 187. [Google Scholar] [CrossRef]
- Yang, Y.; Li, Y.L.; Wen, X.Z. Comparative studies of patterns of variation of daily temperature differences inside the north wall in Chinese solar greenhouses of three different designs during cold periods. Acta Hortic. 2017, 1227, 189–196. [Google Scholar]
- Katsoulas, N.; Kittas, C.; Bartzanas, T. Microclimate distribution in a greenhouse cooled by a fog system. Acta Hortic. 2010, 927, 773–778. [Google Scholar]
- Guan, Y.; Chen, Y.; Zhou, L.; Wei, Z.; Hu, W.; Yang, Y. The thermal properties of an active–passive heat storage wall system incorporating phase change materials in a Chinese solar greenhouse. Sustainability 2024, 16, 2624. [Google Scholar] [CrossRef]
- Hou, Y.; Li, A.; Li, Y.; Jin, D.; Tian, Y.; Zhang, D.; Wang, H.; Liu, S.; Lei, W. Analysis of microclimate characteristics in solar greenhouses under natural ventilation. Build. Simul. 2021, 14, 1811–1821. [Google Scholar] [CrossRef]
- Choab, N.; Allouhi, A.; El Maakoul, A.; Kousksou, T.; Saadeddine, S.; Jamil, A. Review on greenhouse microclimate and application: design parameters, thermal modeling and simulation, climate controlling technologies. Sol. Energy 2019, 191, 109–137. [Google Scholar] [CrossRef]
- He, K.S.; Chen, D.Y.; Sun, L.J.; Liu, Z.L.; Huang, Z.Y. The effect of vent openings on the microclimate inside multi-span greenhouses during summer and winter seasons. Eng. Appl. Comput. Fluid Mech. 2015, 9, 399–410. [Google Scholar] [CrossRef]
- Shamshiri, R.R.; Jones, J.W.; Thorp, K.R.; Ahmad, D.; Man, H.C.; Taheri, S. Review of optimum temperature, humidity, and vapour pressure deficit for microclimate evaluation and control in greenhouse cultivation of tomato. Int. Agrophys. 2018, 32, 287–302. [Google Scholar] [CrossRef]
- Gong, X.; Zeng, W.; Ren, T.; Li, Y.; Ge, J.; Li, Y.; Wu, X.; Zhang, T.; Li, H.; Qiu, R. Multi-temporal spectral characteristics of evapotranspiration in greenhouse-grown tomato under deficit irrigation management. Agronomy 2026, 16, 1040. [Google Scholar]
- Zheng, K.; Zhao, S.; Zhou, Q.; Qu, Y.; Wang, P. Preliminary application of diffuse light film in a Chinese solar greenhouse. Acta Hortic. 2017, 1227, 249–256. [Google Scholar]
- Lu, J.; Li, H.; He, X.; Zong, C.; Song, W.; Zhao, S. CFD simulation and uniformity optimization of the airflow field in Chinese solar greenhouses using the multifunctional fan–coil unit system. Agronomy 2023, 13, 197. [Google Scholar] [CrossRef]
- Zhang, Y.; Chen, C.; Fang, H.; Tong, Y. Improving air distribution within lettuce plant canopy by employing double-channel ventilation cultivation system: simulation and experiment study. Agronomy 2025, 15, 2326. [Google Scholar] [CrossRef]
- Lebeda, A.; Cohen, Y. Cucurbit downy mildew (Pseudoperonospora cubensis)–biology, ecology, epidemiology, host-pathogen interaction and control. Eur. J. Plant Pathol. 2011, 129, 157–192. [Google Scholar]
- Reza, M.N.; Islam, M.N.; Iqbal, M.Z.; Kabir, M.S.N.; Chowdhury, M.; Gulandaz, M.A.; Ali, M.; Jang, M.-K.; Chung, S.-O. Spatial, temporal, and vertical variability of ambient environmental conditions in Chinese solar greenhouses during winter. Appl. Sci. 2023, 13, 9835. [Google Scholar] [CrossRef]
- Liu, R.; Liu, J.; Liu, H.; Yang, X.; Bárcena, J.F.B.; Li, M. A 3-D simulation of leaf condensation on cucumber canopy in a solar greenhouse. Biosyst. Eng. 2021, 210, 310–329. [Google Scholar] [CrossRef]
- Liu, K.; Zhang, C.; Yang, X.; Diao, M.; Liu, H.; Li, M. Development of an occurrence prediction model for cucumber downy mildew in solar greenhouses based on long short-term memory neural network. Agronomy 2022, 12, 442. [Google Scholar] [CrossRef]
Figure 1.
Technical Roadmap.
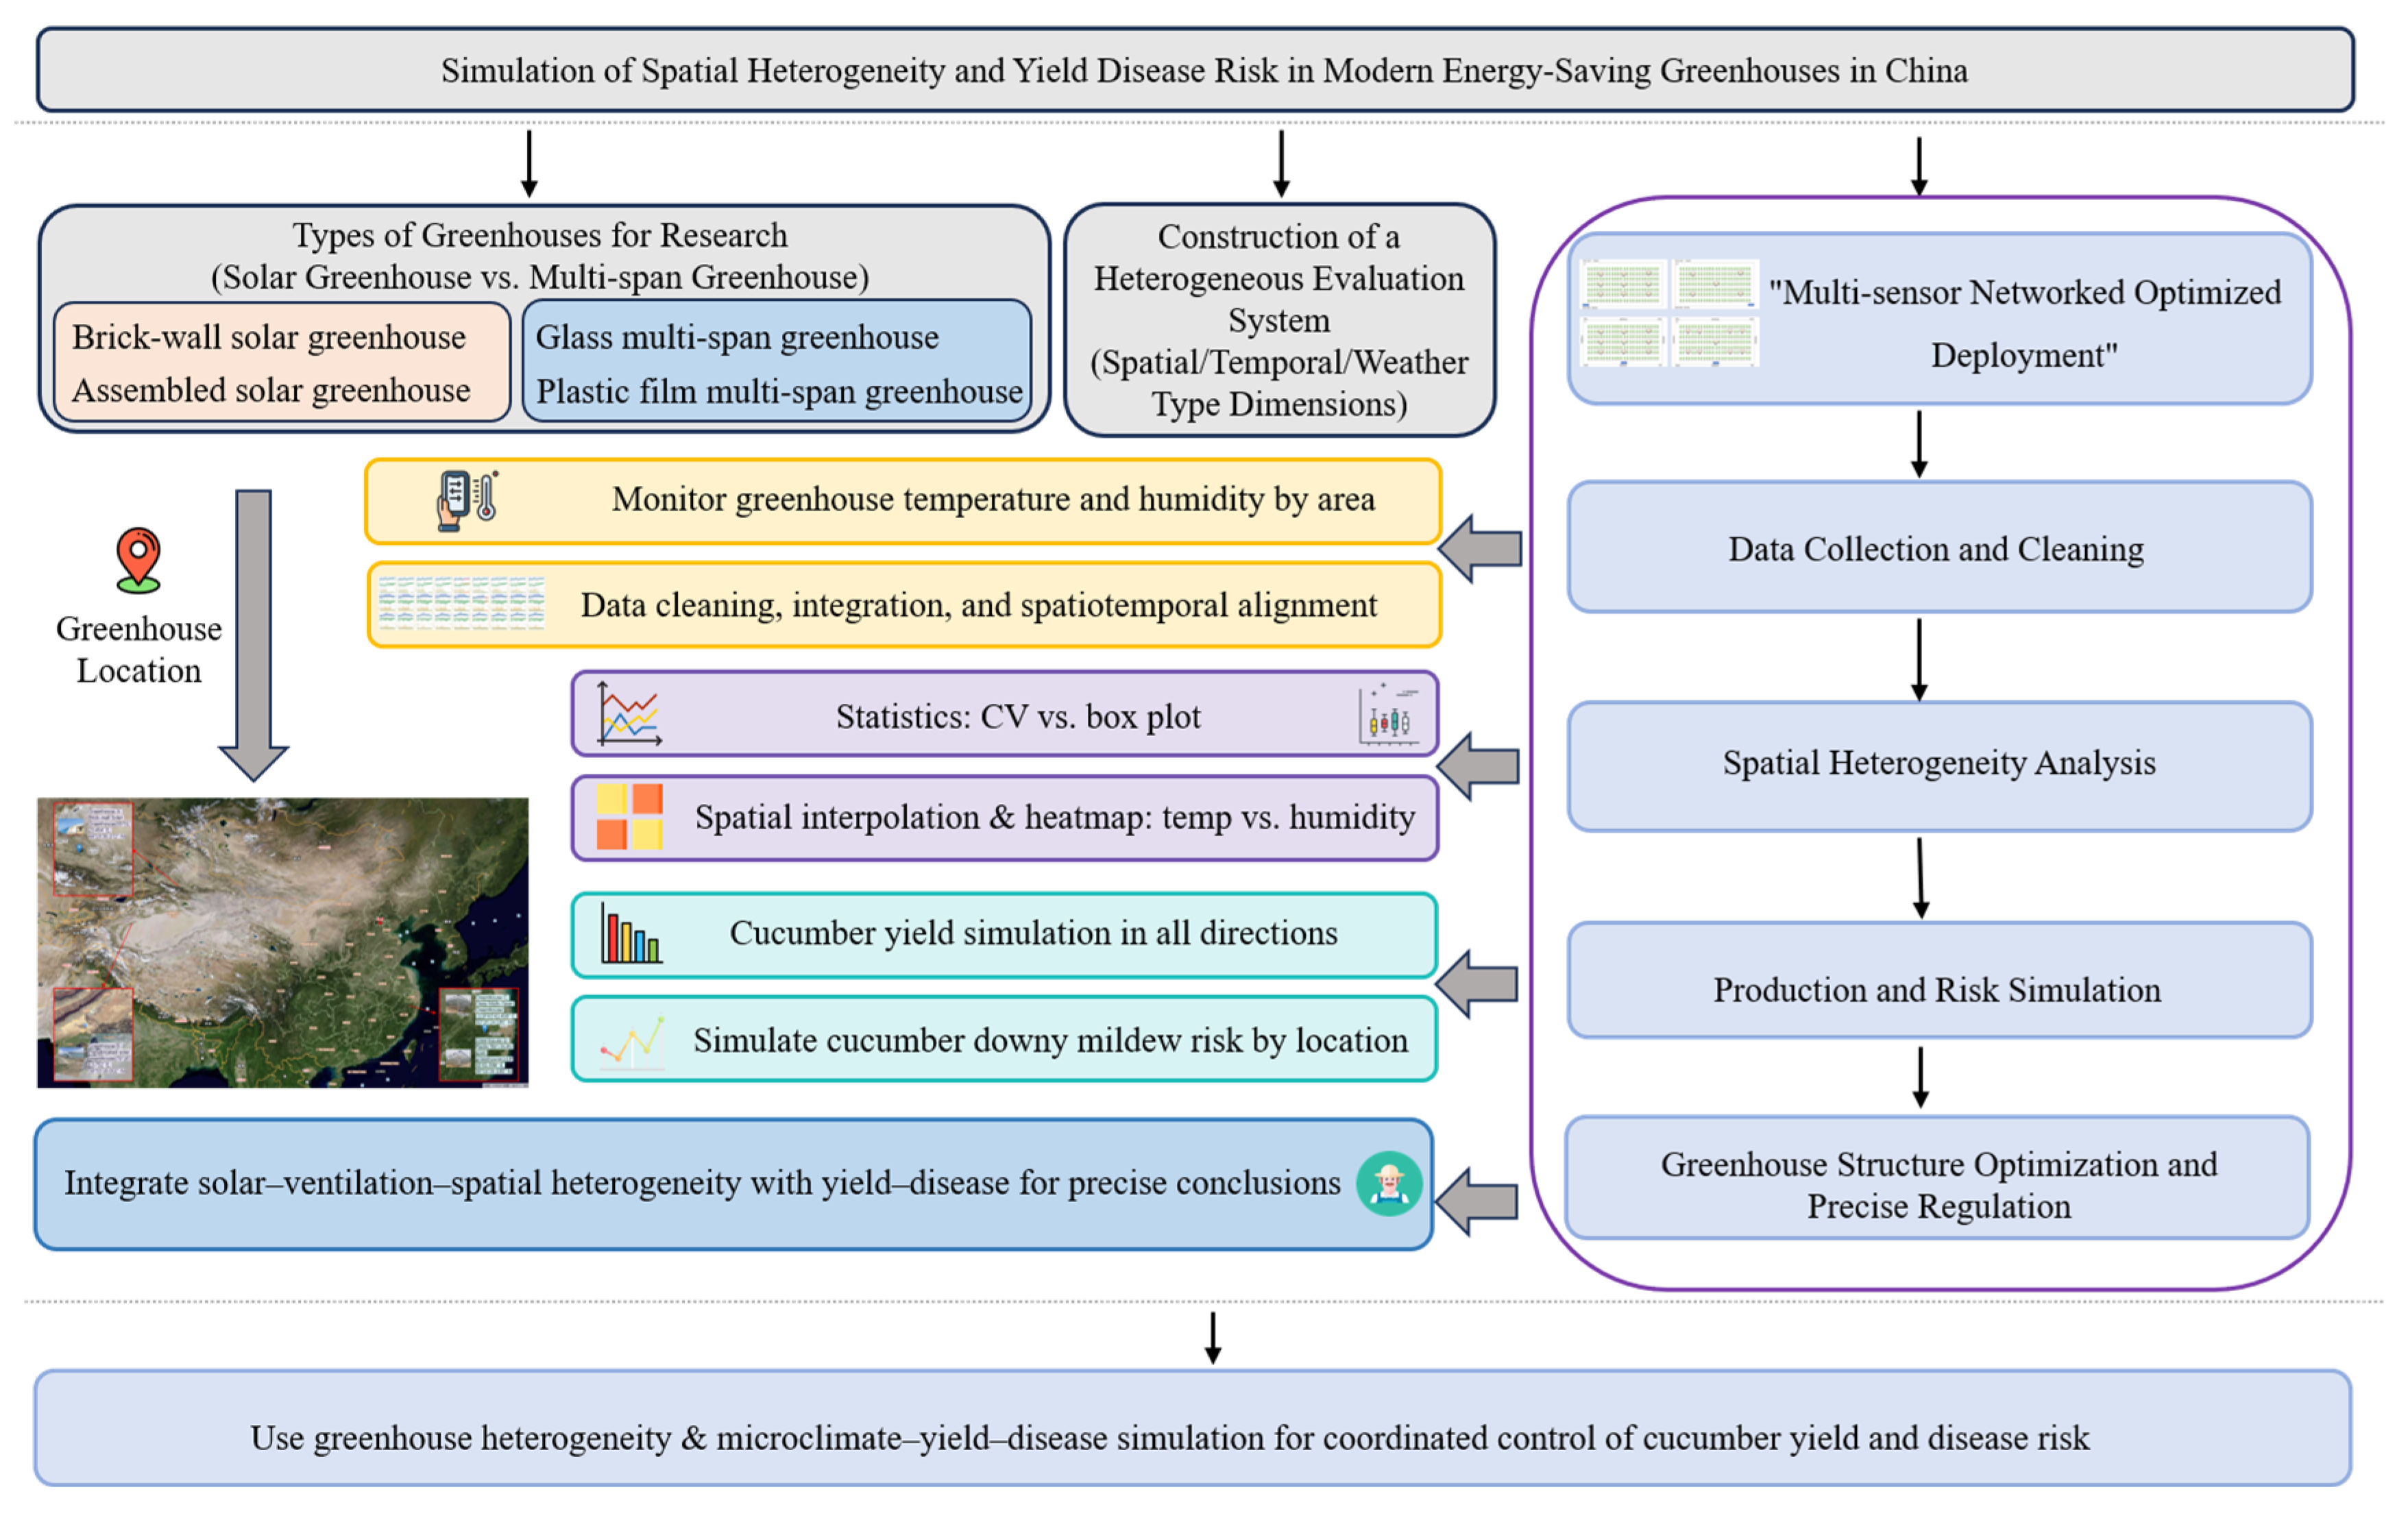
Figure 2.
Overview of greenhouse types and sensor deployment layout; (A) Brick wall solar greenhouse; (B) Assembled solar greenhouse; (C) Glass multi-span greenhouse; (D) Plastic film multi-span greenhouse. Left panels show external views, and right panels illustrate sensor arrangement.
Figure 2.
Overview of greenhouse types and sensor deployment layout; (A) Brick wall solar greenhouse; (B) Assembled solar greenhouse; (C) Glass multi-span greenhouse; (D) Plastic film multi-span greenhouse. Left panels show external views, and right panels illustrate sensor arrangement.
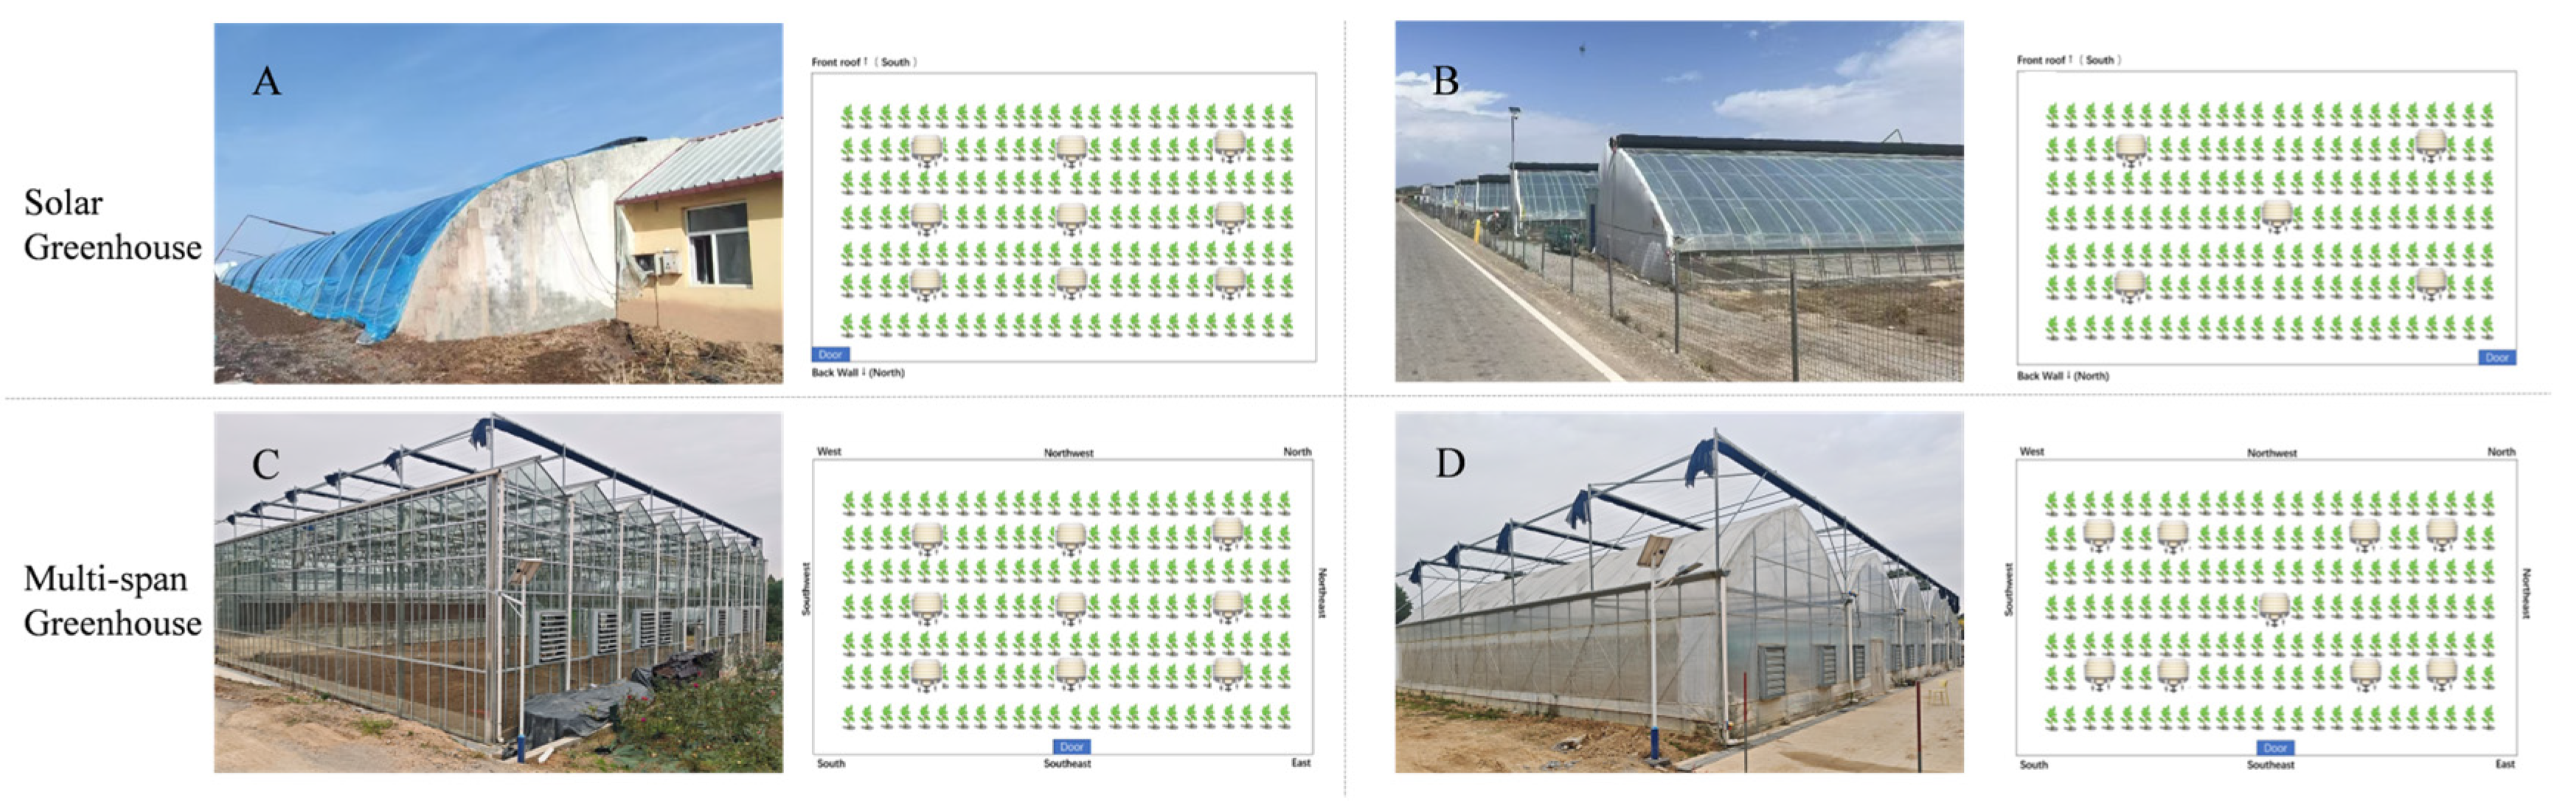
Figure 3.
Interpolation results of missing indoor sensor data. The first row is air temperature, the second row is relative humidity, and the third row is light intensity; the five columns correspond to the southeast, northeast, center, southwest, and northwest measuring positions in the assembled solar greenhouse, respectively.
Figure 3.
Interpolation results of missing indoor sensor data. The first row is air temperature, the second row is relative humidity, and the third row is light intensity; the five columns correspond to the southeast, northeast, center, southwest, and northwest measuring positions in the assembled solar greenhouse, respectively.
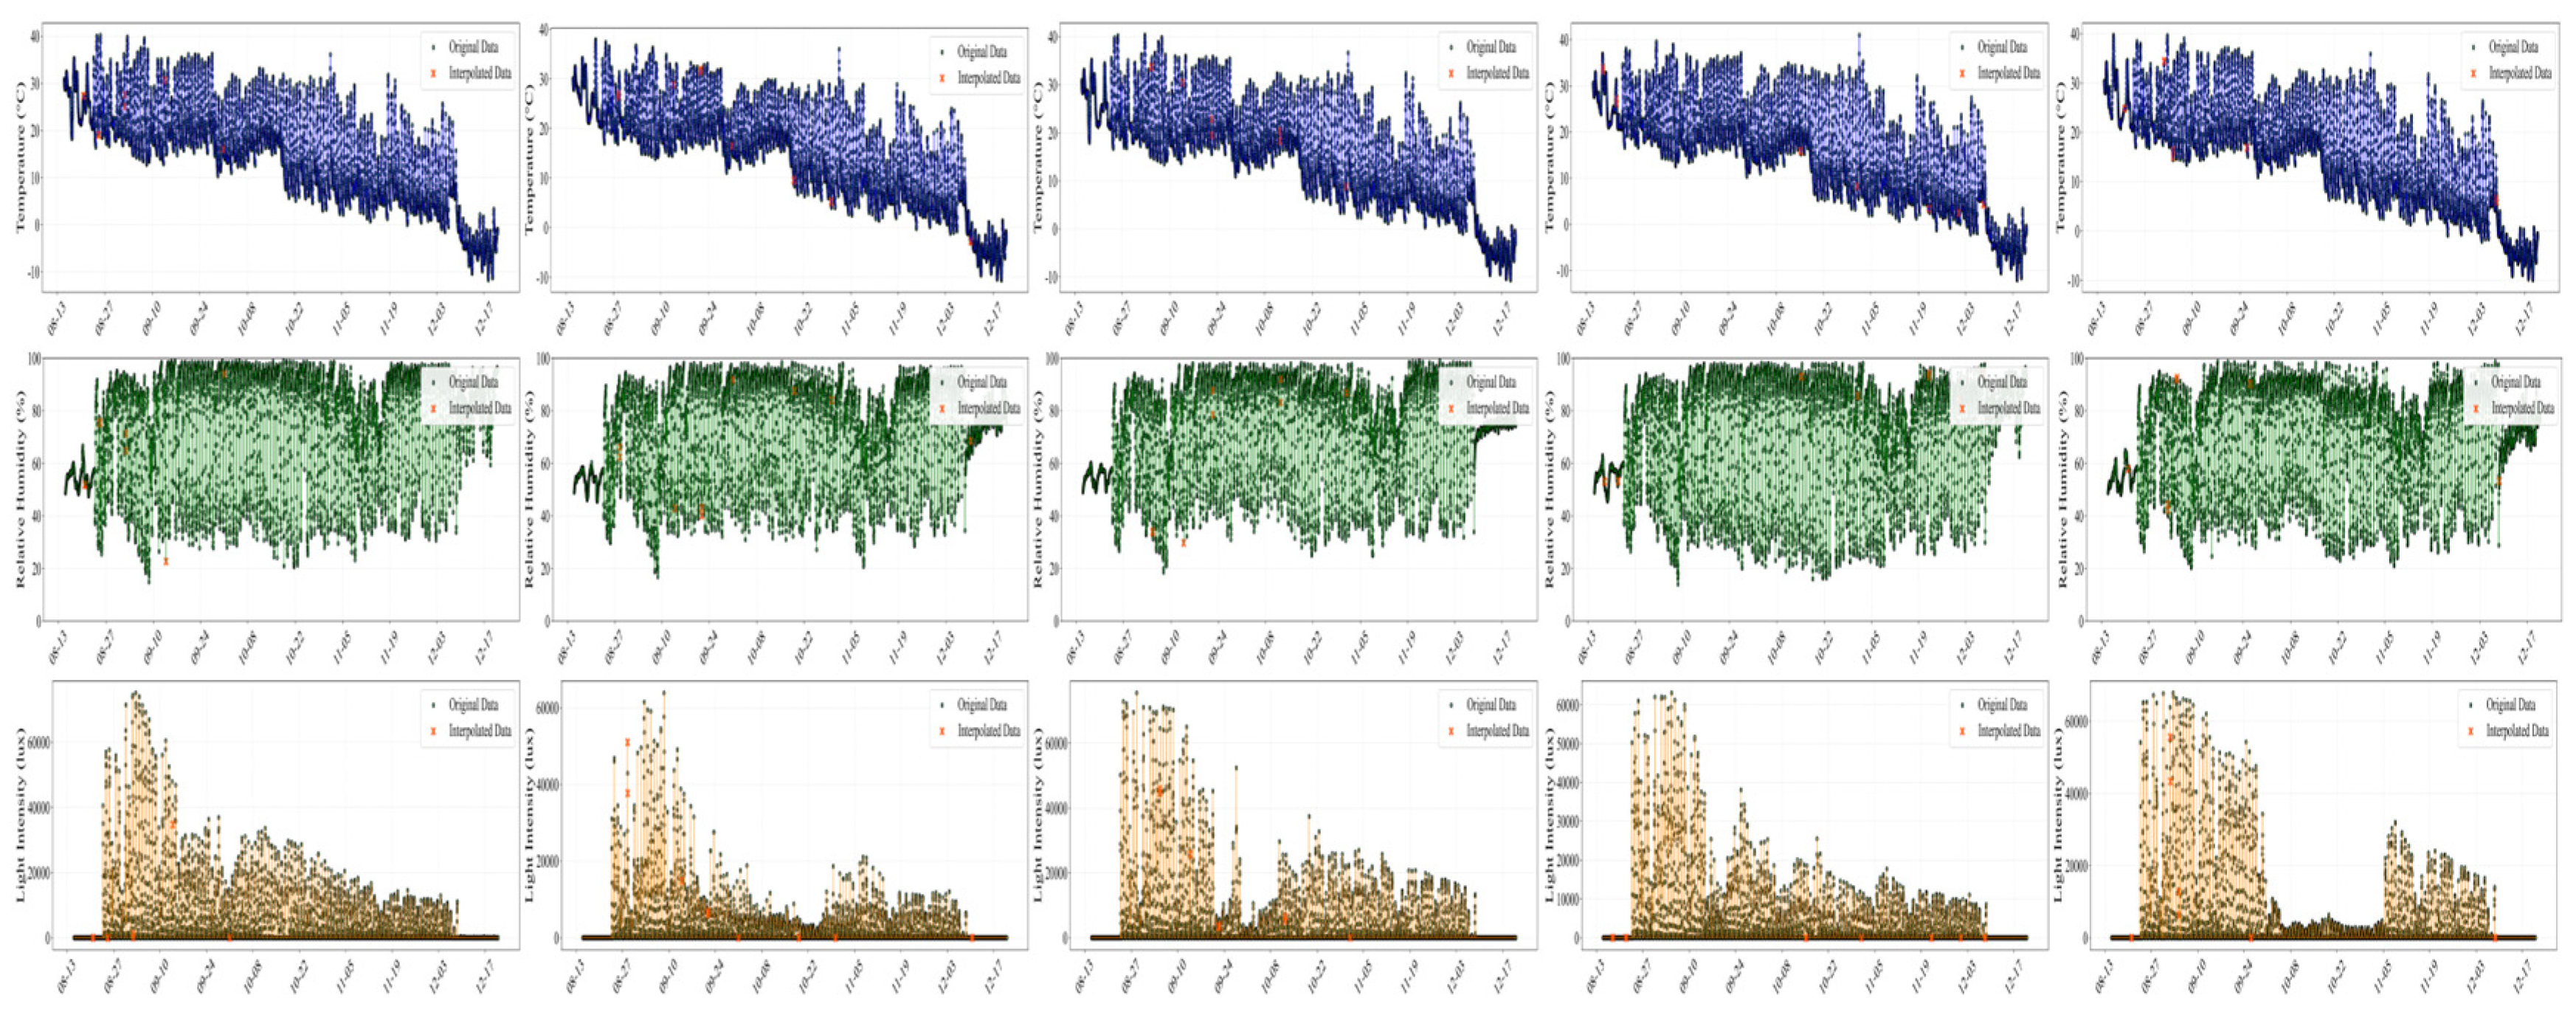
Figure 4.
Heat maps of high-temperature areas in four different types of greenhouses, The values indicate the proportion of high-temperature occurrences (ranked top three across all sites) at each location. (A: Brick wall solar greenhouse, B: Assembled solar greenhouse, C: Glass multi-span greenhouse, D: Plastic film multi-span greenhouse, respectively).
Figure 4.
Heat maps of high-temperature areas in four different types of greenhouses, The values indicate the proportion of high-temperature occurrences (ranked top three across all sites) at each location. (A: Brick wall solar greenhouse, B: Assembled solar greenhouse, C: Glass multi-span greenhouse, D: Plastic film multi-span greenhouse, respectively).
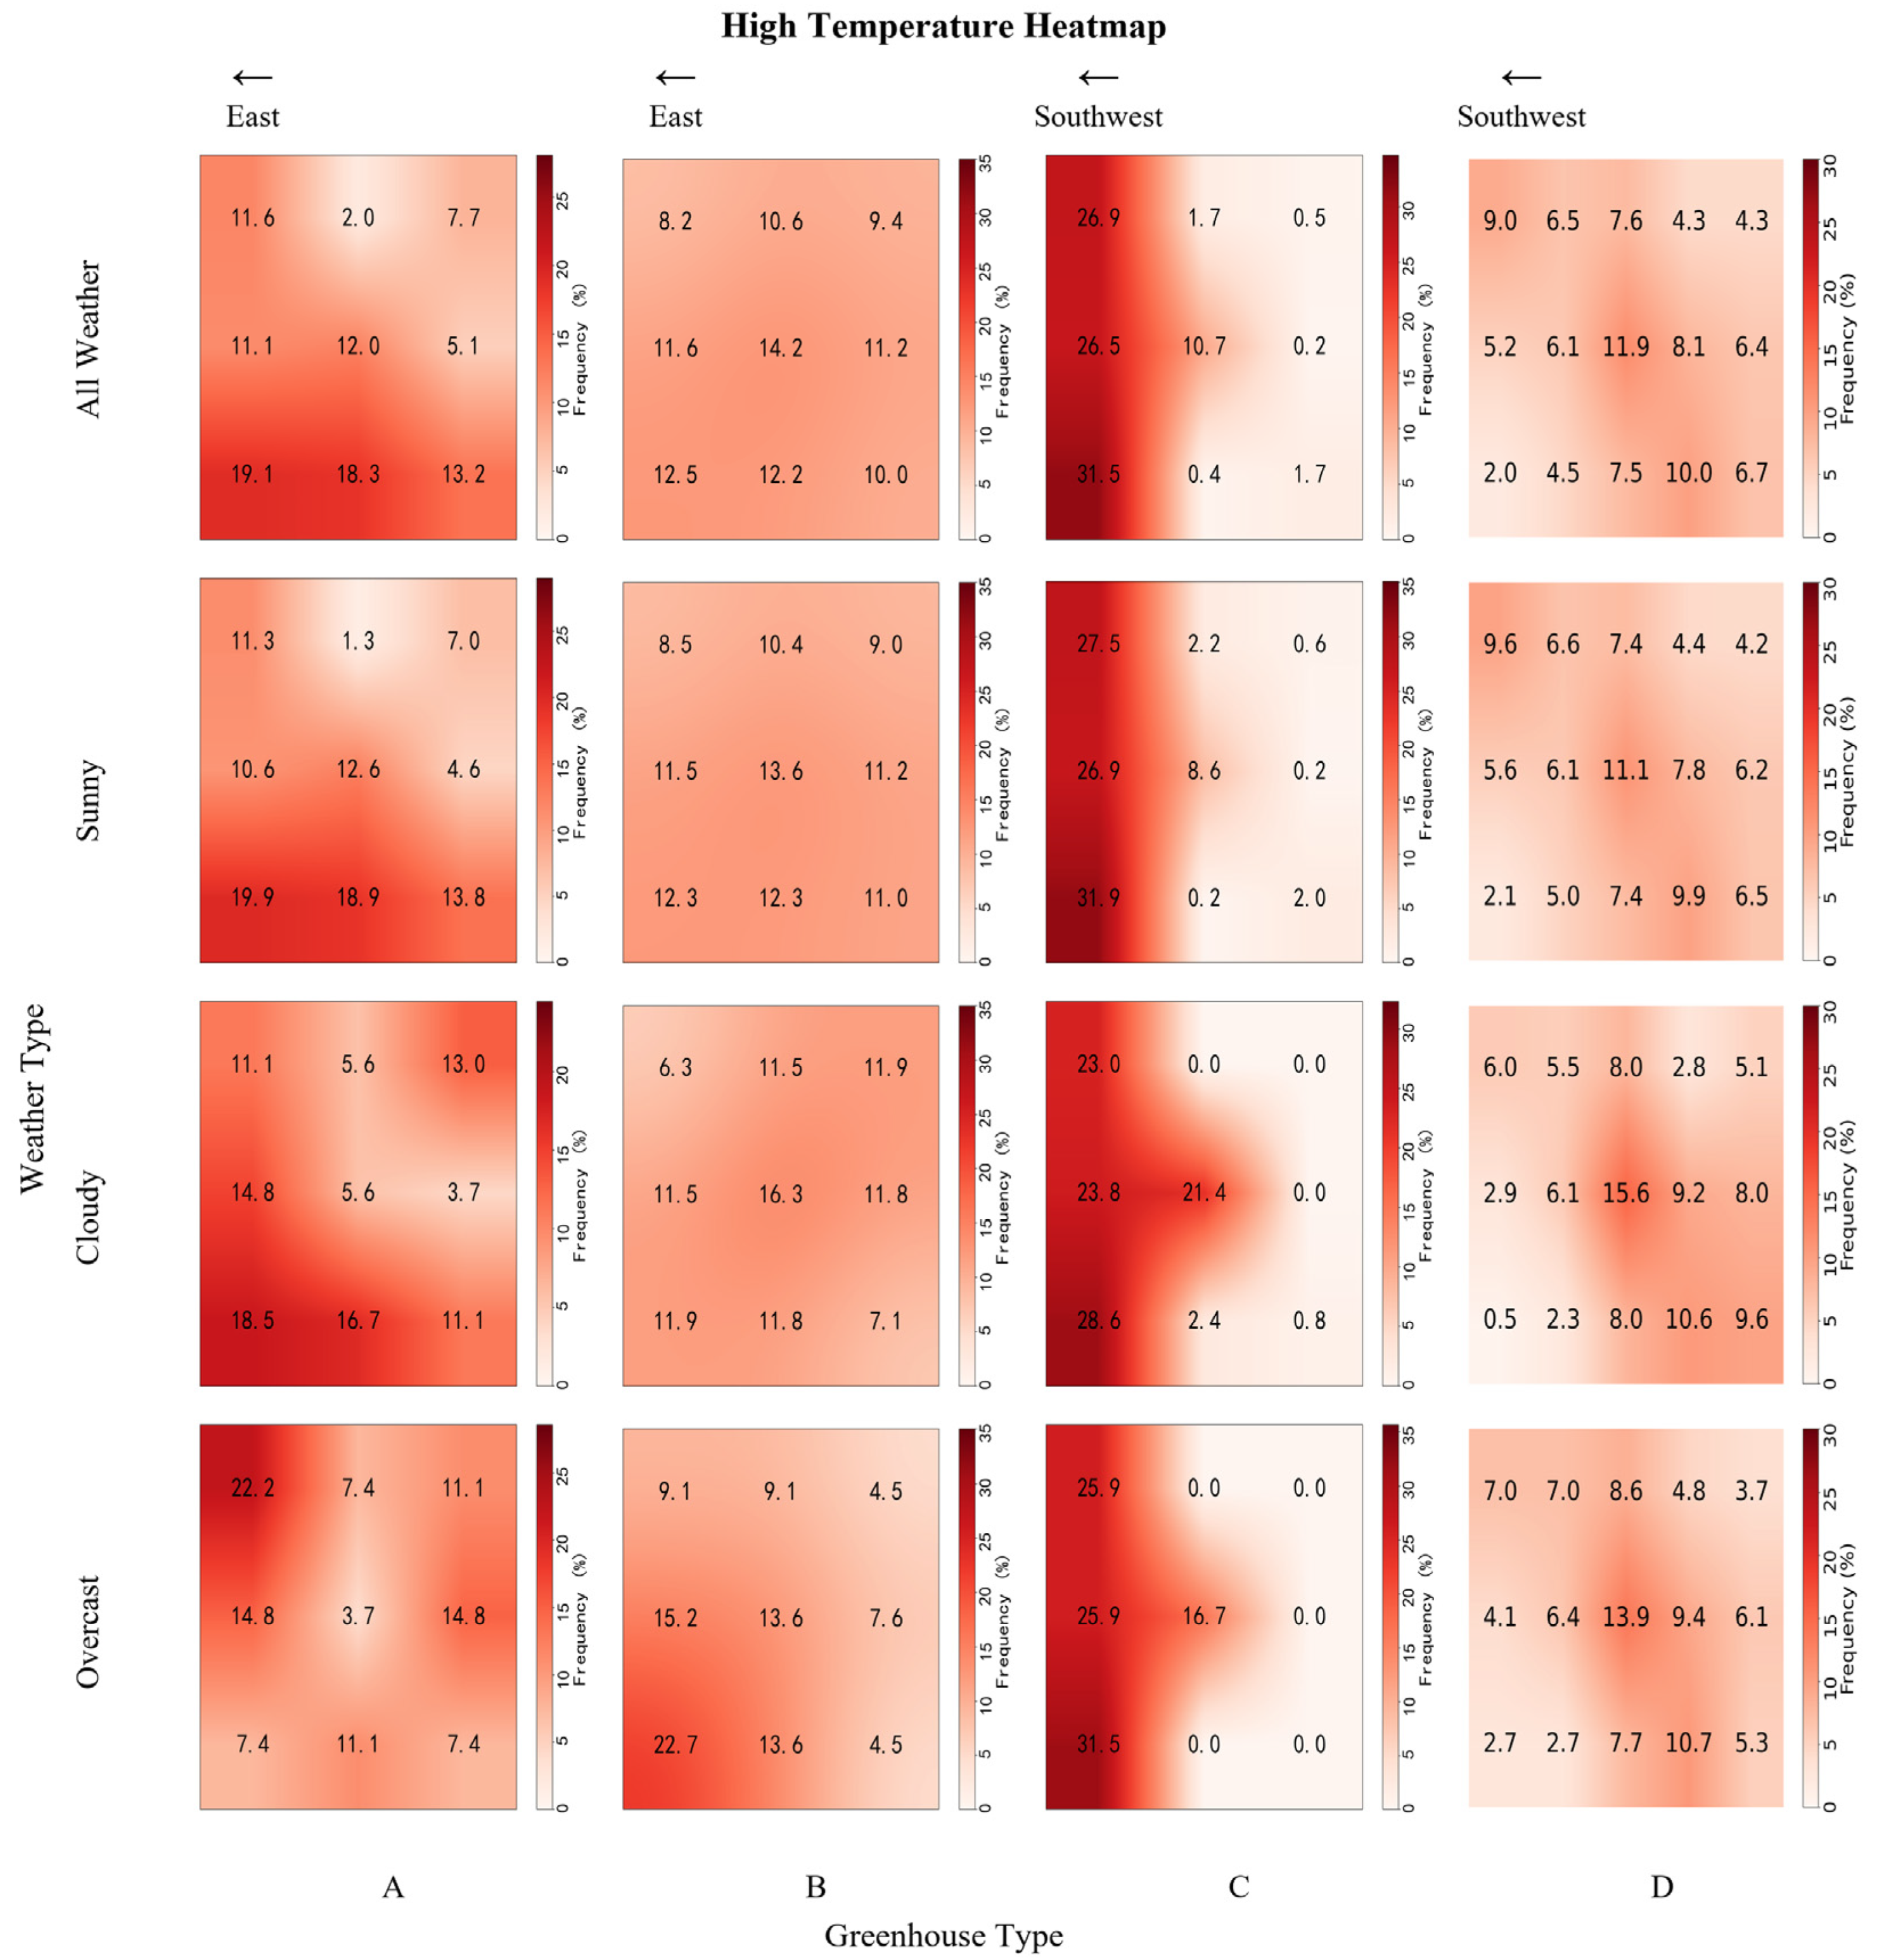
Figure 5.
Heat maps of low-temperature areas in four different types of greenhouses, The values indicate the proportion of low-temperature occurrences (ranked top three across all sites) at each location. (A: Brick wall solar greenhouse, B: Assembled solar greenhouse, C: Glass multi-span greenhouse, D: Plastic film multi-span greenhouse, respectively).
Figure 5.
Heat maps of low-temperature areas in four different types of greenhouses, The values indicate the proportion of low-temperature occurrences (ranked top three across all sites) at each location. (A: Brick wall solar greenhouse, B: Assembled solar greenhouse, C: Glass multi-span greenhouse, D: Plastic film multi-span greenhouse, respectively).
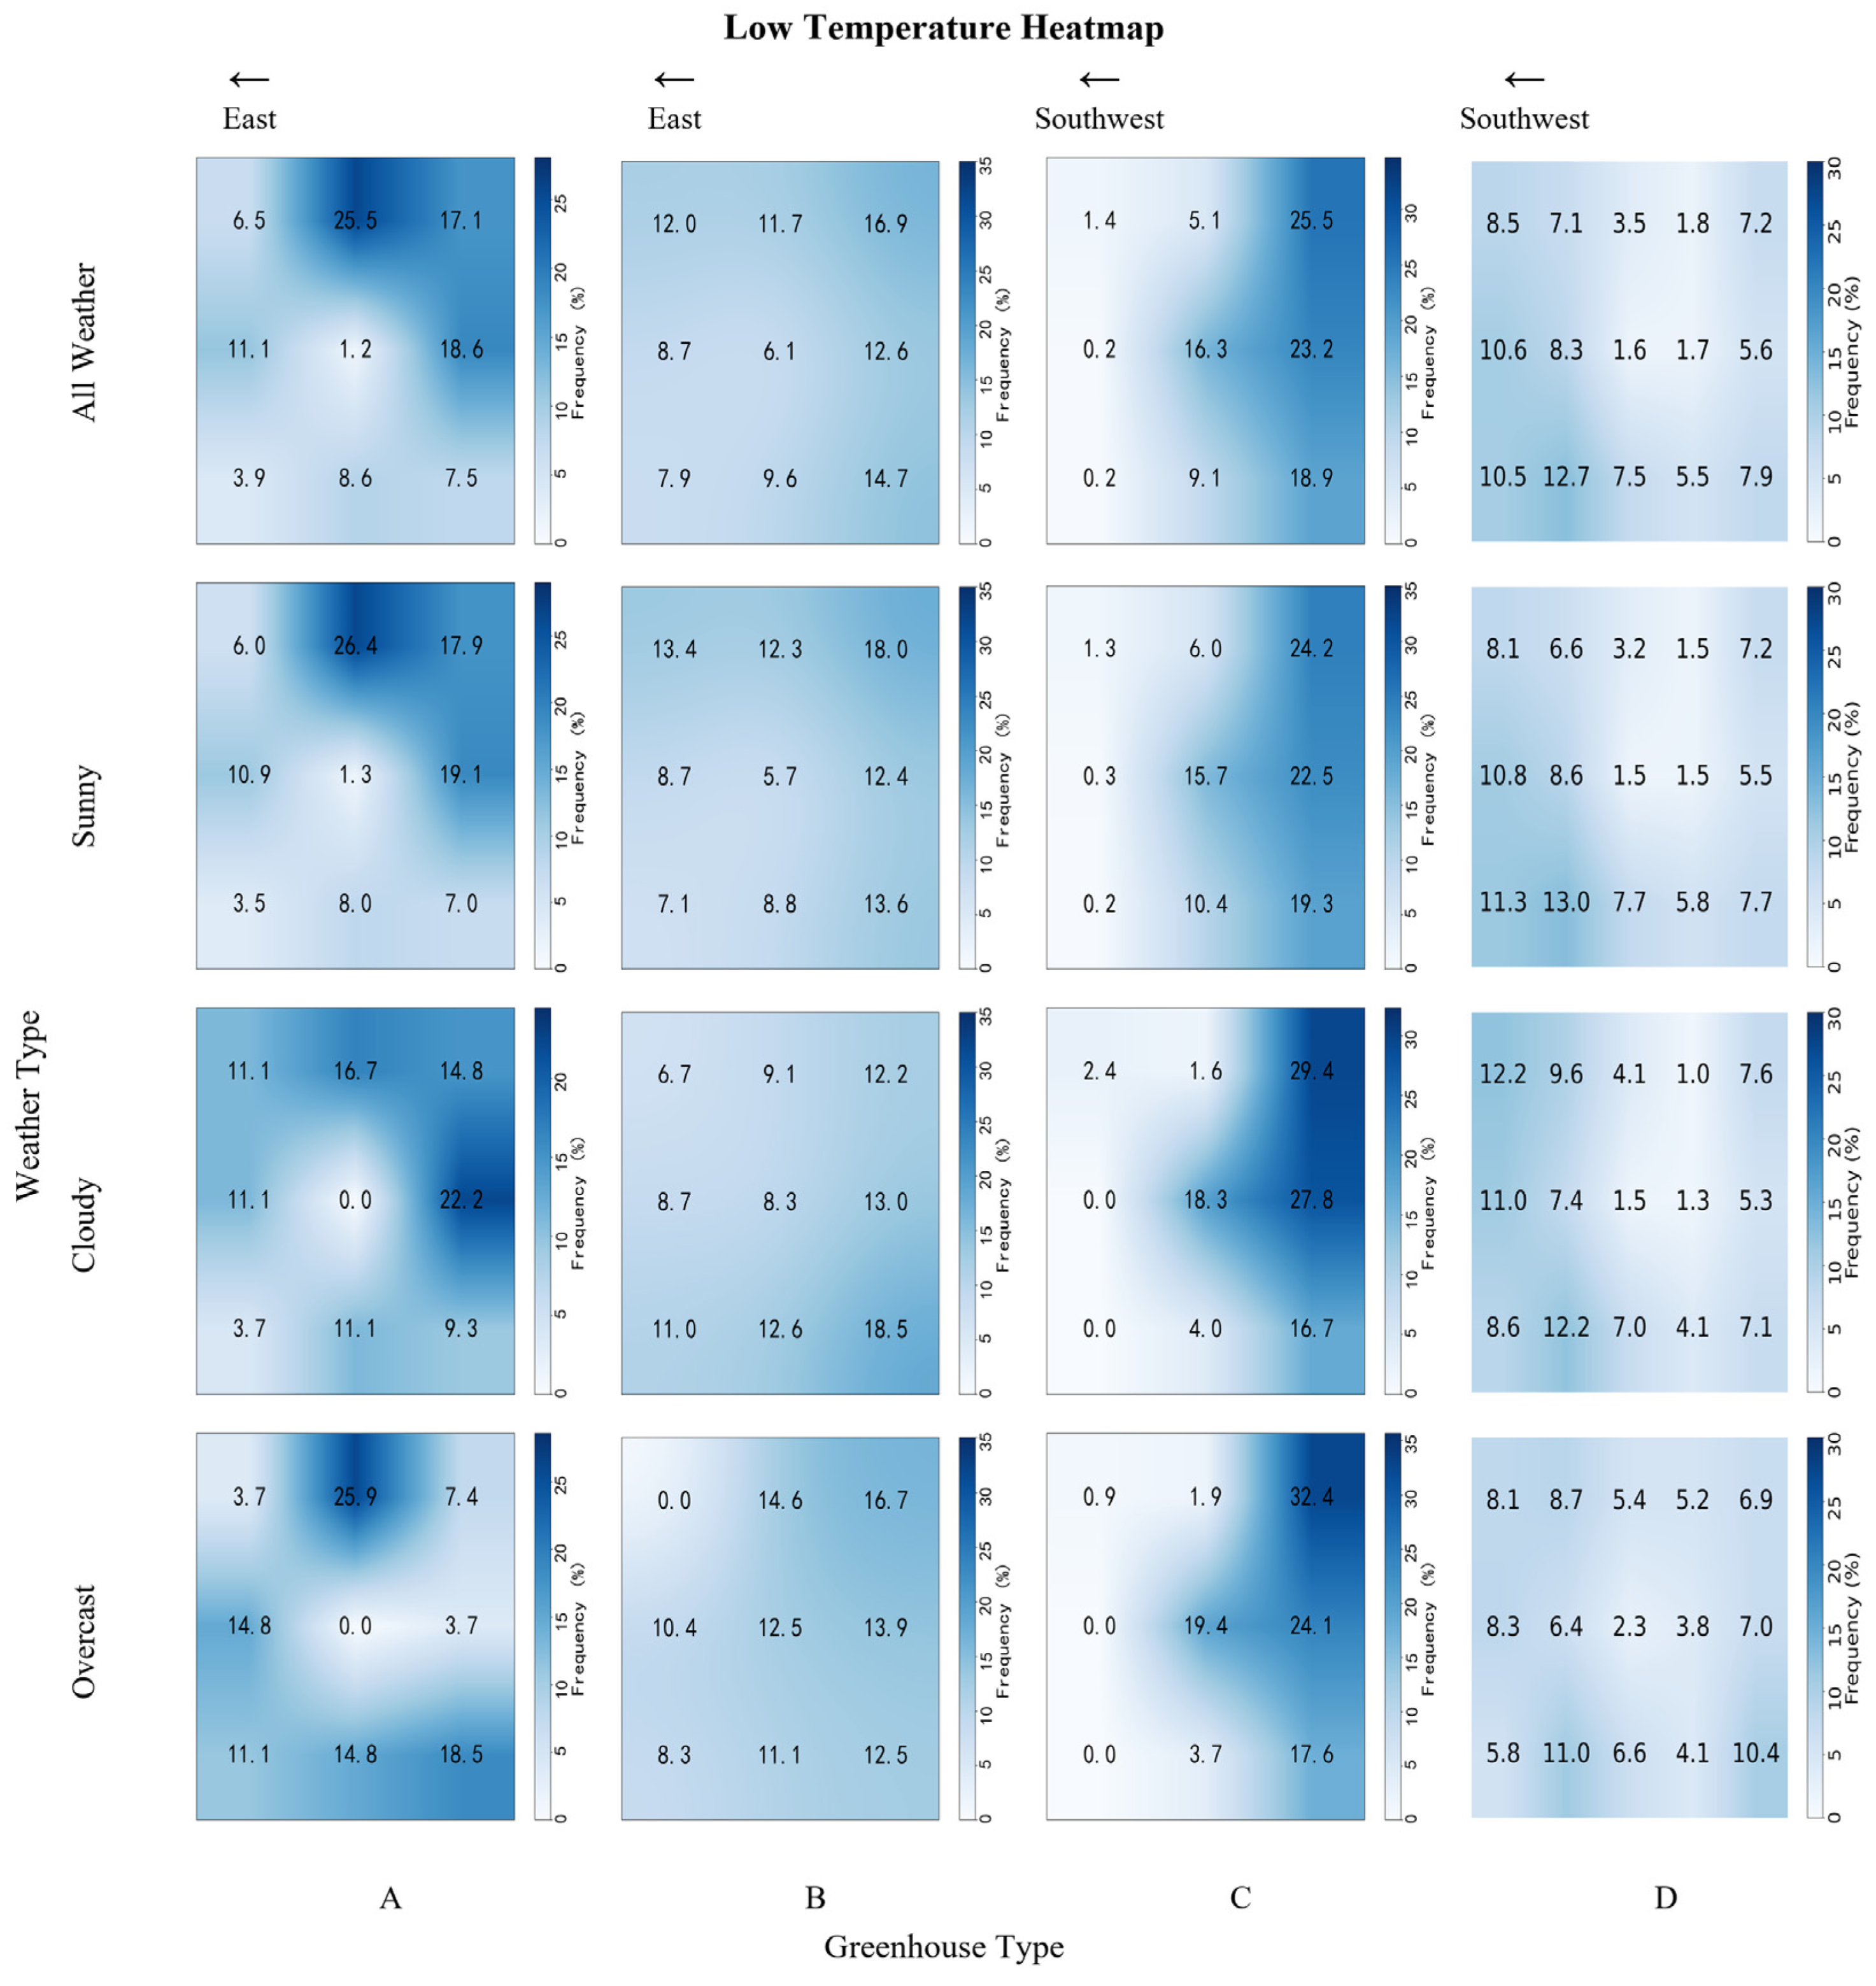
Figure 6.
Heat maps of four different types of greenhouse high-humidity areas, The values indicate the proportion of high-humidity occurrences (ranked top three across all sites) at each location. (A: Brick wall solar greenhouse, B: Assembled solar greenhouse, C: Glass multi-span greenhouse, D: Plastic film multi-span greenhouse, respectively).
Figure 6.
Heat maps of four different types of greenhouse high-humidity areas, The values indicate the proportion of high-humidity occurrences (ranked top three across all sites) at each location. (A: Brick wall solar greenhouse, B: Assembled solar greenhouse, C: Glass multi-span greenhouse, D: Plastic film multi-span greenhouse, respectively).
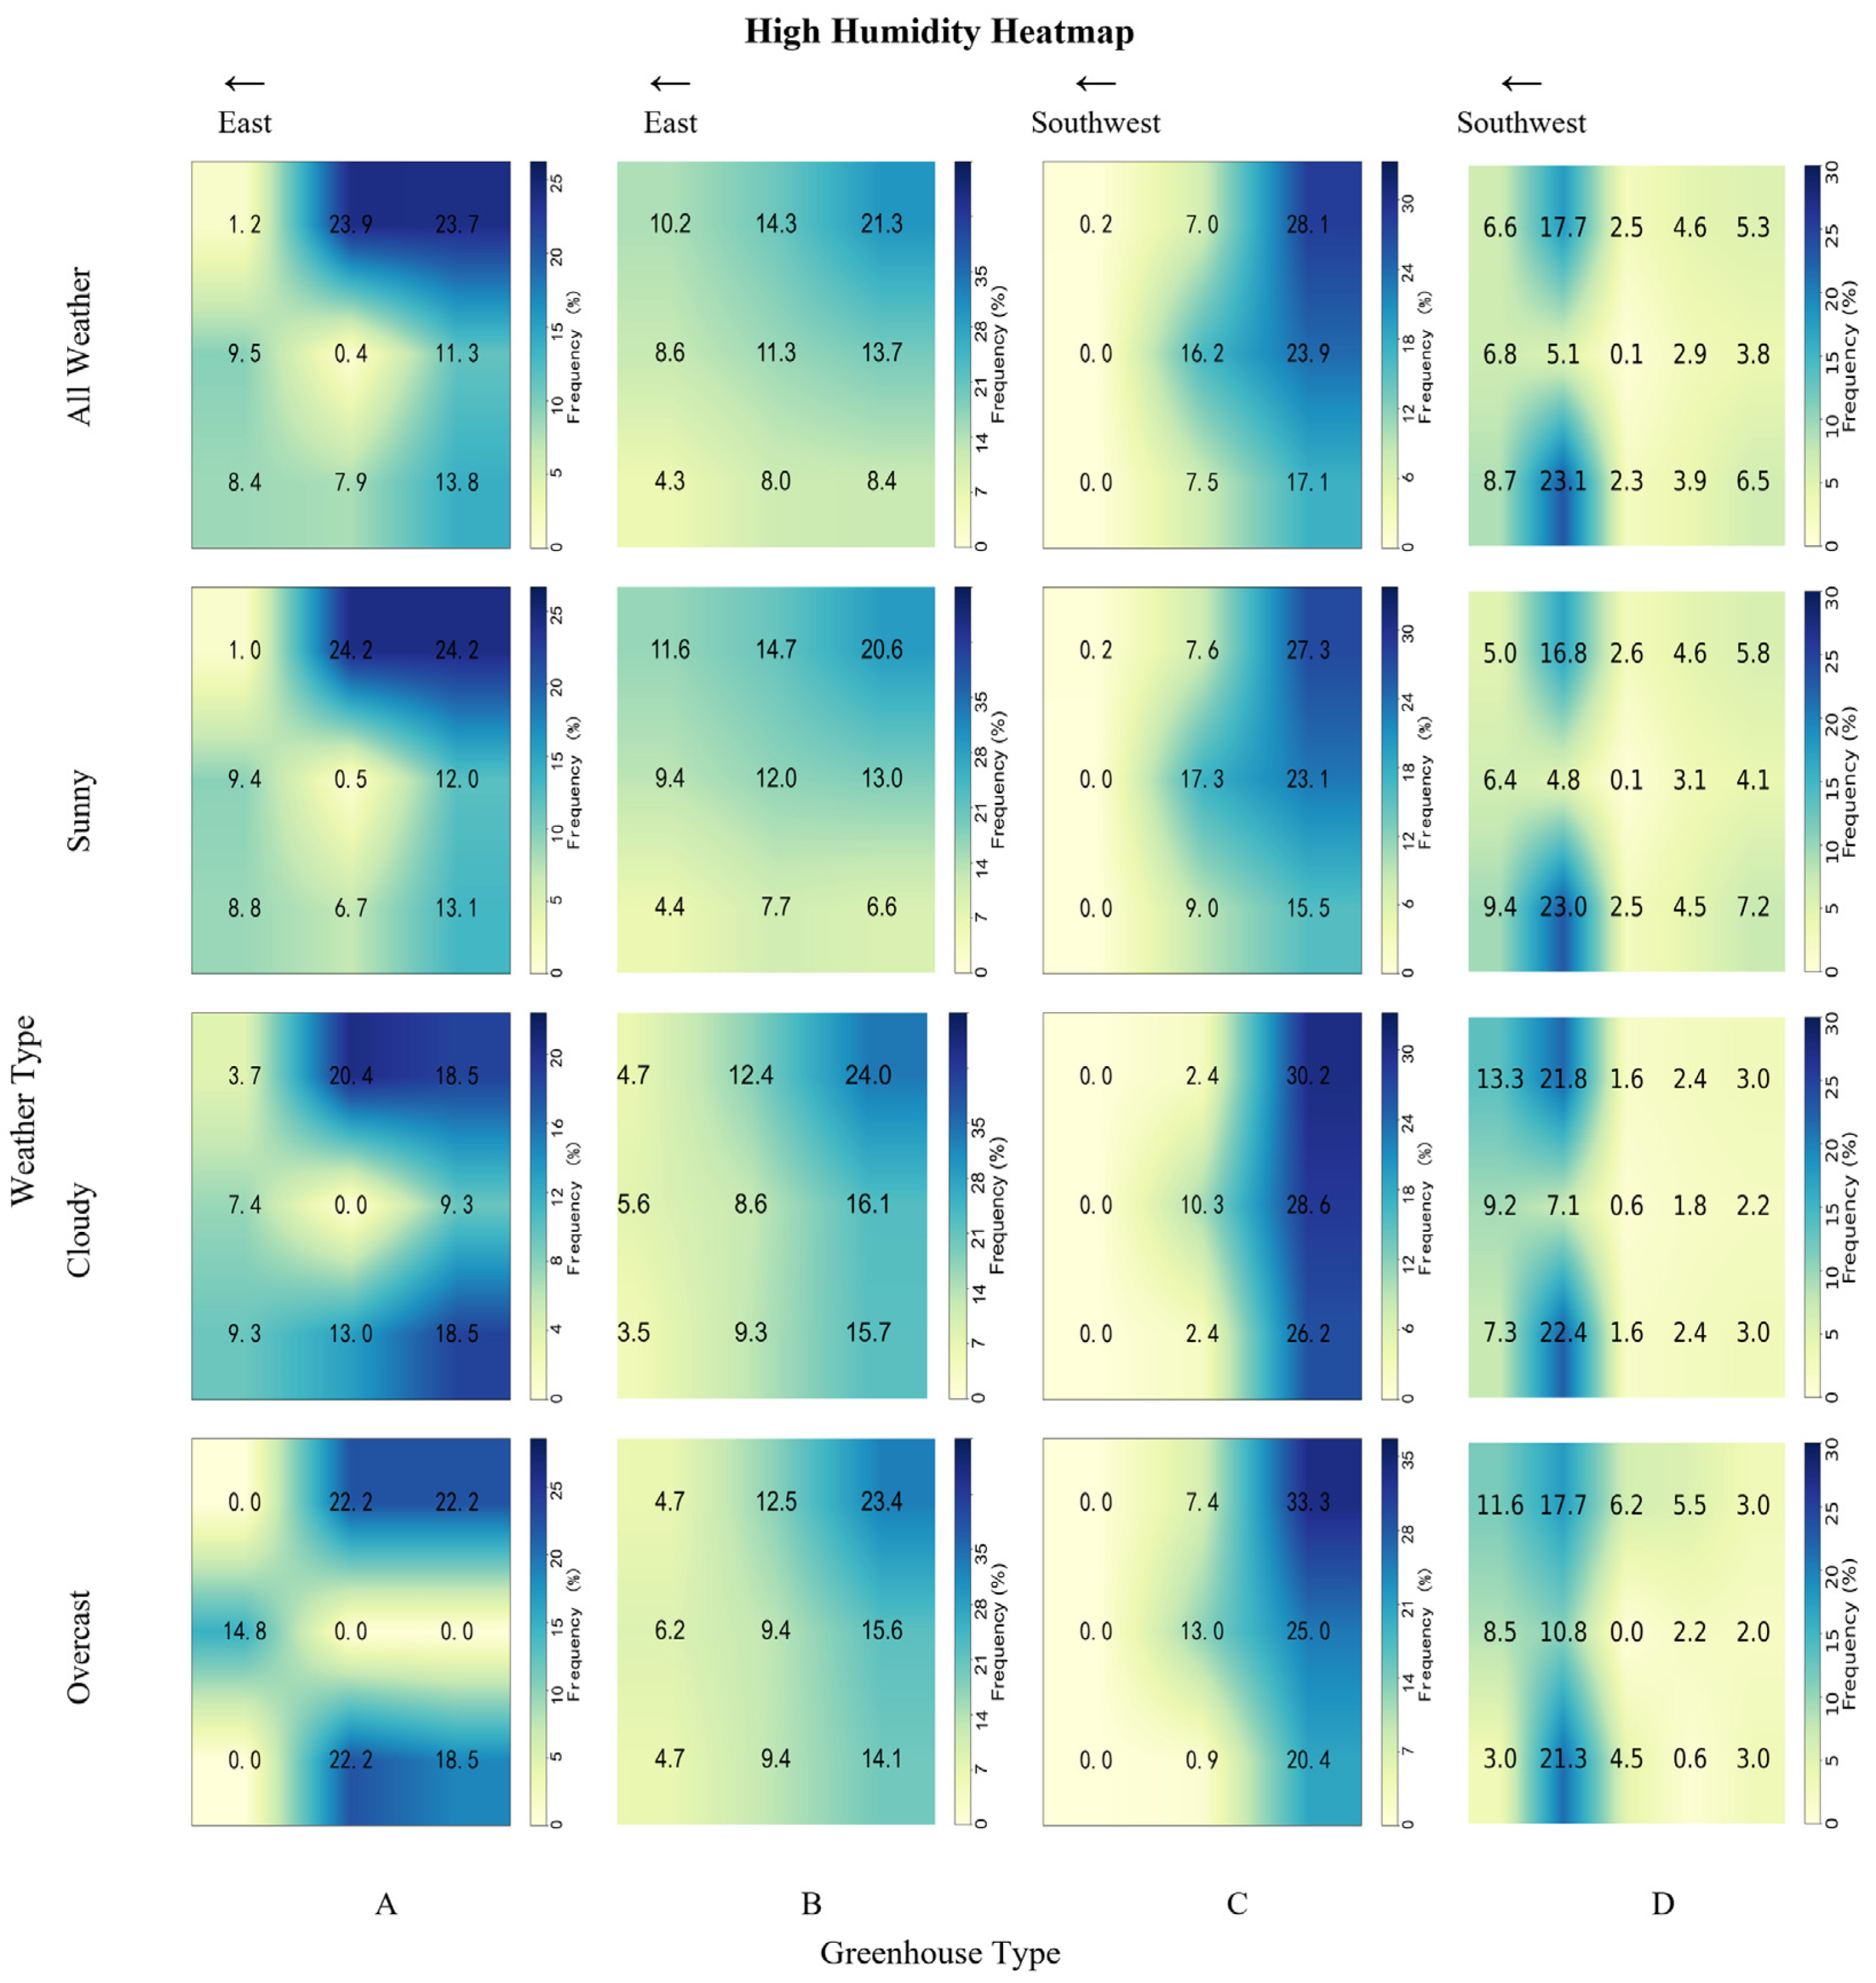
Figure 7.
Heat maps of four different types of greenhouses in low-humidity areas, The values indicate the proportion of low-humidity occurrences (ranked top three across all sites) at each location. (A: Brick wall solar greenhouse, B: Assembled solar greenhouse, C: Glass multi-span greenhouse, D: Plastic film multi-span greenhouse, respectively).
Figure 7.
Heat maps of four different types of greenhouses in low-humidity areas, The values indicate the proportion of low-humidity occurrences (ranked top three across all sites) at each location. (A: Brick wall solar greenhouse, B: Assembled solar greenhouse, C: Glass multi-span greenhouse, D: Plastic film multi-span greenhouse, respectively).
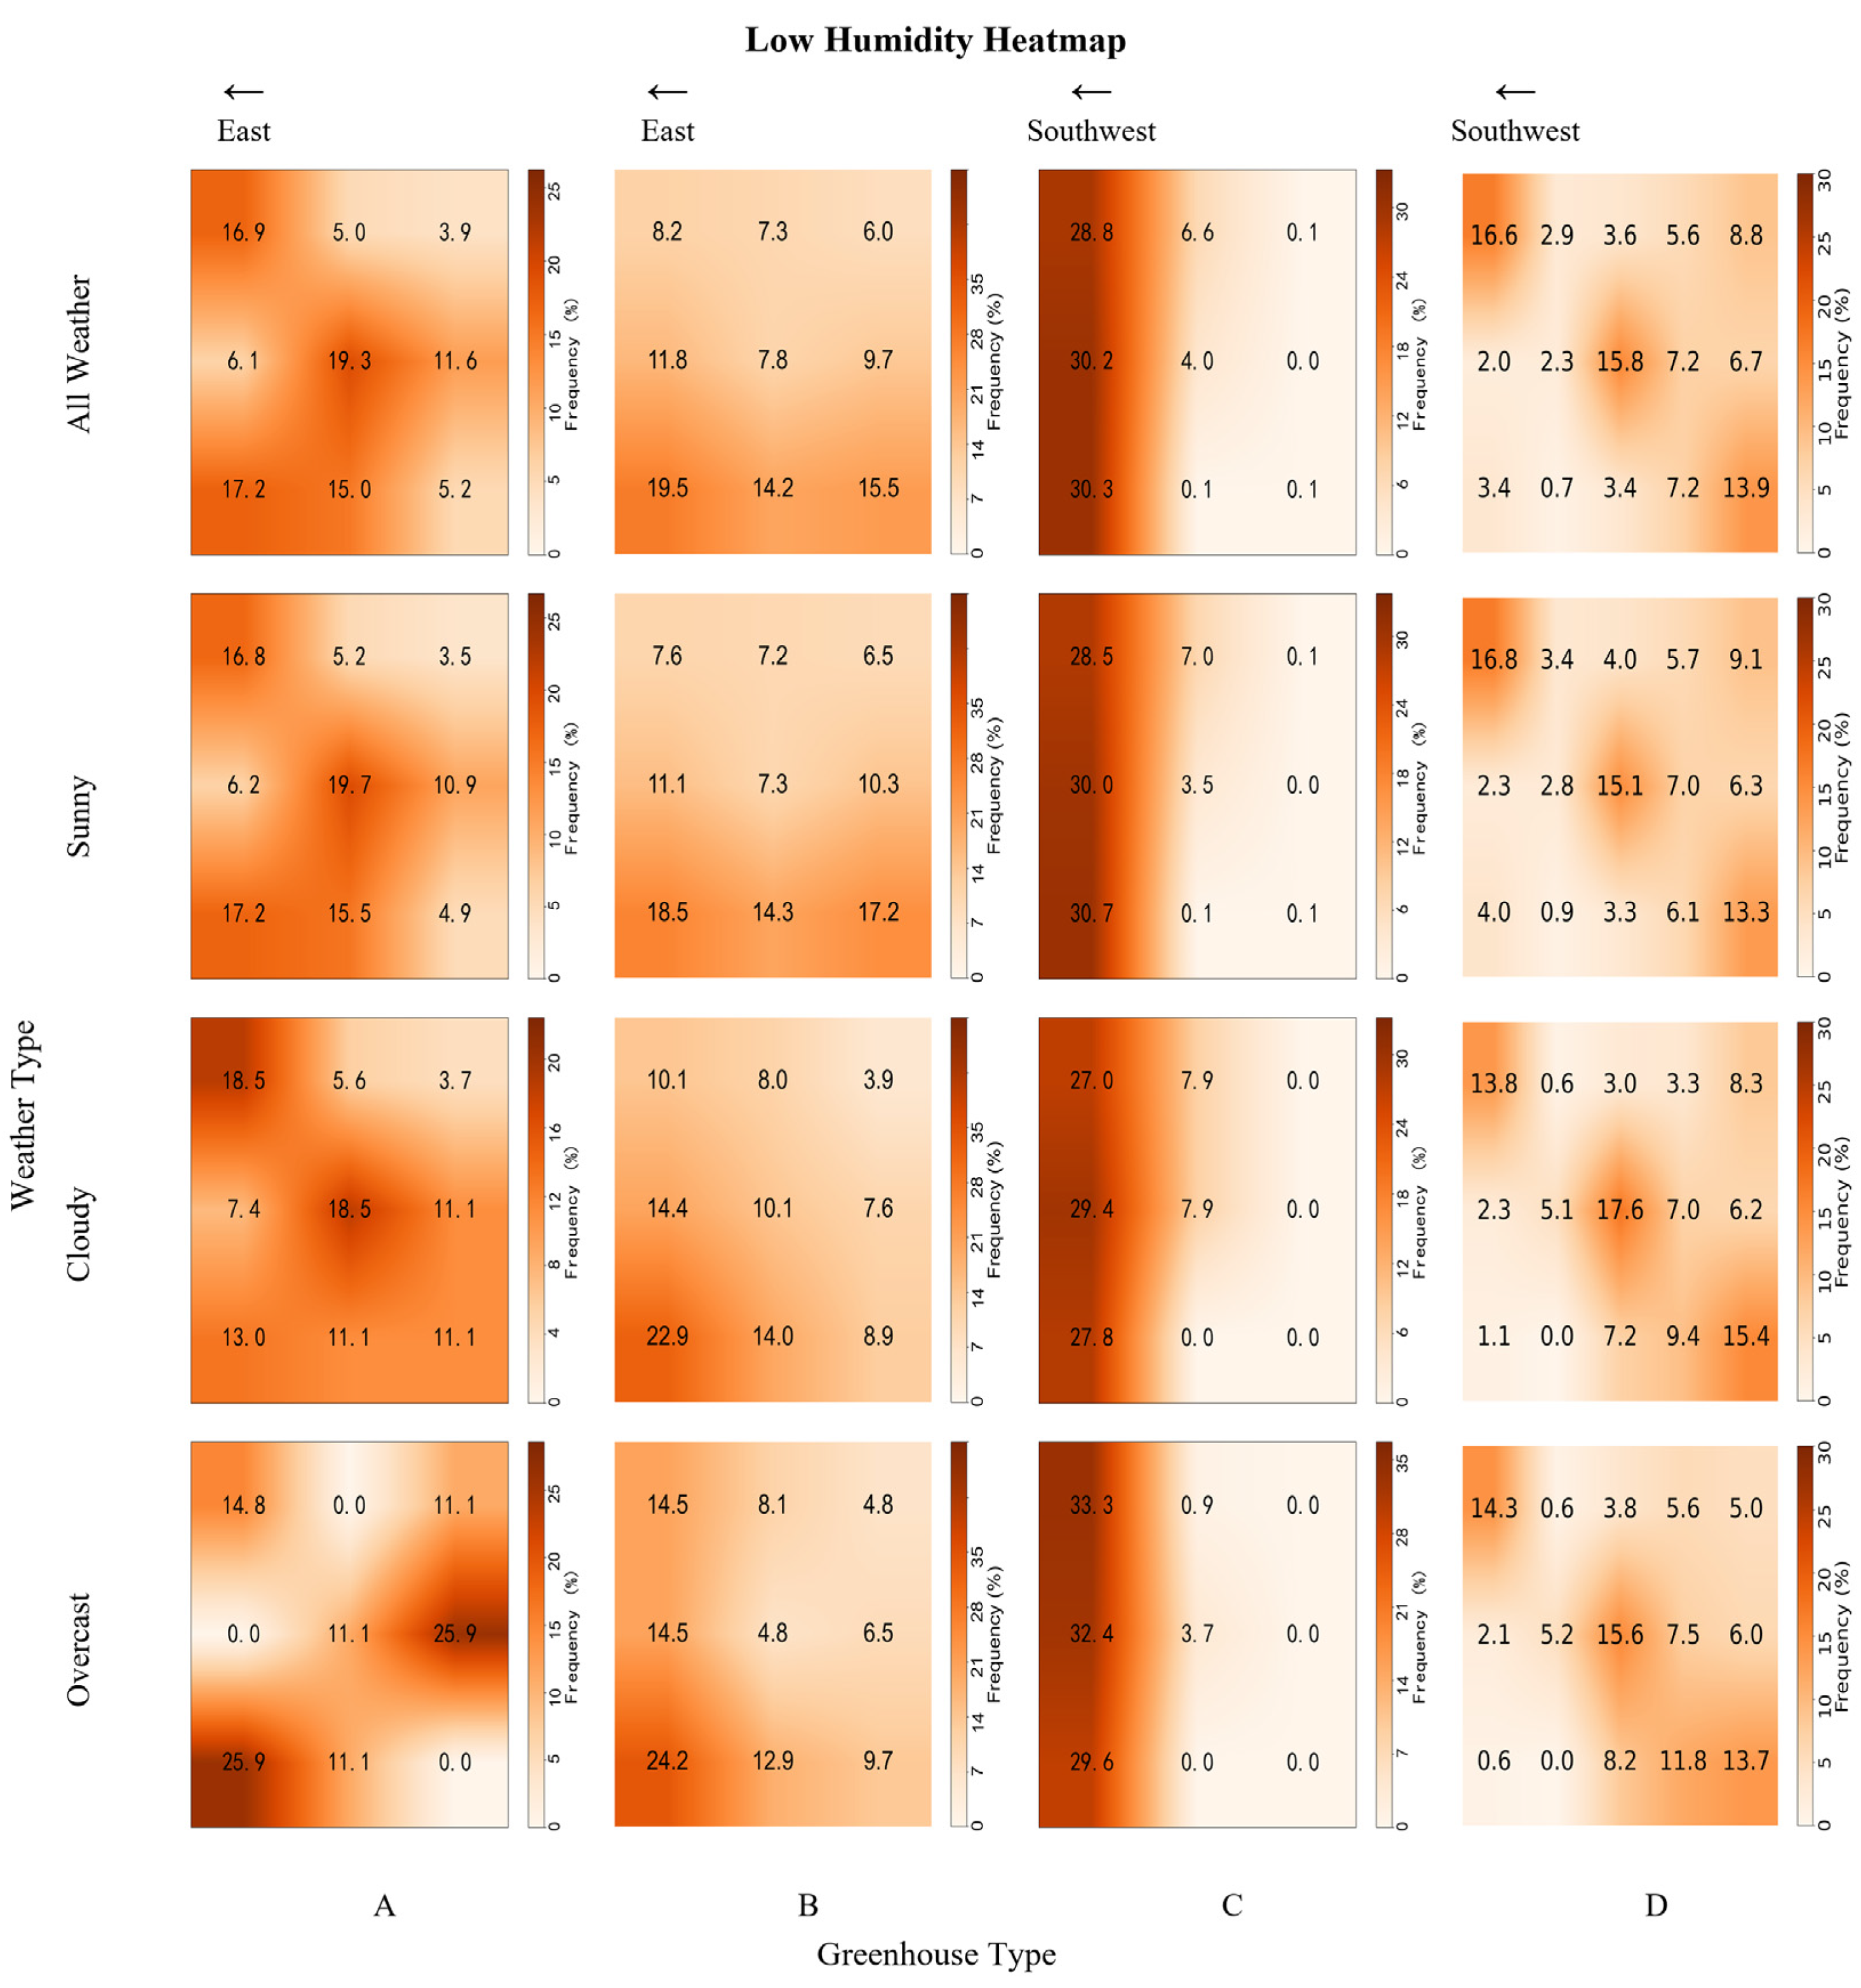
Figure 8.
Spatial temperature differences and the daily spatial coefficient of variation (CV) across consecutive days. From left to right: A is Brick-wall solar greenhouse; B is Assembled solar greenhouse; C is Glass multi-span greenhouse; D is Plastic film multi-span greenhouse. ΔT_mean, ΔT_max and ΔT_min are respectively the daily spatially averaged, maximum and minimum temperature difference, where ΔT is the hourly spatially temperature difference.
Figure 8.
Spatial temperature differences and the daily spatial coefficient of variation (CV) across consecutive days. From left to right: A is Brick-wall solar greenhouse; B is Assembled solar greenhouse; C is Glass multi-span greenhouse; D is Plastic film multi-span greenhouse. ΔT_mean, ΔT_max and ΔT_min are respectively the daily spatially averaged, maximum and minimum temperature difference, where ΔT is the hourly spatially temperature difference.
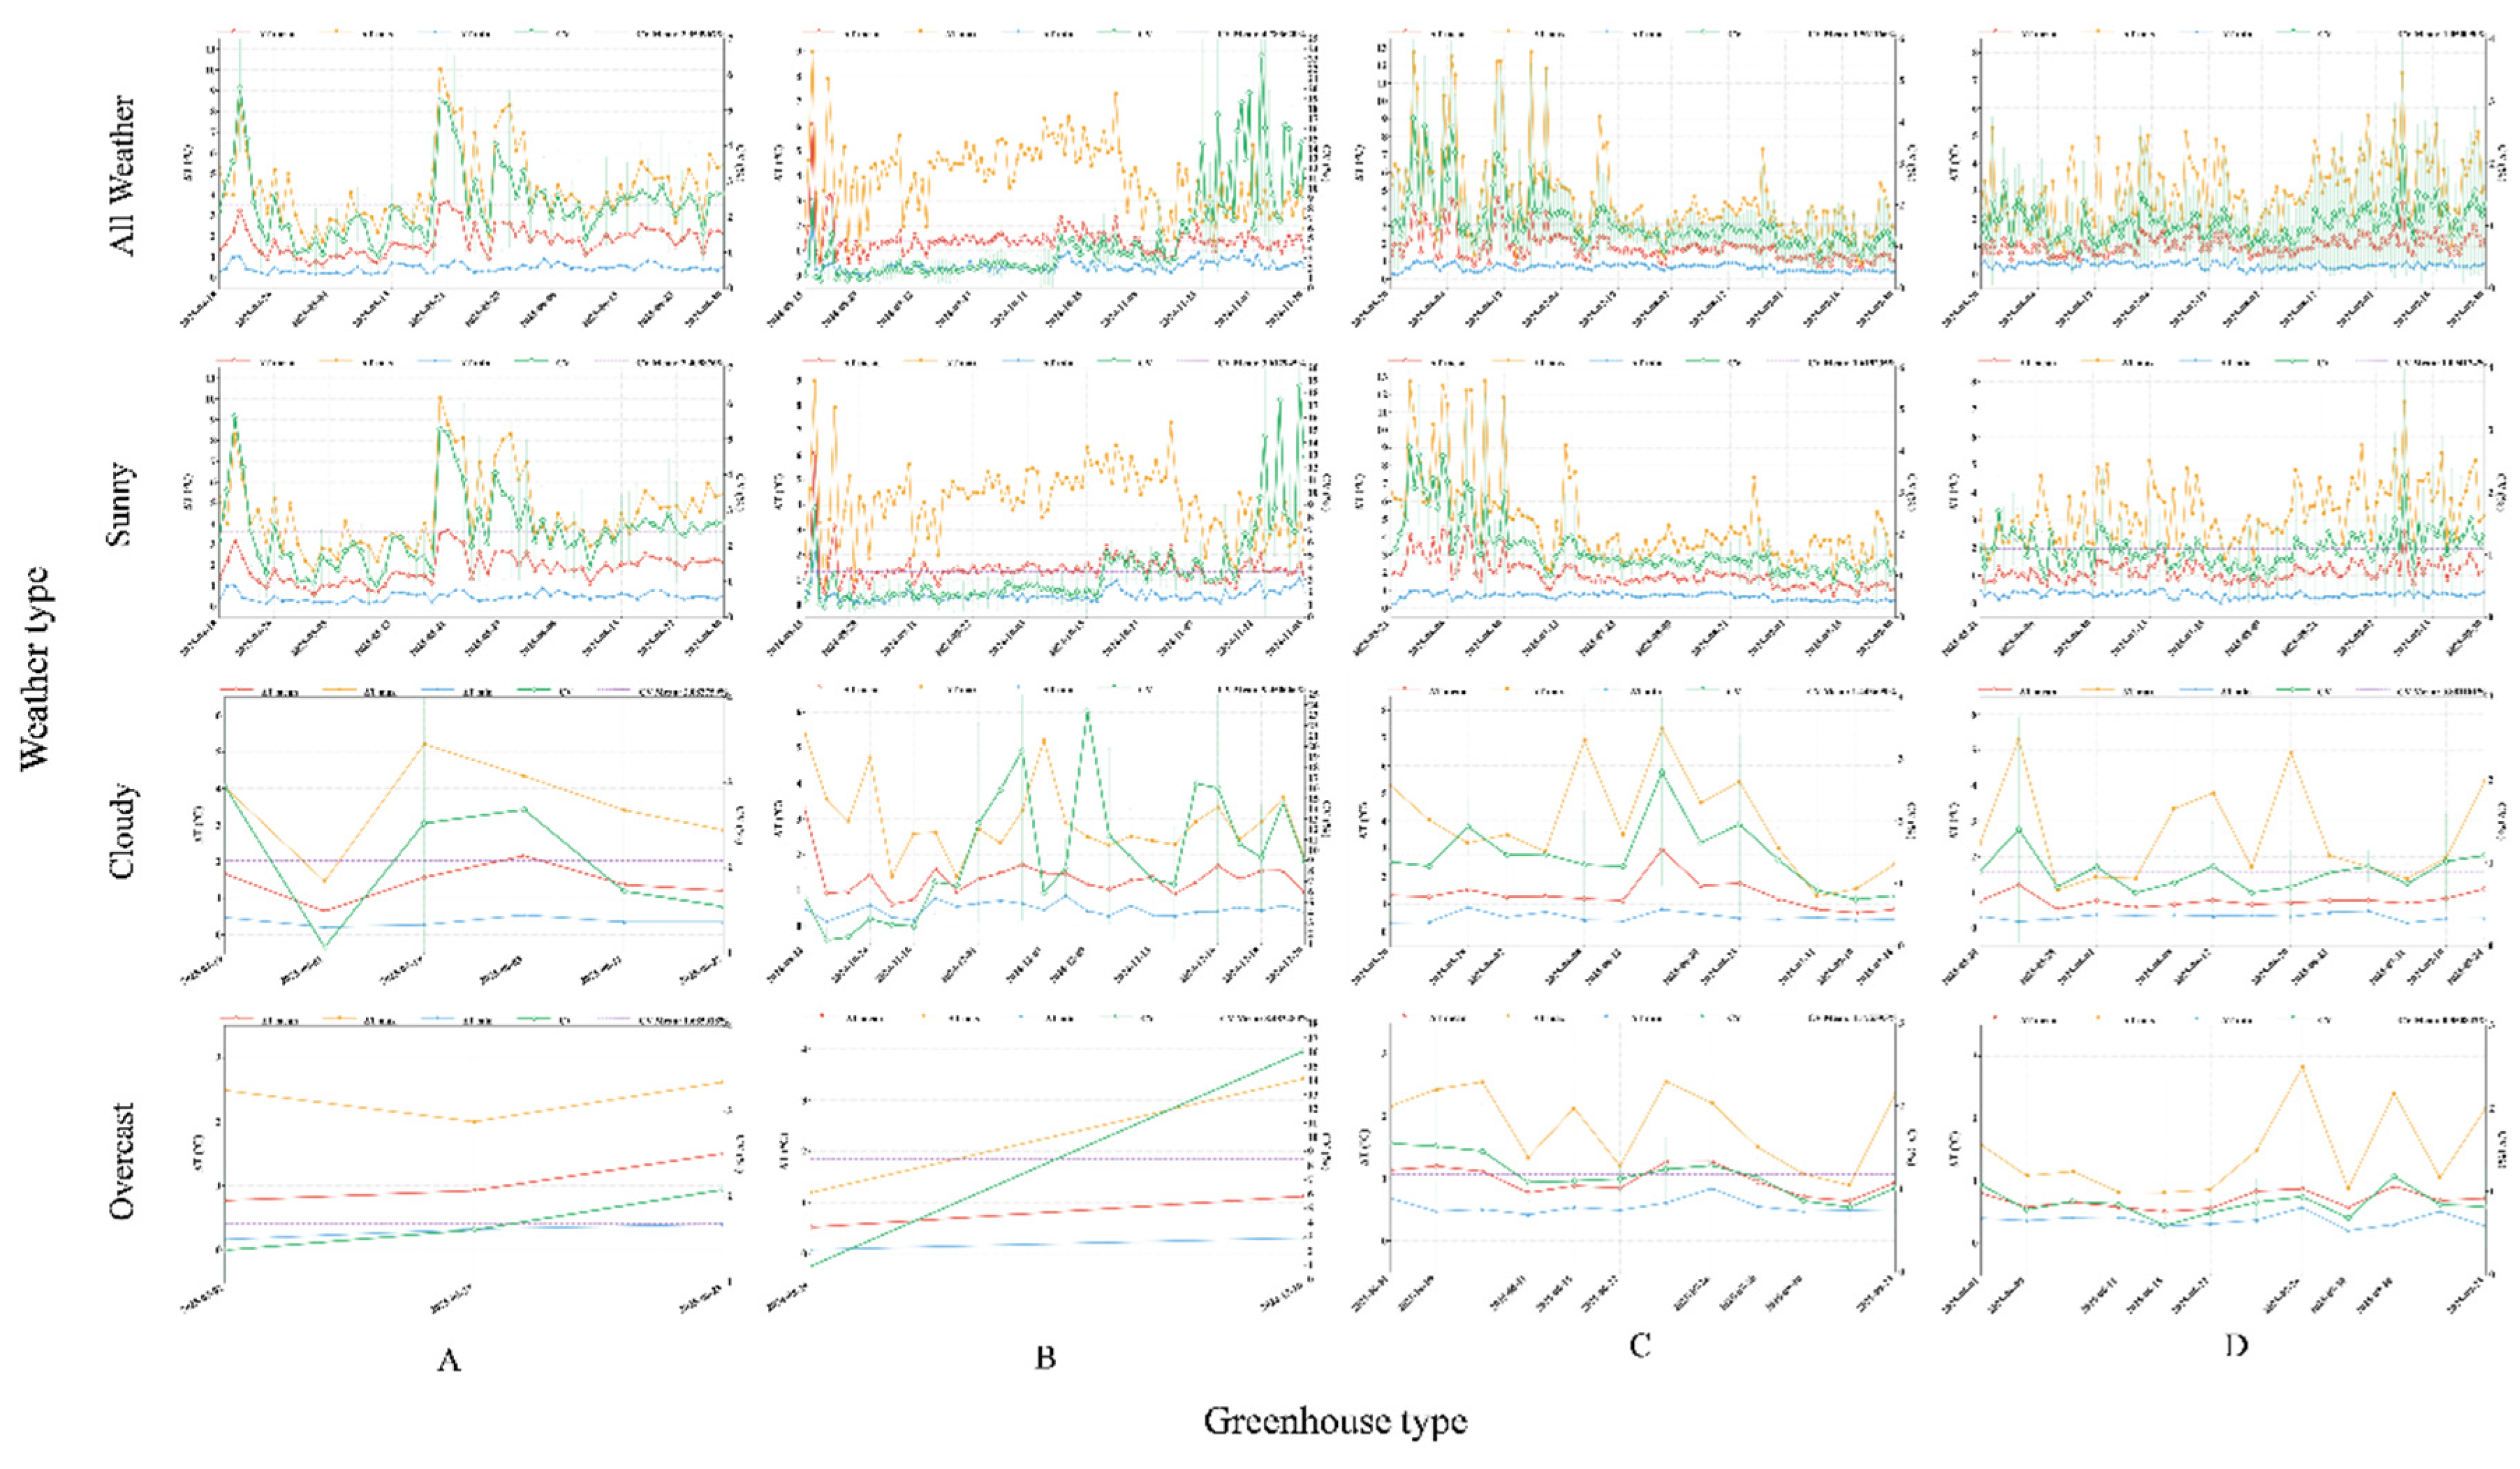
Figure 9.
Spatial relative humidity differences and the daily spatial coefficient of variation (CV) across consecutive days. From left to right: A is Brick-wall solar greenhouse; B is Assembled solar greenhouse; C is Glass multi-span greenhouse; D is Plastic film multi-span greenhouse. ΔH_mean, ΔH_max and ΔH_min are respectively the daily spatially averaged, maximum and minimum temperature difference, where ΔH is the hourly spatially temperature difference.
Figure 9.
Spatial relative humidity differences and the daily spatial coefficient of variation (CV) across consecutive days. From left to right: A is Brick-wall solar greenhouse; B is Assembled solar greenhouse; C is Glass multi-span greenhouse; D is Plastic film multi-span greenhouse. ΔH_mean, ΔH_max and ΔH_min are respectively the daily spatially averaged, maximum and minimum temperature difference, where ΔH is the hourly spatially temperature difference.
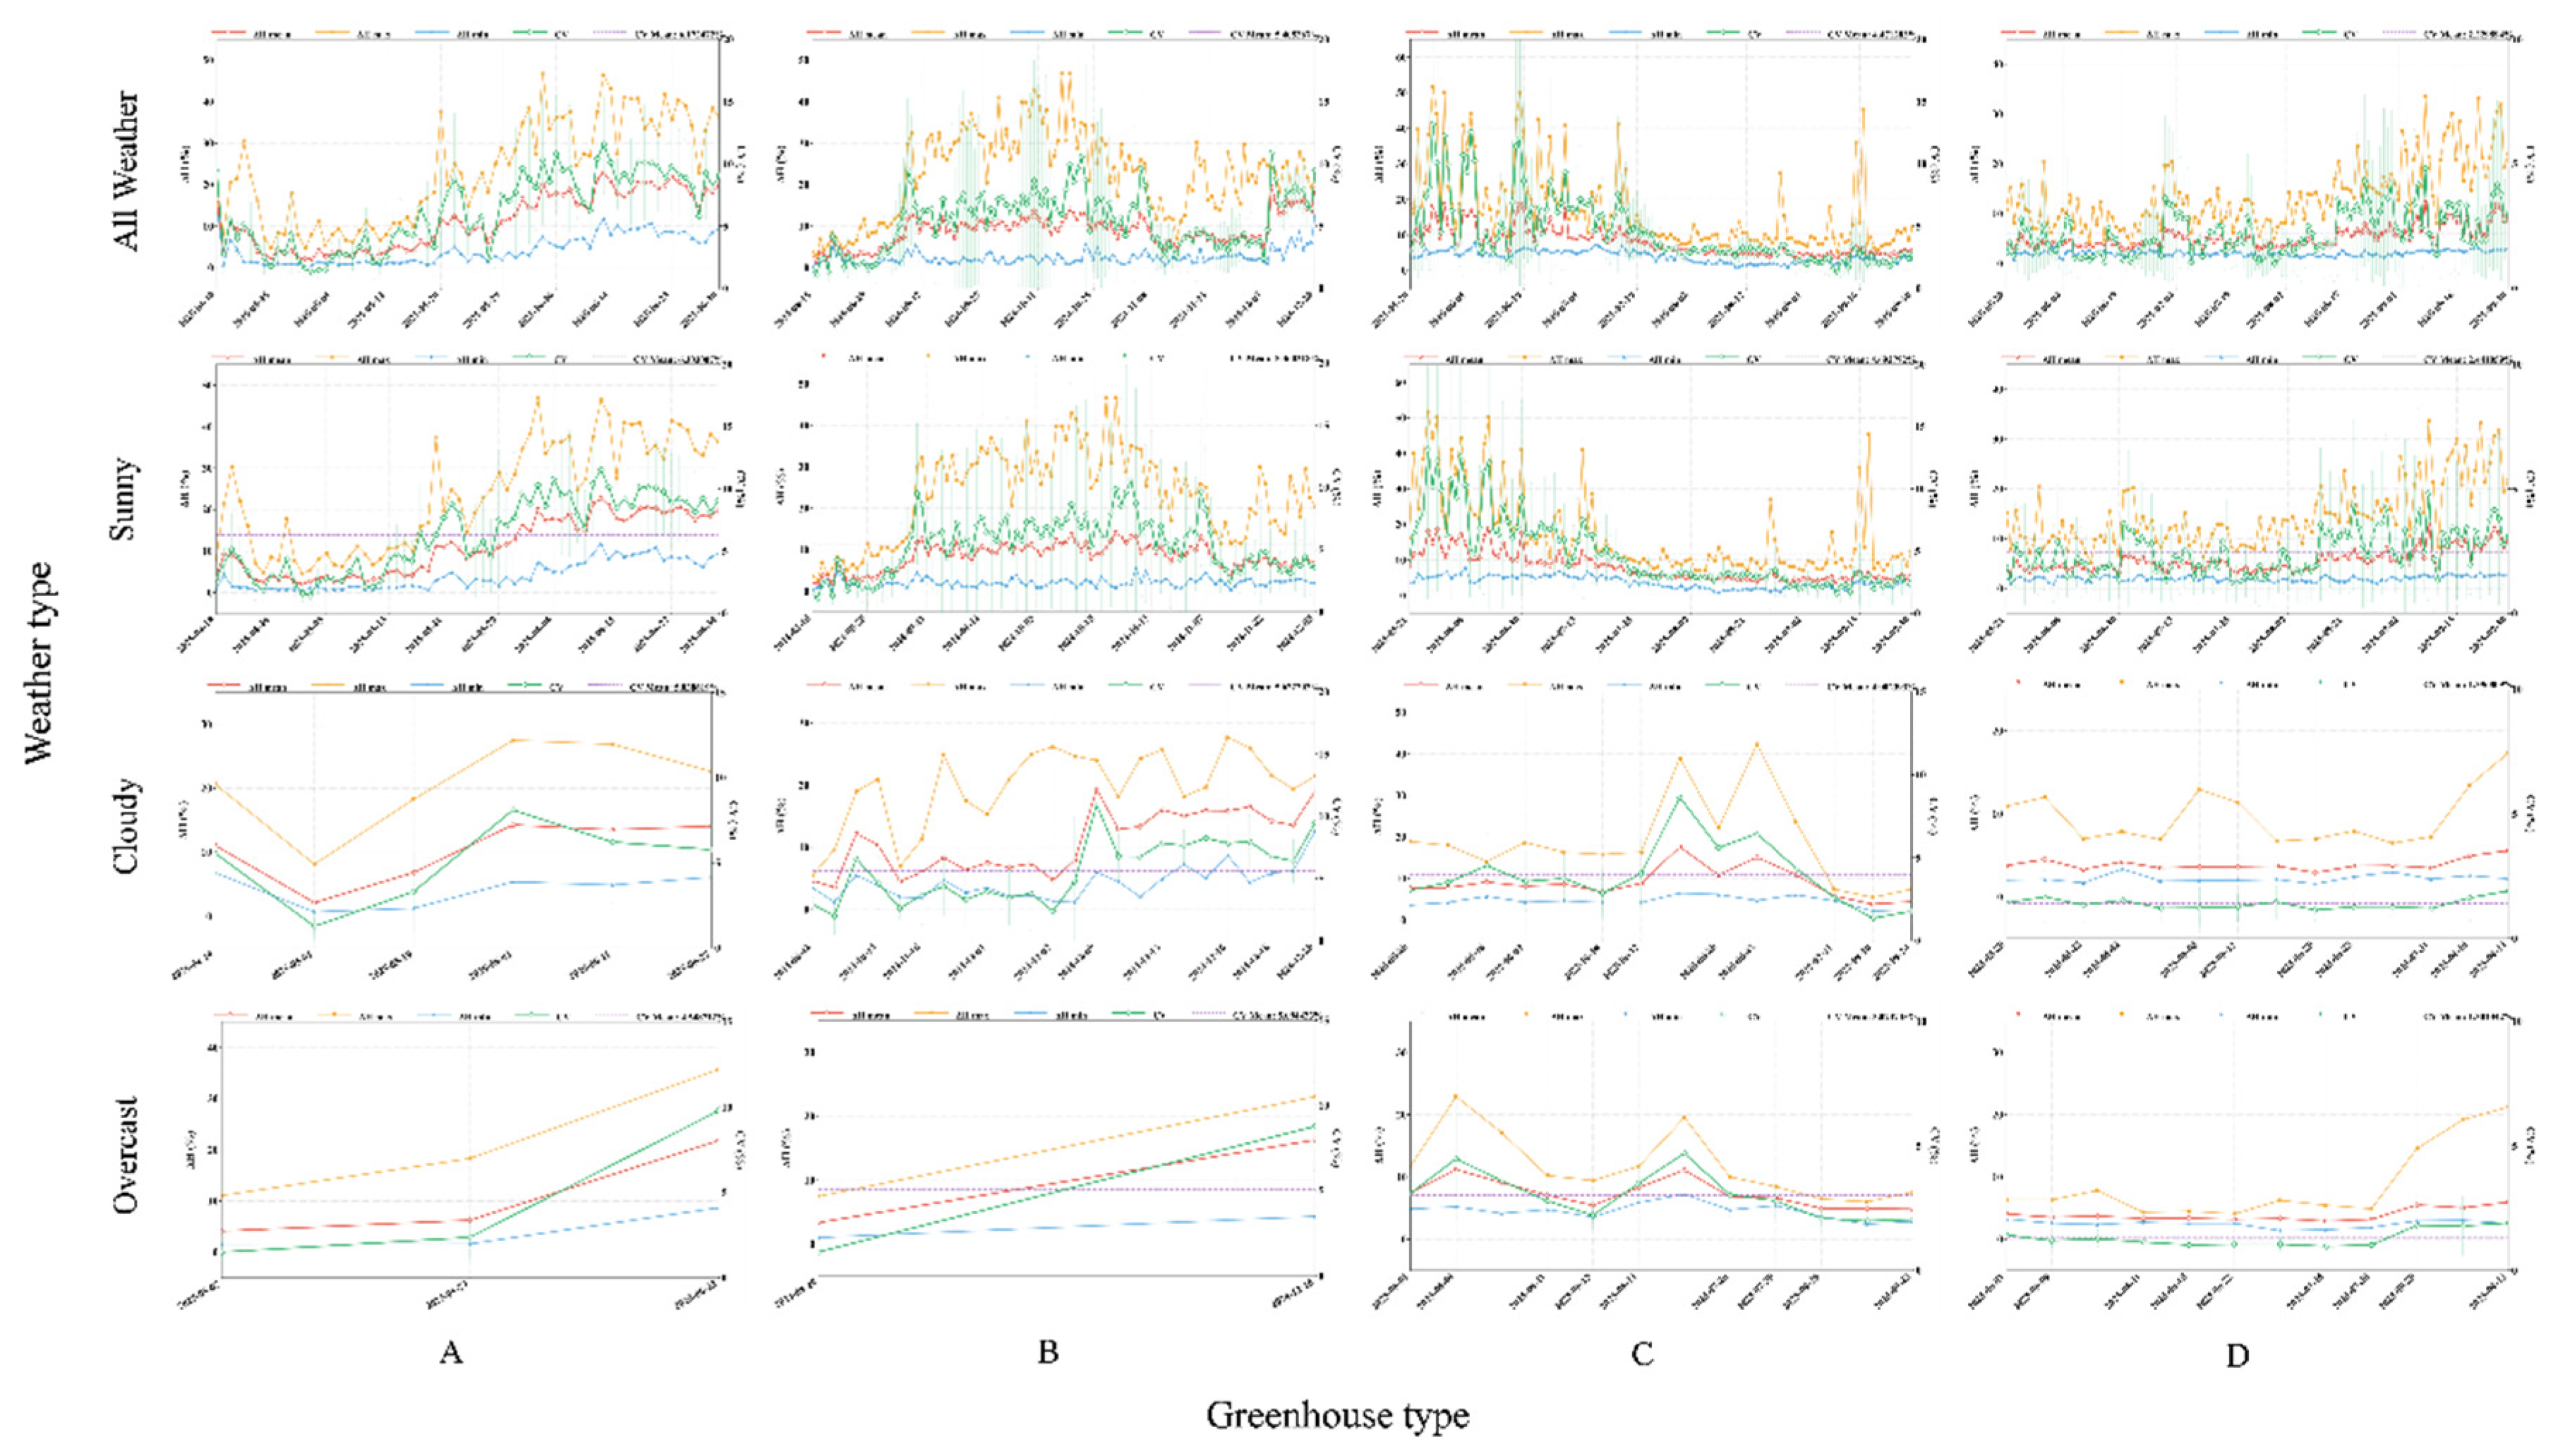
Figure 10.
Hourly temperature difference boxplot. (A: Brick wall solar greenhouse; B: Assembled solar greenhouse; C: Glass multi-span Greenhouse; D: Plastic film multi-span greenhouse; S: Sunny; C: Cloudy; O: Overcast)); The horizontal axis represents nine variables combining four greenhouse types and three weather conditions. The vertical axis represents temperature difference (i.e., the temperature difference at each time interval).
Figure 10.
Hourly temperature difference boxplot. (A: Brick wall solar greenhouse; B: Assembled solar greenhouse; C: Glass multi-span Greenhouse; D: Plastic film multi-span greenhouse; S: Sunny; C: Cloudy; O: Overcast)); The horizontal axis represents nine variables combining four greenhouse types and three weather conditions. The vertical axis represents temperature difference (i.e., the temperature difference at each time interval).
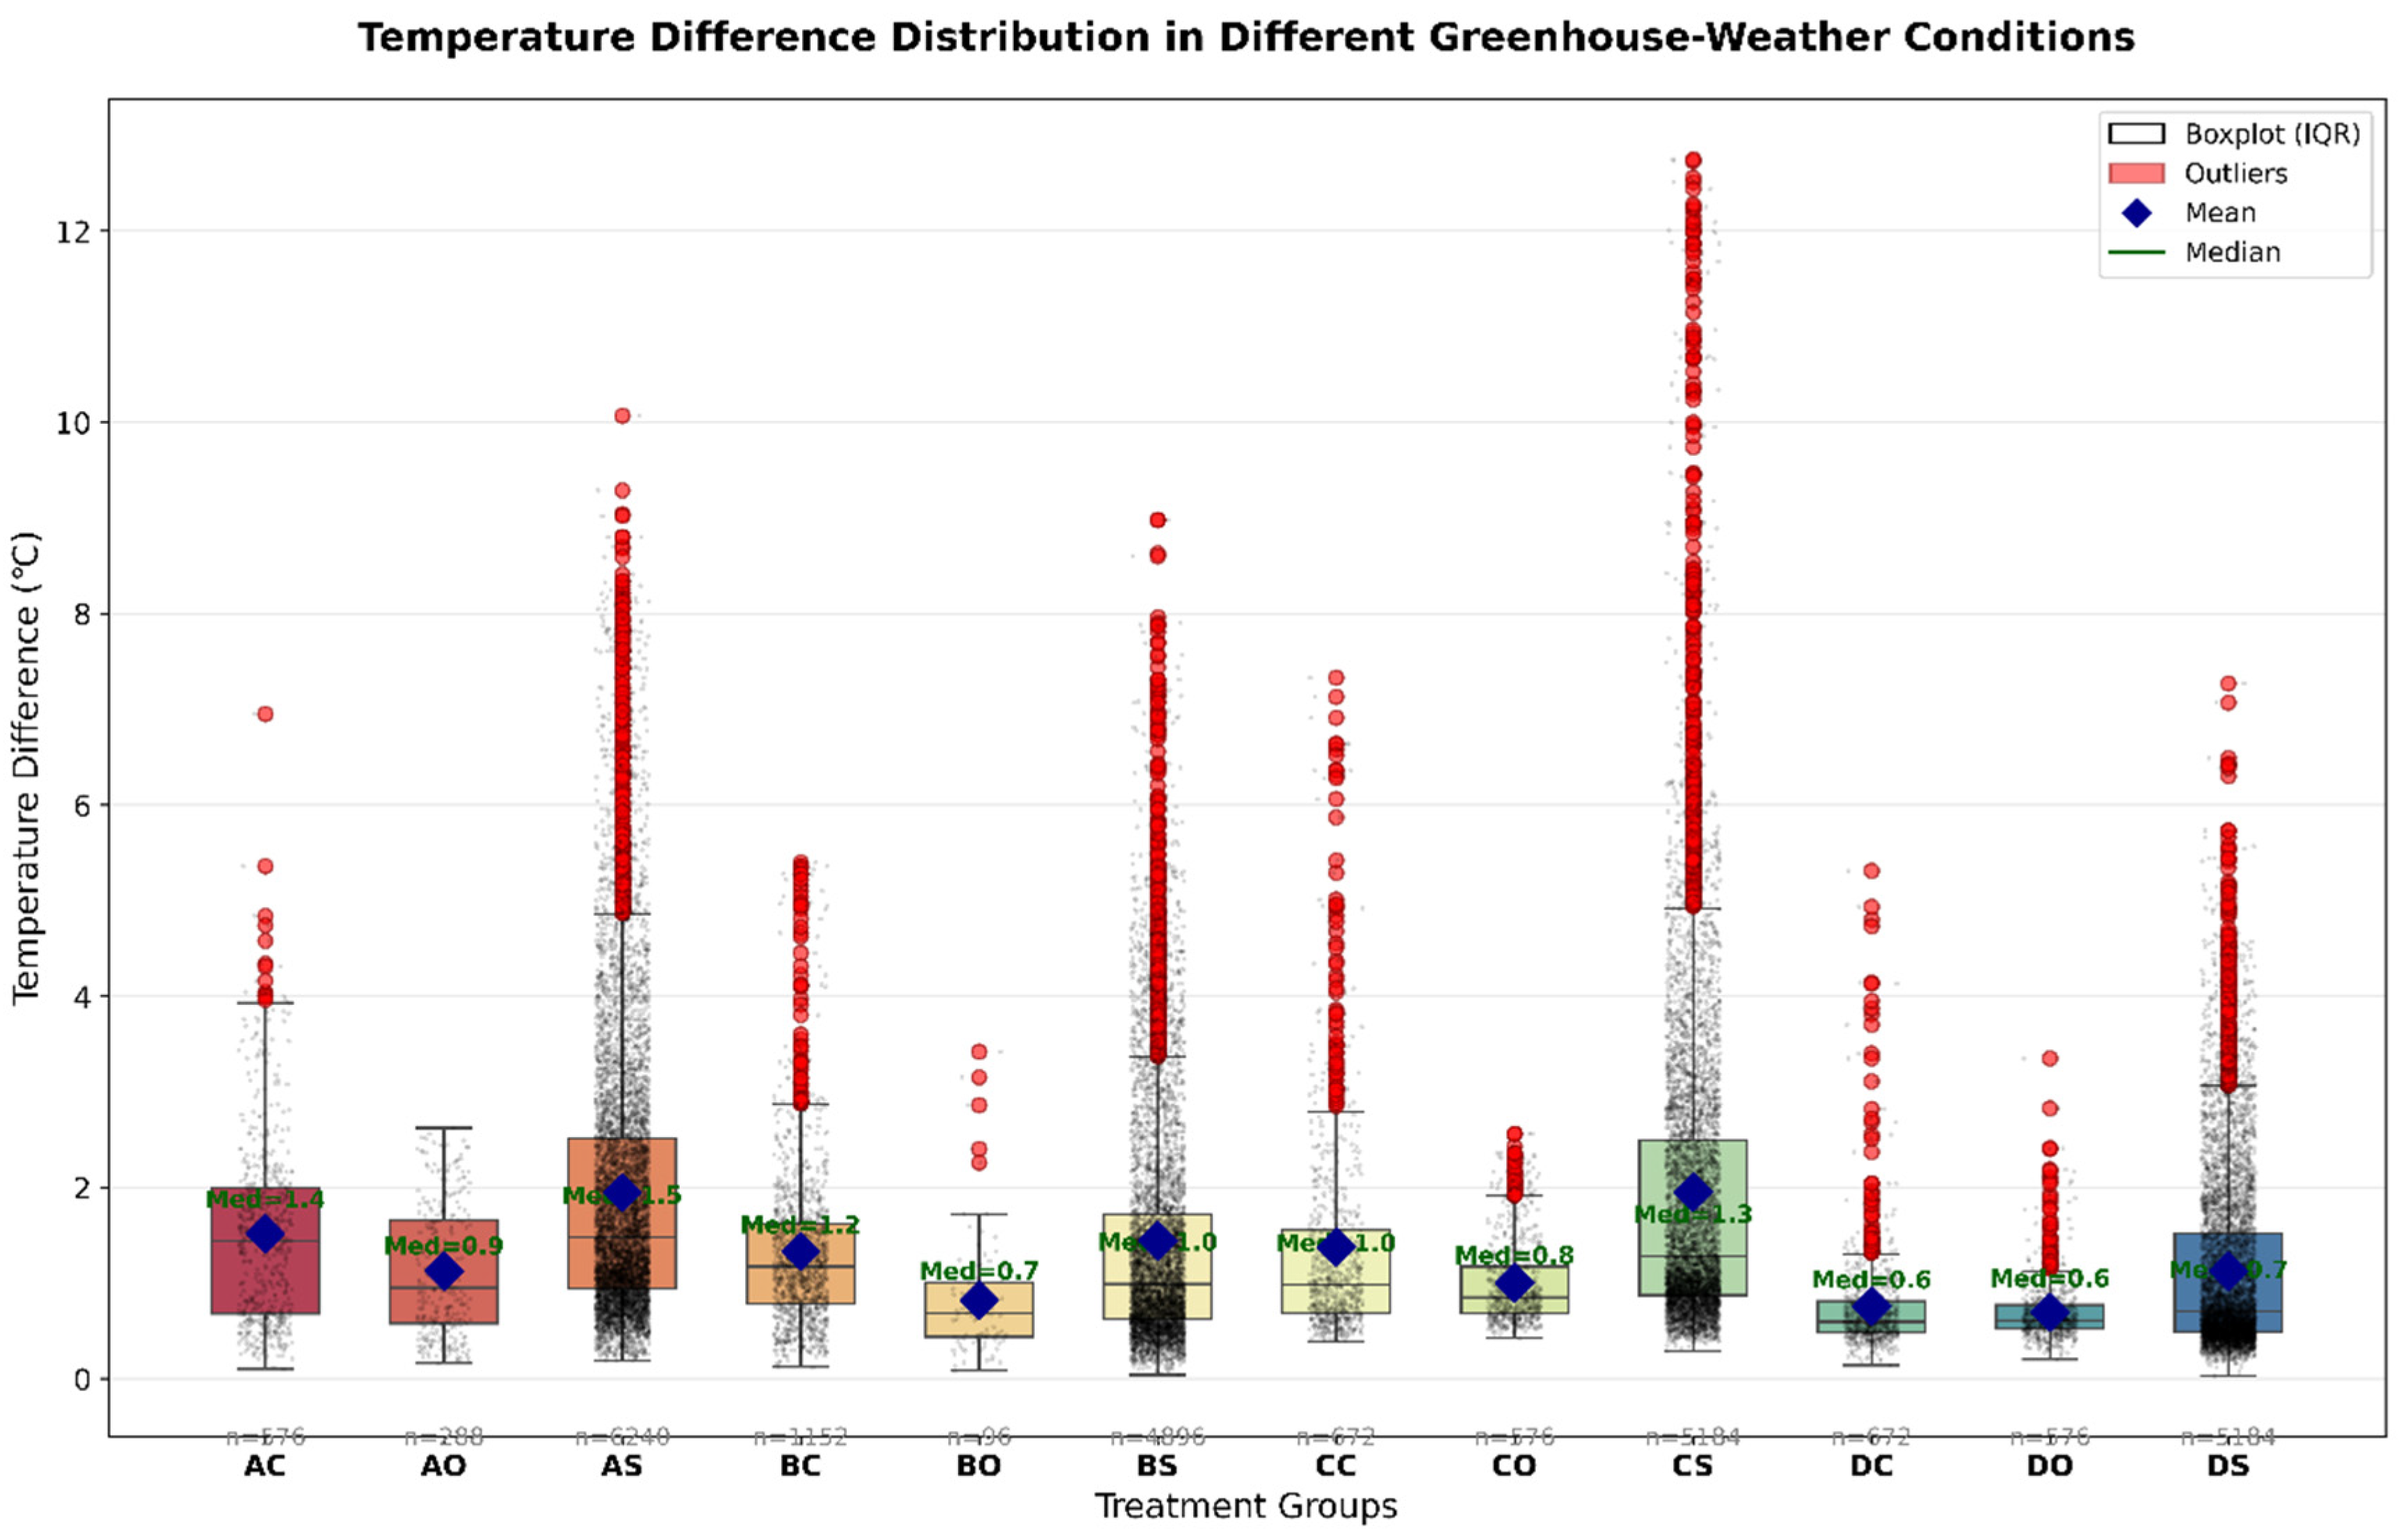
Figure 11.
Hourly relative humidity difference boxplot. (A: Brick wall solar greenhouse; B: Assembled solar greenhouse; C: Glass multi-span Greenhouse; D: Plastic film multi-span greenhouse; S: Sunny; C: Cloudy; O: Overcast)); The horizontal axis represents nine variables combining four greenhouse types and three weather conditions. The vertical axis represents humidity difference (i.e., the humidity difference at each time interval).
Figure 11.
Hourly relative humidity difference boxplot. (A: Brick wall solar greenhouse; B: Assembled solar greenhouse; C: Glass multi-span Greenhouse; D: Plastic film multi-span greenhouse; S: Sunny; C: Cloudy; O: Overcast)); The horizontal axis represents nine variables combining four greenhouse types and three weather conditions. The vertical axis represents humidity difference (i.e., the humidity difference at each time interval).
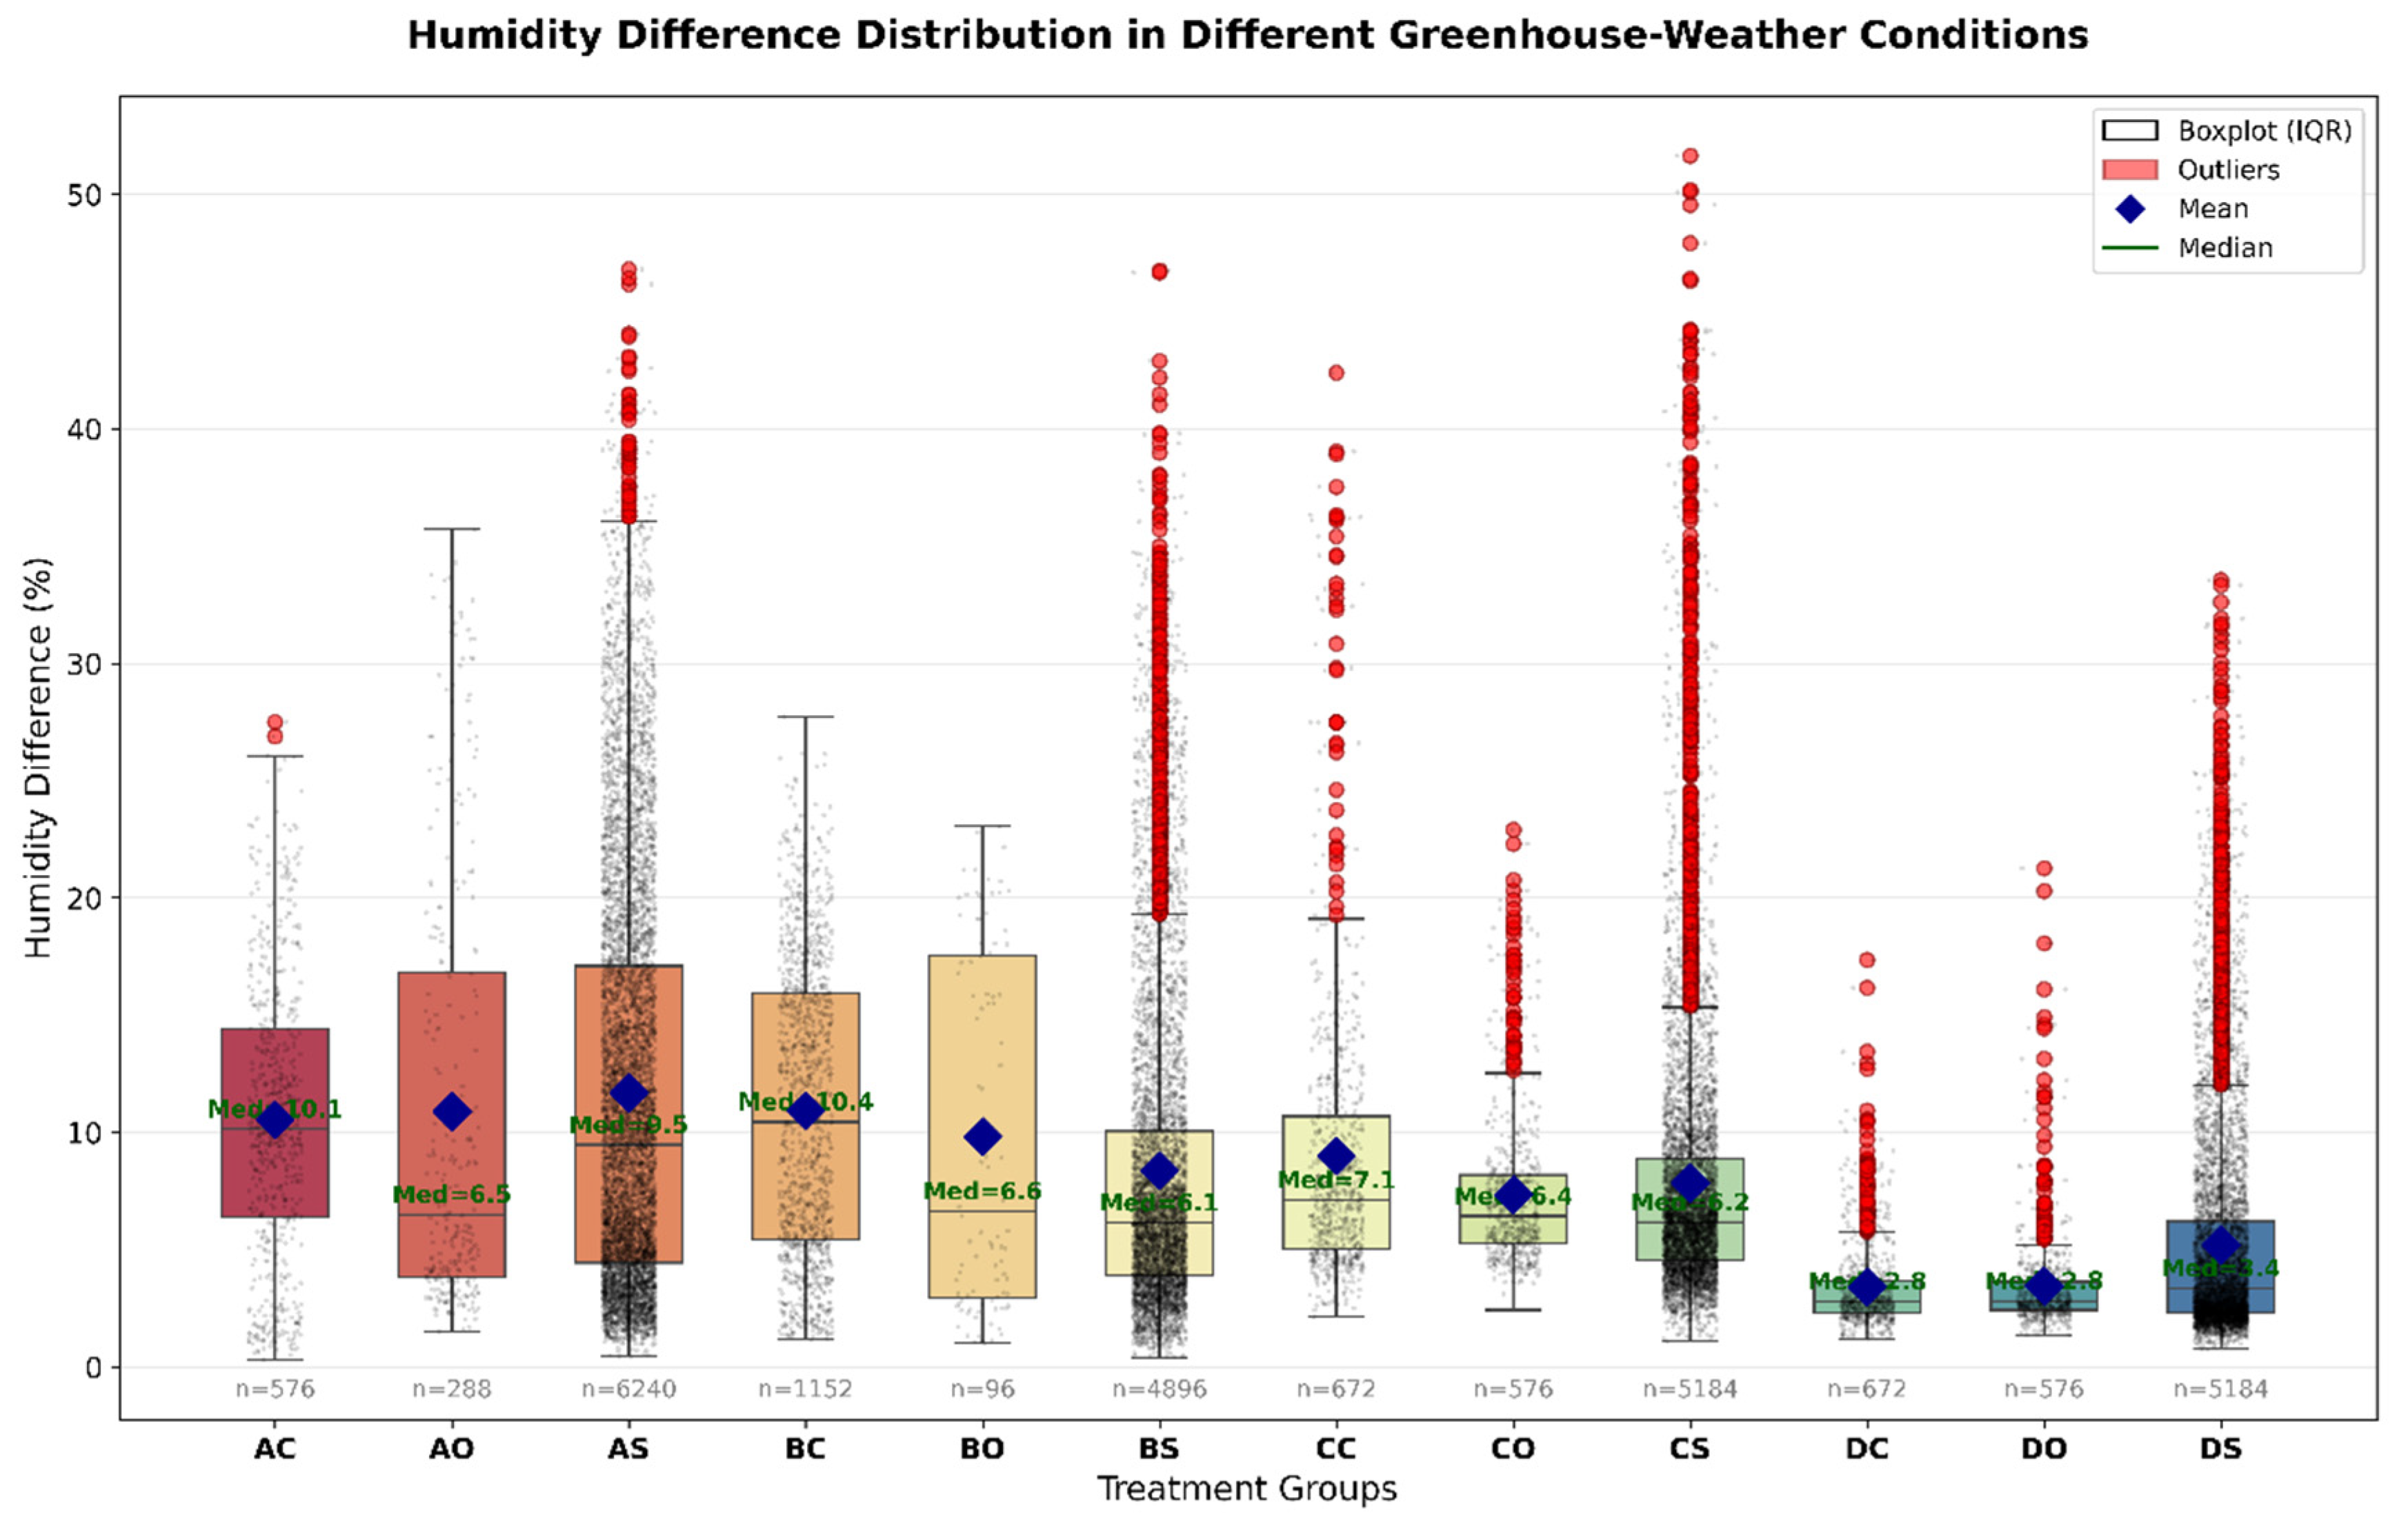
Figure 12.
Cumulative yield estimation at different positions of the greenhouses. (A: Brick wall solar greenhouse; B: Assembled solar greenhouse; C: Glass multi-span Greenhouse; D: Plastic film multi-span greenhouse).
Figure 12.
Cumulative yield estimation at different positions of the greenhouses. (A: Brick wall solar greenhouse; B: Assembled solar greenhouse; C: Glass multi-span Greenhouse; D: Plastic film multi-span greenhouse).
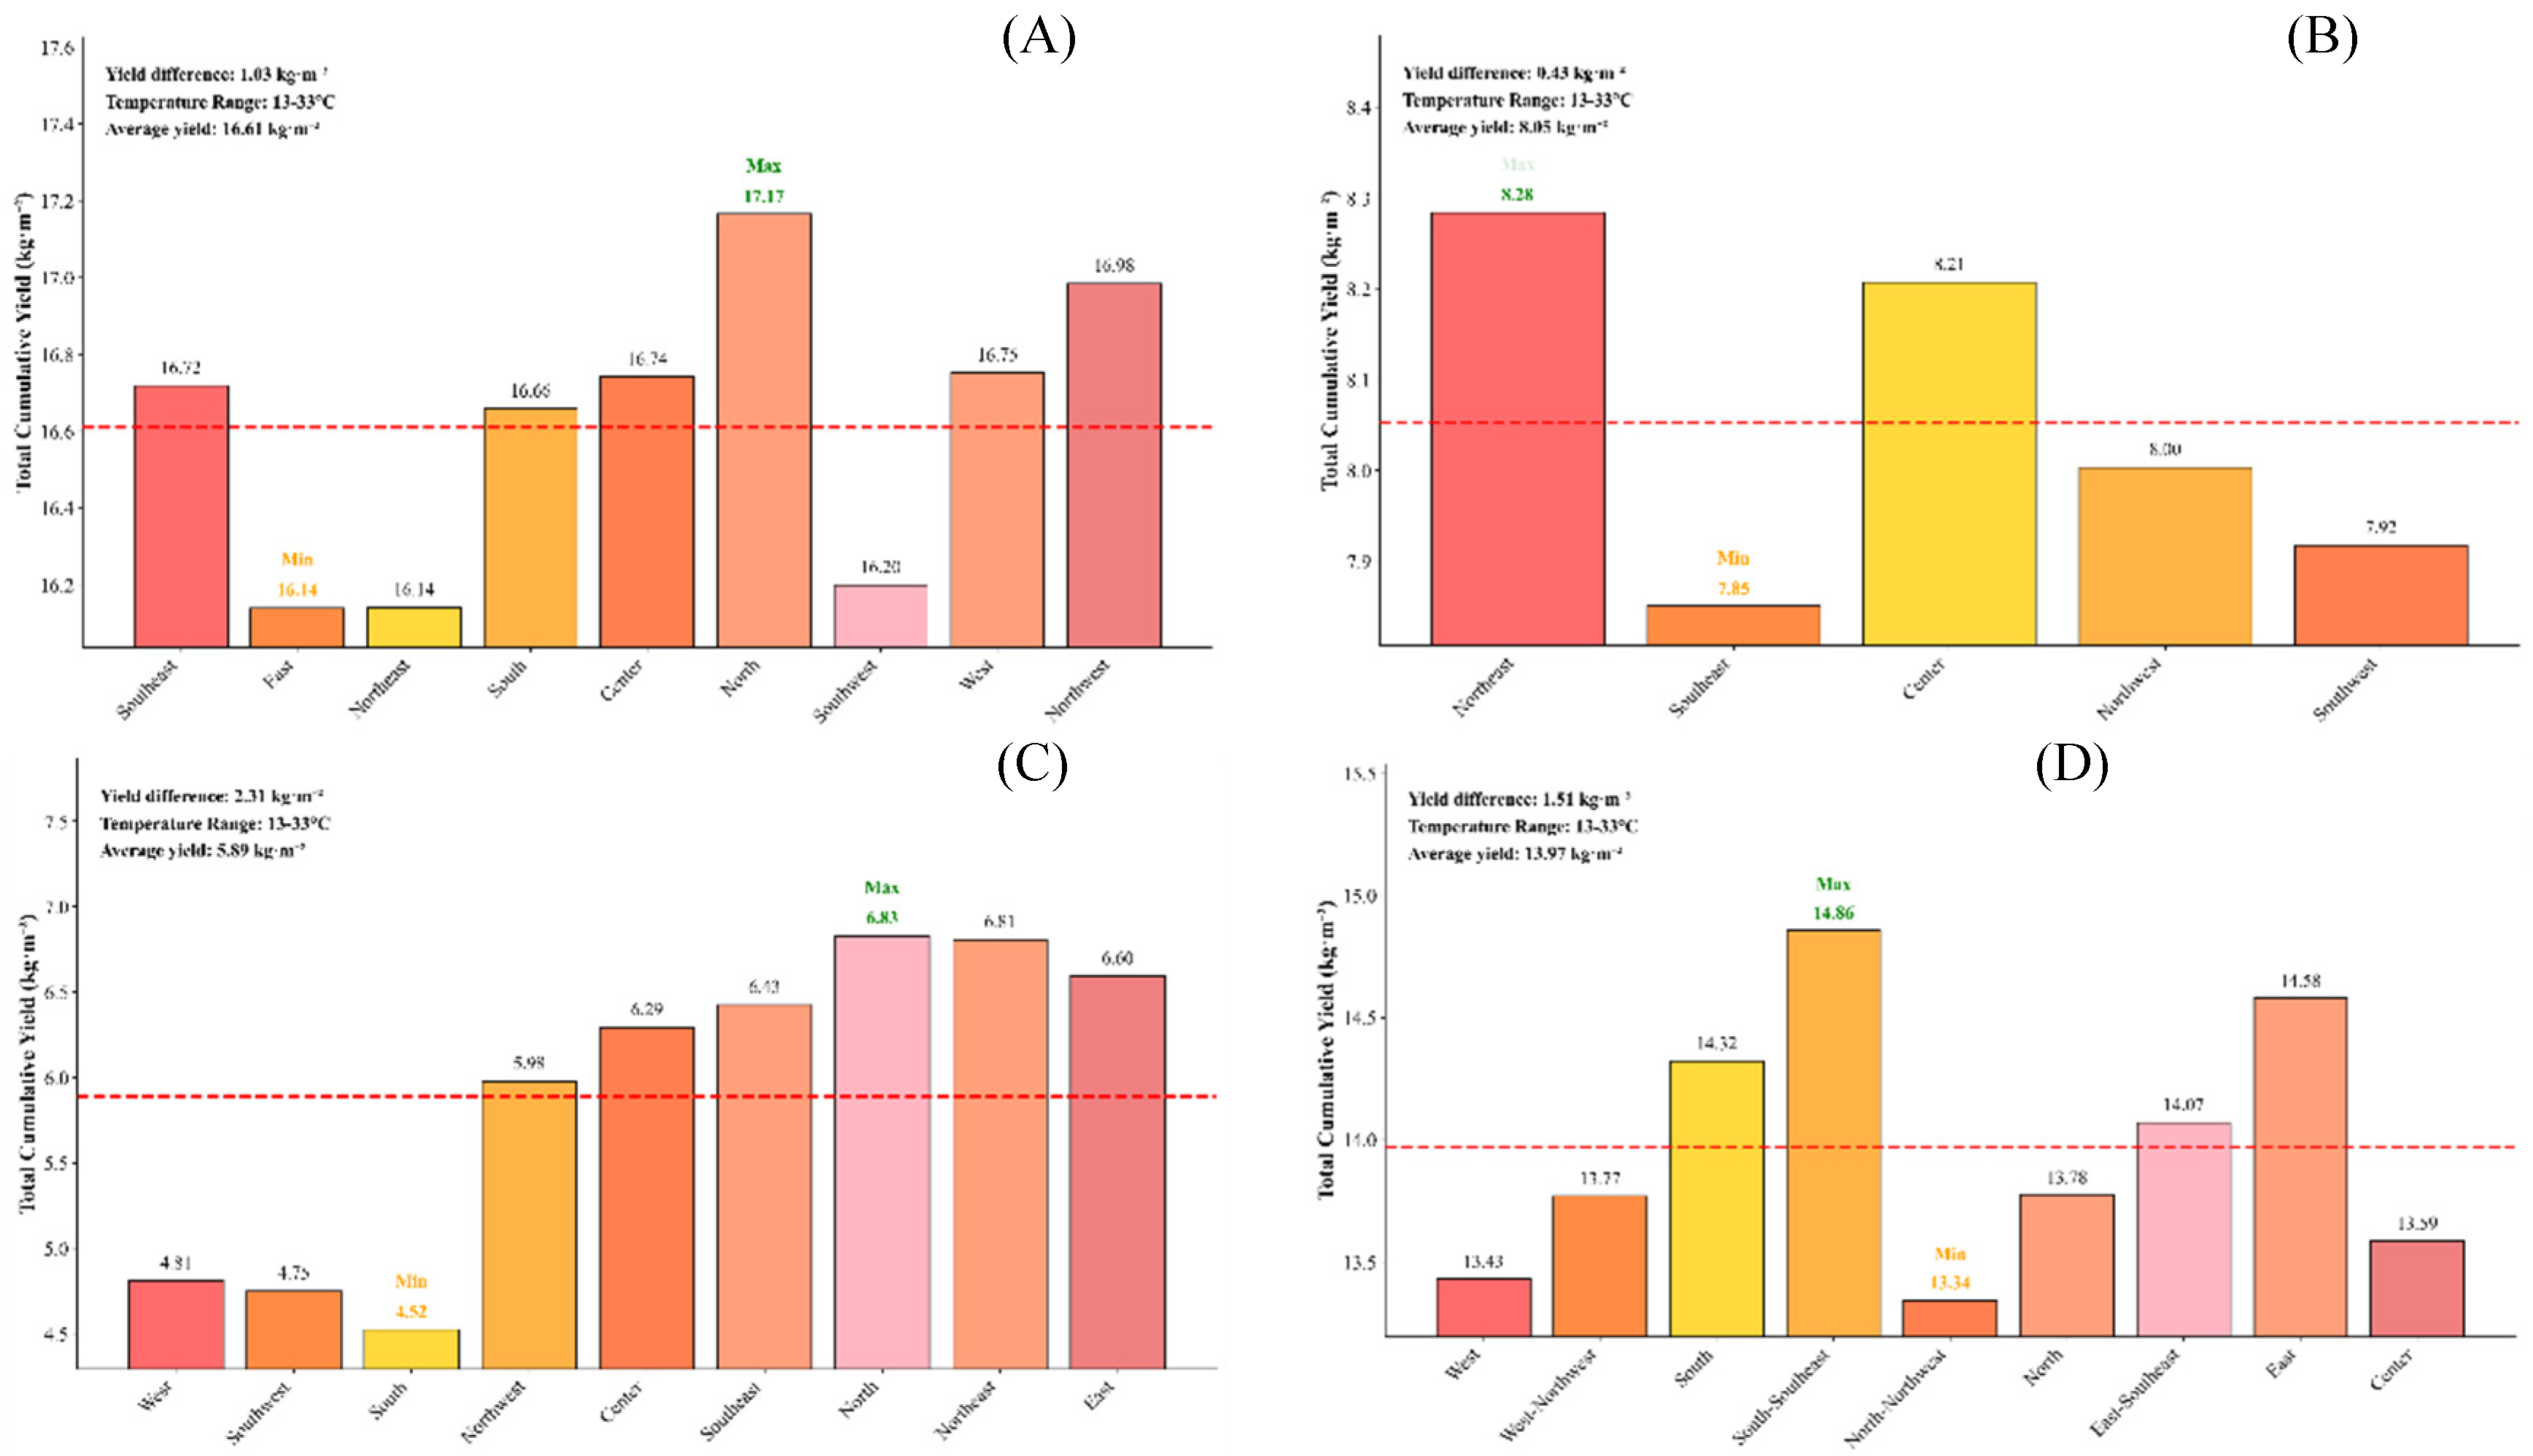

Table 1.
Specifications of temperature and humidity sensors deployed in the greenhouse.
| Sensor | Location | Acquired parameters | Measurement range | Measurement resolution | Accuracy |
Temperature and humidity sensor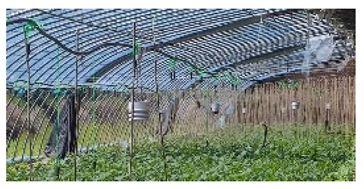
|
Inside the greenhouse, 1.5 meters above the ground | Air Temperature | -30 °C-70 °C | 0.01 °C | ±2 °C |
| Air Humidity | 0-100%RH | 0.01%RH | ±2%RH | ||
| Light Intensity | 0-200000lux | 100lux | ±5% | ||
Outdoor weather station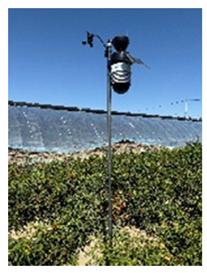 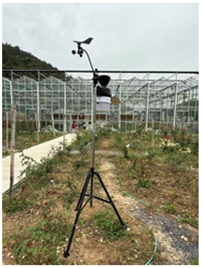
|
Outside the greenhouse, 3.5 meters high and 2 meters high | Air Temperature | -30 °C-70 °C | 0.01 °C | ±2 °C |
| Air Humidity | 0-100%RH | 0.01%RH | ±2%RH | ||
| Solar radiation | 0-200000lux | 100lux | ±5% | ||
| Wind speed | 0-67m/s | 1m/s | 0.1m/s | ||
| Wind direction | ±7° | 1° | 0-360° | ||
| Rainfall | 0-1000mm/h | ±4% | 0.2mm | ||
Indoor weather station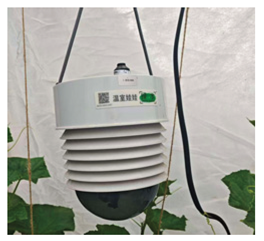 |
Inside the greenhouse, 1.5 meters above the ground | Air Temperature | -30 °C-70 °C | 0.01 °C | ±2 °C |
| Air Humidity | 0-100%RH | 0.01%RH | ±2%RH | ||
| Solar radiation | 0-200000lux | 100lux | ±5% | ||
| Carbon dioxide | 0-2000ppm | ±(40ppm + 3%) | 1ppm | ||
| Inside the greenhouse, 0.5m depth | soil temperature | -40 °C-80 °C | ±0.2 °C | 0.01 °C | |
| soil moisture | 0-100%VWC | ±2%VWC | 0.1%VWC |
Disclaimer/Publisher’s Note: The statements, opinions and data contained in all publications are solely those of the individual author(s) and contributor(s) and not of MDPI and/or the editor(s). MDPI and/or the editor(s) disclaim responsibility for any injury to people or property resulting from any ideas, methods, instructions or products referred to in the content. |
© 2026 by the authors. Licensee MDPI, Basel, Switzerland. This article is an open access article distributed under the terms and conditions of the Creative Commons Attribution (CC BY) license (http://creativecommons.org/licenses/by/4.0/).
Copyright: This open access article is published under a Creative Commons CC BY 4.0 license, which permit the free download, distribution, and reuse, provided that the author and preprint are cited in any reuse.


