

Submitted:
03 July 2026
Posted:
06 July 2026
You are already at the latest version
Abstract
The basal amygdala (BA) nuclei (basal nucleus and accessory basal nucleus) have been proposed as an emotional sensory gateway that evaluates the environmental significance of stimuli, processes both threats and rewards, is involved in translating those experiences into memories, guiding both emotional responses and goal-directed behaviors. BA circuits mature during adolescence, and alterations in this process during this critcal period have been proposed to be related to the emergence of stress-related psychiatric disorders. Understanding the molecular factors driving normal amygdala development may yield insight in the underlying pathological mechanisms of these disorders. So far however, there is no data on the cell type specific molecular changes occurring in BA during this developmental period in human or primates. To address this gap, we performed single nucleus RNA sequencing (snRNA-seq) of the BA from 68 pre- and periadolescent rhesus macaques. We identified 29 cell types including neuronal and glial cell types as well as cells mapping to the intercalated nuclei, confirming and extending previous analyses. The gene expression profiles of the BA showed limited but robust association with circulating cortisol levels, underlining the role of the BA in stress processing. Importantly, we observed 158 genes across 16 cell types to be significantly associated with developmental age, with pathway enrichment analyses supporting a broad downregulation of cell adhesion programs and associations with synaptic pruning pathways. Genes showing age-associated expression were significantly enriched for genetic risk loci underlying a hierarchical general psychopathology (“p”) factor derived from psychiatric GWAS, with a further, more lenient-threshold overlap emerging for an internalizing-specific factor. Because this developmental window coincides with the peak onset of several psychiatric disorders, these findings from a nonhuman primate model support a link between developmentally regulated amygdala gene expression and risk for stress-related psychopathology. The findings also highlight the relevance of primate models in understanding neurodevelopmental risk factors for psychiatric illnesses.
Keywords:
basal amygdala
; single nucleotide RNA sequencing
; Rhesus macaque
; internalizing disorders
Introduction
The amygdala is a complex limbic brain structure that is conserved across species, composed of different subnuclei, and represents a core component of the distributed neural circuit underlying threat and anxiety processing in the mammalian brain [1]. Alterations in this neural circuit are hypothesized to underlie the pathophysiological processes leading to anxiety disorders, depression, and other types of psychopathology. Neuroimaging meta-analyses consistently find alterations in amygdala centered networks and amygdala volume with a number of psychiatric disorders, including anxiety and depressive disorders as well as posttraumatic stress disorder [2−6]. From childhood into early adulthood the amygdala is undergoing dynamic changes in volume, activation and neural circuit connectivity. Generally, amygdala volume continues to increase throughout childhood and adolescence [7], and many studies also find increasing amygdala reactivity to emotional stimuli across the same developmental period [8,9]. Changes in the function of prefrontal cortex-amygdala circuitry that is relevant for emotion regulation has also been observed into early adulthood [10,11]. These developmental changes in the amygdala neural circuitry coincide with the emergence of stress-related psychopathology, as anxiety symptoms typically begin during childhood, followed by an increase in the prevalence of anxiety and depressive disorders diagnoses during adolescence [12].
Among the amygdala nuclei, the basal amygdala nuclei, basal nucleus and accessory basal nucleus, are strategically located to serve as a processing hub between information flowing into and out of the amygdala [13]. The BA communicates via reciprocal projections with cortical and subcortical regions and sends projections to regions of the extended amygdala (central nucleus (Ce) and the bed nucleus of the stria terminalis (BST)), which then activates threat-related responses via its downstream targets. Overall, the BA evaluates the significance of sensory stimuli through integration across sensory modalities, integrating prior experience and learning with internal states. Beyond its well-researched role in fear conditioning, the BA also responds to stimuli with positive or negative valence, predict positive or negative outcomes and can give rise to both, appetitive or aversive behaviors stimulated [14]. Importantly, the BA matures across the periadolescent period which is characterized by an increasing integration and function of local inhibitory GABAergic circuits and their engagement by the regulatory medial prefrontal cortical regions [15,16]. It has been hypothesized that alterations in the development of prefrontal-amygdala connectivity may contribute to the heightened to develop stress-related psychopathology during periadolescence [14].
The primate BA is composed of glutamatergic projection neurons, along with several distinct classes of GABAergic interneurons [17−19]. Rodent studies have demonstrated involvement of BA excitatory projection neurons in modulating anxiety-related behavior depending on the specificity of their projection sites [13,20−26]. The heterogeneity and complexity of BA inhibitory interneurons is only beginning to be understood. Within the BA, multiple classes of inhibitory interneurons form microcircuits that modulate the function and output of the longer-range projecting excitatory neurons [24,27−31]. Other relevant cell types are located within the intercalated cell masses (ICMs), which are a population of GABAergic neurons that surround various amygdala nuclei including the BA. Their strategic location further serves to modulate information flow coming to and leaving the BA [32,33]. The BA GABAergic interneurons along with the ICMs [27−29,34−36] occupy a key position for the modulation of BA function and amydala output [37].
Studies in NHPs have been examining the role of BA neurons in anxiety and threat-related behaviors. Recent studies in young rhesus monkeys using chemogenetic methods have demonstrated that neuronal excitation of BA neurons results in increases in anxiety-related behaviors, whereas, inhibition of BA neurons has opposite effects [38,39]. The evolutionary relatedness of rhesus monkeys to humans, makes this NHP species invaluable for modeling human psychopathology to uncover underlying molecular and neural mechanisms. Recent advances in single cell/nucleus RNA sequencing (sc/sn-RNA-seq) now allow evaluations at the cell type level of this complex brain region. A few studies using amygdala tissue from a small number of rhesus monkeys (N = 3 to 5) used snRNA-seq to characterize the cellular composition of the rhesus amygdala [40−42], compared it to the human amygdala and demonstrated general conservation of amygdala gene expression across rhesus monkeys and humans. However, despite the established nuclei diversity in the amygdala and the evidence suggesting vulnerability to psychiatric disorders during adolescence, there is currently no snRNA-seq data available in adolescent NHPs focusing on the BA.
The goal of the present study is to use snRNA-seq in a large sample of pre- and peri-adolescent rhesus monkeys to identify and describe distinct neuronal populations and their patterns of gene expression in the rhesus BA. We leverage this unique sample to understand the extent to which factors previously shown to relate to amygdala function would map to the cell-type specific expression profiled in the BA. This included hypothalamus pituitary adrenal (HPA) axis activity, specifically baseline blood cortisol levels, developmental age from childhood through adolescence, as well as trait-like anxiety, or anxious temperament. The age of the monkeys ranged from 1.8 to 4.3 years, which in humans is comparable to an age range that spans the transition from pre-adolescence to adolescence in humans. This phase is of particular clinical relevance as it marks a critical window of increased risk for onset of several psychiatric illnesses such as anxiety disorder and depression. Given the relative scarcity of human brain expression data available for this developmental period, the investigation of rhesus macaque tissue offers a unique opportunity, to investigate cell-type resolved gene expression in the BA, a region strongly implicated in anxiety, depression and other stress-related disorders.
Results
Single-Nucleus Profiling of the Basal Amygdala Region in Rhesus Macaques
Single-nucleus RNA sequencing (snRNA-seq) data from the basal amygdala region of 68 young monkeys from three cohorts (mean age = 2.61 years; range: 1.76 - 4.27 years; 24 females and 44 males) was analyzed. The snRNA-seq data from the 68 individuals resulted in 745,497 nuclei after quality control. The median number of nuclei per sample was 11,122 nuclei (range: 7,263 -16,297). The median number of genes and counts per nucleus were 1085 and 1502, respectively. We applied Leiden clustering using highly deviant genes to identify cell type clusters, discovering a total of 29 cell types including neuronal and glial cell types as well as a small fraction of endothelial cells, immune cells, and fibroblasts (Figure 1a,b). Most of the clusters showed homogenous contributions from all subjects and from the three cohorts, however four of the clusters were mainly constituted with snRNAseq data from cohorts 2 and 3 (Supplementary Figure S1a-c).
Identification of Cell Types Within the Basal Amygdala Region
Glial cell types (including astrocytes, ependymal cells, oligodendrocyte precursors, committed oligodendrocyte precursors, oligodendrocytes and microglia) were annotated based on well-established marker genes from the literature [41,43−45]. Neuronal cell types were assigned using previous studies conducted in the rhesus macaque amygdala and across species including human, baboon, mouse, and chicken [40,41,46,47] (Figure 1). Figure 1a shows the UMAP visualization of cell clusters and Figure 1b shows the number of nuclei for each of the identified cell types, with oligodendrocytes being the most common cell type.
Neuronal cell types were labelled by first distinguishing excitatory versus inhibitory identity based on glutamatergic versus GABAergic marker expression, then annotating subtypes using cluster-specific marker genes cross-referenced against three snRNA-seq publications in rhesus macaque and/or across species in amygdala [40−42]. Among the neuronal cell types, 73.1% were excitatory and 26.9% were inhibitory, aligning well with previous findings of a ratio of 70.2% to 29.8% in the basal amygdala [46,47].
Within inhibitory cell types (Figure 2a), all 10 clusters corresponded to cell types described in at least one of the three previous studies [40−42]. Inhibitory neuron types could be annotated based on developmental origin (Figure 2b) such as CGE-derived (ADARB2+, PROX1+, NR2F2+), LGE-derived (MEIS2+, ISLR2+), and MGE-derived (NKX2-1, LHX6, SOX6). CGE-derived interneurons reflected the highest proportion of detected interneurons, with In_VIP_CALB2_ADARB1 cells representing 29.1% of inhibitory neurons. This was followed by In_LAMP5_NDNF_RELN, that also showed high expression of KIT and constituted 11.5% of inhibitory neurons and In_CNR1_HTR3A_CCK, representing 9.7% of all inhibitory neurons. We also identified two LGE-derived inhibitory neuron clusters that are characteristic of neurons found in the ICMs. These were labelled In_FOXP2_TSHZ1_DRD1 and In_FOXP2_TSHZ1_ESR1 and constituted 4.0% and 1.5% of inhibitory neurons, respectively. The In_FOXP2_TSHZ1_DRD1 cluster has been previously described [42] as spiny neurons with enriched expression of DRD3 whereas the In_FOXP2_TSHZ1_ESR1 cluster have been described as aspiny neurons with enriched expression of HTR7, also observed in our data. We identified four MGE-derived inhibitory neuron types. These included In_LAMP5_LHX6_NTNG1 constituting 8.9% of inhibitory neurons. A previous study showed that this LAMP5 inhibitory neuron subtype was enriched in primate cortex compared to mice [48]. We also identified two MGE-derived PVALB-expressing inhibitory neuron subtypes; In_PVALB_ADAMTS5_UNC5B and In_PVALB_MYO5B, accounting for 7.3% and 11.6% of inhibitory neurons, respectively. MGE-derived SST-expressing neurons (In_SST_NPY) constituted 15% of all inhibitory neurons and were characterized by the co-expression of NPY. The clustering analysis also revealed a small (1.5%) inhibitory neuron subtype not clearly mapping to one of the three GE, In_MEIS2_ADARB2_PARD3B, that was categorized as an inhibitory neuronal subtype, although it also expressed low levels of the excitatory neuron subtype marker SLIT3.
We identified 10 excitatory neuron clusters (Figure 2c). In general, all excitatory clusters except Ex_SOX11_SOX4_BCL2 showed a relatively high expression of PEX5L and COL25A (Supplementary Figure S2a), two marker genes identified as highly enriched in the basal amygdala compared to other amygdala subnuclei [42]. The majority of the excitatory neuron clusters identified in our data matched previously described cell type annotations. Totty et al. [42] identified four classes of excitatory neurons that were present across multiple amygdala subdivisions in human and NHPs. Two of these classes clearly mapped to clusters in our dataset. The class of excitatory neurons identified as RXFP1+/KIAA1217+ in Totty et al. [42] +mapped to our Ex_FOXP2_RXFP1_KIAA1217 cluster and constituted 3.6% of all excitatory neurons. The SATB2+/MPPED1+ excitatory neuron class from Totty et al. [42] likely corresponds to 4 excitatory neuron clusters in our dataset given their high co-expression of these two genes (Supplementary Figure S2a): Ex_ABI3BP_FBN2_SULF1 (4.01%), Ex_HTR1F_PDZRN4_KCNH5 (1.13%), Ex_IQGAP2_TRPC4_KLHL32 (11.09%), and Ex_NFIA_RPS6KA2_GALNT14 (1.2%). A large cluster representing 17.9% of all excitatory cells in our data (Ex_SOX11_SOX4_BCL2) mapped a neuronal cluster characterized by the expression of immature marker genes described in Yu et al. [40]. The two largest clusters were Ex_TMEM132C_SYN3_TIMP3 (35.0% of excitatory cells), characterized by low but enriched expression of DRD2 and high but not unique expression of MOXD1, mapping onto a cluster previously described by Yu et al. [40] as “MOXD1 DRD2”; and Ex_ESR1_ZIC5_ZBTB7 (20.0% of excitatory cells), characterized by enriched expression of VWA5B1 and PDE1C, matching a cluster previously described in the same study [40]. Another cluster (Ex_PROX1_LPAR1_MALRD1; 5.7%) showed a very unique expression of PROX1, LPAR1 and MALRD1. This cluster could potentially map to a cluster previously described as “VGLL3 GRP” [40] (while these two genes are enriched in this cluster, they are also expressed in some other clusters; Supplementary Figure S2a). Lastly, a small cluster Ex_TFAP2C_CARTPT_CDH23 (0.4%) showed highly unique expression of TFAP2C, CARTPT, CDH23, and MEIS1 as well as an enriched expression of PARD3B and the highest expression of SLC17A6. This cell type may map to “cryptic amygdalar neurons” described in Totty et al. [46] showing high expression of MEIS1, PARD3B and SLC17A6 which co-clustered with inhibitory neurons in their data. Similarly, in our data hierarchical clustering placed this cluster closer to inhibitory cell types (Supplementary Figure S2b). Yet, given the high expression of the glutamatergic marker gene SLC17A6 and the lack of expression of GAD1, GAD2, and SLC32A1, we classified this cluster as excitatory.
Associations between individual differences in baseline cortisol with gene expession Prior to the euthanasia of the animals, blood samples were collected to measure baseline cortisol concentrations. No significant differences were observed across the three cohorts (Kruskal-Wallis, p = 0.086; Figure 3a). Differential gene expression analysis indicated that overall gene expression patterns were not strongly related to inter-individual variability in baseline cortisol levels (Figure 3b). However, canonical glucocorticoid-responsive genes, such as FKBP5 and ZBTB16, were significantly associated with individual differences in baseline cortisol in several glial cell types (Figure 3c,d). Interestingly, the cell types showing the most significant cortisol associations (OPCs, Oligodendrocytes) did not correspond to those with the highest NR3C1 expression; excitatory neuron subtypes such as Ex_ABI3BP_FBN2_SULF1, Ex_TMEM132C_SYN3_TIMP3, and Ex_ESR1_ZIC5_ZBTB7C showed higher NR3C1 expression (Figure 3e,f). This dissociation is could be partially explained by differences in statistical power: glial cell types were contributed by the full sample of 68 subjects and were among the most abundant cell populations (ranging from ~68,000 to ~112,000 nuclei), whereas the highest NR3C1-expressing excitatory subtype was considerably rarer and contributed to by fewer subjects (Ex_ABI3BP_FBN2_SULF1: ~11,000 nuclei from a total of 47 subjects), substantially reducing sensitivity to detect cortisol-related transcriptional changes despite potentially stronger GR-mediated biology. Notably, even in cell types expressing canonical GR-response genes (FKBP5, ZBTB16, PER1) where the cortisol association did not reach statistical significance, the direction of the effect was generally consistent with that observed in the cell types where the association did reach significance. In addition to differences in statistical power, biological mechanisms may also contribute to the observed dissociation. For example, chronically elevated circulating cortisol can drive sustained GR activation, which is often associated with downregulation of GR mRNA and protein in brain regions involved in HPA axis feedback regulation, such as the amygdala and the hippocampus [49,50]. We additionally observed strikingly distinct expression patterns for the two main corticosteroid receptors - the glucocorticoid receptor (GR/NR3C1) and the mineralocorticoid receptor (MR/NR3C2) - across cell types, suggesting that cortisol sensitivity is mediated through largely non-overlapping cell populations depending on receptor subtype (Figure 3e,f).
Anxious Temperament and BA Gene Expression
Rhesus macaques across three cohorts were phenotyped for anxious temperamen (AT), a trait-like anxiety phenotype that when extreme models human anxiety disorders, using the No Eye Contact (NEC). Individual differences in the AT are calculated by averaging three threat related parameters elicited by exposure to the no eye contact condition of the human intruder paradigm (i.e., increased freezing duration, decreased coo vocalizations, and increased cortisol levels) [51] - for detail see methods. Freezing behavior differed significantly across cohorts (Kruskal-Wallis p = 0.00077; Supplementary Figure S3a), with pairwise comparisons confirming differences between all three cohort pairs (NORS vs. OFFEM, p = 0.04; NORS vs. RS, p = 0.00039; OFFEM vs. RS, p = 0.03). Vocalizations (cooing) and cortisol did not differ across cohorts (p = 0.39 and p = 0.28, respectively; Supplementary Figure S3b,c). Because the animals in this study expressed few vocalizations, interindividual differences in gene expression were only examined for freezing duration and NEC-induced cortisol. However, no genes were found to be significantly associated with freezing behavior or NEC-induced cortisol at FDR < 0.1.
Developmentally Regulated Gene Expression During the Pre-Adolescent Phase
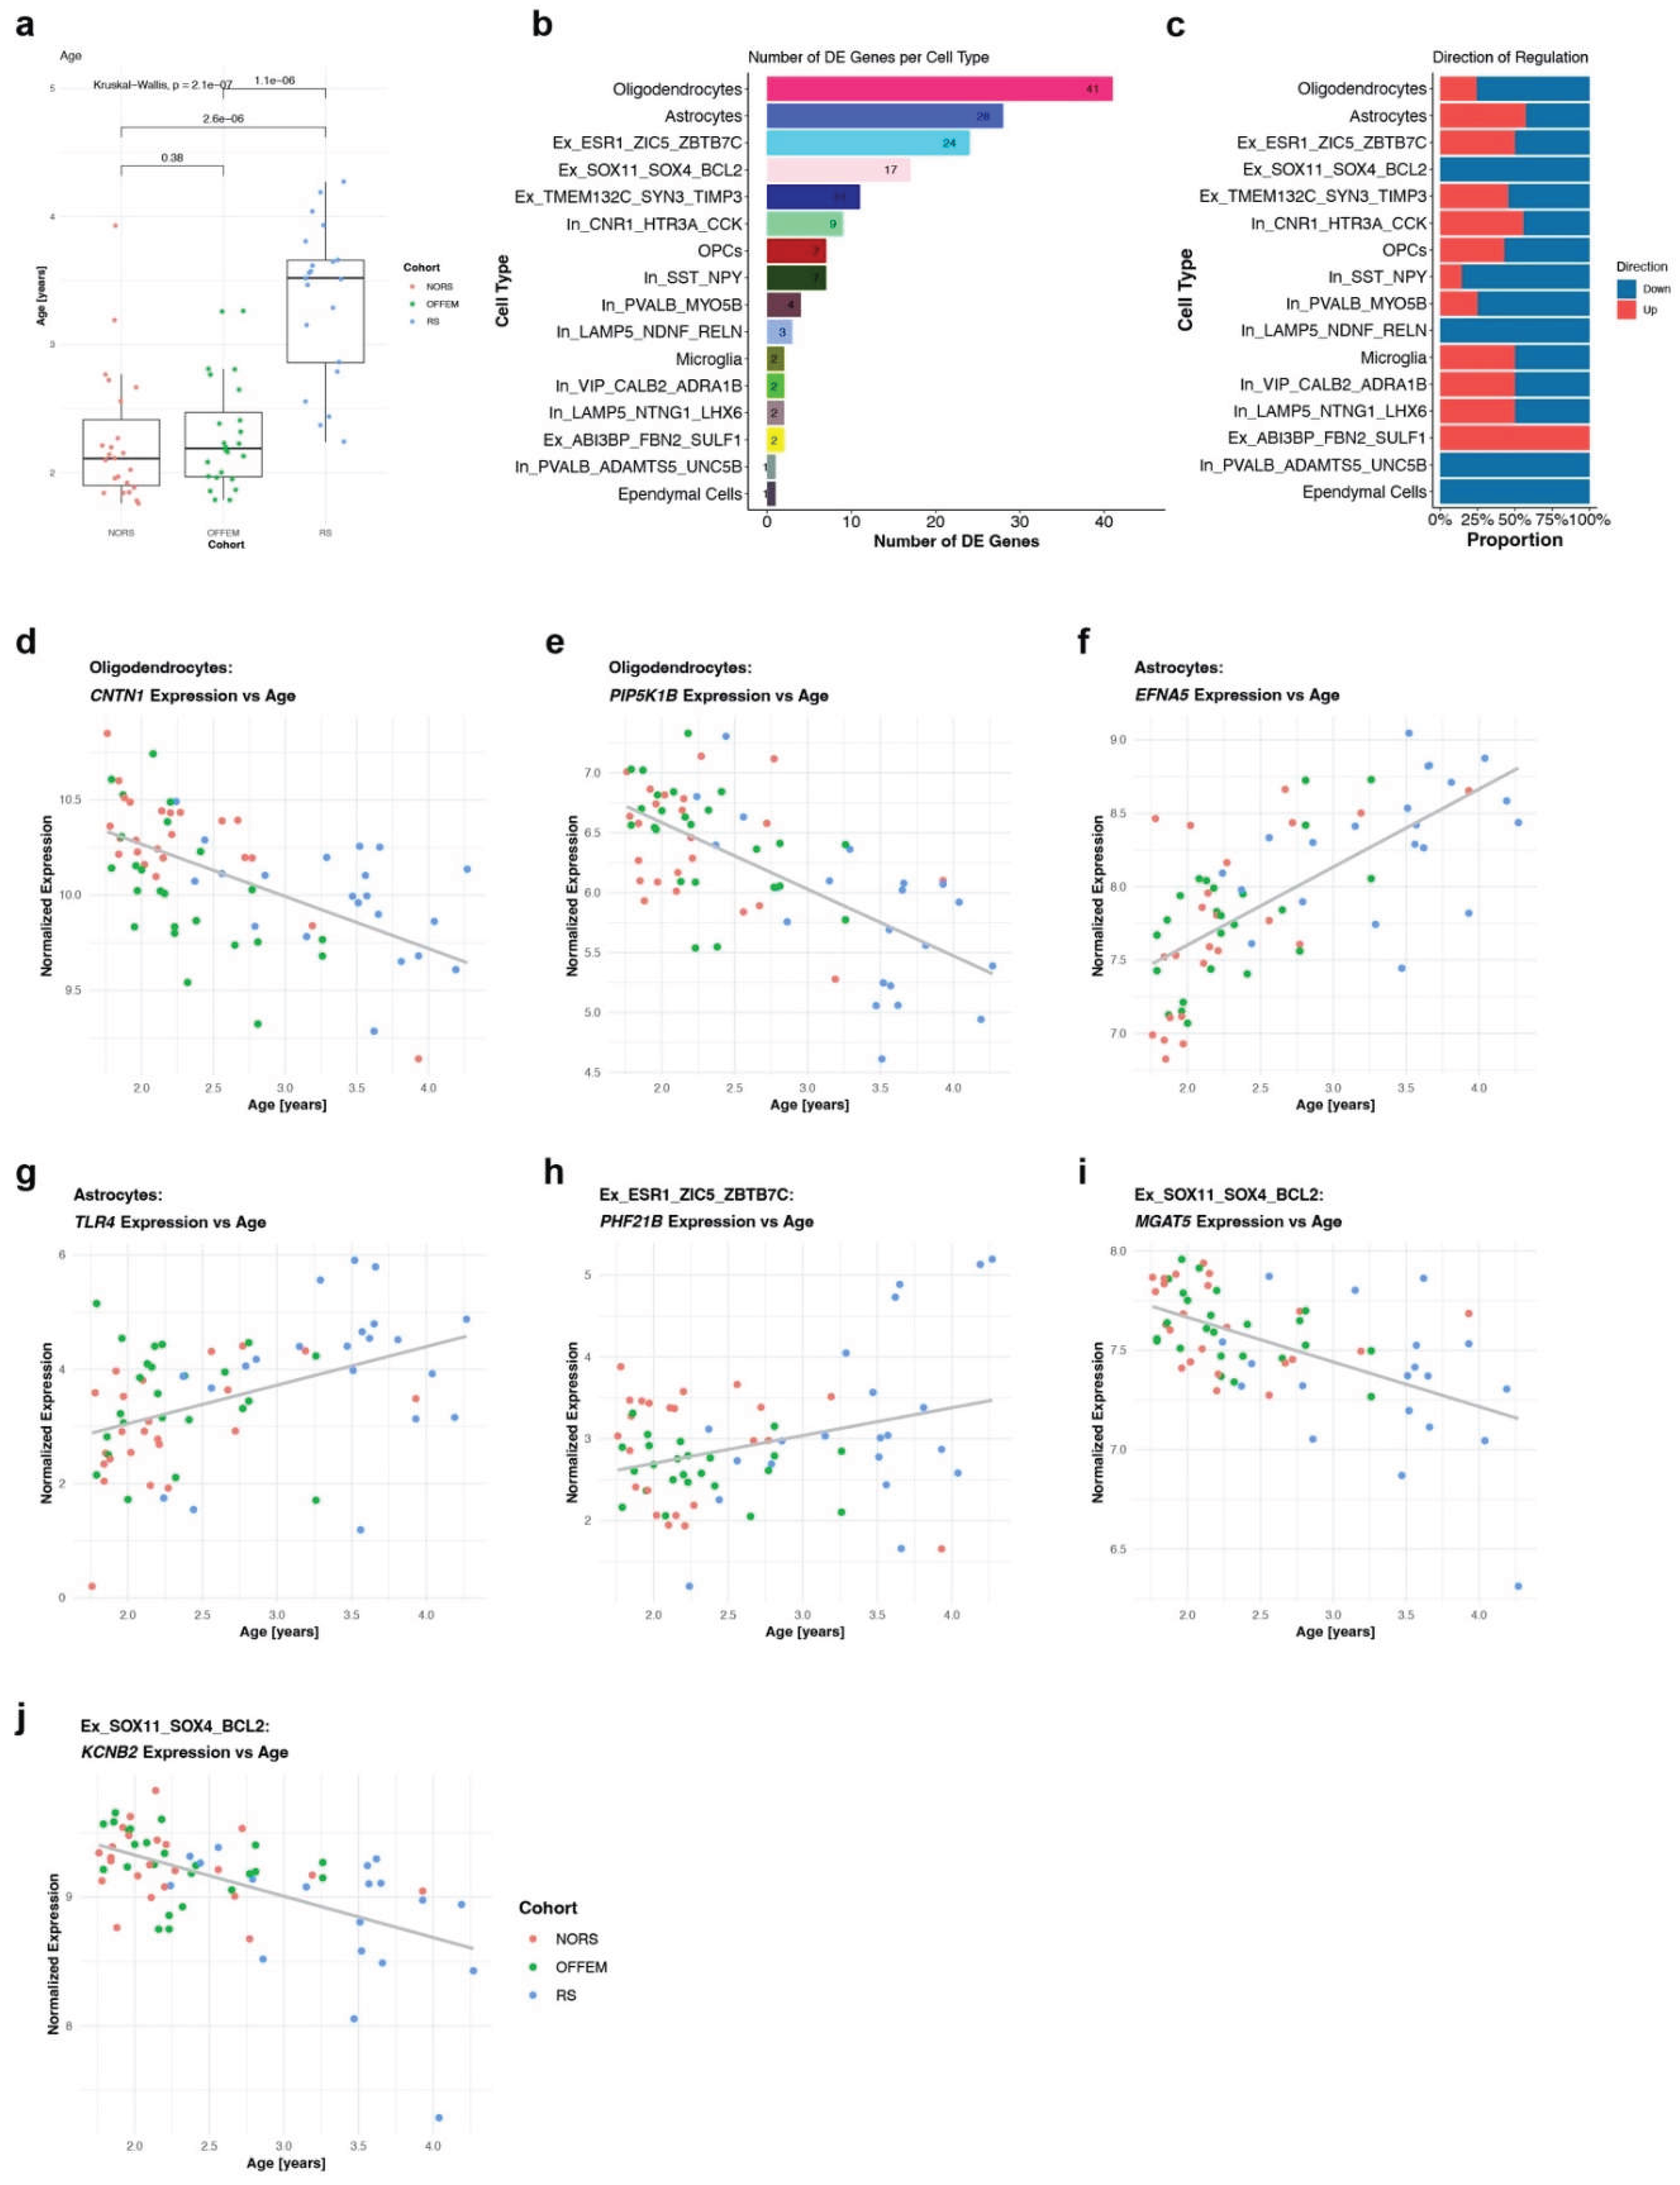
Next, we explored how developmental age influences gene expression in the BA, focusing on the unique developmental window captured by our study sample, which encompasses the (pre-) adolescent phase. Although there were significant differences in age distribution between the cohorts (Kruskal-Wallis p = 2.1e-07), primarily driven by the slightly older subjects in cohort RS (wilcox-test, two-sided, p=2.6e-06 with NORS, and p=1.1e-06 with OFFEM), the age range for RS still overlapped with those of the other two cohorts (Figure 4a). Differential gene expression analysis showed a total of 158 (unique) developmentally regulated genes (FDR < 0.1) within 16 cell types, most of which (%) were downregulated with increasing age (Figure 4b,c). Overall, oligodendrocytes and astrocytes showed the highest number of age-related transcripts, followed by excitatory neuron cell types.
Oligodendrocytes showed 41 significant DE genes; among these, CNTN1 and PIP5K1B showed reduced expression with increasing age (Figure 4d,e). CNTN1 encodes a cell adhesion molecule expressed dynamically on oligodendrocytes during postnatal development, where it mediates axon-oligodendrocyte communication and is required for myelin membrane extension, nodal formation, and paranodal domain establishment [52]. PIP5K1 encodes a member of the phosphatidylinositol-4-phosphate 5-kinase 1 family, which has been implicated in the regulation of oligodendrocyte differentiation [53].
In astrocytes 28 transcripts, including EFNA5 and TLR4 showed increased expression with age (Figure 4f,g). EFNA5 encodes Ephrin-A5, a member of the ephrin-A family whose astrocytic ligands mediate contact-dependent bidirectional signaling with neurons through Eph receptor tyrosine kinases, with roles in regulating dendritic spine morphology, glutamate transporter expression, and synaptic plasticity [54]. TLR4 encodes Toll-like receptor 4, which has been shown to regulate excitatory synaptogenesis in astrocytes during postnatal hippocampal development [55].
In the ESR1_ZIC5_ZBTB7C neuron subtype 24 transcripts show association with age. These included PHF21B, encoding a PHD finger epigenetic reader protein, that showed increased expression with age (Figure 4h) and has been implicated in neuronal differentiation and regulation of synaptic plasticity-related genes [56]. In the SOX11_SOX4_BCL2-expressing immature neuron subtype 17 transcripts were associated with MGAT5 and KCNB2 downregulated with age (Figure 4i,j). MGAT5 encodes a glycosylation enzyme involved in neural progenitor cell differentiation [57], while KCNB2 encodes a voltage-gated potassium channel subunit involved in neuronal excitability and synaptic transmission, with mutations linked to neurodevelopmental disorders [58].
To more broadly characterize biological pathways affected during this developmental period, gene set enrichment analysis (GSEA) was performed for each cell type. Oligodendrocytes showed a downregulation of gene sets related to homophilic and cell-cell adhesion via plasma membrane adhesion molecules, suggesting a broad downregulation of cell adhesion programs with increasing age. In astrocytes, all significant terms were downregulated, including translation, ribosome biogenesis, protein folding, and chaperone activity, indicative of a transition from a biosynthetically active, proliferative state in early development toward a more homeostatic state as adolescence progresses. In Ex_ESR1_ZIC5_ZBTB7C excitatory neurons, both up- and downregulated processes were detected. Declining pathways included translation, peptide biosynthesis, ATP synthesis, and respiratory chain function, mirroring the metabolic and anabolic slowdown observed in astrocytes, while positively enriched gene sets included nucleotide metabolic processes, regulation of purine metabolism, and peptidyl-serine phosphorylation, suggesting a shift toward increased intracellular signaling activity with age. Ex_ABI3BP_FBN2_SULF1 excitatory neurons similarly showed downregulation of cellular respiration pathways alongside microtubule-based processes, suggesting reduced metabolic and cytoskeletal dynamics. The most extensive GSEA signal was observed in IQGAP2_TRPC4_KLHL32 excitatory neurons, where age-associated downregulation of synaptic transmission, neurotransmitter signaling, and dendrite/axon morphogenesis gene sets was accompanied by upregulation of immune/inflammatory signaling, apoptosis-related, and DNA damage response programs - a pattern collectively consistent with active synaptic pruning, complement-mediated elimination signaling, and associated chromatin remodeling. In PVALB_MYO5B inhibitory neurons, downregulation of pathways including translation, peptide biosynthesis, and multiple gene sets related to neuron projection development and plasma membrane-bounded cell projection organization, suggest a broad reduction in both biosynthetic activity and structural remodeling of neuronal projections with increasing age. Microglia yielded enrichment exclusively in neuronal gene sets (e.g., synapse organization, neuron projection development, and neuronal differentiation). This pattern may reflect residual ambient neuronal RNA contamination, a well-documented limitation of brain snRNA-seq datasets that can lead to neuronal signatures in glial populations [59]. Collectively, these findings point to a coordinated downregulation of biosynthetic and structural remodeling programs across multiple amygdala cell types during this developmental period.
Developmentally Regulated Genes Converge on Transdiagnostic Genetic Risk for Psychopathology
Psychiatric disorders are highly polygenic and share substantial genetic overlap across diagnostic boundaries, motivating the use of genomic structural equation modeling (SEM) to identify shared and disorder-specific genetic factors underlying psychopathology. We used the genomic SEM factors identified by Grotzinger et al. [60] - including a hierarchical general psychopathology (“p”) factor and several intermediate factors such as internalizing - to ask whether genes showing developmentally regulated expression in the BA converge with these transdiagnostic genetic risk loci. Of the genomic SEM factors tested, the hierarchical p-factor was the only one showing significant overlap with age-differentially expressed genes at genome-wide significance (p = 0.02, based on 1,000 permutations). When the GWAS significance threshold was relaxed to p < 1×10⁻⁵, this overlap expanded, and a significant overlap also emerged for the internalizing factor (p = 0.001), consistent with the hierarchical relationship between these two factors in the genomic SEM model. The large majority of overlapping genes were shared between the two factors, spanning multiple cell types, including astrocytes (EFNA5, NLGN1, TLR4), Ex_ESR1_ZIC5_ZBTB7C (ALS2), Ex_TMEM132C_SYN3_TIMP3 (SPAG16), In_CNR1_HTR3A_CCK interneurons (NDST3, PRSS12), In_LAMP5_NDNF_RELN interneurons (DSCAM), In_SST_NP interneurons (CACNA1E, INPP4B), In_VIP_CALB2_ADRA1B interneurons (CTNNA3), and oligodendrocytes (SEMA6D, UGGT2, LUZP2); of these, EFNA5, TLR4, NDST3, PRSS12, CACNA1E, INPP4B, SEMA6D, and UGGT2 were already significant at genome-wide significance. However, within several of these cell types, the two factors were additionally driven by distinct genes: in Ex_ESR1_ZIC5_ZBTB7C RPS27 was specific to the internalizing overlap and FAM43B to the p-factor; in Ex_TMEM132C_SYN3_TIMP3 CCDC60 was specific to internalizing; in oligodendrocytes PDE1C was specific to internalizing while PCDH7 and SYT14 were specific to the p-factor; and in In_CNR1_HTR3A_CCK GRIN2A was specific to internalizing. Furthermore, some overlaps were entirely factor-specific: ependymal cells (FSTL5), Ex_SOX11_SOX4_BCL2 (ETV1), and microglia (SLC39A1) overlapped only with the internalizing factor, while OPCs (SYT14) overlapped only with the hierarchical p-factor. Unlike the p-factor, which indexes broad transdiagnostic liability, the internalizing factor captures genetic risk more specific to anxiety and depressive disorders. The substantial gene overlap between the two factors is consistent with internalizing’s position within the general psychopathology hierarchy, while the smaller set of factor-specific genes - particularly those linked only to internalizing - may point to developmentally regulated pathways with more targeted relevance to anxiety and depressive phenotypes.
Discussion
Using single-nucleus RNA-seq in 68 rhesus macaque BA samples spanning the pre- to peri-adolescent period, we characterized BA cell type diversity, tested effects of baseline cortisol and trait-anxiety phenotypes (freezing, NEC cortisol) on gene expression, and identified genes whose expression changes with age across this window. Age-related genes were significantly enriched among genes implicated in a genomic-SEM-derived general psychopathology (p) factor and an internalizing (F4) factor based on adult psychiatric GWAS [60]. This suggests the pre- to peri -adolescent BA is a period and region in which normal transcriptional maturation intersects with the genetic architecture of broad psychiatric risk.
Imaging and postmortem work have repeatedly implicated protracted amygdala development - and the BA specifically, as a major cortical-like integration node within the complex - in the emergence of anxiety- and mood-related psychopathology. Yet cellular-resolution transcriptomic data on the amygdala across development are essentially absent, and even coarse-grained data through this window are sparse. This gap is not unique to the amygdala: a full-lifespan transcriptomic atlas of the dorsolateral prefrontal cortex, a region far more extensively studied in general, has only very recently become available (preprint) [61]. This underscores how recently and incompletely this question has been addressed even for well-studied cortical regions - let alone the amygdala, for which no comparable pediatric/adolescent single-cell resource exists in any primate, including humans.
Our dataset is considerably larger than existing rhesus macaque amygdala single-nucleus datasets with approximately 7- to 30-fold more nuclei and >10-fold more individuals than Yu et al. [40] (3 subjects, ages 4-15 years, 45,626 nuclei), Kamboj et al. [41] (3 subjects, ages 3.5-4 years, 21,394 nuclei), and Totty et al. [46] (5 subjects, ages 5-18 years, 104,797 nuclei). Our major excitatory and inhibitory taxonomies broadly converge with these prior studies, though consensus on some excitatory cluster identities and taxonomy is still lacking across studies likely reflecting differences in the subnuclei sampled, the age range of animals profiled, and the greater power of our dataset to resolve finer-grained or lower-abundance subtypes.
No primate or human study has directly related blood cortisol measurements to amygdala gene expression at single cell resolution. Human postmortem work cannot address this question: antemortem cortisol is essentially never available or only with a long time gap, and postmortem measures are confounded by agonal state, cause and manner of death, and postmortem interval [62,63]. Our measurement of circulating (blood) baseline cortisol sidesteps this limitation and represents, to our knowledge, the first link between measured peripheral cortisol and single-cell gene expression in the primate amygdala. Baseline cortisol was associated with expression of canonical glucocorticoid-responsive genes. Notably, cell types with the highest glucocorticoid receptor (NR3C1) expression were not necessarily those with the strongest transcriptional association with cortisol. Reduced power in lower-abundance cell types could be one likely explanation, though a true biological dissociation - e.g., higher circulating cortisol driving downregulation of NR3C1 itself, as previously reported in bulk-tissue studies of rodent brain across multiple regions [49,50] - or cell-type-specific differences in co-regulator availability or chromatin accessibility cannot be excluded.
No gene expression associations with freezing behavior or NEC-paradigm cortisol were detected, both of which index trait-like anxiety-related phenotypes. The lack of significant association may no reflect evidence of a true absence of effect: associations between stable behavioral and endocrine trait measures and gene expression are typically small in magnitude, and our sample may simply be underpowered to detect them.
We identified a substantial number of age-related genes across this developmental window. Enrichment analyses implicated extracellular matrix (ECM) organization and synaptic pruning and refinement. These processes are thought to close and stabilize developmental windows of plasticity in limbic and cortical circuits. Detecting this signature at cellular resolution, in a species with a well-characterized developmental timeline relative to humans, extends prior bulk-tissue and imaging evidence of amygdala maturation into a molecular framework, and as previously mentioned for a developmental window and a brain region essentially unstudied at this resolution in any primate species to date.
Additionally, age-related genes were significantly enriched among genes implicated in a genomic-SEM-derived p factor [60], and, at a more lenient threshold, an internalizing-specific (F4) factor. The p-factor enrichment points toward a broad, shared developmental substrate for psychiatric risk rather than a disorder-specific one. The additional, more tentative enrichment for the internalizing factor raises the possibility of a more specific link to internalizing psychopathology, such as anxiety disorders and depression, though given the lenient threshold required to detect it, we interpret this result cautiously and see it as a hypothesis for future, better-powered work rather than a firm conclusion.
This study’s principal strengths are its scale the largest primate BA single-nucleus dataset assembled to date, the developmental window it captures, which is essentially understudied at this resolution in any primate species including humans, and the availability of directly measured endocrine and behavioral phenotypes alongside transcriptomic data, a combination unattainable in human postmortem cohorts. Its main limitations are that sex was confounded with cohort (two cohorts entirely male, one entirely female), precluding formal tests of sex-specific effects, which represents an important direction for future studies given known sex differences in internalizing disorder prevalence and timing. Moreover, interpreting our findings through adult human psychiatric GWAS assumes, reasonably but unverifiably here, some degree of conservation of developmental genetic architecture across species and across the lifespan.
Taken together these findings suggest that a subset of genes undergoing transcriptional change during amygdala maturation in the pre- to peri-adolescent period are implicated in the genetic architecture of general psychopathology, and, more tentatively, internalizing disorders specifically pointing to a potential developmental origin of broad-based, rather than disorder-specific, psychiatric risk.
Materials and Methods
Study Sample and Behavioral Assessment
The tissue used in this study was harvested from our previously established brain bank obtained from 72 monkeys that were fully phenotyped for anxious temperament (AT). For detailed methods on anxiety phenotyping see [64,65]. Briefly, all study subjects were tested in the no-eye-contact (NEC) condition of the human intruder paradigm [51], where freezing behavior, defined as the duration of behavioral freezing (a species-typical defensive response to a potential threat), cooing vocalizations, the number of coo calls emitted, which typically decrease under conditions of perceived threat and plasma cortisol, sampled immediately following NEC as an index of hypothalamic-pituitary-adrenal (HPA) axis activation are measured. Freezing and cooing were significantly negatively correlated across animals (Kendall’s r = -0.45, p = 3.57 × 10⁻⁷), consistent with their reflecting a shared behavioral domain. Given this correlation, and the high proportion of zero values in cooing (41% of animals) that limited its suitability for downstream modeling, freezing behavior (log_Avg_FF) and NEC cortisol levels were selected as the primary proxy for anxious behavior in subsequent differential expression analyses.
All study animals were maternally-reared and pair-housed at the Harlow Center for Biological Psychology or the Wisconsin National Primate Research Center. The sample was comprised of three cohorts: cohort 1 was 24 male subjects (mean age = 3.32 years; age range 2.24 – 4.27 years), cohort 2 was 24 male subjects (mean age = 2.24 years; age range 1.76 – 3.93 years), and cohort 3 was 24 female subjects (mean age = 2.29 years; age range 1.79 – 3.26 years). All procedures were approved by and in accordance with the guidelines established by the Institutional Animal Care and Use Committee at the University of Wisconsin - Madison.
Cortisol Measurement
Cortisol levels were assessed using the DPC Coat-a-count radioimmunoassay following the manufacturer’s instructions (Siemens, Los Angeles, CA). Samples were diluted 8-fold prior to being measured in duplicate. The coefficient of variation (CV) did not exceed 20% for any duplicate. The limit of detection, defined as the lowest cortisol standard used in the assay, was 0.71 μg/dL. The inter-assay and intra-assay CVs were both 7.0%.
Tissue Collection
On the day of euthanasia, blood was collected in EDTA tubes, centrifuged for collection of plasma, and stored at -80 °C until assayed. Blood was collected prior to ketamine anesthesia for cohorts 1 and 2, and an average of 6.5 ± 0.46 min following ketamine anesthesia for cohort 3. Animals were then deeply anesthetized with pentobarbital and euthanized for brain collection in accordance with the recommendations of the Panel on Euthanasia of the American Veterinary Medical Association. The time of day for euthanasia ranged from 8:58 AM to 11:21 AM.
Following euthanasia, the brain was removed from the skull, placed in a brain block and sliced into coronal slabs and snap frozen in dry ice-chilled isopentane. For cohorts 1 and 2, the slabs were 4.5 mm thick, and for cohort 3 the slabs were 13.5 mm thick. Slabs were stored at -80 °C. For cohorts 1 and 2, on the day of tissue collection, the tissue slab containing the amygdala was thawed for several minutes on a glass petri dish on wet ice. Tissue punches from several brain regions including the basal amygdala region were collected using the procedures previously described [66]. Tissues samples were collected from this slab using a circular 3-mm diameter punch tool and placed in a 1.5 mL microfuge tube on dry ice. The procedure was the same for cohort 3, with the exception that on the day of tissue collection the frozen 13.5 mm thick slab was first placed in the brain block and a 4.5 mm coronal slab containing the amygdala was cut and this slab was then processed as described for cohorts 1 and 2. The initial tissue punch targeted the region best corresponding to the central nucleus (Ce). The Ce was identified from the coronal plane as the most dorsal portions of the amygdalar gray matter that were both (i) medial and ventral to the white-matter of the anterior commissure (AC) and (ii) lateral to the medial temporal convexity that houses the amygdalar cortical nuclei and the entorhinal cortex on the surface of the brain. Once the Ce punch was collected, this was followed by two punches taken from the ventral amygdala nuclei, one lateral (containing primarily tissue from the lateral nucleus and portions of the basal nucleus) and one medial (containing tissue from the basal and accessory basal nuclei). The basal amygdala samples sequenced in this study were the medial punches containing tissue from the basal and accessory basal nuclei. These tissue punches were stored at -80 °C until shipment on dry ice to the Binder Laboratory in Munich, Germany for processing for snRNA-seq.
Nuclei Extraction
Nuclei were extracted from ~ 20 mg of frozen tissue as previously described [67]. In brief, tissue was dounce homogenized on ice in 1 mL of nucleus extraction buffer (10 mM Tris-HCl (pH 8.1), 0.1 mM EDTA, 0.32 M sucrose, 3 mM magnesium acetate, 5 mM CaCl2, 0.1% IGEPAL CA-630 and 40 U/mL RiboLock RNase-Inhibitor (Thermo Scientific)). Suspension was layered onto 1.8 mL of sucrose cushion (10 mM Tris-HCl (pH 8.1), 1.8 M sucrose and 3 mM magnesium acetate), followed by ultracentrifugation at 107,200g at 4 °C for 2.5 h (Thermo Scientific Sorvall WX+ ultracentrifuge). The supernatant was discarded using vacuum suction, and nuclei pellet was diluted in 30 μL of resuspension buffer (1× PBS, 3 mM magnesium acetate, 5 mM CaCl2, 1% bovine serum albumin and 40 U/mL RiboLock RNase-Inhibitor). Nuclei suspension was filtered through a preseparation filter (20 μm; Miltenyi Biotec), stained with DAPI (1:1,000) and quantified on a hemocytometer.
Library Preparation
snRNA-seq libraries were prepared according to the manufacturer’s instructions in the 10x Genomics user guide (Chromium Single Cell 3′ Reagents kit v3.1) with a targeted recovery of 10,000 nuclei per sample. Libraries (N=72) were pooled equimolarly into four pools, followed by treatment with Illumina Free Adapter Blocking Reagent and were sequenced on four lanes of a 25B flow cell on the NovaSeq X Plus System (Illumina).
Sequence Alignment, Filtering, Normalization and Clustering
Sequence reads were demultiplexed using the sample index and were aligned to the rhesus macaque genome (NCBI Macaca mulatta Annotation Release 103) and unique molecular identifiers were counted after demultiplexing of nuclei barcodes using cell ranger count (Cell Ranger v8.0.1; 10x Genomics) including the argument --include-introns. Ambient RNA was removed for each sample using SoupX v1.6.2 [68], followed by filtering of low quality cells based median absolute deviation (MAD) using scanpy v 1.10.2 [30]. Nuclei with MAD >= 4 in any of the following parameters (log1p_total_counts, log1p_n_genes_by_counts, pct_counts_in_top_20_genes) were excluded. Any nuclei with a mitochondrial gene expression > 2% was excluded, then an MAD cutoff of >= 3 was set. Doublets were detected using doubletdetection v4.2 [69] and scDblFinder v1.16.0 [70]. Nuclei identified as a doublet by any of the methods were classified as a doublet and removed. Genes expressed in less than 500 nuclei were removed. Data was normalized using scran [71], followed by selection of highly variable features and dimensionality reduction. Next, leiden clustering was performed and clusters were first annotated based on known marker genes for broad cell type classes: Astrocytes (AQP4, GFAP and GJA1), excitatory (glutamatergic) neurons (SLC17A7, SLC17A6 and SLIT3), inhibitory (GABAergic) neurons (GAD1, GAD2, SLC32A1), microglia (CX3CR1, C3 and P2RY12), oligodendrocytes (MBP, MOBP and PLP1), oligodendrocyte precursor cells (OLIG1, PDGFRA), committed oligodendrocyte precursor cells (GPR17, FYN, TNS3) [44], endothelial cells (CLDN5, FLT1, NOSTRIN), immune cells (SKAP1, PTPRC, RUNX1), fibroblasts/mural cells (DCN, LAMA2, ACTA2, MYH11) [45]. Fine-grained annotation of excitatory and inhibitory neuronal subtypes was then performed separately within each broad class. Differential expression analysis (Wilcoxon rank-sum test) was performed across clusters to identify candidate marker genes. Because many top-ranked genes were highly expressed but not uniquely enriched in a given cluster, expression was further visualized using scaled dot plots to prioritize genes with more cluster-specific expression patterns. Each cluster was named using three representative marker genes. Candidate labels were then cross-referenced against three snRNA-seq publications in rhesus macaque and/or across species in amygdala [40−42] in an attempt to converge on consensus nomenclature. Out of the originally 72 samples, one had to be excluded due to a clog during the 10x GEM generation, three other samples had to be excluded since more than 50% of the nuclei contributed to a single cluster. Four clusters (25,072 nuclei) were excluded since three or less individuals contributed more than 50% of nuclei to these clusters. One cluster (28,721 nuclei) was excluded due to high mt% with expression of both excitatory and inhibitory marker genes. These steps resulted in a final dataset of 745,497 nuclei from 68 subjects with 22,270 expressed genes.
Differential Gene Expression Analysis
For robust differential expression modeling, we excluded cell types with sparse counts and unstable voom mean-variance trends (immune cells, fibroblasts/mural cells, endothelial cells, and committed OPCs), as well as any cell type to which fewer than 60% of subjects contributed cells (Ex_FOXP2_RXFP1_KIAA1217, Ex_HTR1F_PDZRN4_KCNH5, Ex_NFIA_RPS6KA2_GALNT14, Ex_PROX1_LPAR1_MALRD1).
Then, we selected covariates for differential expression analysis as previously described [67]. In brief, we created a full pseudobulk count matrix by summing gene-wise counts across all cell types and applied a filter for genes with at least 10 counts in 90% of individuals. We used variance stabilizing transformation (vsd, DESeq2 v1.46.0 [72]) and performed principal component analysis (PCA; PCAtools v2.18.0 [73]). Nominally significant correlations with PCs were found for age, sex, baseline cortisol, freezing, and RIN. Canonical correlation analysis (CCA) identified library preparation batch (lib_prep_batch) and study (sex) as a covariate. NEC cortisol (residualized for time of day) was included as an additional covariate. To address hidden confounders, we first calculated the normfactors, then performed voom transformation and removed batch effects of all covariates using removeBatchEffect) [74], resulting in a batch-corrected expression matrix. Next, we performed PC analysis and included the first PC as an additional covariate, with the final model: (~ lib_prep_batch + Study + age+ baseline_cortisol + Freezing + NEC_Cort + RIN + PC1). Variance partitioning (variancePartition v1.36.3 [75]) was used to determine variance explained by each covariate. (RIN had been set to the median for one individual due to missing data).
Next, we conducted differential gene expression analysis using dreamlet v1.4.1 [76], employing a pseudobulk approach by summing gene-wise counts within the 21 cell types. Normalization was done with the processAssays function, filtering genes and nuclei with cutoffs: min.count=10, min.prop=0.6, min.cells=5, min.samples=41 Using the dreamlet function, we performed differential analysis with selected covariates. Lib_prep_batch and Study (Sex) were modeled as random effects. P-values were adjusted using the FDR method (Benjamini Hochberg [77]) across all tested genes across all cell types, and DE genes with an adjusted p-value <0.1 were considered for further analysis.
Pathway Enrichment Analyses
To identify biological processes associated with age-differentially expressed (DE) genes, we performed gene set enrichment analysis (GSEA) using clusterProfiler v. 4.10.0 [78]. GSEA, which leverages the full ranked gene list, genes were ranked by the signed t-statistic derived from the dreamlet differential expression analysis. GSEA was performed across all cell types using clusterProfiler with default parameters for minimum and maximum gene set sizes and using the Macaca mulatta annotation database. GO terms were considered statistically significant at an FDR-adjusted p-value < 0.05.
Overlap of Developmentally-Regulated Genes with GWAS-Based Genomic SEM Factors
We tested whether the 158 genes differentially expressed with age in at least one cell type (adj. p-value < 0.1) significantly overlapped with genetic risk loci identified by the genomic SEM factors from Grotzinger et al. [60], a transdiagnostic structural model of psychopathology derived from GWAS summary statistics across multiple psychiatric disorders. For each genomic SEM factor, we used FUMA [79] to map genome-wide significant GWAS SNPs (p < 5×10⁻⁸) to genes; in a secondary analysis, we relaxed this threshold to p < 1×10⁻⁵ to capture a broader set of suggestively associated loci. We then assessed whether the resulting factor-specific gene sets significantly overlapped with our list of 158 age-differentially expressed genes. To evaluate the significance of each observed overlap, we generated 1,000 random subsets of 158 genes drawn from the full set of genes tested for differential expression with age, and counted the proportion of subsets in which the overlap with the factor’s gene set was as large as, or larger than, that observed. This proportion was used as an empirical p-value.
Supplementary Materials
The following supporting information can be downloaded at the website of this paper posted on Preprints.org.
Funding
This work was supported by National Institutes of Health (NIH) grants to Kalin NH (R01-MH081884, R01-MH046729), as well as NIH grants to the Wisconsin National Primate Research Center (P51-OD011106 and P51-RR000167).
Conflicts of Interest
Kalin NH serves as a consultant to the Board of Scientific Advisors, Pritzker Neuropsychiatric Disorders Consortium; Corcept Therapeutics Incorporated; Sero Mental Health Scientific Advisory Board; EMA Wellness, LLC Scientific Advisory Board and Invisalert Solutions, Inc. Scientific Advisory Board. He is the current Editor-in-Chief of the American Journal of Psychiatry. All other authors declare no conflict of interest.
References
- LeDoux, J. The amygdala. Curr. Biol. 2007, 17, R868–874. [Google Scholar] [CrossRef] [PubMed]
- Cao, L.; et al. Common alterations of whole and subregion-specific amygdala intrinsic functional connectivity across psychiatric disorders: a meta-analysis. Mol. Psychiatry 2026, 31, 2916–2926. [Google Scholar] [PubMed]
- Hinojosa, C.A.; et al. Resting-State Functional Connectivity of the Amygdala and Hippocampus in PTSD: Results From the PGC-ENIGMA PTSD Working Group. Am. J. Psychiatry 2026, 183, 333–342. [Google Scholar] [CrossRef] [PubMed]
- Thomas, E.; et al. Amygdala connectivity is associated with withdrawn/depressed behavior in a large sample of children from the Adolescent Brain Cognitive Development (ABCD) Study(R). Psychiatry Res. Neuroimaging 2024, 344, 111877. [Google Scholar] [CrossRef] [PubMed]
- Zugman, A.; Jett, L.; Antonacci, C.; Winkler, A.M.; Pine, D.S. A systematic review and meta-analysis of resting-state fMRI in anxiety disorders: Need for data sharing to move the field forward. J. Anxiety Disord. 2023, 99, 102773. [Google Scholar] [CrossRef] [PubMed]
- Lu, L.; et al. Altered amygdala resting-state functional connectivity in anxiety disorders: a coordinate-based meta-analysis. Psychol. Med. 2026, 56, e161. [Google Scholar] [CrossRef] [PubMed]
- Dima, D.; et al. Subcortical volumes across the lifespan: Data from 18,605 healthy individuals aged 3-90 years. Hum. Brain Mapp. 2022, 43, 452–469. [Google Scholar] [PubMed]
- Scherf, K.S.; Smyth, J.M.; Delgado, M.R. The amygdala: an agent of change in adolescent neural networks. Horm. Behav. 2013, 64, 298–313. [Google Scholar] [CrossRef] [PubMed]
- Hare, T.A.; et al. Biological substrates of emotional reactivity and regulation in adolescence during an emotional go-nogo task. Biol. Psychiatry 2008, 63, 927–934. [Google Scholar] [CrossRef] [PubMed]
- Gabard-Durnam, L.J.; et al. The development of human amygdala functional connectivity at rest from 4 to 23 years: a cross-sectional study. Neuroimage 2014, 95, 193–207. [Google Scholar] [CrossRef] [PubMed]
- Gee, D.G.; et al. A developmental shift from positive to negative connectivity in human amygdala-prefrontal circuitry. J. Neurosci. 2013, 33, 4584–4593. [Google Scholar] [CrossRef] [PubMed]
- Kessler, R.C.; et al. Lifetime prevalence and age-of-onset distributions of DSM-IV disorders in the National Comorbidity Survey Replication. Arch. Gen. Psychiatry 2005, 62, 593–602. [Google Scholar] [CrossRef] [PubMed]
- McDonald, A.J. Functional neuroanatomy of the basolateral amygdala: Neurons, neurotransmitters, and circuits. In Handbook of Behavioral Neuroscience; Urban, J.H., Rosenkranz, J.A., Eds.; Elsevier: San Diego, CA, 2020; pp. 1–38. [Google Scholar]
- McDonald, A.J. Functional neuroanatomy of the basolateral amygdala: Neurons, neurotransmitters, and circuits. Handb. Behav. Neurosci. 2020, 26, 1–38. [Google Scholar] [CrossRef] [PubMed]
- Selleck, R.A.; Zhang, W.; Mercier, H.D.; Padival, M.; Rosenkranz, J.A. Limited prefrontal cortical regulation over the basolateral amygdala in adolescent rats. Sci. Rep. 2018, 8, 17171. [Google Scholar] [CrossRef] [PubMed]
- Cody, C.R.; et al. Interactive effects of early life adversity and adolescent basolateral amygdala activity on corticolimbic connectivity and behavior. Neurobiol. Stress 2025, 38, 100753. [Google Scholar] [CrossRef] [PubMed]
- Spampanato, J.; Polepalli, J.; Sah, P. Interneurons in the basolateral amygdala. Neuropharmacology 2011, 60, 765–773. [Google Scholar] [CrossRef] [PubMed]
- McDonald, A.J. Cell types and intrinsic connections of the amygdala. In The Amygdala: Neurobiological Aspects of Emotion, Memory, and Mental Dysfunction; Aggleton, J.P., Ed.; Wiley-Liss: New York, NY, 1992; pp. 67–96. [Google Scholar]
- McDonald, A.J.; Augustine, J.R. Localization of GABA-like immunoreactivity in the monkey amygdala. Neuroscience 1993, 52, 281–294. [Google Scholar] [CrossRef] [PubMed]
- Davis, M.; Whalen, P.J. The amygdala: vigilance and emotion. Mol. Psychiatry 2001, 6, 13–34. [Google Scholar] [PubMed]
- Duvarci, S.; Pare, D. Amygdala microcircuits controlling learned fear. Neuron 2014, 82, 966–980. [Google Scholar] [CrossRef] [PubMed]
- Janak, P.H.; Tye, K.M. From circuits to behaviour in the amygdala. Nature 2015, 517, 284–292. [Google Scholar] [CrossRef] [PubMed]
- Wang, J.; Barbas, H. Specificity of primate amygdalar pathways to hippocampus. J. Neurosci. 2018, 38, 10019–10041. [Google Scholar] [CrossRef] [PubMed]
- Ehrlich, I.; et al. Amygdala inhibitory circuits and the control of fear memory. Neuron 2009, 62, 757–771. [Google Scholar] [CrossRef] [PubMed]
- Felix-Ortiz, A.C.; et al. BLA to vHPC inputs modulate anxiety-related behaviors. Neuron 2013, 79, 658–664. [Google Scholar] [CrossRef] [PubMed]
- Tye, K.M.; et al. Amygdala circuitry mediating reversible and bidirectional control of anxiety. Nature 2011, 471, 358–362. [Google Scholar] [CrossRef] [PubMed]
- Babaev, O.; Piletti Chatain, C.; Krueger-Burg, D. Inhibition in the amygdala anxiety circuitry. Exp. Mol. Med. 2018, 50, 18. [Google Scholar] [CrossRef] [PubMed]
- Krabbe, S.; Grundemann, J.; Luthi, A. Amygdala inhibitory circuits regulate associative fear conditioning. Biol. Psychiatry 2018, 83, 800–809. [Google Scholar] [CrossRef] [PubMed]
- Polepalli, J.S.; Gooch, H.; Sah, P. Diversity of interneurons in the lateral and basal amygdala. npj Sci. Learn 2020, 5, 10. [Google Scholar] [CrossRef] [PubMed]
- Wolf, F.A.; Angerer, P.; Theis, F.J. SCANPY: large-scale single-cell gene expression data analysis. Genome Biol. 2018, 19, 15. [Google Scholar] [CrossRef] [PubMed]
- Hajos, N. Interneuron Types and Their Circuits in the Basolateral Amygdala. Front Neural Circuits 2021, 15, 687257. [Google Scholar] [CrossRef] [PubMed]
- Zikopoulos, B.; John, Y.J.; Garcia-Cabezas, M.A.; Bunce, J.G.; Barbas, H. The intercalated nuclear complex of the primate amygdala. Neuroscience 2016, 330, 267–290. [Google Scholar] [CrossRef] [PubMed]
- Pare, D.; Quirk, G.J.; Ledoux, J.E. New vistas on amygdala networks in conditioned fear. J. Neurophysiol. 2004, 92, 1–9. [Google Scholar] [CrossRef] [PubMed]
- Wolff, S.B.; et al. Amygdala interneuron subtypes control fear learning through disinhibition. Nature 2014, 509, 453–458. [Google Scholar] [CrossRef] [PubMed]
- Rhomberg, T.; et al. Vasoactive intestinal polypeptide-immunoreactive interneurons within circuits of the mouse basolateral amygdala. J. Neurosci. 2018, 38, 6983–7003. [Google Scholar] [CrossRef] [PubMed]
- Kasugai, Y.; et al. Structural and Functional Remodeling of Amygdala GABAergic Synapses in Associative Fear Learning. Neuron 2019, 104, 781–794 e784. [Google Scholar] [CrossRef] [PubMed]
- Hagihara, K.M.; et al. Intercalated amygdala clusters orchestrate a switch in fear state. In Nature; 2021. [Google Scholar]
- Roseboom, P.H.; et al. Evidence in primates supporting the use of chemogenetics for the treatment of human refractory neuropsychiatric disorders. Mol. Ther. 2021, 29, 3484–3497. [Google Scholar] [CrossRef] [PubMed]
- Mueller, S.A.L.; et al. DREADD-mediated amygdala activation is sufficient to induce anxiety-like responses in young nonhuman primates. Curr. Res. Neurobiol. 2023, 5, 100111. [Google Scholar] [CrossRef] [PubMed]
- Yu, B.; et al. Molecular and cellular evolution of the amygdala across species analyzed by single-nucleus transcriptome profiling. Cell Discov. 2023, 9, 19. [Google Scholar] [CrossRef] [PubMed]
- Kamboj, S.; et al. Translational Insights From Cell Type Variation Across Amygdala Subnuclei in Rhesus Monkeys and Humans. Am. J. Psychiatry 2024, 181, 1086–1102. [Google Scholar] [CrossRef] [PubMed]
- Totty, M.S.; et al. Transcriptomic diversity of amygdalar subdivisions across humans and nonhuman primates. Sci. Adv. 2025, 11, eadw1029. [Google Scholar] [CrossRef] [PubMed]
- Darmanis, S.; et al. A survey of human brain transcriptome diversity at the single cell level. Proc. Natl. Acad. Sci. U S A 2015, 112, 7285–7290. [Google Scholar] [CrossRef] [PubMed]
- Marques, S.; et al. Oligodendrocyte heterogeneity in the mouse juvenile and adult central nervous system. Science 2016, 352, 1326–1329. [Google Scholar] [CrossRef] [PubMed]
- Kearns, N.A.; et al. Dissecting the human leptomeninges at single-cell resolution. Nat. Commun. 2023, 14, 7036. [Google Scholar] [CrossRef] [PubMed]
- Totty, M.S.; et al. Transcriptomic diversity of amygdalar subdivisions across humans and nonhuman primates. bioRxiv. 2024.
- Totty, M.S.; et al. Transcriptomic diversity of amygdalar subdivisions across humans and nonhuman primates. bioRxiv 2024, 2024.2010.2018.618721. [Google Scholar]
- Krienen, F.M.; et al. Innovations present in the primate interneuron repertoire. Nature 2020, 586, 262–269. [Google Scholar] [CrossRef] [PubMed]
- Lee, R.S.; et al. Chronic corticosterone exposure increases expression and decreases deoxyribonucleic acid methylation of Fkbp5 in mice. Endocrinology 2010, 151, 4332–4343. [Google Scholar] [CrossRef] [PubMed]
- Shiraki, H.; Segi-Nishida, E.; Suzuki, K. Effect of chronic corticosterone administration on acute stress-mediated gene expression in the cortex and hippocampus of male mice. Biochem Biophys. Res. Commun. 2025, 762, 151729. [Google Scholar] [CrossRef] [PubMed]
- Kalin, N.H.; Shelton, S.E. Defensive behaviors in infant rhesus monkeys: environmental cues and neurochemical regulation. Science 1989, 243, 1718–1721. [Google Scholar] [CrossRef] [PubMed]
- Colakoglu, G.; Bergstrom-Tyrberg, U.; Berglund, E.O.; Ranscht, B. Contactin-1 regulates myelination and nodal/paranodal domain organization in the central nervous system. Proc. Natl. Acad. Sci. U S A 2014, 111, E394-403. [Google Scholar] [CrossRef] [PubMed]
- Kato, Y.; et al. Phospholipase D and phosphatidylinositol-4-phosphate 5-kinase 1 are involved in the regulation of oligodendrocyte morphological differentiation. Exp. Cell Res. 2021, 405, 112654. [Google Scholar] [CrossRef] [PubMed]
- Murai, K.K.; Pasquale, E.B. Eph receptors and ephrins in neuron-astrocyte communication at synapses. Glia 2011, 59, 1567–1578. [Google Scholar] [CrossRef] [PubMed]
- Shen, Y.; et al. Postnatal activation of TLR4 in astrocytes promotes excitatory synaptogenesis in hippocampal neurons. J. Cell Biol. 2016, 215, 719–734. [Google Scholar] [CrossRef] [PubMed]
- Chin, E.W.; et al. The epigenetic reader PHF21B modulates murine social memory and synaptic plasticity-related genes. JCI Insight 2022, 7. [Google Scholar] [CrossRef] [PubMed]
- Yale, A.R.; et al. Regulation of neural stem cell differentiation and brain development by MGAT5-mediated N-glycosylation. Stem Cell Rep. 2023, 18, 1340–1354. [Google Scholar] [CrossRef]
- Mohamed, Z.A.; Li, J.; Wen, J.; Jia, F.; Banerjee, S. The KCNB2 gene and its role in neurodevelopmental disorders: Implications for genetics and therapeutic advances. Clin. Chim. Acta 2025, 566, 120056. [Google Scholar] [CrossRef] [PubMed]
- Caglayan, E.; Liu, Y.; Konopka, G. Neuronal ambient RNA contamination causes misinterpreted and masked cell types in brain single-nuclei datasets. Neuron 2022, 110, 4043–4056 e4045. [Google Scholar] [CrossRef] [PubMed]
- Grotzinger, A.D.; et al. Transcriptome-Wide Structural Equation Modeling of 13 Major Psychiatric Disorders for Cross-Disorder Risk and Drug Repurposing. JAMA Psychiatry 2023, 80, 811–821. [Google Scholar] [CrossRef] [PubMed]
- Yang, H.; et al. A lifespan transcriptomic atlas of the human prefrontal cortex at single-cell resolution. medRxiv, 2024.2011.2006.24316592 2025. [Google Scholar] [CrossRef]
- Dai, J.; et al. Agonal Factors Distort Gene-Expression Patterns in Human Postmortem Brains. Front Neurosci. 2021, 15, 614142. [Google Scholar] [CrossRef] [PubMed]
- Miyahara, K.; et al. The influence of tissue pH and RNA integrity number on gene expression of human postmortem brain. Front Psychiatry 2023, 14, 1156524. [Google Scholar] [CrossRef] [PubMed]
- Fox, A.S.; Shelton, S.E.; Oakes, T.R.; Davidson, R.J.; Kalin, N.H. Trait-like brain activity during adolescence predicts anxious temperament in primates. PLoS ONE 2008, 3, e2570. [Google Scholar] [CrossRef] [PubMed]
- Fox, A.S.; et al. Intergenerational neural mediators of early-life anxious temperament. Proc. Natl. Acad. Sci. U. S. A. 2015, 112, 9118–9122. [Google Scholar] [CrossRef] [PubMed]
- Fox, A.S.; et al. Central amygdala nucleus (Ce) gene expression linked to increased trait-like Ce metabolism and anxious temperament in young primates. Proc. Natl. Acad. Sci. U. S. A. 2012, 109, 18108–18113. [Google Scholar] [CrossRef] [PubMed]
- Frohlich, A.S.; et al. Single-nucleus transcriptomic profiling of human orbitofrontal cortex reveals convergent effects of aging and psychiatric disease. Nat. Neurosci. 2024. [Google Scholar] [CrossRef] [PubMed]
- Young, M.D.; Behjati, S. SoupX removes ambient RNA contamination from droplet-based single-cell RNA sequencing data. Gigascience 2020, 9. [Google Scholar] [CrossRef] [PubMed]
- Gayoso, A.; Shor, J. JonathanShor/DoubletDetection: doubletdetection v4.2. 2022. [Google Scholar] [PubMed]
- Germain, P.L.; Lun, A.; Garcia Meixide, C.; Macnair, W.; Robinson, M.D. Doublet identification in single-cell sequencing data using scDblFinder. F1000Res 2021, 10, 979. [Google Scholar] [CrossRef] [PubMed]
- Lun, A.T.; McCarthy, D.J.; Marioni, J.C. A step-by-step workflow for low-level analysis of single-cell RNA-seq data with Bioconductor. F1000Res 2016, 5, 2122. [Google Scholar] [CrossRef] [PubMed]
- Love, M.I.; Huber, W.; Anders, S. Moderated estimation of fold change and dispersion for RNA-seq data with DESeq2. Genome Biol. 2014, 15, 550. [Google Scholar] [CrossRef] [PubMed]
- Blighe, K.; Andrews, J.; A, L. PCAtools: Everything Principal Components Analysis. R package version 2.18.0. 2023. [Google Scholar]
- Ritchie, M.E.; et al. Limma powers differential expression analyses for RNA-sequencing and microarray studies. Nucleic Acids Res. 2015, 43, e47. [Google Scholar] [CrossRef] [PubMed]
- Hoffman, G.E.; Schadt, E.E. variancePartition: interpreting drivers of variation in complex gene expression studies. BMC Bioinform. 2016, 17, 483. [Google Scholar] [CrossRef]
- Hoffman, G.E.; et al. Efficient differential expression analysis of large-scale single cell transcriptomics data using dreamlet. bioRxiv 2023. [Google Scholar] [CrossRef] [PubMed]
- Benjamini, Y.; Hochberg, Y. Controlling The False Discovery Rate - A Practical And Powerful Approach To Multiple Testing. J. R. Stat. Soc. Ser. B 1995, 57, 289–300. [Google Scholar] [CrossRef]
- Wu, T.; et al. clusterProfiler 4.0: A universal enrichment tool for interpreting omics data. Innovation (Camb) 2021, 2, 100141. [Google Scholar] [CrossRef] [PubMed]
- Watanabe, K.; Taskesen, E.; van Bochoven, A.; Posthuma, D. Functional mapping and annotation of genetic associations with FUMA. Nat. Commun. 2017, 8, 1826. [Google Scholar] [CrossRef] [PubMed]
Figure 1.
Identification of cell types. a, Uniform manifold approximation and projection (UMAP) of ~745,000 nuclei from the basal amygdala of 68 rhesus macaques, colored by cell-type cluster. b, Bar plot depicting the number of nuclei per cell-type cluster. c, Dot plot showing expression of representative marker genes grouped by cell type. Dot size indicates the percentage of nuclei expressing the gene; color indicates mean expression level, scaled per gene (0–1) for comparability across markers.
Figure 1.
Identification of cell types. a, Uniform manifold approximation and projection (UMAP) of ~745,000 nuclei from the basal amygdala of 68 rhesus macaques, colored by cell-type cluster. b, Bar plot depicting the number of nuclei per cell-type cluster. c, Dot plot showing expression of representative marker genes grouped by cell type. Dot size indicates the percentage of nuclei expressing the gene; color indicates mean expression level, scaled per gene (0–1) for comparability across markers.
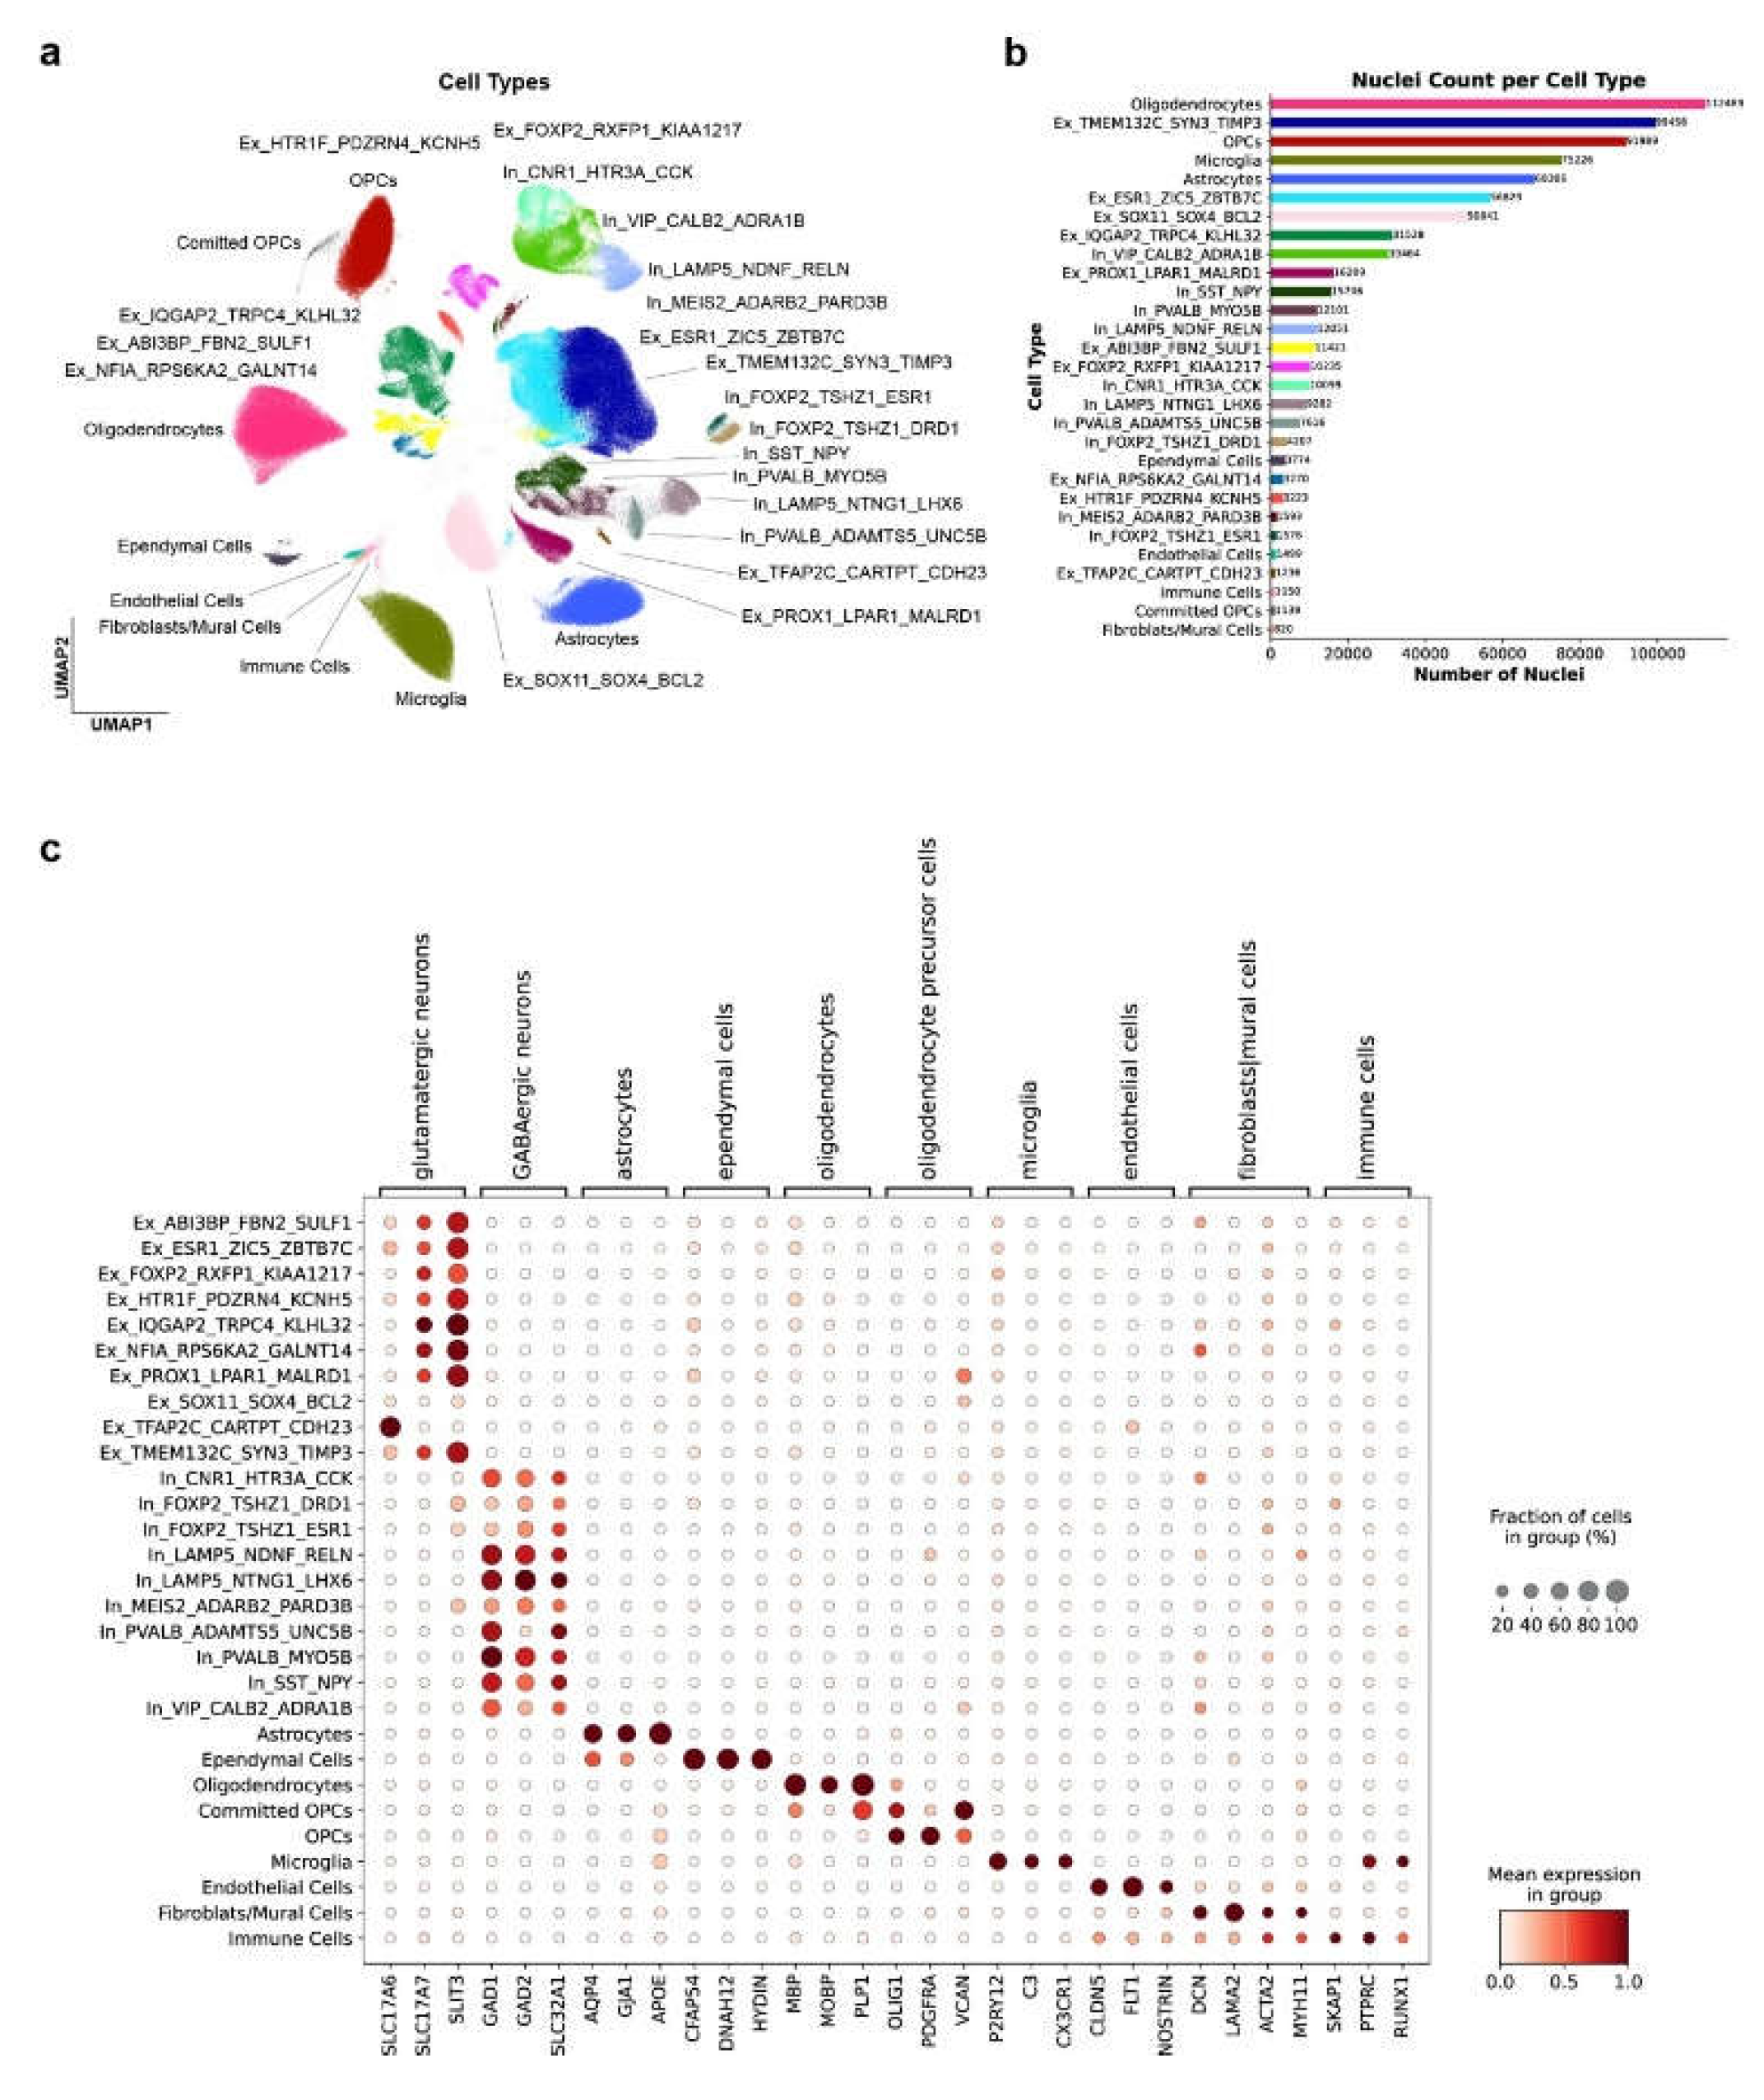
Figure 2.
Cell-type marker genes. a-c, Dot plots showing expression of representative marker genes for inhibitory neuron subtypes (a), ganglionic eminence marker genes reflecting developmental origin (b), and excitatory neuron subtypes (c). Dot size indicates the percentage of nuclei expressing the gene; color indicates mean expression level, scaled per gene (0–1) for comparability across markers.
Figure 2.
Cell-type marker genes. a-c, Dot plots showing expression of representative marker genes for inhibitory neuron subtypes (a), ganglionic eminence marker genes reflecting developmental origin (b), and excitatory neuron subtypes (c). Dot size indicates the percentage of nuclei expressing the gene; color indicates mean expression level, scaled per gene (0–1) for comparability across markers.
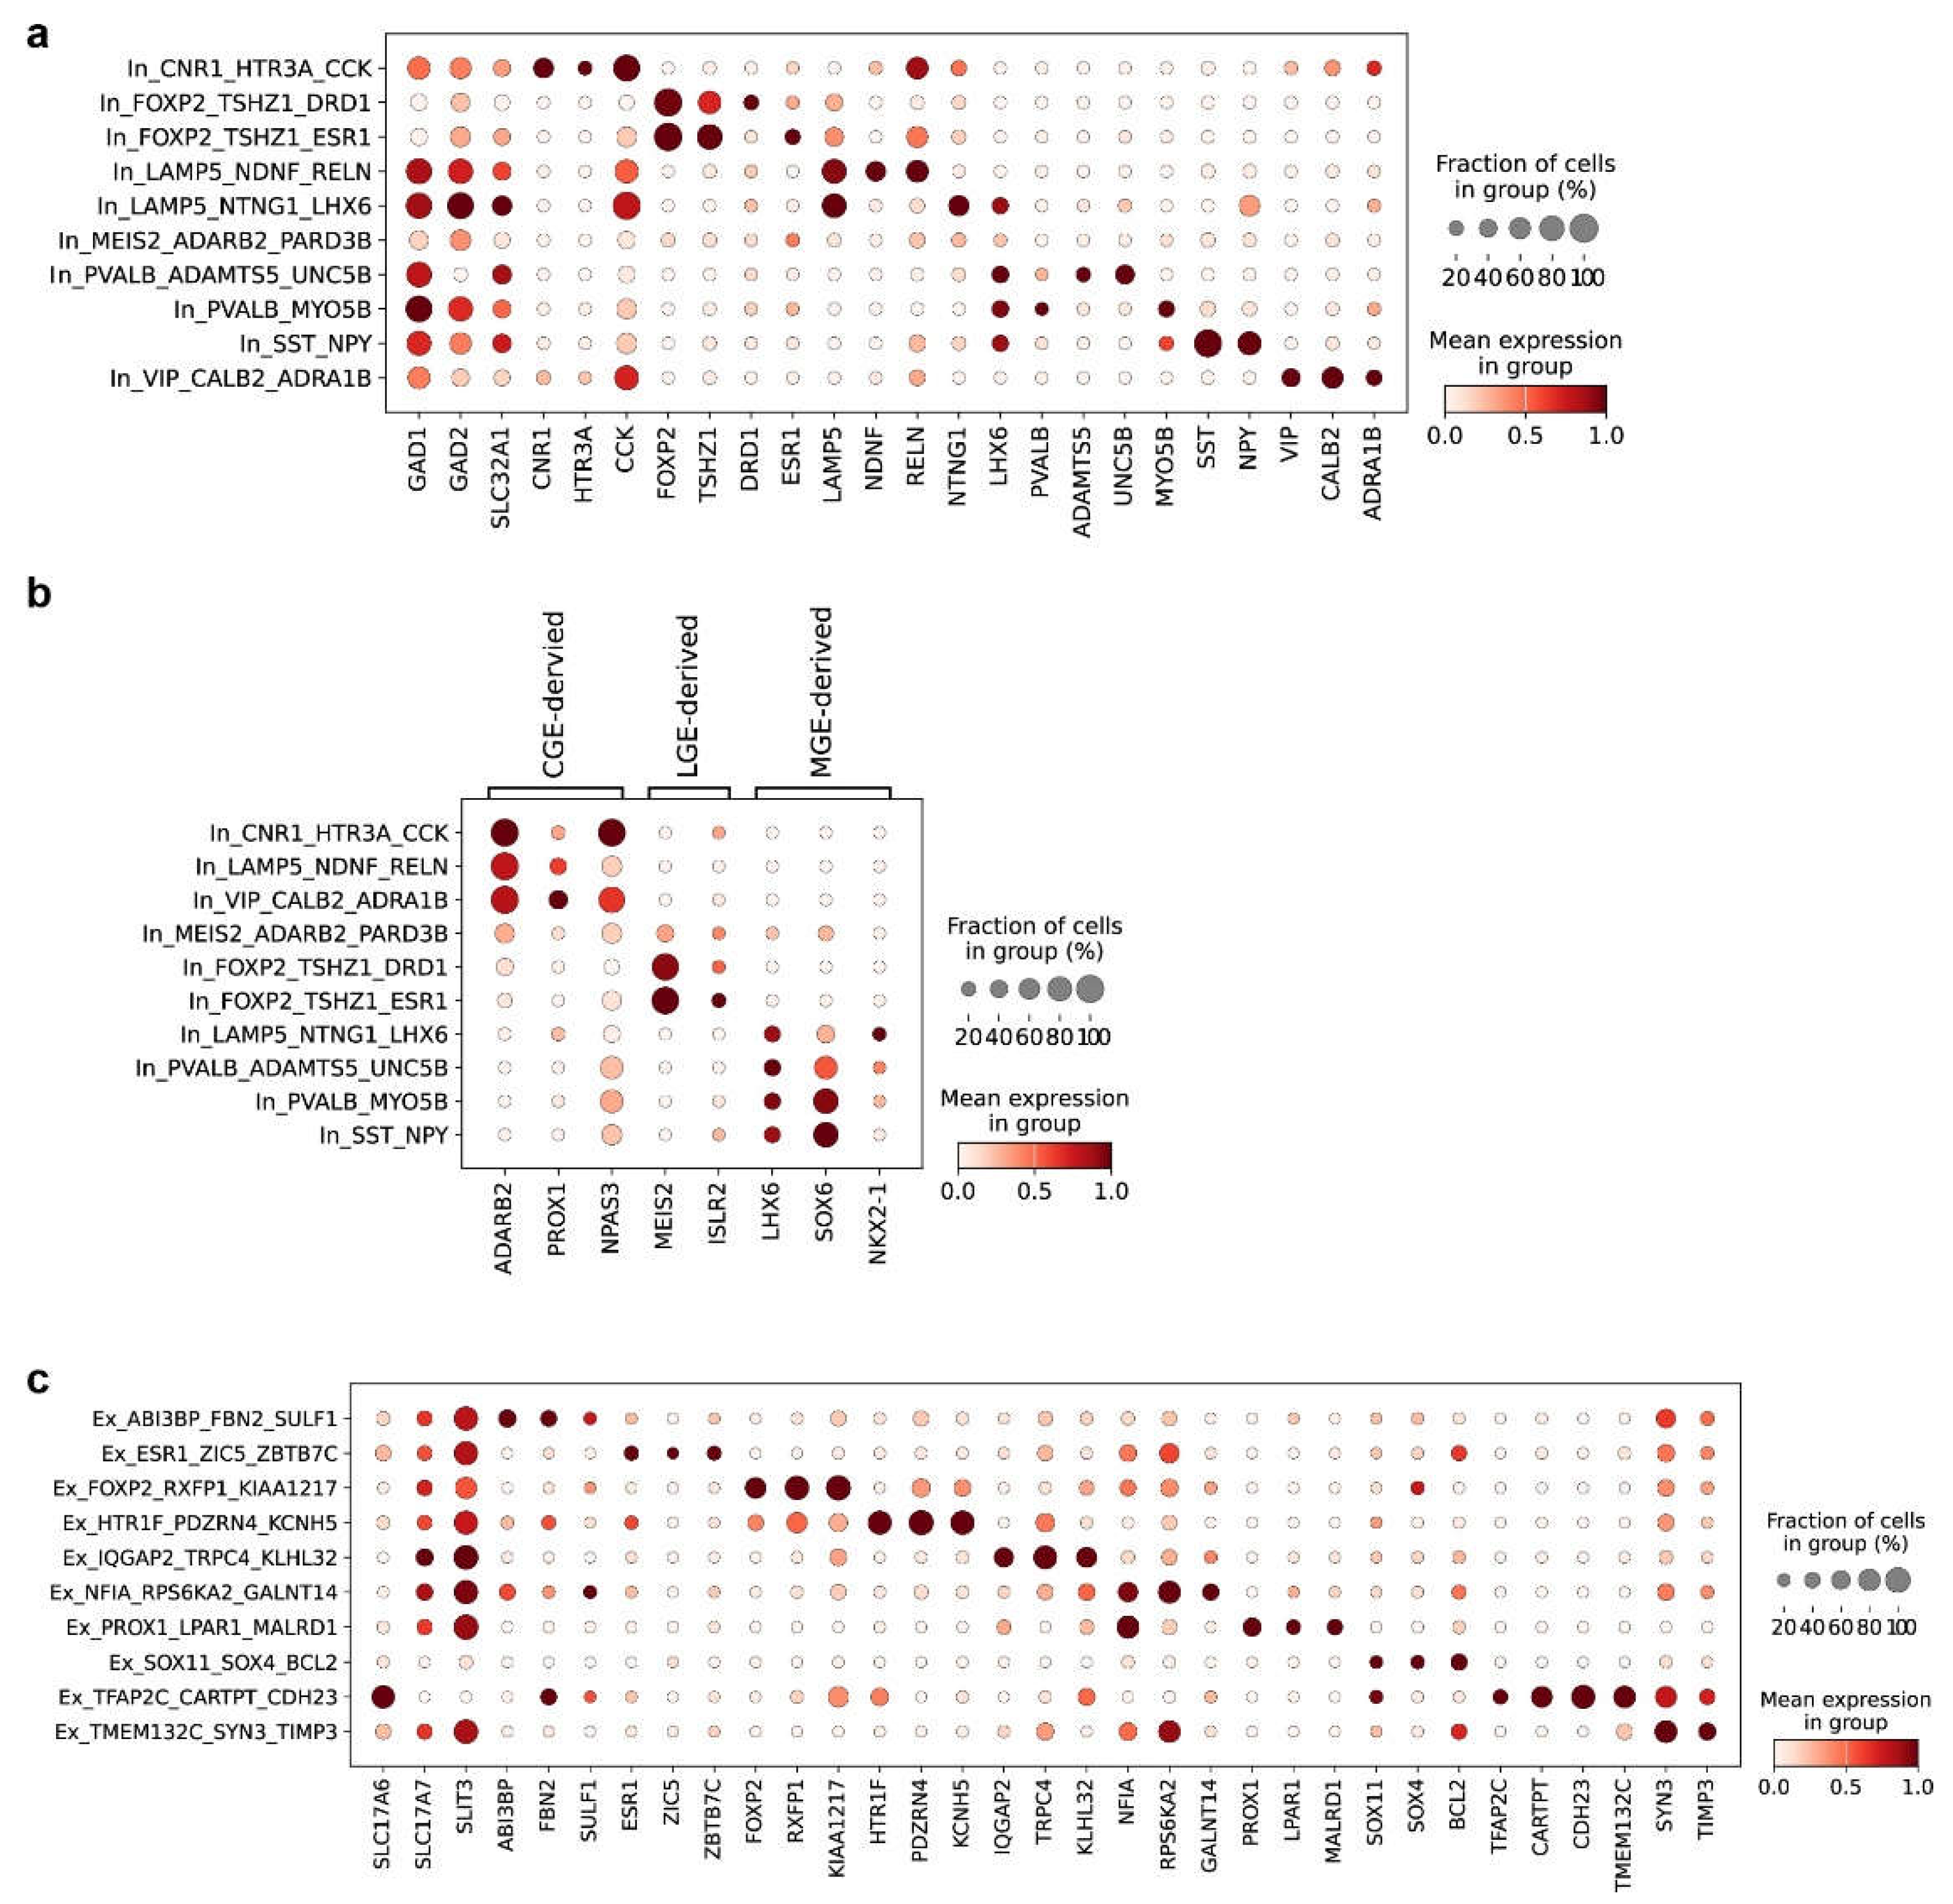
Figure 3.
Baseline cortisol and associated gene expression across cell types. a, Box plot of baseline cortisol concentration by cohort; depicted P-value from a Kruskal-Wallis test. b, Number of significantly cortisol-associated genes per cell type (Benjamini-Hochberg adjusted P < 0.1). c, Scatter plots of normalized FKBP5 expression versus baseline cortisol for cell types with a significant association. d, Scatter plots of normalized ZBTB16 expression versus baseline cortisol for cell types with a significant association. e, UMAP showing scran-normalized expression of NR3C1 (top) and NR3C2 (bottom). f, Dot plot showing scran-normalized expression of NR3C1 and NR3C2 across cell types included in the differential expression analysis, shown without per-gene scaling to allow direct comparison of absolute expression levels between the two genes. Dot size indicates the percentage of nuclei expressing the gene; color indicates mean expression level.
Figure 3.
Baseline cortisol and associated gene expression across cell types. a, Box plot of baseline cortisol concentration by cohort; depicted P-value from a Kruskal-Wallis test. b, Number of significantly cortisol-associated genes per cell type (Benjamini-Hochberg adjusted P < 0.1). c, Scatter plots of normalized FKBP5 expression versus baseline cortisol for cell types with a significant association. d, Scatter plots of normalized ZBTB16 expression versus baseline cortisol for cell types with a significant association. e, UMAP showing scran-normalized expression of NR3C1 (top) and NR3C2 (bottom). f, Dot plot showing scran-normalized expression of NR3C1 and NR3C2 across cell types included in the differential expression analysis, shown without per-gene scaling to allow direct comparison of absolute expression levels between the two genes. Dot size indicates the percentage of nuclei expressing the gene; color indicates mean expression level.
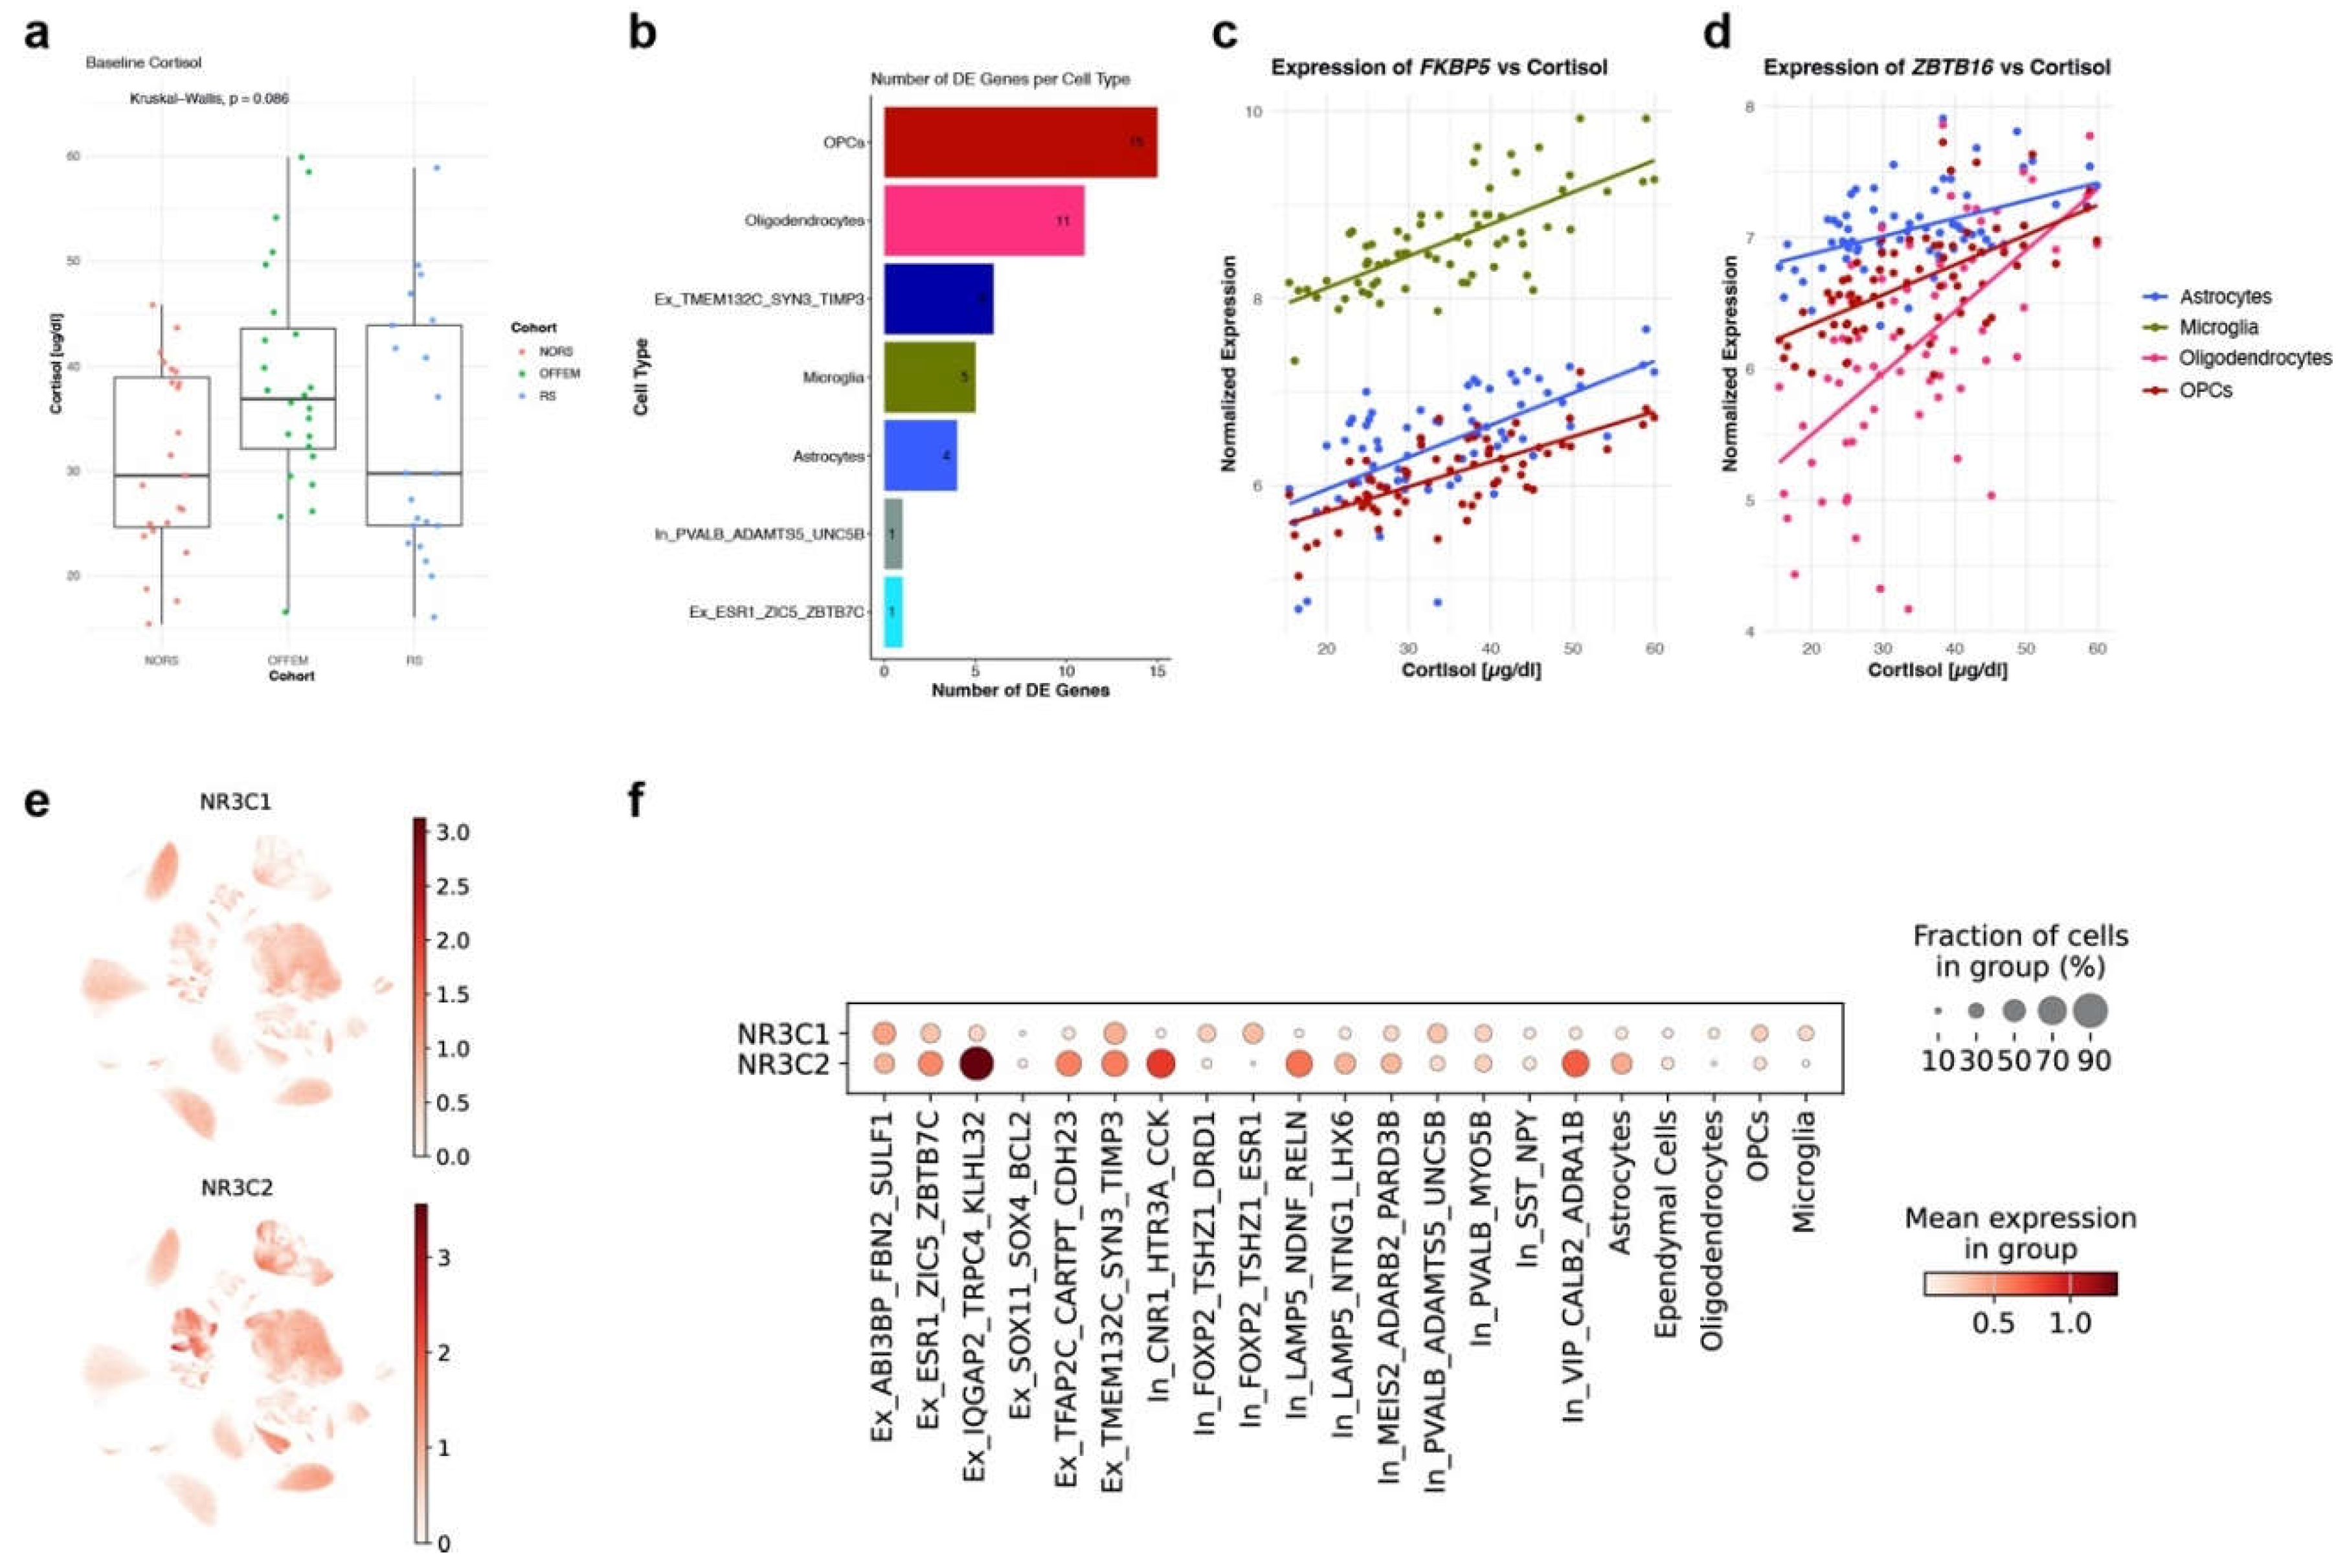
Figure 4.
Age-associated gene expression changes in the basal amygdala. a, Box plot showing age distribution by cohort. b, Bar plot showing the number of age-associated differentially expressed (DE) genes per cell type. c, Bar plot showing the direction of regulation of age-associated DE genes (percentage up- and downregulated). d–j, Scatter plots showing normalized expression (y-axis) versus age (x-axis) for representative age-regulated genes in the indicated cell type (labeled on each plot); individual dots are colored by cohort.
Figure 4.
Age-associated gene expression changes in the basal amygdala. a, Box plot showing age distribution by cohort. b, Bar plot showing the number of age-associated differentially expressed (DE) genes per cell type. c, Bar plot showing the direction of regulation of age-associated DE genes (percentage up- and downregulated). d–j, Scatter plots showing normalized expression (y-axis) versus age (x-axis) for representative age-regulated genes in the indicated cell type (labeled on each plot); individual dots are colored by cohort.
Disclaimer/Publisher’s Note: The statements, opinions and data contained in all publications are solely those of the individual author(s) and contributor(s) and not of MDPI and/or the editor(s). MDPI and/or the editor(s) disclaim responsibility for any injury to people or property resulting from any ideas, methods, instructions or products referred to in the content. |
© 2026 by the authors. Licensee MDPI, Basel, Switzerland. This article is an open access article distributed under the terms and conditions of the Creative Commons Attribution (CC BY) license (http://creativecommons.org/licenses/by/4.0/).
Copyright: This open access article is published under a Creative Commons CC BY 4.0 license, which permit the free download, distribution, and reuse, provided that the author and preprint are cited in any reuse.


