

Submitted:
04 July 2026
Posted:
06 July 2026
You are already at the latest version
Abstract
Underground Gas Storage (UGS) facilities serve to balance natural gas networks within a given area. The nature of natural gas network balancing is twofold: long-term (seasonal) during periods of significant gas withdrawal (the cold half-year) and short-term (daily) during periods of peak natural gas demand throughout the day. The first type of balancing has been a standard characteristic for many years, covering increased demand during the winter season. In contrast, the importance of daily balancing is growing alongside the ongoing energy transition, where natural gas-based power generation sources flexibly replace renewable energy sources that are dependent on the time of day or weather conditions. The necessity for increased balancing of energy systems makes them more sensitive to crisis situations. This article presents the key role of UGS as a fundamental resilience factor for European energy systems, particularly in the face of energy crises triggered by geopolitical instability. Conflicts are redefining the role of UGS as a pillar of energy security. This study analyzes how strategic gas reserves mitigate the effects of sudden supply disruptions and price shocks caused by geopolitical factors. It describes impact scenarios of two conflicts: Russia’s invasion on Ukraine and the conflict in the Persian Gulf leading to the closure of the Strait of Hormuz. While UGS is essential for the short-term management of natural gas supply flows, its long-term value lies in providing a “strategic buffer” that allows energy systems to adapt to unforeseen geopolitical conflicts. Integrated storage management is indispensable for maintaining the operational integrity of the European transmission and energy system during periods of heightened instability. The paper also identifies necessary directions for the development of UGS systems.
Keywords:
UGS
; underground gas storage
; energy storage
; energy security
; geopolitical instability
1. Introduction
One of the key factors ensuring the stable development of states and societies is secure access to energy carriers. In the gas sector, energy security is no longer understood solely as the ability to maintain uninterrupted supplies under normal market conditions, but also as the resilience of the entire gas system to geopolitical crises, disruptions of import routes, extreme weather events, market volatility and infrastructure failures.
Energy security in the gas sector has been defined both at the national level, by individual states, and at the European Union level. In general terms, it may be understood as the ability of the gas system to ensure continuous, reliable and economically acceptable supplies of gaseous fuels to final consumers, while maintaining the capacity to respond effectively to disruptions in supply, demand peaks and emergency situations.
Energy security can be considered in several time dimensions, including:
- – short-term security, also referred to as operational security, related to the current balancing of the gas system and the ability to respond to sudden disturbances,
- – seasonal security, associated mainly with covering increased gas demand during the heating season,
- – medium-term security, concerning supply contracts, infrastructure availability and system development over the next few years,
- – long-term security, also referred to as strategic security, connected with diversification of energy sources, decarbonization policy, investment planning and the transformation of the energy system.
The actions of public authorities and gas system operators should therefore aim to ensure not only short-term and seasonal security, but also medium, and long term resilience of the gas sector. A positive assessment of energy security requires that the state has access to diversified sources of gas, adequate transmission capacity, sufficient storage capacity, effective emergency procedures and the ability to cooperate with neighbouring systems.
In 2009, the Russia - Ukraine gas crisis occurred, affecting several countries in Central and Southern Europe. Its consequences, particularly restrictions on gas supplies from the east, were felt most severely in Slovakia, but also had a significant impact on Hungary, Poland and the Czech Republic [1,2]. The crisis contributed to increased interest in infrastructure investments in the natural gas sector, including the expansion of underground gas storage (UGS) capacity. For instance, between 2009 and 2014, UGS capacity increased by 67% in Hungary and by 77% in Poland [3].
Since 2010, the conditions shaping gas security in Europe have changed significantly. The most important turning point was the energy crisis following Russia’s full-scale invasion of Ukraine in 2022, which demonstrated the risks associated with excessive dependence on a single supplier and accelerated the diversification of gas supply routes in the European Union. In response, the EU strengthened its security-of-supply framework, including obligations related to the filling of underground gas storage facilities before the winter season.
Further geopolitical instability, including the war in Iran in February 2026, confirmed that events outside Europe can also directly affect European gas security. Disruptions around the Strait of Hormuz, a key route for global LNG exports, showed that diversification away from Russian pipeline gas does not eliminate supply risk, but changes its nature. Europe’s growing dependence on LNG makes the gas market more exposed to maritime chokepoints, shipping constraints, insurance costs and global price volatility.
In the case of Poland, the current gas security model is based on a combination of several key elements: domestic production, underground gas storage, the LNG terminal in Świnoujście, the Baltic Pipe enabling imports from the Norwegian Continental Shelf, cross-border interconnections with neighbouring countries, and the development of the FSRU terminal in the Gulf of Gdańsk. The Gdańsk FSRU project, currently under construction, is intended to provide additional LNG import and regasification capacity, with the first unit planned to offer approximately 6.1 bcm of natural gas per year after regasification and to be commissioned in 2028. These elements have significantly increased the flexibility and resilience of the Polish gas system compared with the situation before 2010, strengthening Poland’s ability to respond to supply disruptions, seasonal demand fluctuations and volatility in global gas markets.
Infrastructure plays a decisive role in ensuring short-term and seasonal gas security. Underground gas storage (UGS) facilities remain particularly important, as they allow gas to be injected during periods of lower demand and withdrawn during periods of increased consumption, especially in the autumn and winter season. They also provide a strategic buffer in the event of supply disruptions, technical failures, sudden increases in demand or international crises affecting global gas markets.
Taking into account the seasonal character of natural gas consumption, with lower demand typically observed in the spring and summer period and higher demand in autumn and winter, it remains necessary to store gas surpluses when consumption decreases in order to cover increased demand during the heating season. However, the role of underground gas storage has expanded. Today, storage facilities are not only a tool for seasonal balancing, but also an essential component of crisis management, European energy solidarity and resilience to external shocks.
Poland has extensive experience in underground natural gas storage. The first underground gas storage facility in Europe was established in Poland in 1954, the Roztoki UGS facility, developed in a depleted natural gas reservoir. In 1956, the first European underground gas storage facility in an aquifer structure was established in France [4]. This historical experience remains important, but the current role of gas storage must be assessed in the broader context of market integration, EU security regulations, LNG supply, pipeline diversification, geopolitical instability and the gradual transformation of the gas sector towards low-emission gases, including biomethane and hydrogen.
Therefore, contemporary energy security in the gas sector should be analyzed not only through the prism of the physical availability of natural gas, but also in relation to infrastructure diversification, regulatory obligations, cross-border cooperation, resilience to geopolitical risks, exposure to global LNG markets and the long-term decarbonization of the energy system.
2. Types of Underground Gas Storage Systems
Each underground gas storage facility is characterized by a number of key technical parameters that determine its operational performance, strategic value and role within the gas system. The most important parameters include:
- – working gas capacity, understood as the volume of gas that can be injected into and withdrawn from the storage facility between its minimum and maximum operating pressure. This volume represents the part of the stored gas that is commercially and operationally available during storage operation;
- – cushion gas capacity, understood as the volume of gas that must remain permanently in the storage structure in order to maintain the required pressure conditions and ensure safe and efficient operation. In depleted reservoirs and aquifer storage facilities, cushion gas also helps to keep formation water at a safe distance from the well system. The required cushion gas volume depends on the type of storage facility, geological conditions, reservoir properties and the assumed operating regime;
- – total gas capacity, defined as the sum of working gas and cushion gas capacity;
- – maximum and minimum operating pressure. In underground gas storage facilities developed in depleted gas or oil reservoirs, the maximum operating pressure is generally related to the original reservoir pressure and should not exceed values that could compromise reservoir integrity or caprock tightness. In other types of storage, including aquifers and salt caverns, the maximum pressure is determined by the mechanical strength of the reservoir rock, caprock or salt formation, as well as by geomechanical safety criteria. The minimum operating pressure is determined by the pressure required for gas withdrawal, processing and delivery to the transmission system;
- – maximum withdrawal rate, defined as the maximum volume of gas that can be withdrawn from the storage facility per unit of time. This parameter depends on the type of storage, reservoir permeability, well deliverability, surface facilities, compression capacity and the pressure level in the storage structure.
- a)
- storage facilities in depleted natural gas or oil reservoirs;
- b)
- storage facilities in aquifer structures;
- c)
- storage facilities in salt caverns or, less commonly, rock caverns;
- d)
- storage facilities in abandoned mine workings or other underground voids.
Natural gas storage in depleted gas or oil reservoirs is the most common type of underground gas storage both in Poland and worldwide. This is mainly because depleted reservoirs usually have proven geological tightness, known reservoir parameters and, in many cases, existing infrastructure, including wells, gathering systems and gas-treatment facilities. As a result, the conversion of a depleted field into a gas storage facility is often less capital-intensive than the development of other types of storage. Nevertheless, such projects still require detailed reservoir, geomechanical and integrity assessments, particularly with regard to caprock sealing capacity, well integrity and long-term pressure cycling [2].
Underground gas storage in aquifer structures is possible only if two fundamental geological conditions are fulfilled. First, the storage horizon must be composed of porous and permeable rocks, such as sandstone, capable of accumulating and transmitting gas. Second, the porous formation must be overlain by an impermeable caprock that prevents the upward migration of stored gas. The maximum gas volume that can be stored depends on the volume and porosity of the aquifer, the temperature and pressure conditions, the geometry of the structure and the efficiency of the sealing formation. Aquifer storage facilities may offer favourable reservoir properties and, in some cases, may be located close to major consumers or urban areas. However, they usually require larger volumes of cushion gas and more extensive geological characterization than depleted reservoirs [6].
Underground gas storage in salt caverns involves the storage of gas in artificial caverns created by leaching in rock salt formations. The development of such caverns is possible only where the salt deposit has suitable geological, geometrical and mechanical properties, including appropriate depth, thickness, purity, continuity and structural stability. The position of other geological layers within and around the salt formation is also of major importance for long-term safety and operational reliability [7,8].
Due to their specific characteristics, salt cavern storage facilities are distinguished by very high injection and withdrawal rates compared with depleted reservoirs and aquifer storage. They are therefore particularly suitable for covering short-term peak demand, balancing rapid fluctuations in the gas system and responding to emergency situations, such as failures of transmission infrastructure or temporary disruptions of gas supply. Salt caverns are also highly flexible operational assets, as gas can be injected and withdrawn several times during a year. This makes them especially valuable in modern gas systems, where flexibility and rapid response capability are becoming increasingly important [9].
Salt cavern storage facilities occupy relatively small surface areas while offering high deliverability and operational availability. They can also complement larger seasonal storage facilities in depleted reservoirs or aquifers. In the context of the energy transition, salt caverns are increasingly discussed not only as natural gas storage facilities, but also as potential large-scale storage sites for hydrogen or other low-emission gases, provided that geological, geomechanical, microbiological and materials-related requirements are satisfied [10,11].
Underground gas storage in abandoned mine workings or other underground voids is much less common. In this type of storage, the key technical issue is ensuring and continuously monitoring tightness. The complex geometry of mine workings, possible leakage pathways and the need for extensive safety monitoring mean that this solution is used only in specific geological and technical conditions.
Underground gas storage facilities play an essential role in ensuring continuity of gas supply under normal operating conditions, particularly during seasonal or peak demand periods. However, their importance has increased significantly in the context of the European energy crisis after 2022, the reduction of Russian pipeline gas supplies, growing reliance on LNG imports and the increased exposure of the European gas market to global price volatility and maritime transport risks.
By 2026, underground gas storage should therefore be regarded not only as a tool for seasonal balancing, but also as strategic infrastructure supporting energy security, market stability and crisis resilience. Storage facilities help mitigate the effects of supply interruptions, sudden demand growth, infrastructure failures and geopolitical disruptions, including crises affecting LNG supply routes and global gas markets. The war in Iran in February 2026 and the related concerns over the security of maritime routes in the Middle East further demonstrated that diversification away from Russian pipeline gas reduces one type of dependence but may increase exposure to global LNG logistics, shipping constraints, insurance costs and price volatility.
In many countries, underground gas storage facilities are also operated as strategic reserves that reduce the risk associated with uncertainty of gas imports. In the European Union, this role has been strengthened by regulatory requirements concerning the filling of storage facilities before the winter season. As a result, modern underground gas storage is a key component of national and European gas-security policy, combining seasonal balancing, emergency response, market stabilization and long-term resilience of the energy system [12].
The strategic role of underground gas storage facilities was further reinforced after 2020, particularly in the context of deteriorating gas relations between Russia, Ukraine and the European Union. The expiry of the Russian gas transit agreement through Ukraine at the end of 2024 marked a significant turning point. From 1 January 2025, Russian pipeline gas flows to Europe via Ukraine ceased. Unlike the 2009 gas crisis, this did not cause a general security-of-supply emergency in the EU, mainly due to earlier diversification of supply routes, expanded LNG infrastructure, alternative pipeline connections, improved regional coordination and sufficient gas volumes in storage [13].
Underground gas storage had become a key pillar of European energy security, supporting not only seasonal balancing, but also resilience to geopolitical crises, import-route disruptions, price shocks, infrastructure failures and volatility in global LNG markets.
At present, 699 underground gas storage facilities operate worldwide, with a total working gas capacity of about 424 bcm. The Table 1 shows that global underground gas storage capacity is strongly concentrated in a few countries, especially the USA, Russia, Ukraine, Canada and Germany. Europe plays a major role, with Ukraine, Germany, Italy, the Netherlands and France among the key storage markets Differences between working gas volume and withdrawal capacity indicate different storage functions: some facilities mainly support seasonal balancing, while others provide high flexibility for peak demand and emergency supply [14]. Ukraine remains an important element of the European gas storage system, with one of the largest underground storage capacities in Europe, estimated at approximately 30 bcm. Before 2022, its storage facilities were increasingly considered a potential flexibility resource for the European gas market. However, the ongoing war, damage to energy infrastructure and security risks have limited their practical use by foreign market participants. Nevertheless, Ukraine’s continued efforts to accumulate gas before heating seasons confirm the strategic importance of storage even under wartime conditions.
Table 2 shows that the European underground gas storage system is primarily based on depleted gas fields and salt caverns, which together constitute the dominant storage types. The presented data also highlight the strategic relevance of non-EU countries, especially Ukraine, Turkey and the United Kingdom, for the overall European storage potential. Thus, Europe’s storage portfolio is diversified in terms of geological setting and operational function, which enhances regional gas supply security and system resilience.
Table 2. Number and types of underground gas storage facilities located in Europe.
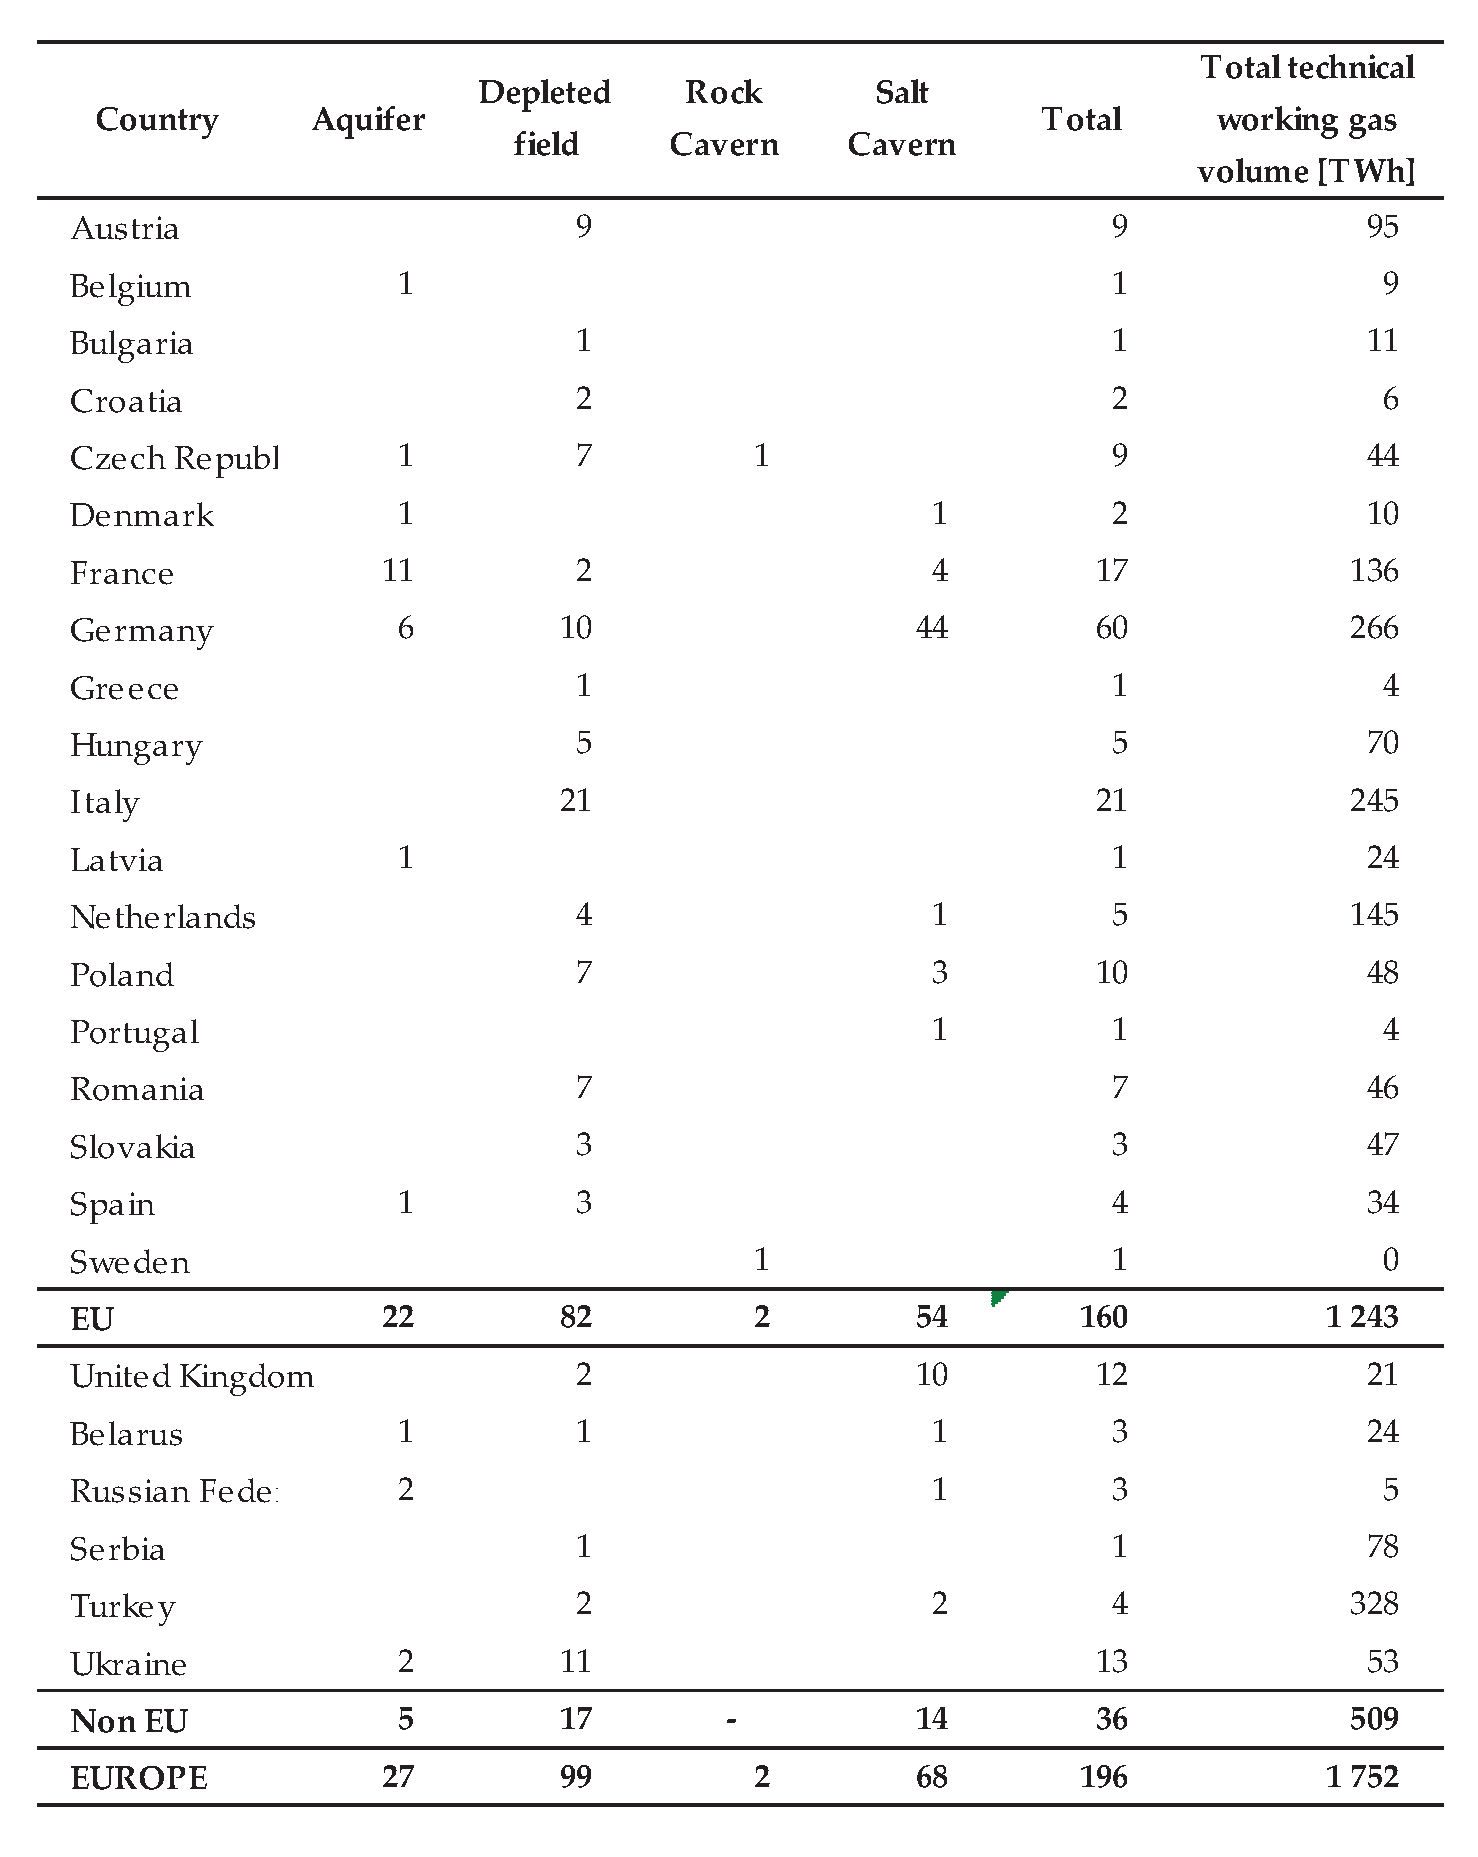
Source: own elaboration based on [15].
3. European UGS Capacities
The natural gas underground storage capacities in Europe exhibit substantial heterogeneity, arising from diverse geological conditions, historical supply models, and the varying roles of individual countries within the regional natural gas transmission system. Quantitative analysis of storage capacities and the spatial distribution of storage infrastructure indicates that the European gas storage system is highly concentrated in a limited number of countries, whereas the remaining states possess facilities of significantly smaller scale.
At the continental level, Europe’s total gas storage capacity exceeds 1500 TWh (130 bcm), of which approximately 1147 TWh (100 bcm) is located within the European Union. The largest storage capacities in Europe are located in Ukraine, exceeding 320 TWh (30 bcm). Within the EU, Germany holds the largest storage capacity (around 250 TWh), followed by Italy (approx. 200 TWh), the Netherlands (approx. 140 TWh), France (approx. 120 TWh), and Austria (approx. 100 TWh). These countries account for roughly two-thirds of the EU’s total storage capacity, underscoring their central role in balancing the European gas system. In Central Europe, countries maintain moderate storage capacities, with Hungary being the regional leader (approx. 67 TWh). Czechia, Poland, Slovakia, and Romania operate storage facilities ranging from 30 to 45 TWh (Figure 1).
This variation reflects both the availability of suitable geological formations and differences in national energy profiles. For instance, Spain and Portugal rely primarily on LNG terminals for gas security, which limits the development of underground gas storage. Conversely, Latvia’s Inčukalns storage facility plays a strategic role in the gas systems of the Baltic states.
The injection and withdrawal capacities of underground natural gas storage facilities in Europe exhibit substantial variability, reflecting the scale of storage infrastructure, the role of individual countries within the regional gas system, and the technical characteristics associated with different underground storage types. Presented on Figure 2 data shows, that the highest values for both parameters are observed in Germany, which reaches approximately 4300 GWh/d of injection capacity and around 7000 GWh/d of withdrawal capacity. High capacities are also recorded in Italy and the Netherlands. Italy achieves 1700 GWh/d of injection and 2900 GWh/d of withdrawal, while the Netherlands reaches 1500 GWh/d and 2600 GWh/d, respectively. Both countries operate extensive salt cavern and hydrocarbon depleted-field storage systems, enabling rapid response to fluctuations in demand. France maintains a more balanced profile, with 1078 GWh/d of injection and 2415 GWh/d of withdrawal capacity, largely due to the significant share of aquifer storage in its system.
Ukraine possesses some of the largest capacities in Europe, with 2200 GWh/d of injection and approximately 1500 GWh/d of withdrawal. The high injection performance reflects the large scale of Ukrainian storage facilities, although withdrawal capacities remain lower than in the largest EU countries. This results in reduced operational flexibility, as all Ukrainian storage sites are located in depleted hydrocarbon reservoirs.
The storage capacity of underground gas facilities alone does not directly indicate whether a given country is adequately protected against disruptions caused either by severe winter conditions or by rising demand and shifts in its structure. The data presented in Figure 3 illustrates a key technical parameter of natural gas storage systems: the ratio of maximum daily withdrawal to the total storage capacity of underground gas facilities. This indicator reflects the flexibility of each country’s storage system and determines its ability to respond to sudden increases in demand or interruptions in supply. High values of this parameter point to a significant share of cavern storage, which offers high withdrawal rates, whereas low values are typical of storage systems with large capacities but limited withdrawal performance, such as depleted gas fields or aquifer storage.
Analysis of presented data reveals clear differences among EU member states. Germany ranks first, with a ratio of 2.9%. High values are also observed in Portugal and Belgium, both exceeding 2% (despite their very small storage capacities), as well as in France, Slovakia, Denmark, and the Netherlands, which fall within the range of 1.8% to nearly 2%. Poland is positioned exactly in the middle of the ranking, with a value of approximately 1.6%, indicating a balanced storage structure combining seasonal storage in depleted gas fields with cavern storage. In contrast, countries whose storage infrastructure is predominantly seasonal, such as Italy, Hungary, Croatia, Austria, and Romania, exhibit ratios below 1.5%. The lowest daily flexibility is found in Bulgaria, Spain, and Ukraine (below 0.5%), as well as Latvia, which records the lowest value at around 0.3%. The cases of Latvia and Ukraine illustrate the specific nature of storage systems with large capacities but operational characteristics that do not align with the requirements of the ongoing energy transition.
For European countries, variation in the relationship between UGS capacity and annual natural gas demand is observed. A commonly accepted benchmark for safe natural gas system operation is a 25% ratio of storage capacity to annual demand. The highest values are recorded in Ukraine (140%) and Austria (128%), where storage facilities significantly exceed annual consumption, indicating an exceptionally high level of system security. High ratios are also observed in Slovakia (74%), Hungary (72%), Czechia (59%), and Latvia (55%) - with Latvia additionally as a key storage hub for Baltic states (Figure 4).
Western and Northern European countries such as the Netherlands (48%), Denmark (47%), France (34%), Italy (30%), and Germany (27%) maintain storage capacities above 25% of annual demand. This suggests that their systems are well-balanced, with storage fulfilling a primarily seasonal role. Germany’s relatively lower percentage reflects its position as the largest gas consumer in the EU.
Lower values are found in Bulgaria (23%), Croatia (17%), Poland (15%), Spain (11%), Portugal (8%), and Belgium (5%). In these countries, storage capacity is small relative to demand, meaning supply security must rely on other system components: for instance Spain and Portugal benefit from extensive LNG import capacities, while Belgium relies on dense cross-border interconnections and access to neighbouring countries’ storage. Poland, at around 15%, is in the weakest position in terms of domestic storage coverage, which implies the need for expanding national storage infrastructure; otherwise, securing access to storage capacity abroad may become necessary.
4. European Natural Gas Supply Directions
A structural shift from reliance on eastern direction of natural gas towards a more diversified supply portfolio dominated by LNG and supported by North Sea flows, with declining importance of domestic European production is shown on Figure 5.
In 2016-2021, supplies from East remained the dominant source, accounting for 35.5-43.7% of total natural gas inflows. However, from 2022 onwards, their share declined, falling from 35.5% in 2021 to 5.8% in 2025 and 5.2% in Q1 2026. This reduction was primarily offset by the rapid expansion of LNG imports, whose share increased from 8.6% in 2016 to 32.3% in 2022 and reached 41.7% in Q1 2026, making LNG the largest single supply direction. At the same time, the share of North Sea supplies also increased, from around 20% before 2020 to 27.0% in Q1 2026, while EU production continued to decline, from 19.3% in 2016 to 8.8% in Q1 2026. Supplies from North Africa, the UK and the Caspian region played a complementary role.
In addition, data presented on Figure 6 shows the EU seasonal gas supply structure by direction, expressed in TWh. The values represent the quantity of gas injected into the natural gas network in each season, while negative flows indicate either gas exports or net gas injected into underground gas storage (UGS). The seasonal gas balance shows a profound restructuring of the European gas supply system between 2020 and 2026.
The most visible change is the sharp decline in Russian gas imports, which decreased from 871 TWh in winter 2020/2021 to only 40 TWh in summer 2026, confirming the marginalization of this supply direction. This reduction was compensated mainly by increased LNG imports, which became the dominant external source of natural gas, rising from 419 TWh in summer 2020 to 724 TWh in summer 2025 and 787 TWh in winter 2025/2026. Supplies from the North Sea remained relatively stable and constituted an important balancing component, while flows from North Africa, the Caspian region and the UK played a supplementary role. The data also show a seasonal pattern in UGS operation: net withdrawals were positive during winter seasons, reaching 728 TWh in winter 2020/2021 and 696 TWh in winter 2024/2025, whereas summer seasons were characterized by net injections into storage, reflected by negative UGS values. Overall, the presented data demonstrate a transition from a supply structure strongly dependent on Russian pipeline gas towards a more diversified system based primarily on LNG, North Sea supplies, and seasonal storage flexibility.
Also, the structure of EU gas pipeline imports changed substantially between 2021 and Q1 2026, reflecting a major reorientation of supply routes. Figure 7. demonstrate a shift in EU pipeline gas imports away from traditional eastern and northern Russian corridors towards Norway, Algeria and other non-Russian suppliers.
Norway strengthened its position as the dominant pipeline supplier, with its share increasing from 29% in 2021 to 54% in 2025 and remaining stable at 55% in Q1 2026. Algeria also maintained an important role, increasing from 12% in 2021 to 18% in Q1 2026. The most pronounced decline concerned Russian pipeline supplies through the Yamal/Nord Stream route, which fell from 33% in 2021 to 15% in 2022 and disappeared from the supply structure from 2023 onwards. Similarly, Russian natural gas transit via Ukraine declined from 13% in 2021 to 8-9% in 2022-2024 and stop in 2025. In contrast, the share of Russian gas delivered through TurkStream increased from 4% in 2021 to 12% in Q1 2026, indicating a partial rerouting of remaining Russian pipeline flows.
5. Impact of Energy Transition in Europe on Natural Gas Systems
The ongoing energy transition characterized by the gradual decarbonization of the economy, the rapid expansion of renewable energy sources, and the advancement of low-emission technologies is fundamentally reshaping the role of natural gas within contemporary energy systems. In this context, natural gas serves as a transitional fuel that facilitates the stabilization of national power systems under conditions of increasing variability in renewable electricity generation. This systemic shift has direct implications for the operation of gas storage infrastructure, which must evolve from its traditional function of seasonal balancing within the gas network toward becoming an essential component of flexibility across the entire energy sector.
The growing share of renewable energy sources, particularly solar photovoltaics and wind power, has led to greater amplitude and frequency of fluctuations in electricity generation. Under these circumstances, gas-fired power plants emerge as critical regulatory assets capable of rapidly adjusting output in response to changes in renewable energy supply. This variability translates into fluctuating demand for natural gas, which must be met both promptly and reliably. As a result, gas storage facilities, historically utilized primarily for seasonal balancing, are increasingly required to operate as short-term balancing resources that support the gas system during periods of peak demand and enable the flexible operation of gas-fired units. Salt cavern storage facilities, in particular, gain strategic importance due to their high injection and withdrawal flexibility, allowing rapid response to short-duration changes in gas demand driven by the intermittency of renewable generation.
Simultaneously, the energy transition affects the structure of natural gas supply. In this context, gas storage facilities become a key element of energy security, enabling compensation for short-term supply disruptions and stabilizing prices on the gas market. The energy crisis of 2022-2023, triggered by Russia’s invasion of Ukraine, underscored the strategic significance of gas storage across the European Union. In many EU member states, storage facilities became indispensable instruments for mitigating extreme gas price spikes and ensuring continuity of supply amid sharply reduced imports from the eastern direction [19].
The transition also encompasses the development of renewable gases, such as biomethane and hydrogen, which introduces new technological challenges for gas storage infrastructure. Biomethane, owing to its physicochemical similarity to methane, can be stored in existing facilities without substantial modification. However, its distributed production profile favors integration at the level of distribution networks rather than transmission systems, where large-scale gas storage facilities are typically connected. Hydrogen, by contrast, exhibits distinct physicochemical properties that necessitate dedicated adaptations of storage infrastructure, particularly salt caverns, which currently represent the only viable option for large-scale hydrogen storage. Looking ahead, gas storage facilities will be required to accommodate hydrogen/methane blends, a development that will demand modernization of compression systems, construction materials, and flow-balancing methodologies, as well as the establishment of new safety and operational standards [20,21].
6. Scenario of Russian Invasion on Ukraine (2021-2025)
Europe’s gas storage system experienced a rapid transformation between 2021 and 2023, driven directly by the escalating geopolitical crisis and Russia’s subsequent aggression against Ukraine. In 2021, the level of gas storage filling in the European Union remained clearly below the long-term average, as shown in Figure 8, where average storage levels reached historic lows. During the summer months, which traditionally serve to rebuild inventories, filling levels were 10-15 percentage points lower than the multi-year average. The maximum storage level before the winter season reached only 75%, while the historical average stood at 85-90%.
This situation was directly linked to Gazprom’s actions. In 2021, the company restricted gas supplies to Europe and deliberately failed to refill storage facilities in which it held shares within the EU. Reports by the IEA and ACER emphasized that the Russian company did not book additional pipeline capacity even though European prices were hitting record highs due to limited supply [22,23]. In the fourth quarter of 2021, Russian gas deliveries to Europe were 25% lower year-on-year, and Gazprom reduced spot market sales, directing gas exclusively to long-term contract customers. At the same time, Russia’s share in European gas supplies remained high - around 40% at the beginning of 2021 - making Europe structurally dependent on a single supplier.
The mechanisms of supply manipulation were multidimensional. First, Gazprom did not refill storage facilities in which it held stakes in Germany, Austria, and the Netherlands. Second, it restricted flows through the Yamal-Europe pipeline, which in December 2021 even operated in reverse mode, meaning gas flowed from Germany to Poland rather than the other way around. Third, Russia did not increase deliveries through Nord Stream 1, despite the infrastructure being fully available. These actions left Europe entering the winter season with the lowest inventories in a decade, while being forced to buy gas at record prices - strengthening Russia’s negotiating position. This was part of a pressure strategy intended to discourage Europe from responding to Russia’s planned aggressive actions, amplified by propaganda narratives about a harsh winter that Europe supposedly could not withstand without Russian gas.
In 2022, after Russia launched its aggression against Ukraine, the European gas system had to undergo a sudden shift and reorganize supply routes while urgently rebuilding storage inventories. Faced with the risk of physical gas shortages, destabilization of power systems, and potential industrial collapse, EU member states undertook coordinated regulatory, infrastructural, and market-based actions that rapidly reshaped the European gas system. The storage filling curve for that year shows a swift increase in inventories - by July 2022, storage levels reached around 65-70%, and in August they exceeded 80%, the level required by EU regulations only by 1 November. In October 2022, inventories reached 90-95%, one of the highest levels in history (Figure 8).
A second pillar of Europe’s response was the immediate diversification of supply routes. At the same time, the structure of gas supplies to Europe changed completely. Russia’s share fell from 40% at the beginning of 2021 to below 10% by mid-2022, and in some months even to 5% (Figure 9). Russia pursued a policy of faits accomplished, demanding payment for gas in its own currency under threat of supply termination; most countries refused, resulting in halted deliveries. Additionally, in September 2022, three of the four Nord Stream pipelines were destroyed, limiting Russia’s export capacity. Meanwhile, LNG’s share rose to 30-35%, becoming Europe’s main source of supply-spot LNG deliveries played a key role in securing Europe’s needs. LNG prices offered in Europe were significantly higher than in East Asia, prompting suppliers to redirect cargoes to Europe. As Russian deliveries fell below 10%, Europe turned to the global LNG market, which quickly became its primary supply source. EU countries launched new floating FSRU terminals, accelerated regasification infrastructure expansion, and increased capacity at existing terminals. Particularly important was the rapid deployment of FSRU units in Germany, which previously had no LNG terminals. In parallel, imports from Norway increased - Norway became the largest gas supplier to the EU, maintaining a stable share of 20-25%. Domestic EU production and imports from North Africa remained stable in the 5-15% range.
In 2023, the European gas market reached a new equilibrium amid the ongoing conflict in the east. The storage filling curve for that year lies significantly above the curves for 2021 and 2022. The 80% filling level was reached as early as June a record level and from August onwards inventories remained above 90%, ensuring full readiness and security ahead of the winter season. The supply structure in 2023 confirms a lasting departure from Russian gas: Russia’s share remained marginal, at 5-8%, mainly to countries such as Slovakia, Hungary, and Serbia, which politically chose not to abandon Russian gas. LNG deliveries maintained their dominant position with a 30-35% share (Figure 9.).
Taken together, the years 2021-2023 illustrate three phases of transformation in Europe’s gas system and gas market. The year 2021 was a period in which low inventories and Russian supply manipulation created structural risks for Europe’s energy security. The year 2022 was a phase of rapid adaptation, during which Europe had to simultaneously rebuild inventories and reorganize supply routes, leading to an unprecedented rise in the importance of LNG. The year 2023 was a phase of consolidation of the new model, in which gas storage became a strategic tool for market stabilization, and supply diversification became the foundation of Europe’s energy security.
During the Russian invasion, Ukraine gas storage facilities emerged as a critical component in stabilizing both the national energy system and the broader regional European gas market. Ukraine possesses the largest underground gas storage infrastructure in Europe, with a total capacity of approximately 31 bcm, which already prior to the outbreak of hostilities positioned Ukraine as a strategic reserve for consumers across the region. Once Russia initiated its aggression and simultaneously curtailed gas supplies to Europe, the strategic importance of Ukraine storage facilities increased markedly, functioning as a buffer that mitigated supply volatility on the European market.
In 2023, following a relative stabilization of the Russian-Ukrainian conflict, the role of Ukraine’s gas storage system expanded once again. European Union market participants injected roughly 2.5 bcm of gas into Ukrainian storage sites [24], raising the filling level to a record 39% (Figure 10). Owing to Ukraine’s exceptionally large storage capacity, domestic demand does not necessitate high filling levels, which makes the system particularly attractive for external users.
The expiration of Russian gas transit through Ukrainian territory at the end of 2024 altered the operational role of these facilities. Storing gas from the European market now required its physical transport into Ukraine, which slightly reduced the attractiveness of Ukrainian storage for European traders. Consequently, in 2025 the filling level did not reach the elevated values observed in 2023. Nevertheless, by offering approximately 10 bcm of storage capacity to European market, Ukraine retains the potential to evolve into a regional storage hub capable of enhancing market stability during periods of rapid shifts in supply routes or demand patterns [24].
7. Scenario of Persian Gulf Conflict (2026)
The new conflict in the Persian Gulf and the closure of the Strait of Hormuz have led to a reduction in global LNG supply. At the same time, the relatively cold winter of 2025/26 in Europe resulted in extensive use of European gas reserves and brought natural gas storage levels down to exceptionally low values. In 2026, gas storage facilities become a central element of the European Union’s energy security amid growing concerns about securing supplies for the 2026/27 winter season. Disruptions in the Strait of Hormuz are causing a decline in global LNG availability, the temporary shutdown of the largest liquefaction facility in Qatar’s Ras Laffan significantly affects the global gas market. Europe, which after 2022 replaced most Russian pipeline gas with LNG imports, feels this situation particularly strongly. According to market analyses, the LNG supply gap in 2026 may reach more than 20% of global exports, resulting in limited availability of spot cargoes and price shifts on the TTF. Under such conditions, gas storage facilities cease to serve merely as seasonal buffers and instead become strategic assets that determine system stability and resilience to further supply level variability. Unfortunately, the conflict emerged after a relatively cold winter, during which the minimum average filling level of European storage facilities fell to 28% [26,27].
The EU-wide graph (Figure 11) shows that the 2026 line begins clearly below the 2011–2025 average and close to the lower boundary of the historical range. This indicates that post-winter stocks dropped to levels comparable to the lowest recorded in the past decade. In practice, this forces an earlier start to the injection season, intensive use of LNG infrastructure, and increased gas flows from North Sea and North Africa.
Germany faces a similar situation to the EU as a whole - storage levels in 2026 lie below the historical average and near the lower end of the long-term range (Figure 12). In practice, low storage levels in Germany translate into higher prices on regional markets and necessitate intensive use of FSRU terminals in the north of the country. Meanwhile, reduced LNG supply limits the ability to rebuild storage inventories. German storage facilities in 2026 therefore become not only a national asset but also a key factor influencing prices across the European market.
The Netherlands, with the third-largest storage capacity in the EU, plays an equally important role due to the presence of the TTF market. In 2026, Dutch gas storage levels are particularly low - clearly below the average and below historical minimums (Figure 13). In practice, this means that low Dutch storage levels immediately translate into price signals for the entire EU. Storage facilities in the Netherlands have a significant impact on the gas market and are crucial for balancing flows from LNG terminals in the Benelux region.
8. Discussion
The analysis of European underground gas storage (UGS) capacities, withdrawal and injection performance, and the evolving structure of natural gas supply between 2016 and 2026 demonstrates that the role of natural gas storage in ensuring energy security has been reshaped in fundamental ways transformation. Historically, UGS facilities served primarily as seasonal balancing role, enabling the accumulation of gas surpluses during periods of low demand and their withdrawal during the heating season. However, the geopolitical impacts of 2022–2026, combined with structural changes in the European gas market, have significantly expanded the strategic importance of storage infrastructure.
A key finding of the study is the increasing divergence between countries with large, flexible storage systems and those whose storage capacities remain limited or structurally constrained. Germany, Italy and the Netherlands illustrate the advantages of diversified storage portfolios combining depleted reservoirs with salt caverns, which provide high withdrawal rates and rapid response capability. In contrast, countries such as Ukraine, Latvia or Bulgaria, despite possessing substantial working gas volumes, exhibit low withdrawal to total capacity ratios, limiting their ability to respond to sudden demand spikes or supply interruptions. This confirms that storage capacity alone is not a sufficient indicator of system resilience; operational flexibility, geological characteristics and the structure of storage types are equally decisive.
The results also highlight the growing importance of UGS in the context of Europe’s increasing reliance on LNG. The shift from pipeline gas imports from the East to LNG supplies - whose share rose to over 40% in Q1 2026 - has changed the risk profile of the European gas system. While diversification away from Russian gas has reduced geopolitical dependence on a single supplier, it has simultaneously increased exposure to global LNG market volatility and shipping disruptions. In this new environment, underground gas storage acts as a stabilizing buffer that mitigates short term price variability, compensates for delays in LNG deliveries and supports system balancing during periods of global market impacts.
The study also shows that the relationship between storage capacity and annual demand varies significantly across Europe. Countries such as Austria, Slovakia and Hungary maintain storage capacities exceeding 70% of annual consumption, ensuring exceptionally high resilience. Conversely, Poland, Spain and Belgium operate with much lower ratios, relying instead on LNG terminals or cross-border interconnections. For Poland, the relatively low total storage capacity to annual demand ratio (approx. 15%) indicates a structural vulnerability that may intensify as the gas system becomes more exposed to global LNG market changes. This suggests that expanding domestic storage capacity or securing access to foreign storage facilities will be necessary to maintain adequate levels of energy security.
Another important observation concerns the operational characteristics of different storage types. Salt caverns, with their high withdrawal rates and multi-cycle capability, are increasingly valuable in modern natural gas systems characterized by volatile demand patterns and the need for rapid balancing. Their role will likely grow further as Europe progresses toward decarbonization and the integration of low-emission gases, including hydrogen. Depleted pore reservoirs, while offering large operating gas volumes, remain primarily seasonal assets.
Finally, the results confirm that UGS facilities have become a central element of European gas crisis management. The ability of the EU to avoid a major supply emergency after the cessation of Russian gas transit through Ukraine in 2025 was largely due to high storage levels, diversified supply routes and improved regional coordination. This underscores the importance of regulatory frameworks mandating minimum storage filling levels before winter seasons, which have proven effective in enhancing resilience.
9. Conclusions and Recommendations
From the perspective of short-term energy security, countries should maintain the largest economically justified underground gas storage capacities. Underground gas storage facilities are a key element of the gas system, as they enable the accumulation of gas reserves during periods of lower demand and their withdrawal during periods of increased consumption, supply disruptions or transmission network constraints.
The role of underground gas storage became particularly significant after Russia’s full-scale invasion of Ukraine in 2022, which fundamentally changed the structure of gas supply in Europe and accelerated the reduction of dependence on Russian pipeline gas. Storage facilities became a central element of the European gas-security framework, supporting supply continuity, market stability and preparation for winter demand peaks.
The strategic importance of storage was also confirmed during the war in Iran in 2026, when risks related to the Strait of Hormuz increased uncertainty in global LNG markets. This demonstrated that diversification away from Russian pipeline gas does not eliminate supply risk, but changes its nature by increasing exposure to maritime transport routes, LNG availability, shipping costs and price volatility.
Therefore, underground gas storage should be regarded as one of the key instruments of national and European energy security, alongside diversification of supply sources and import routes. In the case of Poland, the development and modernization of domestic storage capacity remain important for ensuring continuity of gas supply in the event of import disruptions, transmission network failures, sudden demand increases or disturbances in global gas markets. Particular attention should be paid not only to working gas capacity, but also to withdrawal capacity, which determines the ability of the system to respond rapidly to peak demand and crisis situations.
Author Contributions
Conceptualization, T.W. and S.K.; methodology, T.W. and S.K.; validation, A.S.; formal analysis, T.W. and S.K.; investigation, T.W. and S.K.; resources, T.W. and S.K.; data curation, T.W. and S.K.; writing—original draft preparation, T.W. and S.K.; writing—review and editing, M.L. and A.S.; visualization, T.W. and S.K.; supervision, M.L. and A.S.; funding acquisition, S.K.. All authors have read and agreed to the published version of the manuscript.
Funding
The authors acknowledge the support and funding received from the Ministry of Science and Higher Education by subsidy.
Data Availability Statement
Data is contained within the article or supplementary material.
Conflicts of Interest
The authors declare no conflicts of interest.
References
- Kaliski, M.; Janusz, P.; Szurlej, A. Wpływ kryzysu gazowego rosyjsko- -ukraińskiego z początku 2009 r. na rynek gazu ziemnego w Polsce. Gaz. Woda I Tech. Sanit. 2009, t. 83(nr 7–8), 2–5. [Google Scholar]
- Kaliski, M.; Janusz, P.; Szurlej, A. Podziemne magazyny gazu jako element krajowego systemu gazowego. Nafta-Gaz 2010, 66, 325–332. [Google Scholar]
- Ruszel, M.; Szurlej, A. Sektor gazu ziemnego w państwach V4. Przegląd Gazow. 2016, 1(49). [Google Scholar]
- Michałowski, W. S.; Trzop, S. Rurociągi dalekiego zasięgu, Wyd. V. ed; Odysseum, Warszawa, 2006. [Google Scholar]
- Reinisch, R. Wybrane, istotne aspekty podziemnych magazynów gazu u progu XXI wieku. In Wyd.; PLJ: Warszawa, 2000. [Google Scholar]
- Nagy, S.; Barczyński, A.; Blicharski, J.; Duliński, W.; Łaciak, M.; Marszałek, J.; Ślizowski, J. Vademecum Gazownika Tom I. Podstawy Gazownictwa Ziemnego: Pozyskiwanie, Przygotowanie do Transportu, Magazynowanie; 2014. [Google Scholar]
- Wilkosz, P. Kawernowe podziemne magazyny gazu w Polsce: teraźniejszość i przyszłość. Przegląd Geol. 2024, 72(11). [Google Scholar] [CrossRef]
- Andrusikiewicz, W. Możliwości magazynowania gazu ziemnego i energii w utworach solnych na terenie Polski. Inz. Miner. 2024, 53(2). [Google Scholar]
- Ślizowski, J.; Lankof, L.; Urbańczyk, K.; Serbin, K. Potential capacity of gas storage caverns in rock salt bedded deposits in Poland. J. Nat. Gas. Sci. Eng. 2017, 43, 167–178. [Google Scholar] [CrossRef]
- Ligęza, K.; Narloch, P. Perspektywy magazynowania wodoru z odnawialnych źródeł energii w Polsce cz. 1. In Nowa Energia.; 2023. [Google Scholar]
- Serbin, K.; Ślizowski, J.; Urbańczyk, K.; Nagy, S. The influence of thermodynamic effects on gas storage cavern convergence. Int. J. Rock. Mech. Min. Sci. 2015, 79, 166–171. [Google Scholar] [CrossRef]
- Wittman, B.; Wilkosz, P. Bezpieczeństwo energetyczne–rola podziemnych magazynów gazu ziemnego. In W służbie społeczeństwu. Polska w obronie praw człowieka na świecie i w kraju; Stala, J., Butrymowicz, M., Eds.; Uniwersytet Papieski Jana Pawła II w Krakowie Wydawnictwo Naukowe: Kraków, 2022; pp. 159–182. [Google Scholar]
- Janusz, P.; Kaliski, M.; Szurlej, A. Role of underground gas storage in the EU gas market. AGH Drill. Oil Gas. 2014, 31(1). [Google Scholar] [CrossRef]
- International Gas Union. Underground gas storage: A critical pillar for energy security. In International Gas Union; 2025. [Google Scholar]
- Gas Infrastructure Europe (GIE). Storage Database. Available online: https://www.gie.eu/transparency/databases/storage-database/ (accessed on 23 June 2026).
- Gas Infrastructure Europe (GIE). AGSI & ALSI Transparency Platforms. Available online: https://www.gie.eu/agsi-and-alsi-transparency-platforms/ (accessed on 23 June 2026).
- JRC EU Security of Gas Supply Dashboard. Available online: https://app.powerbi.com/view?r=eyJrIjoiNjYxN2JmYTctYmEzYy00NGE3LTk4ZGQtMWI5YzU3OWIxNDQ2IiwidCI6ImIyNGM4YjA2LTUyMmMtNDZmZS05MDgwLTcwOTI2ZjhkZGRiMSIsImMiOjh9 (accessed on 26 June 2026).
- EU Gas Flows Tracker. Available online: https://ieefa.org/eu-gas-flows-tracker (accessed on 26 June 2026).
- Lousada, S.; Jankauskienė, D.; Pukite, V.; Zubaka, O.; Roman, L.; Delehan, S. Bridging the resilience gap: how Ukraine’s gas network and UGS de-risk Europe’s sustainable transition beyond 2025. Sustainability 2025, 18(1), 136. [Google Scholar]
- Pavlenko, A.; Cherp, A. Do energy security crises accelerate decarbonisation? The case of REPowerEU. Energies 2025, 19(1), 200. [Google Scholar] [CrossRef]
- Mielich, T.; Dobler, R.; Hollnagel, J.; Akca, O.; Müller-Kirchenbauer, J. Europe’s way from natural gas to green hydrogen: Modeling and simulation of the transforming European gas transport infrastructure. Int. J. Hydrogen Energy 2025, 135, 156–171. [Google Scholar]
- International Energy Agency. Gas Market Report, Q1-2022. IEA, Paris. 2022. Available online: https://www.iea.org/reports/gas-market-report-q1-2022 (accessed on 23 June 2026).
- ACER/CEER. Annual Report on the Results of Monitoring the Internal Electricity and Natural Gas Markets in 2021: Gas Wholesale Markets Volume; 2022. [Google Scholar]
- Financial Times. Ukraine’s Gas Storage Helps Europe Avert Further Energy Crises. Available online: https://www.ft.com/content/d02a5c8e-8406-40e5-91a4-a58fb4dd1565 (accessed on 26 June 2026).
- ENTSOG Transparency Platform. European Network of Transmission System Operators for Gas (ENTSOG). Available online: https://transparency.entsog.eu (accessed on 26 June 2026).
- An, F.; Ren, S.; Liu, X.; Cui, J. Energy Supply Resilience and Industrial Continuity Under a Strait of Hormuz Blockade. Energies 2026, 19(11), 2719. [Google Scholar] [CrossRef]
- International Energy Agency (IEA). Strait of Hormuz—Factsheet. Available online: https://www.iea.org/about/oil-security-and-emergency-response/strait-of-hormuz (accessed on 23 June 2026).
Figure 1.
Underground natural gas storage technical capacity in EU countries and Ukraine. Source: own study based on [16].
Figure 1.
Underground natural gas storage technical capacity in EU countries and Ukraine. Source: own study based on [16].
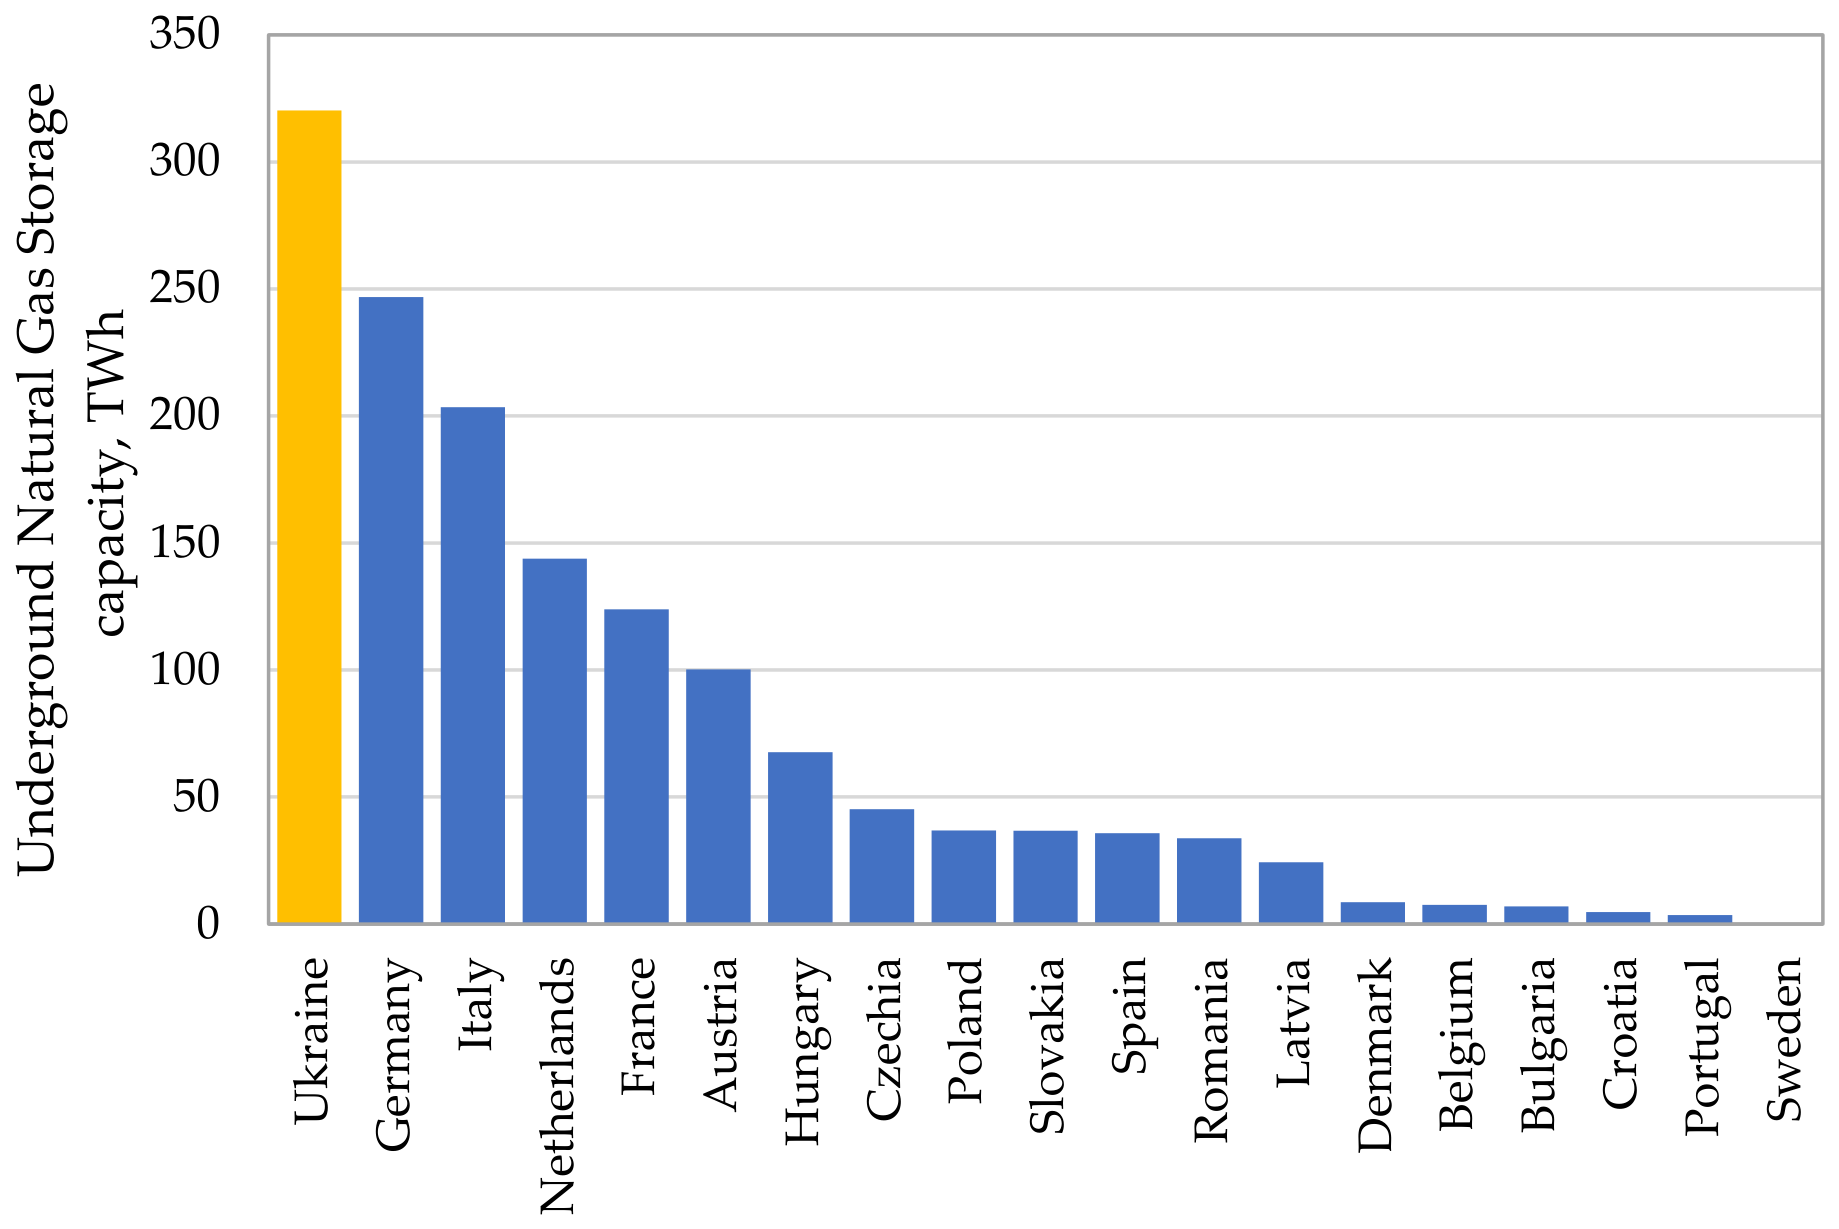
Figure 2.
Injection/withdrawal technical capacities in EU countries and Ukraine. Source: own study based on [16].
Figure 2.
Injection/withdrawal technical capacities in EU countries and Ukraine. Source: own study based on [16].
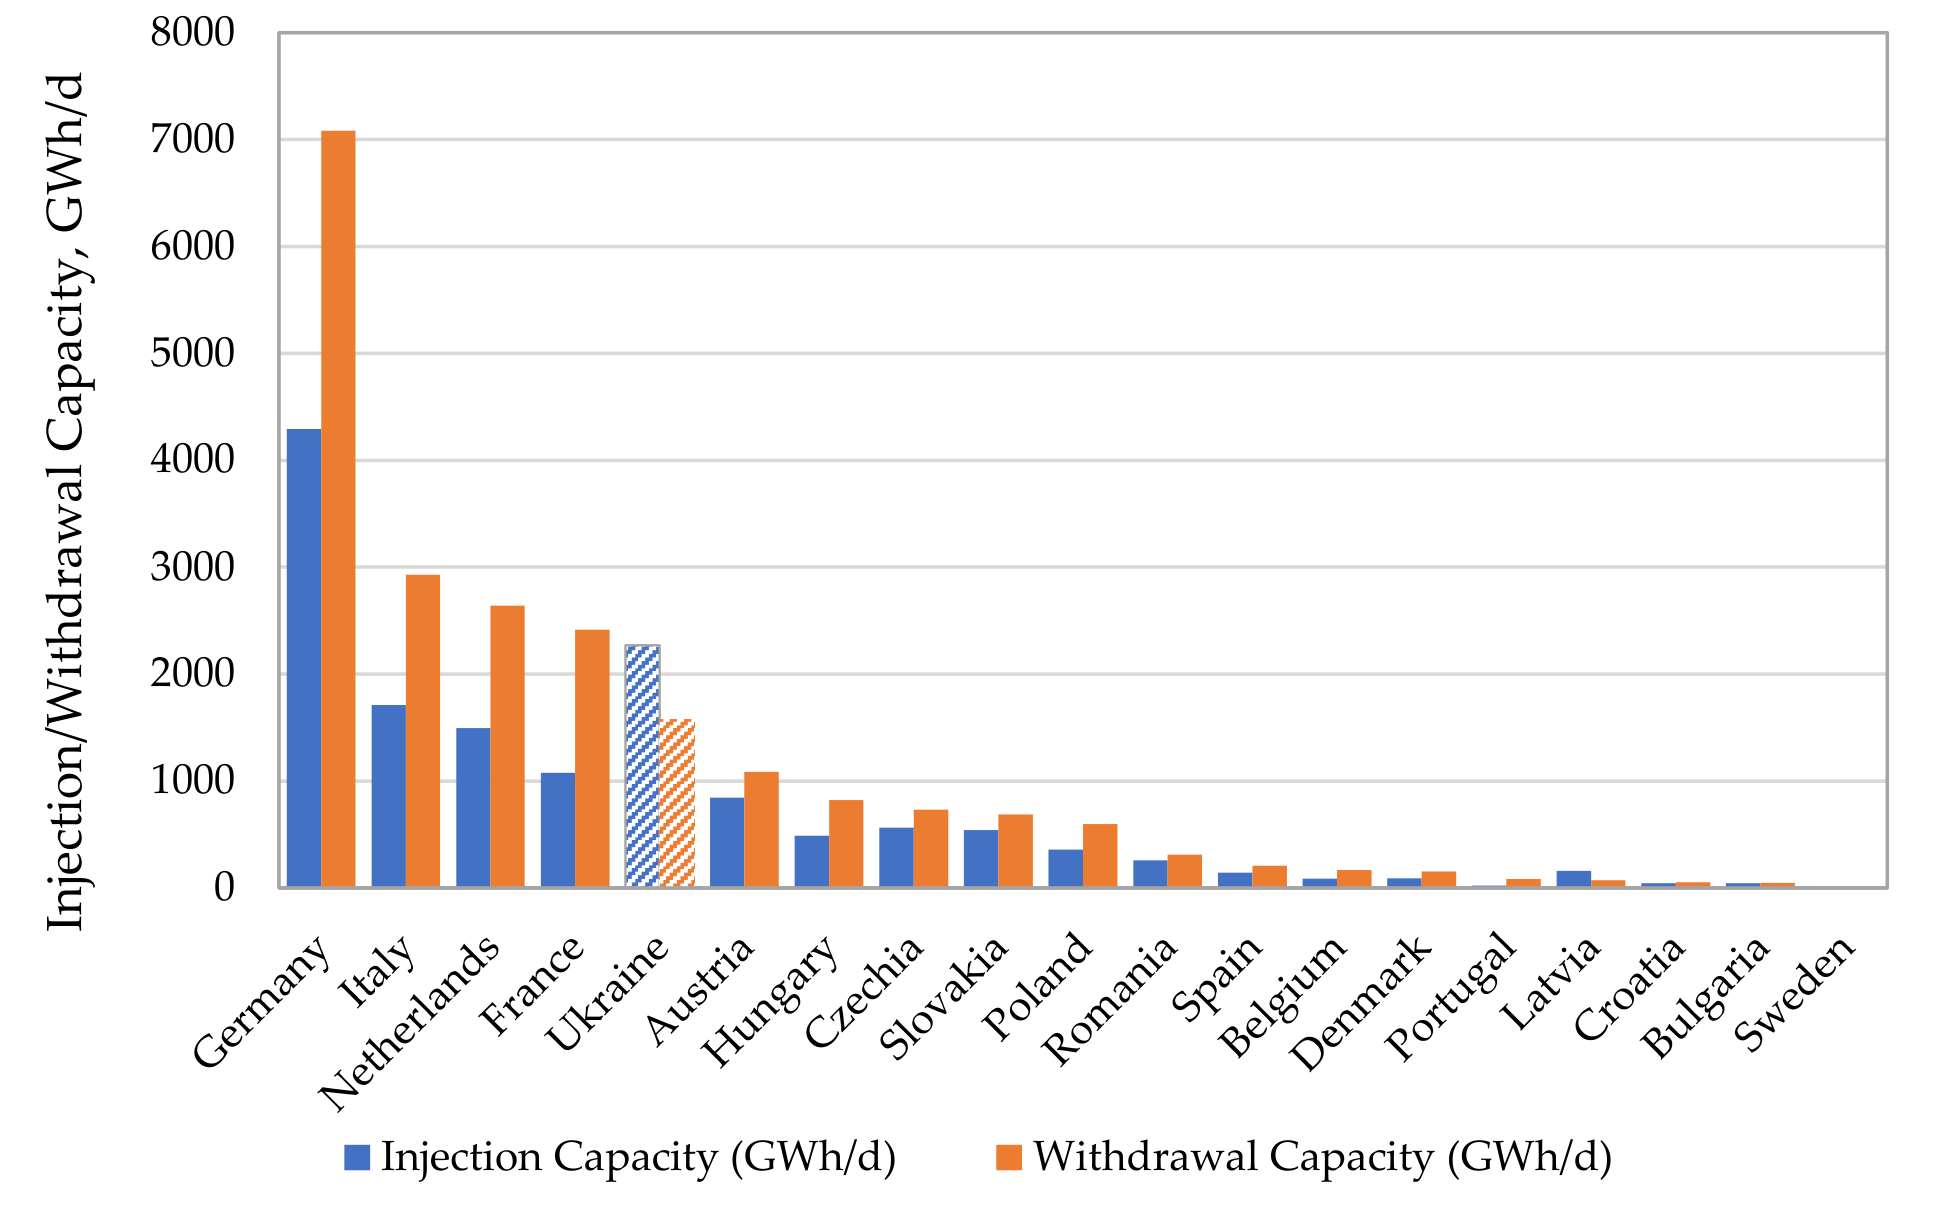
Figure 3.
The ratio of maximum daily withdrawal to the total storage capacity of underground gas facilities in EU countries and Ukraine. Source: own study based on [16].
Figure 3.
The ratio of maximum daily withdrawal to the total storage capacity of underground gas facilities in EU countries and Ukraine. Source: own study based on [16].
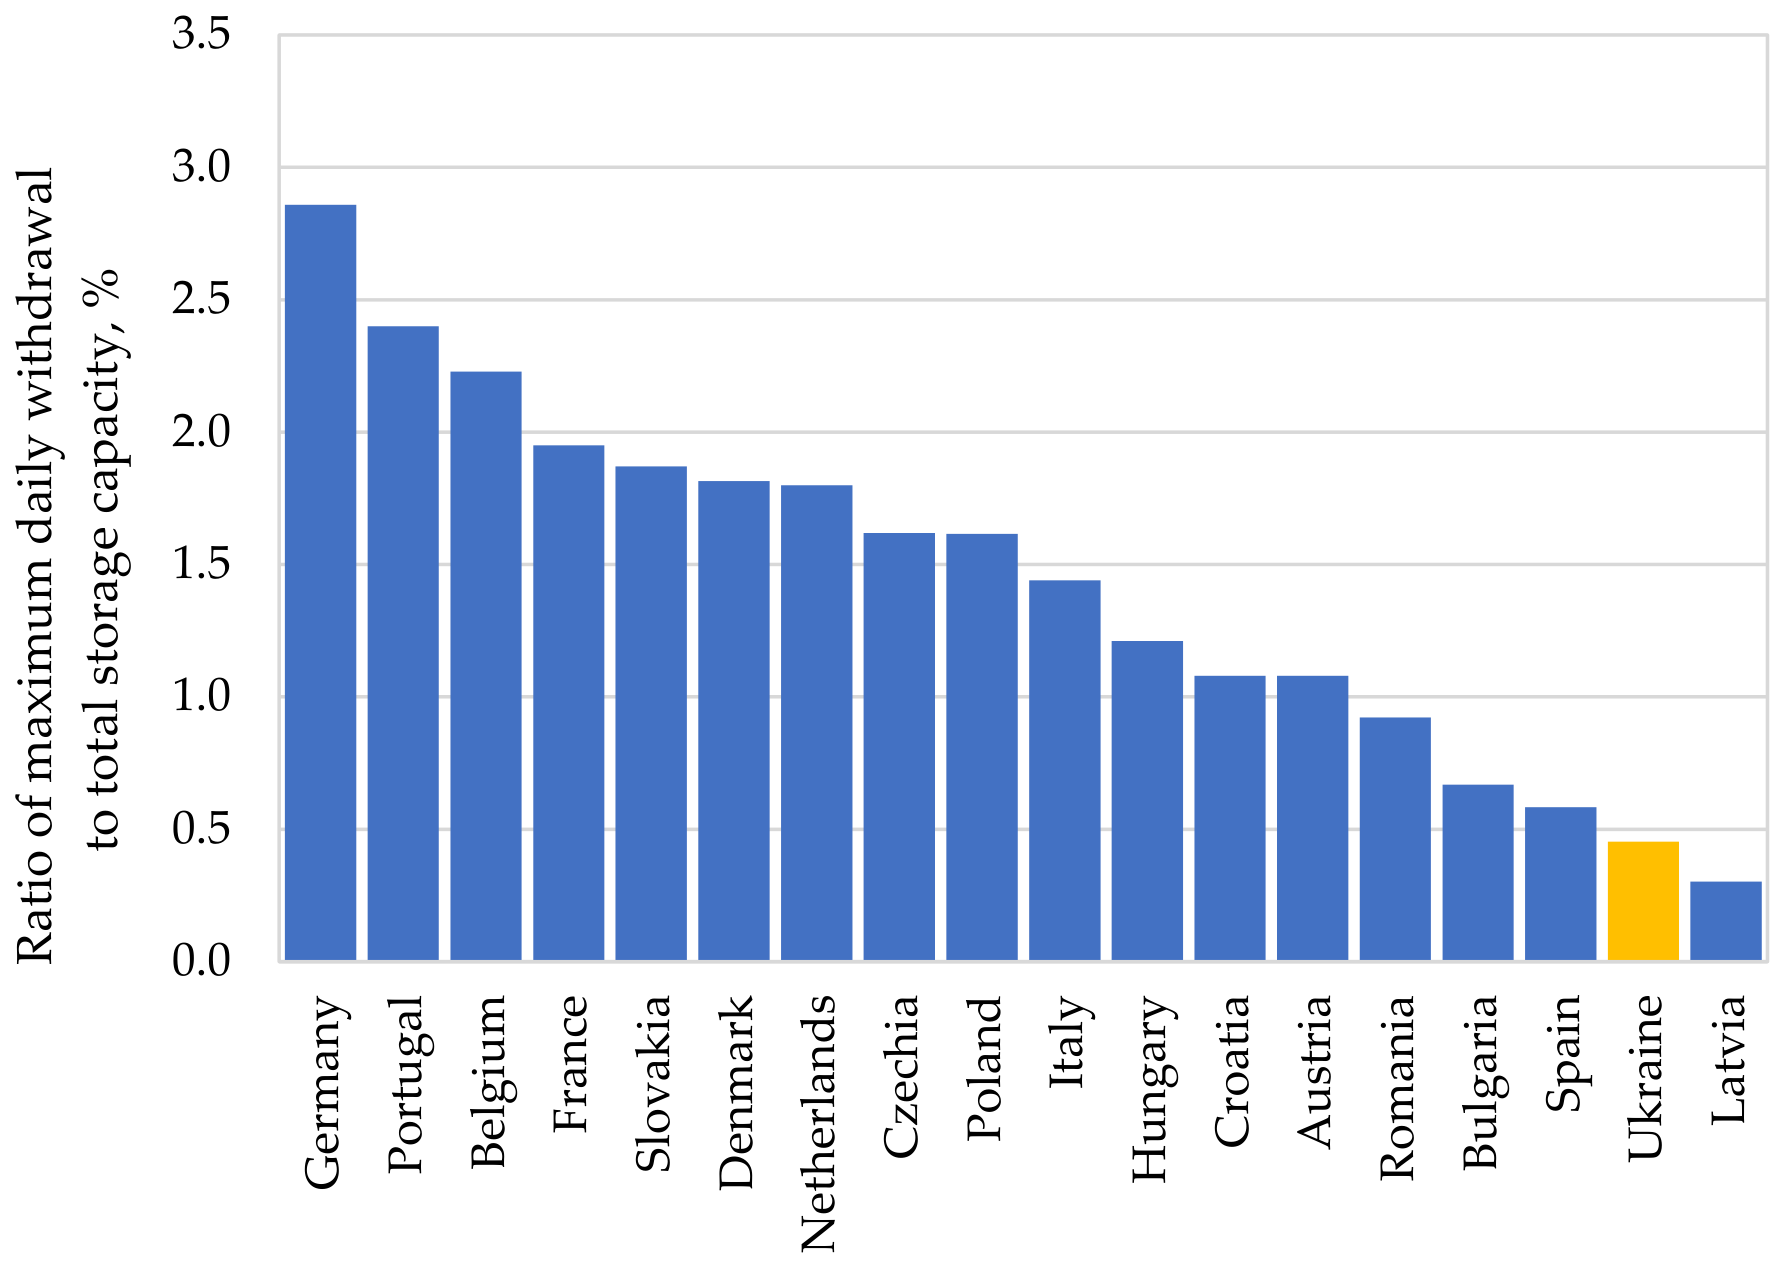
Figure 4.
Relationship between underground gas storage capacity and annual natural gas demand. Source: own study based on [16].
Figure 4.
Relationship between underground gas storage capacity and annual natural gas demand. Source: own study based on [16].
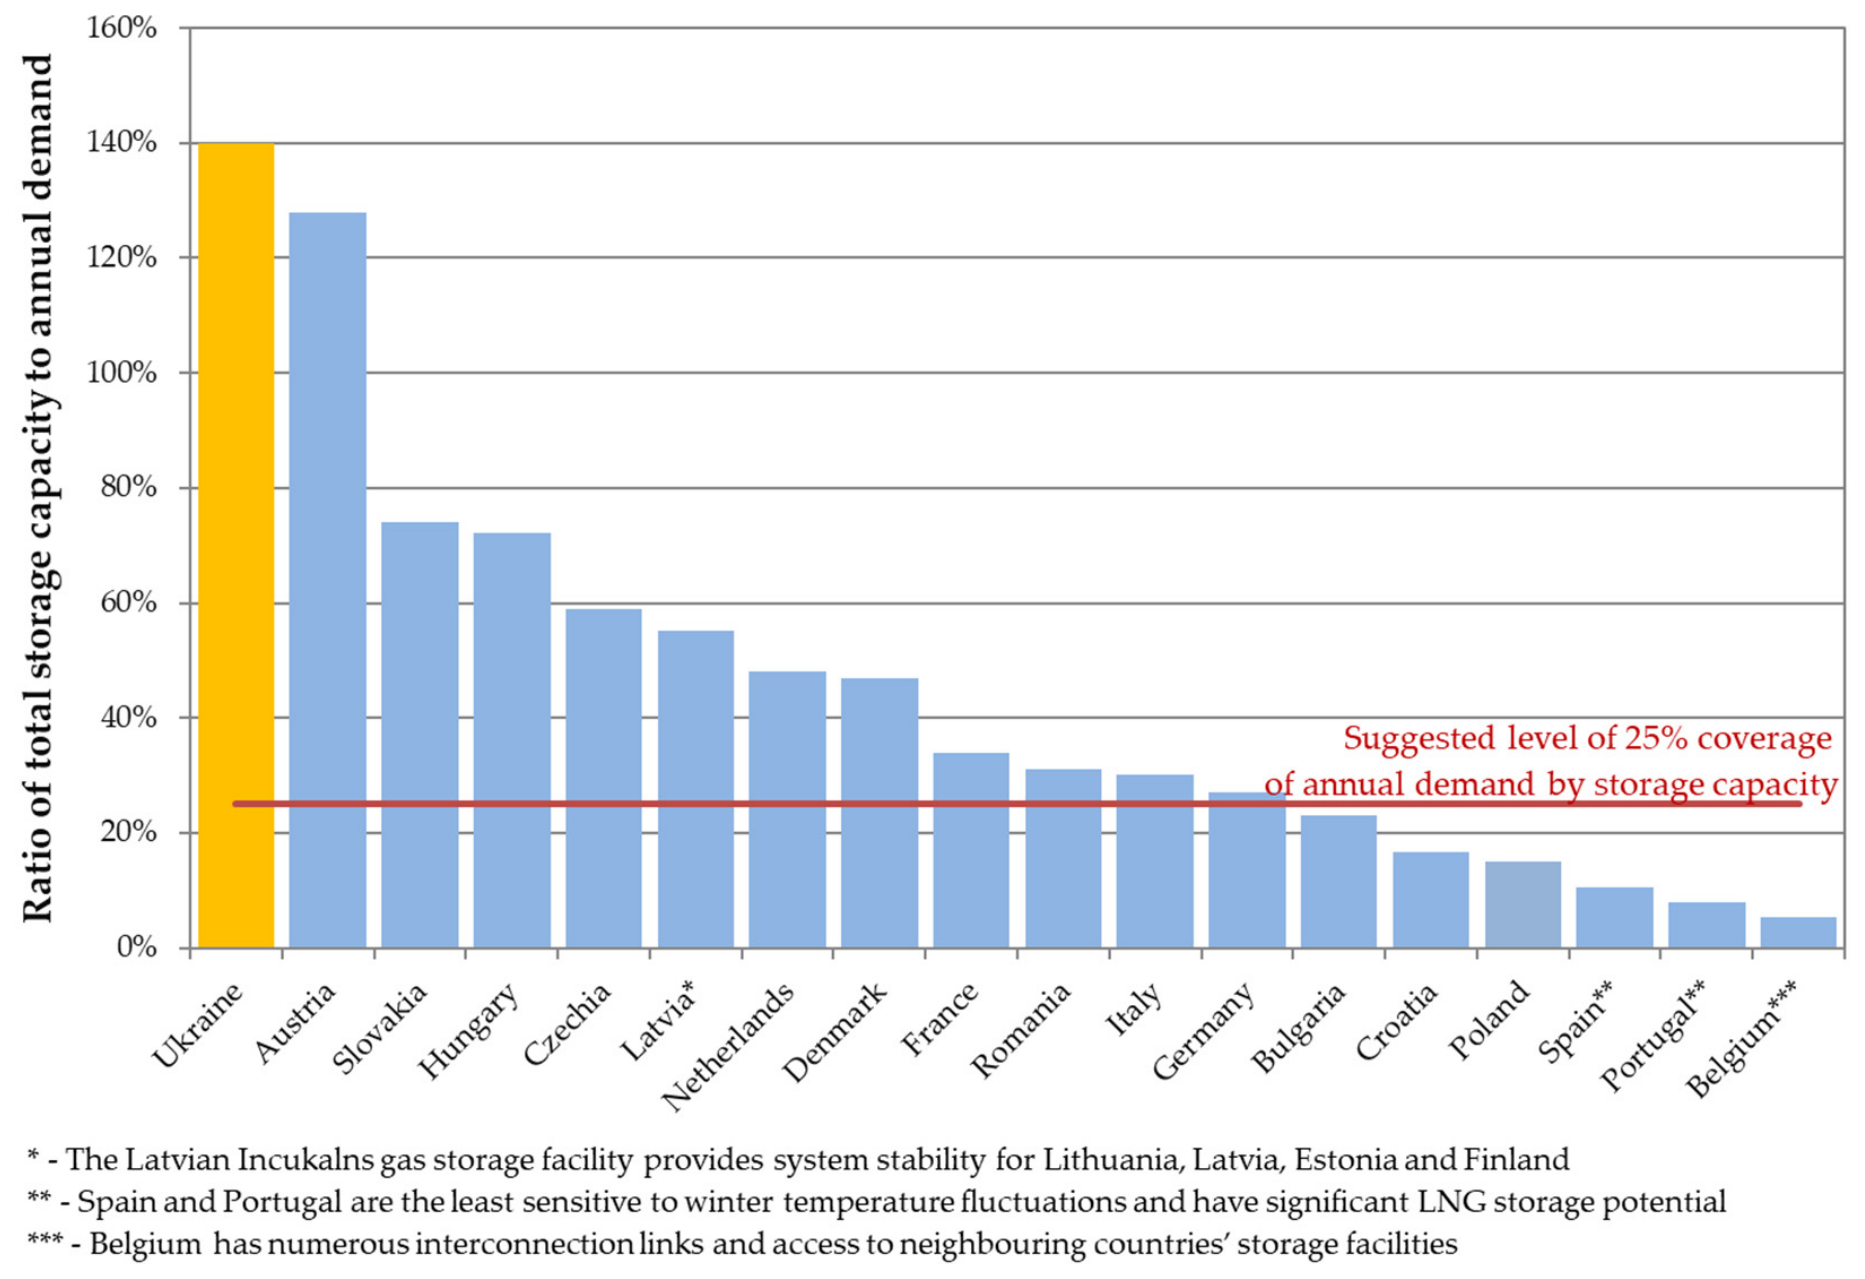
Figure 5.
Natural gas supply directions to Europe (2016-2026). Source: own study based on [17].
Figure 5.
Natural gas supply directions to Europe (2016-2026). Source: own study based on [17].
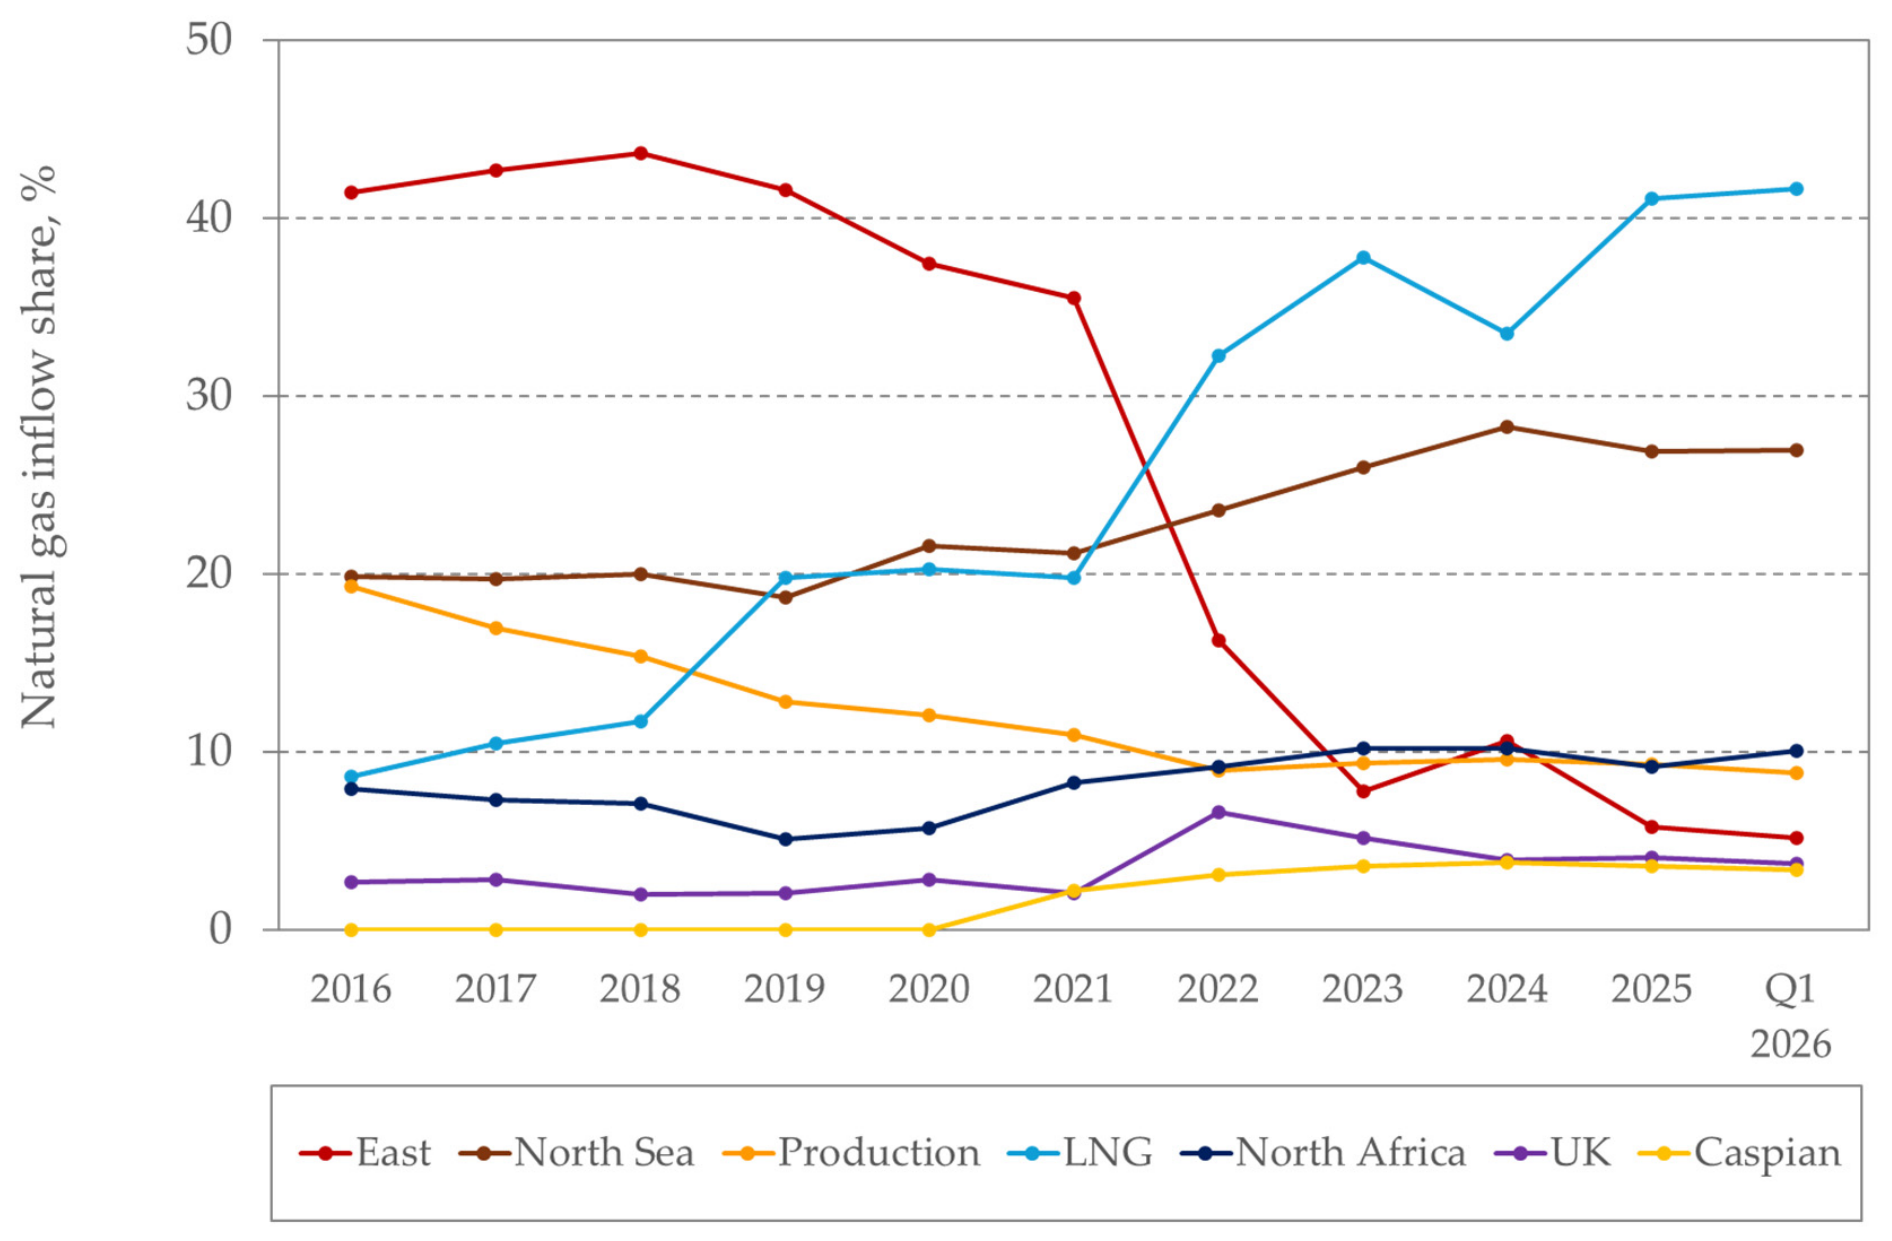
Figure 6.
Source of gas injected to the European gas network by season (2020-2026). Source: own study based on [17].
Figure 6.
Source of gas injected to the European gas network by season (2020-2026). Source: own study based on [17].
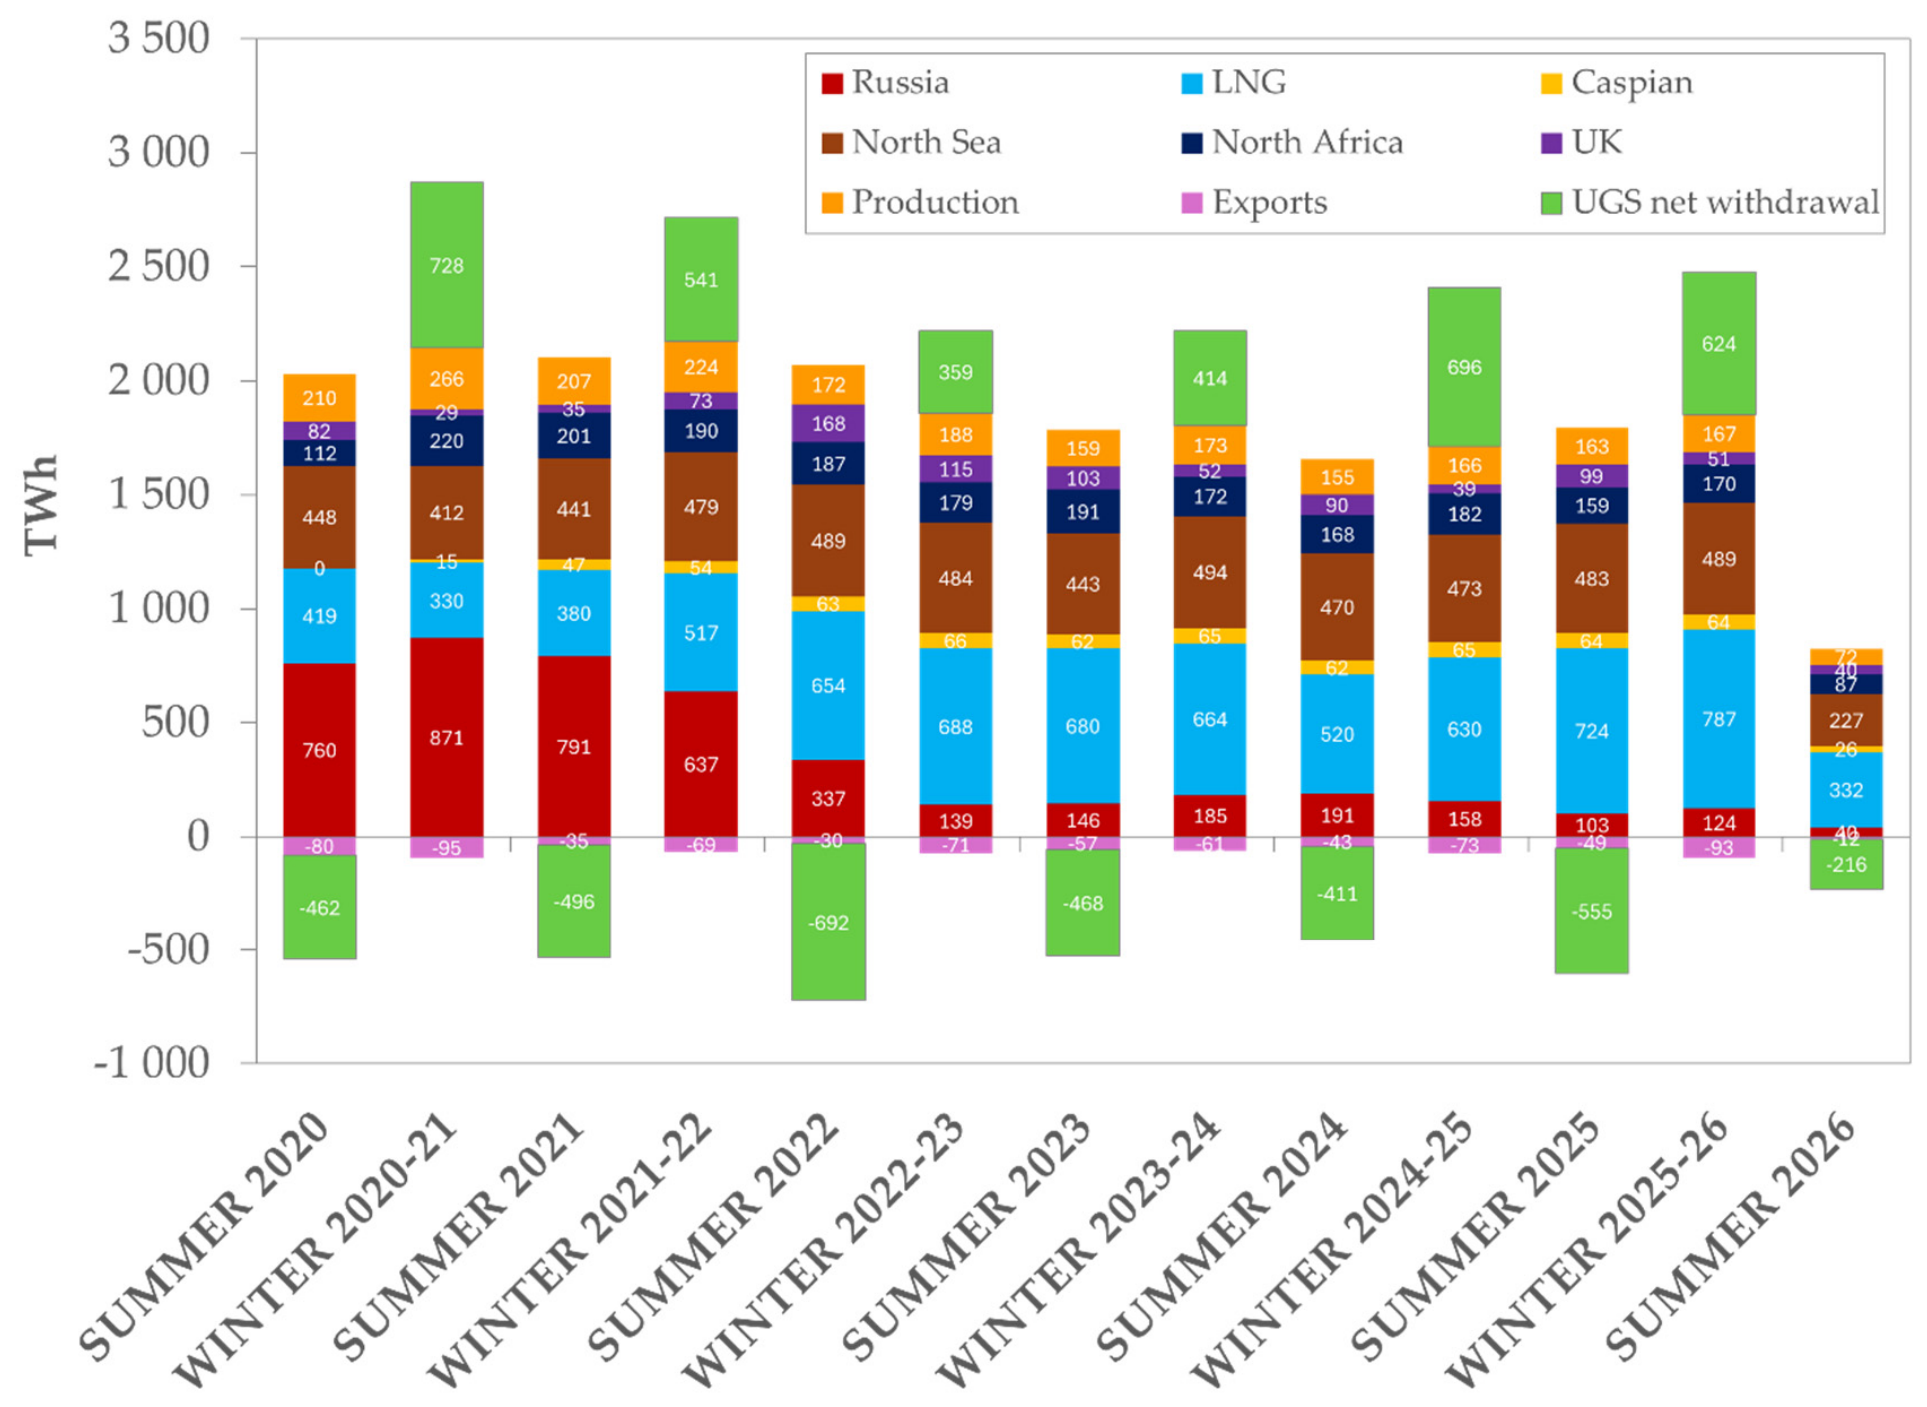
Figure 7.
Natural gas pipelines import directions in Europe (2021-2026). Source: own study based on [18].
Figure 7.
Natural gas pipelines import directions in Europe (2021-2026). Source: own study based on [18].
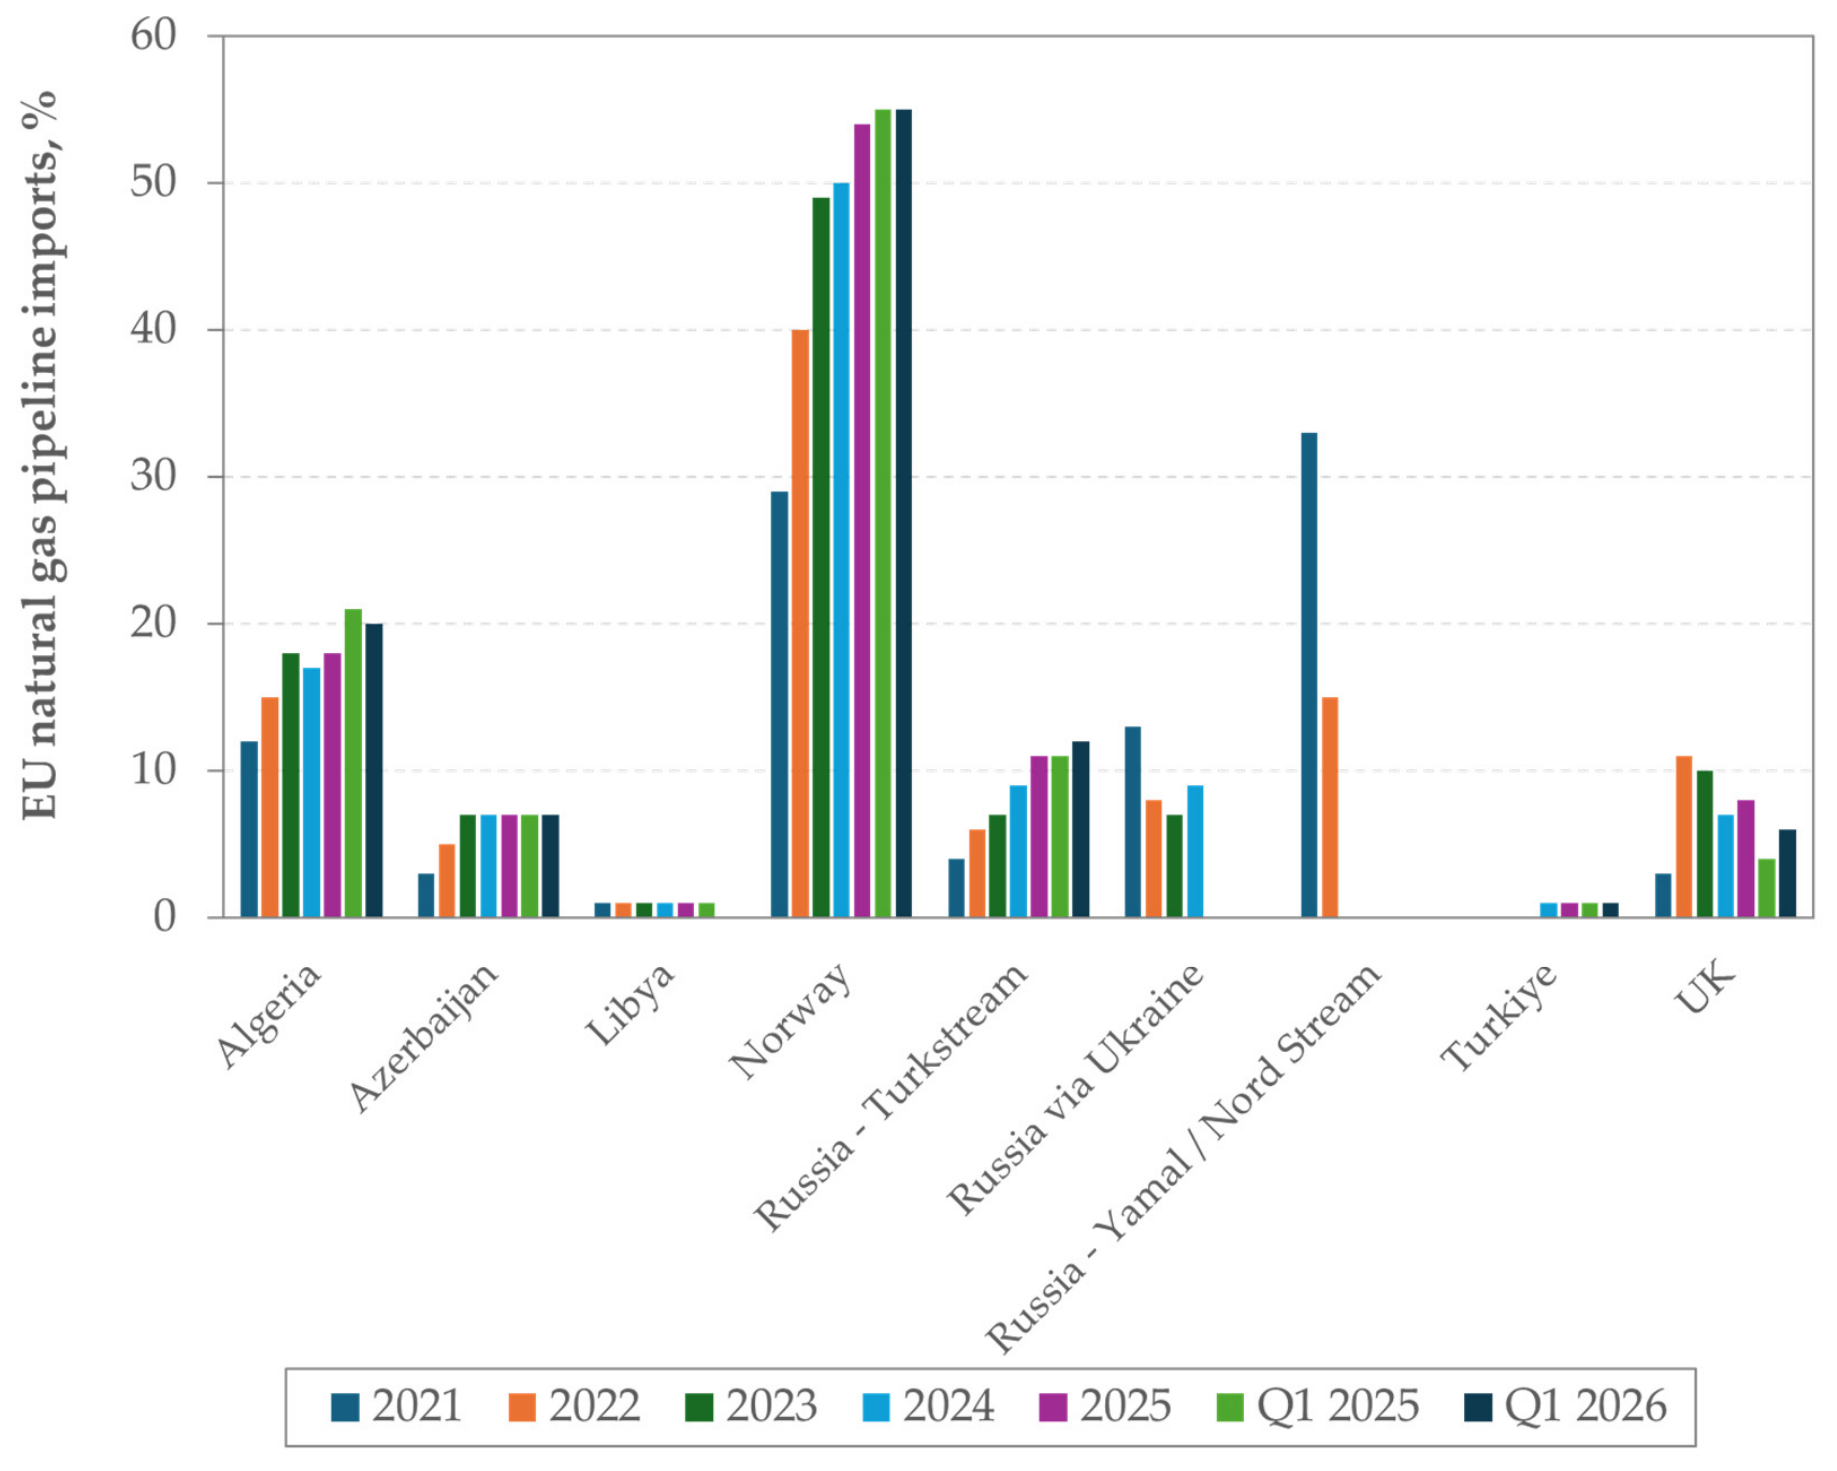
Figure 8.
Natural gas storage filling levels in EU in 2021–2023 compared with the long-term average and the range observed in 2011–2025. Source: own study based on [16].
Figure 8.
Natural gas storage filling levels in EU in 2021–2023 compared with the long-term average and the range observed in 2011–2025. Source: own study based on [16].
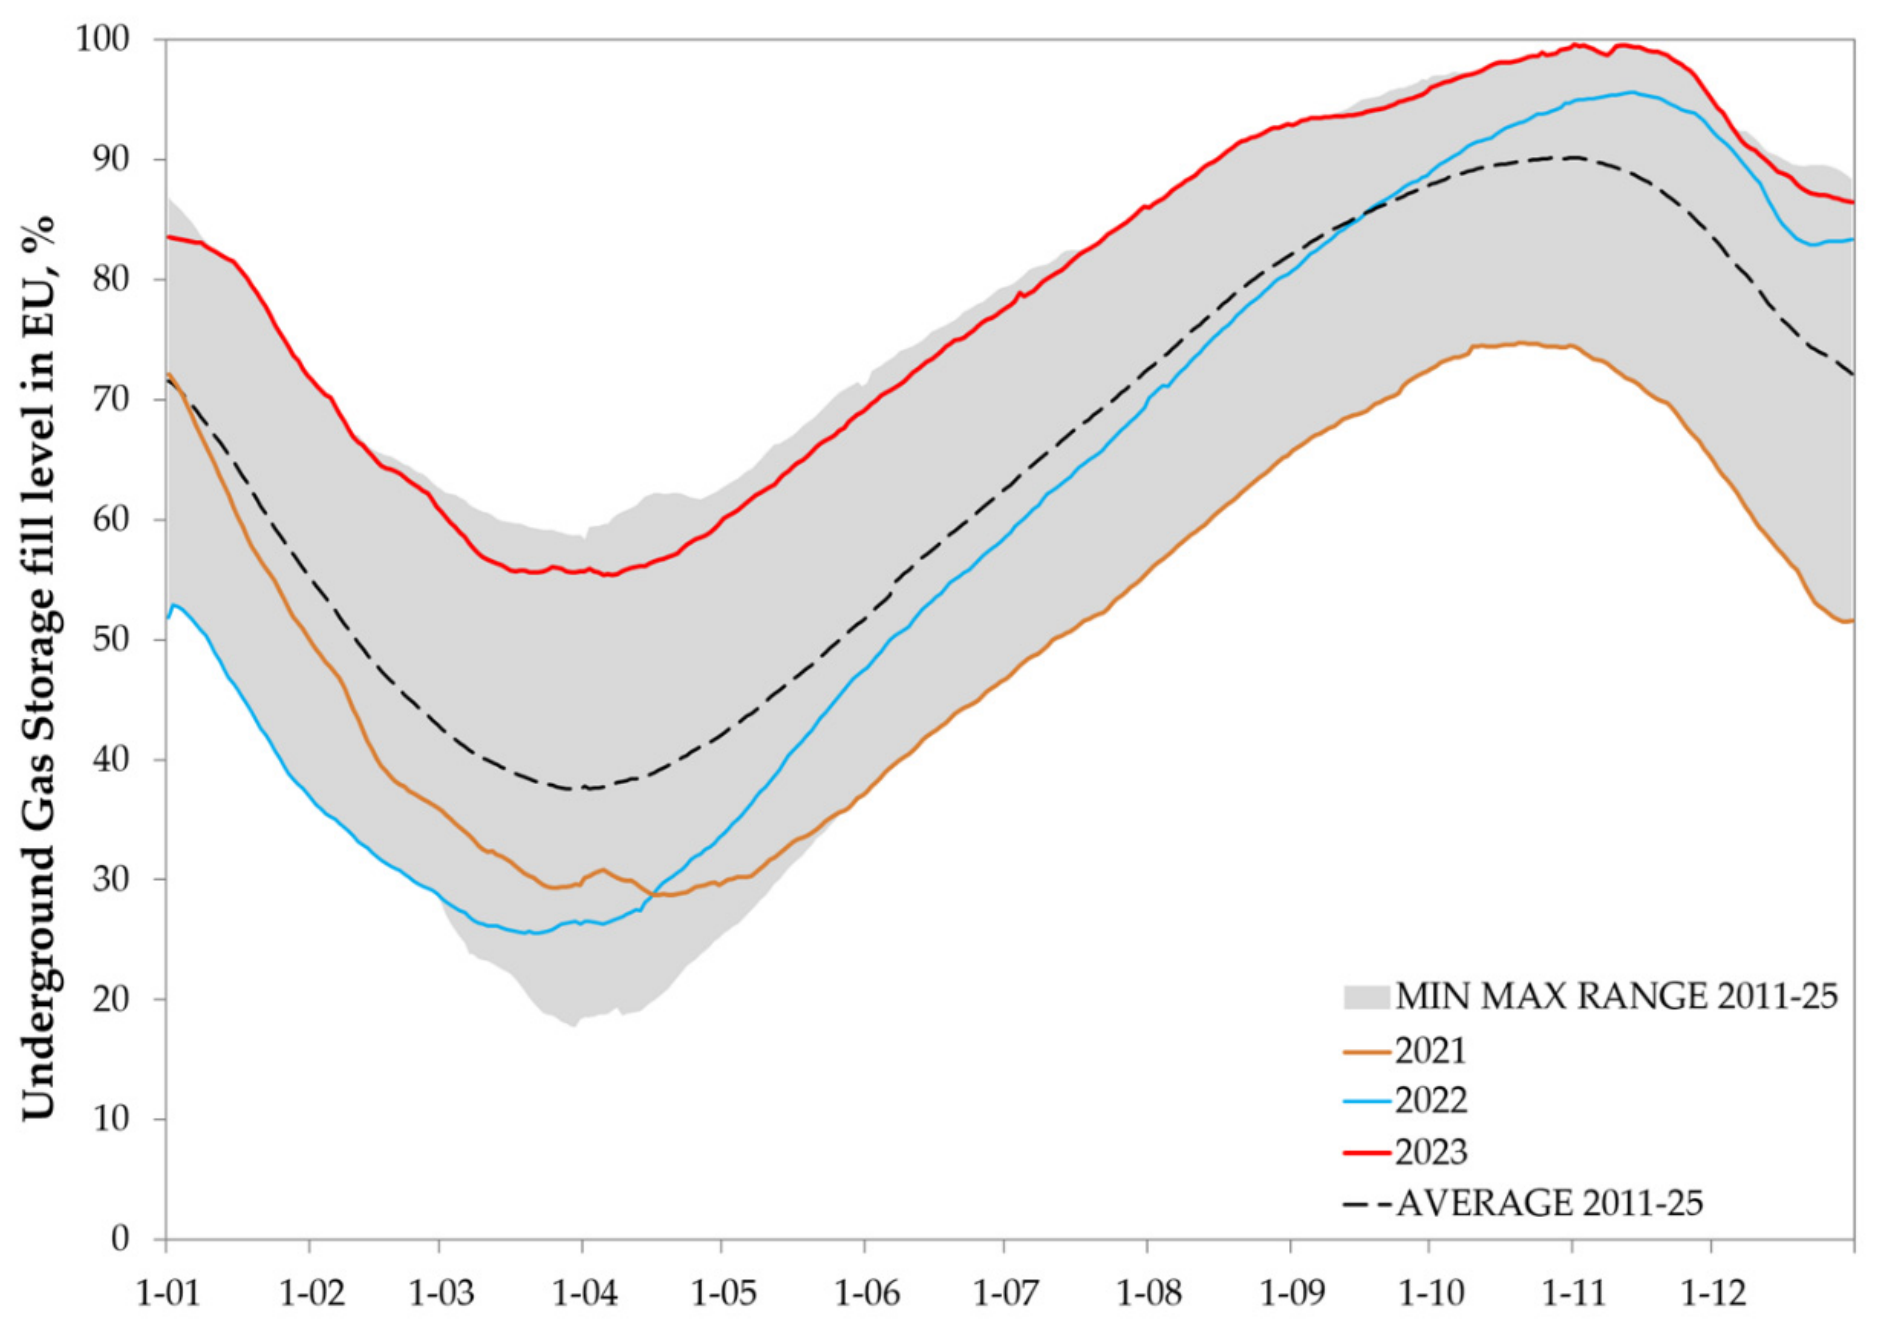
Figure 9.
Changes in the structure of gas supplies to the EU in 2021-2023. Source: own study based on [17].
Figure 9.
Changes in the structure of gas supplies to the EU in 2021-2023. Source: own study based on [17].
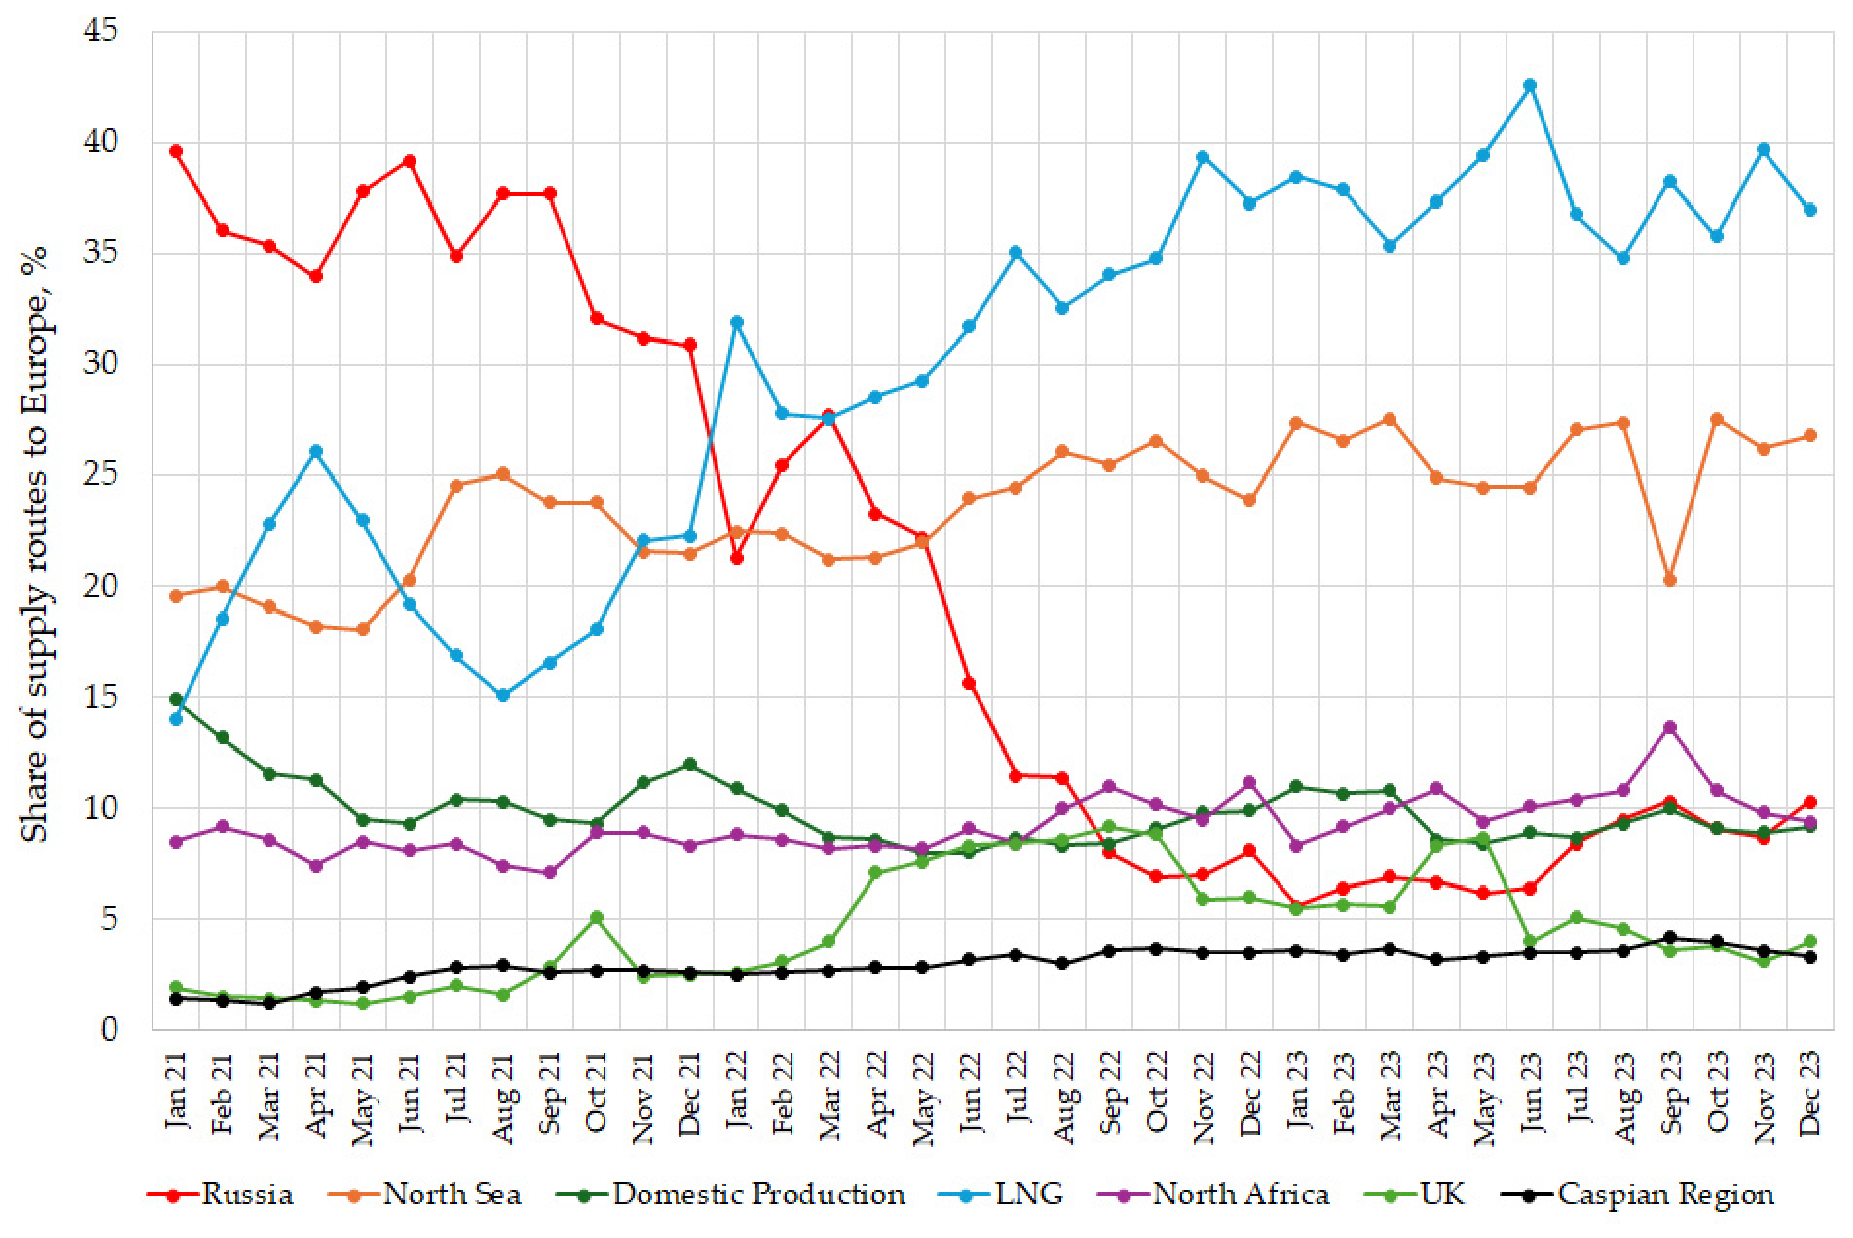
Figure 10.
Natural gas storage filling levels in Ukraine in 2022–2026. Source: own study based on [16].
Figure 10.
Natural gas storage filling levels in Ukraine in 2022–2026. Source: own study based on [16].
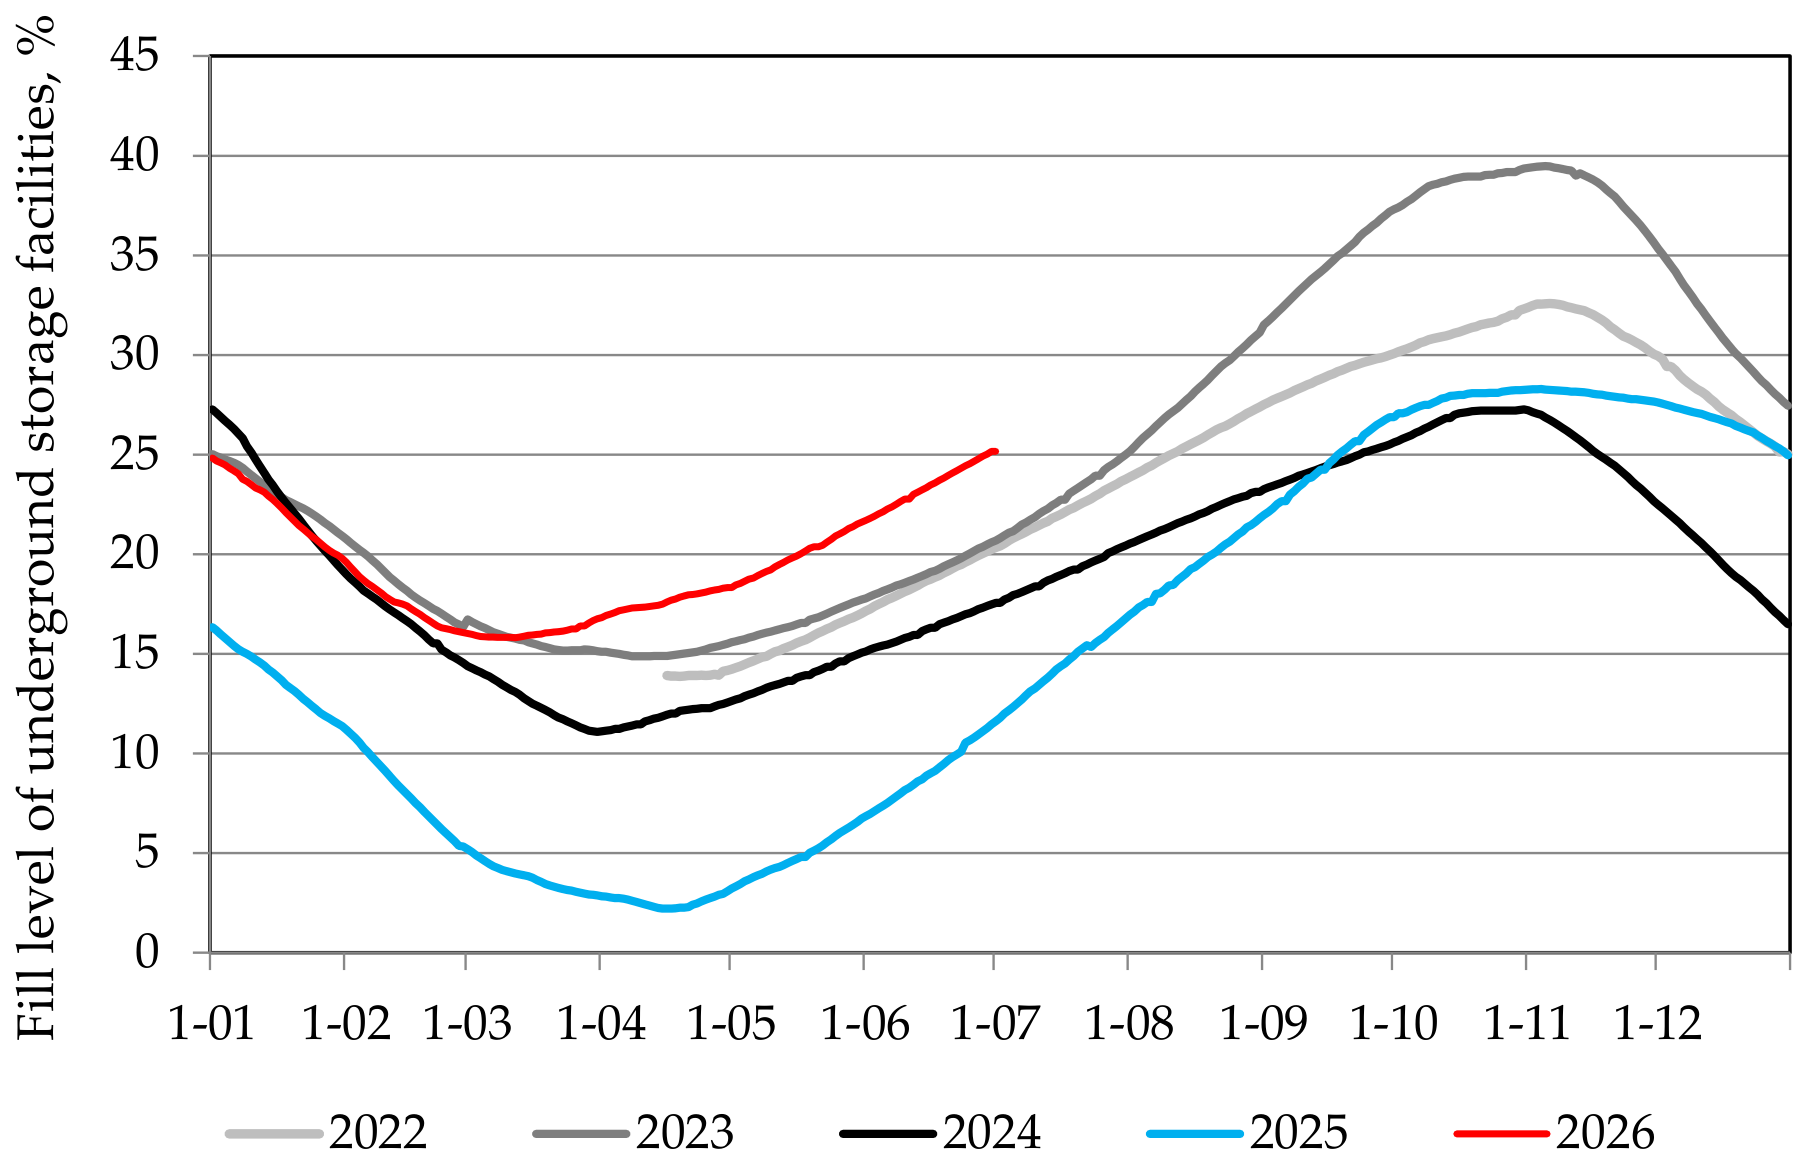
Figure 11.
Natural gas storage filling levels in EU in 2025-2026 compared with the long-term average and the range observed in 2011–2025. Source: own study based on [16,25].
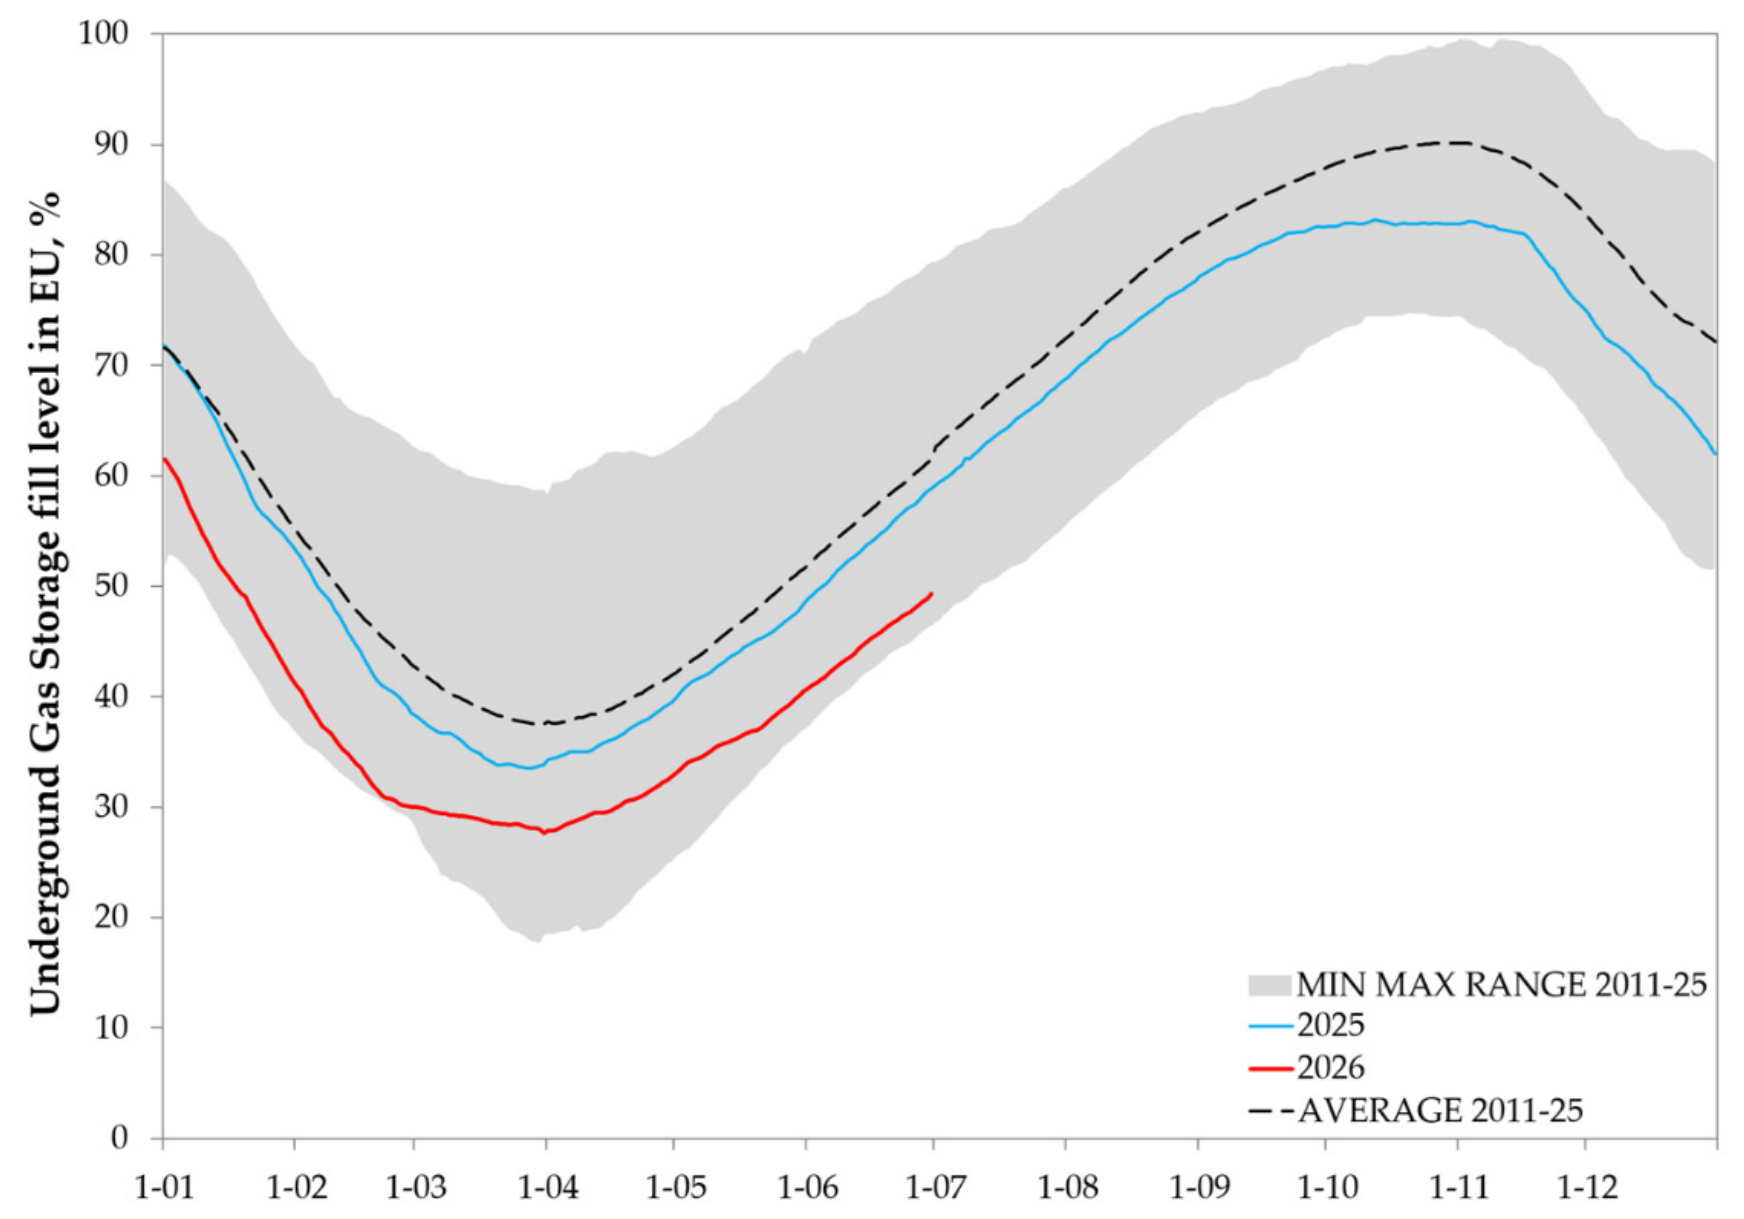
Figure 12.
Natural gas storage filling levels in Germany in 2025-2026 compared with the long-term average and the range observed in 2011–2025. Source: own study based on [16,25].
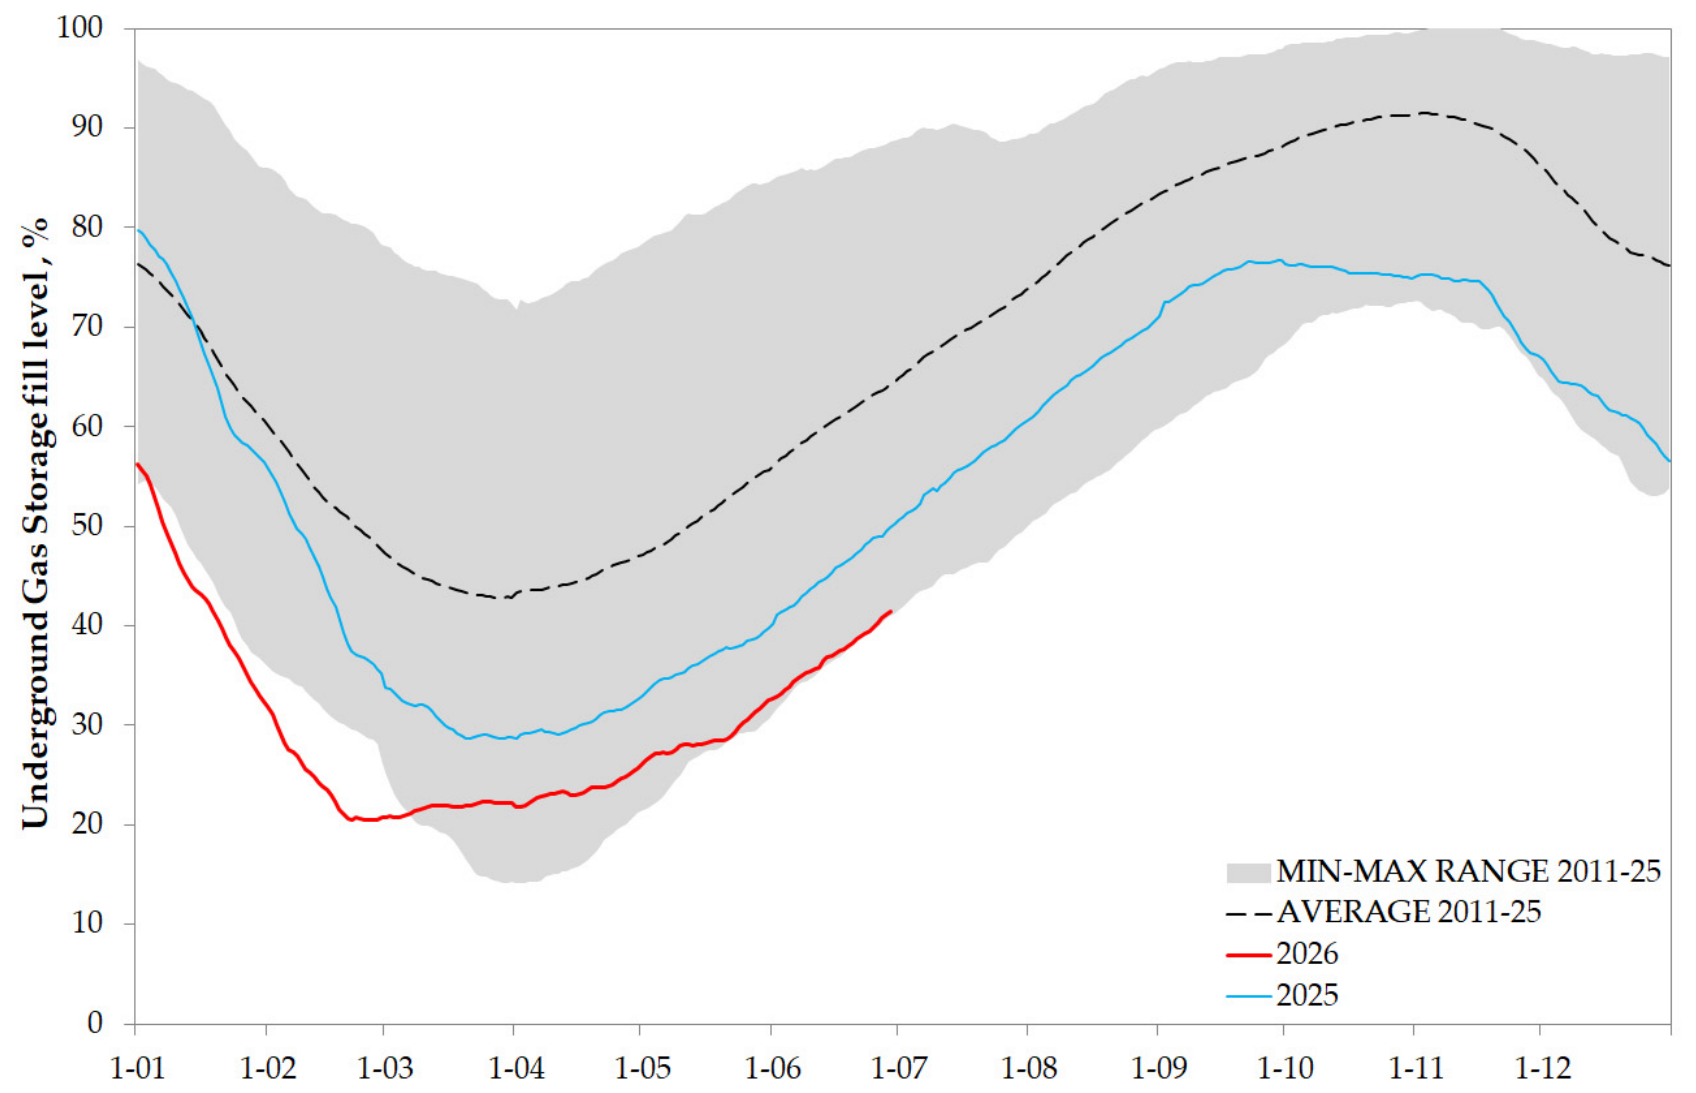
Figure 13.
Natural gas storage filling levels in Natherlands in 2025-2026 compared with the long-term average and the range observed in 2011–2025. Source: own study based on [16,25].
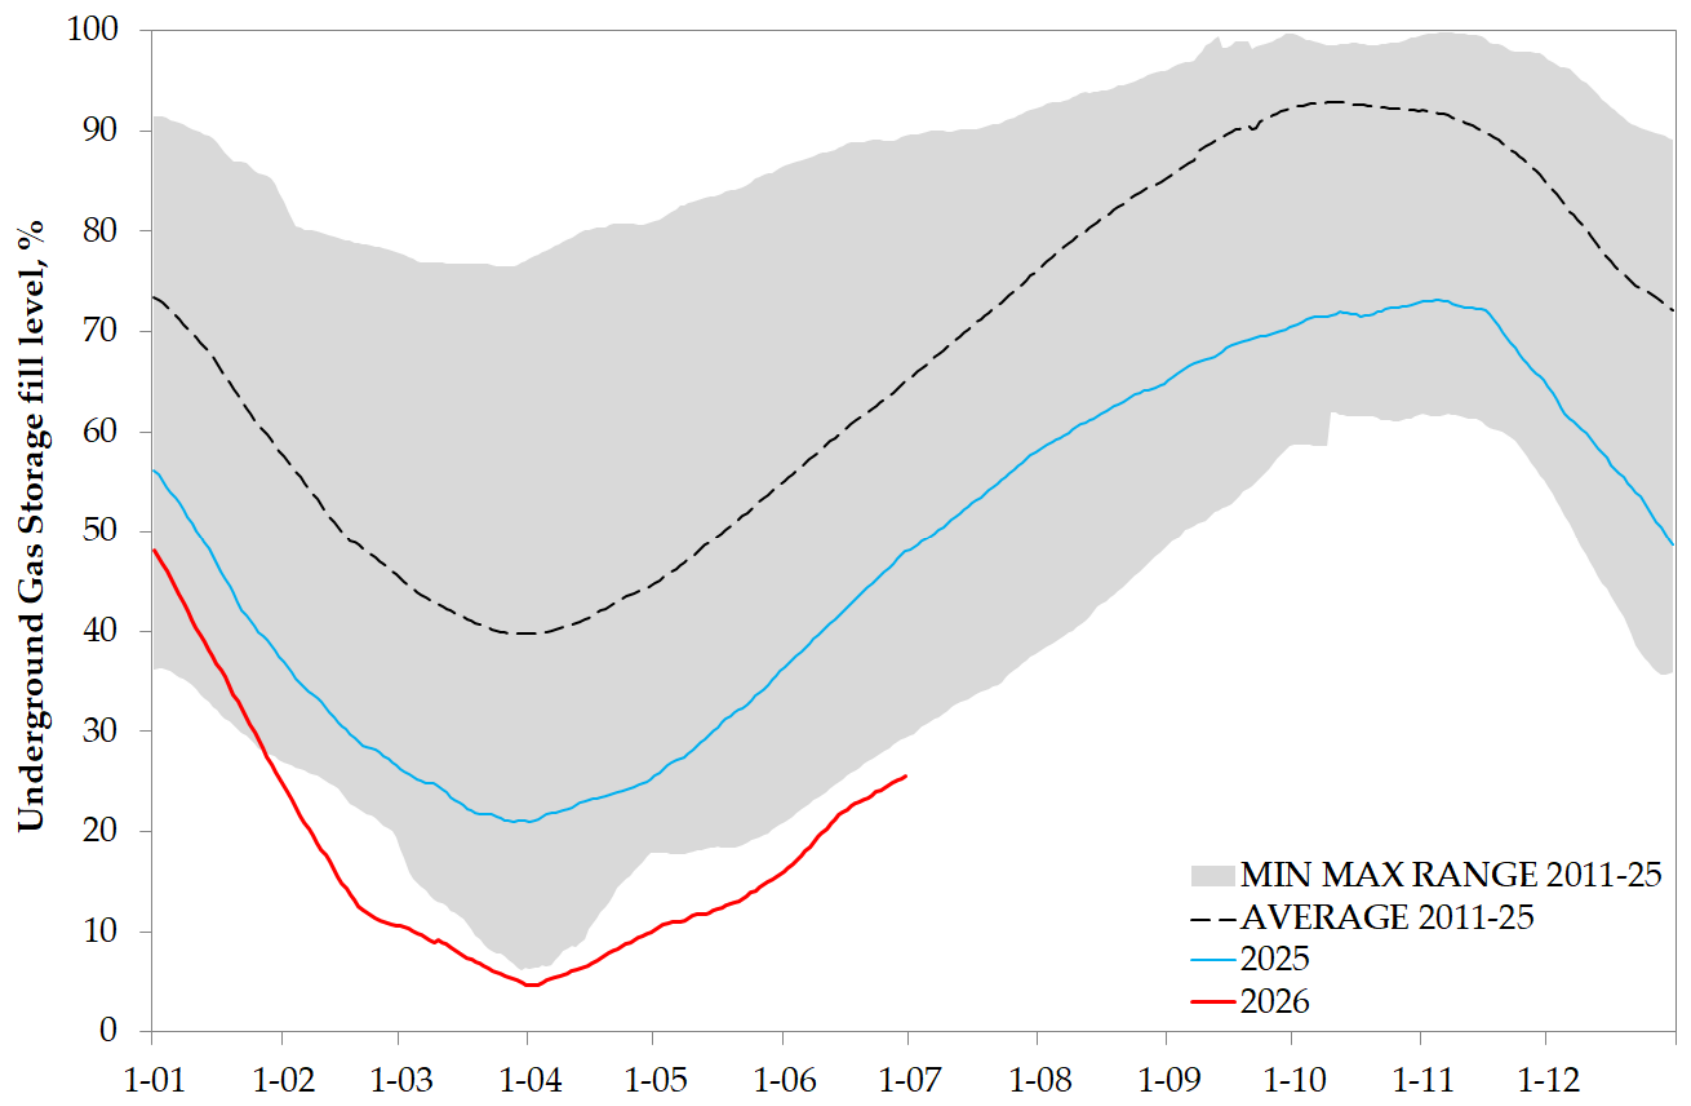

Table 1.
Number and types of underground gas storage facilities Worldwide.
| Country | Number of underground gas storage facilities | Working gas volume (billion cubic metres) | Peak withdrawal rate (million cubic metres per day) |
| USA | 403 | 138.09 | 3395 |
| Russia | 24 | 68.99 | 934 |
| Ukraine | 13 | 32.18 | 307 |
| Canada | 64 | 25.52 | 267 |
| Germany | 44 | 22.49 | 631 |
| China | 25 | 19.83 | 220 |
| Italy | 13 | 17.66 | 244 |
| Netherlands | 5 | 13.74 | 283 |
| France | 14 | 11.77 | 220 |
| Austria | 9 | 8.58 | 94 |
| Hungary | 5 | 6.10 | 72 |
| Iran | 2 | 6.00 | 29 |
| Australia | 6 | 5.90 | 27 |
| Türkiye | 2 | 5.84 | 81 |
| Azerbaijan | 2 | 4.70 | 14 |
| Uzbekistan | 3 | 4.00 | 47 |
| Czech Republic | 9 | 3.90 | 83 |
| Kazakhstan | 3 | 3.65 | 27 |
| Poland | 9 | 3.56 | 54 |
| United Arab Emirates | 6 | 3.30 | 4 |
| Slovakia | 3 | 3.23 | 45 |
| Romania | 4 | 3.17 | 32 |
| Spain | 1 | 2.41 | 21 |
| Latvia | 1 | 2.30 | 13 |
| United Kingdom | 8 | 1.74 | 119 |
| Belarus | 3 | 1.09 | 34 |
| Denmark | 2 | 0.95 | 25 |
| Belgium | 1 | 0.84 | 15 |
| Bulgaria | 1 | 0.55 | 4 |
| Serbia | 1 | 0.45 | 5 |
| Croatia | 1 | 0.44 | 6 |
| New Zealand | 1 | 0.27 | 1 |
| Japan | 3 | 0.26 | 2 |
| Portugal | 1 | 0.24 | 7 |
| Armenia | 1 | 0.16 | 6 |
| Argentina | 1 | 0.15 | 1 |
| Sweden | 1 | 0.01 | 1 |
| Total | 699 | 424.04 | 7371 |
Source: own elaboration based on [14].
Disclaimer/Publisher’s Note: The statements, opinions and data contained in all publications are solely those of the individual author(s) and contributor(s) and not of MDPI and/or the editor(s). MDPI and/or the editor(s) disclaim responsibility for any injury to people or property resulting from any ideas, methods, instructions or products referred to in the content. |
© 2026 by the authors. Licensee MDPI, Basel, Switzerland. This article is an open access article distributed under the terms and conditions of the Creative Commons Attribution (CC BY) license.
Copyright: This open access article is published under a Creative Commons CC BY 4.0 license, which permit the free download, distribution, and reuse, provided that the author and preprint are cited in any reuse.


