

Submitted:
03 July 2026
Posted:
06 July 2026
You are already at the latest version
Abstract
On July 2, 2023, a destructive two-component precipitation event occurred between O’Hare and Midway Airports in Chicago. 9 in (~225 mm) of precipitation fell over a focused region accompanying four observed mesoscale convective systems (MCS) in less than 12 hours. Three systems were quasi-linear convective systems (QLCS) that subsequently built upscale into a fourth system which exhibited many similarities to a mesoscale convective vortex (MCV). The larger scale precursor environment that organized these features included: 1) an upstream deep cold trough, 2) mid-upper tropospheric jet streak, 3) dual coupled mid-upper tropospheric potential vorticity maxima, 4) near surface west to east stationary warm boundary and deformation zone with poleward moisture advection, and 5) west-southwesterly low-level jet equatorward of that stationary boundary. As these meso-α scale systems approached the city they organized the first propagating QLCS#1 from central Illinois during the night prior to the heavy rain event. As that QLCS formed, the upper-level divergence and mid-upper tropospheric height falls migrated from the jet streak right entrance to left exit region strengthening in phase with the developing QLCS#1 thus allowing that QLCS to propagate over the city. The remnant trough accompanying this QLCS#1 subsequently was reorganized and modified by: 1) another QLCS #2 forced by the next morning’s Lake Michigan breeze convergence zone and then 2) an eastward-propagating QLCS# 3 from west-central Illinois closely coupled to the upstream cold trough. The first component of the heavy precipitation resulted from the interaction of these three QLCS followed by that precipitation system’s subsequent upscale growth into an MCS (system 4) with many characteristics consistent with a long-lasting massive MCV that controlled the second heavy precipitation component.
Keywords:
Quasi-Linear Convective System (QLCS)
; urban heat island (UHI)
; Mesoscale Convective Vortex (MCV)
; lake-breeze
; convergence
1. Introduction
The World Meteorological Organization (WMO) has for some time been saying that climate change will accelerate the water cycle in the atmosphere which has now become a widely accepted theory. Implicit in this is the concept that more global evaporation will continue to lead to increased extreme precipitation events and subsequent flash flooding [1]. Many geographical regions have experienced these extreme precipitation events in recent years, not the least of which is the Upper Mississippi River Valley watershed including northern Illinois and the Chicago Metroplex (Figure 1c) [2]. In their National Weather Service Technical Publication, Lincoln and Ford [2] expand on earlier climatological analyses of extreme rainfall events within the Chicago metroplex by analyzing several recent (since 1950) extreme flooding events to demonstrate that these extreme rainfalls exceeding 7.5 in (~187.5 mm) in a day or annual exceedance probabilities (AEP) > 1% are becoming more intense in magnitude and more frequent with less time between events. Their climatology expands on similar earlier studies of extreme precipitation in Chicago and northern Illinois by [3,4,5,6,7,8,9,10,11,12,13] and [14]. Lincoln and Ford [14] present unambiguous evidence that these events are getting stronger and more frequent when the last ~70-year period of case study analyses are inter compared to case studies in the mid-20th century. Almost all these events since the 1950’s are coupled to organized summertime mesoscale convective systems (MCS).
Of course, when analyzing extreme events in a metroplex the size of Chicago over a considerable time, consideration must also be given to forcing signals other than global such as the mesoscale impacts of the expanding metroplex and its changing surface characteristics. [15] and [16] have presented evidence based on both observations and numerical simulation sensitivity studies that indicate that the Chicago metroplex and Lake Michigan both impact on the location and intensity of rainfall maxima during the propagation of multiple QLCS over the metroplex during the warm season. These studies are not dissimilar in many ways from the evidence presented in numerous simulations of the effects of urban heat island and city mechanical forcing on precipitation all over the world (e.g., [17]). Hence, a question remains as to whether the city expansion over time as well as changes in Lake Michigan water surface temperatures are at least in part if not largely responsible for the increased intensity and frequency of contemporary extreme precipitation events in Chicago. These local effects must be evaluated as well as global climate forcing impacts when considering high impact precipitation trends in massive metroplexes like Chicago.
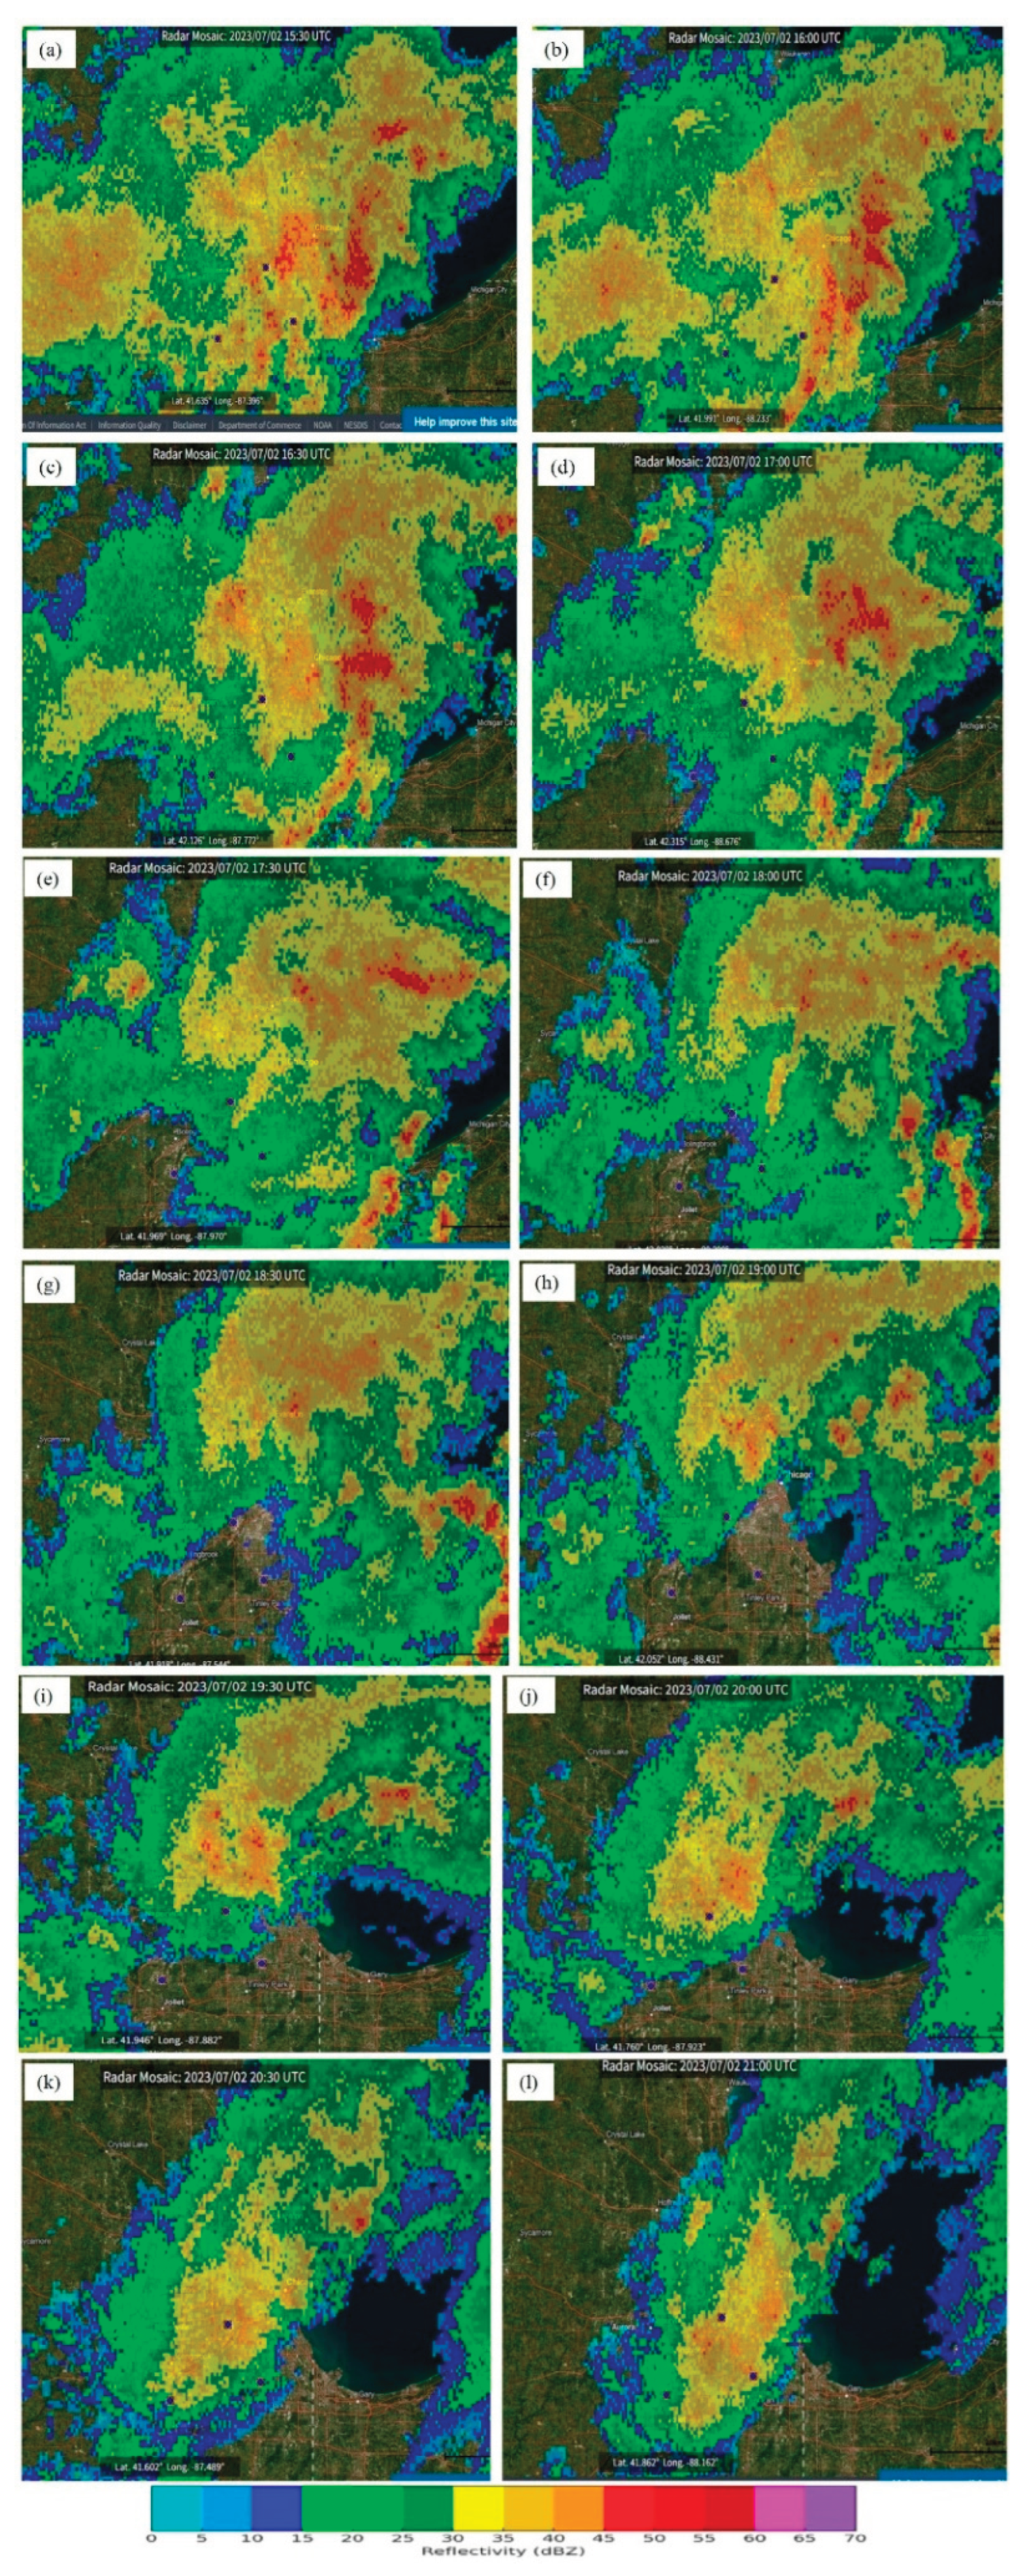
In this manuscript we analyze the 2 July 2023 flood which represented an extremely high impact event for the Chicago metroplex totaling more than $500 million in damage and flooding more than 70,000 basements [14] (Figure 1b). Remarkably, as can also be seen in Figure 1a, the total area of rainfall exceeding 7.5 in was rather isolated to the Berwyn and Cicero subdivisions where Community Research on Climate and Urban Science (CROCUS) field network observations recorded the heaviest precipitation in between Chicago’s O’Hare (KORD) and Midway (KMDW) Airports. There were two periods of heavy precipitation, one from 1030-1730 UTC (~55% of the total rainfall) and one from 1830-2130 UTC (~45% of the total rainfall) that produced the heaviest precipitation depicted in Figure 1a. The first period unambiguously accompanying multiple transient QLCSs and the second period was dominated by an upscale building mesoscale convective vortex (MCV) with a broad upstream expanding stratiform rain shield. Also evident in Figure 1a is that this small region of extreme precipitation roughly centered on the Cicero and Oak Park neighborhoods was embedded within a broader scale and much weaker northwest-southeast-banded area roughly parallel to the Lake Front which was a recurring pattern in many of the cases analyzed in [2]. Broader bands often interacted with or organized secondary orthogonal bands propagating over the metroplex from the Lake, although no two cases exhibited the same banded structures over their multi-decadal analysis of case studies. The Doppler radar observations for this 2 July 2023 case indicated that a northwest-southeast QLCS, which had several > 50 dBZ convective cells, slowly propagated southwestwards during the first earlier QLCS episode after it redeveloped near the Lake, i.e., along the Lake Michigan shoreline on the northeast side of the main downtown region. This QLCS#2, then interacted with two other squall lines, one that developed earlier from central Illinois QLCS#1 and one from western Illinois QLCS#3. Later, during the second heavy rainfall period of the building MCV, these QLCS formed a pattern that we call a “T-bone” structure, when the dying QLCS from central Illinois, the QLCS from the northeast side of the city, and the QLCS from western Illinois all phased over the metroplex near Midway Airport (KMDW). Subsequently that T-bone structure developed into a vortical structure that grew upscale with a mesoscale baroclinic leaf-like stratiform region that developed over and persisted in the isolated region of very heavy precipitation centered near Berwyn in between O’Hare Airport (KORD) and KMDW. After that, the MCV expanded greatly in scale as it propagated downstream over Lake Michigan and persisted for several more hours over and downstream from the Lake.
In the next section of this Part I manuscript, we will describe the observational data employed in the analysis. In section 3, we will analyze the precursor meso-α scale upstream environment with RUC analysis datasets and rawinsonde soundings during which the incipient QLCS is organized upstream over central Illinois. Section 4 will then involve additional upper-air analyses as well as detailed convective indices and Doppler radar analyses as well as surface meso-net analyses over the metroplex to diagnose the meso-β/γ processes that focused the development of the T-bone from the two other QLCS interacting with the remnant central Illinois QLCS over the heaviest precipitation region during the first precipitation period centered on KMDW. Section 5 will then repeat section 4’s analyses but for the transition to the MCV during the second precipitation period. We will then summarize the complex multi-scale sequence of events in Section 6 in preparation for Part II’s numerical sensitivity studies which will focus on how multiple Lake Michigan breeze fronts/convergence zones and the urban heat island play a key role in the evolution of the multiple QLCS and MCV that produced the extreme flood event of 2 July 2023.
2. Methods and Datasets
In this Part I manuscript exclusively, observed datasets have been employed to analyze both the precursor large scale environment as well as the evolution of radar and local surface processes. The larger (meso-α) scale analyses will be described employing the ERA5 reanalysis [18]. Rapid Update Cycle (RAP) 13 km datasets were employed for soundings over Chicago at Midway Airport KMDW) [19]. Additionally, RAP derived stability and kinematic fields were extracted from the Storm Prediction Center’s RAP archive [20]. Upper air soundings at Lincoln, Illinois (KILX) were extracted from the University of Wyoming active radiosonde archive website [21]. Surface analyses were constructed over the Chicago metroplex including buoy data over Lake Michigan from the Mesowest dataset [22] comprised primarily of airport stations (Table 1). Doppler radar datasets were extracted from the NOAA NCEI Doppler Radar Archive [23]. Additional fields were extracted from the Plymouth State Weather Center Archives [24].
3. Meso-α Scale Precursor to the Chicago Heavy Rainfall Environment
3.1. Upper Tropospheric QLCS Precursors (0000 UTC-0900 UTC)
The mid-upper tropospheric meso-α scale flow on and immediately after 0000Z 2 July 2023 (00Z7/2) was dominated by unusually strong (for mid-summer) dual mid-upper tropospheric isobaric layer PV maxima, a jet streak, a mid-continental baroclinic trough, and a mid-level cold pool as depicted in the three-hourly fields extending to 09Z7/2 in Figure 2, Figure 3, Figure 4 and Figure 5, respectively. The broad trough axis initially over the Central Plains propagates east-northeastwards into the Mississippi River Valley by 06Z7/2 (Figure 2). The jet streak propagates with the trough and has a stretched out dual maxima of mid-upper tropospheric isobaric layer PV with the upstream trough PV maximum at 02Z7/2 in eastern Kansas (Figure 2a-b) being stronger than in the jet’s left exit region maximum early on. However, in time the downstream left exit region PV strengthens into an elongated narrow filament over eastern Missouri and western/central Illinois as can be seen in the 06Z7/2-09Z7/2 increase in mid-upper tropospheric positive horizontal PV advection just south-southeast of Chicago in Figure 2c-d. The jet contains upward vertical motion maxima (Figure 4a-b) roughly in sync with the 300 hPa divergence maxima (Figure 3a-b) extending from the trough axis downstream to the left exit region and right entrance region over Missouri and western Illinois and southeastern Illinois, respectively early on. However, like the PV, the ascent maximum shifts from the right entrance to the left exit region in time and builds downstream towards Chicago and northern Illinois in sync with the shift in divergence and mid-tropospheric height falls and oriented roughly west to east like the convective trend in Figure 5c-e (Figure 3c-d, Figure 4c-d, and Figure 6a-d). This ascent field ultimately will have embedded within it dual maxima roughly in phase with the dual maxima in PV. One with the upstream trough and one with the PV filament extending to the jet’s left exit region. As shown in Figure 5, active MCSs over Iowa, Missouri, and Illinois are roughly coincident with the larger scale jet-induced dual ascending regions under the right entrance and left exit regions during the period between 03Z7/2 and 09Z7/2 in Figure 4. It is the jet’s right entrance region with significant sub-geostrophic curved flow (Figure 3a-b and Figure 4a-b) that represents the more critical organizing circulation for the first MCS early in this period over southern and central Illinois that subsequently becomes the QLCS#1 over central Illinois on or before 06Z7/2 that will ultimately affect Chicago during the precursor period to the extreme precipitation event before 12Z7/2 as that QLCS strengthens under the left exit region (Figure 5a-f).
After this early period of right entrance region lift before 06Z7/2, the left exit region ascent is more directly coupled to the QLCS as it moves poleward through Illinois. Also, while the core of the mid-tropospheric PV maximum is closely coupled to the trough, an expanding filament is clearly apparent extending into the jet’s left exit region as the main QLCS is strengthened over central Illinois between 06Z7/2 and 09Z7/2 in Figure 5. This dual maxima of PV will be mirrored in the ascent and divergence fields as time progresses during the first precipitation event. Also, as can be seen in Figure 3 and Figure 4 after 06Z7/2, the divergence and upward motion migrate towards the left exit region as the combined streak and trough approach northern Illinois. At 09Z7/2 the trough extends into northern Illinois accompanying significant 300 and 500 hPa height falls with the 500 hPa deepening trough and vortical shear pattern extending into northern Illinois accompanying strong mid-tropospheric cooling across the same region between 06Z7/2 and 09Z7/2 in Figure 6c-d. Additionally, there is accompanying convective outflow, as diagnosed from the diffluent and leftward-directed ageostrophic flow after 03Z7/2, which can be seen approaching northern Illinois in sync with the main QLCS band primarily in Figure 4c. This convectively enhanced jet exit region circulation shifts divergence and ascent into the region just equatorward and west of Chicago by this period, i.e., primarily between 06Z7/2 and 09Z7/2. Note the splitting tendency in the PV advection maxima in Figure 2b-d. This splitting signal will ultimately play a key role in the proliferation of multiple QLCS that comprise a “T-bone” convective structure centered near KMDW during the first heavy precipitation period.
3.2. Lower Tropospheric QLCS Precursors (0000 UTC – 0900 UTC)
During this 0000 UTC - 0900 UTC period, the transition of upper-tropospheric divergence, ascent, and lower-mid-tropospheric cooling from the jet streak’s right entrance to left exit region is in phase with and coupled to the movement of the 700 and 850 hPa low pressure center’s location from the central Iowa-Missouri border to over northern Illinois (note Figure 2 and Figure 3, Figure 7 and Figure 8). As this occurs, two prominent signals can be seen establishing a favorable environment for the strengthening of the QLCS#1 and it’s organization into a well-organized squall line propagating towards Chicago from south central Illinois. First, in Figure 7a,d at 700 hPa and 8a and d at 850 hPa, one sees the significant low-level west-southwesterly jet accelerating from ~20 to 30 ms−1 and ~15 to ~25 ms−1 maximum values, respectively, and extending poleward and downstream from southern and central Missouri to the southern and central portions of Illinois during 00Z7/2 through 09Z7/2. This strengthens the thermal/shear boundary and shearing/confluent deformation zone in Figure 8 and Figure 9 across central Illinois in sync with the upper divergence as it shifts north-northwestwards across the jet streak exit region above the region of lowering heights which are propagating into northern Illinois after 06Z7/2 at all tropospheric levels. That 700-850 hPa jet is also in proximity to the warm front across the south-central Illinois, which is very much aligned with shearing deformation, in particular, as the meridional gradient of the u wind velocity component is significant in this location.
This prominent lower tropospheric deformation zone, which is progressively more confluent as one descends, is largely derivative of very warm continental tropical air that was advected downslope into the Central and Southern Plains prior to 00Z7/2 thus creating the mass perturbation that organized the low-level jet accelerations, i.e., the lee trough meridional height gradient upstream over western Kansas and Nebraska and its attendant accelerating west-southwesterly low-level flow. Dry hot air advected into the upstream portion of this feature (note the 700-850 hPa meridional temperature boundary across central Missouri and central Illinois) and the moist Gulf of Mexico air advected first around its eastern periphery and then westward as well as poleward of the deformation zone both propagate in tandem polewards towards north central Illinois as can be seen in the lower tropospheric temperatures in Figure 8 a-d and precipitable water and water vapor flux vectors in Figure 9a, c, e, and g and b, d, f, and h, respectively. The meridional confluence near the surface in Figure 9b, d, f, and g’s streamline fields and meridional shear of the zonal wind component in the 700 hPa-850 hPa layer in Figure 8a-d are both centered over central Illinois and are consistent with a confluent and shearing deformation zone supporting the warm frontal boundary. This gradual strengthening of the meridional-zonal shears within the surface to 850 hPa layer occurs as the increasing ascent also occurs downstream over north central Illinois which is shifting to the northwest side of the jet exit region (Figure 4c-d). These processes cool the air in the mid-lower troposphere across Iowa and northern Illinois thus maintaining the deep column height falls which are approaching the Chicago metroplex by 09Z/7/2 in the form of a closed low in the height field quite evident in Figure 6a-d. Consistent with these upper air adjustments, also depicted in Figure 8e-h, notice the west-east expansion of 1000 hPa height falls that begin in south central Illinois at ~03Z7/2 and move poleward to northern Illinois including the Chicago metroplex by ~09Z7/2 in Figure 8e-h both poleward of a strengthening west-southwesterly low-level jet and equatorward of entrenched north-northeasterly low level flow over north central Illinois. The evolution of this strengthening west-east lower tropospheric trough, broad/large scale thermal structure including the warm frontal boundary at 700 hPa and below, and predominantly meridional convergence zone support the concept that the QLCS#1 development and propagation are likely reflective of the aforementioned deep mass and momentum adjustments as opposed to local earlier preexisting MCS outflow boundaries from the flanking early convective features depicted in Figure 5a-b in eastern Iowa and southwestern Indiana.
By 09Z7/2 in Figure 8d and Figure 9g-h, the meridional shear of the zonal wind component and low-mid-tropospheric closed low have both moved just equatorward and southwest of Chicago, respectively. The west-east line of convection shown in the Doppler radar imagery in Figure 5c-f represents the QLCS#1 which is strengthening as it approaches the Chicago metroplex by 07Z7/2. In Figure 9i-l, 1) the strengthening of the mesoscale surface trough noted in Figure 8 in time is proximate to the 2) the surface confluence zone evident in the streamline field, and 3) the organizing zonally oriented precipitable water maximum. All of these features are in proximity to the central Illinois deformation zone on the equatorward side of that closed surface low pressure in Figure 9g-h and are also near to the mid-lower tropospheric cooling across north central Illinois in Figure 7 and Figure 8 after 06Z7/2. In Figure 9g-h this moisture and surface confluence feature is beginning to rotate cyclonically, establishing a more southwest-northeast confluent structure at the surface. Hence a plume of very substantial moisture is becoming collocated with cooling aloft along the deformation zone in central Illinois which is the location of the west-east elongating QLCS#1 depicted in Figure 5c-e between 04Z7/2 and 06Z7/2 as this first of three QLCS strengthens and propagates towards Chicago.
3.3. QLCS Precursor Convective Environment (0000Z-0900Z)
Consistent with these dynamical and thermodynamical adjustments is the early QLCS#1 evolution of the convective environment from 0000 UTC - 0900 UTC depicted in Figure 5a-f. The developing line of convection reflects the dynamical sequence described earlier and inferred from Figure 2, Figure 3 and Figure 4 and Figure 6, Figure 7, Figure 8 and Figure 9. Figure 10 indicates that both the Lincoln, IL (ILX) 00Z7/2 sounding and the RAP surface based (SBCAPE) as well as most unstable convective available potential energy (MUCAPE) are already significant but not extraordinarily high, i.e., >1000 JKg−1 over central Illinois at 00Z7/2. A key feature in the ILX sounding is the deep well-mixed (adiabatic) layer between 700 and 850 hPa indicating the transport of dry air from the southern Plains by the low-level jet under the mid-tropospheric cooling in the upper jet’s entrance region that ultimately shifts to that jet’s exit region by 06Z7/2. At that time a well-organized west-east line of convection can be seen consolidating over north central Illinois, northeastern Missouri, and northwestern Indiana from the earlier upstream multiple MCS flanking the upper-tropospheric jet in its left exit and right entrance regions in Figure 5e-f. The location is very closely aligned with the lower tropospheric confluent deformation zone, developing 1000 hPa trough, and moist tongue depicted in Figure 8 and Figure 9 as well as the transitioning/increasing upper-tropospheric divergence and ascent in the jet’s left exit region as height falls occur over northern Illinois after 06Z7/2 in Figure 2, Figure 3 and Figure 4 and Figure 6, Figure 7 and Figure 8. Between 06Z7/2 and 07Z7/2 the line enters the equatorward side of the Chicago metroplex as the previously very strong reflectivity cores weaken (Figure 5f and Figure 11d).
Over the city, in Figure 9i-j, after mean sea level pressure falls followed by rises between 00Z7/2 and 06Z7/2 reflecting: 1) a dying line of convection producing rises and cooling over the city followed by 2) a somewhat delayed inland penetration of cool Lake Michigan air and a shift at most locations to northeasterly airflow during the typical summertime late afternoon lake breeze penetration inland, pressure falls reflecting the poleward motion of QLCS#1 can be seen during the 06Z7/2 to 09Z7/2 period as well as surface nocturnal cooling and the development of south-southeasterly flow building poleward through the metroplex (Figure 9k-l). Note the zonally oriented meso-trough over the city in Figure 9i-j. Also evident in Figure 9m-n and consistent with the Figure 5 radars in e-f) is the transition from relatively dry surface air over the southern part of the Chicago metroplex to a zonally oriented line of saturated surface air with increasing surface dewpoints as convection arrives. This is also consistent with the shift of the divergence aloft poleward to the jet’s left exit region as the QLCS#1 moves into and initially weakens as it interacts with the drier environment over the city. Between 06Z7/2 and 9Z7/2 in Figure 9k-l can be seen the development of a confluence zone over the city to match the preceding mean sea level pressure falls, meso-low, and moistening development as the northeasterly flow along the lake front starts to penetrate back southwestwards and converge with the southerly flow near the center and south of the metroplex. This urban convergence is in phase with the shift in upper tropospheric divergence poleward in the jet’s left exit region which organizes the regeneration of convection after 12Z7/2 further northeast leading to QLCS#2. At that time the confluent flow over the city replaces the previous 00Z7/2 surface ridging as the late afternoon lake breeze subsequently propagates across the metroplex.
3.4. Temporary Weakening of the QLCS Over the City (0700 UTC–1000 UTC)
Shortly after the line of convection accompanying the west-east oriented and poleward propagating QLCS#1 crosses over the city it splits apart. Figure 11d-f depict the collapse of convection during this 07Z7/2-10Z7/2 period as the middle of the QLCS#1 dissipates over the city. However the low pressure accompanying that line will serve as a residule feature important for subsequent convective strengthening shortly after this period when QLCS#2 begins propagating towards the city. Thus QLCS#1 does not directly contribute to the first period of heavy precipitation but does so indirectly by creating surface pressure falls, confluence, and moistening prior to the arrival of QLCS#2 shortly thereafter and subsequent to the arrival of QLCS#3 that merge to organize the first period of heavy precipitation. During the weakening of QLCS#1 the RAP soundings in Figure 11a-c at 06Z7/2-12Z7/2 indicate that over KMDW, which should be representative of much of the city at the meso-β scale, a state of somewhat drier sub saturation exists in the column as the QLCS#1 approached the city with mostly veering south-southwesterly column airflow and a very shallow layer of near-surface southeasterly flow. This vertical wind shear is consistent with mid-tropospheric geostrophic warm air advection early on that transitions to cool air advection, particularly in the lower troposphere, as backing occurs at low levels with the later arrival of the cold closed low aloft (Figure 13a). Between 06Z7/2 and 12Z7/2 there is net cooling below 600 hPa as the easterly wind component builds almost to that level and the mid-tropospheric westerly component slowly diminishes. This reflects the arrival of the deep cold vortex across northern Illinois (Figure 13a). It also reflects the transport of cooler air inland and diffluent near surface airflow from Lake Michigan stabilizing and moistening the environment at low levels below 650 hPa while MUCAPE increases aloft above 650 hPa also inferred from Figure 9k,l with onshore flow over the city. Thus, one sees a general moistening of and elevated destabilization of the column by 12Z7/2 indicating that the sub saturation which weakened the QLCS#1 after 06Z7/2 is transitioning back to a more favorable moist column for regeneration of convection due to the larger scale closed low arrival and immediately prior to the southwestward propagation of QLCS#2 between 11Z7/2 and 13Z7/2 as can be seen in Figure 15 early radars. This redevelopment of convection over the city is also consistent with the maximum in precipitable water with the west-east low-level deformation zone in Figure 9f,g arriving over Chicago at this time, i.e., by ~09Z7/2 - 12Z7/2. Hence the environment that favored short-term QLCS weakening changes and favors convective regeneration after 11Z7/2.
4. QLCS#2 -3 and T-Bone Squall Line Development Leading to the First Period of Heavy Precipitation Forcing
4.1. Upper Tropospheric Forcing (1200Z-1500Z)
The key period for the shift and rapid intensification of convection as shown on radar across north central Illinois and primarily over the Chicago metroplex is 11Z7/2 – 13Z7/2 as will be shown in the radar evolution later in this section as well as the surface confluence within the area near KMDW in Figure 14 and Figure 15. This time period of convective intensification is emblematic of the sounding in Figure 11c indicating mid-lower tropospheric moistening after 09Z7/2. Between 12Z7/2 and 15Z7/2 the column saturates up to 500 hPa and the wind becomes nearly calm throughout the entire column consistent with an environment likely to support an MCV [24,25]. Additionally these RAP Chicago soundings and surface-based (SBCAPE) and most unstable (MUCAPE) convective available potential energies (CAPE) all support an overnight maintenance of convective instability over the metroplex (Figure 12). This reflects: 1) slight diurnal surface cooling, 2) the strengthening of the ascent and upper-level divergence across the city as shown in Figure 13 and Figure 3) the motion of the 500-700 hPa vortex towards this region with its relatively cool air sustained by ascent under the mid-upper tropospheric jet’s left exit region, and 4) the motion of the lower tropospheric deformation/confluence zone and its precipitable water maximum poleward (Figure 14e-f) maintaining a very moist column that gradually loses its elevated dry layer with the CAPE sustained by increasing its vertically integrated moisture and cooling aloft. The CAPE is no longer primarily a reflection of the relatively dry and unstable elevated mixed layer between 850 and 700 hPa evident in the KILX 00Z7/2 sounding in Figure 10a that becomes more elevated after 12Z7/2 and looks progressively less like the classical “loaded gun” sounding through this period while increasing moisture is propagating into the Chicago metroplex accompanying the poleward propagating lower tropospheric confluent deformation zone in Figure 14f. A closer examination of the evolving RAP soundings over the Chicago metroplex in Figure 12 reflects this moist neutral layer that is progressively becoming wetter while maintaining the weak wind shear profile more indicative of a weak vortex over the metroplex. Figure 13 supports the 12Z7//2 - 15Z7/2 upper-tropospheric divergence in an extended west-east band in the jet’s left exit region as well as upward vertical motion and the eastward propagation of the cold core closed low at 500 hPa.
Figure 12.
RAP soundings over Chicago valid at a) 1300 UTC and b) 1500 UTC 2 July 2023. c) RAP surface-based (SBCAPE) (red contours in JKg−1), SBCIN (shaded at 25 and 100 JKg−1), and surface wind barbs (kt) and d) RAP most unstable (MUCAPE) (red contours in JKg−1), lifted parcel level (shaded in m), and surface wind barbs (kt) all at 1200 UTC 2 July 2023.
Figure 12.
RAP soundings over Chicago valid at a) 1300 UTC and b) 1500 UTC 2 July 2023. c) RAP surface-based (SBCAPE) (red contours in JKg−1), SBCIN (shaded at 25 and 100 JKg−1), and surface wind barbs (kt) and d) RAP most unstable (MUCAPE) (red contours in JKg−1), lifted parcel level (shaded in m), and surface wind barbs (kt) all at 1200 UTC 2 July 2023.
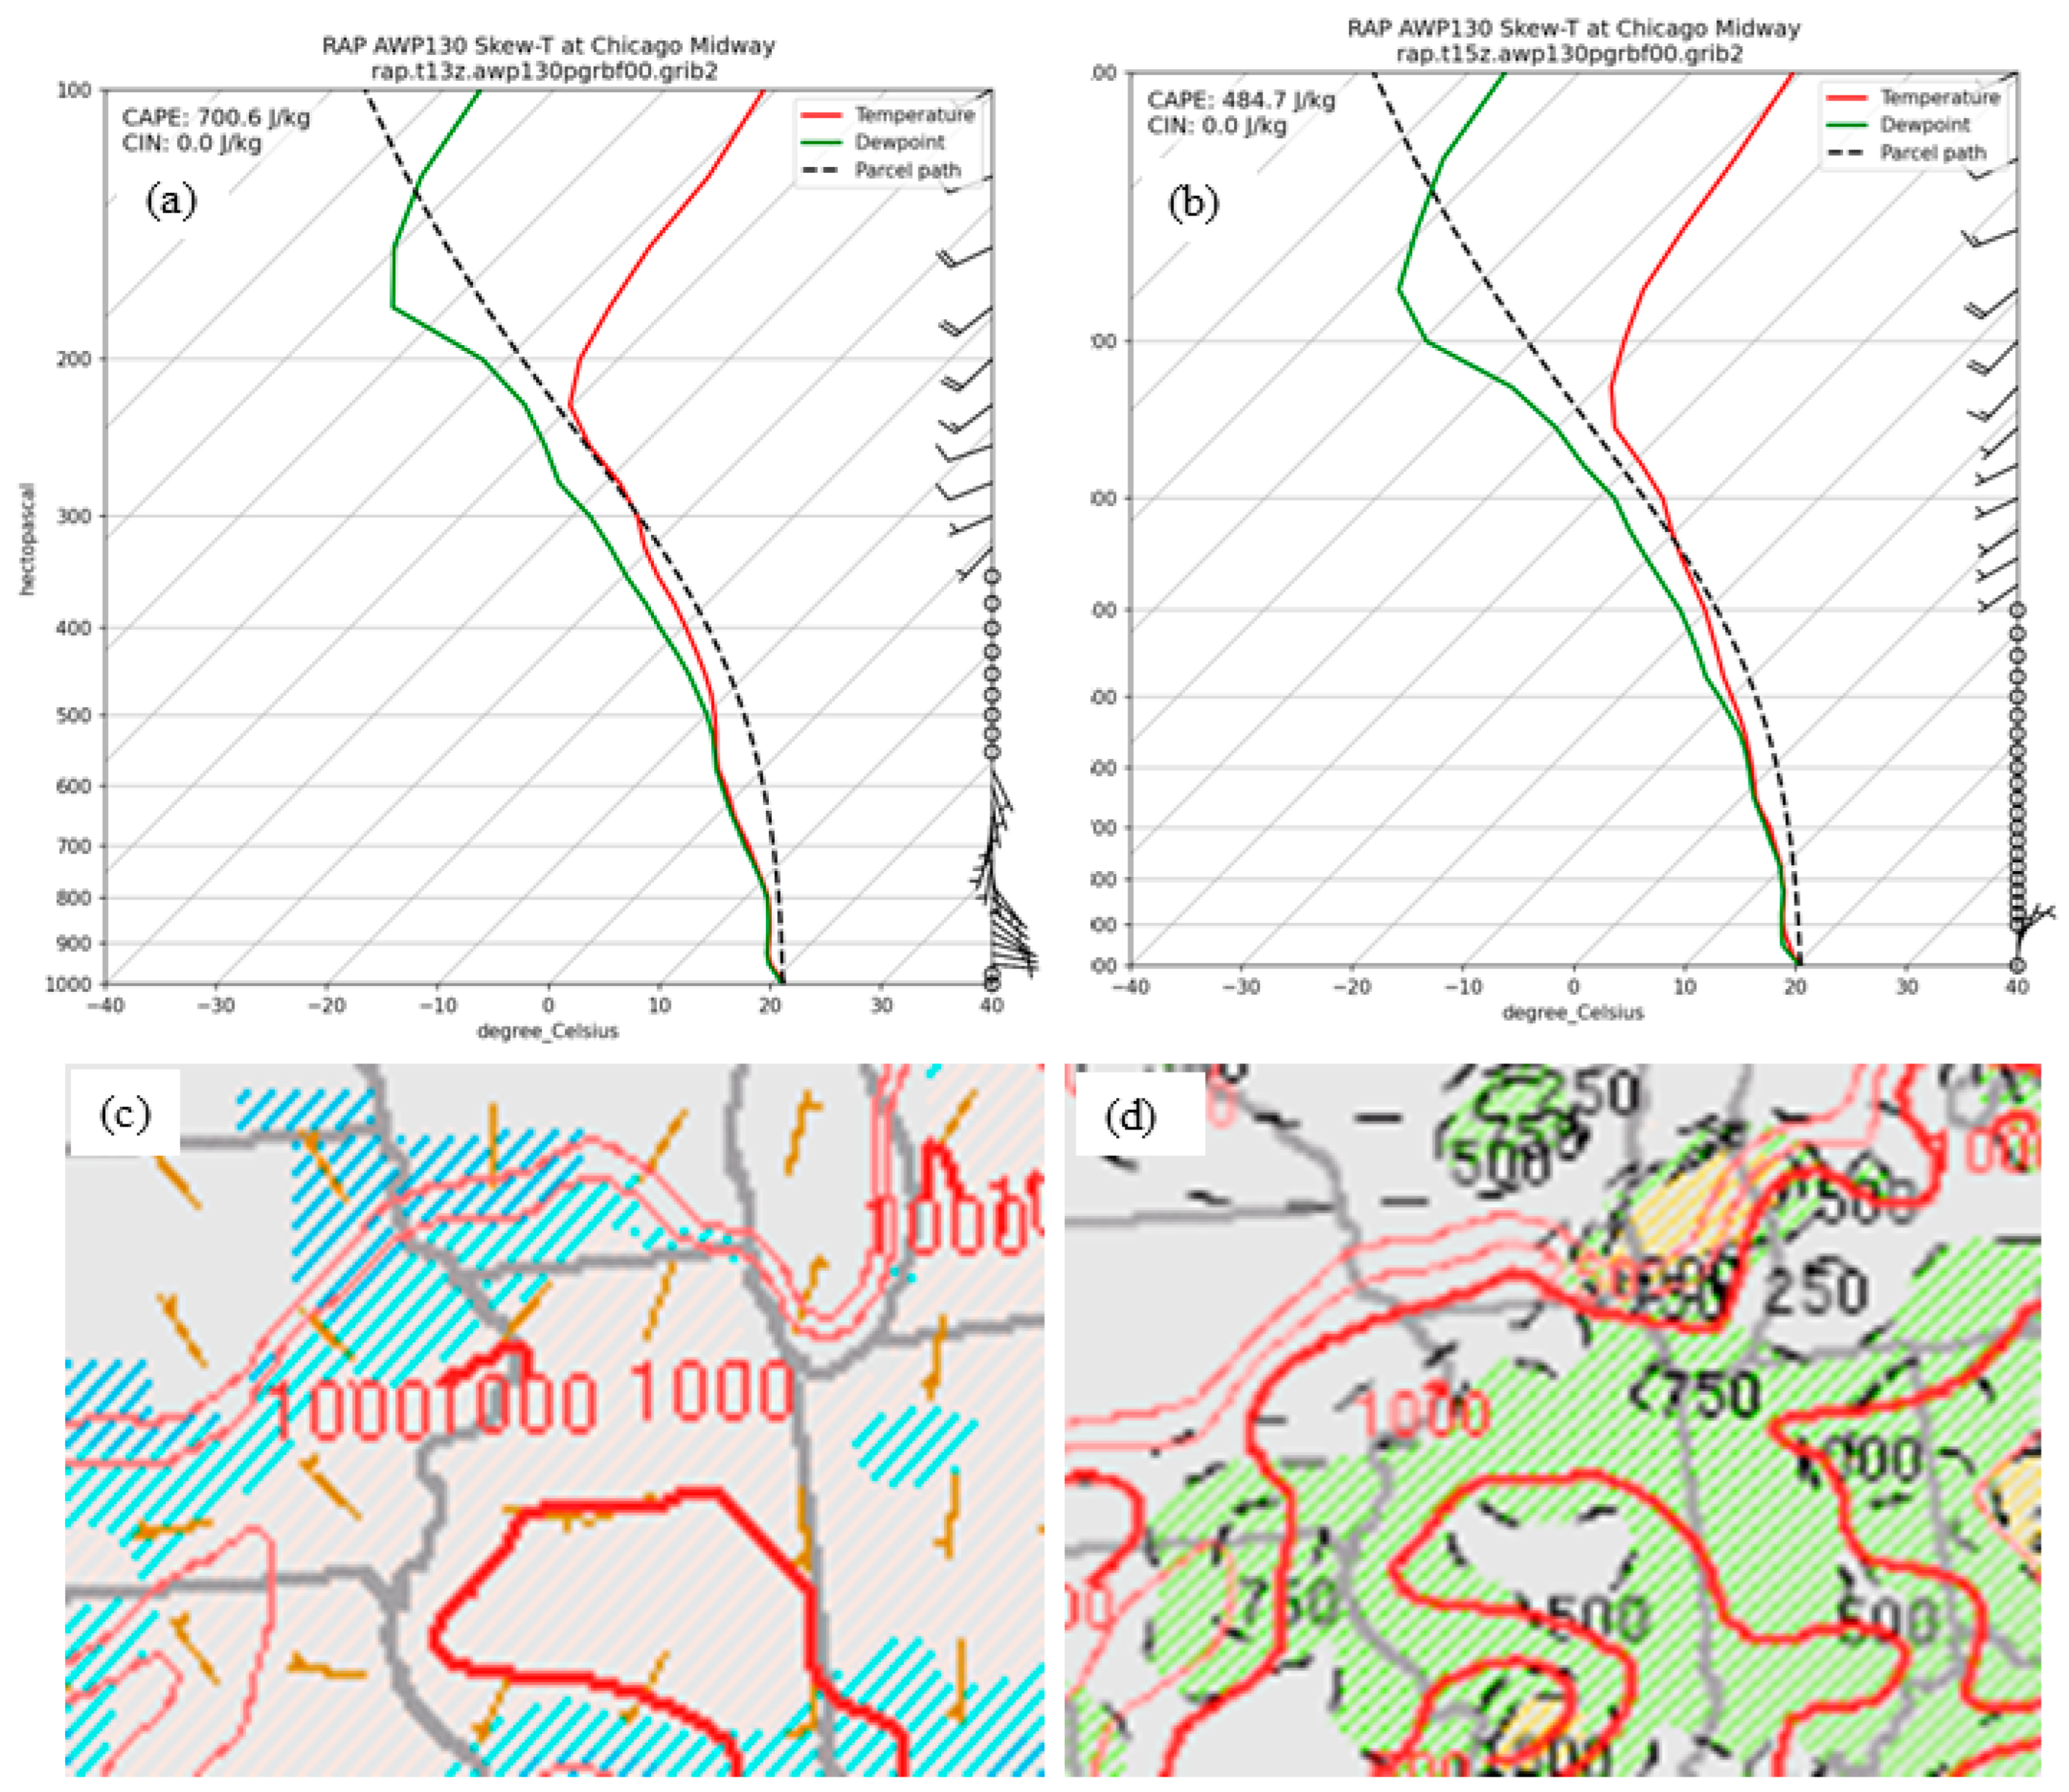
Figure 13.
As in Figure 2, Figure 3 and Figure 4, respectively, at a-b) 1200 UTC – 1500 UTC, c-d) 1200 UTC – 1500 UTC, and e-f) 1200 UTC – 1500 UTC 2 July 2023.
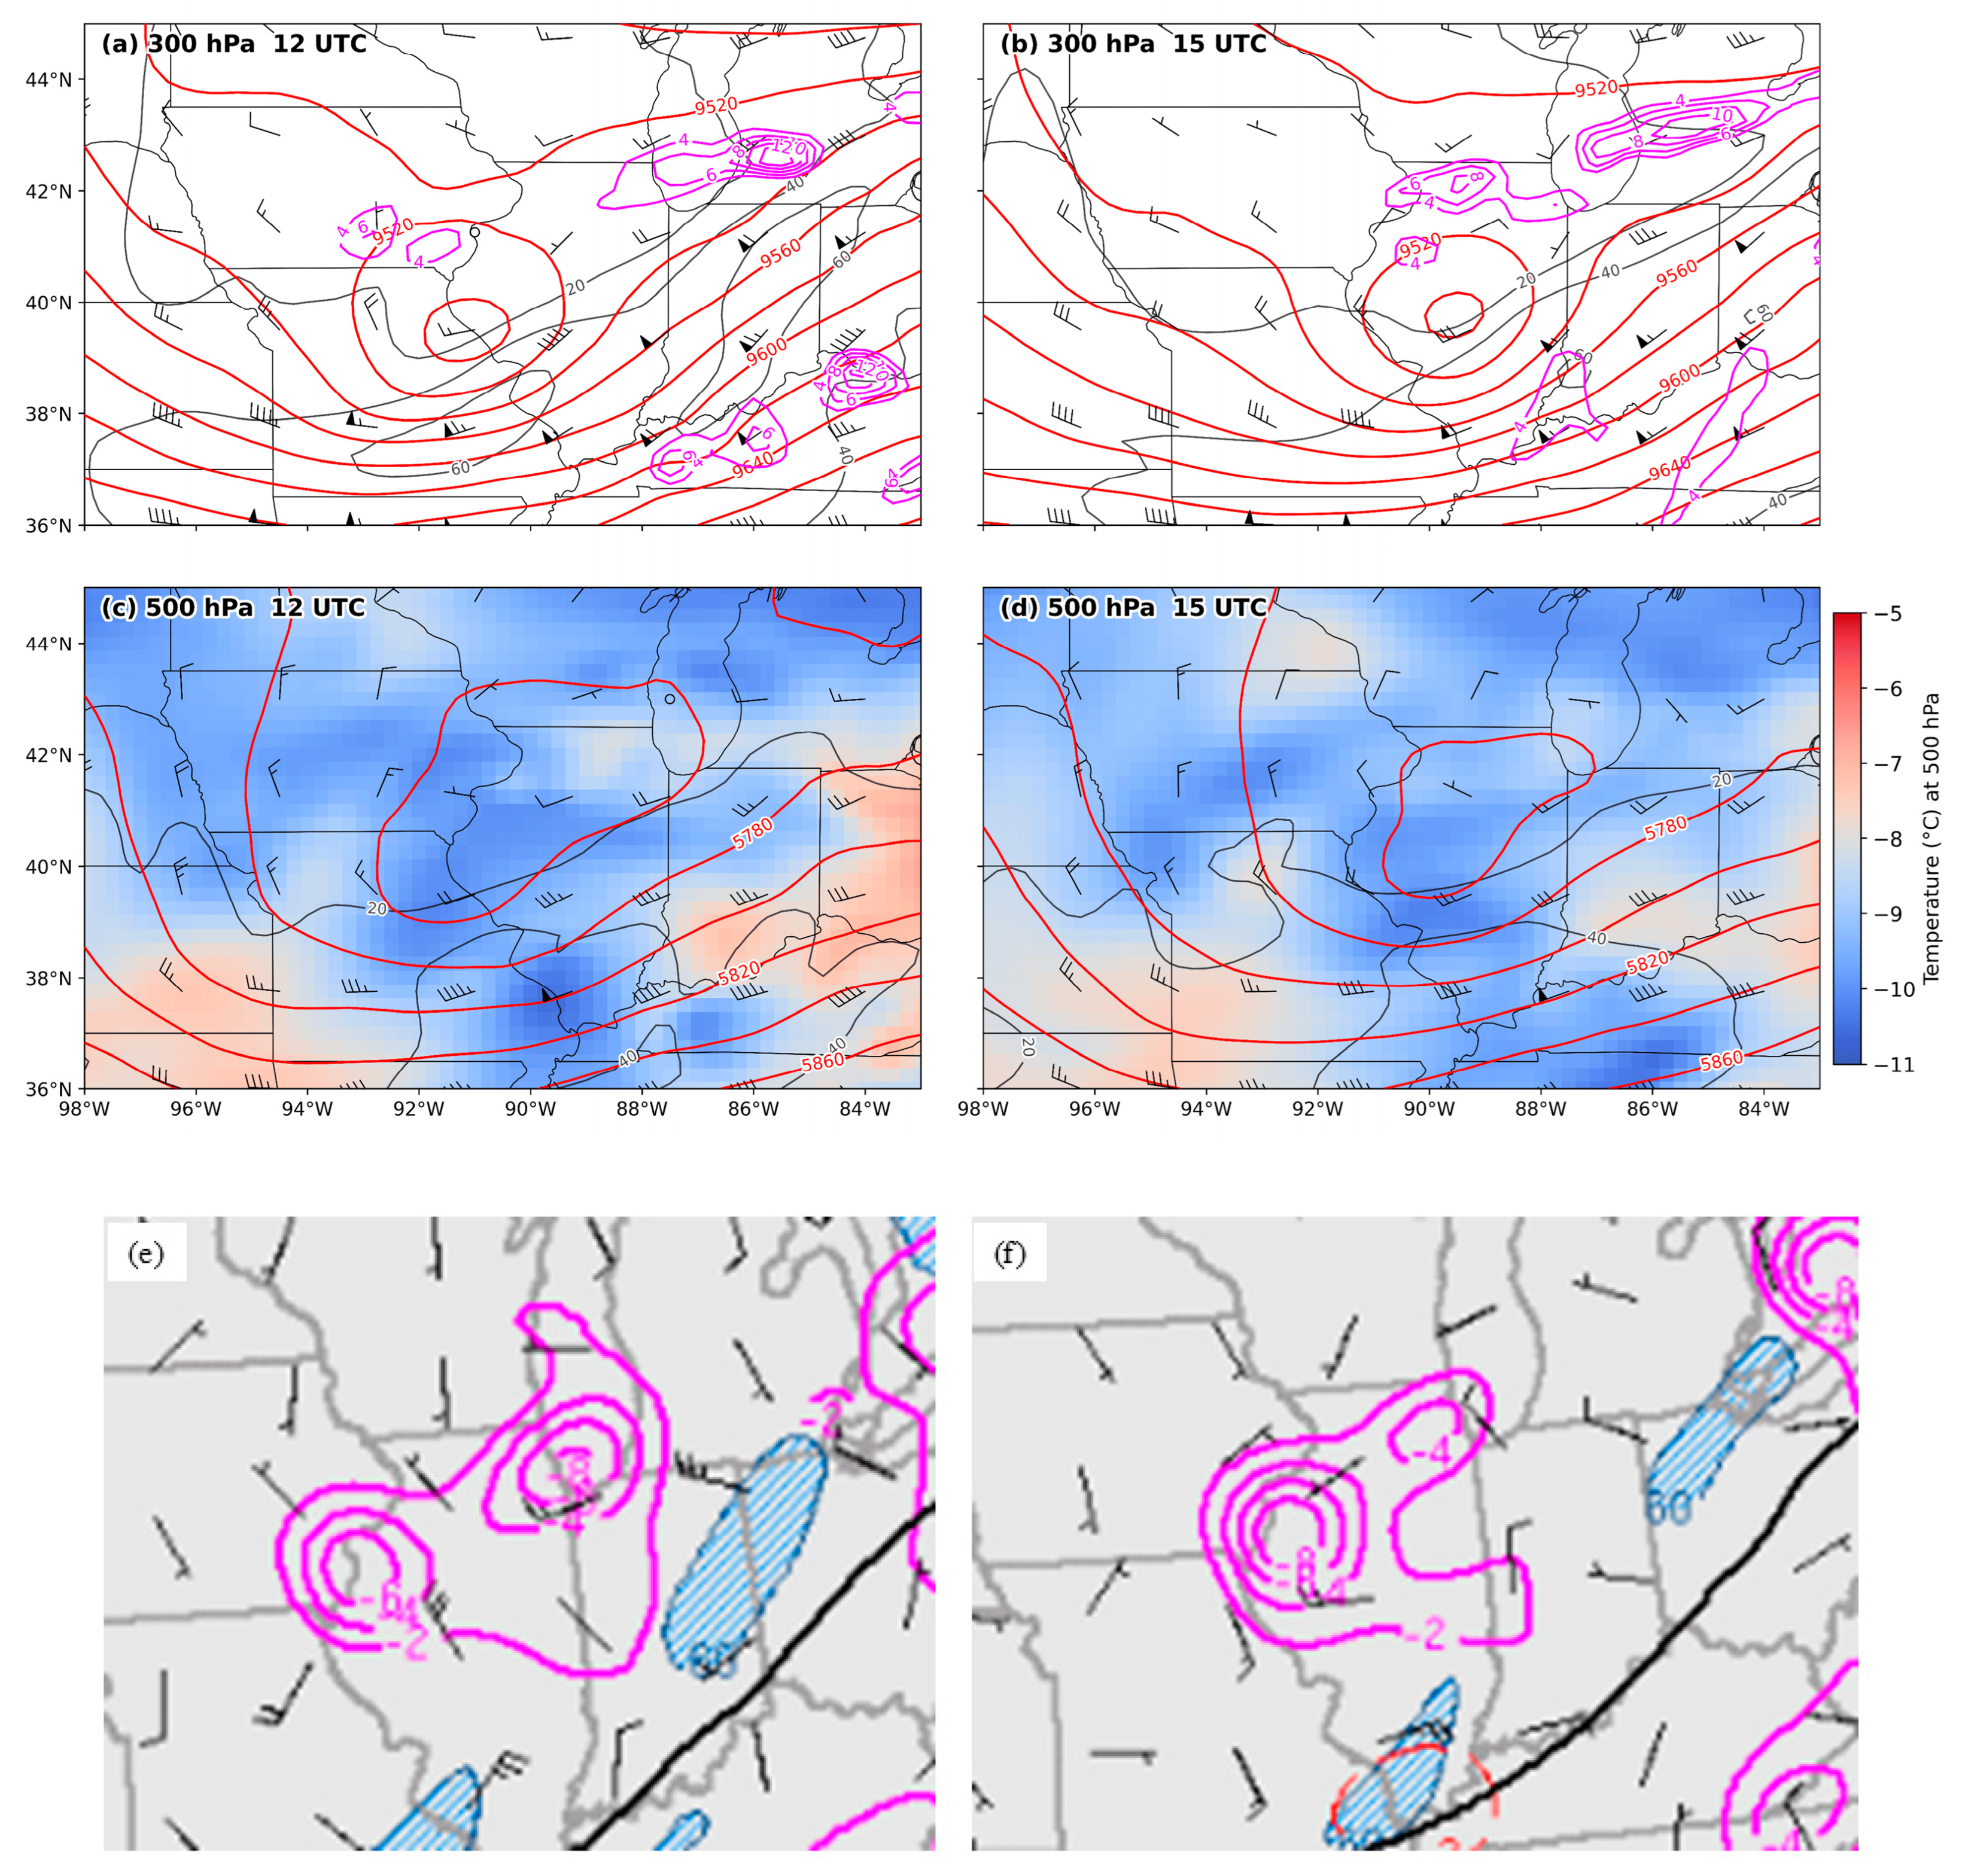
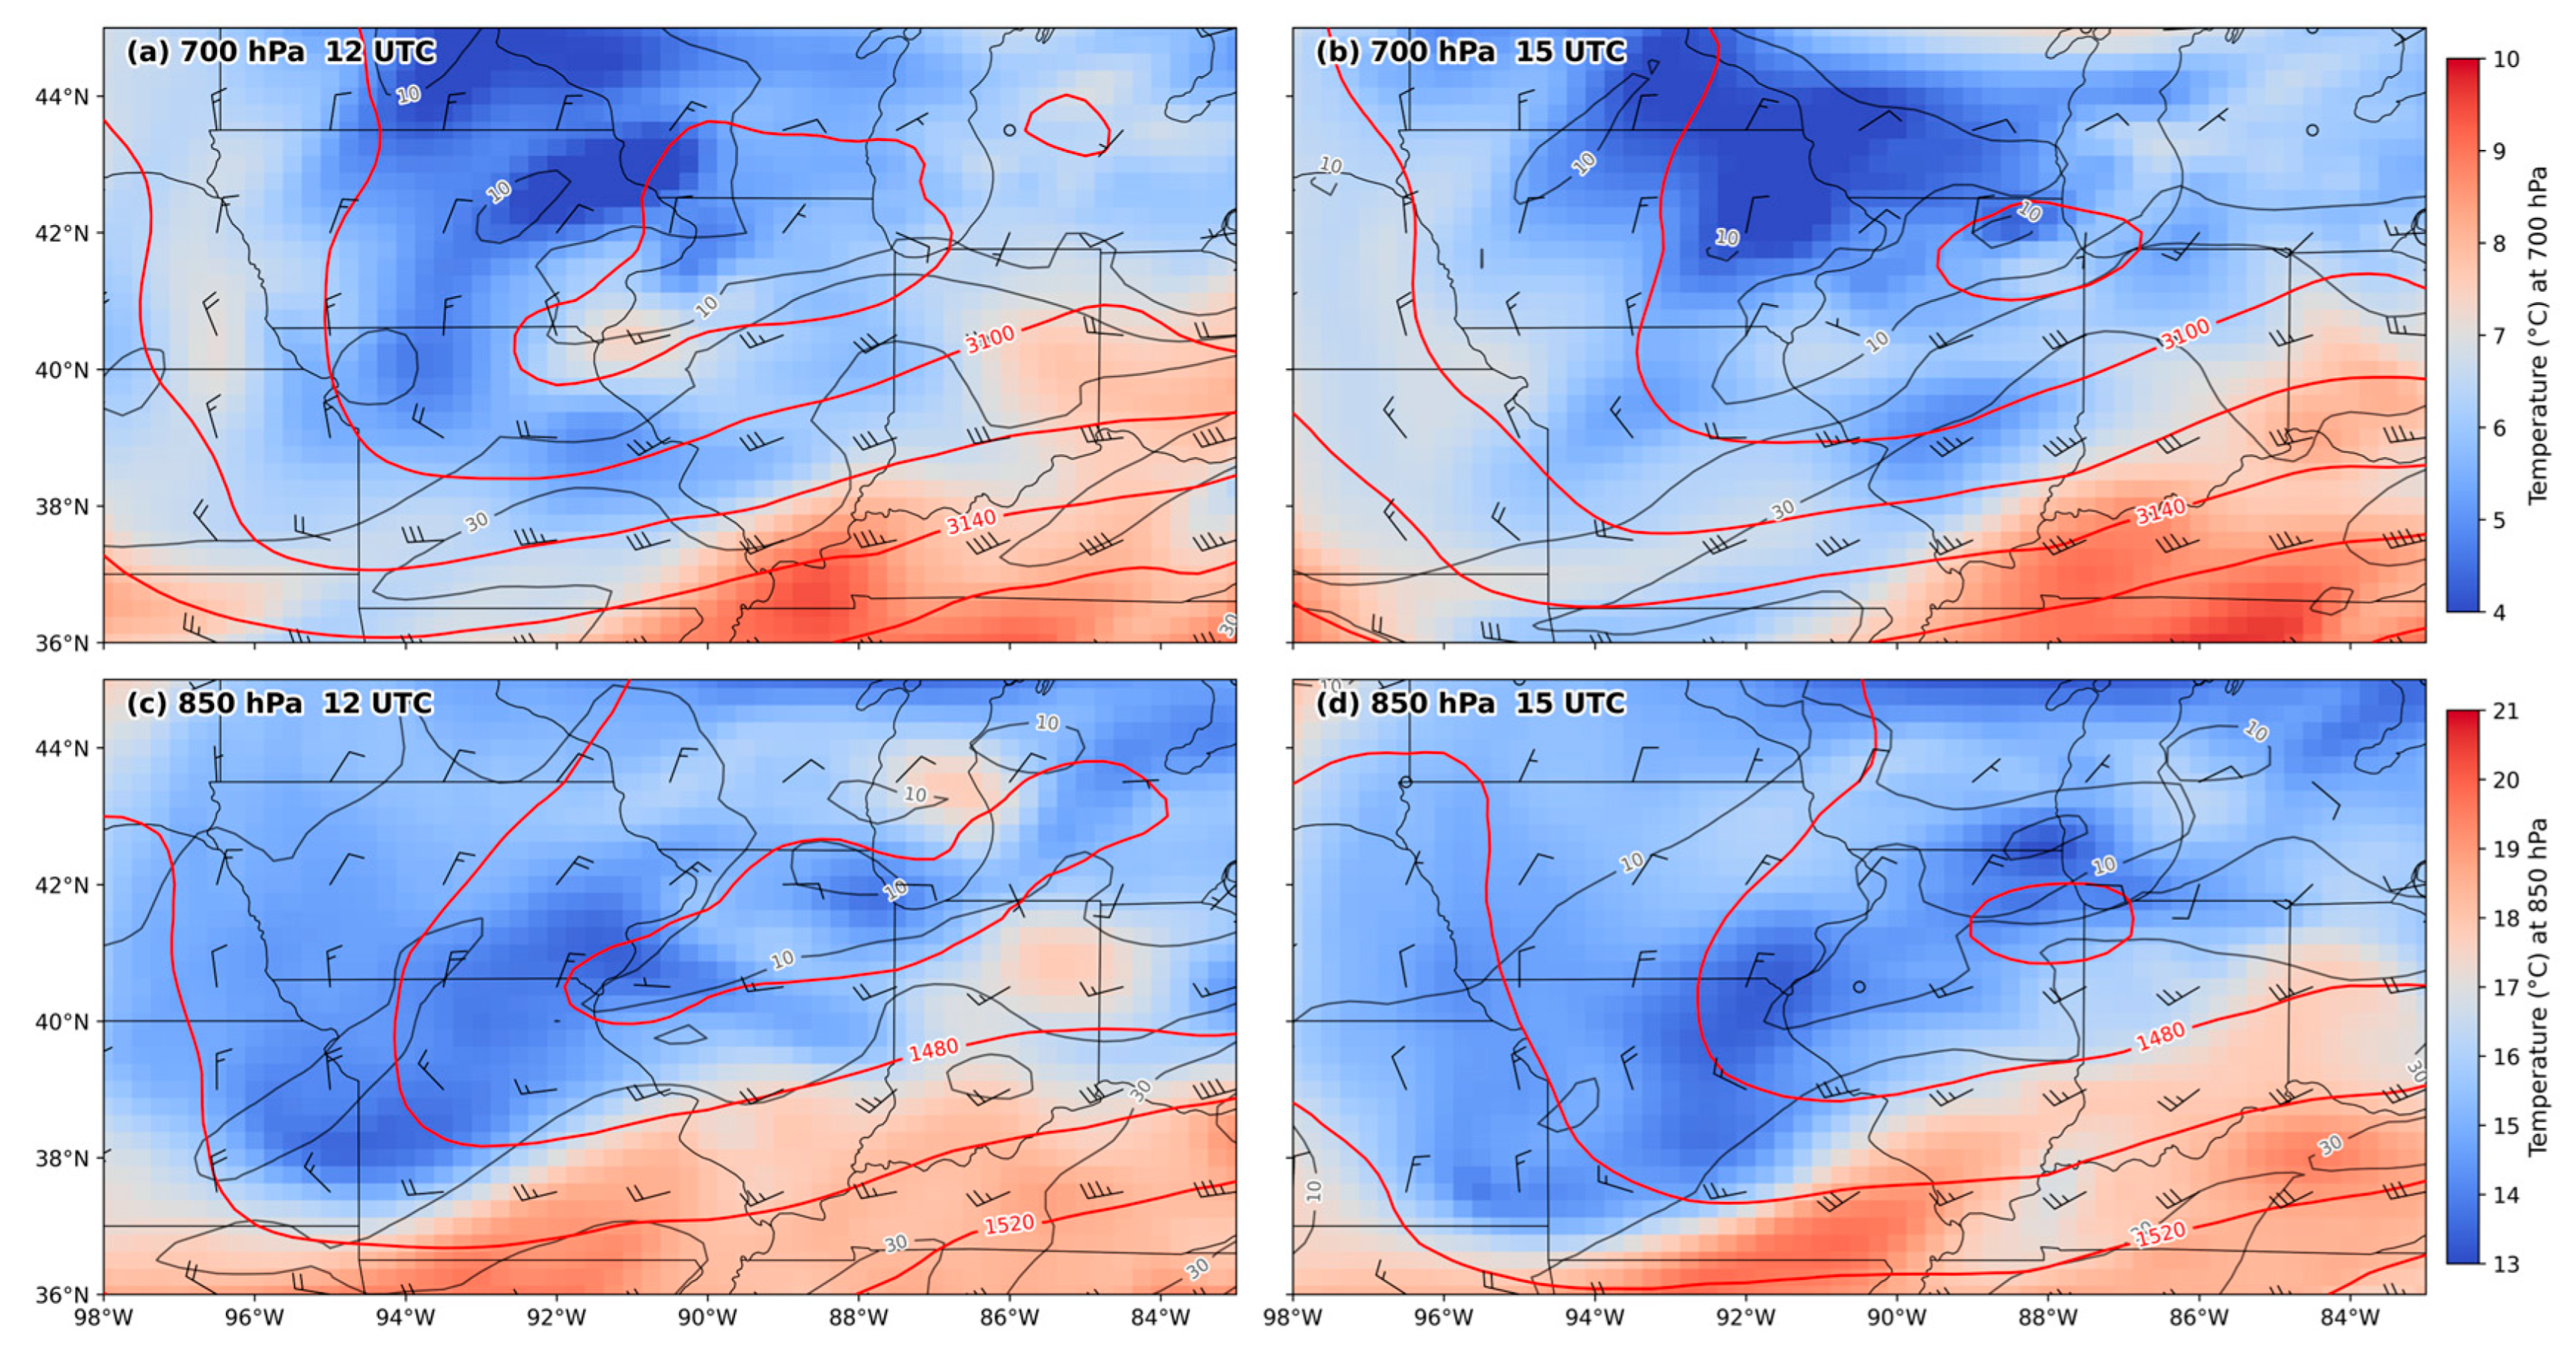
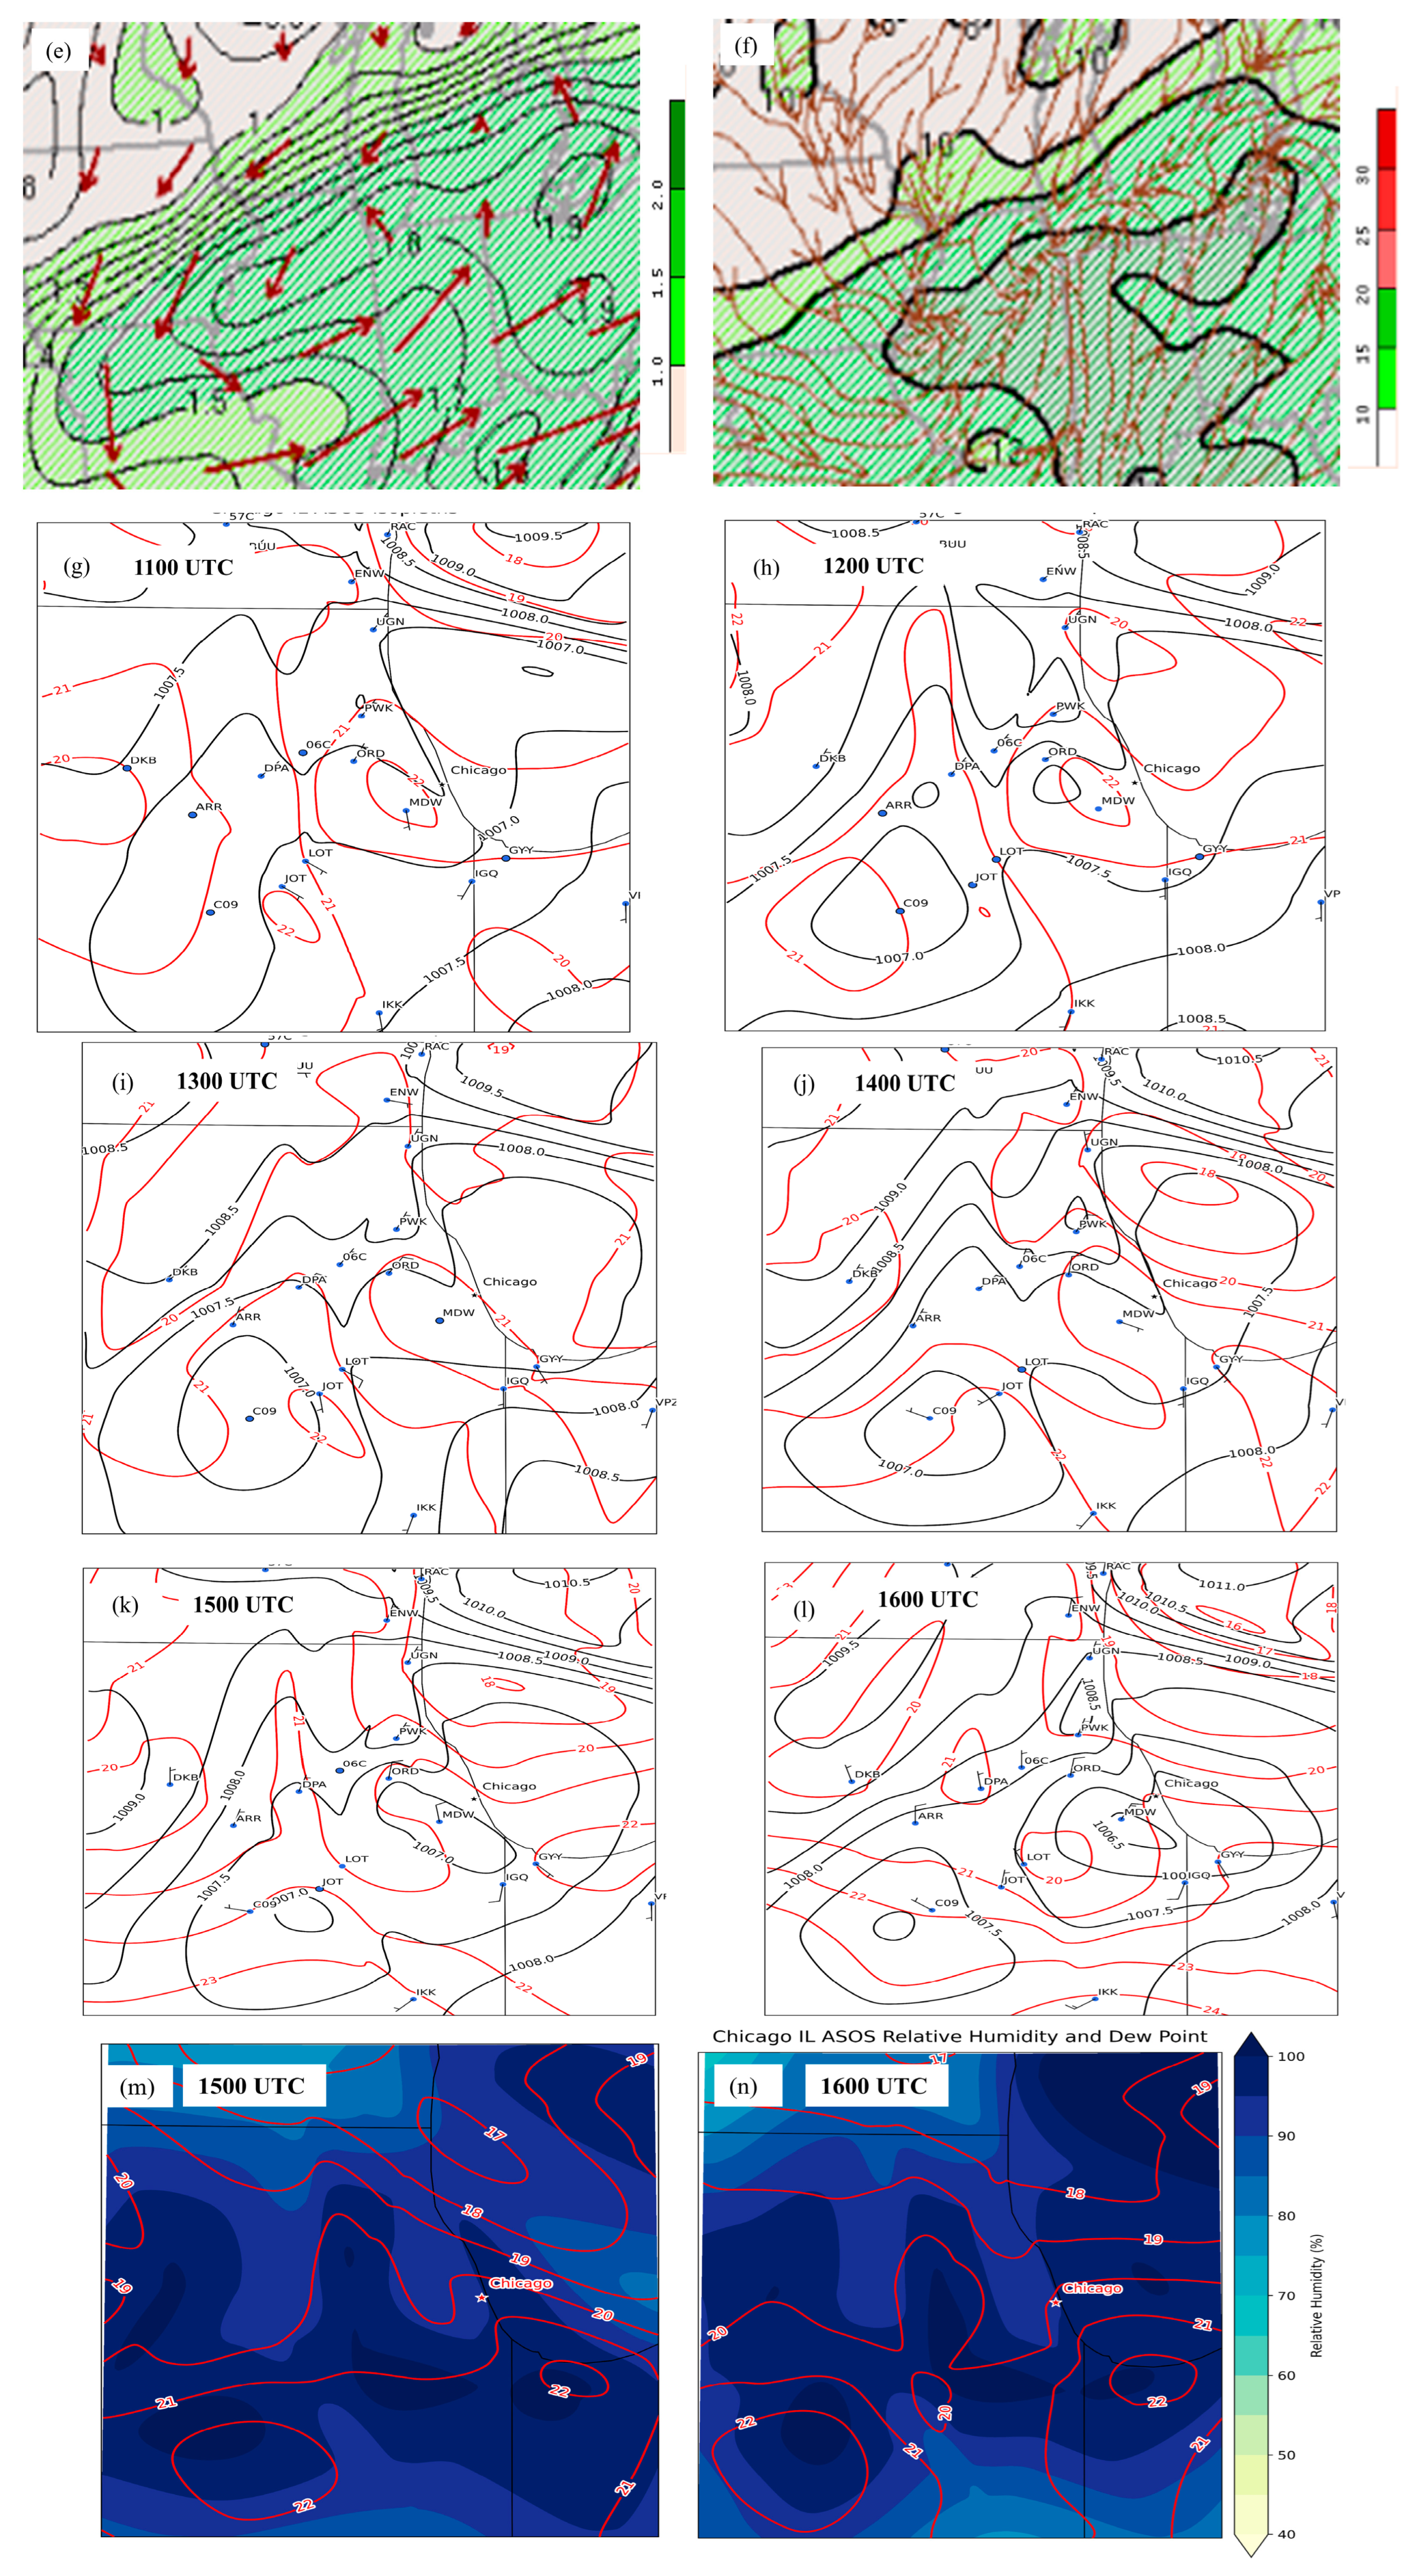
Figure 14.
As in Figure 6, Figure 7 and Figure 8, respectively, at a-b) 1200 UTC – 1500 UTC, c-d) 1200 UTC – 1500 UTC, and e-f) 1200 UTC – 1500 UTC 2 July 2023. Chicago area airport METAR analyses of mean sea level pressure (black solid in hPa), wind barbs (kt), and temperature (red solid in °C) valid at g) 1100 UTC, h) 1200 UTC, i) 1300 UTC, j) 1400 UTC, k) 1500 UTC , and l) 1600 UTC and surface Td (red solid in°C) and surface relative humidity (shaded in %) at m) 1500 UTC and n) 1600 UTC 2 July 2023.
Figure 14.
As in Figure 6, Figure 7 and Figure 8, respectively, at a-b) 1200 UTC – 1500 UTC, c-d) 1200 UTC – 1500 UTC, and e-f) 1200 UTC – 1500 UTC 2 July 2023. Chicago area airport METAR analyses of mean sea level pressure (black solid in hPa), wind barbs (kt), and temperature (red solid in °C) valid at g) 1100 UTC, h) 1200 UTC, i) 1300 UTC, j) 1400 UTC, k) 1500 UTC , and l) 1600 UTC and surface Td (red solid in°C) and surface relative humidity (shaded in %) at m) 1500 UTC and n) 1600 UTC 2 July 2023.
4.2. Lower Tropospheric Forcing (1200Z-1500Z)
In the lower troposphere (Figure 14) the 850-700 hPa vortex becomes situated over the city by 15Z7/2 nearly in sync with the 500 hPa vortex thus indicating very weak winds in the column over the metroplex which is also consistent with the soundings in Figure 12. The deep west-east precipitable moisture plume in phase with the surface deformation zone is aligned across the metroplex with the 850 hPa moisture flux transport vector oriented from southeast to northwest and directed nearly across the city (Figure 14e-f). This surface deformation zone likely reflects the initial pressure falls and convergence of the QLCS#1 trough at low levels (note Figure 8h and Figure 9l) that is subsequently enhanced by the jet’s left exit region divergence aloft described earlier. Figure 14g-n show the strengthening and evolving complexity of this trough during the first heavy rainfall event spanning 11Z7/2-16Z7/2. A dual meso-low system develops emblematic of the evolution of the radar into a “T-bone” configeration to be described in the next subsection. Under the arriving closed low aloft a meso-low strengthens over the region between KMDW and the Lake Michigan coast on the southeast side of the city. This is joined by another meso-low propagating into the metroplex fron western Illinois in conjunction with the upper closed low and its trough/PV maximum. The pressure troughing over the city in Figure 14g-n as well as the confluence zone, first established early on around 07-09Z7/2 between the QLCS#1 trough and a second developing line of convection accompanying the QLCS#2, is further joined by the meso-low and QLCS#3 propagating in from western Illinois under the closed low aloft. This produces a “T-bone” pressure trough with surface confluence where the northeasterly flow from the QLCS#2 propagating southwestwards intersects the remnant trough from the QLCS#1 and the second meso-low’s southwesterly surface flow accompanying QLCS#3. Confluence over the city is therefore established among north-northeasterly, south-southeasterly and west-southwesterly surface flow near KMDW. Eventually the more eastern meso-low between KMDW and the Lake Michigan coast becomes the dominant of the two lows taking over the T-bone mean sea level pressure structure by 15-16Z7/2 in Figure 14k-l. Also at this time the surface dewpoint and relative humidity emblematic of a saturated surface layer take on a pattern consistent with the intensification of the more eaastern meso-low and the confluence of west-southwesterly surface flow with north-northeasterly surface flow over the city during the most extreme rainfall with the first rainfall period.
4.3. Convective Environment (1200 UTC-1500 UTC)
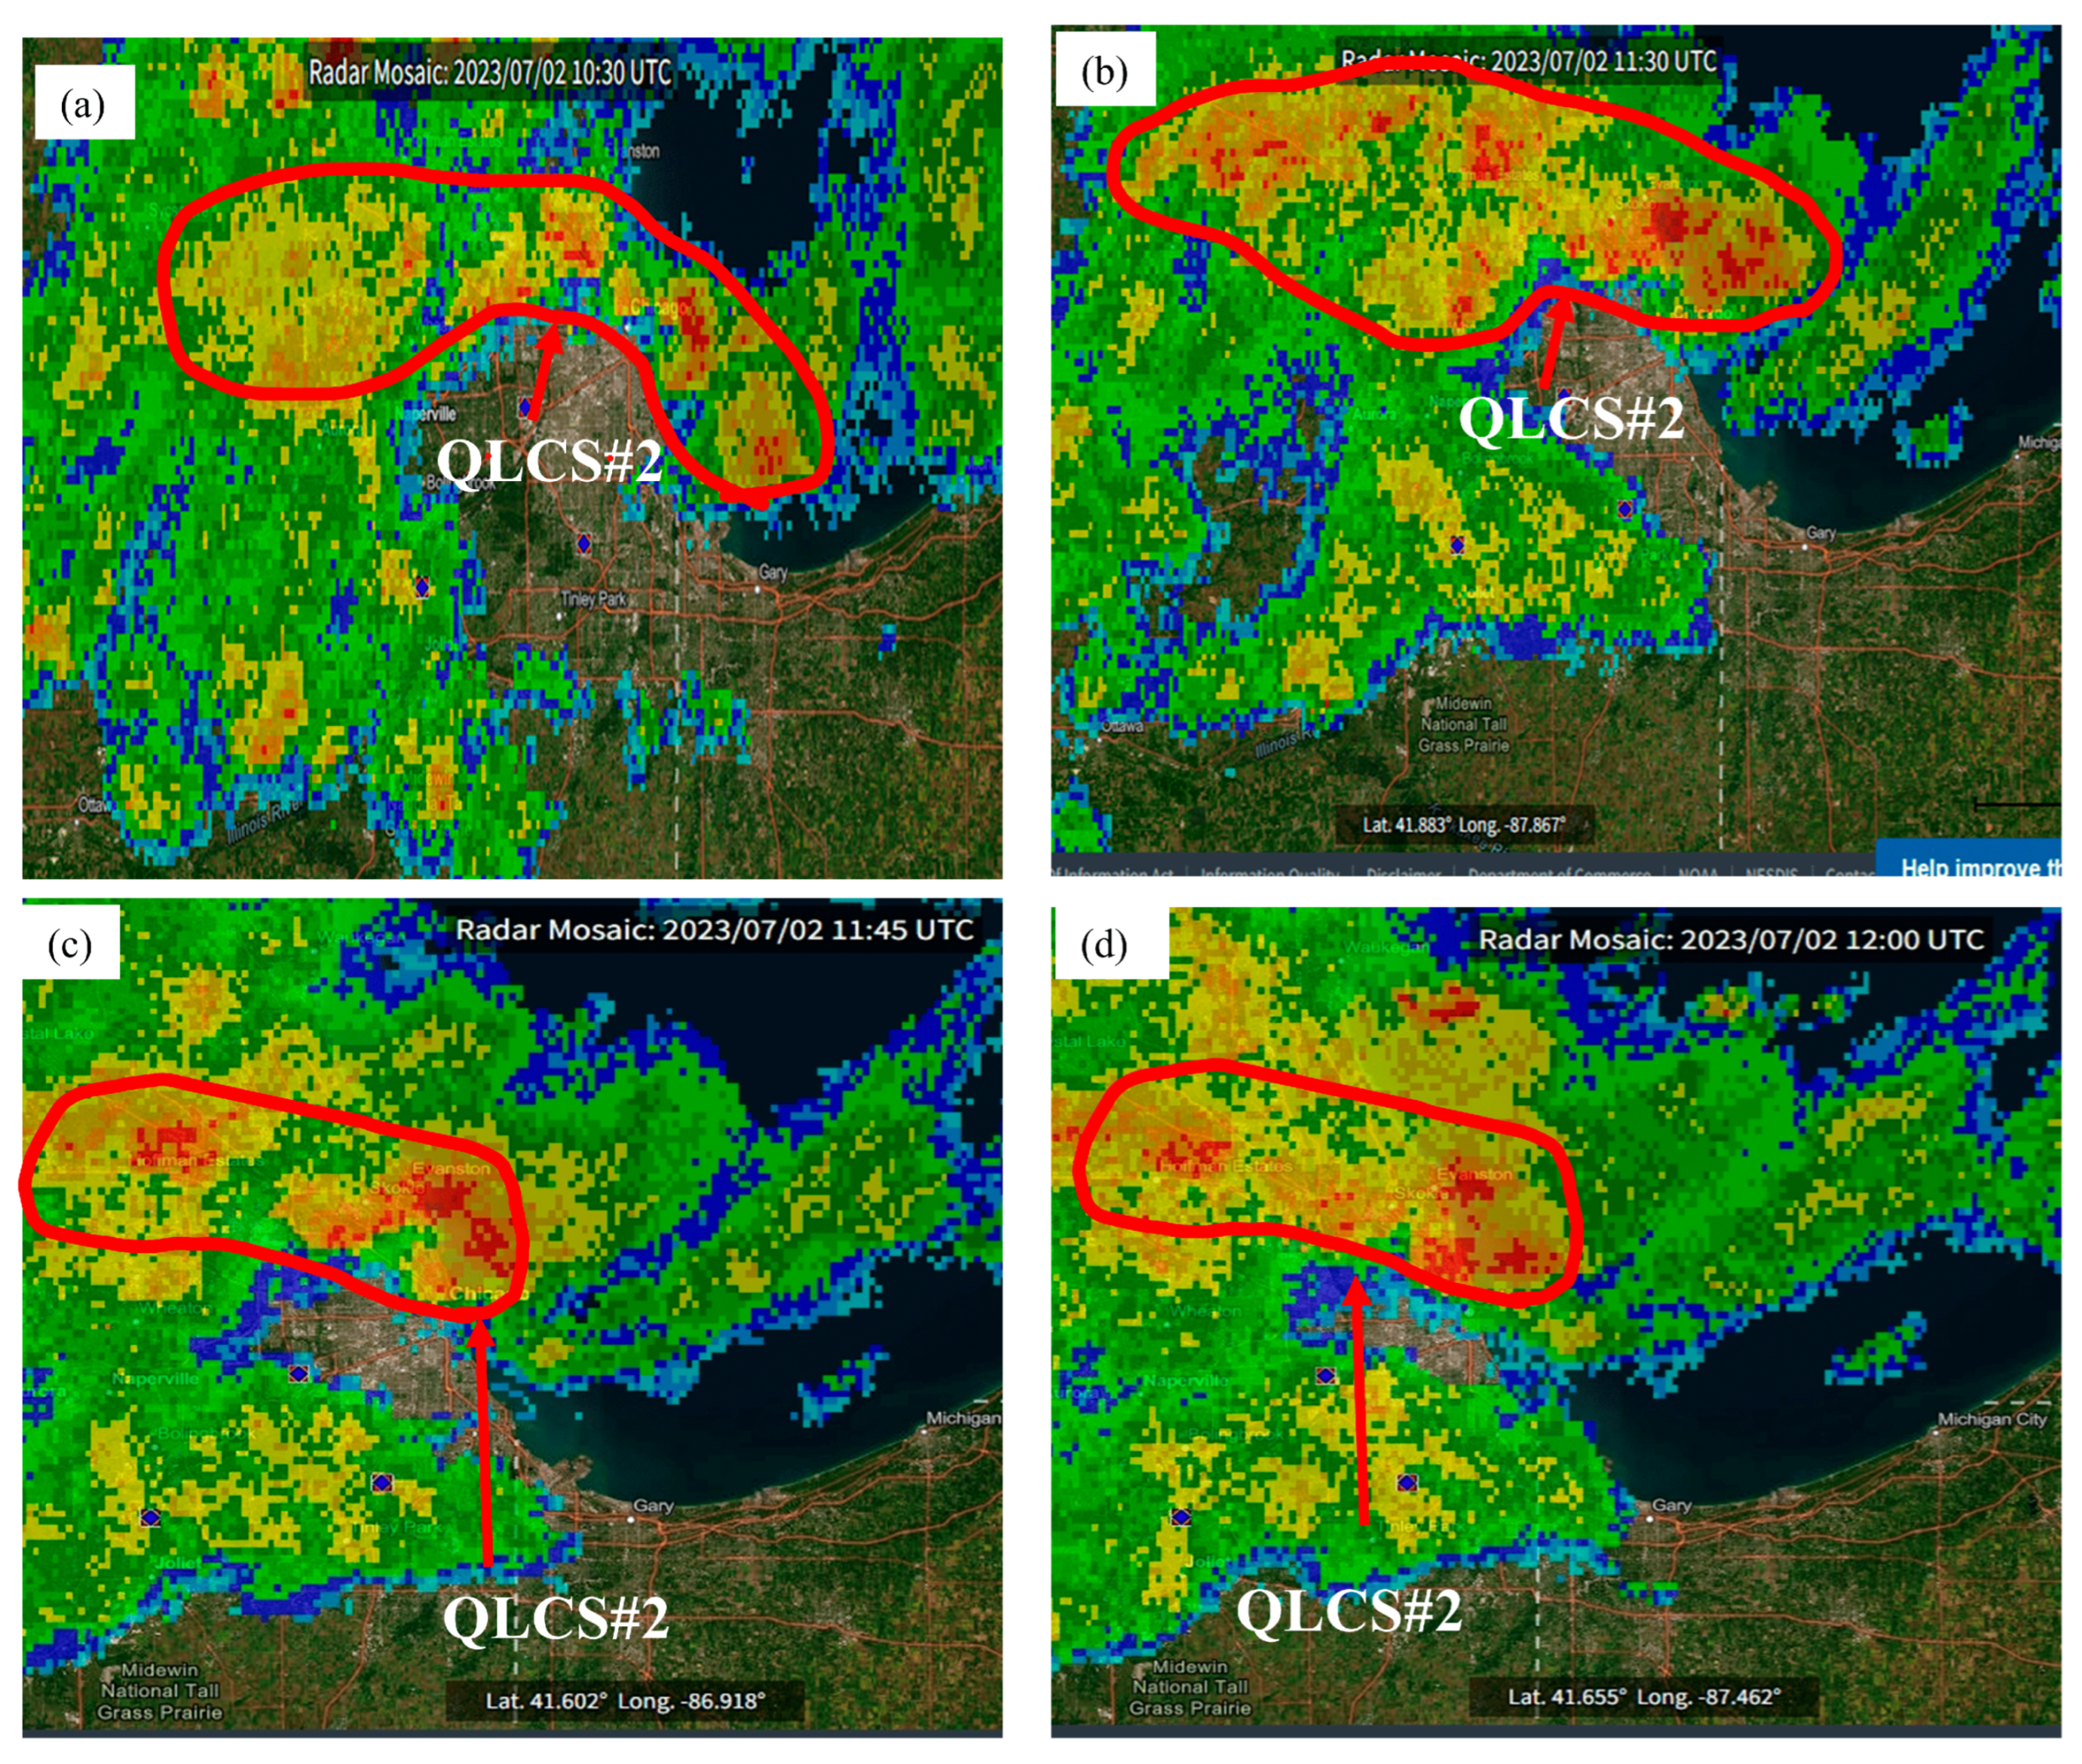
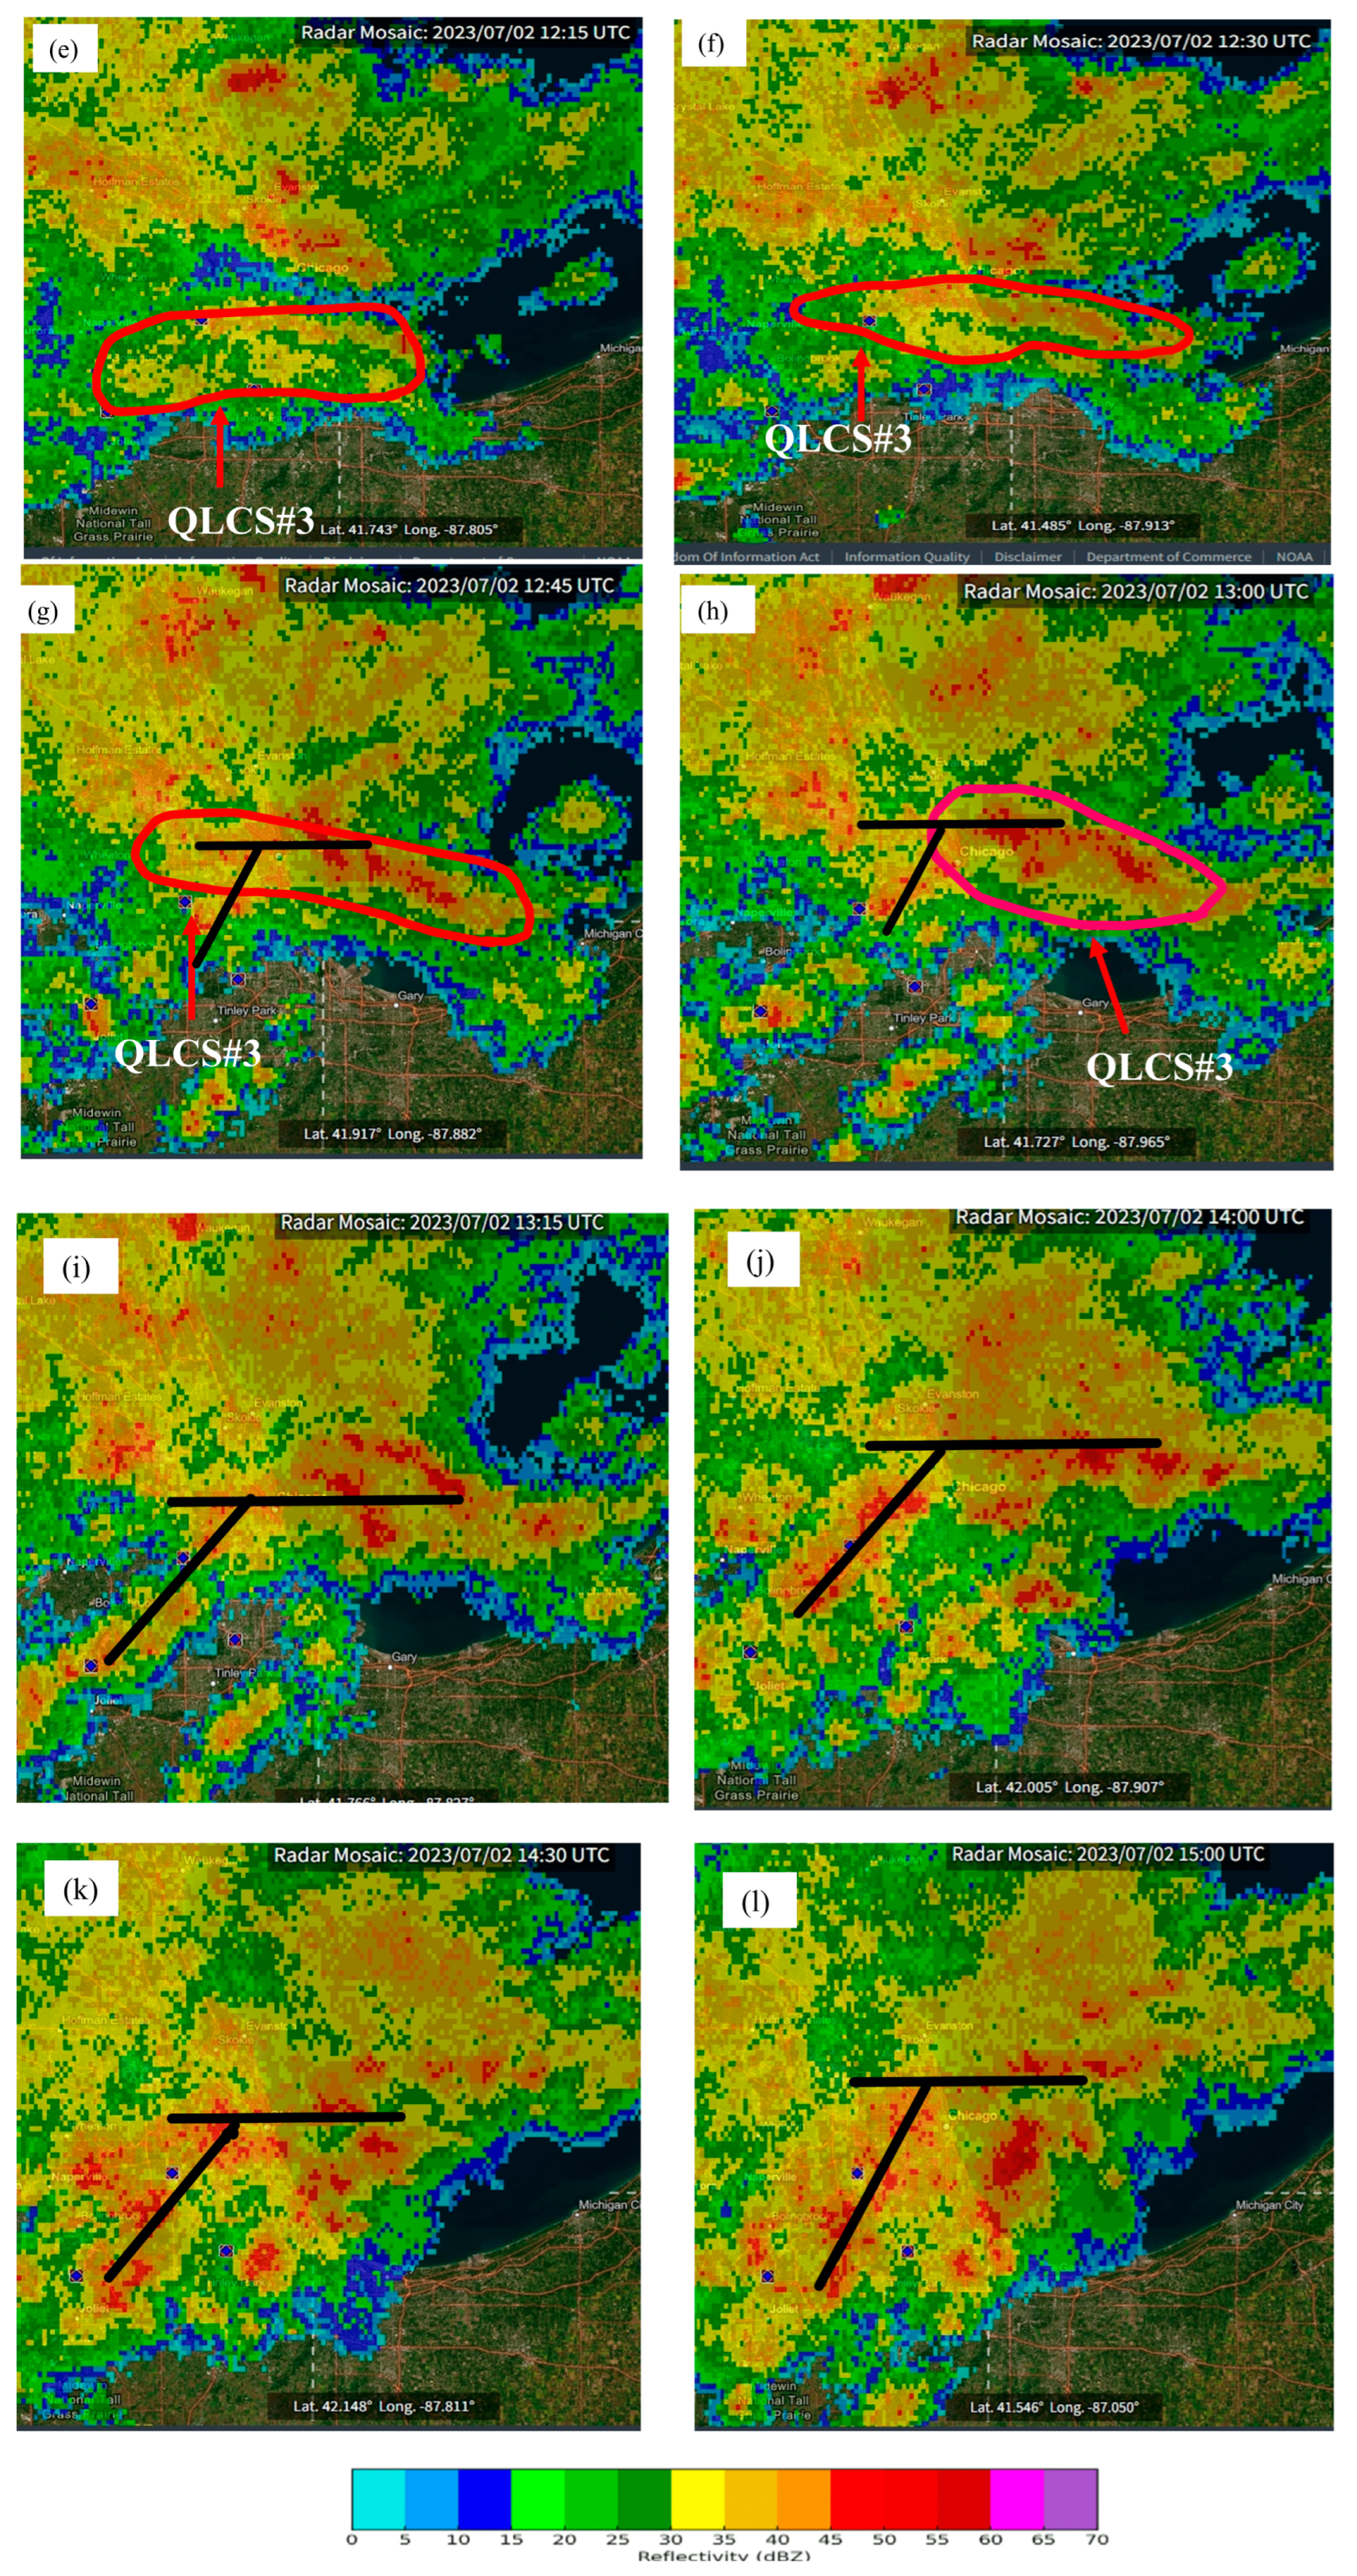
The radar imagery in Figure 15 represents the most important period for convective reorganization across the city resulting in the first and most significant component of the two extreme rainfall events. It depicts the resurgence of convection leading to the first heavy precipitation period as the QLCS#1 gives way to QLCS#2 and 3 resulting in the T-bone radar configeration primarily in between KMDW and the Lake Michigan coast on the southeast side of the metroplex. The radar evolution after 1030Z7/2 starts with a well-organized northwest-southeast band along the Lake front on the northeast side of the metroplex (Figure 15a,b). This likely represents the morning’s lake breeze converging into the remnant QLCS#1 trough indicated by the city scale trough/meso-low in Figure 14g,h. As this northwest-southeast convective band very slowly propagates southwestwards between 1145 UTC and 1315 UTC towards the remnant QLCS#1 city scale trough the detailed 15 minute radars in Figure 15c-i show the explosive phasing between this northwest-southeast line (QLCS#2 ) and a line propagating into the metroplex from western Illinois on the southwest flank of the metroplex, i.e., QLCS#3 which is strongly coupled to the closed low aloft. The 15 minute sequence in Figure 15c-i indicate what roughly appears to be a collision of QLCS lines on radar reinforcing QLCS#2 ’s convection followed by the southwestern growth, shortly thereafter of a line consistent with the second meso-low and propagation of southwesterly momentum arriving into the metroplex after 14Z7/2. Additionally with the formation of this southwestward extension unifying both lines and completing the T-bone structure another leading southwest-northeast line is generated which rapidly propagates into southwestern Lake Michigan. This key “T-bone” structure develops along the western flank of this 40-50 dBZ area of convection extending the heavy rainfall accompanying the 40-50 dBZ echoes southward over the western side of town. As can be seen in Figure 14g,h, this reflects the geometry of the city scale winds and surface trough which is being rotated towards the southwest on its western flank not unlike the RAP low-level streamlines, precipitable water plume, and moisture flux vectors in Figure 14e,f. In Figure 15j,k and as is shown in Figure 18, after 1400 UTC, the “T-bone” gradually fills in with significant more uniform > 40 dBZ echoes and very slowly drifts across the city towards the Lake front setting up the period of some of the most intense rainfall in the region between and over KORD and KMDW consistent with the observations of the first rainfall event focussed on the region around and over Berwyn inferred from Figure 1. The 14Z7/2 - 15Z7/2 period represents the focal point for continuous moderate to heavy rainfall over and near KMDW as all of these features consolidate into a region of fairly uniform but intense precipitation (>40 dBZ in Figure 15k) with a surface north-northeast – south-southwest confluence maximum centered near or slightly south of KMDW and extending roughly west to east across the metroplex in Figure 14j-l.
Figure 15.
NOAA NEXRAD Doppler radar composite imagery at a) 1030 UTC, b) 1130 UTC, c) 1145 UTC, d) 1200 UTC, e) 1215 UTC, f) 1230 UTC, g) 1245 UTC, h) 1300 UTC, i) 1315 UTC, j) 1400 UTC, k) 1430 UTC and l) 1500 2 July 2023. Northwest-southeast red circle represents QLCS#2 on a-d). Black solid line feature represents the “T-Bone” mentioned in the text on Figs. e-l) which represents the unification of QLCS# 2 and QLCS#3.
Figure 15.
NOAA NEXRAD Doppler radar composite imagery at a) 1030 UTC, b) 1130 UTC, c) 1145 UTC, d) 1200 UTC, e) 1215 UTC, f) 1230 UTC, g) 1245 UTC, h) 1300 UTC, i) 1315 UTC, j) 1400 UTC, k) 1430 UTC and l) 1500 2 July 2023. Northwest-southeast red circle represents QLCS#2 on a-d). Black solid line feature represents the “T-Bone” mentioned in the text on Figs. e-l) which represents the unification of QLCS# 2 and QLCS#3.
5. Probable MCV Formation Organizing the Second Period of Heavy Precipitation over Chicago
5.1. Upper and Lower Tropospheric Circulation Structure (1500Z – 2100Z)
Figure 16, Figure 17 and Figure 18 depict the evolution of tropospheric stability and circulation as the multiple QLCS which evolved into a T-bone structure and subsequently built into a deep circulation analogous to an MCV strengthens over southwestern Lake Michigan. Figure 16a,b indicate the subtle warming in the mid-troposphere, i.e., 700-500 hPa during 19Z7/2-20Z7/2 as well as the increasing mid and lower tropospheric east-northeasterly to backing north-northwest flow during this period in the RAP Chicago soundings. SBCAPE and MUCAPE show a significant decrease as warming aloft and, most importantly, increasing wrap-around cool lake airflow forces the largest instability equatorward and downstream of the metroplex. Additionally Figure 17 and Figure 18 support slight warming at mid-levels over the city as the 500 hPa warms faster than the 700-850 hPa layer by 20Z7/2. During this period the precipitable water plume is almost stationary over the city as the near vertically stacked vortex indicates deep weak east-northeasterly airflow in Figure 17f,g. Between the surface and 700 hPa significant vortical structure exists by 18Z7/2 in Figure 17d,e. Figure 18b,d,e,g show even stronger indication of the deep nature of the vortex structure extending downstream over southern Lake Michigan by 20Z7/2. Consistent with the reflectivity Figure 19f,h, the wrap-around mid-tropospheric ascent over the city in Figure 17g and Figure 18g indicates a persistent and slowly migrating moderate stratiform precipitation region that comprises the core of the late period second maximum in rainfall near KMDW. Figure 17h indicates how the eastern meso-low now moving over the lake has strengthened relative to the western one and is slowly drifting offshore by 18Z7/2. The airflow over the whole metroplex has adjusted to this dominant circulation and exhibits a typical cyclonic circulation structure with most of meso-β scale variability evident in the first heavy precipitation event just 2-3 hours earlier now absorbed into this broader scale (between meso-β and meso-α scale) circulation. This pattern continues through 20Z7/2 in Figure 18h.
Figure 16.
RAP soundings over Chicago valid at a) 1900 UTC and b) 2000 UTC 2 July 2023. c) RAP surface-based (SBCAPE) (red contours in JKg−1), SBCIN (shaded at 25 and 100 JKg−1), and surface wind barbs (kt) and d) RAP most unstable (MUCAPE) (red contours in JKg−1), lifted parcel level (shaded in m), and surface wind barbs (kt) all at 2000 UTC 2 July 2023.
Figure 16.
RAP soundings over Chicago valid at a) 1900 UTC and b) 2000 UTC 2 July 2023. c) RAP surface-based (SBCAPE) (red contours in JKg−1), SBCIN (shaded at 25 and 100 JKg−1), and surface wind barbs (kt) and d) RAP most unstable (MUCAPE) (red contours in JKg−1), lifted parcel level (shaded in m), and surface wind barbs (kt) all at 2000 UTC 2 July 2023.
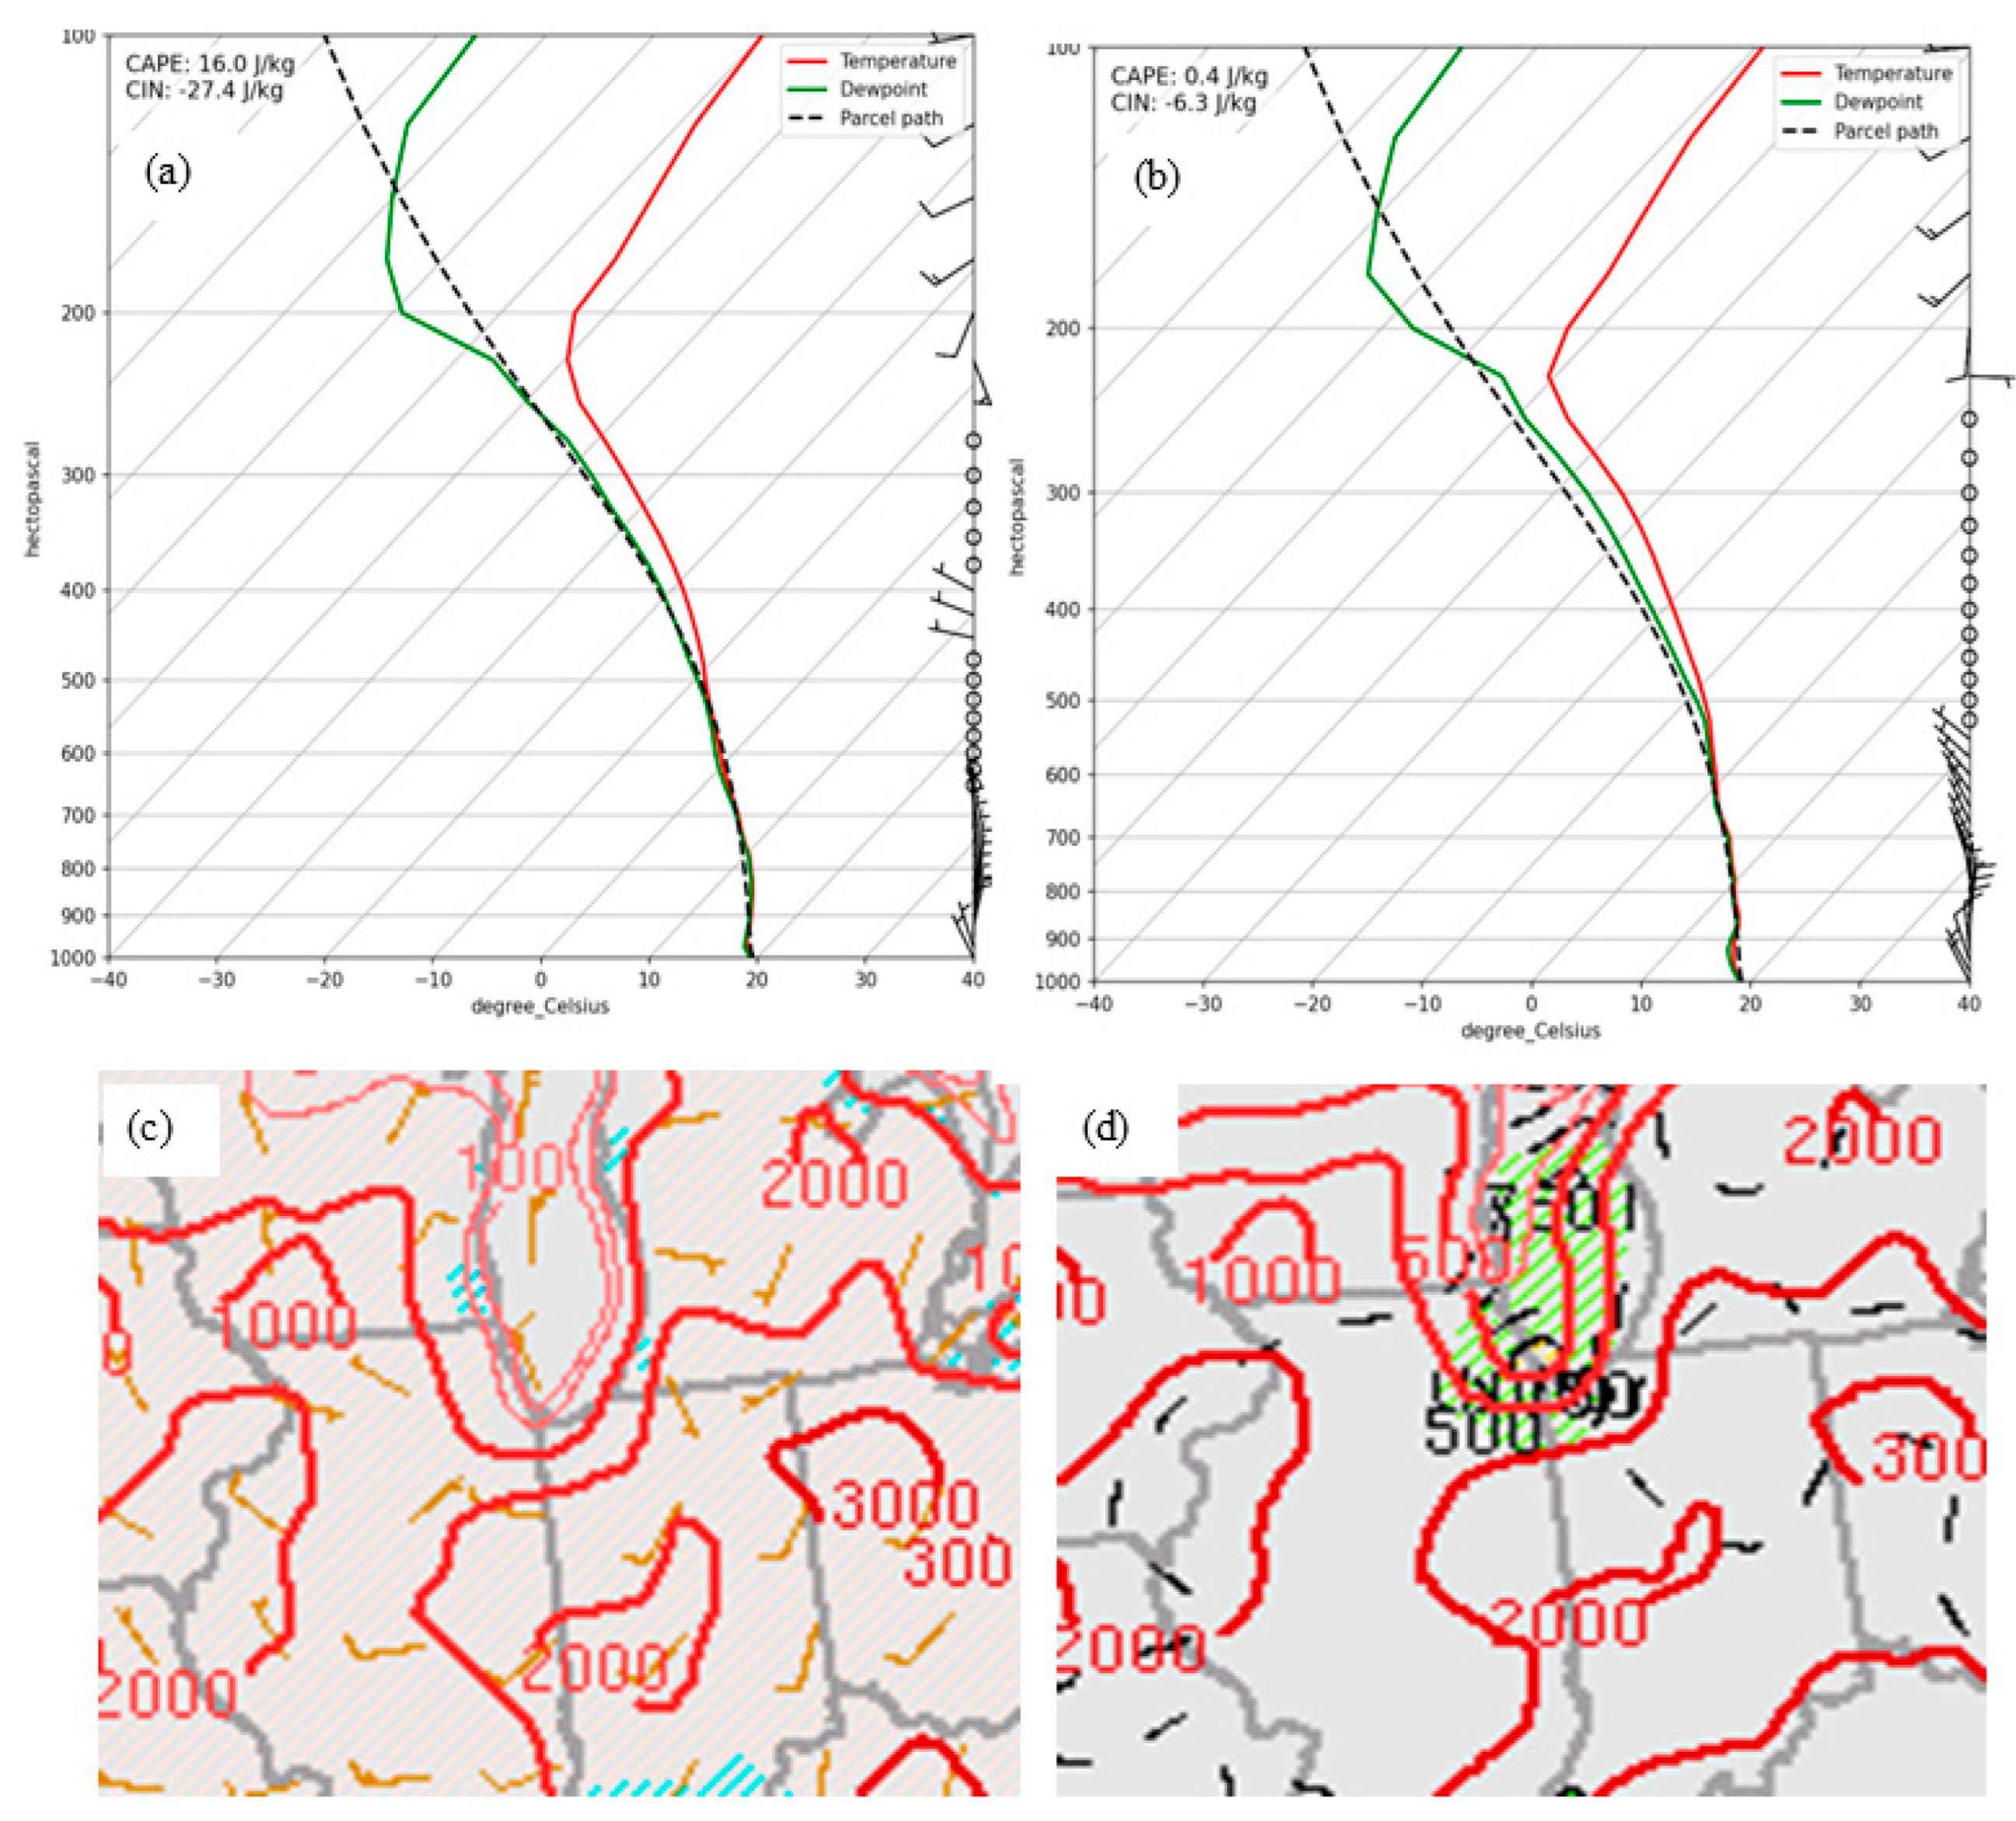
Figure 17.
As in Figure 6, Figure 7, Figure 8 and Figure 9, respectively, at a-h) 1800 UTC 2 July 2023.
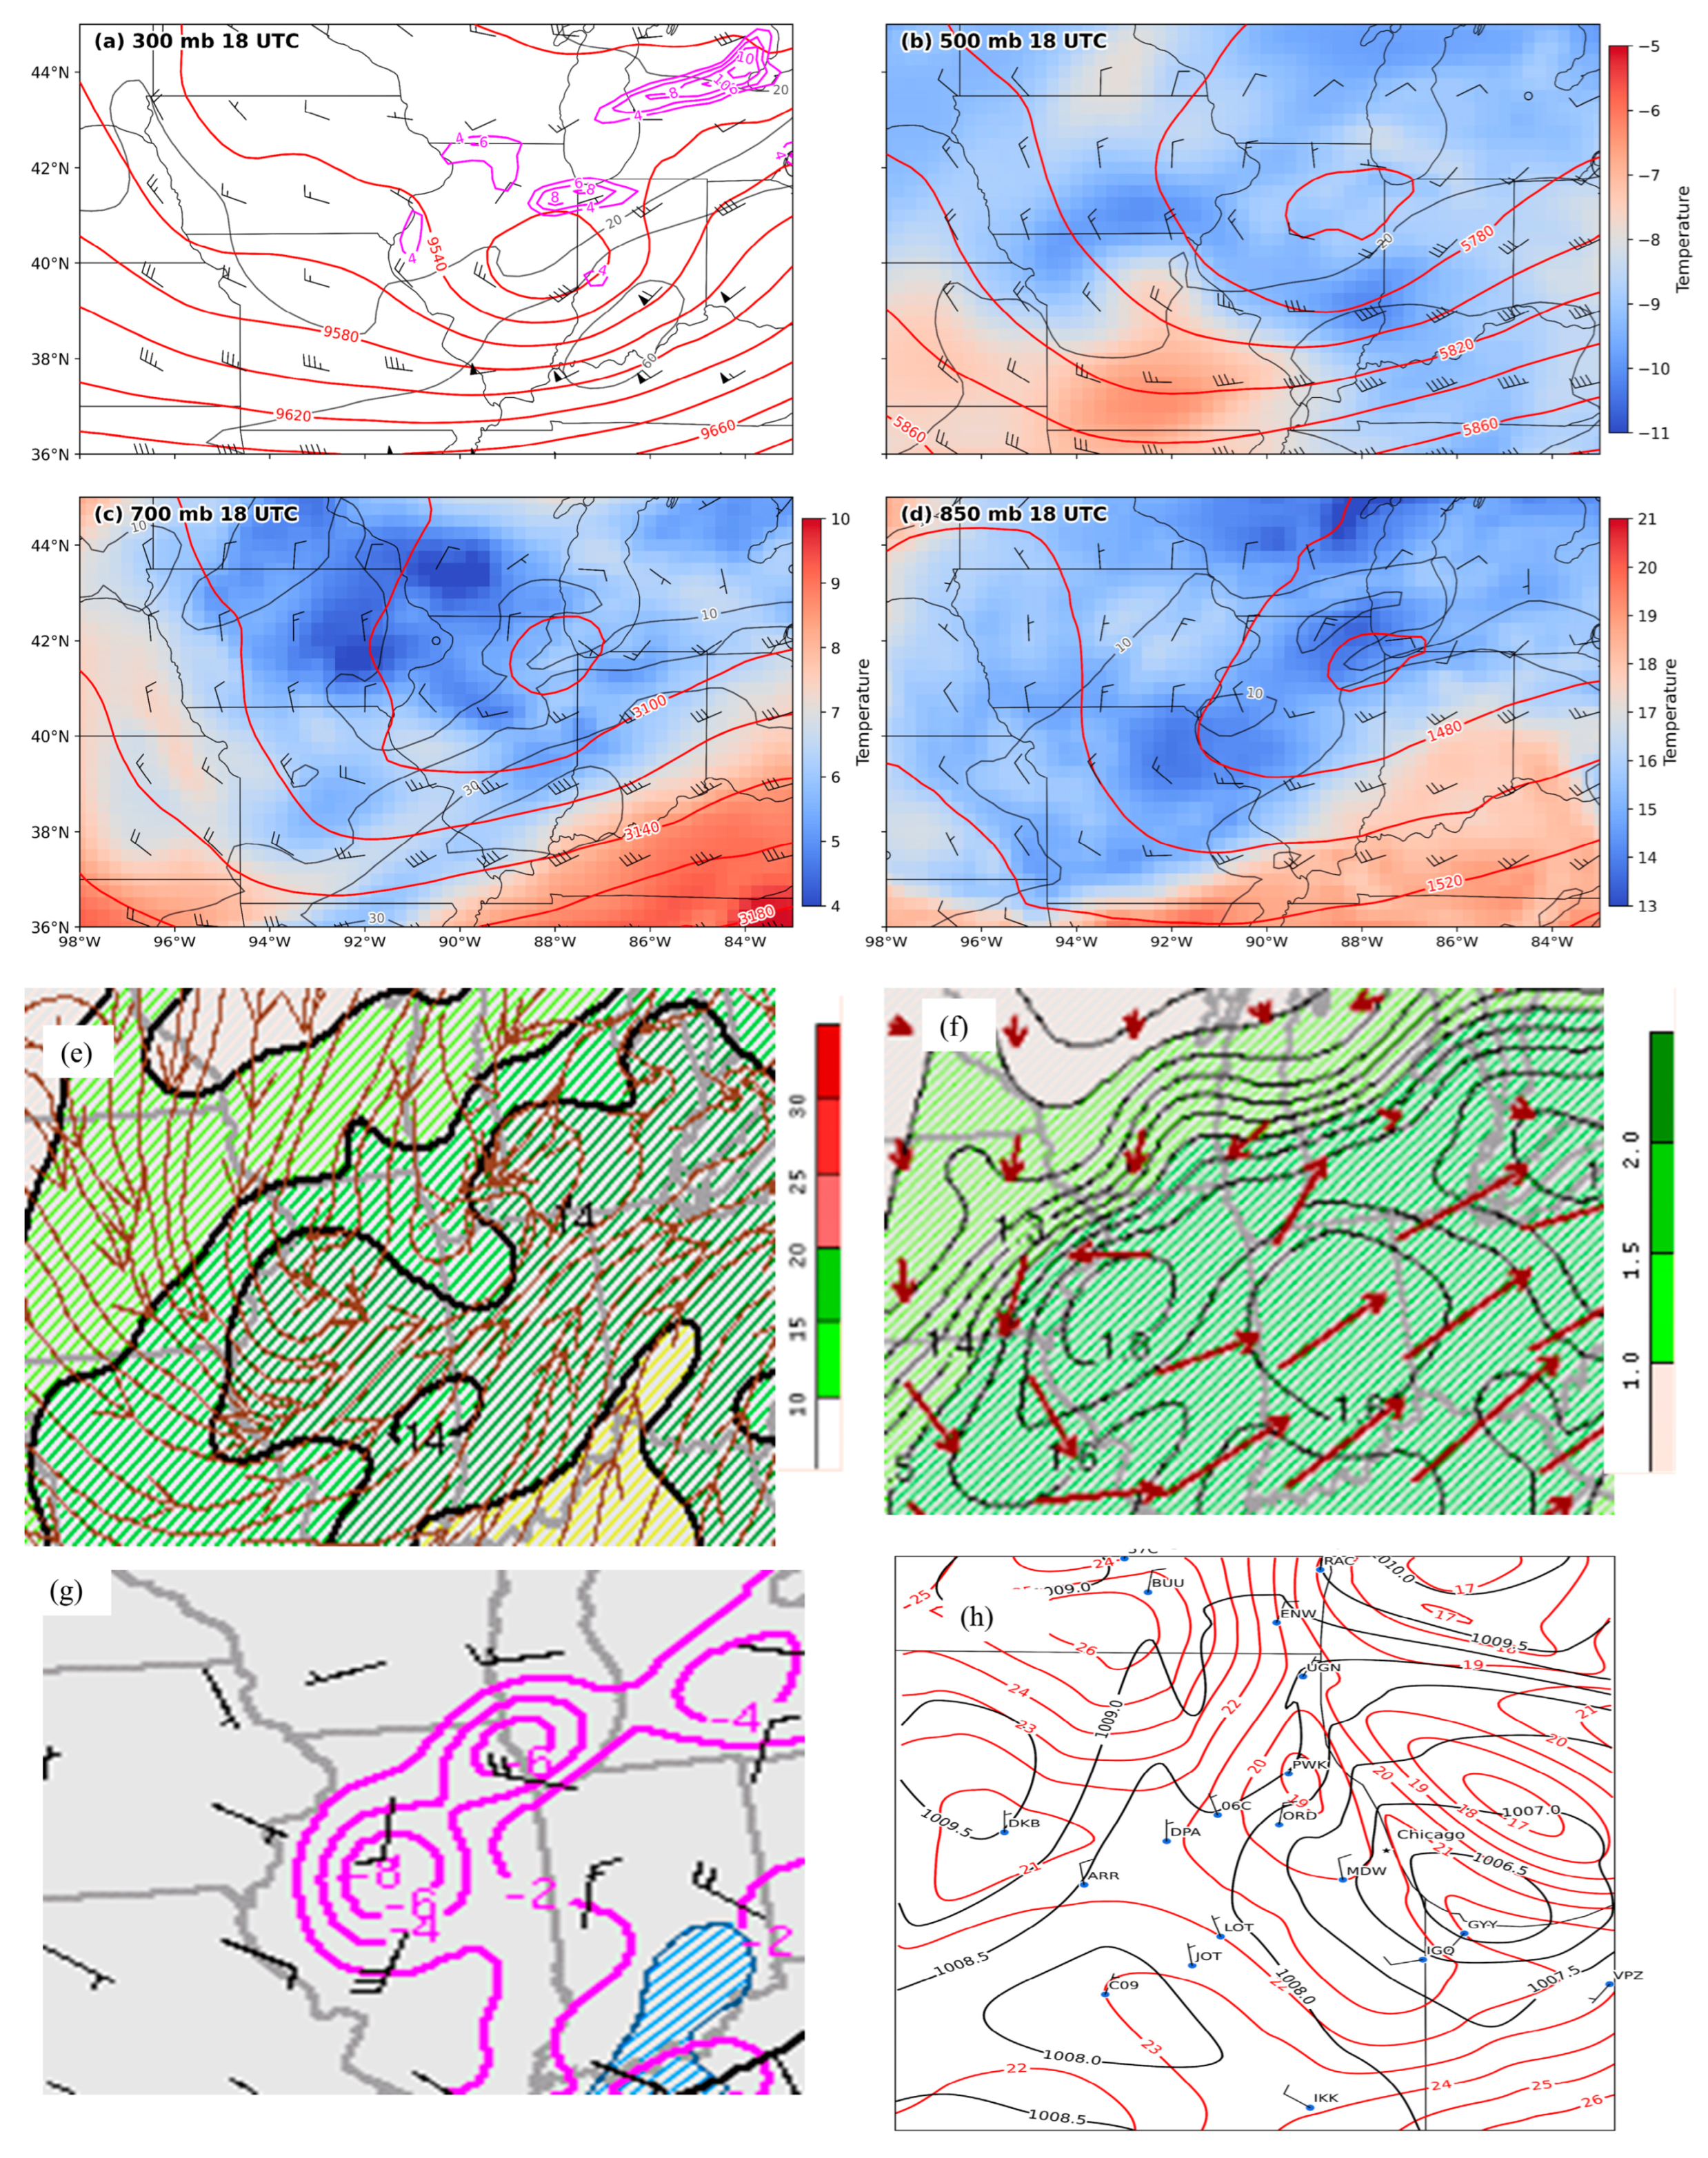
Figure 18.
As in Figure 6, Figure 7, Figure 8 and Figure 9, respectively, at a-h) 2000 UTC 2 July 2023.
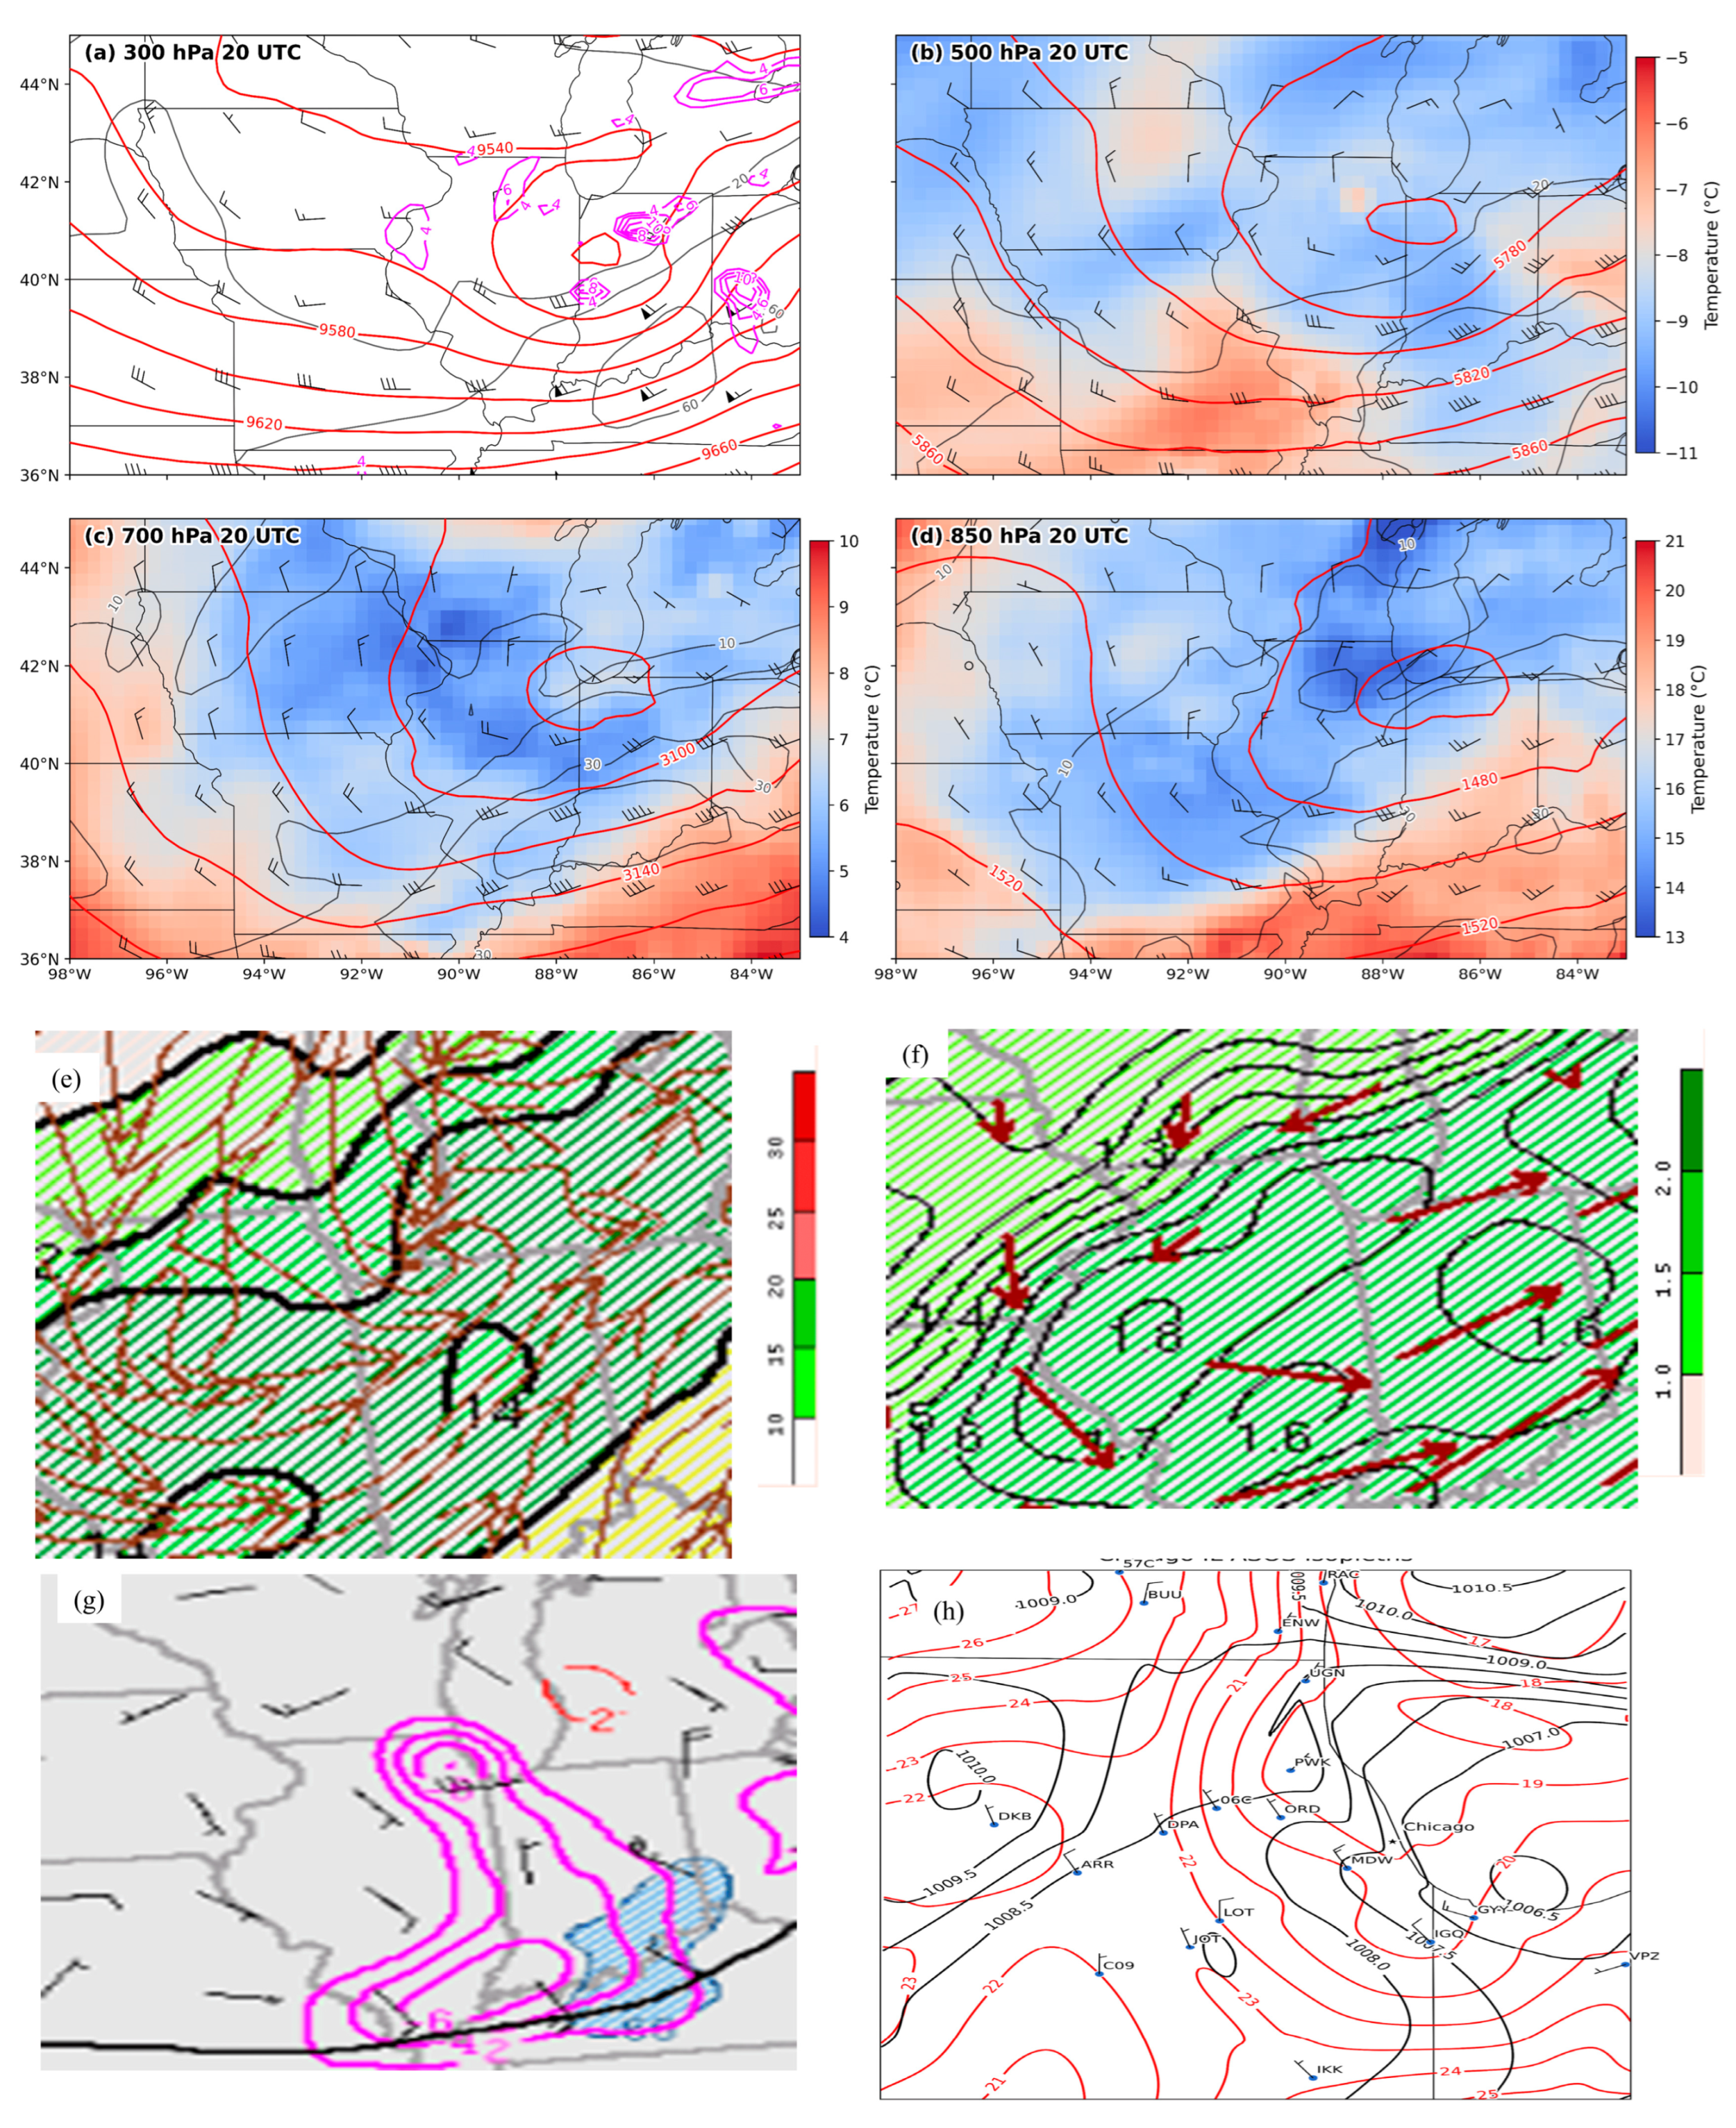
Figure 19.
NOAA NEXRAD Doppler radar composite imagery at a) 1530 UTC, b) 1600 UTC, c) 1630 UTC, d) 1700 UTC, e) 1730 UTC, f) 1800 UTC, g) 1830 UTC, h) 1900 UTC, i) 1930 UTC, j) 2000 UTC, k) 2030 UTC, and l) 2100 UTC 2 July 2023.
Figure 19.
NOAA NEXRAD Doppler radar composite imagery at a) 1530 UTC, b) 1600 UTC, c) 1630 UTC, d) 1700 UTC, e) 1730 UTC, f) 1800 UTC, g) 1830 UTC, h) 1900 UTC, i) 1930 UTC, j) 2000 UTC, k) 2030 UTC, and l) 2100 UTC 2 July 2023.
5.2. Convective Evolution (1500Z-2100Z)
Radar imagery in Figure 19 from 14Z7/2 to 21Z7/2 clearly indicates that the T-bone slowly drifts eastward across the city and while it does that five major changes occur: 1) the western flank rotates equatorward like a major deformation zone separating northerly from easterly flow hence increasing the lower-mid-tropospheric vorticity, 2) as this occurs eventually the southern side of that deformation zone thins southwestwards and progressively fills in like a mini baroclinic leaf system, 3) south-southeast of the location of 2) a dry surge is progressing towards the vortex center over the lake from the southwestern side of the metroplex, 4) significant vortical structure can be seen organizing over southwestern Lake Michigan, and 5) the radar intensity levels gradually weaken and become more uniform emblematic of continuous moderate stratiform precipitation with significant but progressively weaker dBZ levels. As time progresses, the precipitation zone over the metroplex narrows and weakens but only very slowly departs the city after 21Z7/2 thus ensuring a prolonged period of moderate-heavy stratiform precipitation which represents the ending of the second major precipitation period during which nearly half of the observed precipitation occurred near KMDW. All indicators of lower tropospheric winds in Figure 18 indicate a low-level jet from the east-northeast into the convective system after 15Z7/2 consistent with published studies of MCV [25,26]
6. Summary and Conclusions
ERA5, RAP, Doppler radar, and surface observations indicate a complex multi-scale evolution of the four structured convective features which organize the extreme dual component and extreme precipitation event of 2 July 2023 over a small region of Chicago. Critical to the convective features is a mid-upper-tropospheric jet streak and cold trough with its attendant dual isobaric PV maxima which nicely frames an evolving mid-upper tropospheric divergence and ascent pattern. Early on an MCS forms in south central Illinois in response to: 1) divergence aloft within the jet’s right entrance region in proximity to 2) a low-level confluent deformation zone and 3) low-level jet transporting large precipitable water values under drier air aloft into that deformation zone thus creating significant MUCAPE. As the central Illinois MCS strengthens and builds upscale, the downstream mid-upper tropospheric PV, divergence, and ascent shift to and strengthen within the jet’s left exit region. This transforms the MCS into the elongated west to east QLCS#1 over north central Illinois as the low-level confluence zone intensifies, thus transporting the moisture rich west-east boundary/deformation zone poleward towards the metroplex with significant SBCAPE and MUCAPE.
Following this first QLCS#1 organization, and after a brief weakening of that QLCS convection over the metroplex, a surface boundary/trough/meso-low strengthens over the city in response to the pressure falls under the jet’s left exit region and between the QLCS residual southerly flow and likely Lake Michigan enhanced surface northeasterly flow At ~15Z7/2 the surface deformation zone of the poleward propagating QLCS becomes nearly synonymous with the trough/mesolow over the middle of the metroplex while in the vertical, between 850 and 500 hPa, the deep cold closed low propagates over the city under the jet’s left exit region divergence maximum. A QLCS#2 system develops on the northeastern side of the metroplex and slowly propagates towards this city scale trough. While elevated dry air dissipates in response to ascent and moisture advection, significant CAPE becomes fixed in place over the city in proximity to the deep moisture maximum coupled to the low-level confluence zone. Heavy precipitation evolves as inferred from radar when the boundary between the southerly and northeasterly surface flow propagates southwestwards over the city. However, the most significant precipitation occurs with the first event near KMDW when a third QLCS rapidly propagates across the southeastern side of the metroplex and further energizes QLCS#2. Convection builds upscale as this highly confluent meso-β scale boundary between northeasterly, southeasterly, and southwesterly flow is deformed into a “T-bone” structure and is joined by an additional northeast-southwest oriented squall line equatorward of the T-bone feature. Surface pressure falls also indicate a meso-low near KMDW that eventually becomes the dominant meso-low relative to a secondary weaker meso-low on the southwest flank of the metroplex. This frames the initial heaviest precipitation period between KMDW and KORD with the surface winds and pressure reflecting the T-bone radar structure.
Shortly thereafter, a second region of precipitation is organized over the city as the massive previous upscale building precipitation area moves over southwestern Lake Michigan and takes on a more vortical structure as the flow aloft over the city reflects this deep vortex as winds aloft increase from the northeast, the static stability gradually increases, and the surface flow shifts to be more northerly and the earlier complex surface confluence boundary moves offshore. A narrowing but intense region of more uniform but moderate stratiform precipitation builds west-south-westward on the western flank of the offshore vortical feature creating a southwest-northeast narrow heavy rainfall region that appears much like a mesoscale baroclinic leaf precipitation zone coupled to the MCV. In this back building precipitation region over the city the second period of heavy precipitation occurs between KMDW and KORD. Eventually the precipitation ends when this wrap-around feature slowly propagates east-southeastwards and dissipates after 22Z7/2.
In Part II of this manuscript, we will fill in the details of convective evolution over the city focusing on the role of the Lake Michigan breeze convergence zones and their possible control of the multiple QLCS and the evolving MCV. We will focus on meso-γ scale simulations differentiating urban canopy scale forcing from more conventional land surface representation to better diagnose how the urban heat island and city drag modifies the Lake Michigan breeze forcing of convective evolution.
Author Contributions
Conceptualization, M.L.K.; Methodology, M.L.K. and M.S.H. ; Software, M.S.H.; Validation, M.L.K. and M.S.H.; Formal analysis, M.S.H.; Investigation, M.L.K. and M.S.H..; Data curation, M.S.H.; Writing—original draft, M.L.K.; Writing—review and editing, M.L.K., M.S.H. and Y.-L.L.; Visualization, M.S.H.; Project administration, Y.-L.L.; Funding acquisition, Y.-L.L. All authors have read and agreed to the published version of the manuscript.
Funding
This research was funded by the Department of Energy under contract # DE-SC0023240.
Data Availability Statement
The ERA5 data using this study are openly available from the NCAR’s Research Data Archive (https://doi.org/10.5065/BH6N-5N20)ascitedin ECMWF (2019). RAP-based mesoscale analysis fields were obtained from the NOAA Storm Prediction Center (SPC) mesoanalysis archive (https://www.spc.noaa.gov/exper/ma_archive/). The NEXRAD radar data used in this study are publicly available from NOAA/NCEI. The dataset is cited as: NOAA National Weather Service Radar Operations Center (1991), NOAA Next Generation Radar (NEXRAD) Level-II Base Data, NOAA National Centers for Environmental Information, DOI: 10.7289/V5W9574V.
Acknowledgments
This research was funded by the Department of Energy under contract # DE-SC0023240 for the Community Research on Climate and Urban Science (CROCUS) Program. The authors would like to acknowledge NCAR and the Computational and Information Systems Laboratory (CISL) for their support of computing times on the Derecho supercomputer (Project No. UNCT0005 and UNCT0012). The comments from anonymous reviewers, which helped to improve the quality of the paper, are highly appreciated.
Conflicts of Interest
The authors declare that there are no conflicts of interest. Funding agencies did not participate in the design, data handling, analysis, or publication decisions related to this study.
Abbreviations
The following abbreviations are used in this manuscript:
| KMDW | Chicago Midway International Airport |
| KORD | Chicago O’Hare International Airport |
| ERA5 | European Centre for Medium-Range Weather Forecasts Reanalysis v5 |
| RAP | Rapid Refresh analysis data |
| PV | Potential Vorticity |
| MCS | Mesoscale Convective System |
| MUCAPE | Most Unstable Convective Available Potential Energy |
| SBCAPE | Surface Based Convective Available Potential Energy |
| QLCS | Quasi-Linear Convective System |
| SPC | Storm Prediction Center |
References
- Wang, J.; Zhou, L.; Han, D. Hydrological Model Adaptability to Rainfall Inputs of Varied Quality - Wang - 2023 - Water Resources Research - Wiley Online Library. Available online: https://agupubs.onlinelibrary.wiley.com/doi/full/10.1029/2022WR032484 (accessed on 4 June 2026).
- Lincoln, W.S. 4 The July 2 and September 17, 2023, Flash 5 Flood Events in the Chicago Metro Area. [CrossRef] [PubMed]
- Nash, W.P.; Chamberlain, L.W. SOME ASPECTS OF THE HEAVY RAINS IN THE CHICAGO AREA, OCTOBER 9–11; 1954. [Google Scholar]
- Huff, F.A.; Hiser, H.W.; Stout, G.E. The October 1954 Storm in Northern Illinois; 1955. [Google Scholar]
- Huff, F.A.; Semonin, R.G.; Jr, S.A.C.; Jones, D.M.A. Hydrometeorological Analysis of Severe Rainstorms in Illinois: 1956-1957 with Summary of Previous Storms; 1958. [Google Scholar]
- Huff, F.A.; Vogel, J.L. Hydrometeorological Analysis of Severe Rainstorms in Illinois 1956-1957 with Summary of Previous Storms.; Illinois State Water Survey., 1958. [Google Scholar]
- Huff, F.A.; Angel, J.R. Bulletin 70, State Climatologist Office, Illinois State Water Survey, U of I. Available online: https://www.isws.illinois.edu/statecli/rf/download.htm (accessed on 2 June 2026).
- Merzlock, P. The Record Rainfall of August 13-14, 1987 at Chicago, Illinois. Available online: https://repository.library.noaa.gov (accessed on 3 June 2026).
- Balding, G.O.; Ishii, A.L. Floods of September 26 - October 4, 1986, and August 14-17, 1987, in Illinois; 1993. [Google Scholar]
- Holmes, R.R.; Kupka, A.L. Floods of July 18-20, 1996, in Northern Illinois; 1997. [Google Scholar]
- Changnon, S.A. Record Flood-Producing Rainstorms of 17–18 July 1996 in the Chicago Metropolitan Area. Part III: Impacts and Responses to the Flash Flooding; 1999. [Google Scholar]
- Changnon, S.A.; Kunkel, K.E. Record Flood-Producing Rainstorms of 17–18 July 1996 in the Chicago Metropolitan Area. Part I: Synoptic and Mesoscale Features; 1999. [Google Scholar] [CrossRef] [PubMed]
- Changnon, S.A.; Westcott, N.E. A Rec. Number Heavy Rainstorms Chic. 2001 2001. [CrossRef]
- Lincoln, W.S.; Ford, T. An Analysis of Extreme Rainfall Events in Chicago and Vicinity Since 1950; Central Region Technical Service Publication, 2024. [Google Scholar]
- Kaplan, M.L.; Karim, S.M.S.; Lin, Y.-L. Urban Impacts on Convective Squall Lines over Chicago in the Warm Season—Part I: Observations of Multi-Scale Convective Evolution. Atmosphere 2025, 16, 306. [Google Scholar] [CrossRef]
- Karim, S.M.S.; Kaplan, M.L.; Lin, Y.-L. Urban Impacts on Convective Squall Lines over Chicago in the Warm Season—Part II: A Numerical Study of Urban Infrastructure Effects on the Evolution of City-Scale Convection. Atmosphere 2025, 16, 652. [Google Scholar] [CrossRef]
- Steensen, B.M.; Marelle, L.; Hodnebrog, Ø.; Myhre, G. Future Urban Heat Island Influence on Precipitation. Clim. Dyn. 2022, 58, 3393–3403. [Google Scholar] [CrossRef]
- ERA5 Reanalysis (0.25 Degree Latitude-Longitude Grid) - DASH Search. Available online: https://data.ucar.edu/dataset/era5-reanalysis-0-25-degree-latitude-longitude-grid (accessed on 2 June 2026).
- Information (NCEI); N.C. for E. Rapid Refresh (RAP) [13 Km]. Available online: https://www.ncei.noaa.gov/access/metadata/landing-page/bin/iso?id=gov.noaa.ncdc:C00690 (accessed on 8 June 2026).
- Archive SPC Mesoscale Analysis (HTML5 JavaScript Version). Available online: https://www.spc.noaa.gov/exper/ma_archive/ (accessed on 8 June 2026).
- University of Wyoming Atmospheric Science Radiosonde Archive. Available online: https://weather.uwyo.edu/upperair/sounding.shtml (accessed on 8 June 2026).
- MesoWest Data. Available online: https://mesowest.utah.edu/index.html (accessed on 8 June 2026).
- Team, N.G. Radar Data. Available online: https://www.ncei.noaa.gov/maps/ (accessed on 8 June 2026).
- Plymouth State University Weather Center. Available online: https://vortex.plymouth.edu/ (accessed on 8 June 2026).
- Davis, C.; Atkins, N.; Bartels, D. THE BOW ECHO AND MCV EXPERIMENT: Observations and Opportunities. 85, 1075–1093. [CrossRef]
- Schumacher, R.S.; Johnson, R.H. Quasi-Stationary, Extreme-Rain-Producing Convective Systems Associated with Midlevel Cyclonic Circulations. 2009. [Google Scholar] [CrossRef]
Figure 1.
(a) Observed precipitation on July 2, 2023, in Chicago from the CROCUS observational network as well as ASOS and COOP observers (J. Wang personal communication). (b) Impacts from flooding on 2 July 2023 [14].(c) Study area and focused Chicago rainfall corridor. The right panel shows the broader regional domain, and the left panel highlights rainfall distribution, nearby cities, and weather stations around Chicago.
Figure 1.
(a) Observed precipitation on July 2, 2023, in Chicago from the CROCUS observational network as well as ASOS and COOP observers (J. Wang personal communication). (b) Impacts from flooding on 2 July 2023 [14].(c) Study area and focused Chicago rainfall corridor. The right panel shows the broader regional domain, and the left panel highlights rainfall distribution, nearby cities, and weather stations around Chicago.
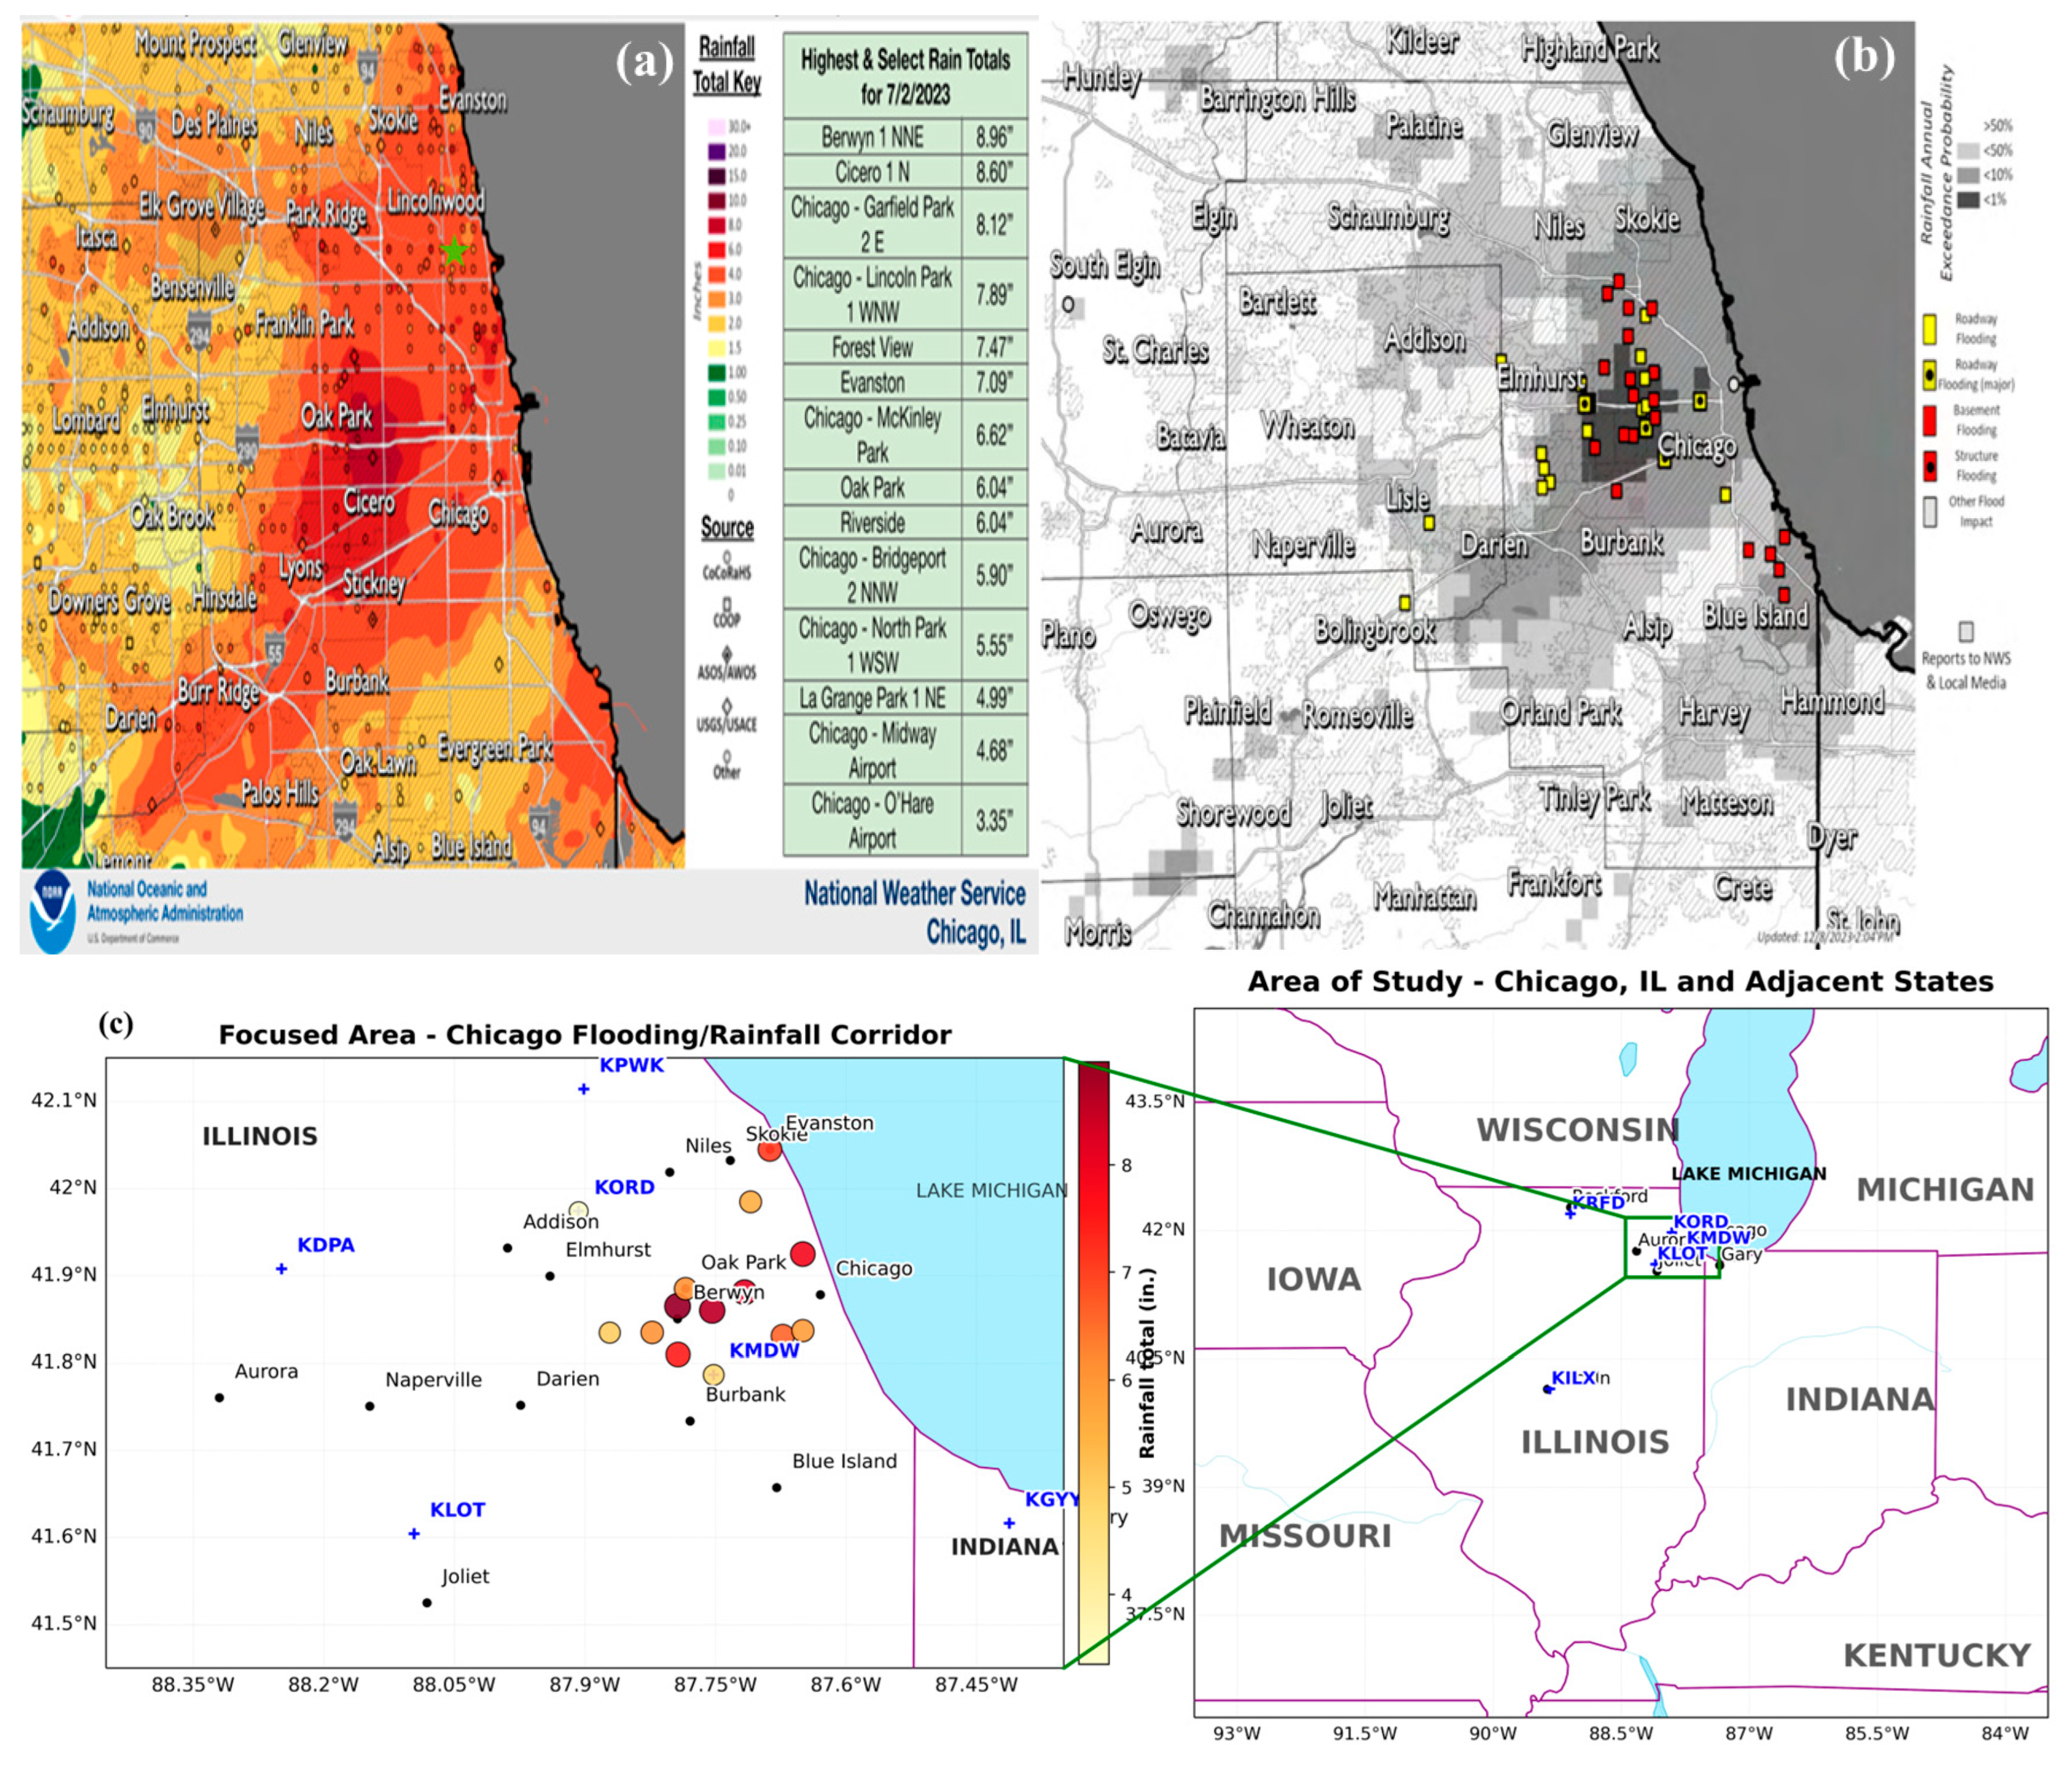
Figure 2.
RAP 400-250 hPa isobaric PV (shaded in PV units (PVU), where 1 PVU = 10−6m2s−1K kg−1), PV advection (solid blue positive, dashed red negative in PVUx103s−1) -and 300 hPa streamlines (black solid) valid at a) 0000 UTC, b) 0300 UTC, c) 0600 UTC, and d) 0900 UTC 2 July 2023.
Figure 2.
RAP 400-250 hPa isobaric PV (shaded in PV units (PVU), where 1 PVU = 10−6m2s−1K kg−1), PV advection (solid blue positive, dashed red negative in PVUx103s−1) -and 300 hPa streamlines (black solid) valid at a) 0000 UTC, b) 0300 UTC, c) 0600 UTC, and d) 0900 UTC 2 July 2023.
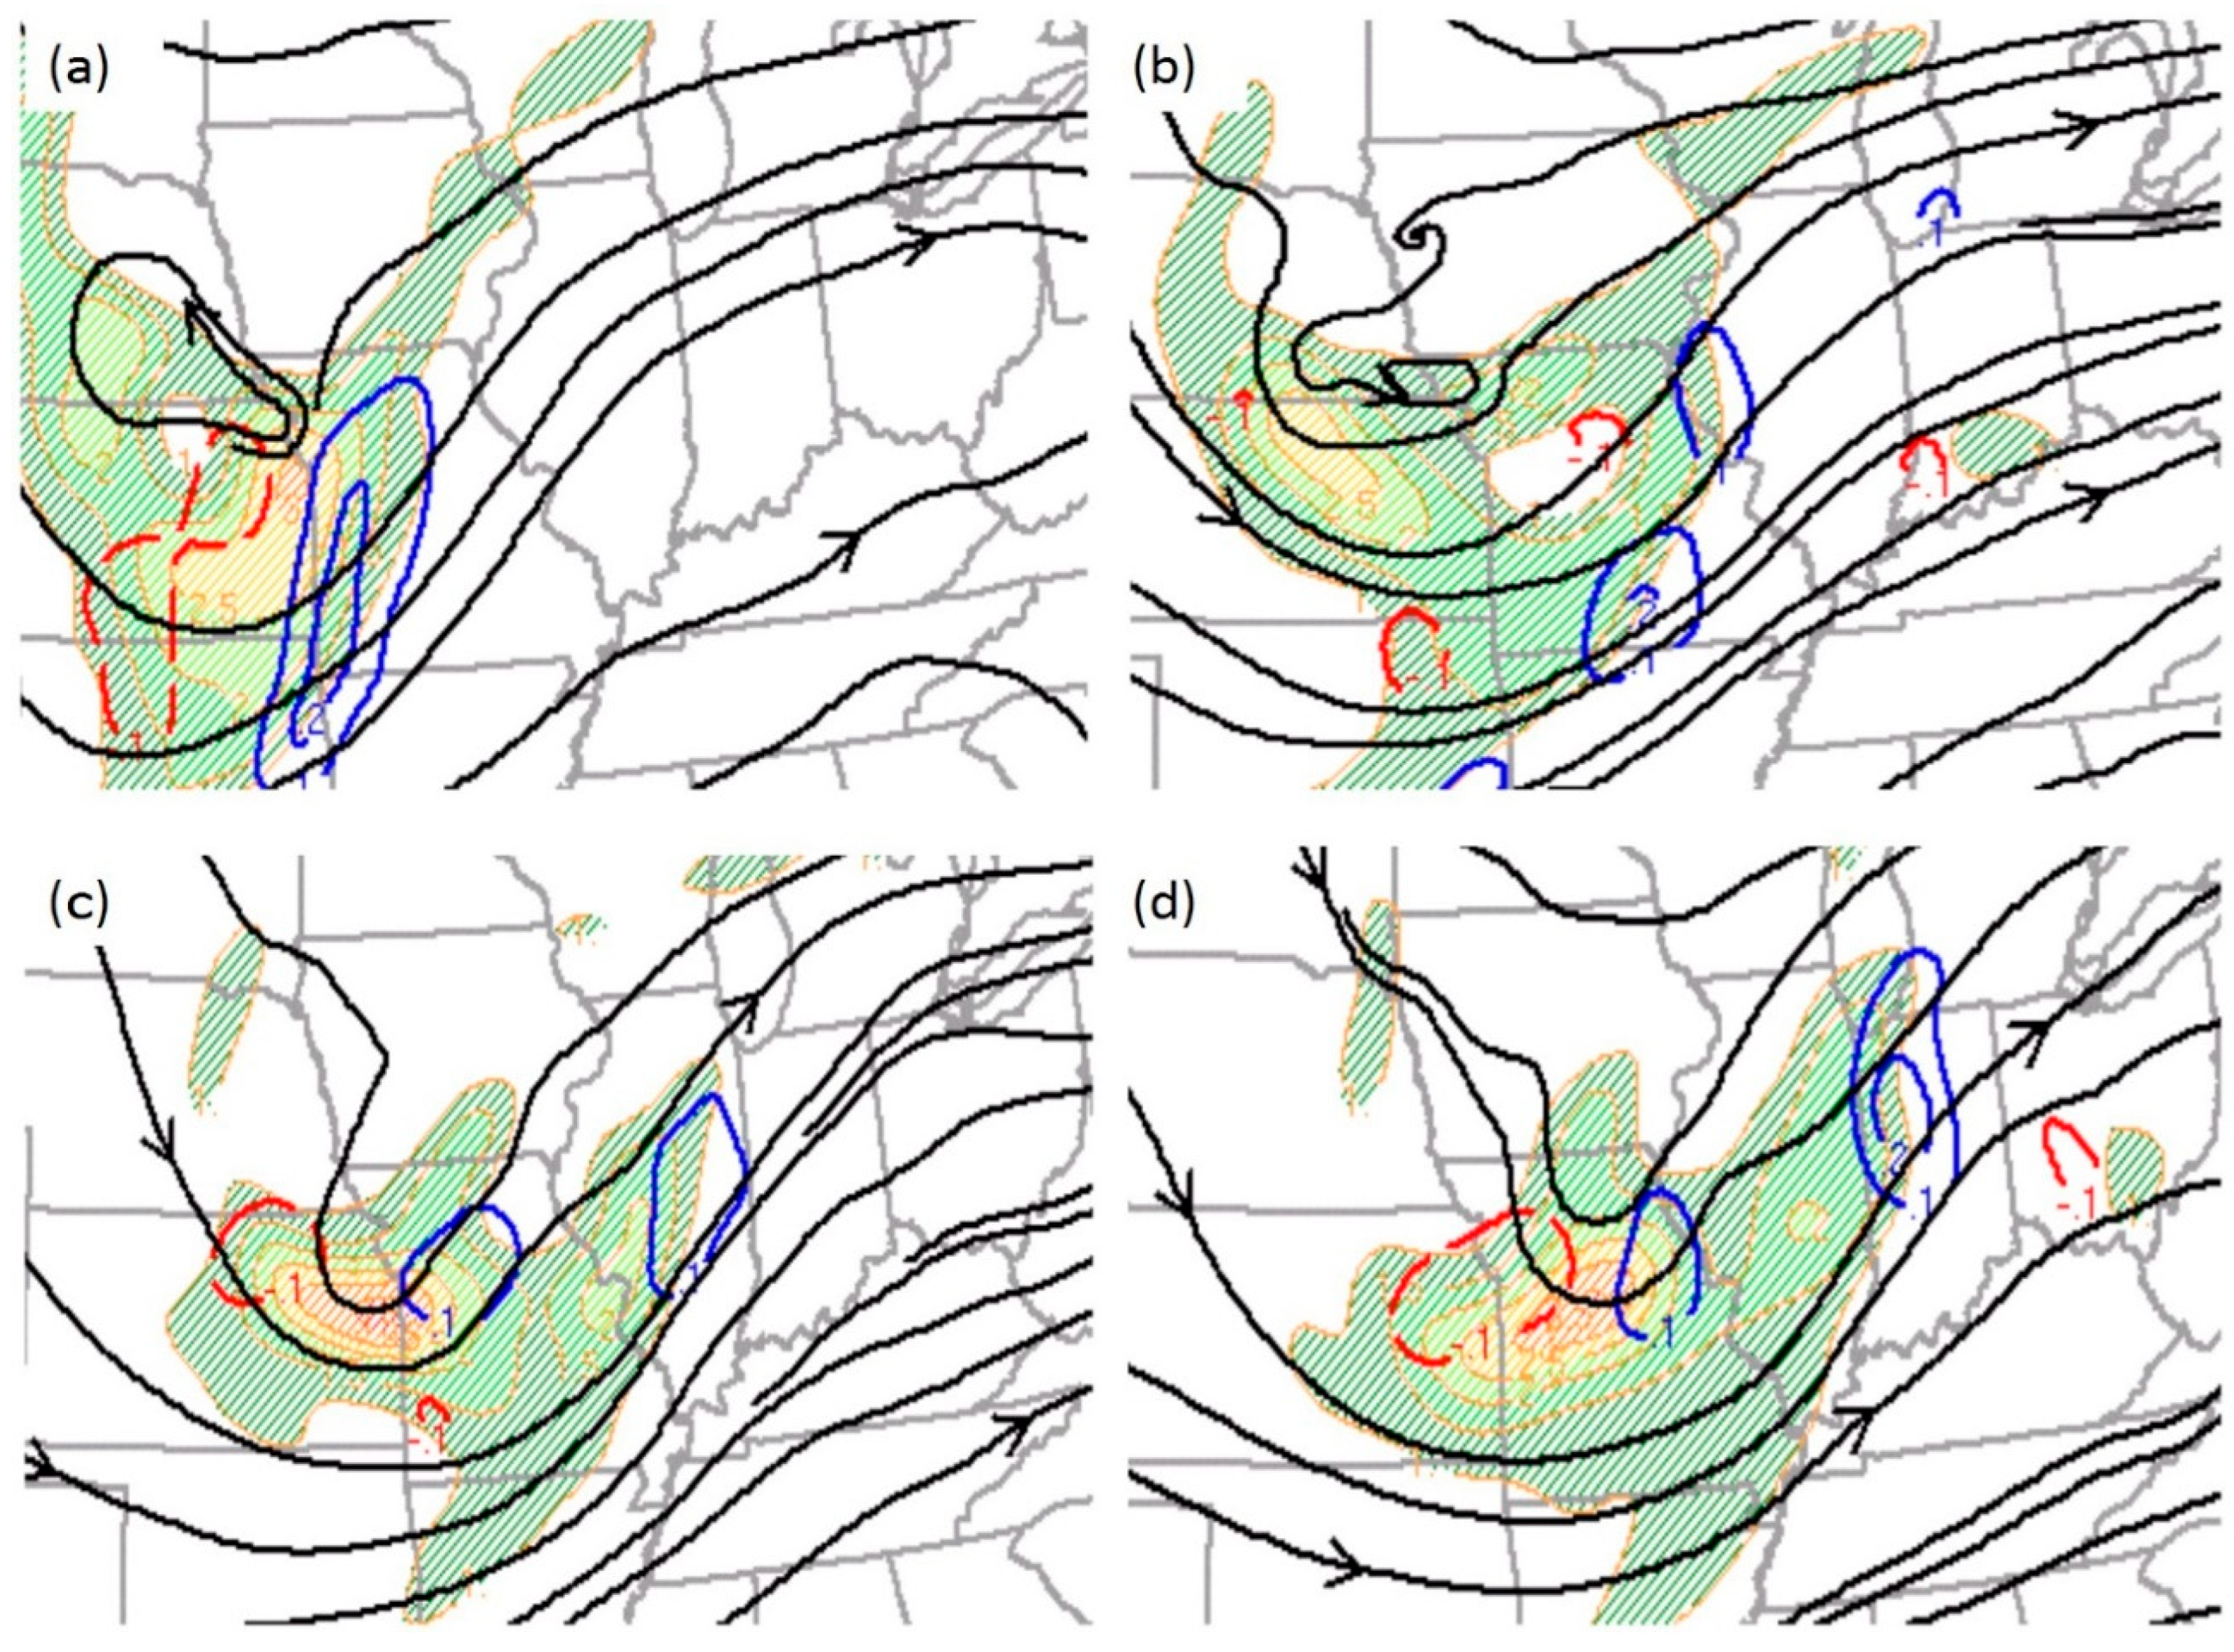
Figure 3.
ERA5 300 hPa height (red solid in m), wind barbs (ms−1), isotachs (black solid in kt), and divergence (magenta in 10−4s−1) at a) 0000 UTC, b) 0300 UTC, c) 0600 UTC, and d) 0900 UTC 2 July 2023.
Figure 3.
ERA5 300 hPa height (red solid in m), wind barbs (ms−1), isotachs (black solid in kt), and divergence (magenta in 10−4s−1) at a) 0000 UTC, b) 0300 UTC, c) 0600 UTC, and d) 0900 UTC 2 July 2023.
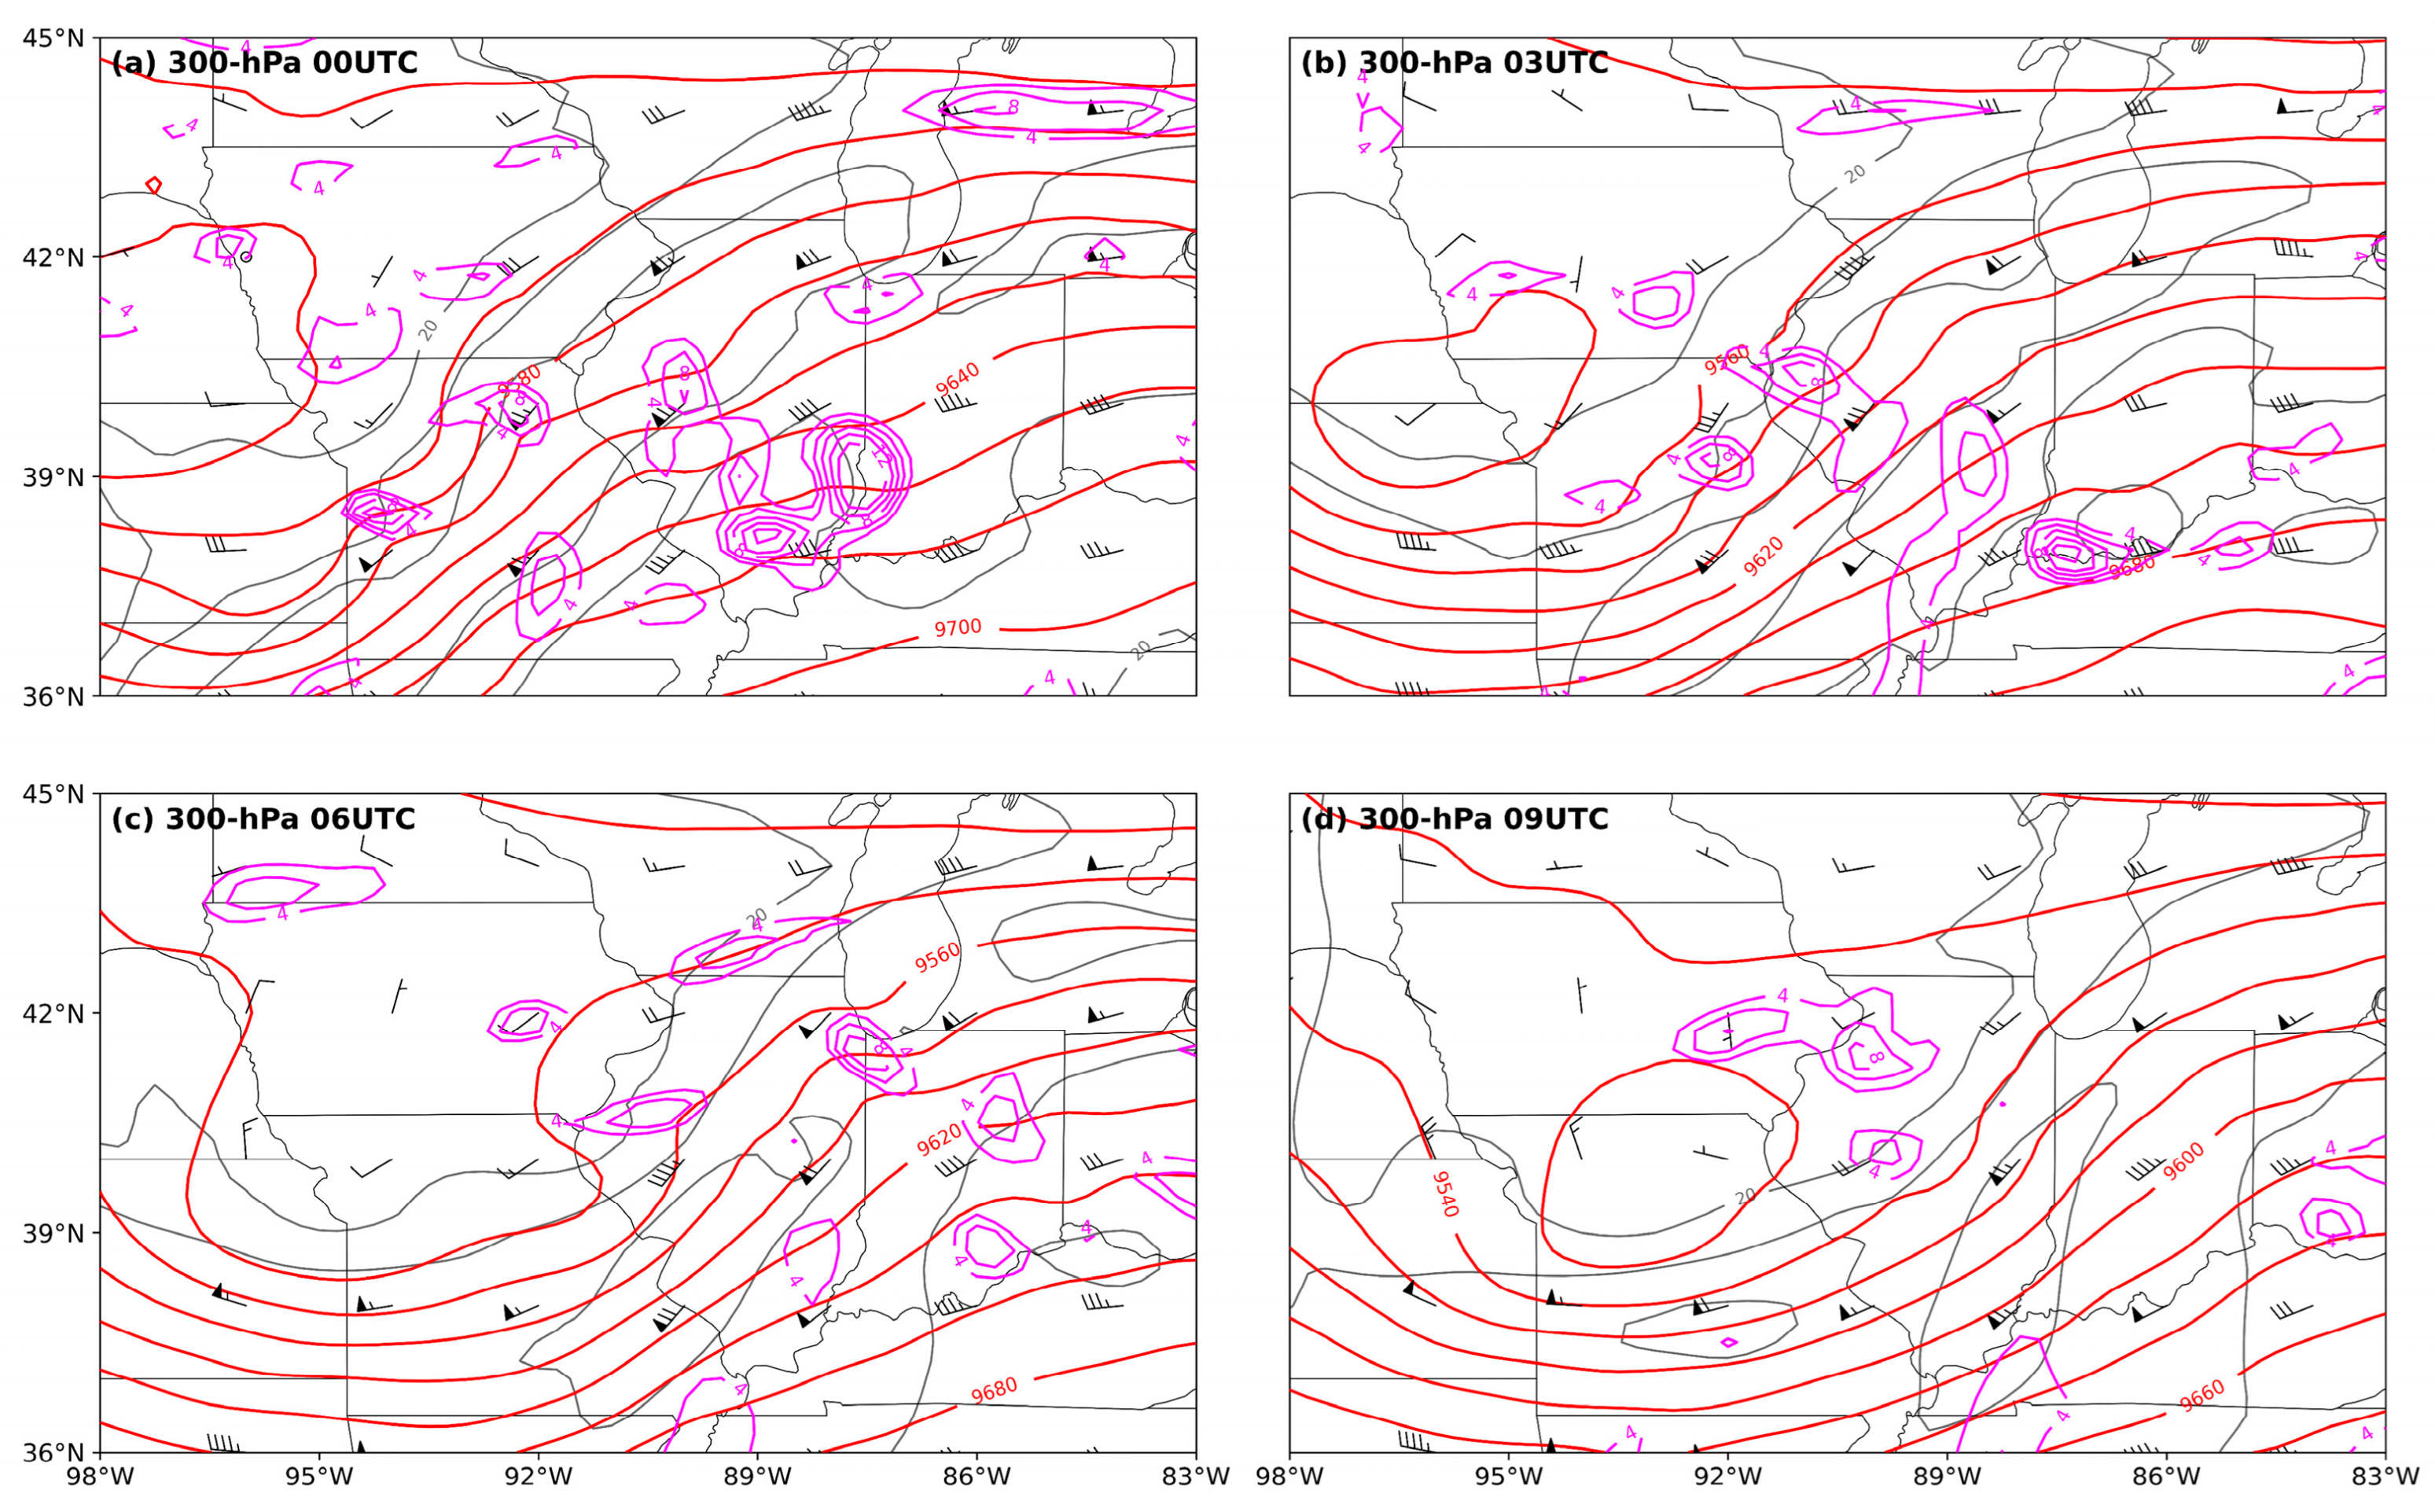
Figure 4.
RAP 300 hPa height (solid in m), isotachs (shaded in kt), ageostrophic wind barbs (kt), and 700-500 hPa mean omega (magenta in μbs−1) valid at a) 0000 UTC, b) 0300 UTC, c) 0600 UTC, and d) 0900 UTC 2 July 2023.
Figure 4.
RAP 300 hPa height (solid in m), isotachs (shaded in kt), ageostrophic wind barbs (kt), and 700-500 hPa mean omega (magenta in μbs−1) valid at a) 0000 UTC, b) 0300 UTC, c) 0600 UTC, and d) 0900 UTC 2 July 2023.
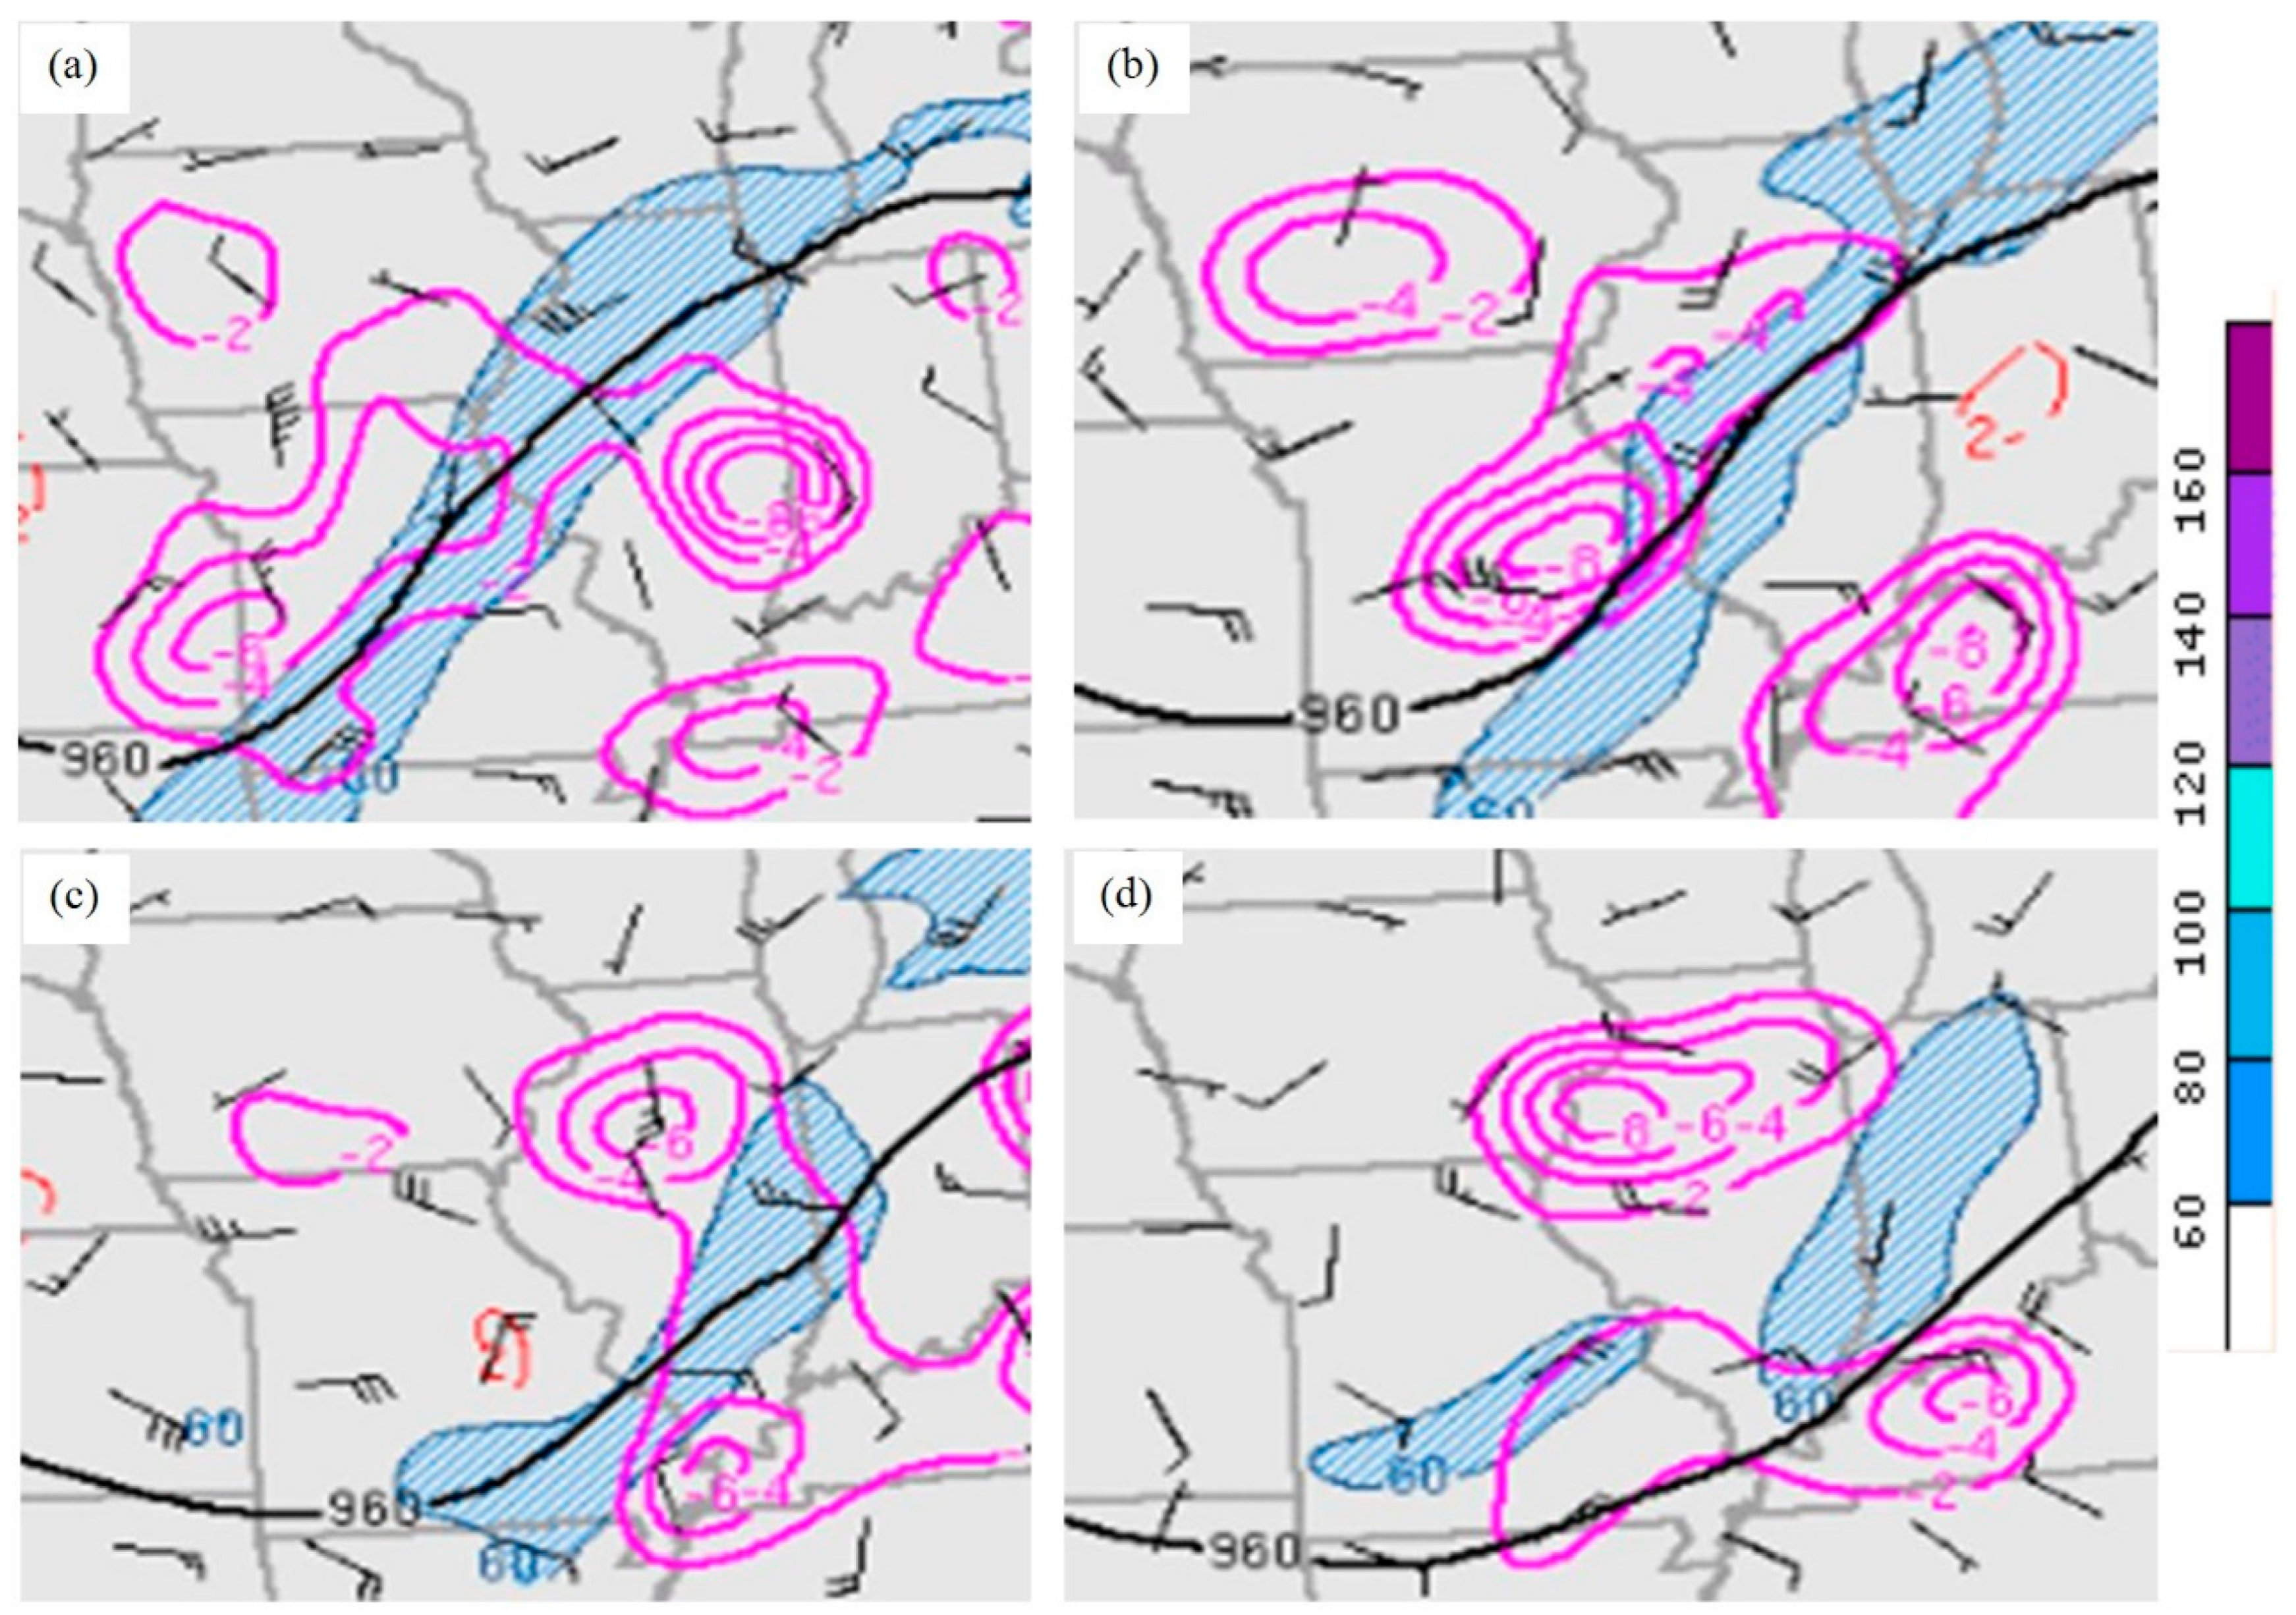
Figure 5.
NOAA NEXRAD Doppler radar composite imagery at a) 0000 UTC, b) 0300 UTC, c) 0400 UTC, d) 0500 UTC, e) 0600 UTC and f) 0700 UTC 2 July 2023. Note the organization and evolution of QLCS#1 poleward (Fig. d) towards Chicago from central Illinois.
Figure 5.
NOAA NEXRAD Doppler radar composite imagery at a) 0000 UTC, b) 0300 UTC, c) 0400 UTC, d) 0500 UTC, e) 0600 UTC and f) 0700 UTC 2 July 2023. Note the organization and evolution of QLCS#1 poleward (Fig. d) towards Chicago from central Illinois.
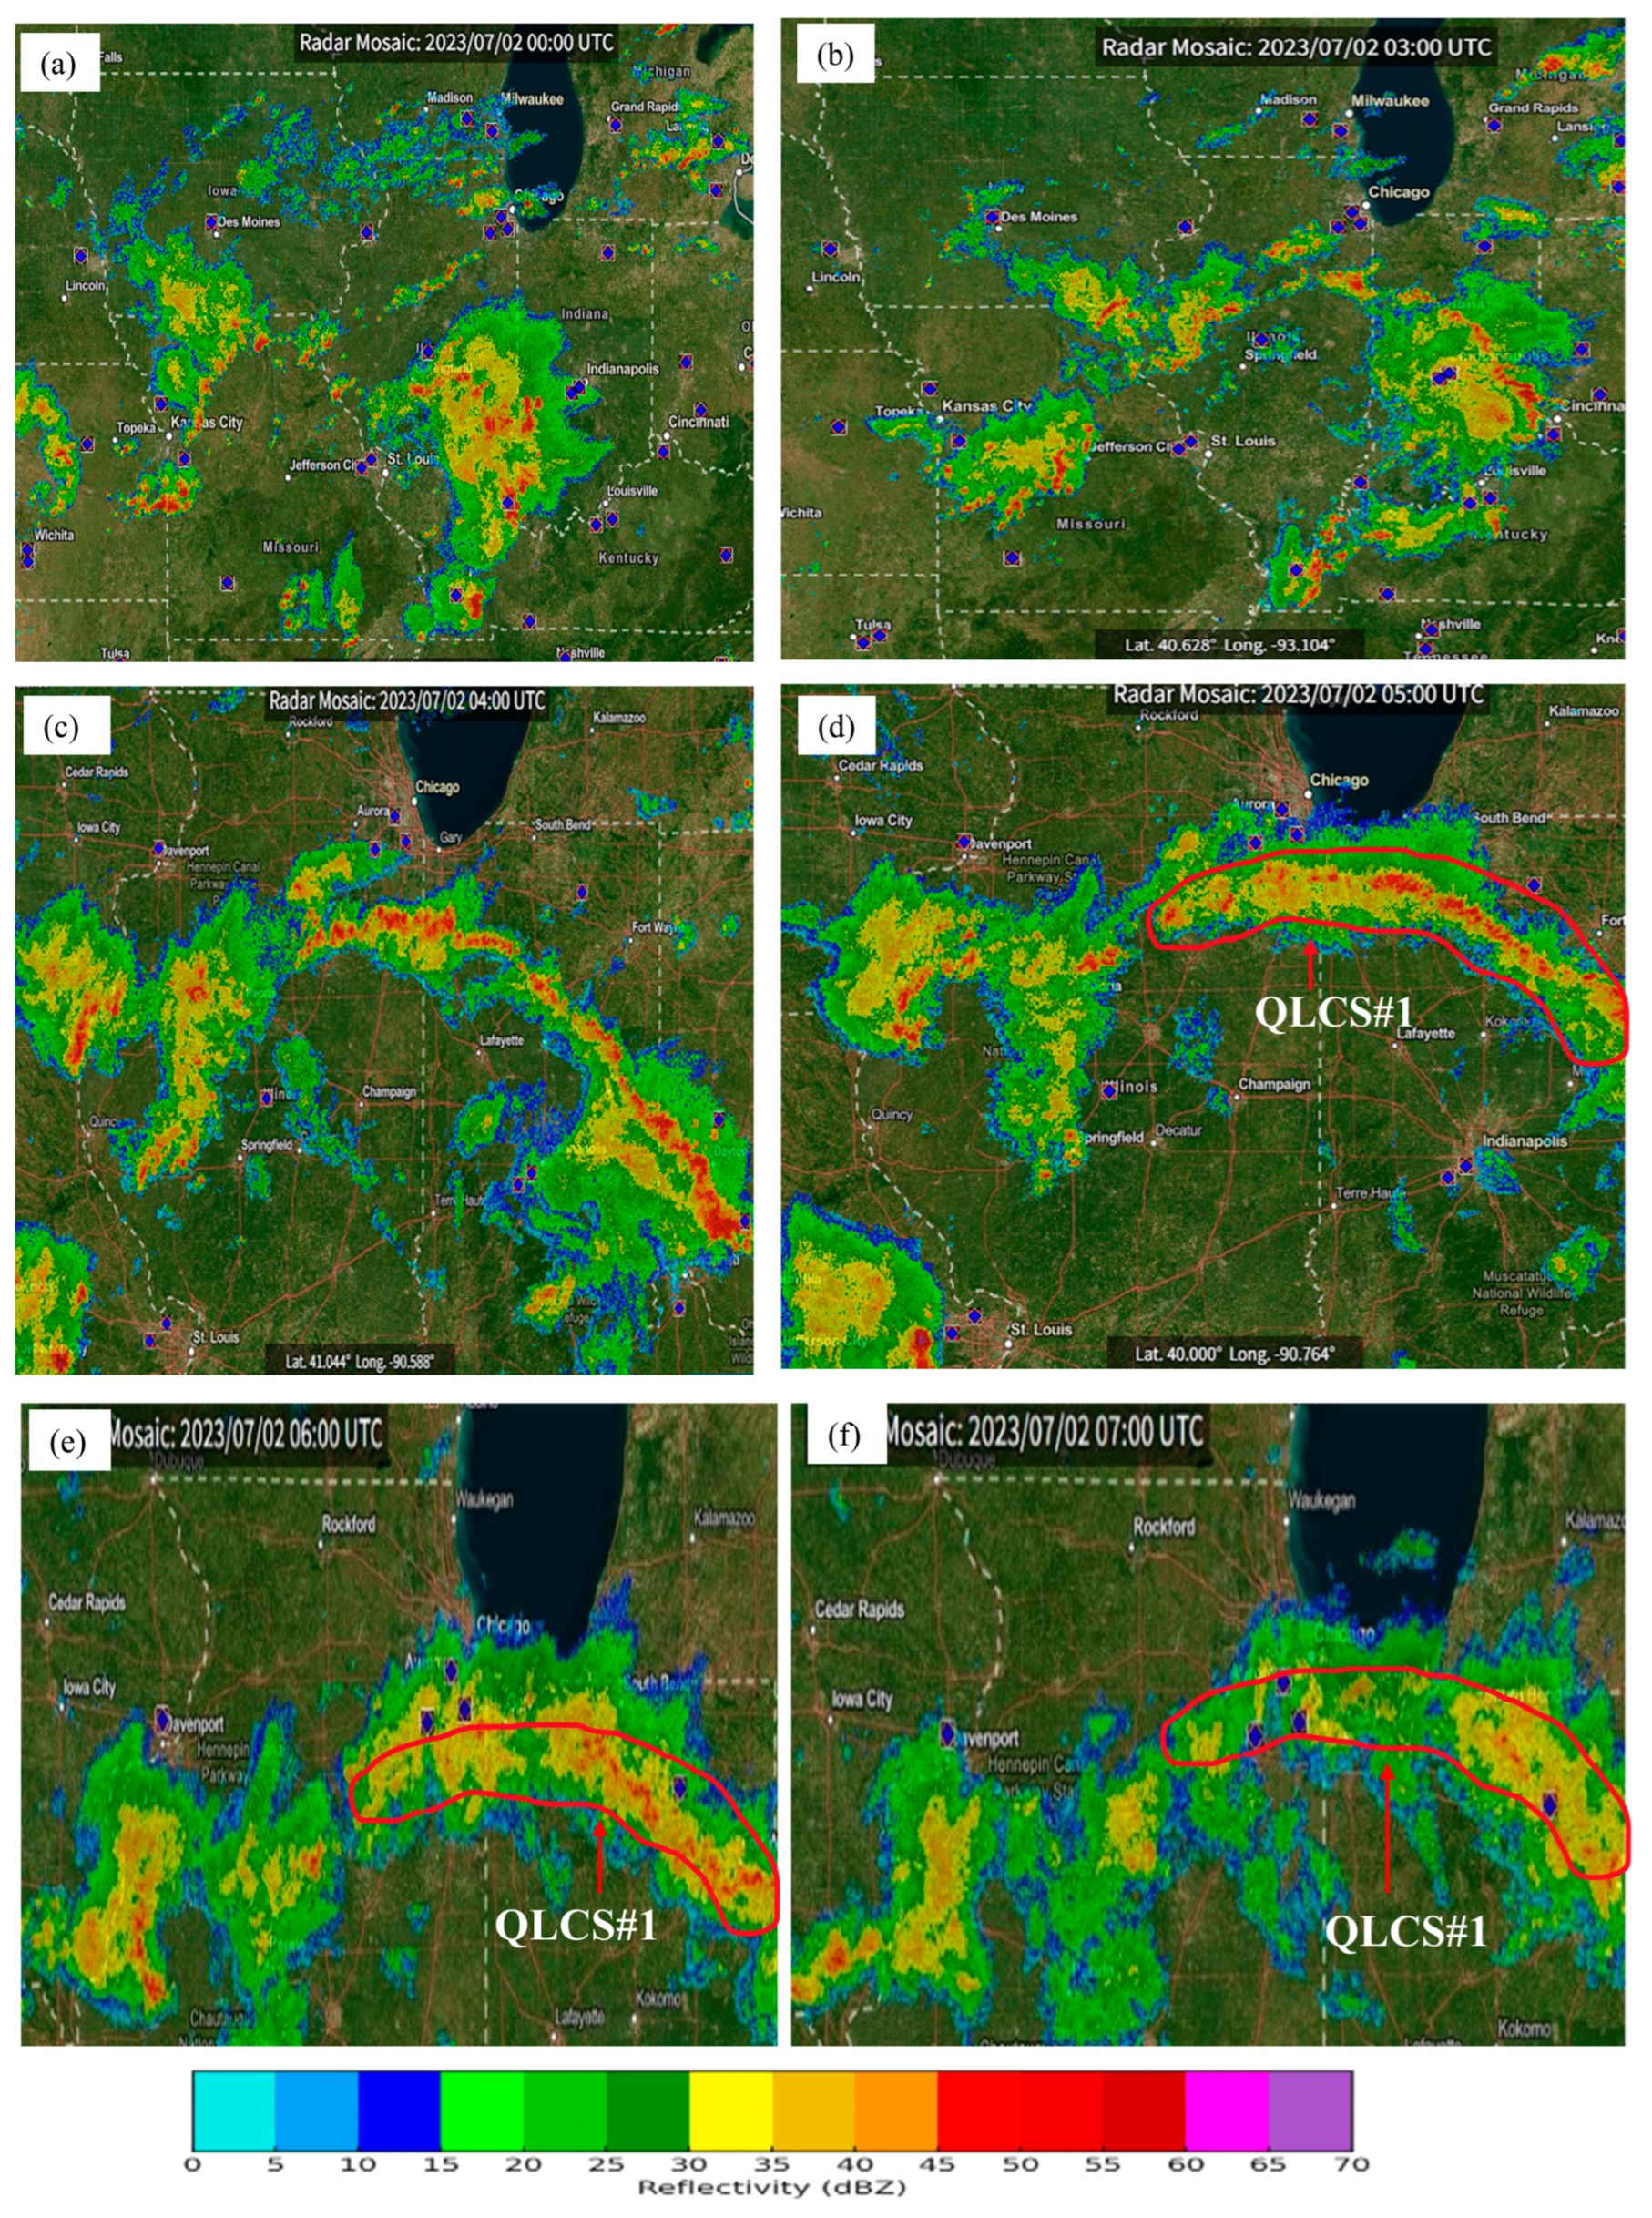
Figure 6.
ERA5 500 hPa height (solid red in m), wind barbs (ms−1), isotachs (solid black in kt), and temperature (°C) valid at a) 0000 UTC, b) 0300 UTC, c) 0600 UTC, and d) 0900 UTC 2 July 2023.
Figure 6.
ERA5 500 hPa height (solid red in m), wind barbs (ms−1), isotachs (solid black in kt), and temperature (°C) valid at a) 0000 UTC, b) 0300 UTC, c) 0600 UTC, and d) 0900 UTC 2 July 2023.
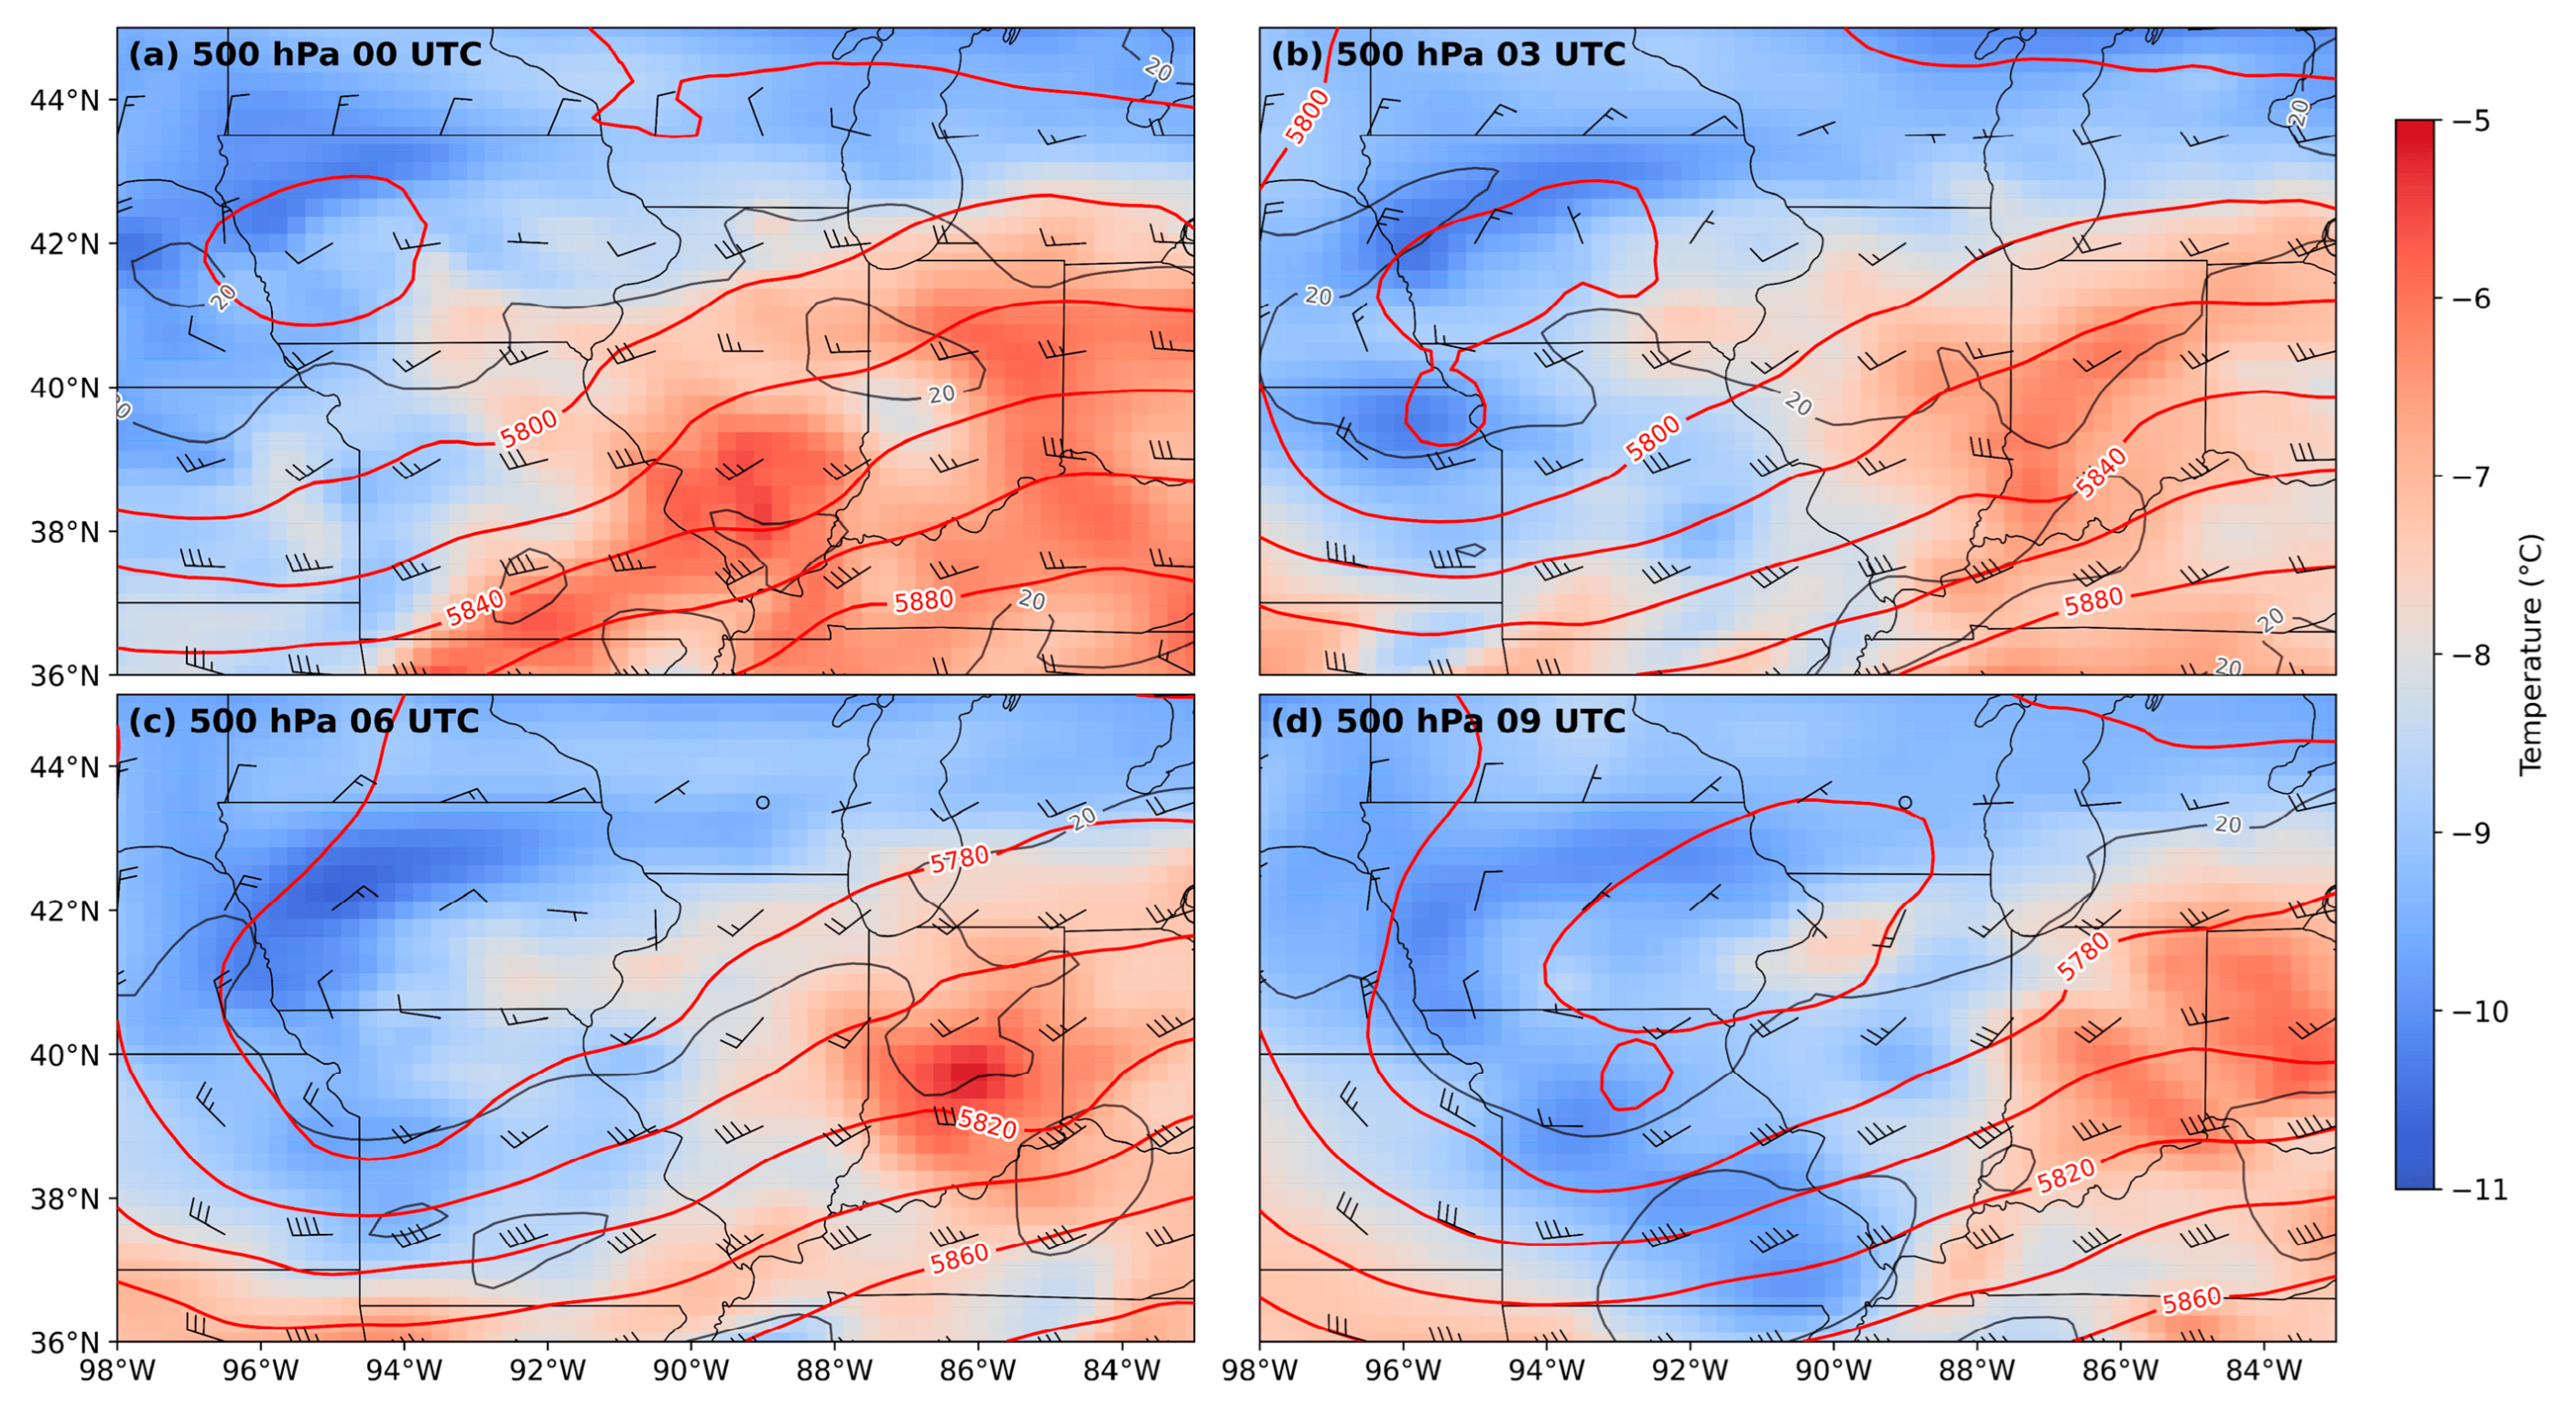
Figure 7.
ERA5 700 hPa height (solid red in m), wind barbs (ms−1), isotachs (solid black in kt), and temperature (°C) valid at a) 0000 UTC, b) 0300 UTC, c) 0600 UTC, and d) 0900 UTC 2 July 2023.
Figure 7.
ERA5 700 hPa height (solid red in m), wind barbs (ms−1), isotachs (solid black in kt), and temperature (°C) valid at a) 0000 UTC, b) 0300 UTC, c) 0600 UTC, and d) 0900 UTC 2 July 2023.
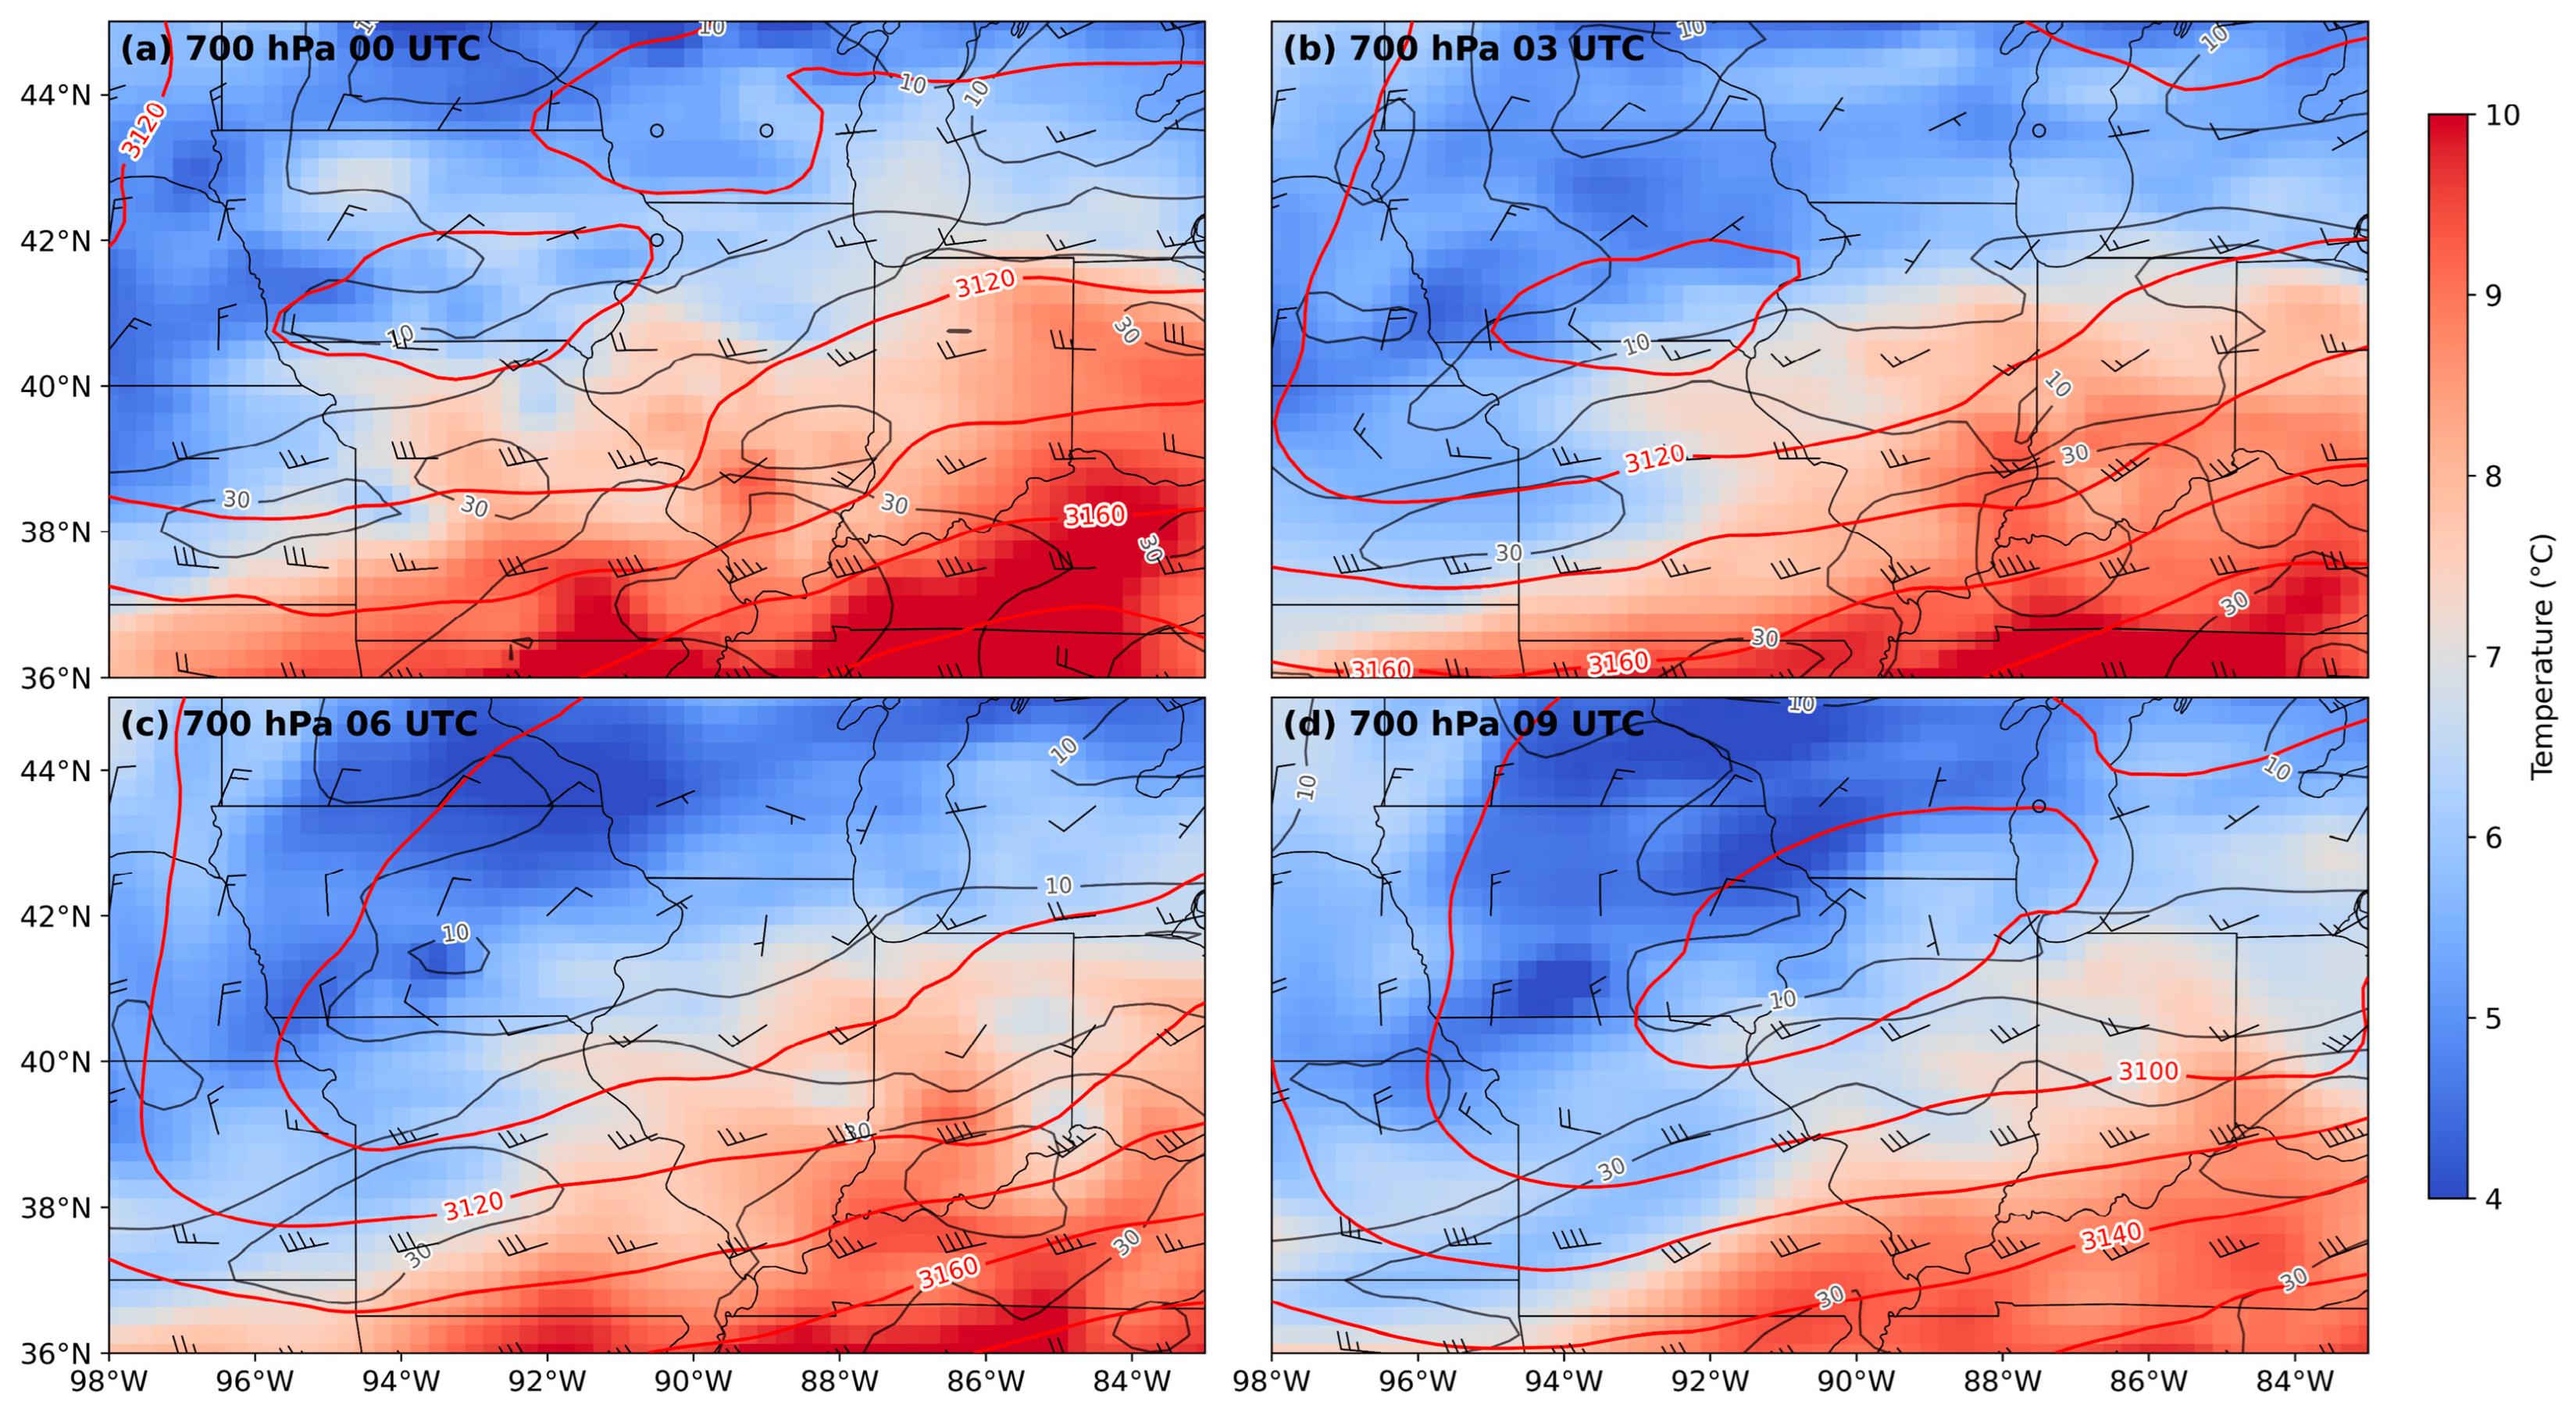
Figure 8.
ERA5 850 hPa height (solid red in m), wind barbs (ms−1), and temperature (°C) valid at a) 0000 UTC, b) 0300 UTC, c) 0600 UTC, and d) 0900 UTC 2 July 2023. ERA5 1000 hPa height (solid red in m), wind barbs (ms−1), isotachs (solid black in kt), and temperature (shaded in °C) valid at e) 0000 UTC, f) 0300 UTC, g) 0600 UTC, and h) 0900 UTC 2 July 2023.
Figure 8.
ERA5 850 hPa height (solid red in m), wind barbs (ms−1), and temperature (°C) valid at a) 0000 UTC, b) 0300 UTC, c) 0600 UTC, and d) 0900 UTC 2 July 2023. ERA5 1000 hPa height (solid red in m), wind barbs (ms−1), isotachs (solid black in kt), and temperature (shaded in °C) valid at e) 0000 UTC, f) 0300 UTC, g) 0600 UTC, and h) 0900 UTC 2 July 2023.
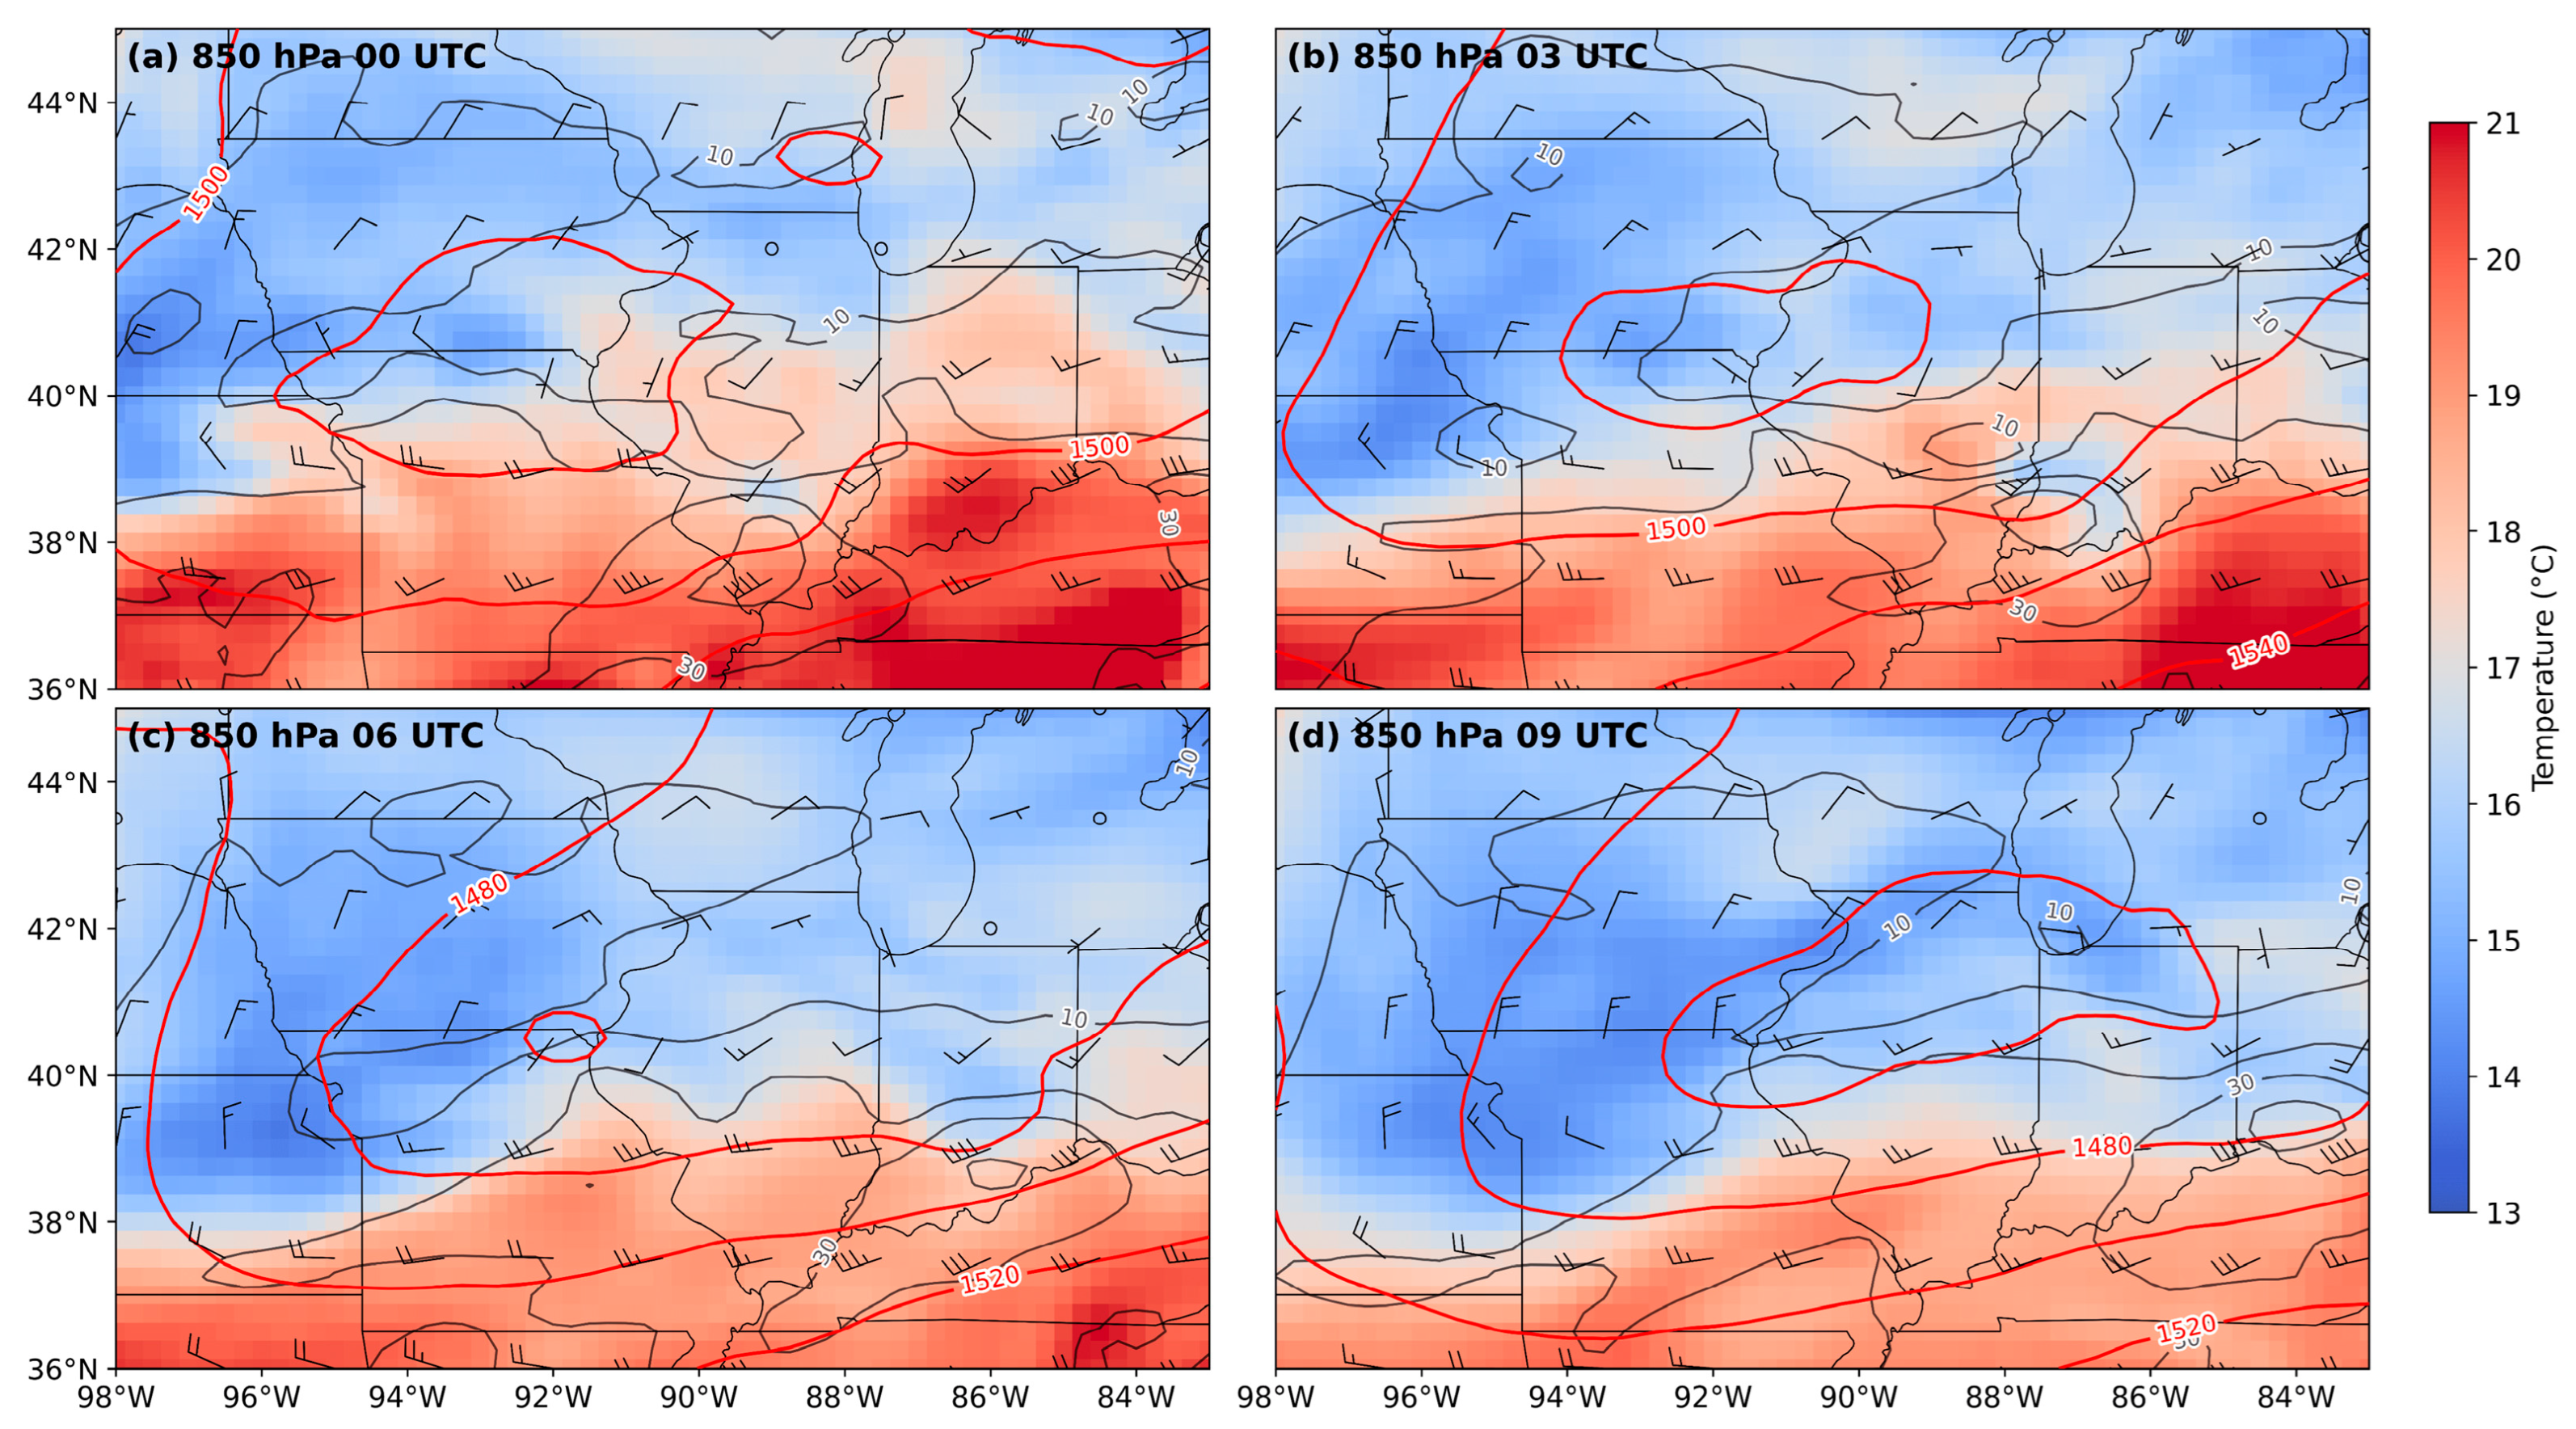
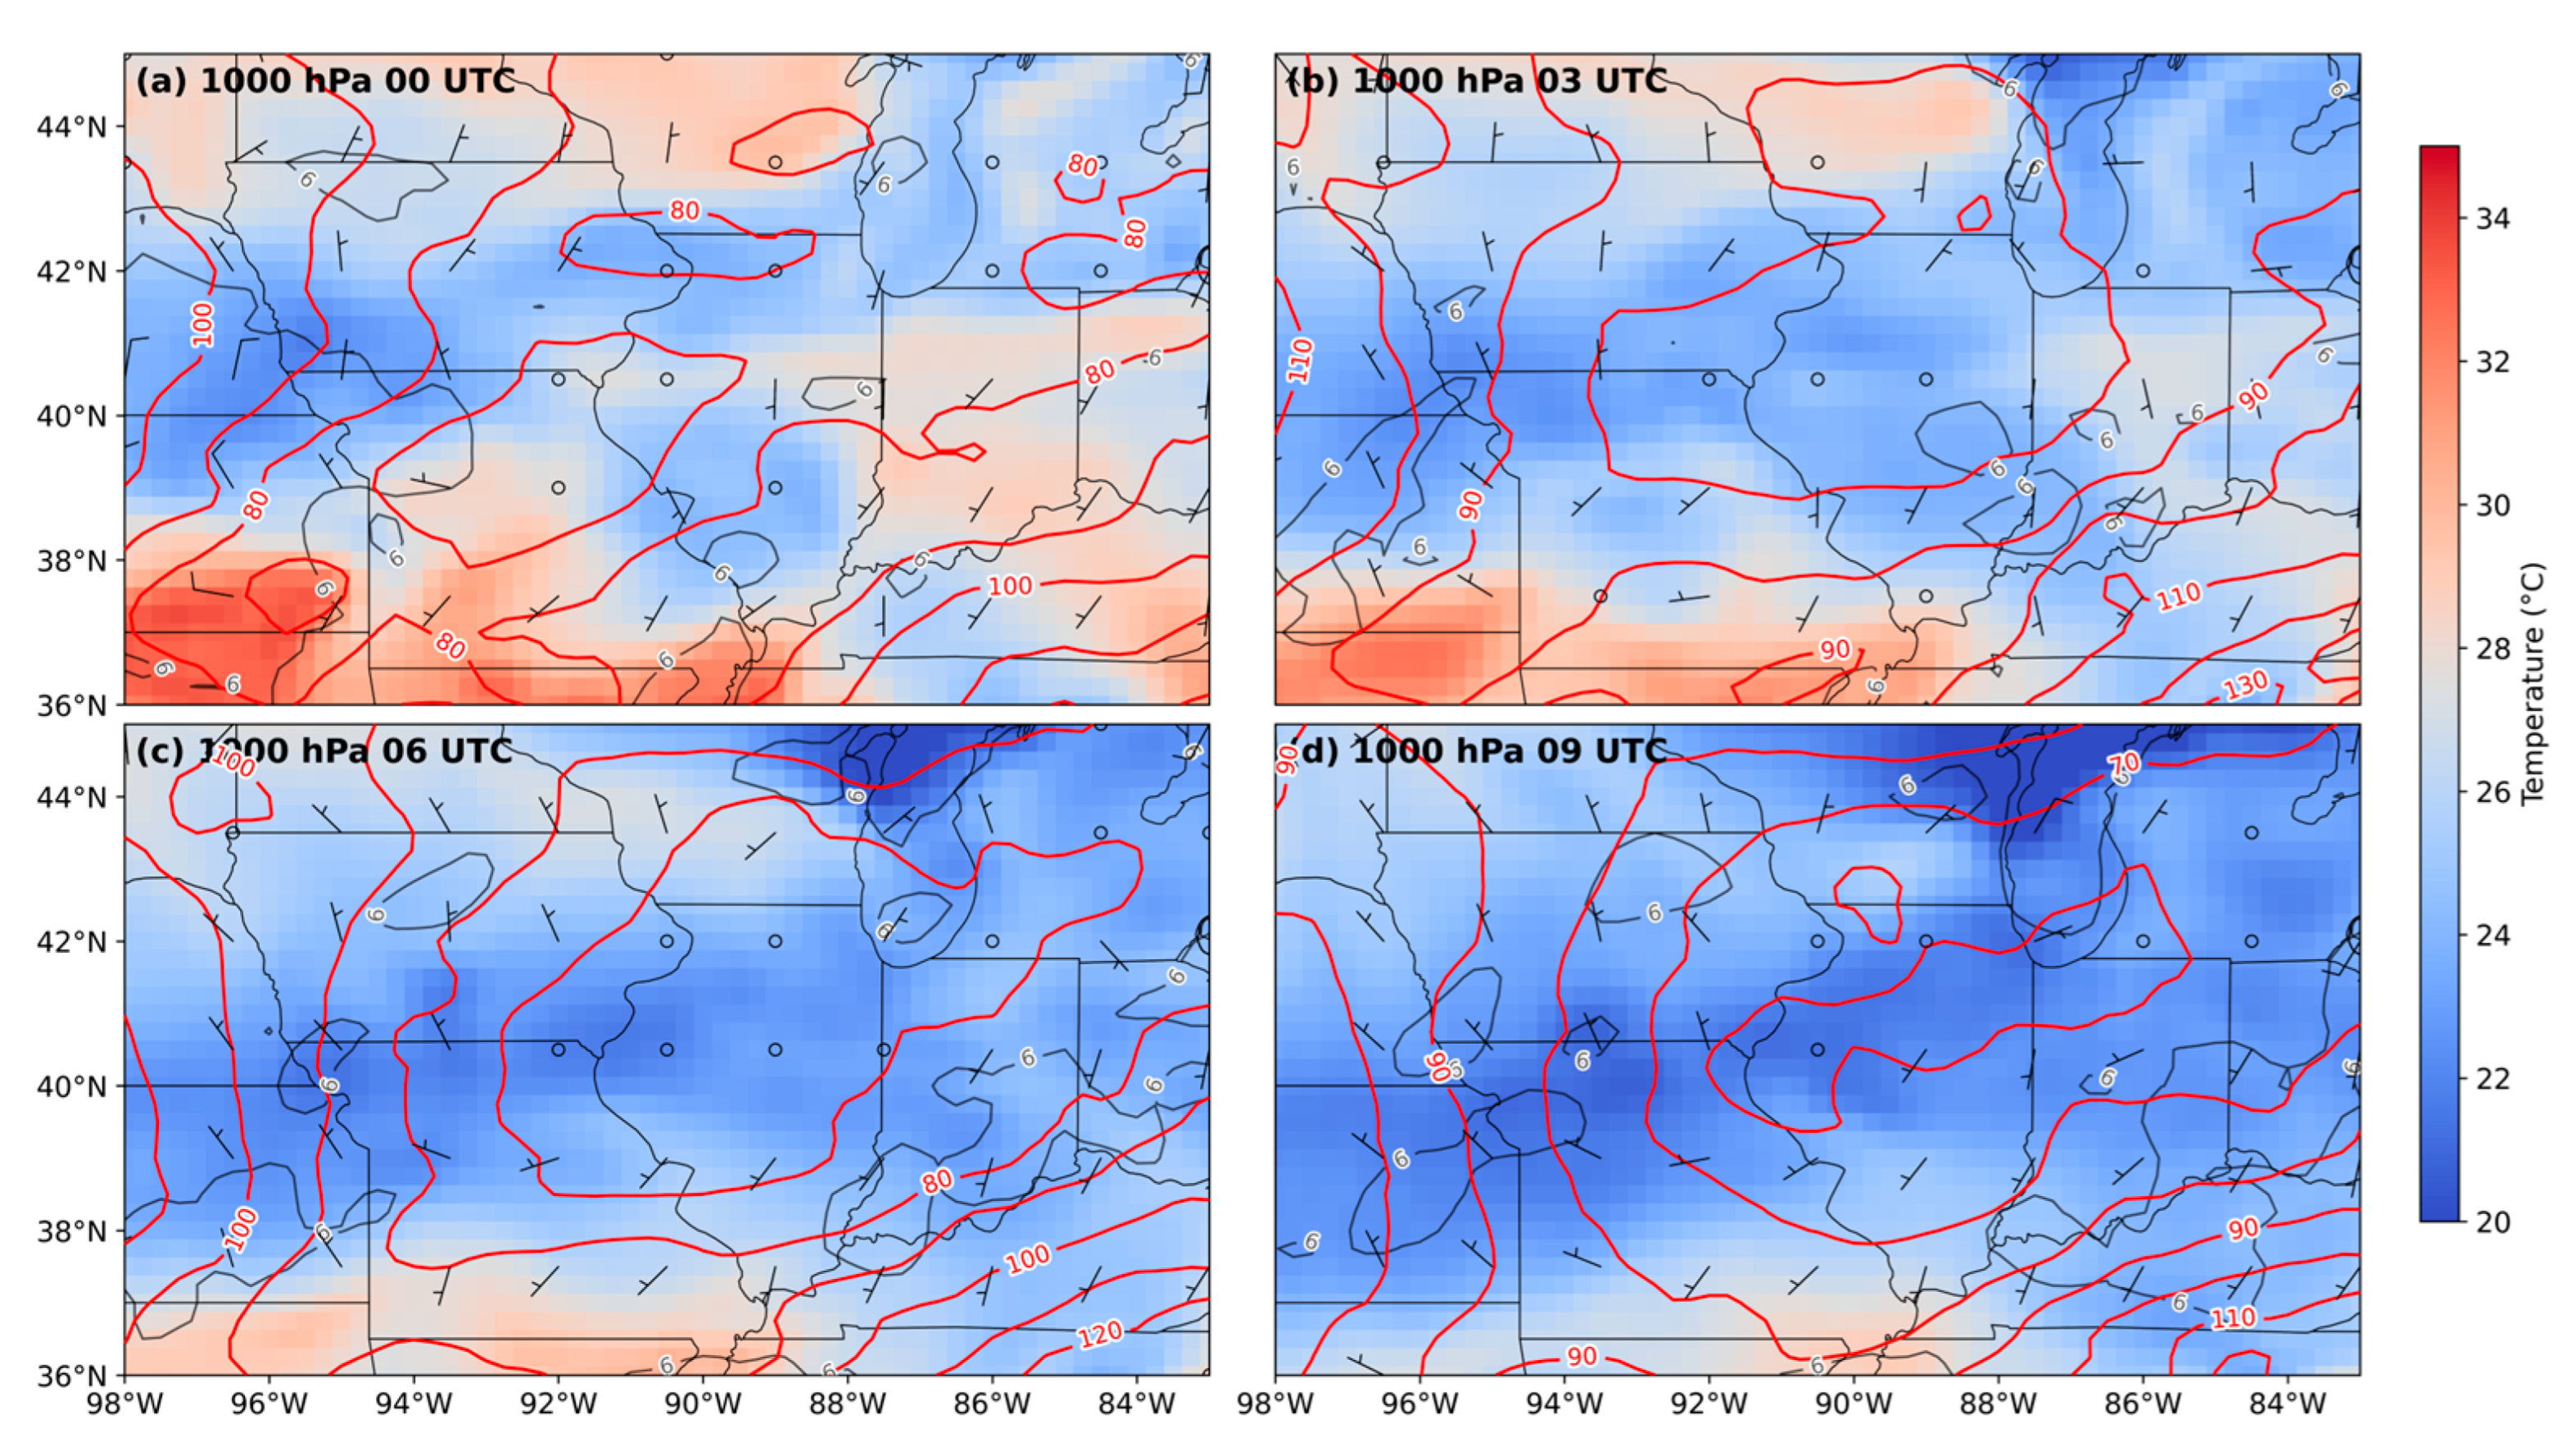
Figure 9.
RAP lower 400 hPa precipitable water (shaded and solid in in) and 850 hPa moisture flux transport vectors (g2s−1m−3Kg−1) (left) and surface streamlines (solid brown elongated vectors) and lowest 100 hPa mean mixing ratio (black solid in gKg−1) valid at a-b) 0000 UTC, c-d) 0300 UTC, e-f) 0600 UTC, and g-h) 0900 UTC 2 July 2023. Chicago area airport METAR analyses of mean sea level pressure (black solid in hPa), surface wind barbs (kt), and surface temperature (red solid in °C) valid at i) 0000 UTC, j) 0300 UTC, k) 0600 UTC, and l) 0900 UTC and surface Td (red solid in°C) and surface relative humidity (shaded in %) at m) 0000 UTC and n) 0600 UTC 2 July 2023.
Figure 9.
RAP lower 400 hPa precipitable water (shaded and solid in in) and 850 hPa moisture flux transport vectors (g2s−1m−3Kg−1) (left) and surface streamlines (solid brown elongated vectors) and lowest 100 hPa mean mixing ratio (black solid in gKg−1) valid at a-b) 0000 UTC, c-d) 0300 UTC, e-f) 0600 UTC, and g-h) 0900 UTC 2 July 2023. Chicago area airport METAR analyses of mean sea level pressure (black solid in hPa), surface wind barbs (kt), and surface temperature (red solid in °C) valid at i) 0000 UTC, j) 0300 UTC, k) 0600 UTC, and l) 0900 UTC and surface Td (red solid in°C) and surface relative humidity (shaded in %) at m) 0000 UTC and n) 0600 UTC 2 July 2023.
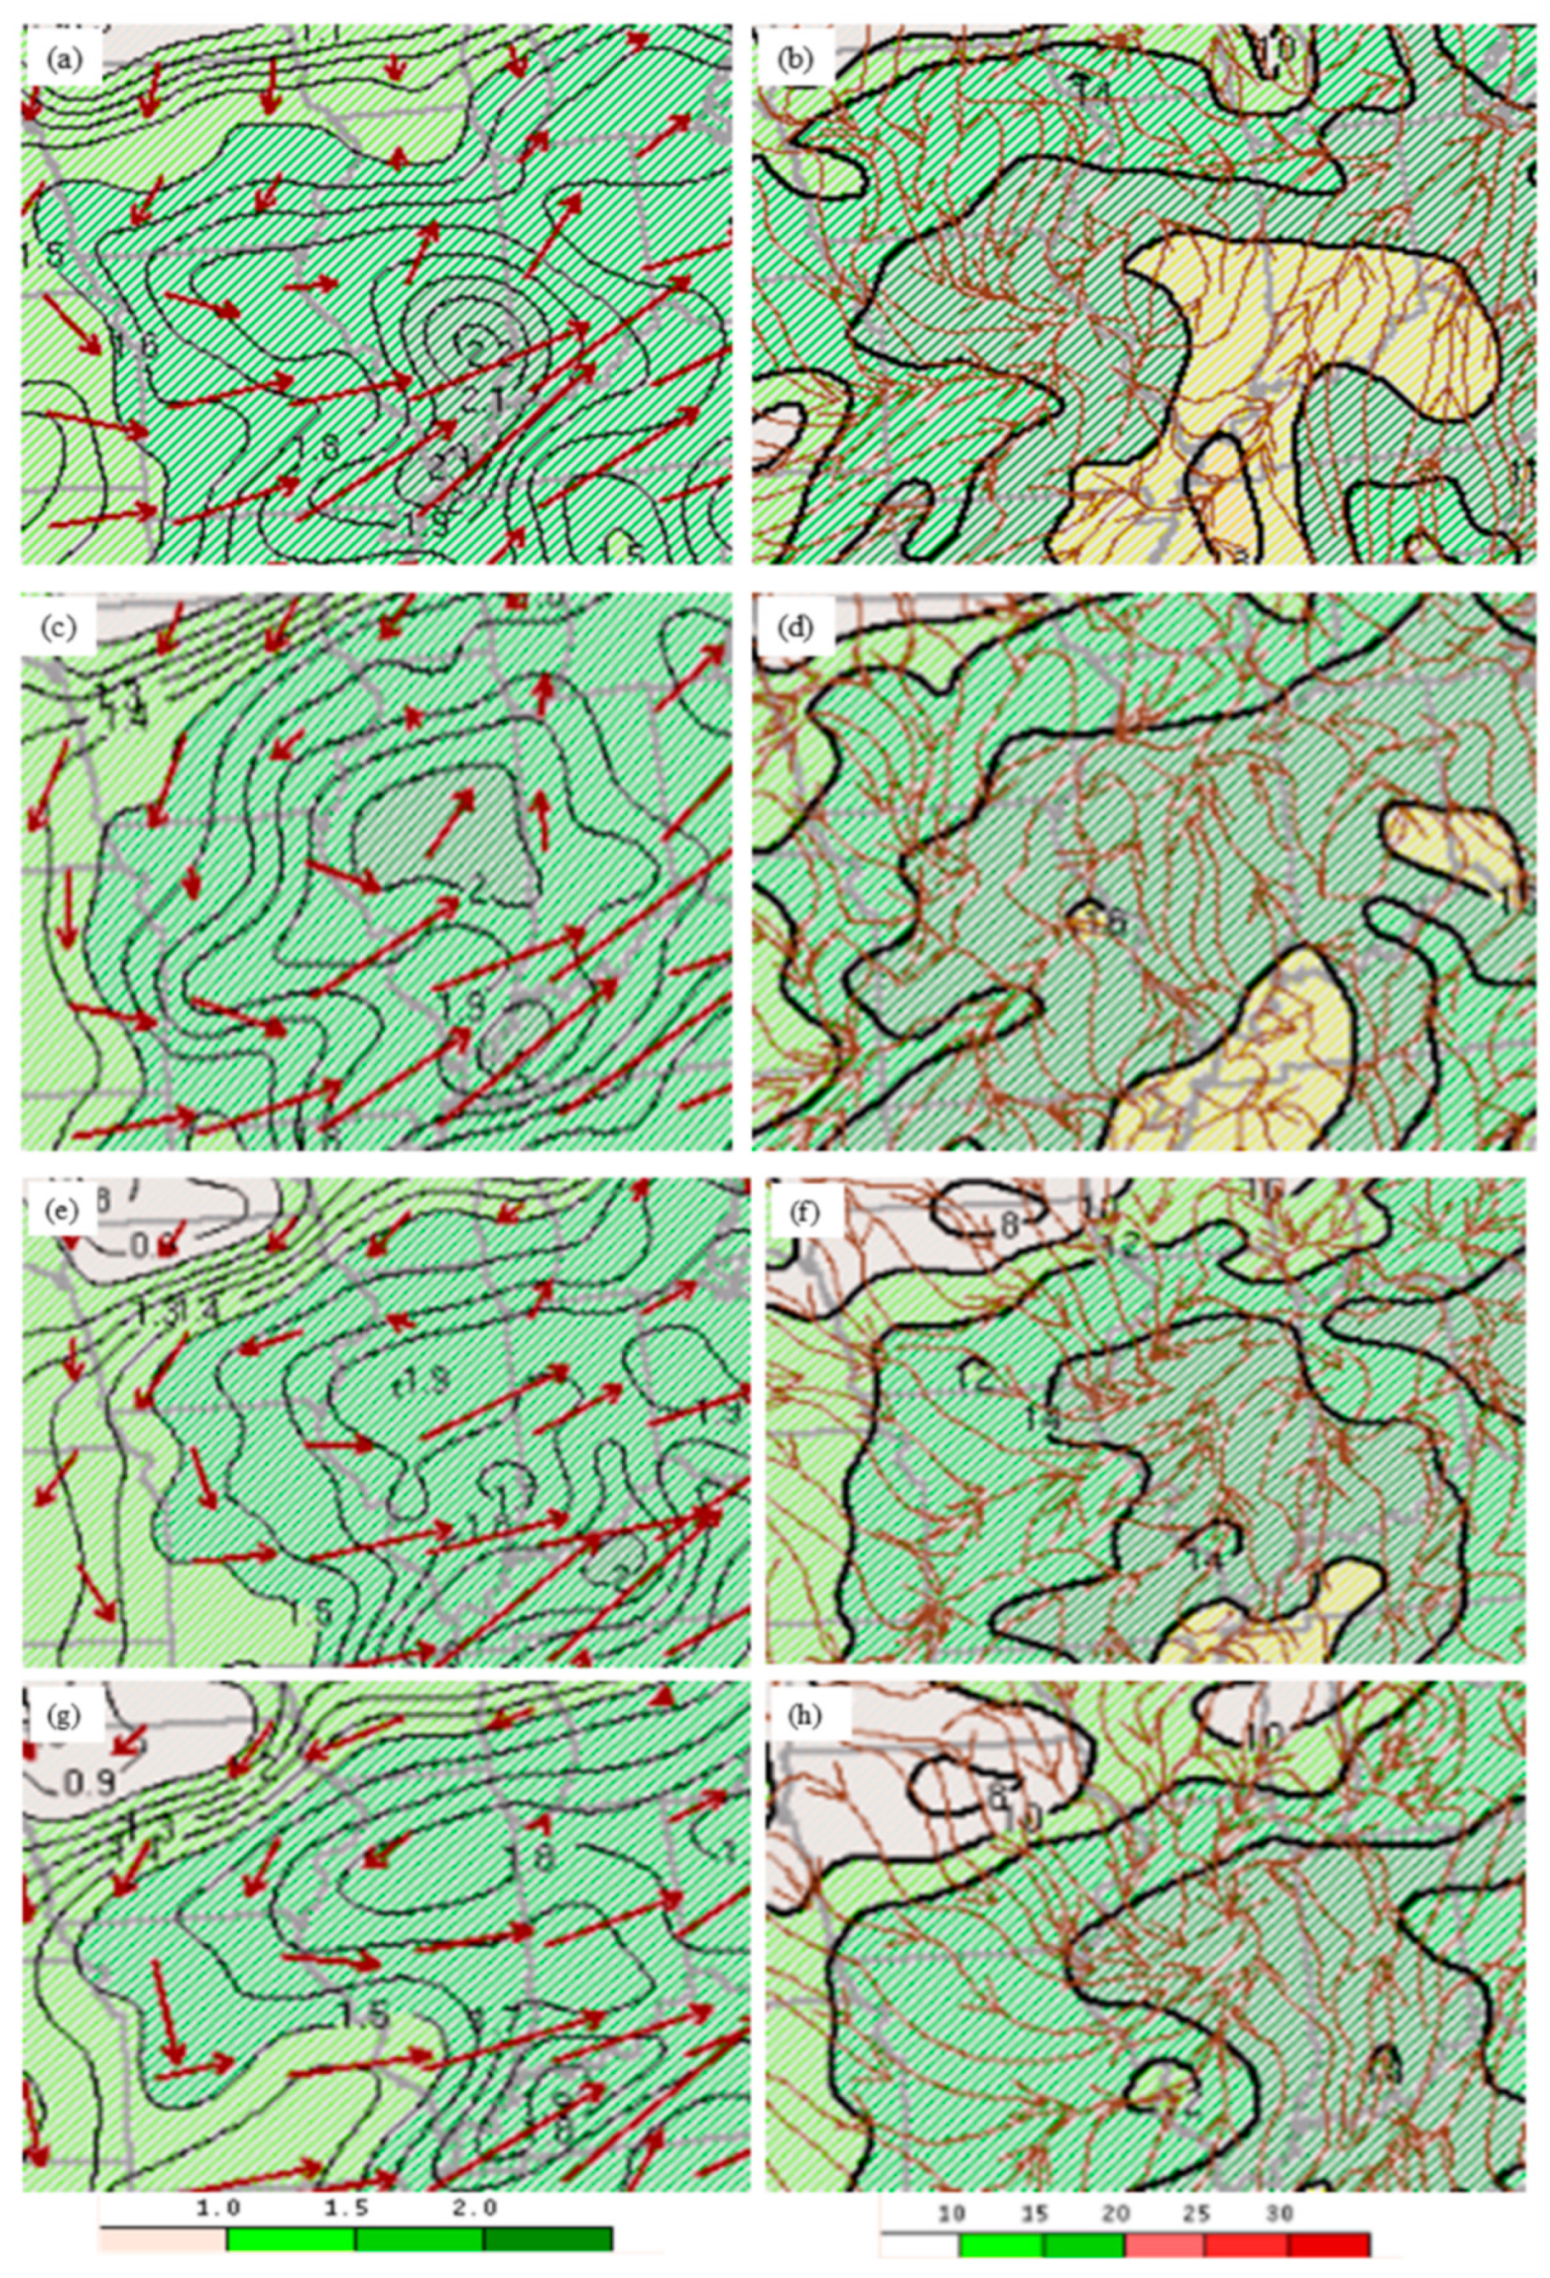
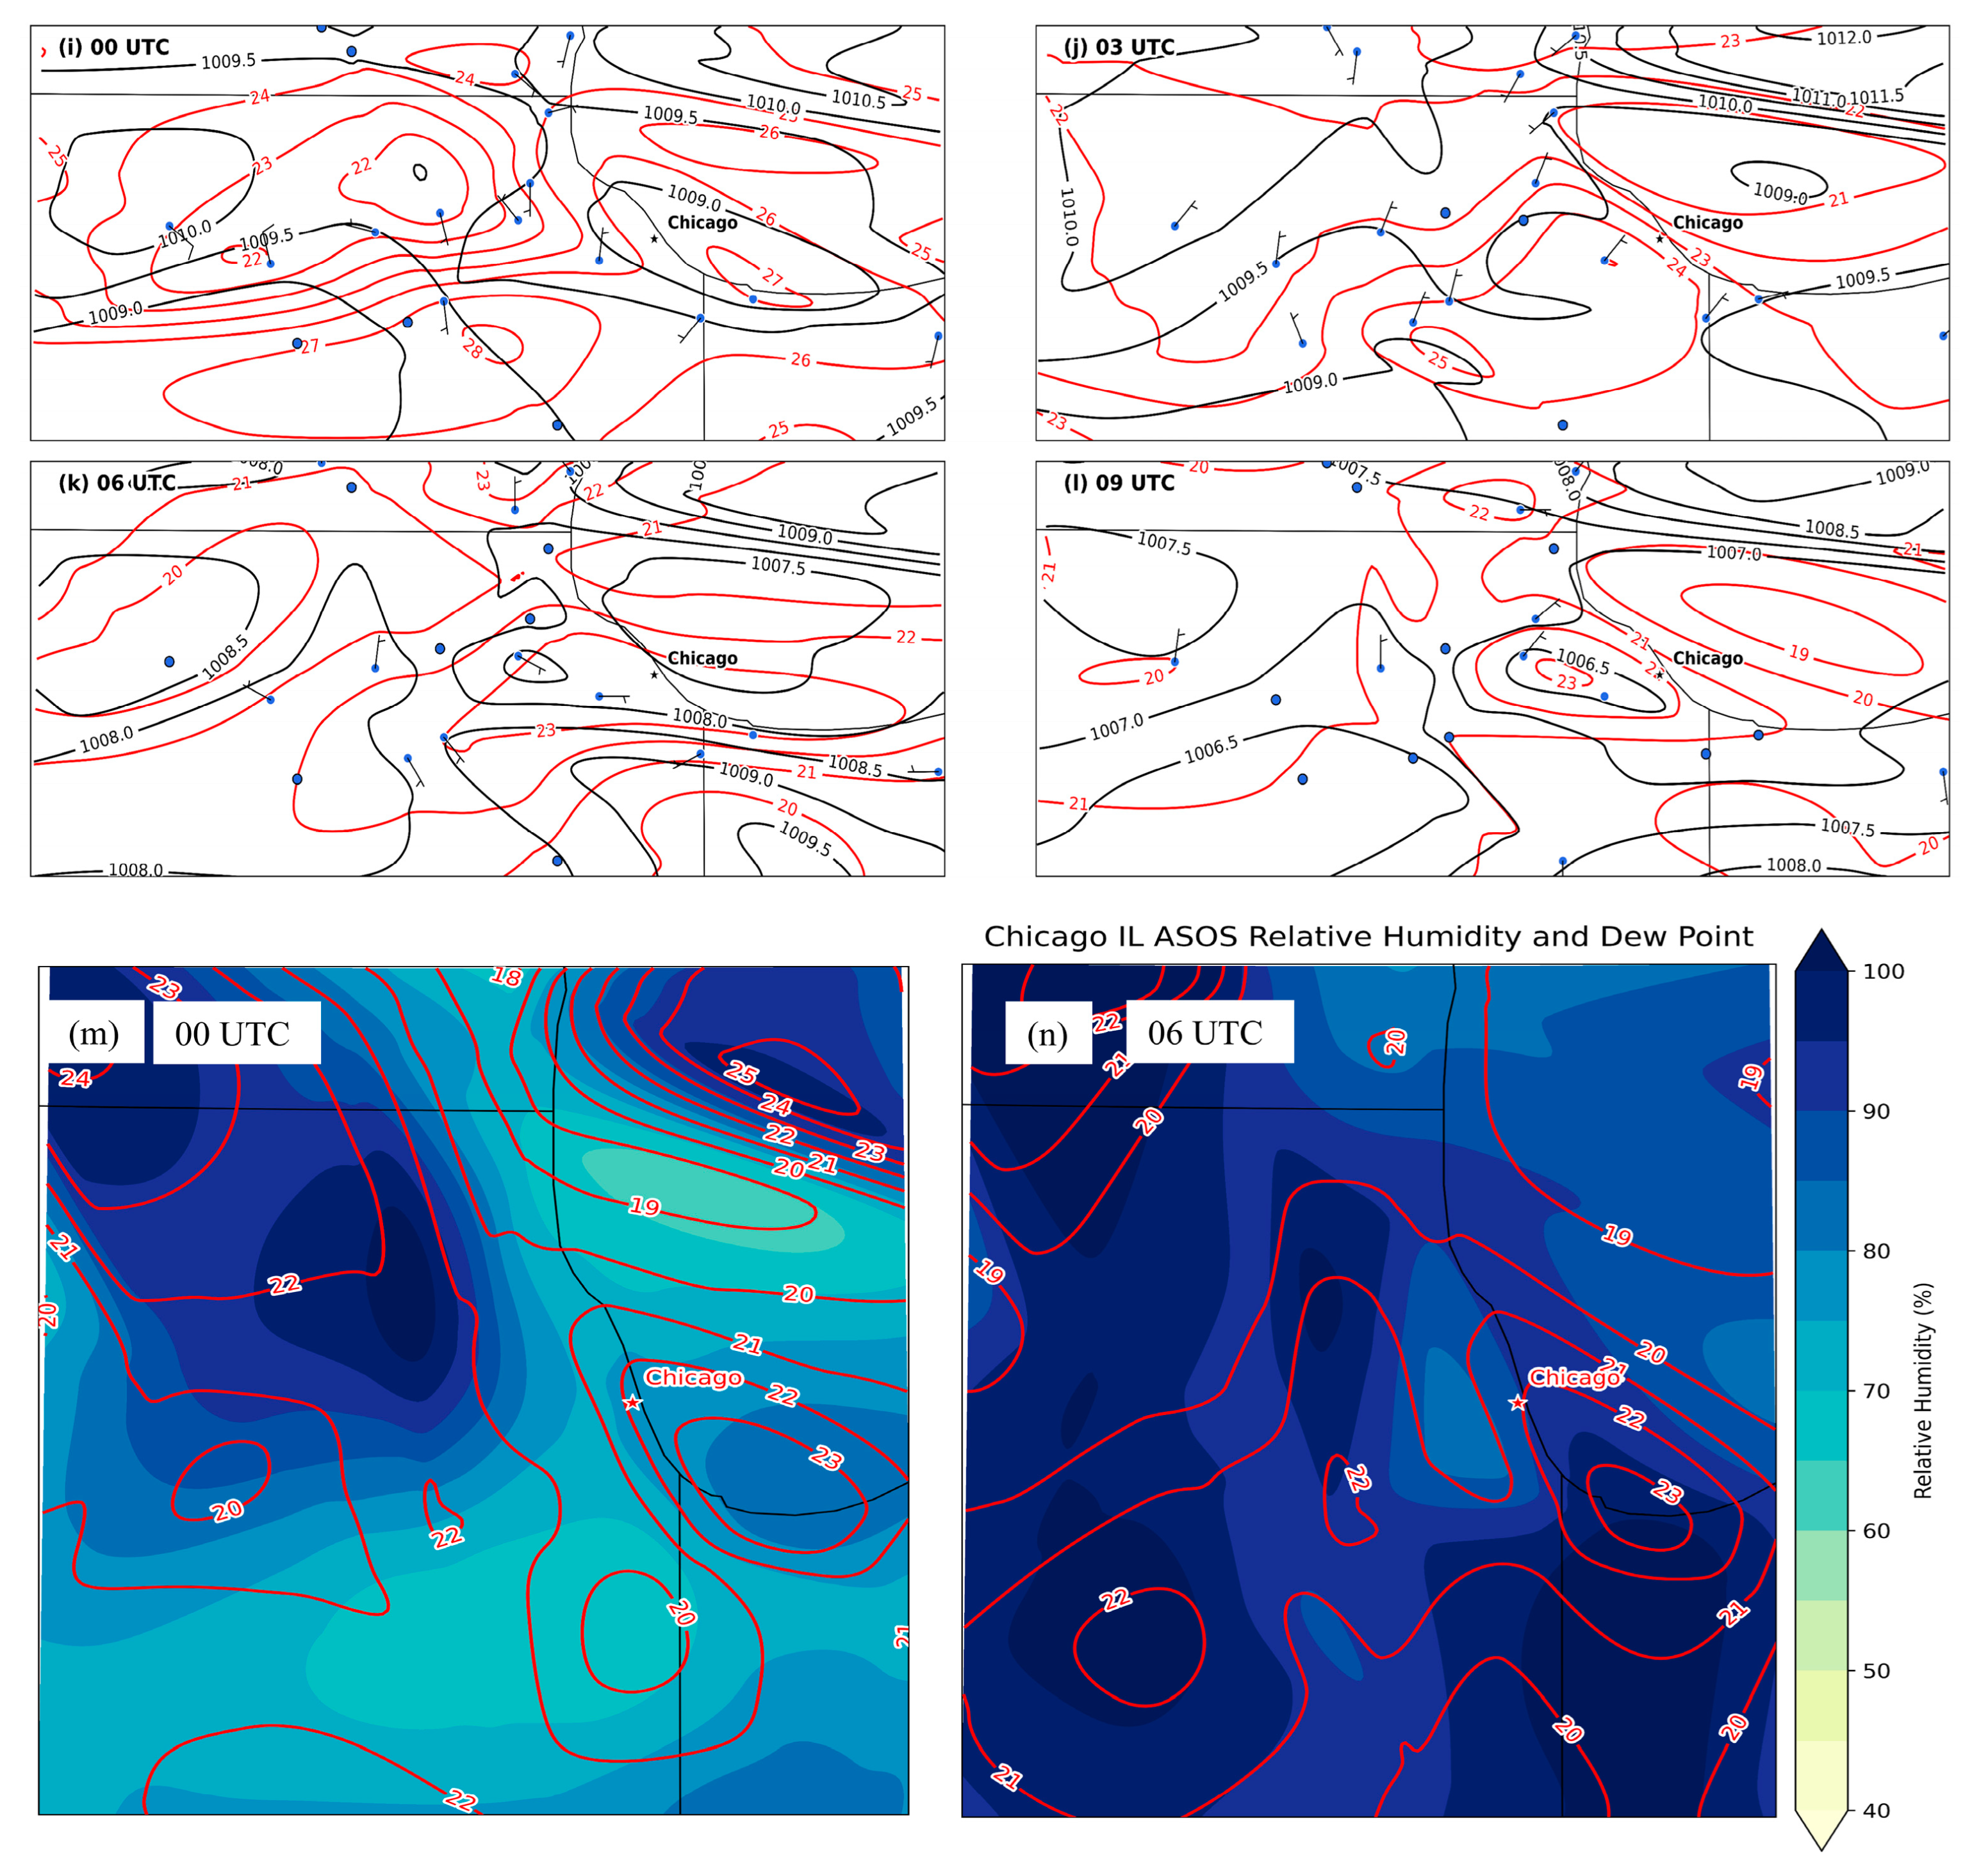
Figure 10.
a) Lincoln, IL (ILX) sounding b) RAP surface-based (SBCAPE) (red contours in JKg−1), SBCIN (shaded at 25 and 100 JKg−1), and surface wind barbs (kt) and c) RAP most unstable (MUCAPE) (red contours in JKg−1), lifted parcel level (shaded in m), and surface wind barbs (kt) all at 0000 UTC 2 July 2023.
Figure 10.
a) Lincoln, IL (ILX) sounding b) RAP surface-based (SBCAPE) (red contours in JKg−1), SBCIN (shaded at 25 and 100 JKg−1), and surface wind barbs (kt) and c) RAP most unstable (MUCAPE) (red contours in JKg−1), lifted parcel level (shaded in m), and surface wind barbs (kt) all at 0000 UTC 2 July 2023.
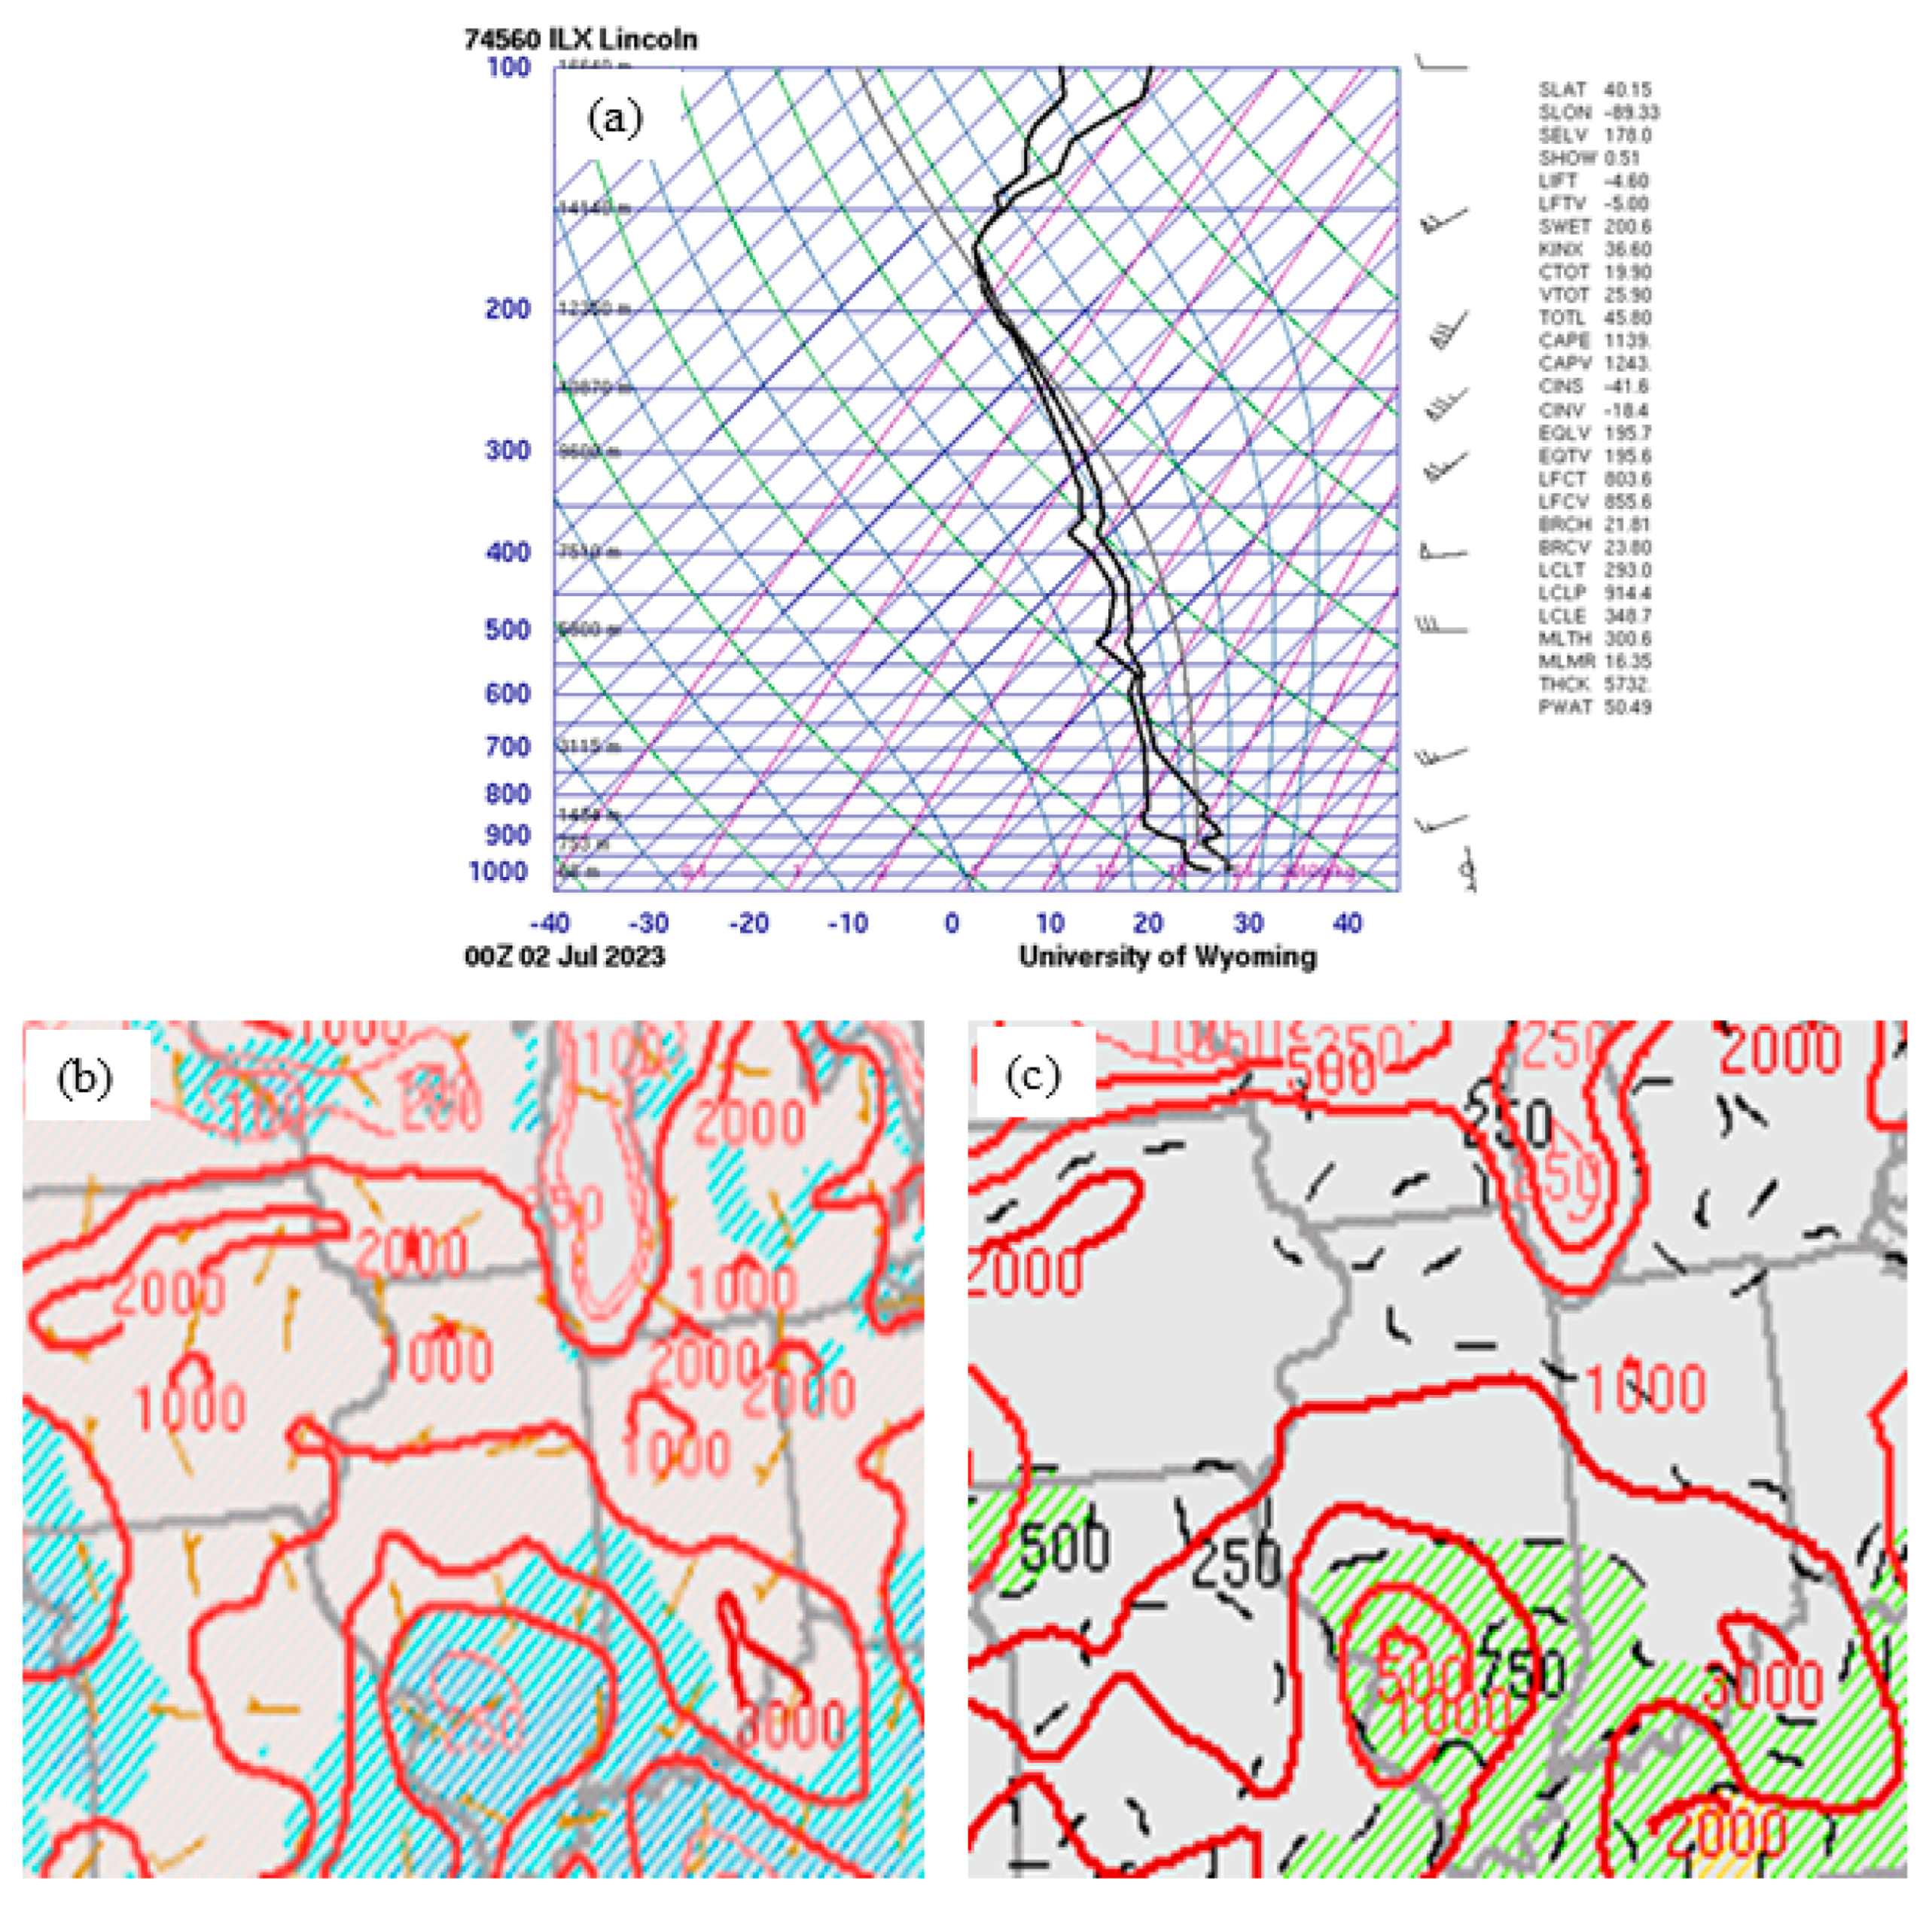
Figure 11.
RAP KMDW soundings valid at a) 0600 UTC, b) 0900 UTC, and c) 1200 UTC 2 July 2023. CAPE and CIN = MUCAPE and MUCIN. NOAA NEXRAD Doppler radar composite imagery at d) 0730 UTC, e) 0930 UTC, and f) 1000 UTC 2 July 2023.
Figure 11.
RAP KMDW soundings valid at a) 0600 UTC, b) 0900 UTC, and c) 1200 UTC 2 July 2023. CAPE and CIN = MUCAPE and MUCIN. NOAA NEXRAD Doppler radar composite imagery at d) 0730 UTC, e) 0930 UTC, and f) 1000 UTC 2 July 2023.
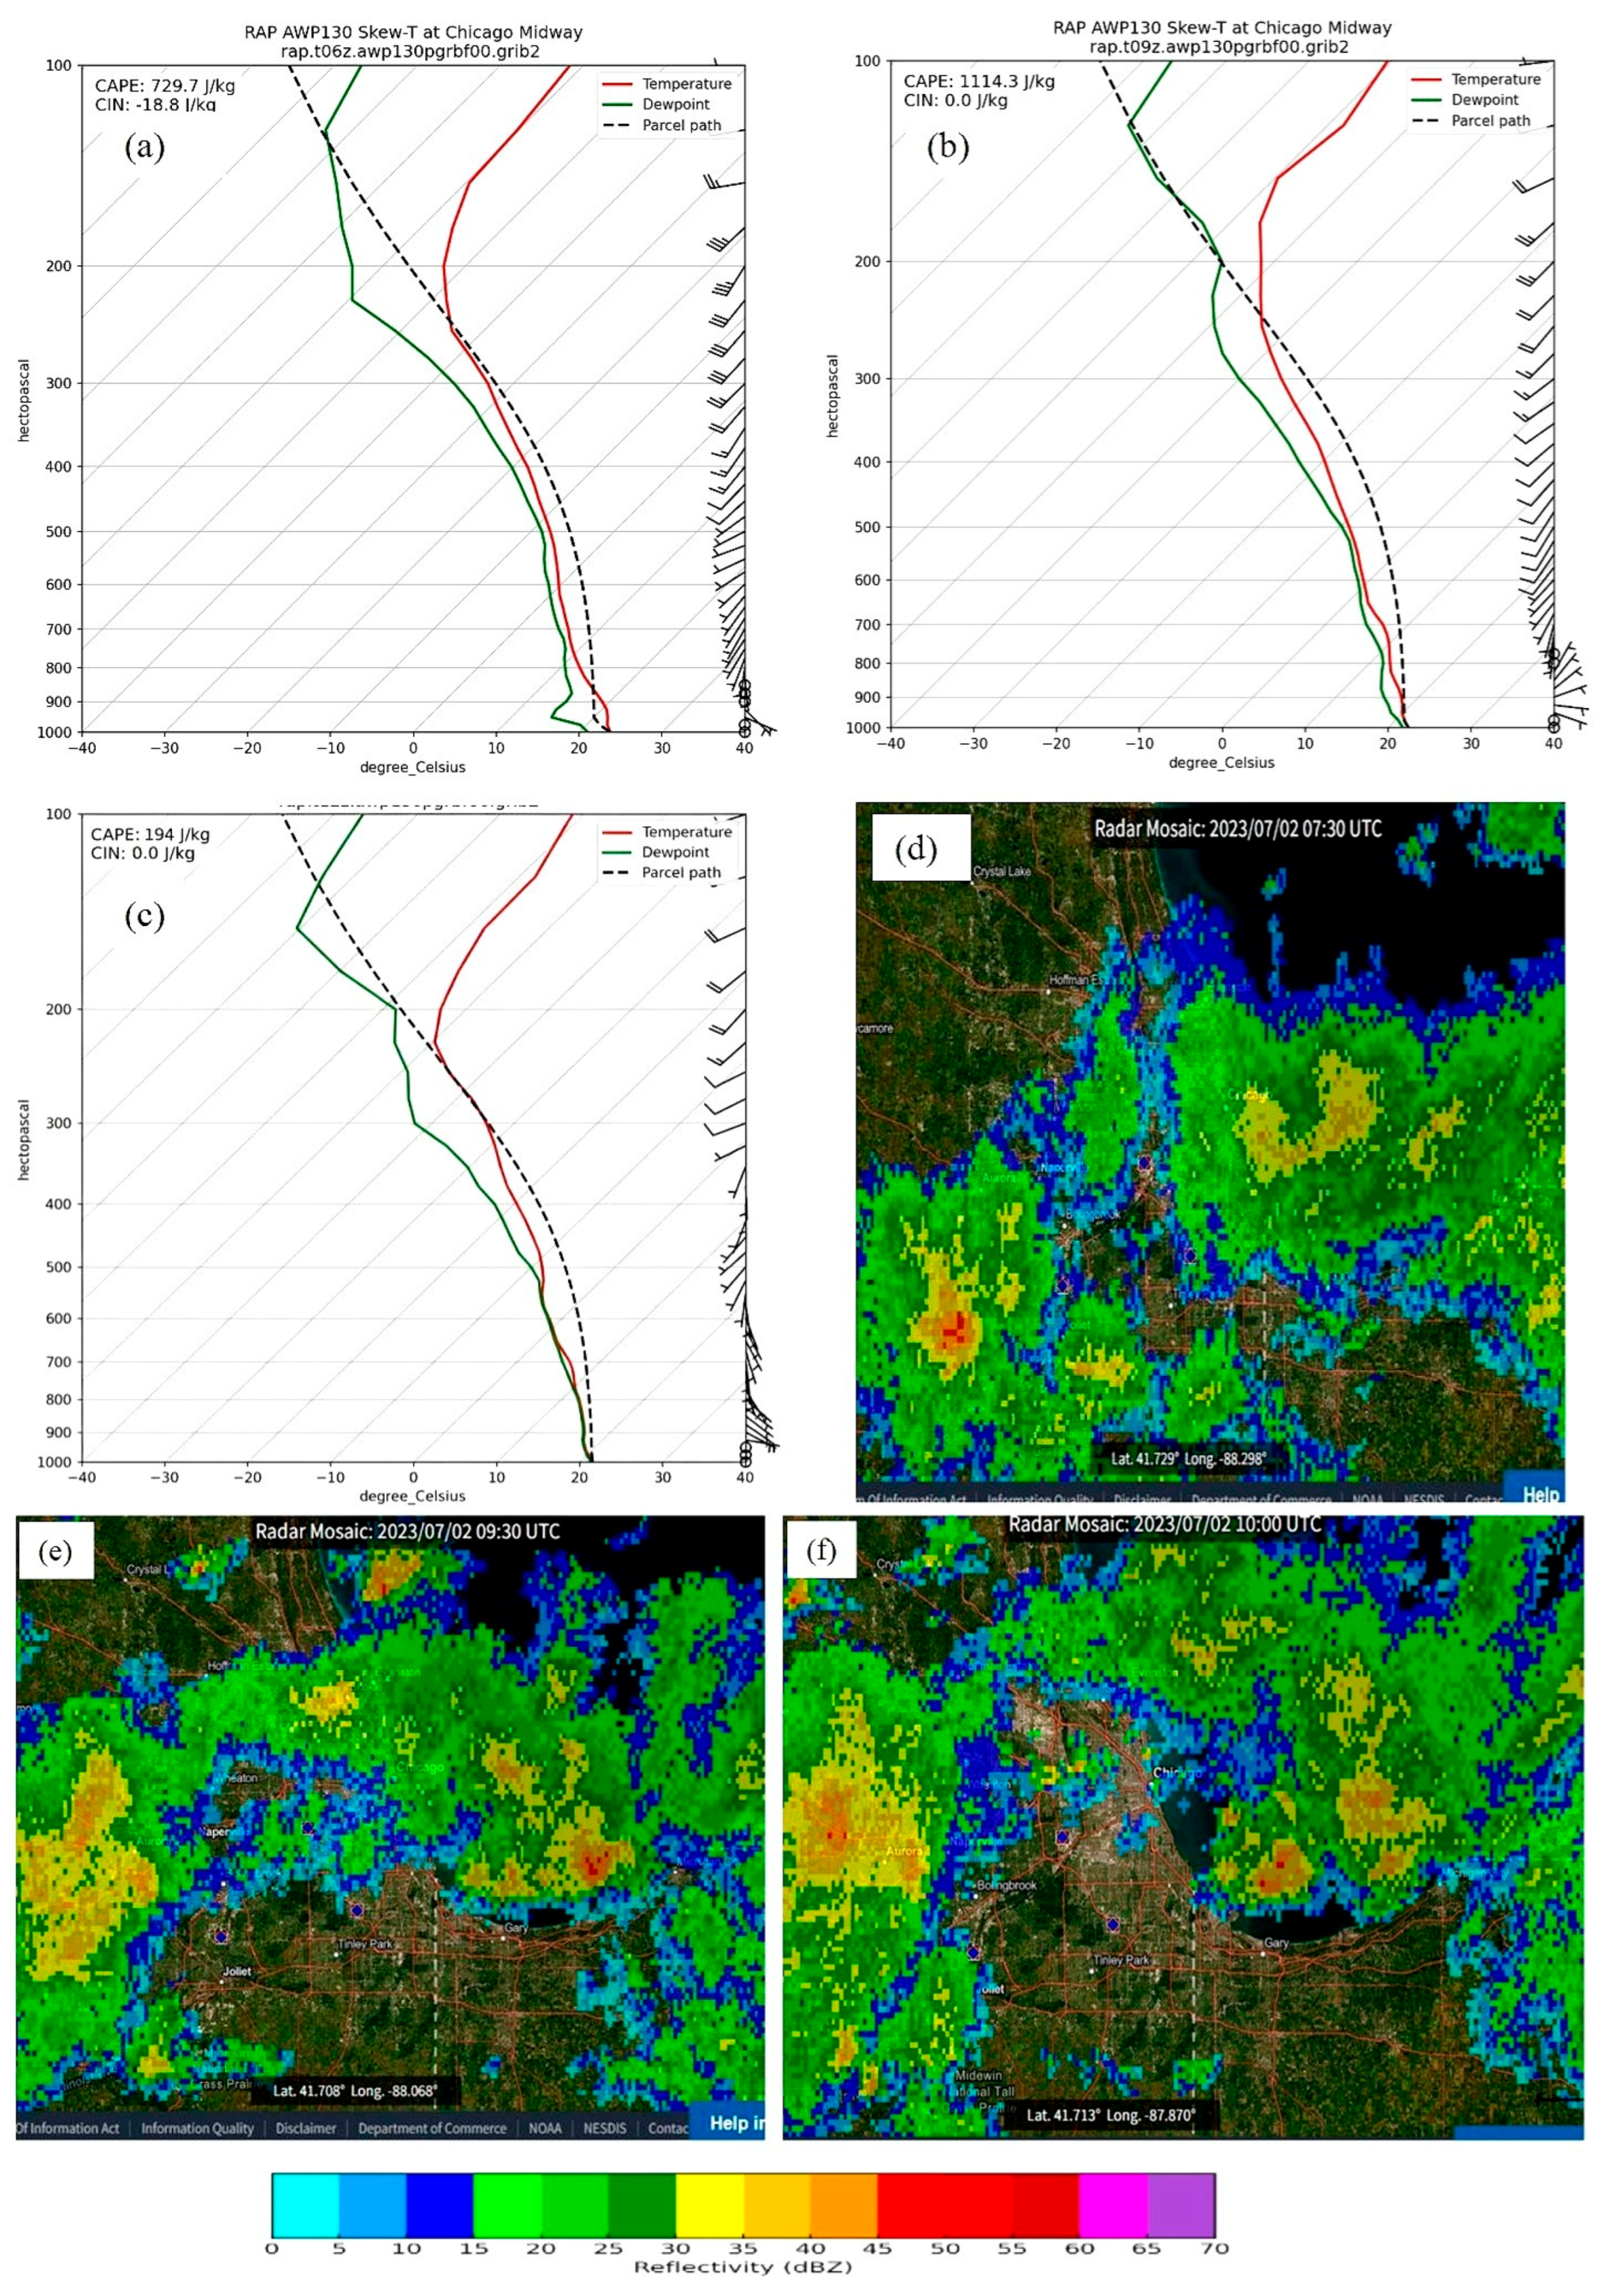

Table 1.
Chicago area airport stations employed in local analyses.
| Station | Name | Location |
|---|---|---|
| ORD | Chicago O’Hare International Airport | Chicago, IL |
| MDW | Chicago Midway Airport | Chicago, IL |
| PWK | Chicago Executive Airport | Wheeling, IL |
| UGN | Waukegan National Airport | Waukegan, IL |
| DPA | DuPage Airport | West Chicago, IL |
| 06C | Schaumburg Regional Airport | Schaumburg, IL |
| ARR | Aurora Municipal Airport | Aurora, IL |
| JOT | Joliet Regional Airport | Joliet, IL |
| IGQ | Lansing Municipal Airport | Lansing, IL |
| IKK | Greater Kankakee Airport | Kankakee, IL |
| C09 | Morris Municipal Airport | Morris, IL |
| DKB | DeKalb Taylor Municipal Airport | DeKalb, IL |
Disclaimer/Publisher’s Note: The statements, opinions and data contained in all publications are solely those of the individual author(s) and contributor(s) and not of MDPI and/or the editor(s). MDPI and/or the editor(s) disclaim responsibility for any injury to people or property resulting from any ideas, methods, instructions or products referred to in the content. |
© 2026 by the authors. Licensee MDPI, Basel, Switzerland. This article is an open access article distributed under the terms and conditions of the Creative Commons Attribution (CC BY) license.
Copyright: This open access article is published under a Creative Commons CC BY 4.0 license, which permit the free download, distribution, and reuse, provided that the author and preprint are cited in any reuse.


