

Submitted:
03 July 2026
Posted:
06 July 2026
You are already at the latest version
Abstract
Transition metal phosphides (TMPs) have gained significant attention from researchers in the field of catalytic hydrogenation due to their excellent properties. However, existing studies rarely explored the targeted regulation of the degree of crystal plane exposure of the Ni12P5 catalyst. It is difficult to significantly enhance the performance of this catalyst in the hydrogenation dechlorination (HDC) reaction of trichloroethylene by this strategy. This study proposes a regulatory approach: changing the ratio of ethylene glycol to water to precisely control the exposure ratio of the high-index (312) crystal plane of the Ni12P5 catalyst. Combined with the performance tests of trichloroethylene hydrogenation dechlorination at different reaction temperatures, the intrinsic relationship between the step atoms generated during the formation of the (312) crystal plane and the active sites of the catalyst was clarified. The study also utilized multiple characterization methods such as transmission electron microscopy (TEM), X-ray diffraction (XRD), X-ray photoelectron spectroscopy (XPS), and scanning electron microscopy (SEM) to conduct a comprehensive property analysis of the prepared catalytic materials.
Keywords:
(312) crystal facet
; Ni12P5
; hydrodechlorination
1. Introduction
Trichloroethylene (TCE) is a widely used organic chemical in the chemical and pharmaceutical industries. It has the characteristics of being difficult to biodegrade and highly carcinogenic. It has been included in the key controlled pollutants list by the United States Environmental Protection Agency (USEPA) [1,2,3,4]. In the existing traditional TCE disposal processes, technologies such as incineration and condensation generally have high operation and investment costs and long processing cycles, making them difficult to meet the application requirements of actual engineering [5,6]. In contrast, hydrogenation dechlorination (HDC) is a non-destructive treatment process that can directly convert TCE into hydrogen chloride and corresponding alkane products, while also achieving the resource recovery and utilization of by-products [7]. Therefore, this technology has become a research hotspot in the field of organic pollutant treatment, and various hydrogenation catalysts suitable for HDC reactions have been continuously developed and iterated. Currently, domestic and foreign related research mostly uses platinum (Pt), palladium (Pd), rhodium (Rh), and other precious metal catalysts for the hydrogenation dechlorination reaction of TCE. Although these precious metal catalysts have excellent catalytic activity for TCE hydrogenation reactions, they have problems such as high preparation costs, easy carbon deposition during the reaction process, high-temperature sintering, and poisoning of active sites, which greatly restrict their large-scale industrial application [8,9,10,11,12,13,14,15,16,17,18,19,20,21].
A large number of existing studies have confirmed that crystal plane control engineering is an effective strategy for optimizing the surface structure of catalysts and enhancing the performance of catalytic reactions. Jiang et al. [22] systematically investigated the crystal plane effect and structure-activity relationship of the CO2 reduction to CO reaction by regulating the exposure degree of the (110) crystal plane of ZnO nanosheets. Shi et al. [23] successfully prepared BiOBr materials with different crystal planes, (010) and (001), by regulating the solvent type of the synthesis system, achieving spatial directional separation of photogenerated carriers and effectively regulating the distribution behavior of electrons and holes in the switchable photocatalytic oxidation/reduction reaction system. Wang et al. [24] based on the core principle that catalytic adsorption reactions mainly occur on the surface of the catalyst, controllably synthesized CoSe2 materials exposed to (220) and (210) crystal planes, explored the regulation mechanism of different crystal planes on catalytic performance, and confirmed that crystal plane engineering can effectively optimize the conversion process of lithium polysulfides (LiPSs), which is an effective means to improve the electrochemical performance of lithium-sulfur (LiS) batteries. She et al. [25] prepared CuOx/Fe2O3 composite catalysts with different crystal planes, (001), (102), and (104), by combining hydrothermal method and impregnation method. The research results showed that the preferential exposure of the (001) crystal plane of the catalyst can optimize the adsorption-desorption kinetics of reaction intermediates and significantly improve the efficiency of CO oxidation reaction. Yun et al. [26] precisely controlled the crystal plane exposure type of Co3O4, and constructed catalytic systems with single (111) crystal plane, (111)/(100) mixed crystal plane, and preferential (100) crystal plane structure, effectively regulated the electronic structure of Pt nanoparticles, and optimized the hydrogen overflow performance of the Pt/Co3O4 composite material.
Transition metal phosphides (TMPs) possess unique crystal and electronic structure characteristics. When phosphorus atoms are embedded in the lattice of transition metals, the spacing between metal atoms can be expanded from 0.250 nm to 0.261 nm. The increase in lattice spacing can weaken the interaction between metal atoms, causing the contraction of d orbital energy bands and thereby enhancing the electron density near the Fermi level. Some TMPs exhibit catalytic properties similar to those of noble metals such as platinum, thus being defined as "quasi-platinum catalysts". They show good catalytic potential in the hydrogenation dechlorination (HDC) reaction of trichloroethylene. Current catalytic mechanism studies indicate that the structural regulation of the atomic layers on the catalyst surface can significantly alter its catalytic reaction activity, and the control of crystal planes is the core means to achieve precise modification of the catalyst surface. With excellent atomic exposure characteristics and controllable surface modification advantages, crystal plane engineering has become an effective strategy to improve the performance of heterogeneous catalytic systems. Currently, there are still shortcomings in the research on the Ni12P5 catalyst. The academic community has not yet clearly identified the influence mechanism of the edge structure of the catalyst on different crystal planes and its promoting or inhibiting rules for the rate of trichloroethylene hydrogenation dechlorination reaction. Based on this, this paper proposes a controllable synthesis strategy. By adjusting the solvent ratio of ethylene glycol and water, an Ni12P5 catalyst with preferentially exposed (312) high-index crystal plane can be precisely prepared. This crystal plane is rich in step-site atoms, which can effectively optimize the microscopic structure of the catalyst surface and construct efficient active sites, ultimately achieving a significant improvement in the catalytic performance of trichloroethylene hydrogenation dechlorination at different reaction temperatures.
2. Experimental Equipment
(1). Materials
All the chemicals were used without further purification. Both Nickel(II) nitrate hexahydrate (Ni(NO3)2·6(H2O), AR) and Ethylene glycol (C3H6O2, AR) were purchased from Sinopharm Chemical Reagent Co., Ltd. Red phosphorus (P, AR) was purchased from Adamas-beta.
(2). Catalyst preparation
This study employed a one-step hydrothermal synthesis method to prepare Ni12P5 materials, with the specific preparation process as follows: 0.008 mol of nickel nitrate hexahydrate (Ni(NO3)2·6(H2O)) was accurately weighed and dissolved in a mixed solvent system consisting of 70 mL deionized water and ethylene glycol. To investigate the effect of solvent ratio on material properties, six gradient solvent volume ratios were set, with deionized water to ethylene glycol volumes of 40 mL/30 mL, 45 mL/25 mL, 50 mL/20 mL, 55 mL/15 mL, 60 mL/10 mL, and 70 mL/0 mL, respectively. The mixture was stirred magnetically at room temperature until the solute was completely dissolved. Subsequently, 0.04 mol of phosphorus source was added into the homogeneous solution, followed by continuous magnetic stirring for 1 hour to obtain a uniform and stable precursor mixture.
The resulting precursor solution was transferred into a 100 mL Teflon-lined stainless steel hydrothermal autoclave, sealed, and placed in a constant-temperature oven for a hydrothermal reaction at 453.15 K for 12 hours. After the reaction, the autoclave was allowed to cool naturally to room temperature, and the black solid precipitate was separated via high-speed centrifugation. The precipitate was successively washed three times each with deionized water and anhydrous ethanol to thoroughly remove residual soluble impurities and organic solvents from the surface of the sample. The purified black solid product was then dried in a vacuum drying oven at 353.15 K under vacuum conditions for 3 hours, ultimately yielding a series of Ni12P5 samples.
Based on the volume of ethylene glycol added during preparation, the six samples synthesized using different solvent ratios were named sequentially as Ni12P5-30, Ni12P5-25, Ni12P5-20, Ni12P5-15, Ni12P5-10, and Ni12P5-n.
(3). Characterizations
The powder X-ray diffraction (XRD) characterization was conducted using an Ultima IV X-ray diffractometer. The radiation source was Cu Kα characteristic rays (wavelength λ = 0.1541 nm), with the instrument operating voltage set at 40 kV and the working current at 40 mA. The 2θ scanning range was 30° to 60°, and the continuous scanning rate was 20°/min. The microscopic surface morphology of the sample was observed using a FEI Sirion field emission scanning electron microscope (FESEM). The transmission electron microscope (TEM) characterization was carried out on a FEI-G20-2010 transmission electron microscope, with the electron acceleration voltage set at 200 kV to observe the microscopic crystal structure and particle morphology of the sample. The X-ray photoelectron spectroscopy (XPS) test was conducted using a Thermo Scientific K-Alpha spectrometer to collect information on the types, contents, and valence states of elements on the sample surface.
(4). Hydrodechlorination (HDC) of trichloroethylene (TCE)
This study employed a continuous-flow fixed-bed reactor equipped with quartz reaction tubes to systematically investigate the hydrogenation dechlorination (HDC) catalytic performance of the Ni12P5-x catalyst for trichloroethylene (TCE). The experiment used high-purity hydrogen gas provided by the Shanghai Anspet LGH-300B hydrogen generator as the carrier gas. TCE vapor was smoothly introduced into the fixed-bed reaction system by bubbling. During the experiment, 4 mL of the catalyst sample was accurately measured and filled in the central temperature zone of the quartz reaction tube. Before sample testing, the sample was in situ reduced and activated under a pure hydrogen atmosphere at 400 ℃ for 2 hours to complete the catalyst pretreatment. All HDC catalytic reactions were carried out under normal pressure conditions. Two reaction temperature gradients of 450 ℃ and 500 ℃ were set, and each group of reactions lasted for 40 minutes. The hydrogen carrier gas flow rate was constant at 50 mL·min-1 throughout the experiment. The mass of the liquid containing TCE in the gas washing bottle was accurately weighed using a high-precision analytical balance. The mass difference of the system before and after the reaction was recorded to calculate the actual amount of TCE involved in the reaction. The hydrogen chloride (HCl) products generated during the reaction were absorbed by deionized water throughout the process. Phenolphthalein was used as an acid-base indicator, and the concentration of HCl in the absorption solution was precisely determined by acid-base titration to characterize the HDC catalytic activity of the catalyst. The specific activity calculation method is as follows:
R–Cl decomposition of TCE = n(HCl)/3n(TCE) × 100%
3. Results and Discussion
Figure 1 shows the XRD diffraction patterns of the series of Ni12P5 catalysts. The diffraction peaks of all samples have sharp shapes and regular positions, and they are in good agreement with the characteristic diffraction peaks of standard card PDF #22-1190. Among them, the characteristic diffraction peaks at 32.84°, 38.58°, 40.84°, 41.32°, 41.88°, 44.56°, 46.96°, and 49.10° respectively belong to the (310), (112), (202), (321), (400), (330), (420), and (312) crystal planes of NiP. From the results of the graph, it can be seen that the catalysts prepared without ethylene glycol solvent system have almost no characteristic diffraction signals of the (312) crystal plane; as the volume of ethylene glycol added increases, the intensity of the (312) crystal plane diffraction peak gradually increases, and the degree of crystal plane exposure significantly enhances. Combined with the particle size analysis results in Figure 2, by using the Scherrer formula, it can be calculated that the particle size of the NiP catalyst without adding ethylene glycol is approximately 8.57 nm, and the particle size of the NiP catalyst modified by ethylene glycol increases to 14.6 nm. The above results indicate that the introduction of ethylene glycol can regulate the exposure degree of the (312) crystal plane of the Ni12P5 catalyst, and the preferential exposure of the (312) crystal plane is significantly correlated with the increase in the particle size of the catalyst.
Our previous research in this group has confirmed [27] that the preferential growth behavior of the catalyst's crystal planes plays a crucial role in regulating its hydrogenation catalytic activity. To further quantitatively analyze the influence of ethylene glycol on the growth of the catalyst's crystal planes, the (420) crystal plane with stable signals and the highest intensity was selected as the reference crystal plane. The relative intensities of the crystal planes of different samples were compared and analyzed. Based on the data in Table 1, it can be clearly seen that as the volume of ethylene glycol added increases, the relative diffraction intensity of the (312) crystal plane of the NiP catalyst continuously increases, proving that ethylene glycol can effectively induce the preferential growth of the (312) crystal plane of the catalyst.
The chemical valence states and electronic structures of Ni and P elements on the surface of the Ni12P5 catalyst were systematically characterized by X-ray photoelectron spectroscopy (XPS). The test results are shown in Figure 3. The high-resolution XPS spectrum of Ni 2p is shown in Figure 3a. The spectrum can be analyzed into six characteristic diffraction peaks, with binding energies of 879.4 eV, 873.4 eV, 869.7 eV, 861.2 eV, 852.8 eV, and 852.6 eV respectively. Among them, the characteristic peak at 852.8 eV belongs to the Ni species in the metal phosphide, and this binding energy is highly consistent with the standard binding energy of zero-valent nickel (Ni0, 852.8 eV) [28]. Thus, it can be inferred that the Ni atoms in this system carry a weak positive charge and exhibit a low-valent state characteristic (Niδ+ 0<δ<2).
Figure 3b shows the high-resolution XPS spectrum of P 2p for the sample. Clear characteristic double-peak structures can be observed. The characteristic peak at 130.1 eV corresponds to the P species in the metal phosphide, and its binding energy is close to that of elemental P (130.0 eV) [29], proving that the P atoms in the phosphide carry a weak negative charge (Pδ-, 0<δ<1). In addition, the characteristic peaks at 852.6 eV and 861.2 eV in the Ni 2p spectrum and the characteristic peak at 133.4 eV in the P 2p spectrum are mainly attributed to the slight oxidation of the surface of the Ni12P5 catalyst in the air environment, generating a phosphate nickel impurity phase [30]. In summary, the XPS characterization results indicate that the prepared Ni12P5 catalyst has a weak charge polarization structure, with the surface Ni species showing weak positive charge and the P species showing weak negative charge. Figure 3c shows the peak positions of the two elements in the full spectrum of the Ni12P5-25 catalyst.
The microscopic morphology and pore structure of a series of Ni12P5 catalysts were characterized by scanning electron microscopy (SEM), as shown in Figure 4. From the SEM images, it can be seen that all the prepared catalyst samples have irregular pores distributed on their surfaces, forming a typical three-dimensional porous network structure. With the increase in the volume of ethylene glycol solvent added, the internal pore structure of the samples gradually became regular and densified, and the degree of densification significantly improved. Combining the aforementioned analysis results of crystal grain size, it can be known that the microscopic pore structure evolution regulated by ethylene glycol has a good correspondence with the change of catalyst crystal grain size.
Based on the above crystal face evolution rules, this study further analyzed the formation mechanism of the preferential exposure of the (312) crystal face of the Ni12P5 catalyst. The surface of the ethylene glycol molecule is rich in hydroxyl groups, and the hydroxyl groups have strong electronegativity, which can undergo selective adsorption with the high-energy crystal faces of the crystal. During the crystal growth process, the newly formed Ni atoms tend to migrate and accumulate on the high-energy surface of the crystal[31], thereby regulating the anisotropic growth of the crystal. With the increase in the addition amount of ethylene glycol, its selective adsorption and induced growth effects on the high-energy crystal face are significantly enhanced, ultimately achieving a continuous increase in the exposure degree of the high-energy crystal face of the Ni12P5 catalyst (312). In contrast, in the synthesis system without ethylene glycol participation, due to the lack of this selective adsorption-induced effect, the (312) crystal face is difficult to be exposed, which is completely consistent with the aforementioned XRD characterization results.
To investigate the regulatory mechanism of hydroxyl groups in ethylene glycol on the microcrystalline growth behavior of the sample, this study employed transmission electron microscopy (TEM) combined with selected area electron diffraction (SAED) to characterize the micro-morphology and crystal structure of the prepared samples. TEM characterization results (Figure 5) revealed that the Ni12P5 catalysts were composed of nanoparticles, which did not exist as monodisperse entities but instead aggregated and stacked into thin sheet-like microstructures. Figure 5a and Figure 5c show the TEM images of Ni12P5-25 and Ni12P5-n samples, respectively, while Figure 5b and Figure 5d present their corresponding SAED diffraction patterns.
The SAED results indicate that in the diffraction pattern of the Ni12P5-n sample (Figure 5d), the number of concentric diffraction spots corresponding to the (312) crystal plane of Ni12P5 is low and the signal intensity weak, suggesting minimal exposure of the (312) plane and making it difficult to clearly identify within the microcrystal structure. In contrast, the SAED pattern of the Ni12P5-25 sample (Figure 5b) shows a significantly increased number of concentric diffraction spots and much stronger diffraction intensity for the (312) plane, clearly indicating a higher degree of (312) plane exposure in the Ni12P5-25 sample.
These characterization results are highly consistent with XRD data, strongly confirming that the hydroxyl groups in ethylene glycol exert specific adsorption control over the growth of the (312) crystal plane in Ni12P5 microcrystals. Ethylene glycol acts as a specific solvent that promotes preferential growth of the (312) plane in Ni12P5 crystals, and its hydroxyl groups effectively enhance the exposure of the (312) plane, enabling directed regulation of the sample's microcrystalline structure.
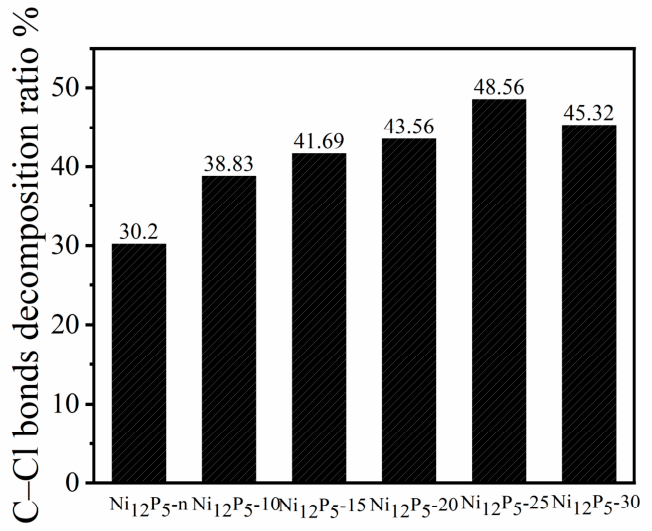
To further explore the influence of the crystal face structure of the catalyst on its catalytic performance, this study focused on the hydrogenation dechlorination (HDC) reaction of trichloroethylene (TCE). By analyzing the degradation behavior of C-Cl bonds under different reaction temperatures (400 ℃, 450 ℃, 500 ℃, 550 ℃, 600 ℃), a systematic comparison was made of the catalytic activity differences of a series of Ni12P5 catalysts. As shown in Figure 6, the performance test results indicated that compared with the Ni12P5 catalyst with a lower exposure degree of the (312) crystal face, the Ni12P5 catalyst with a higher exposure of the (312) crystal face exhibited superior TCE hydrogenation dechlorination catalytic activity in all reaction temperature ranges. Among them, 450℃ was the optimal reaction temperature for this series of catalysts. The catalytic activities of the samples at this temperature were in the following order: Ni12P5-25 (48.6%) > Ni12P5-30 (45.3%) >Ni12P5-20 (43.6%) > Ni12P5-15 (41.7%) > Ni12P5-10 (38.8%) > Ni12P5-n (33.2%). The comparison results indicated that Ni12P5-25 maintained excellent and stable catalytic activity throughout the temperature gradient range. This result further verified that the subtle structural differences of the microscopic crystal faces of the Ni12P5 catalyst can significantly regulate its catalytic performance, and the exposure intensity of the (312) crystal face is the key factor determining the TCE hydrogenation dechlorination activity of the Ni12P5 catalyst.
Figure 6.
C–Cl bonds decomposition ratio at different temperature for Ni12P5-x.
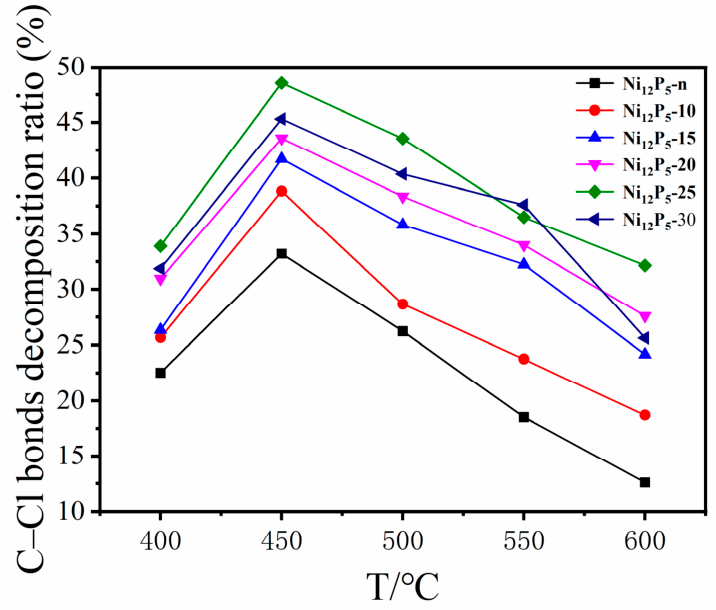
Figure 7.
C–Cl bonds decomposition ratio at 450 oC for Ni12P5-x.
4. Conclusions
This study employed a one-step synthesis method to prepare a series of Ni12P5-x catalysts by adjusting the addition amount of ethylene glycol in the solvent system. The samples' phase structure, microstructure, and surface properties were systematically analyzed using various characterization methods such as XRD, XPS, SEM, and TEM. The comprehensive characterization and catalytic performance test results indicated that the introduction of ethylene glycol could effectively induce the preferential growth of Ni12P5 crystals, significantly promote the exposure of the (312) characteristic crystal plane, and the effective exposure of this crystal plane could significantly enhance the tri-chloroethylene hydrogenation dechlorination catalytic activity of the catalyst at 450 ℃.
Based on the crystal growth mechanism and experimental results analysis, the exposure degree of the (312) crystal plane of the Ni12P5 catalyst is positively correlated with the addition amount of ethylene glycol. During the crystal nucleation and growth process, the hydroxyl groups in the ethylene glycol molecules can selectively adsorb on the high-energy surface of Ni12P5. As the addition amount of ethylene glycol increases, the concentration of hydroxyl groups in the system increases accordingly, and the adsorption protection effect on the (312) high-energy crystal plane further enhances, effectively inhibiting the anisotropic growth of this crystal plane, and ultimately achieving a significant increase in the exposure ratio of the (312) crystal plane. Compared with the Ni12P5-n catalyst prepared without adding ethylene glycol, the Ni12P5-x catalyst with a high exposure (312) crystal plane can provide more effective active sites, which is the core reason for its superior hydrogenation dechlorination catalytic performance.
It is worth noting that the hydrogenation catalytic activity of the catalyst and the exposure intensity of the (312) crystal plane are not in a simple linear positive correlation. Combining the activity test results at different temperatures, it can be seen that as the reaction temperature increases, the hydrogenation activity of the catalyst shows a trend of first increasing and then decreasing. When the ratio of crystal plane strength I(312)/I(420) is 0.45, the catalyst can achieve the optimal catalytic activity. This result indicates that within a certain range, increasing the exposure intensity of the (312) crystal plane can effectively increase the number of surface active sites, thereby optimizing the catalytic performance; however, when the exposure intensity of the (312) crystal plane exceeds the critical threshold, the excessive exposure of the crystal plane will cause the stacking, coverage, and structural aggregation of active sites, which will instead lead to a reduction in the number of effective active sites of the catalyst and ultimately result in the attenuation of the hydrogenation dechlorination catalytic activity.
Acknowledgments
The authors declare that artificial intelligence language models have been applied to refine the sentence structure, academic expression and wording of this manuscript. The use of AI tools does not affect any original research content, experimental data, scientific interpretation and research conclusions presented in this work. We gratefully acknowledge the support of the Anhui Province Higher Education Science Research Project (grant numbers: 2025AHGXZK31131, 2025AHGXZK40616, 2024AH040133); Anhui Province Quality Project (2024cxtd218; 2025jyxm0730); Anhui Vocational College's School-level Quality Project (2023yjjyxm16), School-level Research Platform of Anhui Vocational Technology College (2024xjpt03); Training Program for Young and Middle-Aged Teachers of Colleges and Universities in Anhui Province(YQZD2024073).
Conflicts of interest
The author declares no competing financial interest.
References
- Liu, X.G.; Chen, J.X.; Zhang, J.Y. Ind. Eng. Chem. Res. 2008, 47, 5362–5368.
- Chen, J.; Zhou, S.; Ci, D. Ind. Eng. Chem. Res. 2009, 48, 263–271.
- Chen, J.; Zhou, S.; Liu, X. Catal. Lett 2008, 122, 167–175.
- Yang, Q.; Dai, J.C.; Chen, J.X. Chinese J. Catal. 2013, 34, 1201–1207.
- Ren, L.L.; Pan, X.M. Catal. Commun. 2011, 12, 1366–1369.
- Babu, N.S.; Lingaiah, N.; Prasad, P. Appl. Catal. B Env. 2012, 111, 309–316.
- Bae, J.W.; Lee, J.S.; Lee, K.H. Appl. Catal. A Gen. 2008, 334, 156–167.
- Ukisu, Y.; Kameoka, S.; Miyadera, T. Appl. Catal. B-Env. 1998, 18, 273–279.
- Choi, Y.H.; Lee, W.Y. Catal. Lett 2000, 67, 155–161.
- Molina, C.B.; Calvo, L. Appl. Clay Sci. 2009, 45, 206–212.
- Murthy, K.V.; Patterson, P.M. J. Catal. 2004, 223, 74–85.
- Xia, C.; Liu, Y.; Zhou, S.; Yang, C.; Liu, S. J. Hazard. Mater. 2009, 169, 1029–1033. [PubMed]
- Cecilia, J.A.; Jiménez-Morales, I. J. Mol. Catal. A-Chem. 2013, 53, 78–87.
- Śrębowata, A.; Baran, R.; D. Lisovytskiy, I.I. Catal. Commun. 2014, 57, 107–110.
- Bai, H. T.; Dong, D. R.; Wang, Z. L.; et al. Plat. Finish. 2026, 48(5), 20–26.
- Gu, Y. H.; Ren, H. X.; Bi, K. L. Plat. Finish. 2025, 47(9), 90–96,118.
- Li, Z. W.; Xu, X.; Zhou, J. X. Plat. Finish. 2026, 48(2), 146–153.
- Zheng, X. M.; Zhu, Y. Q.; Ming, S.; et al. Plat. Finish. 2026, 48(5), 13–19, 26.
- Li, Y.; Zhu, S.; Zhao, K.; Shao, Y. Q. Plat. Finish. 2024, 46(12), 10–18.
- Wang, Y. Q.; Su, Y.; Li, N. Plat. Finish. 2024, 46(12), 19–24.
- Dong, Y.; Li, S. Z.; Zhang, J. Q. Plat. Finish. 2024, 47(8), 83–86.
- Jiang, S. S.; Chen, Y.; Cui, X.; et al. ACS Appl. Mater. Interfaces 2024, 16(12), 14965–14973. [PubMed]
- Shi, M.; Ren, G. M.; Zhang, Z. S. J. Catal. 2024, 429, 115300.
- Wang, X. B.; Chen, L. P.; Liu, S. R. Chem. Eng. J. 2024, 483. 149401.
- She, Y.; Niu, W. K.; Liu, R. Chem. Eng. Journal. 2026, 538, 176603.
- Yun, H.; Feng, J.; Peng, W. Y.; Xiong, M.i. Chem. Sci. 2026, 17, 8753. [PubMed]
- Liu, X.M.; Ren, L.L. RSC Adv. 2016, 6, 7413–7418.
- Mandale, A.B.; S. Badrinarayanan, S.K. Date. J. Electron. Spectros 1984, 33, 61–72. [CrossRef]
- Nefedov, V. I.; Salyn, Y. V. E. P.; Domashevskaya; Ugai, Y. A. J. Electron Spectrosc. Relat. Phenom. 1975, 6, 231–238.
- Sawhill, S. J.; Layman, K. A.; Van Wyk, D. R.; Engelhard, M. H. J. Catal. 2005, 231, 300–313.
- Li, Y.; Wang, W.; Xia, K.; Zhang, W.; Jiang, Y.; Zeng, Y.; Zhang, H.; Jin, C.; Zhang, Z.; Yang, D. Small 2015, 11, 4745. [PubMed]
Figure 1.
XRD pattern of Ni12P5-x sample.
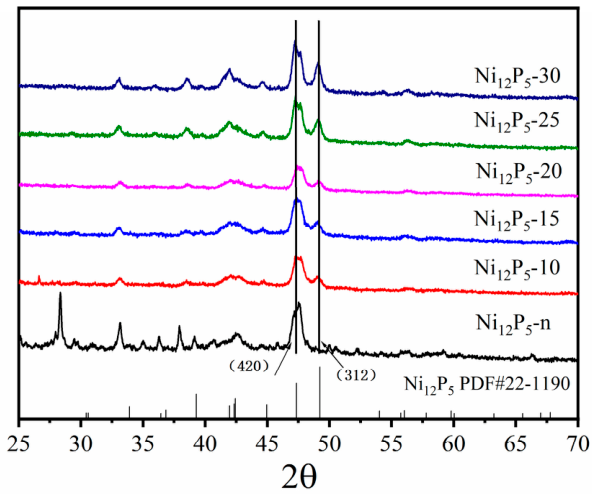
Figure 2.
Calculate the crystal particle sizes of Ni12P5-n (left) and Ni12P5-25 (right).
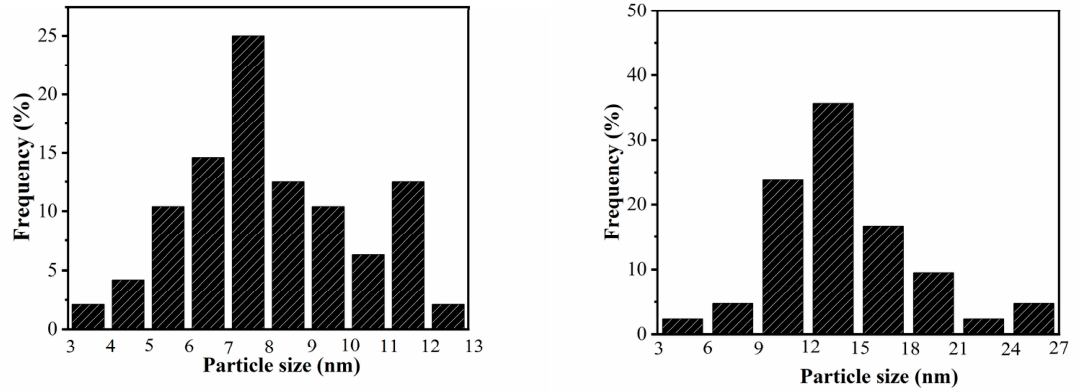
Figure 3.
XPS spectrum of Ni12P5-25 (a) Ni 2p (b) P 2p windows and (c) full survey spectrum.
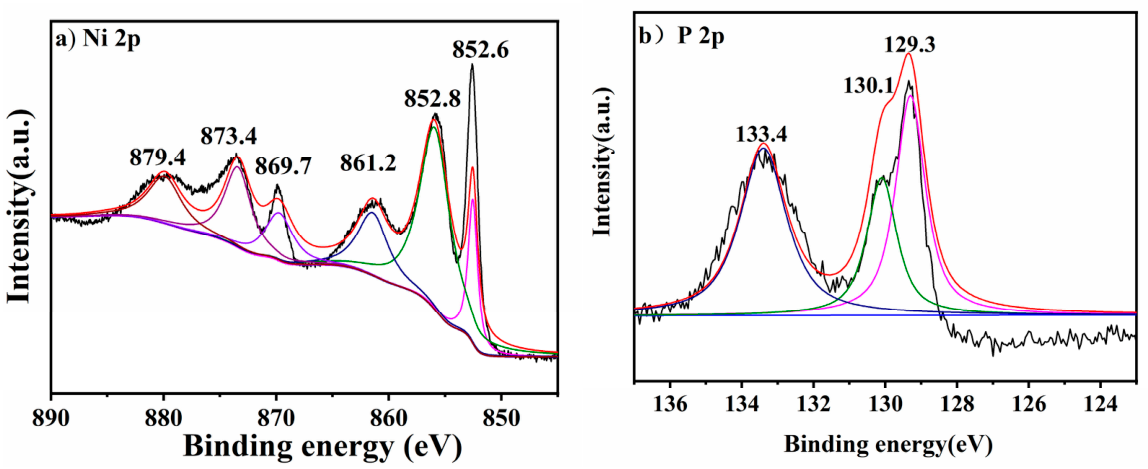
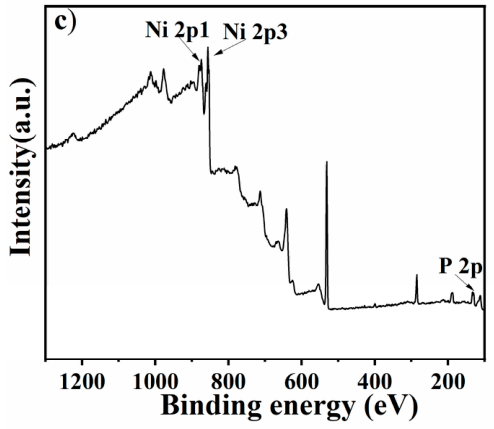
Figure 4.
SEM images of (a) Ni12P5-n (b) Ni12P5-10 (c) Ni12P5-15 (d) Ni12P5-20 (e-f) Ni12P5-25.
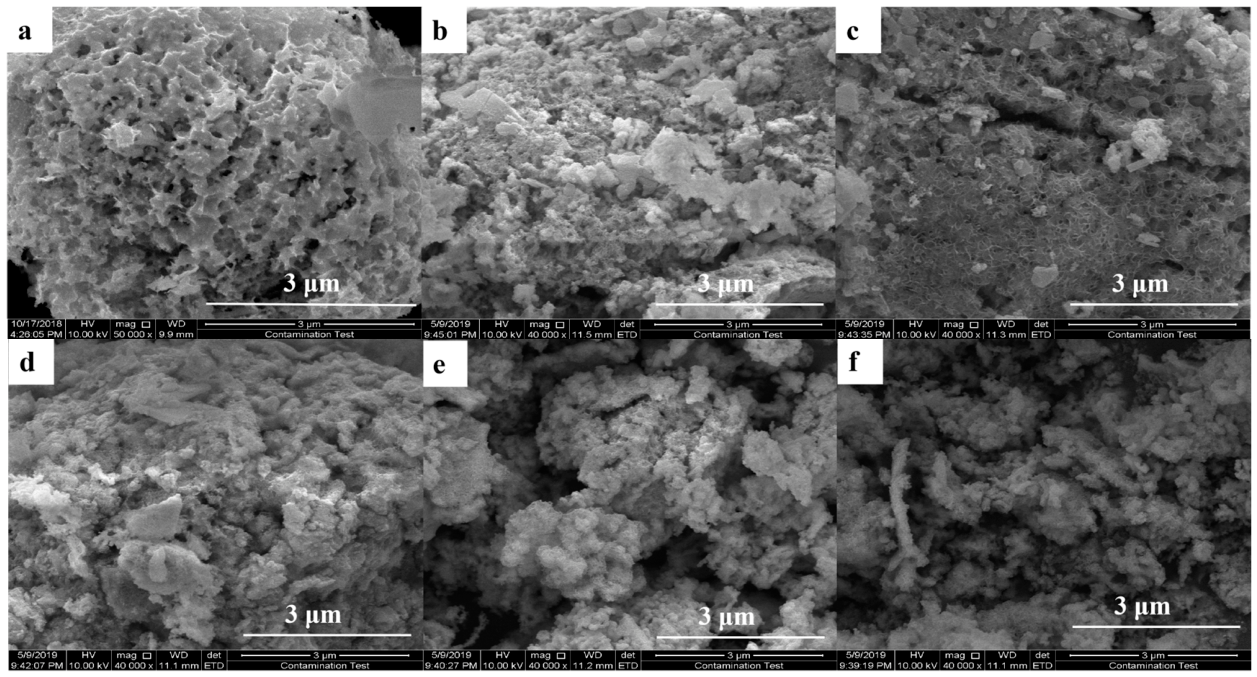
Figure 5.
TEM,and SAED images of (a, b) Ni12P5-25 (c, d) Ni12P5-n.
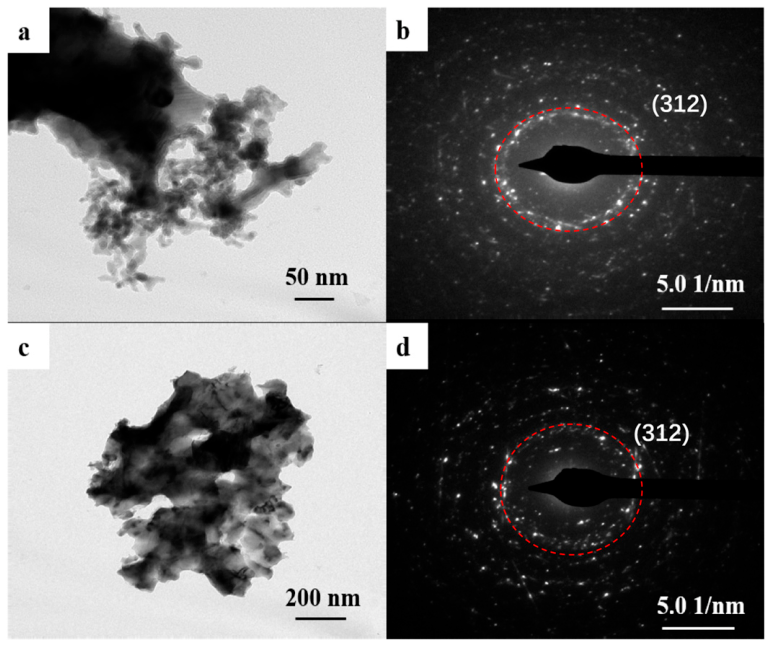

Table 1.
Intensity ratios of different crystal facets.
| I(420)/I(420) | I(312)/I(420) | |
|---|---|---|
| Ni12P5-n | 1 | 0 |
| Ni12P5-10 | 1 | 0.27 |
| Ni12P5-15 | 1 | 0.33 |
| Ni12P5-20 | 1 | 0.36 |
| Ni12P5-25 | 1 | 0.45 |
| Ni12P5-30 | 1 | 0.52 |
Disclaimer/Publisher’s Note: The statements, opinions and data contained in all publications are solely those of the individual author(s) and contributor(s) and not of MDPI and/or the editor(s). MDPI and/or the editor(s) disclaim responsibility for any injury to people or property resulting from any ideas, methods, instructions or products referred to in the content. |
© 2026 by the authors. Licensee MDPI, Basel, Switzerland. This article is an open access article distributed under the terms and conditions of the Creative Commons Attribution (CC BY) license (http://creativecommons.org/licenses/by/4.0/).
Copyright: This open access article is published under a Creative Commons CC BY 4.0 license, which permit the free download, distribution, and reuse, provided that the author and preprint are cited in any reuse.


