
Submitted:
02 July 2026
Posted:
03 July 2026
You are already at the latest version
Abstract
Extensive livestock farming is characteristic of the landscape of the Mediterranean regions of Southern Iberian Peninsula. These production systems based on dryland pastures provide a wide range of services and contribute to maintaining environmental balance when compared with intensive agricultural or other livestock production systems. The application of dolomitic limestone and fertilizer, as well as the increasing livestock stocking rates are possible strategies to promote the sustainable management and the intensification of the Montado ecosystem. This study was carried out under the SUMO (“Sustainability of the Montado”) project during the vegetative cycle of 2023/2024 on a 4-ha pasture field located at Mitra farm (Southern Portugal). The experimental design included four treatments resulting from the combination of limestone application (with and without) and stocking rate (traditional: 7 sheep ha⁻¹; high: 17 sheep ha⁻¹). Sheep grazing preferences, soil compaction and fertility, pasture productivity, quality and floristic composition were monitored at 48 sampling areas. The results confirm that improving soil pH through the application of dolomitic limestone is an effective, although slow and gradual process. When combined with grazing management through increased stocking rates, several important outcomes were observed: (i) preferential grazing areas did not exhibit significant differences in soil trampling; (ii) higher stocking rates resulted in less selective grazing; (iii) soil amendment and higher livestock stocking rate contributed to greater pasture crude protein availability (pasture productivity and quality) and animal productivity; and (iv) the influence of pasture quality on grazing preferences depended on the phase of the pasture-grazing cycle. Overall, these findings are promising indicators of sustainability for extensive animal production in Mediterranean dryland silvopastoral systems.
Keywords:
dryland pastures
; dolomitic limestone
; stocking rates
; grazing preferences
; soil trampling
; pasture quality index
1. Introduction
Extensive livestock farming (ELF), which relies primarily on pasture resources, is a low-input production system [1] and constitutes a characteristic landscape of Mediterranean regions across the Iberian Peninsula in Southern Europe. These systems encompass a broad range of management options whose performance can be very location-specific [2]. Despite their ecological and economic importance, grasslands are particularly susceptible to land-use changes, including overgrazing, as well as to the impacts of climate change, such as increasing temperatures and declining precipitation. Consequently, nearly half of the world’s grasslands are currently affected by some degree of degradation [3]. The productivity of these systems is tipically low, limited by physical constraints, such as climate and soil conditions [4]. In the specific case of Montado ecosystem, in Southern Portugal, which extends over more than one million hectares [5], the dominant soils are Cambisols [6] developed from granitic bedrock. These soils are typically shallow, stony, acidic, and inherently low in fertility, conditions that impose significant limitations on agricultural productivity [7]. According to Carvalho et al. [8], one of the low-cost alternatives suggested in this context is the application of dolomitic limestone as a way of improving soil fertility. Some studies have shown, however, that soil acidity amendment based on dolomitic limestone application is a gradual but very slow process [9], recommending the intermittent and systematic application of limestone until the soil pH stabilized at close to neutral [7]. Although the benefits of liming for agricultural production are widely recognized, the limited availability of field data means that its effects on pasture productivity and nutrient-use efficiency under different initial soil pH conditions remain insufficiently understood. As a result, liming practices in grassland systems are often overlooked, particularly in situations where economic returns are relatively low [10].
These agro-silvopastoral areas constitute Europe’s largest regional high natural value farming system and are internationally recognized for supporting exceptionally high levels of biodiversity. This characteristic led to their inclusion in the EU Habitats Directive as a natural habitat type of Community interest and to their consideration as a potential strategy for enhancing agroecological and community resilience to climate change [2].
Over the last two decades, several studies and projects have been developed, financed by national and European funds, particularly in Portugal and Spain through programs such as the RDP (Rural Development Program), Interreg Europe (Interregional Cooperation Program) or the RRP (Recovery and Resilience Plan), which seek to increase the productivity of the ELF systems. The proposed approaches, generally, involve interventions at level of soil, fertilization and/or pH correction [8], pasture monitoring and incorporation of botanical species that improve pasture quality, particularly legumes [7], trees reforestation and replacement of diseased trees [5] and/or grazing management, with the implementation of deferred grazing systems and the dynamic adjustment of biotic load [11]. These strategies aim to improve pasture productivity and quality, which will increase the number of animals per unit area, i.e., the final animal productivity. Nevertheless, it is important to safeguard the long-term sustainability of the system, particularly soil fertility and functionality. The risk of increased soil compaction due to higher biotic load and poor management of grazing areas and periods has been reported, especially in cattle grazing [11,12], but not in sheep grazing [11]. On the other hand, low stocking rates are usually associated with strong grazing selectivity for plant species. These grazing patterns depend on several factors, including climatic conditions, spatial experience of the animals, forage availability and floristic composition [12]. Selective grazing is considered a drawback, with a medium-term impact on the flora balance of the pasture [13].
Measuring the impact of these strategies, particularly in the context of potential system intensification, is both essential and challenging. This complexity arises not only from the interactions among the multiple factors involved, which are further influenced by the high interannual climatic variability characteristic of Mediterranean environments, but also from the need to ensure long-term sustainability through the preservation of soil and tree functionality, pasture biodiversity, and animal welfare [14].
Meanwhile, promising prospects are emerging with the integration of technologies of Precision Agriculture, to monitor soil, pasture and environmental parameters and to effectively manage grazing animals [1]. When applied to the field of animal production (precision livestock farming, PLF), using the principles and technology of process engineering [15], have made it possible to compile databases for monitoring key indicators that support farm managers decision-making and represents a significant evolution in the livestock sector, whit impact on production efficiency and sustainability [1]. Knowledge-driven and precise grazing management is required to use grasslands’ potential in a sustainable way. Information gaps lead to inefficiencies in grazing land management and ecosystem service provision. Rapid advances in automated sensors and information technologies for information acquisition on herbage availability, controlling animal grazing behavior and setting up data-driven decision support tools have the potential to improve grazing management [16]. Some examples of these technologies that have been widely used in animal experiments include: (i) Global Navigation Satellite Systems (GNSS) collars for monitoring grazing [17], the electronic cone penetrometer for the rapid assessment of soil compaction [18], or various sensors for estimating pasture productivity [19,20] or pasture quality through proximal and remote sensing approaches [21,22].
A better understanding of the factors involved in the Montado ecosystem and their interactions would provide valuable support for management decisions related to soil improvement, fertilization strategies, grazing allocation, stocking rate adjustment, and livestock supplementation requirements.
The objectives of this study were to evaluate: (i) the effect of intermittent application of dolomitic limestone on soil pH; (ii) the relationship between multiple soil parameters; (iii) temporal and spatial sheep grazing patterns and pasture availability/quality; (iv) the effect of grazing preferences on topsoil compaction; (v) the combined effect of soil amendment and the increase of traditional sheep stocking rate on soil compaction, pasture availability, quality (dry matter, crude protein and fiber) and the floristic composition throughout the growing season.
2. Materials and Methods
This article presents the results obtained during a one-year experimental period corresponding to the 2023/2024 pasture growing season, within the framework of a long-term study initiated in October 2015 (Figure 1). The experiment forms part of several research projects aimed at monitoring and evaluating soil conditions, pasture dynamics, and sheep grazing behavior. During the study period, three applications of dolomitic limestone (DLA; 2.0 tons ha-1: 42% calcium oxide, CaO and 10% magnesium oxide, MgO) were carried out on half the experimental field, while a single application of binary mineral fertilizer (SF; 100 kg ha-1 of ammonium phosphate, 18-46-0) was carried out throughout the experimental field. Within the scope of the present study, soil fertility was sampled before the trial (June 2023). Soil pH was monitored regularly from October 2015 to October 2024. The topsoil (0–20 cm) cone index and the availability and quality of the pasture (PAv) were monitored five times during the 2023/2024 growing season, spanning the period between December 2023 and October 2024. In addition, pasture floristic composition (PFC) was assessed at the peak of spring growth. A grazing trial involving variable sheep stocking rates trial was conducted between December 2023 and June 2024. Grazing preferences were monitored on four dates, on a monthly basis between March and June 2024.
2.1. Experimental Field and Sampling Scheme
The experimental area (4 ha), known as ‘Eco-SPAA’, is located at the Mitra experimental farm of the University of Évora, about 10 km from Évora, in the southern region of Portugal (coordinates: 38◦53.1 N; 8◦01.1 W; Figure 2). This field was subdivided into 4 plots of approximately 1 ha each. These plots were assigned to one of four treatments: T1– without liming and low stocking rate (LSR, 7 sheep ha-1); T2– without liming and high stocking rate (HSR, 18 sheep ha-1); T3– with liming and HSR; T4– with liming and LSR. Twelve sampling areas (3 m × 3 m) were georeferenced within each plot, totaling 48 across the field.
The altimetric map of the experimental field (Figure 3) shows the undulating terrain characteristic of this region, with higher elevations in the southern areas (around 227–228 m) and a gradual decrease in elevation towards the north and north-west (elevations of around 220 m).
The evolution of temperature and precipitation in the vegetative cycle of 2023/2024 is shown in Figure 4. The seasonal pattern of temperature is evident, with maximum values of approximately 26◦C in mid-summer (August), gradually decreasing to around 11◦C in winter (December) and gradually rising again throughout the spring and summer months. Monthly rainfall was distributed across the entire growing season of the dryland pastures (Autumn– 283 mm; Winter– 213 mm; and Spring– 174 mm) and the accumulated annual value (670 mm) was higher than the historical average recorded for the 1981–2010 reference period (587 mm).
2.2. Soil Sampling and Laboratory Analysis
Topsoil soil samples (0–30 cm depth) were collected in June 2023 at the 48 sampling areas, using a gouge auger and a hammer. These soil samples were inserted in plastic bags, air-dried, and analyzed for particle-size distribution (texture: sand, silt, and clay content) using a sedimentograph (Sedigraph 5100, manufactured by Micromeritics, Norcross, GA, USA), after passing the fine components through a 2 mm sieve. Soil particle sizes were classified according to USDA standards into three main textural separates based on diameter: clay (< 0.002 mm), silt (0.002–0.05 mm), and sand (0.05–2.0 mm). The fine soil (fraction with diameter < 2 mm) was characterized in terms of pH, organic matter (OM), phosphorus (P2O5), potassium (K2O), magnesium (Mg), manganese (Mn), cationic exchange capacity (CEC), sum of exchange bases (SEB), and degree of base saturation (DBS). These fine components were analyzed using the following methods [23]: (i) for pH in 1:2.5 (soil:water) suspension, using the potentiometric method; (ii) the OM was measured by combustion and CO2 measurement, using an infrared detection cell; (iii) P2O5 and K2O were extracted by the Egner–Riehm method; P2O5 content was measured using the colorimetric method while K2O content was measured with a flame photometer; (iv) the Mg and Mn were measured using atomic absorption spectrometry; (v) the CEC, SEB and DBS were measured by the neutral ammonium acetate method.
2.3. Soil Compaction Monitoring
To measure the soil resistance to penetration (Cone Index, CI, in kPa) an electronic cone penetrometer “FieldScout SC 900” (Spectrum Technologies, Aurora, IL, USA), equipped with an ultrasonic depth sensor, was used. Measurements were performed in the 48 sampling areas (12 in each treatment), on five dates throughout the experimental period (Figure 1): once prior to the animals entering the experimental plots (6 December 2023), to assess the pre-trial soil condition; three times during the growing season (16 February 2024, 11 March 2024 and 11 April 2024); and once, finally, 3–4 months after the grazing period (18 October 2024). On each sampling date, three measurements were taken with the cone penetrometer in each sampling area. In this study the CI data were organized into two depth classes: 0–10 cm; and 10–20 cm.
2.4. Pasture Availability, Quality and Floristic Composition Monitoring
Pasture sampling was carried out at the 48 georeferenced areas (3 m × 3 m). In each of these areas, composite pasture samples were obtained by collecting three subsamples with electric shears at 1 to 2 cm above ground in a 0.5 m × 0.5 m area (defined with a metal quadrat). The sampling process was performed at five different times through the growth cycle, i.e., between December 2023 and June 2024. Pasture samples were inserted into numbered plastic bags and transported to the MED—Animal Nutrition and Metabolism Laboratory at the University of Évora. In the laboratory, pasture samples were (i) weighed, to obtain fresh biomass availability (green matter, GM, in kg ha−1); (ii) dehydrated (72 h at 65◦C); (iii) weighed again to determine pasture moisture content (PMC, in %) and dry matter (DM, in kg ha−1). The dehydrated samples were subjected to standard analysis of wet chemistry according to the Association of Official Analytical Chemists [23] to determine key components of pasture quality, crude protein (CP) and neutral detergent fiber (NDF), both expressed as a percentage of DM. Finally, CP and NDF yields (kg ha−1) were calculated by multiplying their respective concentrations (%) by the total DM (kg ha−1) and dividing by 100.
In this study, a pasture quality index (PQI, in %) which incorporates CP, NDF and PMC (Equation 1) [9] was also calculated.
PQI = (CP × PMC)/NDF
In May 2024, a floristic inventory was conducted across all sampling areas to determine pasture floristic composition (PFC). The abundance of each species was visually estimated from the vertical projection of plant canopies onto the ground as a percentage of the sampling area [24]. Floristic community metrics—species and family richness (number) and diversity (Shannon–Wiener index), were used to characterize pasture biodiversity. Plant nomenclature followed “Flora Iberica” [25].
2.5. Observation of Sheep’s Grazing Behavior and Spot Preferences
To evaluate the impact of livestock spatial preference (grazing and resting areas) on soil compaction, pasture availability, quality, and floristic composition, animal presence or absence was monitored near each sampling area. Observations were conducted simultaneously across all plots by four trained observers (one per treatment) using binoculars, following the protocol described by Carreira et al. [13]. Monitoring took place over four days (over 12 h per day, between 7 am and 7 pm, approximately from sunrise to sunset): 20 March, 18 April, 13 May and 12 June. Observations (animal locations in the pasture) were made, coded and registered every 10 min.
2.6. Statistical Analysis
Descriptive statistical analysis (mean, standard deviation, and range) was performed for soil and pasture parameters. Data analysis was carried out considering a two-factor experiment (soil pH correction, application vs. non-application of dolomitic limestone, DL vs. WDL; and grazing system, low, L vs. high, H stocking rate, SR). Analysis of variance (ANOVA) between treatments (T1, T2, T3 and T4) was performed using the IBM SPSS 25 Statistics package for Windows. All statistical tests were two-tailed, with a 95% significance level (p < 0.05).
2.6.1. Specific Soil Fertility Analysis
Pearson’s correlation coefficient was used to analyze the linear relationships between among the twelve soil variables using the full dataset. A hierarchical clustering analysis was subsequently applied to the correlation matrix using the complete linkage method. The results were presented using dendrograms for the overall dataset and for each area (treatment), enabling variables to be clustered according to similarities in their behavior. The dendrogram allows one to visually identify groups of variables that are strongly positively correlated.
To quantify the similarity between the dendrograms of the four areas (treatments), the Baker’s gamma correlation (based on the agreement of pairs of variables that are grouped together) was used. This measure ranges from 0 to 1. In addition, the Baker’s distance (1 – Baker’s correlation) was derived, where values close to 0 indicate high similarity and values > 0.7 indicate strong dissimilarity.
All the procedures involved in this specific analysis were performed in R (version 4.x) using the RStudio environment, utilizing the following packages: “readxl” (data import), “corrplot” (correlation matrices), “pheatmap” (heatmaps with dendrograms), “dendextend” (dendrogram comparison and Baker’s distance), and stats (correlation, hierarchical clustering).
2.6.2. Specific Soil Cone Index (CI) Analysis
Relative to CI parameter, a separate mixed model was also carried out comparing CI values (across depths and sampling dates), but only between high and low animal grazing preferences densities (accumulated presence records). Based on the cumulative map of grazing preferences, compiled over the four observation dates, CI at 12 sampling areas with highest grazing density vs. CI at 12 sampling areas with lowest grazing density were used as paired comparisons.
2.6.3. Specific Pasture Floristic Composition (PFC) Analysis
With regard to PFC, the spatial distribution of the four most representative species within the experimental field was expressed as the number of occurrences in the 12 sampling areas for each treatment and across the total of 48 sampling areas. To estimate species occurrence at unsampled locations and generate continuous spatial data, the field was discretized into 1 m2 unit, thereby enabling the computation and mapping of species densities. Spatial interpolation was performed using ordinary kriging, which generated predictions for unsampled locations based on point measurements. The resulting kriged surfaces provided a detailed representation of the spatial patterns of each species. Raster maps were subsequently produced at a spatial resolution of 1 m2, a parameter specified in ArcGIS during the vector-to-raster conversion.
2.6.4. Specific Grazing Density Analysis
Grazing preferences maps (grazing density) were carried out through geostatistical analyses with the “Geostatistical Analyst” extension of ArcGIS software. Kriged maps showing the spatial distributions of animals (animal density) on each date were generated. Raster maps were obtained with a spatial resolution of 1 m2.
2.6.5. Relation Between Pasture Quality Index (PQI) and Grazing Density
The relation between PQI and grazing density was subjected to two statistical analyses: (i) A Pearson’s correlation by date, along with its significance level, to explore the direction and strength of the linear relationship. This provided an initial indication of whether positive or negative relationships existed; (ii) A Generalized Linear Mixed Model (GLMM), to assess whether the relationship between pasture quality (PQI) and grazing density changes across four dates in 2024 grazing cycle (repeated measurements), whilst controlling for variability across the 48 fixed sampling areas. The fixed effects of the model included date (four levels), PQI (covariate) and their “Date × PQI” interaction. The intercept was also included as a fixed effect. The random effect consisted of a variable intercept by sampling point to account for repeated measurements. Since the response is a count with overdispersion, a GLMM with a negative binomial distribution and a log link function was fitted. This model allows for: include date and PQI as fixed effects, along with their interaction (“Date × PQI”), to test whether the slope of the pasture quality-grazing density relationship varies across dates; and include the sampling areas as a random effect (random intercept), thereby controlling for the dependence between repeated measurements at the same area. Thus, the new intercept represents the logarithm of the expected grazing density for a point with average quality (PQIc = average) on the reference date (February/March). This facilitates a practical and straightforward interpretation. Following the centring, the model equation is show in Equation 2:
where: β0 = constant intercept (expected grazing density in February/March for an average PQIc); ui = random deviation of area i (random intercept); β1 = PQI slope in February/March (effect of pasture quality on grazing density on that date); β2 = differences in the intercept for April, May and June compared to February/March; β3 = change in the slope for each date compared to the February/March slope.
The hypothesis tested was that the overall interaction “Date × PQIc” (using a joint likelihood ratio or “Wald test”) indicates whether the relationship between pasture quality and grazing density varies significantly with the date. In addition, the individual slopes for each date (obtained by combining β1 and β3) were examined. The model was fitted using the “glmmTMB” package in R (version 1.1.8). Coefficients are reported on a log scale, and to facilitate interpretation, they are transformed to percentage change on the original scale () when the slopes are discussed.
3. Results
3.1. Soil Fertility
Descriptive and inferential analysis of soil samples collected prior to this experimental study (June 2023) are presented in Table 1. Texture analysis revealed average ranges of 76–79% for sand, 11–13% for silt and 10–11% for clay. Significant differences among treatments were observed only for silt, with higher values in the T3 area (13.0%) and lower values in the T4 area (10.7%). The average OM content was relatively high across the entire experimental plot (3.0–4.5%), with significantly higher values in the T1 area. As might be expected given the repeated application of dolomitic lime to plots T3 and T4, the average pH was significantly higher in these plots (around 6.0) and lower in plots T1 and T2 (5.5). Regarding macronutrients, potassium (K2O) levels were relatively high across the entire experimental plot (90–130 mg kg−1), whereas phosphorus (P2O5) levels were significantly higher only in the T1 area (90.7 mg kg−1), with values clearly lower in the remaining areas (between 45 and 64 mg kg−1). Magnesium (Mg) and the micronutrient manganese Mn exhibited different patterns: Mg maintained relatively high average levels across the entire experimental field (90–110 mg kg−1), while Mn were significantly higher in areas T3 and T4 (near of 65 mg kg−1) and lower in areas T1 and T2 (respectively 40 and 27 mg kg−1). Cation exchange capacity (CEC), was almost double in the T1 area (12 cmol kg-1) compared with the other areas (approximately 6 cmol kg-1). The sum of exchange bases (SEB) was significantly higher in the areas treated with dolomitic limestone (T3 and T4- 5.63 and 5.45 cmol kg-1, respectively) when compared with the others areas (T1 and T2- 2.14 and 3.42 cmol kg-1, respectively), and the same was apparent for the degree of base saturation, DBS (T3 and T4- 90-100%; T1- 26%; T2-58%).
The spatial representation of soil texture is presented in Figure 5. This confirms the significantly higher silt content in the area T3 (Figure 5b), and highlights a non-significant trend (Table 1) of the patch with the highest clay content in T2 and T3 (Figure 5c).
The maps in Figure 6 particularly highlight the higher concentrations of OM (4.5%; Figure 6a), CEC (> 8 meq 100g-1; Figure 6b) and P2O5 (> 80 ppm; Figure 6d) in T1 area, a finding already referred in Table 1. The effect of lime application on raising the pH in T3 and T4 areas is also evident (Figure 6c).
The combined approach of correlation matrices, dendrograms and Baker’s correlations enables a robust characterization of the relationships between variables and the structural differences between areas (treatments).
The global Pearson correlation matrix and the corresponding dendrogram of the soil properties (Figure 7a,b) revealed a highly significant inverse correlation between sand and clay content, and highly significant direct correlations between OM and CEC, P2O5 and K2O, pH and Mg, as well as among pH, SEB and DBS. Conversely, a strong direct correlation was found between pH and Mn. Despite these overall relationships (across the experimental field as a whole) among soil fertility parameters, individual analysis of each area (treatment) revealed distinct spatial patterns (Figure 8a–d).
The matrix of Baker’s distances among treatments (Table 2) showed that all pairs of areas (treatments) exhibited high Baker distances (≥ 0.702), indicating high or very high dissimilarity in the correlation structures. The maximum value (1.022) was recorded between T2 and T3, reflecting virtually opposite clustering patterns. The highest (though still low) similarity was found between T1 and T2 (distance 0.702). These results demonstrate that each zone exhibits distinct edaphic behavior. Consequently, aggregating the dataset without considering the treatment as a factor of heterogeneity is inappropriate, highlighting the spatial complexity inherent to soil fertility and soil health parameters.
Based on the historical data of pH measured in this experimental field, Figure 9 illustrates the positive trend in pH in the areas where dolomitic limestone was applied intermittently (COR, T3 and T4), tending towards neutral pH (6.4 in October 2024) compared with the trend (virtually stationary) in the areas where no dolomitic limestone was applied (UCOR, T1 and T2).
3.2. Patterns of Grazing Preferences
The cumulative spatial pattern of grazing preferences within the experimental field is shown in Figure 10a, representing the aggregated data from the four observation dates in spring 2024. Figure 10b, c and d display the same spatial dataset partitioned into three distinct daily observation periods: 06:30 to 11:00 h (b), 11:00 to 15:30 h (c), and 15:30 to 20:00 h (d). There is a clear increase in grazing activity in the early morning (Figure 10b) and late afternoon (Figure 10d). Conversely, the midday period (Figure 10c), which corresponds to the hottest hours and the highest levels of solar radiation, exhibited minimal grazing activity.
3.3. Soil Compaction
The evaluation of soil compaction (CI, in kPa), measured by the electronic cone penetrometer “FieldScout SC 900” (Figure 11a) across two depths intervals (0–10 cm and 10–20 cm) and under different livestock spatial preferences (Figure 10a), on five dates is shown in Figure 11b–f. The results revealed a significant and systematic trend towards higher CI values at greater depths (10–20 cm) compared to the surface layer (0–10 cm). Inferential analysis indicated no statistically significant differences between high and low grazing densities on any monitoring date or at either depth. However, a consistent trend toward higher CI values was observed in areas with higher grazing density, with the exception of 11 March 2024 (Figure 11d). It is important to continue the assessment over longer periods to determine whether this trend becomes statistically significant within the compaction/recovery cycles, thereby justifying the adoption of strategies to mitigate the impact of grazing on soil compaction.
3.4. Characterization of Pasture Floristic Composition
The assessment of the PFC carried out in May 2024 identified 79 plant species. Among these, four species were identified as the most widespread across the experimental field (Figure 12 and Figure 13): Erodium moschatum (Geraniaceae; present in 40 of 48 sampling areas), Diplotaxis catholica (Brassicaceae; present in 36 sampling areas), Cerastium glomeratum (Caryophyllaceae; present in 35 sampling areas) and Trifolium michelianum (Fabaceae; present in 29 sampling areas). This evaluation provided a general overview of the experimental field in terms of plant biodiversity and its spatial distribution.
3.5. Pasture Availability and Quality
Descriptive and inferential analyses of pasture parameters (biomass availability and nutritional quality), collected in five sampling dates between December 2023 and June 2024 are presented in Table 3.
The evolution of pasture availability, expressed as green matter (GM, in kg ha-1) or dry matter (DM, in kg ha-1), reflects: (i) the combined effect of temperature and precipitation on the pasture’s vegetative cycle, with a clear increase in availability on the first three monitoring dates (December, February and April), followed by a decline in May and a particularly sharp drop in June; (ii) the effect of dolomitic limestone application and soil pH correction (greater pasture availability in plot T3, corrected, compared with plot T2, uncorrected, and in plot T4, corrected, compared with T1, uncorrected, except during the final stage of the pasture growing season); and (iii) the effect of the sharp contrast between stocking rates: LSR (T1 and T4 - 7 sheep ha-1) and HSR (T2 and T3 – 18 sheep ha-1), with significantly and expected greater pasture availability in areas with LSR.
Regarding pasture quality, PMC (%) and CP (%) decreased over the growing season, whereas NDF (%) showed the opposite trend, which was particularly pronounced on the final monitoring date (June). None of these parameters showed significant differences among treatments, except for CP on the critical final evaluation date (June), with higher levels in the plots where dolomitic limestone was applied (T3 and T4). This important advantage was particularly evident in the plot subjected to HSR (T3). Crude protein (CP) and NDF, when expressed in kg ha-1, showed a similar trend to the pasture availability parameters (GM and DM).
The average trend (across all four plots of the experimental field) in terms of forage availability (DM or CP, in kg ha−1) is illustrated in Figure 14. Both parameters exhibited a progressive decline starting from the fourth monitoring date (May 2024). Concurrently, pasture quality decreased continuously throughout the growing season, as characterized by the Pasture Quality Index (PQI) line—which integrates CP, PMC, and NDF metrics (Figure 14). The PQI reached a minimum value below 5% during the final sampling event (Date 5; June 2024). In terms of inferential analysis (Figure 15), significant differences in the PQI were observed only on Date 1 (December 2023), with a lower PQI in the T2 area (44% compared with 55–58% in the other treatments).
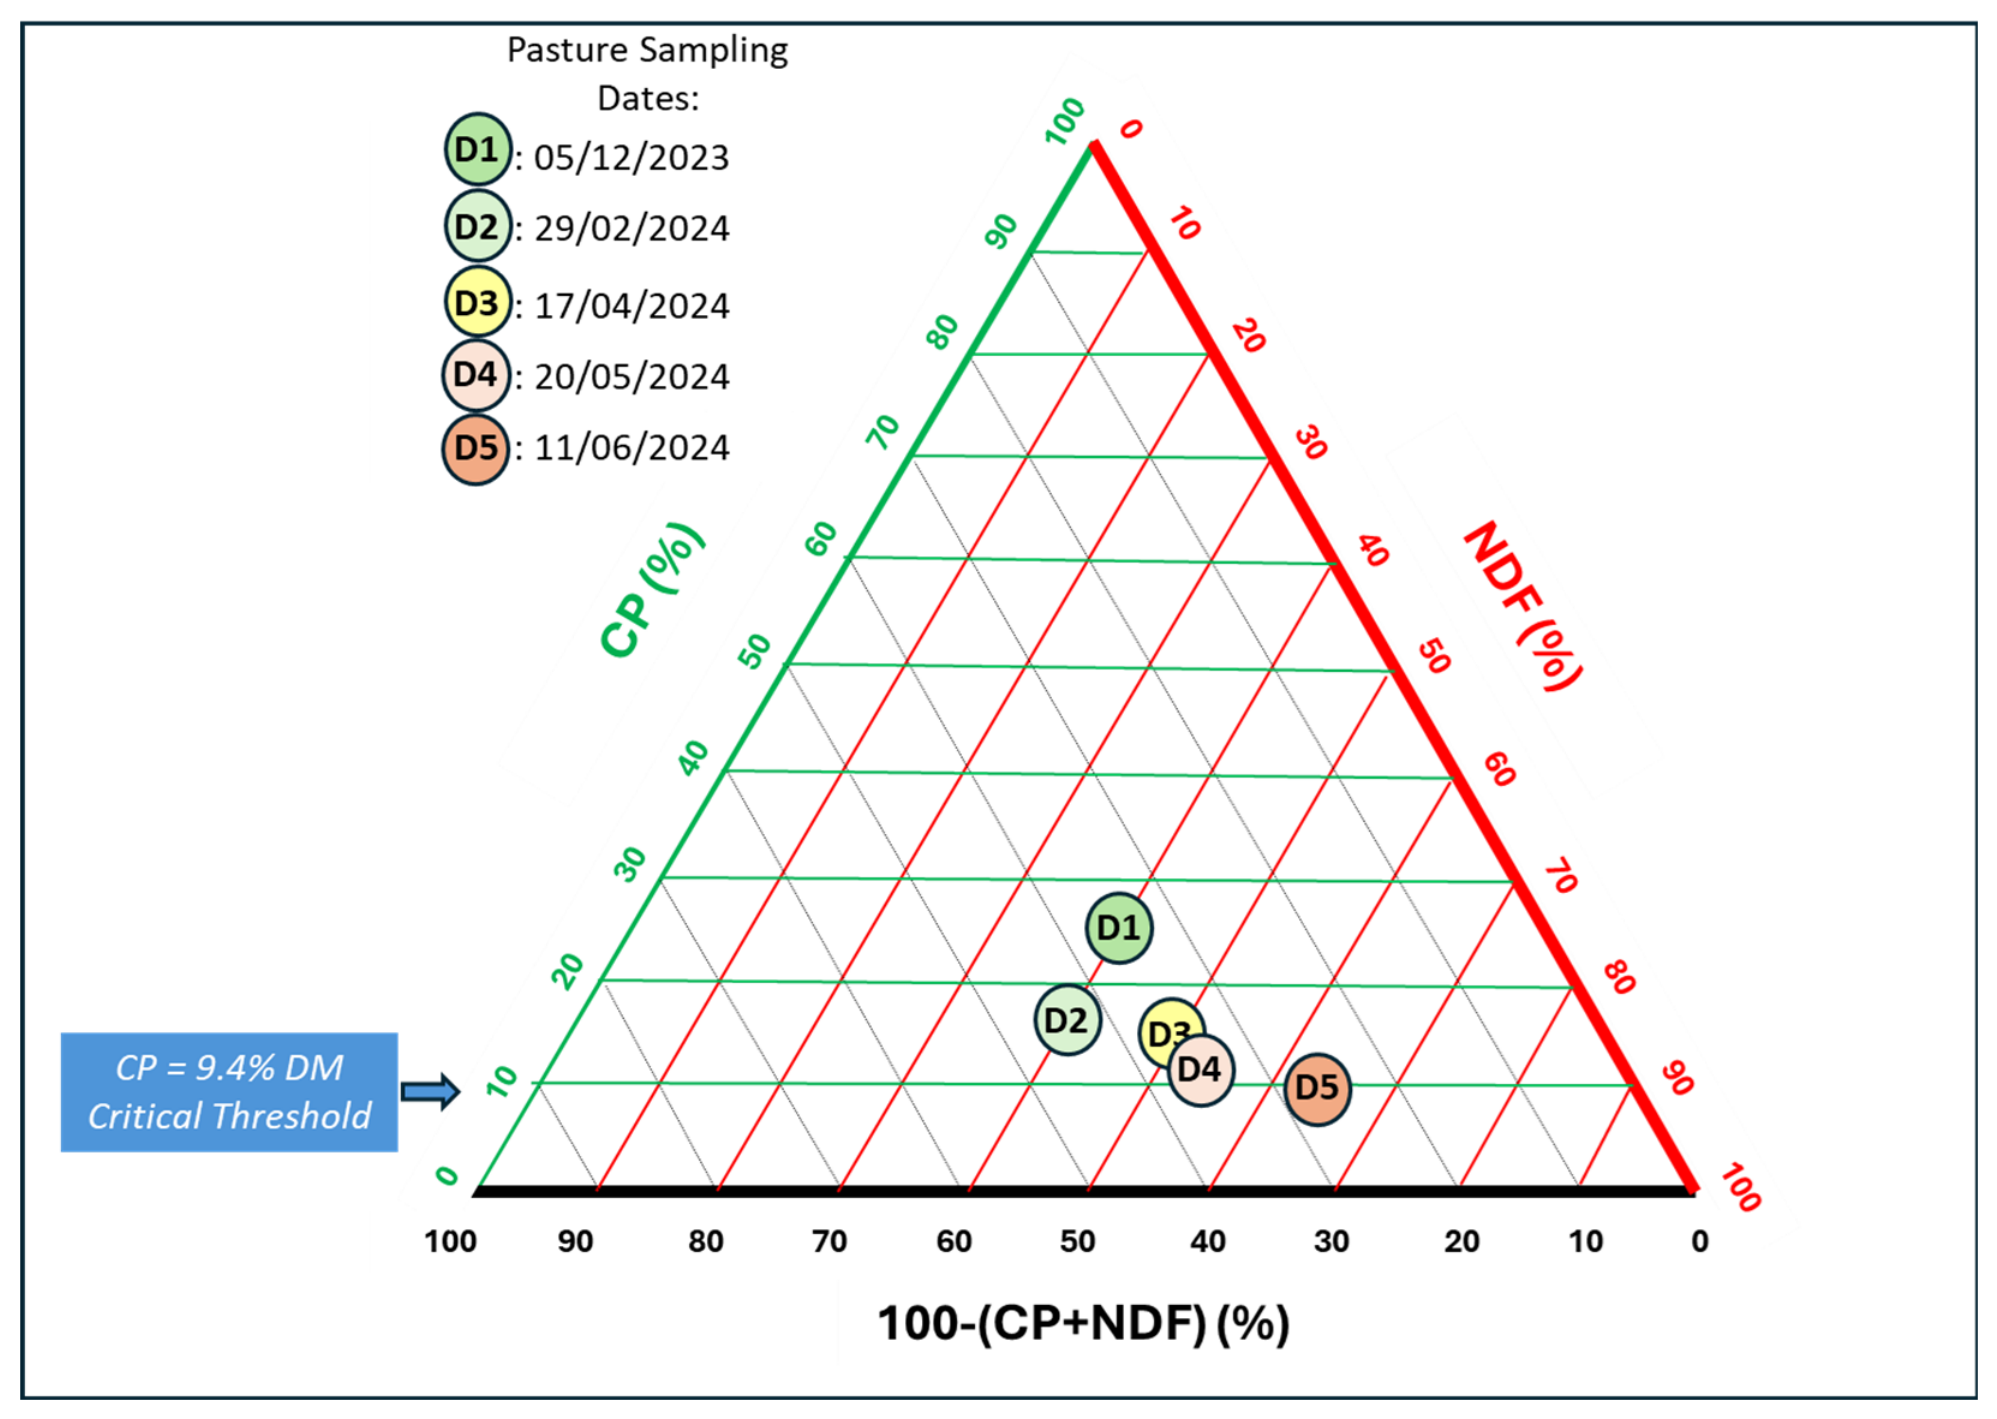
The evolution of average pasture quality, based on CP and NDF, throughout the monitoring process (Dates 1 to 5) can be assessed in Figure 15, using the critical limit considered in terms of minimum maintenance requirements for adult sheep as a reference (critical threshold for sheep supplementation; CP = 9.4%) [26].
Figure 15.
Evolution of mean pasture quality index (PQI, in %) for each treatment and in each date (between December 2023 and June 2024).
Figure 15.
Evolution of mean pasture quality index (PQI, in %) for each treatment and in each date (between December 2023 and June 2024).
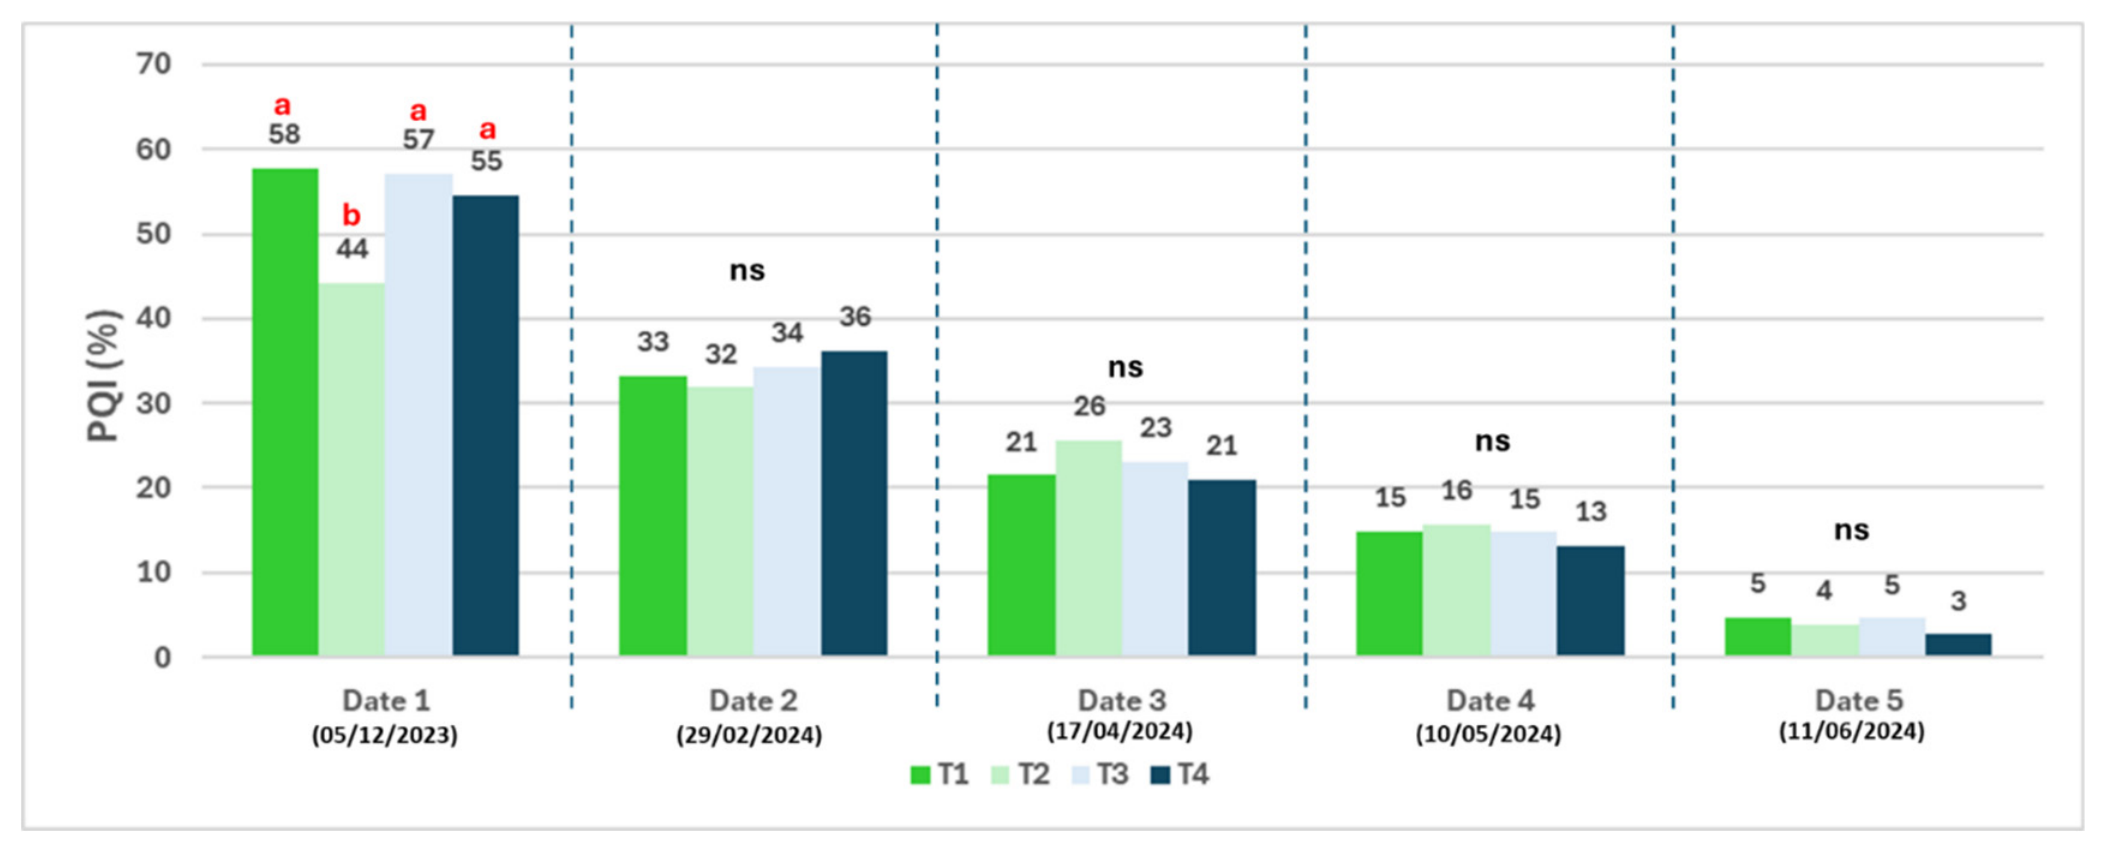
Figure 15.
Evolution of mean pasture quality based in crude protein (CP, in %) and neutral detergent fiber (NDF, in %), in each date (between December 2023 and June 2024, D1 to D5); with reference to critical threshold for sheep supplementation (CP = 9.4%; [26]).
Figure 15.
Evolution of mean pasture quality based in crude protein (CP, in %) and neutral detergent fiber (NDF, in %), in each date (between December 2023 and June 2024, D1 to D5); with reference to critical threshold for sheep supplementation (CP = 9.4%; [26]).
The spatial pattern of PQI in the experimental field in the first monitoring date (5 december 2023), on the date the animals were introduced to the experimental field, is shown in Figure 16. Virtually the entire experimental field showed a PQI > 40% and higher values, exceeding 70%, in the southernmost area—particularly in area T3.
3.6. Relationship Between Pasture Quality Index (PQI) and Grazing Density
Figure 17 shows the relationship between pasture quality index (PQI) and grazing density for all 48 sampling areas, in each grazing monitoring date. Pearson’s linear correlation coefficients are also presented. Positive correlations were observed in April and May, whereas negative correlations were recorded in February/March, and June. All correlations were statistically significant (p < 0.05). These results suggest that the relationship between pasture quality and livestock preferences is dynamic, changing direction throughout the grazing cycle. The spatial correspondence between the PQI patterns and grazing distributions can be seen in Figure 18, Figure 19, Figure 20 and Figure 21.
The decline in pasture quality is evident between December 2023 (Figure 16) and June 2024 (Figure 21a), where practically the entire experimental field showed a PQI less than 6%. Higher values within this final stage were restricted to the northernmost zone, which corresponds to the T3 area.
A temporal shift was observed in the animals’ preferred grazing areas throughout the study. Specifically, during the first monitoring date (20 March 2024; Figure 18b), the livestock exhibited a distinct preference for the northernmost sector of the experimental field. Conversely, on the remaining dates (18 April, 13 May, and 12 June 2024; Figure 19b, Figure 19c and Figure 19d, respectively), the preferred grazing zones shifted and extended in a southwesterly direction across the experimental field.
The results of the generalized linear mixed model (negative binomial GLMM) are presented in Table 4. This shows the estimated slopes (on a logarithmic scale) for each date, together with their 95% confidence intervals and individual significance levels. The interaction between date and PQI was globally significant ( = 12.47; df = 3; p = 0.006), demonstrating that the slope of the pasture quality-grazing density relationship varied significantly across sampling dates.
In the context of the GLMM with a negative binomial distribution, the response “variable grazing density” was modelled using a logarithmic link function (log link). This means that the model predicts the natural logarithm of the expected grazing density, not the grazing density itself. Therefore, when ‘Slope (log)’ appears in Table 4, it refers to the change in the logarithm of the mean density for each unit increase in the PQI. For every unit increase in the PQI, the logarithm of the expected density decreases by 0.031. To understand the effect on the original (non-log) density, this must be incorporated into the model; in this case, the grazing density decreases by approximately 3.1% for every unit increase in PQI (in February/March); in April, the expected density increases by 2.8% for every unit increase in PQI. The slope for February/March (negative) and April (positive) are statistically different from zero. The slope for May, although positive, is not statistically significant due to the control of variability between data areas. The slope for June is negative, but with a very wide confidence interval (a consequence of the low variability of the PQI in that month), so we cannot conclude that it is different from zero.
4. Discussion
4.1. Soil Fertility and Soil Compaction
The spatial variability of soil properties exerts a profound influence on agricultural and environmental processes, particularly plant–water–soil interactions, resulting in within-field variations in plant yield [27]. The spatial heterogeneity of these soil properties is the consequence of the interaction of soil formation and meteorological processes, and anthropogenic influences, whereas, soil formation processes are the result of complex interactions between biological, physical, and chemical mechanisms acting on a parent material over time and influenced by topography [27].
Beyond acting as the foundation for crop production, soil serves as the biophysical framework sustaining livestock grazing systems. Consequently, extensive research has focused on soil health and its broader impacts on ecosystem sustainability. Within this context, soil quality indicators are frequently established as comprehensive measures of edaphic functionality, integrating multiple physical, chemical, and biological soil properties [28].
Soil fertility can be primarily assessed using a number of key physicochemical parameters, including texture, organic matter (OM) content, pH and cation exchange capacity (CEC). These properties govern nutrient availability, pH regulation, and soil structure, thereby serving as critical determinants of overall soil health [28].
In silvopastoral systems, livestock grazing drives spatiotemporal variations in soil parameters and nutrient cycles. This dynamic is largely mediated by the selective feeding behavior of grazers and the heterogeneous spatial deposition of dung and urine [16].
In terms of texture, the baseline status of the experimental field soil is relatively poor (clay content of 10–11% and silt content of 11–13%), with a coarse texture (sand content of 76–79%). This sandy loam texture represents an inherent, unalterable property inherited directly from the original lithological parent material during pedogenesis [7].
Soil pH in the experimental field exhibited relatively low values at the start of this study (2015). Soil acidification is a natural process that reduces grass productivity by reducing soil base status and nutrient availability, while increasing the solubility of metals such as aluminium (Al), iron (Fe) and manganese (Mn) that can be toxic to grass [10]. Regular liming is a common practice used to neutralize and control soil acidification, but also decreases Al toxicity and increases nutrients availability (particularly phosphorus and magnesium) [10,28]. This intervention significantly increases crop productivity and quality [28], particularly in pastures [8], reduces fertilizer requirement and promotes species richness [10]. Additionally, the use of high Mg lime (dolomitic limestone) for soil treatment increases both soil pH and Mg contents in the soils and, thereby, reduces the risks of livestock hypomagnesaemia [10]. Grassland productivity is also reduced if soil acidity is combined with a low soil phosphorus concentration [10], as found in this study, which justified the application of fertilizer across the entire experimental field. In this context, the areas where limestone was applied (T3 and T4) showed a positive, gradual and consistent pH recovery. This robust edaphic response offers promising prospects for these vulnerable Montado ecosystems in Southern Portugal, serving as a key indicator for the potential intensification of livestock production based on higher stocking rates [29]. Consequently, correcting soil pH through liming provides the right environment for grassland to reach its growth potential, thereby minimizing the need for animal supplementary feeding and improving the efficiency and sustainability of extensive grazing livestock production [10].
In this study, the OM content was relatively high (3.0–4.5%) compared to the average levels reported for other production systems in the same region (1.0–1.5%) [7,8]. These high OM levels are primarily attributed to the continuous input of tree debris (leaves, roots, and litter) coupled with at least two decades of sheep grazing in this experimental field, which returns nutrients to the soil via dung and urine [16,30].
OM plays an important role in soil aggregation and in reducing bulk soil density, which helps with air circulation, the distribution of water in the rhizosphere, and improves groundwater recharge and nutrient-use efficiency in arid and semi-arid areas [31]. Higher OM content also mitigates the potential compaction caused by animal trampling [32]. In terms of spatial distribution, maps of Figure 6 particularly highlight the higher concentrations of OM (4.5%; Figure 6a), CEC (> 8 meq 100g-1; Figure 6b) and P2O5 (> 80 mg kg−1; Figure 6d) in T1 area. It is important to note that higher OM levels ensure greater soil buffering capacity [8]. The sum of exchange bases (SEB) was significantly higher in the areas treated with dolomitic limestone (T3 and T4) when compared with the other unamended areas (T1 and T2). A similar pattern was observed for the degree of base saturation, DBS (T3 and T4- 90-100%; T1- 26%; T2-58%). Because DBS is an excellent indicator of general soil fertility, it is frequently used as a complementary factor in soil classification, where soils with a DBS less than 50% are categorized as low-fertility [7], and are prone to accumulating phytotoxic levels of micronutrients such as Al or Mn [8].
Soil compaction, traditionally described as ‘the compression of an unsaturated soil body resulting in a reduction of the fractional air volume’ [33], is heavily influenced by livestock grazing intensity, which impacts overall soil quality [34], animal production, ecosystem functions, and the long-term sustainability of the grassland ecosystem [3]. Grazing effects also vary among different herbivore types; for instance, cattle exert a greater static pressure and create deeper hoof imprints in damp soils due to their larger body mass and greater hoof area compared to sheep, causing considerable damage [3]. In this study, as expected, CI increased with depth (CI10–20 > CI0–10). This is a common pattern based on soil structure, given that the deeper soil layers support the more superficial layers [32]. Conversely, the inferential analysis revealed no statistically significant differences between soil compaction and sheep grazing densities (high and low), on any monitoring date or at any of the depths considered (0–10 cm and 10–20 cm). These results are consistent with other studies conducted with sheep at the same experimental site [11,29], providing favorable support for the desired sustainable intensification of extensive livestock grazing systems based on higher stocking rates [29]. Nevertheless, a systematic trend toward higher CI values was apparent in areas with higher grazing density. Consequently, it will be important
to continue the assessment over longer periods to determine whether this trend becomes statistically significant within the compaction/recovery cycles, thereby justifying the adoption of strategies to mitigate the impact of grazing on soil compaction [29]. This trend would be in line with several studies which have shown that sheep grazing has a significant effect on the compaction of the topsoil surface layers. For example, Drewry et al. [33] reported that the greatest impact of trampling on soil structure occurs within the upper 5 cm of the soil profile and Sharrow et al. [35] found that most hoof-induced compaction is restricted to the top 5–10 cm soil layer. However, the literature also mentions that a rapid amelioration of physically deteriorated topsoil to about 5–10 cm soil layer can be expected as a result of natural recovery processes, namely, precipitation, wetting–drying cycles, soil cracking, freeze–thaw action, and biological activity [18].
4.2. Dynamic Grazing: Relation with Pasture Availability and Quality; Evolution between Early and Last Spring
Livestock grazing is a highly dynamic and variable process and activity that varies spatially, temporally, and even seasonally as livestock roam the pasture to search for the most palatable forage available [36]. Comparing grazing intensity pattern, across different times of the day revealed a pronounced increase in grazing activity in the early morning (first observation period considered, 06:30 to 11:00 h; Figure 10b) and late afternoon (third observation period considered, 11:00 to 15:30 h; Figure 10d). The middle of the day (second observation period considered, 15:30 to 20:00 h; Figure 10c), which corresponds to the hottest hours and the highest levels of solar radiation, is a period of minimal grazing activity. This diurnal pattern aligns with numerous studies assessing the behavior of grazing ruminants [37,38,39]. Although minor behavioral variability occurs, it is typically driven by factors such as the specific grazing system and stocking density [37], the availability and quality of pasture (with advancing vegetation period) [39], the time of year [37,40], or meteorological conditions (temperature, rainfall, wind, etc.) [38], among others.
Based on an integrated interpretation of both, the Pearson correlations and the GLMM, and regarding the relationship between pasture quality and grazing preferences, it can be stated that (Figure 22):
(i) The results of both statistical approaches were highly consistent;
(ii) In February/March, the significant negative relationship demonstrates that high pasture quality did not directly translate into higher grazing density; other factors (for example, winter protection or lower overall forage supply) likely dominate;
(iii) In April, the clear positive relationship suggests that animals selected the highest-quality areas of the pasture;
(iv) In May, weaker positive trend, consistent with a preference for quality which tends to decrease gradually;
(v) In June, the relationship reverted to a negative trend, although it was not statistically significant in the GLMM. This shift suggests a possible effect of a generalized summer pasture degradation and a possible adjustment in grazing preferences because of rising temperatures and search of thermal comfort (welfare). This is particularly important given the ongoing climate change, whose impact is likely to be variable in these Mediterranean agroforestry systems due to the mosaic of environmental and biotic conditions influenced by the typical landscape of scattered trees [41].
The significant interaction in the mixed model (p = 0.006) statistically supports the main hypothesis: the effect of pasture quality on grazing density depends on the phase of the pasture cycle [37,39,40]. This interaction confirms that in April (and to some extent in May) selection based on pasture quality predominates, whereas in February/March and June, other factors such as thermal protection or shade come into play [38]. Figure 23 illustrates this marked contrast in spatial grazing patterns, contrasting the quality-driven selection characteristic of early spring (a) against the shelter-seeking behavior observed during late spring (b).
This spatial dynamic may be related to structural and climatic factors. At the start of the grazing season, when ambient temperatures were lower, the animals sought out lower-lying (more sheltered) and open areas of the field (with less tree cover). Conversely, by the end of spring, when temperatures were significantly higher, the animals sought solar shelter beneath tree canopies, which were more densely concentrated in the southern part of the experimental field. Trees exert a variable buffering effect leading to a stabilization of the microclimate on ecosystem functioning of Mediterranean Montado [42]. Trees may alleviate environmental stress beneath their canopies by moderating both air and soil temperatures, thereby reducing plant evapotranspiration and water stress [41]. Thus, joint analysis of the results suggests that the spatial preferences of sheep are influenced by a complex combination of factors: nutritional quality, selectivity associated with the phenological state of species, and landscape structural elements. For example, the proximity to drinking troughs and feeders encourage animals to stay and return, thus positively affecting their grazing behavior [43]. In this study, the pattern of use, with peripheral areas being preferred on specific dates and convergence towards central areas over time, proves the adaptive (dynamic) nature of grazing. This demonstrates the importance of proper management that takes into account the temporal variability of vegetation and the spatial heterogeneity of the experimental field.
Although pasture quality, assessed by PQI, showed a typical degradation pattern common to dryland Mediterranean conditions [44], it should be noted that, from May to June, the CP did not decrease in plot T3, unlike in the other plots, which highlights the value of combining soil improvement with higher stocking densities. Higher stocking densities are likely to reduce herbivore selectivity of palatable species, improves pasture use efficiency, maintains pasture cover and richness as well as enhances flowering, growth and survival of plant species [45], what increases the likelihood lower-quality species (with lower CP) will also be consumed. These higher stocking densities also lead to a shorter interval between grazing the animals in the same areas, keeping the pasture in constant renewal, meaning the plants will tend to be younger and therefore have a higher CP. This result may mean delaying the need for animal supplementation by 2–3 weeks, which has a positive economic impact on farm management and constitutes another excellent indicator for the sustainable intensification of extensive livestock production.
4.3. Future Research Directions
Future research should to replicate this type of pilot study in other areas in order to assess the medium- and long-term effects of the regular and systematic application of dolomitic limestone on soil chemical reaction, plant biodiversity and pasture nutritional value. Furthermore, extending the experimental timeframe over longer consecutive years are required to clearly understand the long-term performance, stability, and resilience of these intensified grazing systems [45].
The implementation of management strategies that integrate both grazing intensity and shifting climatic variations is also essential to ensure the productive efficiency of grazing systems in Mediterranean climate regions [3]. It will be important to assess how grazing management interacts with trampling pressure and soil compaction, with particular attention to the variability imposed by annual rainfall patterns. As drier years are becoming more frequent in these environments, it is imperative to evaluate whether reduced pasture availability alters grazing distribution, resting periods and the effects of deferred grazing on soil physical properties. Under this climate-change scenario, management practices focusing on maintaining the community structure and composition of grasslands become crucial for the persistence and resilience of these diverse agroforestry ecosystems [41].
Extending these studies to soils with different characteristics, particularly in terms of clay, organic matter content, pH and depth, will be important to ensure greater consistency and representativeness of the results and their practical implications. In parallel, the assessment of grazing impacts should be extended beyond the CI to include indicators of soil functional capacity, such as porosity, aggregate stability and biological activity, which are highly relevant for vegetal cover biodiversity and ecosystem sustainability.
Another relevant direction for future studies is the evaluation of mixed grazing systems, particularly combinations of sheep and cattle, since differences in grazing behavior and trampling patterns may influence both soil condition and pasture performance.
In addition, precision livestock farming tools, in particular the emergence of low-cost Global Navigation Satellite Systems (GNSS), allow monitoring soil electrical conductivity or pasture Normalized Difference Vegetation Index (NDVI), which associated with virtual fencing, may support more adaptive and dynamic grazing management by improving the spatial and temporal control of animal distribution (different stocking rates, rotation between plots). This approach is highly valuable for (i) excluding or reducing grazing pressure in areas highly vulnerable to soil compaction during high-moisture periods, and (ii) implementing precise and differentiated grazing adapted to localized variations in pasture availability, nutritional quality, and floristic composition, in space and time, to minimize external supplementation costs. Knowledge-driven and precise grazing management is required to use the full biophysical potential of Mediterranean grasslands in a sustainable way [16].
Overall, future work should focus on cost-benefit analyses to assess their financial viability of these precision management innovations, thereby providing robust decision-support frameworks for farmers [1]. It is essential to define grazing strategies that reconcile pasture productivity and animal production with soil conservation and tree protection, from a holistic and environmentally sustainable perspective. At the same time, it is important to strengthen knowledge transfer and recommendations to farmers through short technical guides and practical field demonstrations of the potential approaches, accompanied by financial and directive policy support [3].
5. Conclusions
The complex Mediterranean soil-pasture-tree-animals ecosystem (“Montado” in Portugal and “Dehesa” in Spain) is considered a high-nature-value farming system and has become internationally known for supporting outstanding levels of biodiversity, proposed as one option to enhance agroecological and community resilience under climate change scenarios.
This study evaluated the multi-faceted impacts of regular dolomitic limestone applications on soil chemical properties and its cascading effects on pasture dynamics and livestock grazing patterns under intensified sheep stocking rates. The experimental findings demonstrate that neutralizing soil acidity through dolomitic limestone is a highly effective, albeit slow and gradual, edaphic amendment process.
Regarding livestock–ecosystem interactions, this research yields several critical insights: (i) the establishment of preferential grazing zones did not result in statistically significant differences in topsoil compaction or trampling damage, validating the structural tolerance of these soils under the monitored conditions; (ii) higher stocking densities successfully suppressed herbivore foraging selectivity, forcing a more uniform utilization of available pasture biomass; (iii) the synergetic combination of targeted soil amendments and higher stocking rates enhanced pasture crude protein availability, thereby optimizing both pasture productivity and quality and overall animal performance; and (iv) the effect of pasture quality on spatial grazing preferences depends on the phase of the pasture-grazing cycle.
Taken together, these findings provide compelling evidence that integrating targeted soil corrections with adaptive grazing management can drive the sustainable intensification of extensive livestock systems. This strategic framework offers a viable pathway to enhance the biophysical multifunctionality, productivity, and climate resilience of Mediterranean dryland silvopastoral landscapes.
Author Contributions
Conceptualization, J.S. and A.P.; methodology, J.S., F.J.M.; S.S., H.P.; L.L.P., E.C., R.C. and A.P.; software, J.S., F.J.M. and L.L.P.; validation, J.S., F.J.M. and S.S.; formal analysis, J.S., F.J.M. and L.L.P.; investigation, J.C., H.P. and E.C.; resources, J.S., R.C. and A.P.; data curation, J.S.; writing—original draft preparation, J.S.; writing—review and editing, J.S., F.J.M. and S.S.; visualization, J.S., F.J.M. and S.S.; supervision, J.S.; project administration, J.S., R.C. and A.P.; funding acquisition, J.S., R.C. and A.P. All authors have read and agreed to the published version of the manuscript.
Funding
This work was funded by the project “SUMO—Sustainability of the Montado” (Ref. PRR-C05-i03-I000066), investment supported by the PRR—Recovery and Resilience Plan and European Funds NextGeneration EU and by National Funds through FCT (Foundation for Science and Technology) under the Project UIDB/05183/2025.
Data Availability Statement
The original contributions presented in this study are included in the article. Further inquiries can be directed to the corresponding author.
Acknowledgments
The authors acknowledge the R&D unit MED – Mediterranean Institute for Agriculture, Environment and Development (https://doi.org/10.54499/UID/05183/2025) and the Associate Laboratory CHANGE – Global Change and Sustainability Institute (https://doi.org/10.54499/LA/P/0121/2020).
Conflicts of Interest
The authors declare no conflicts of interest.
Abbreviations
The following abbreviations are used in this manuscript:
| Al | Aluminum |
| CEC | Cationic Exchange Capacity |
| CI | Cone Index |
| CO2 | Carbon dioxide |
| COR | Corrected |
| CP | Crude Protein |
| DBS | Degree of Basis Saturation |
| DLA | Dolomitic Limestone Application |
| DM | Dry Matter |
| ELF | Extensive Livestock Farming |
| Fe | Iron |
| GLMM | Generalized Linear Mixed Model |
| GM | Green Matter |
| GNSS | Global Navigation Satellite System |
| HSR | High Stocking Rate |
| IUSS | International Union of Soil Sciences |
| K2O | Potassium |
| LSR | Low Stocking Rate |
| Mg | Magnesium |
| Mn | Manganese |
| OM | Organic Matter |
| PA | Precision Agriculture |
| PAv | Pasture Availability |
| PFC | Pasture Floristic Composition |
| PMC | Pasture Moisture Content |
| PQI | Pasture Quality Index |
| P2O5 | Phosphorus |
| RDP | Rural Development Program |
| RRP | Recovery and Resilience Plan |
| SEB | Sum of Exchangeable Bases |
| SUMO | Sustainability of the Montado |
| T1 | Treatment 1 |
| T2 | Treatment 2 |
| T3 | Treatment 3 |
| T4 | Treatment 4 |
| UCOR | Uncorrected |
| USDA | United States Department of Agriculture |
References
- Bernabucci, G.; Evangelista, C.; Girotti, P.; Viola, P.; Spina, R.; Ronchi, B.; Bernabucci, U.; Basiricò, L.; Turini, L.; Mantino, A.; et al. Precision livestock farming: An overview on the application in extensive systems. Ital. J. Anim. Sci. 2025, 24, 859–884. [Google Scholar] [CrossRef]
- Santos, F.C.; Junior, N.K.; Almeida, R.G.; Filho, M.R.A.; Vilela, L.; Castro, R.V.O.; Rocha, A.L.P.F.; Silveira, M.C.T. Intensification of pasture-based livestock systems: Environmental benefits, forage availability, nutritional value and Nellore cattle performance. Agrofor. Syst. 2025, 99, 80. [Google Scholar] [CrossRef]
- Niu, W.; Ding, J.; Fu, B.; Zhao, W.; Eldridge, D. Global effects of livestock grazing on ecosystem functions vary with grazing management and environment. Agric. Ecosyst. Environ. 2025, 378, 109296. [Google Scholar]
- Psyllos, G.; Hadjigeorgiou, I.; Dimitrakopoulos, P.G.; Kizos, T. Grazing land productivity, floral diversity, and management in a semi-arid Mediterranean landscape. Sustainability 2022, 14, 4623. [Google Scholar] [CrossRef]
- Guimarães, M.; Pinto-Correia, T.; Freitas, M.; Ferraz-de-Oliveira, I.; Sales-Baptista, E.; Veiga, J.; Marques, T.; Pinto Cruz, C.; Godinho, C.; Belo, A. Farming for nature in the Montado: The application of ecosystem services in a results-based model. Ecosyst. Serv. 2023, 61, 101524. [Google Scholar] [CrossRef]
- IUSS Working Group WRB. World Reference Base for Soil Resources. In ternational Soil Classification System for Naming Soils and Creating Legends for Soil Maps, 4th ed.; International Union of Soil Sciences (IUSS): Vienna, Austria, 2022; p. 234p. [Google Scholar]
- Efe Serrano, J. Pastures in Alentejo: Technical Basis for Characterization, Grazing and Improvement; (In Portuguese). Universidade de Évora—ICAM: Évora, Portugal, 2006; pp. 165–178. [Google Scholar]
- Carvalho, M.; Goss, M.J.; Teixeira, D. Manganese toxicity in Portuguese Cambisoils derived from granitic rocks: Causes, limitations of soil analyses and possible solutions. Rev. Cienc. Agrar. 2015, 38, 518–527. [Google Scholar]
- Serrano, J.; Shahidian, S.; Marques da Silva, J.; Moral, F.; Carvajal-Ramírez, F.; Carreira, E.; Pereira, A.; Carvalho, M. Evaluation of the effect of dolomitic lime application on pastures- case study in the Montado Mediterranean ecosystem. Sustainability 2020, 12, 3758. [Google Scholar] [CrossRef]
- Abdalla, M.; Espenberg, M.; Zavattaro, L.; Lellei-Kovacs, E.; Mander, U.; Smith, K.; Thorman, R.; Damatirca, C.; Schils, R.; ten-Berge, H.; et al. Does liming grasslands increase biomass productivity without causing detrimental impacts on net greenhouse gas emissions? Environ. Pollut. 2022, 300, 118999. [Google Scholar] [CrossRef] [PubMed]
- Serrano, J.; Carreira, E.; Shahidian, S.; de Carvalho, M.; Marques da Silva, J.; Paniagua, L.L.; Moral, F.; Pereira, A. Impact of deferred versus continuous sheep grazing on soil compaction in the Mediterranean Montado ecosystem. AgriEngineering 2023, 5, 761–776. [Google Scholar] [CrossRef]
- Wild, M.; Gauly, M.; Zanon, T.; Isselstein, J.; Komainda, M. Tracking free-ranging sheep to evaluate interrelations between selective grazing, movement patterns and the botanical composition of alpine summer pastures in northern Italy. Past. Res. Policy Pract. 2023, 13, 1–15. [Google Scholar] [CrossRef]
- Carreira, E.; Serrano, J.; Shahidian, S.; Infante, P.; Paniagua, L.L.; Moral, F.; Paixão, L.; Gomes, C.P.; deCastro, J.L.; de Carvalho, M.; et al. Sustainable intensification of the Montado ecosystem: Evaluation of sheep stocking methods and dolomitic limestone application. Sustainability 2025, 17, 363. [Google Scholar] [CrossRef]
- Serrano, J.; Franco, J.; Shahidian, S.; Moral, F.J. Estimation of Dry Matter Yield in Mediterranean Pastures: Comparative Study between Rising Plate Meter and Grassmaster II Probe. Agriculture 2024, 14, 1737. [Google Scholar] [CrossRef]
- Schellberg, J.; Verbruggen, E. Frontiers and perspectives on research strategies in grassland technology. Crop Pasture Sci. 2014, 65, 508–523. [Google Scholar] [CrossRef]
- Horn, J.; Isselstein, J. How do we feed grazing livestock in the future? A case for knowledge-driven grazing systems. Grass Forage Sci. 2022, 77, 153–166. [Google Scholar]
- Sales-Baptista, E.; Ferraz de Oliveira, I.; Santos, M.; Lopes de Castro, J.; Pereira, A.; Rafael, J.; Serrano, J. Low-cost GNSS technology for monitoring grazing sheep. Rev. Ciênc. Agr. 2016, 39, 251–260. [Google Scholar]
- Nawaz, M.F.; Bourrié, G.; Trolard, F. Soil compaction impact and modelling. A review. Agron. Sustain. Dev. 2013, 33, 291–309. [Google Scholar]
- Sanderson, M.A.; Rotz, C.A.; Fultz, S.W.; Rayburn, E.B. Estimating forage ass with a commercial capacitance meter, rising plate meter, and pasture ruler. Agron. J. 2001, 93, 1281–1286. [Google Scholar]
- Murphy, D.J.; O’ Brien, B.; Murphy, M.D. Development of a grass measurement optimisation tool to efficiently measure herbage mass on grazed pastures. Comput. Electron. Agric. 2020, 178, 105799. [Google Scholar] [CrossRef]
- Lugassi, R.; Zaady, E.; Goldshleger, N.; Shoshany, M.; Chudnovsky, A. Spatial and temporal monitoring of pasture ecological quality: Sentinel-2-based estimation of crude protein and neutral detergent fiber contents. Remote Sens. 2019, 11, 799. [Google Scholar] [CrossRef]
- Serrano, J.; Shahidian, S.; Moral, F.J. Crude protein as an indicator of pasture availability and quality: A Validation of two complementary sensors. Agronomy 2024, 14, 2310. [Google Scholar] [CrossRef]
- AOAC. Official Methods of Analysis of AOAC International, 18th ed.; AOAC International: Arlington, VA, USA, 2005. [Google Scholar]
- Mueller-Dombois, D.; Ellenberg, H. Aims and Methods of Vegetation Ecology; Wiley: New York, NY, USA, 1974. [Google Scholar]
- Castroviejo, S. Flora Iberica 1986–2021; Volume I–XXI; Real Jardín Botánico, CSIC: Madrid, Spain.
- National Research Council. Nutrient Requirements of Sheep, 6th ed.; National Academy Press: Washington, DC, USA, 1985; Volume 5. [Google Scholar]
- Corwin, D.L.; Scudiero, E. Field-scale apparent soil electrical conductivity. Soil Sci. Soc. Am. J. 2020, 84, 1405–1441. [Google Scholar] [CrossRef]
- Chaudhry, H.; Vasava, H.B.; Chen, S.; Saurette, D.; Beri, A.; Gillespie, A.; Biswas, A. Evaluating the soil quality index using three methods to assess soil fertility. Sensors 2024, 24, 864. [Google Scholar] [CrossRef] [PubMed]
- Serrano, J.; Shahidian, S.; Carreira, E.; Moral, F.; Paniagua, L.; Charneca, R.; Pereira, A. Soil compaction in Montado Mediterranean ecosystem: Dolomitic limestone application, sheep Grazing management and tree effects. Sustainability 2026, 18, 3962. [Google Scholar] [CrossRef]
- Seddaiu, G.; Porcu, G.; Ledda, L.; Roggero, P.P.; Agnelli, A.; Corti, G. Soil organic matter content and composition as influenced by soil management in a semi-arid Mediterranean agro-silvo-pastoral system. Agric. Ecosyst. Environ. 2013, 167, 1–11. [Google Scholar]
- Fahad, S.; Chavan, S.B.; Chichaghare, A.R.; Uthappa, A.R.; Kumar, M.; Kakade, V.; Pradhan, A.; Jinger, D.; Rawale, G.; Yadav, D.K.; et al. Agroforestry Systems for Soil Health Improvement and Maintenance. Sustainability 2022, 14, 14877. [Google Scholar] [CrossRef]
- Pentos, K.; Pieczarka, K.; Serwata, K. The relationship between soil electrical parameters and compaction of sandy clay loam soil. Agriculture 2021, 11, 114. [Google Scholar] [CrossRef]
- Drewry, J.J.; Cameron, K.C.; Buchan, G.D. Pasture yield and soil physical property responses to soil compaction from treading and grazing—A review. Soil Res. 2008, 46, 237–256. [Google Scholar]
- Lai, L.; Kumar, S. A global meta-analysis of livestock grazing impacts on soil properties. PLoS ONE 2020, 15, e0236638. [Google Scholar] [CrossRef] [PubMed]
- Sharrow, S. Soil compaction by grazing livestock in silvopastures as evidenced by changes in soil physical properties. Agrofor. Syst. 2007, 71, 215–223. [Google Scholar] [CrossRef]
- Shi, Y.; Gao, J.; Brierley, G.; Li, X.; He, J.-S. Estimating grazing pressure from satellite time series without reliance on total production. Remote Sens. 2025, 17, 3781. [Google Scholar] [CrossRef]
- Birrel, H.A. The effect of stocking rate on the grazing behaviour of Corriedale sheep. Appl. Anim. Behav. Sci. 1991, 28, 321–331. [Google Scholar] [CrossRef]
- Champion, R.A.; Rutter, S.M.; Penning, P.D.; Rook, A.J. Temporal variation in grazing behaviour of sheep and the reliability of sampling periods. Appl. Anim. Behav. Sci. 1994, 42, 99–108. [Google Scholar] [CrossRef]
- Lin, L.; Dickhoefer, U.; Müller, K.; Susenbeth, A. Grazing behavior of sheep at different stocking rates in the Inner Mongolian steppe, China. Appl. Anim. Behav. Sci. 2011, 129, 36–42. [Google Scholar] [CrossRef]
- Jochims, F.; Mendes Soares, E.; Bittencourt de Oliveira, L.; Castro Kuinchtner, B.; Trindade Casanova, P.; Marin, L.; Ferreira de Quadros, F.L. Timing and duration of observation periods of foraging behavior in natural grasslands. Front. Vet. Sci. 2020, 12, 519698. [Google Scholar]
- Tomás-Marín, S.; Bello, Francesco; Galán Díaz, J.; Muñoz-Gálvez, FranciscoJ.; Prieto, I. How do tree canopy and soil nutrients drive distinct facets of diversity and community assembly in Sub-Mediterranean grasslands? J. Veg. Sci. 2025, 36, e70064. [Google Scholar]
- Hidalgo-Galvez, M.D.; Matías, L.; Cambrollé, J.; Gutiérrez, E.; Pérez-Ramos, I.M. Impact of climate change on pasture quality in Mediterranean dehesas subjected to different grazing histories. Plant Soil 2023, 488, 465–483. [Google Scholar] [CrossRef]
- Gregorini, P.; Tamminga, S.; Gunter, S. Review: Behavior and daily grazing patterns of cattle. Prof. Anim. Sci. 2006, 22, 201–209. [Google Scholar]
- Benavides, R.; Douglas, G.B.; Osoro, K. Silvopastoralism in New Zealand: Review of effects of evergreen and deciduous trees on pasture dynamics. Agrofor. Syst. 2009, 76, 327–350. [Google Scholar]
- Nwaogu, C.; Chukwudi, M.A.O.; Diagi, B.E.; Diagi, D.O.; Ojiaku, A.A.; Mgbeahuruike, L.U.; Unegbu, R.N.; Abdullahi, K.I.; Ameh, Y.A.; Edo, F.A.; et al. Effect of sheep grazing systems on soil, yield, and species diversity in an agricultural watershed, Nigeria. Environ. Chall. 2025, 21, 101318. [Google Scholar] [CrossRef]
Figure 1.
Timeline of activities carried out in the experimental field between October 2015 and October 2024.
Figure 1.
Timeline of activities carried out in the experimental field between October 2015 and October 2024.
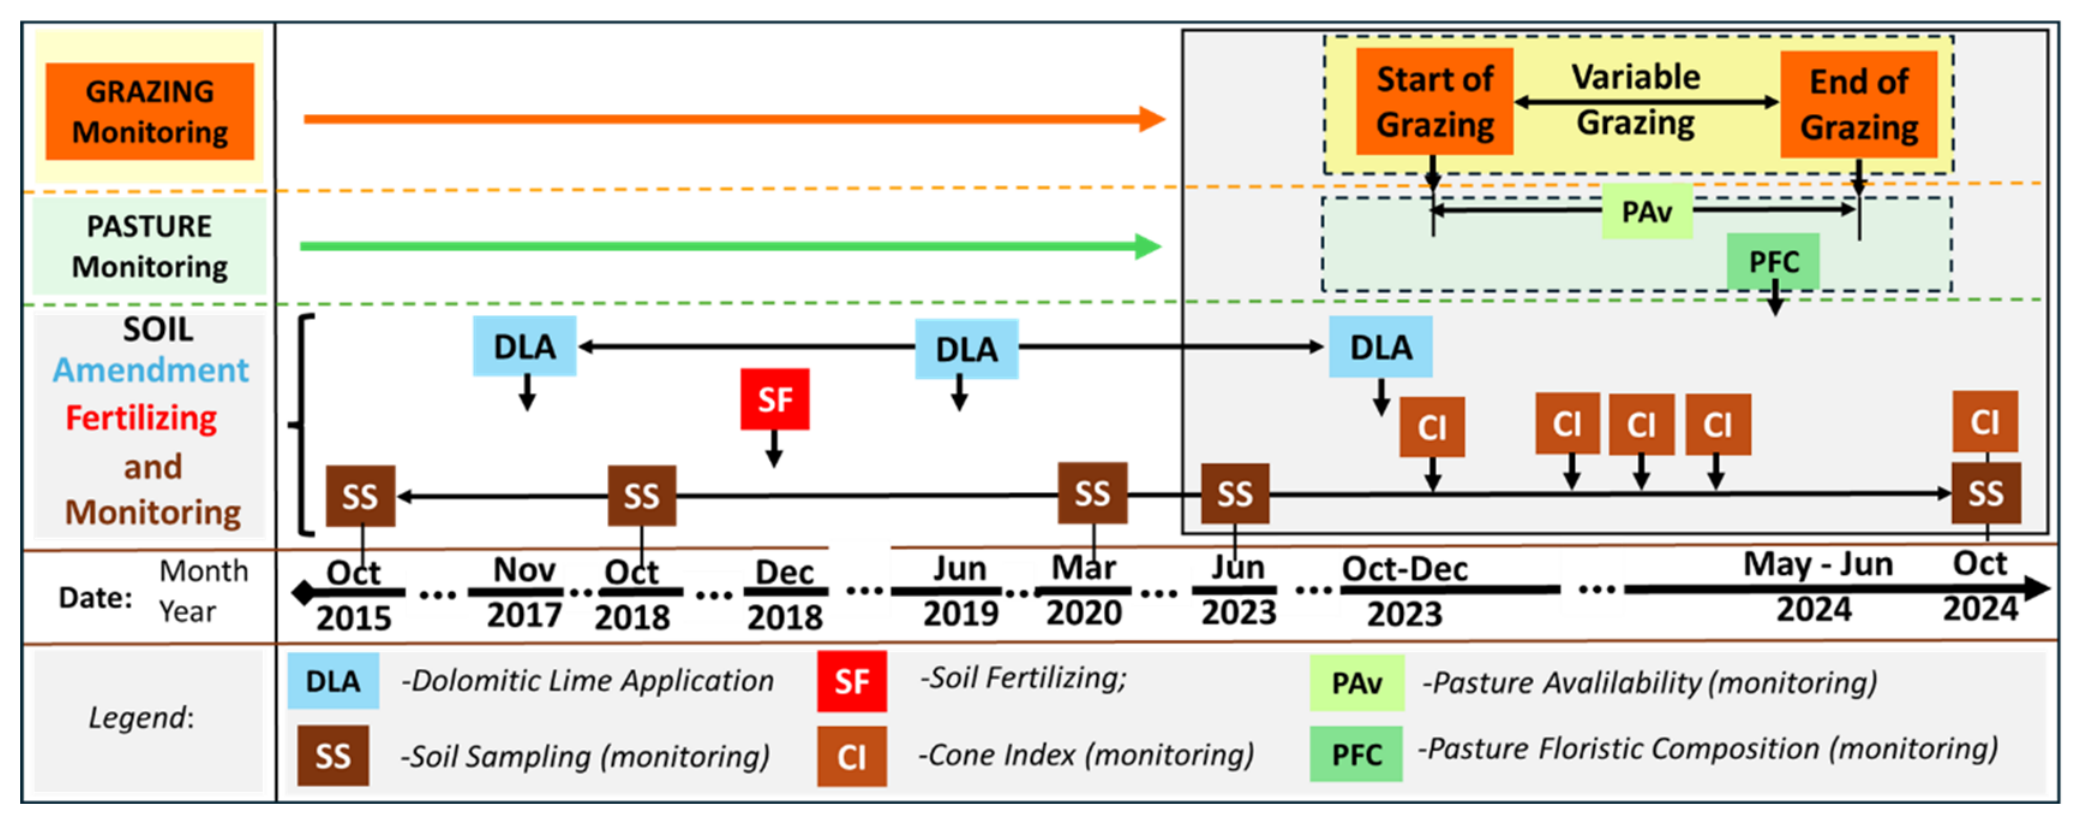
Figure 2.
Location of the Mitra farm in Portugal (a), and the ‘Eco-SPAA’ experimental field with the respective treatments (b).
Figure 2.
Location of the Mitra farm in Portugal (a), and the ‘Eco-SPAA’ experimental field with the respective treatments (b).
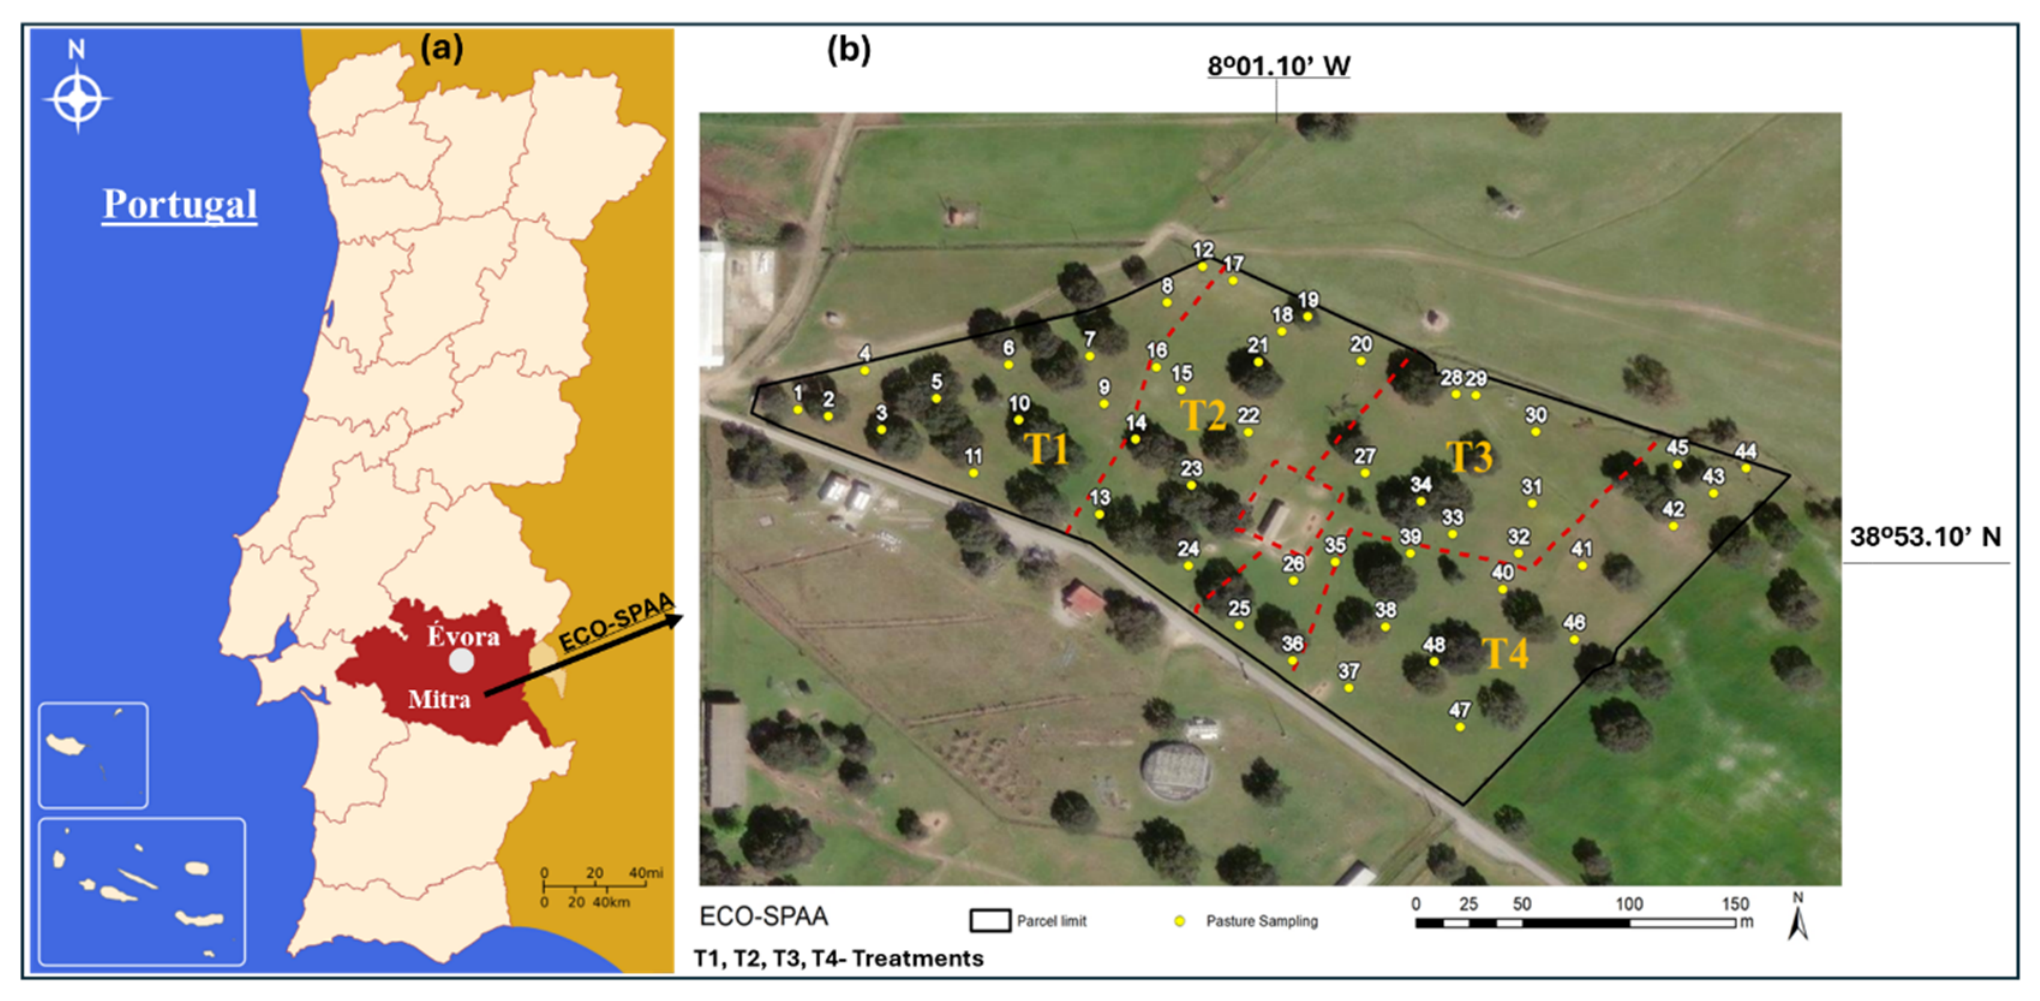
Figure 3.
Altimetric map of the ‘Eco-SPAA’ experimental field. Areas of each treatment and the animal handling park are also identified.
Figure 3.
Altimetric map of the ‘Eco-SPAA’ experimental field. Areas of each treatment and the animal handling park are also identified.
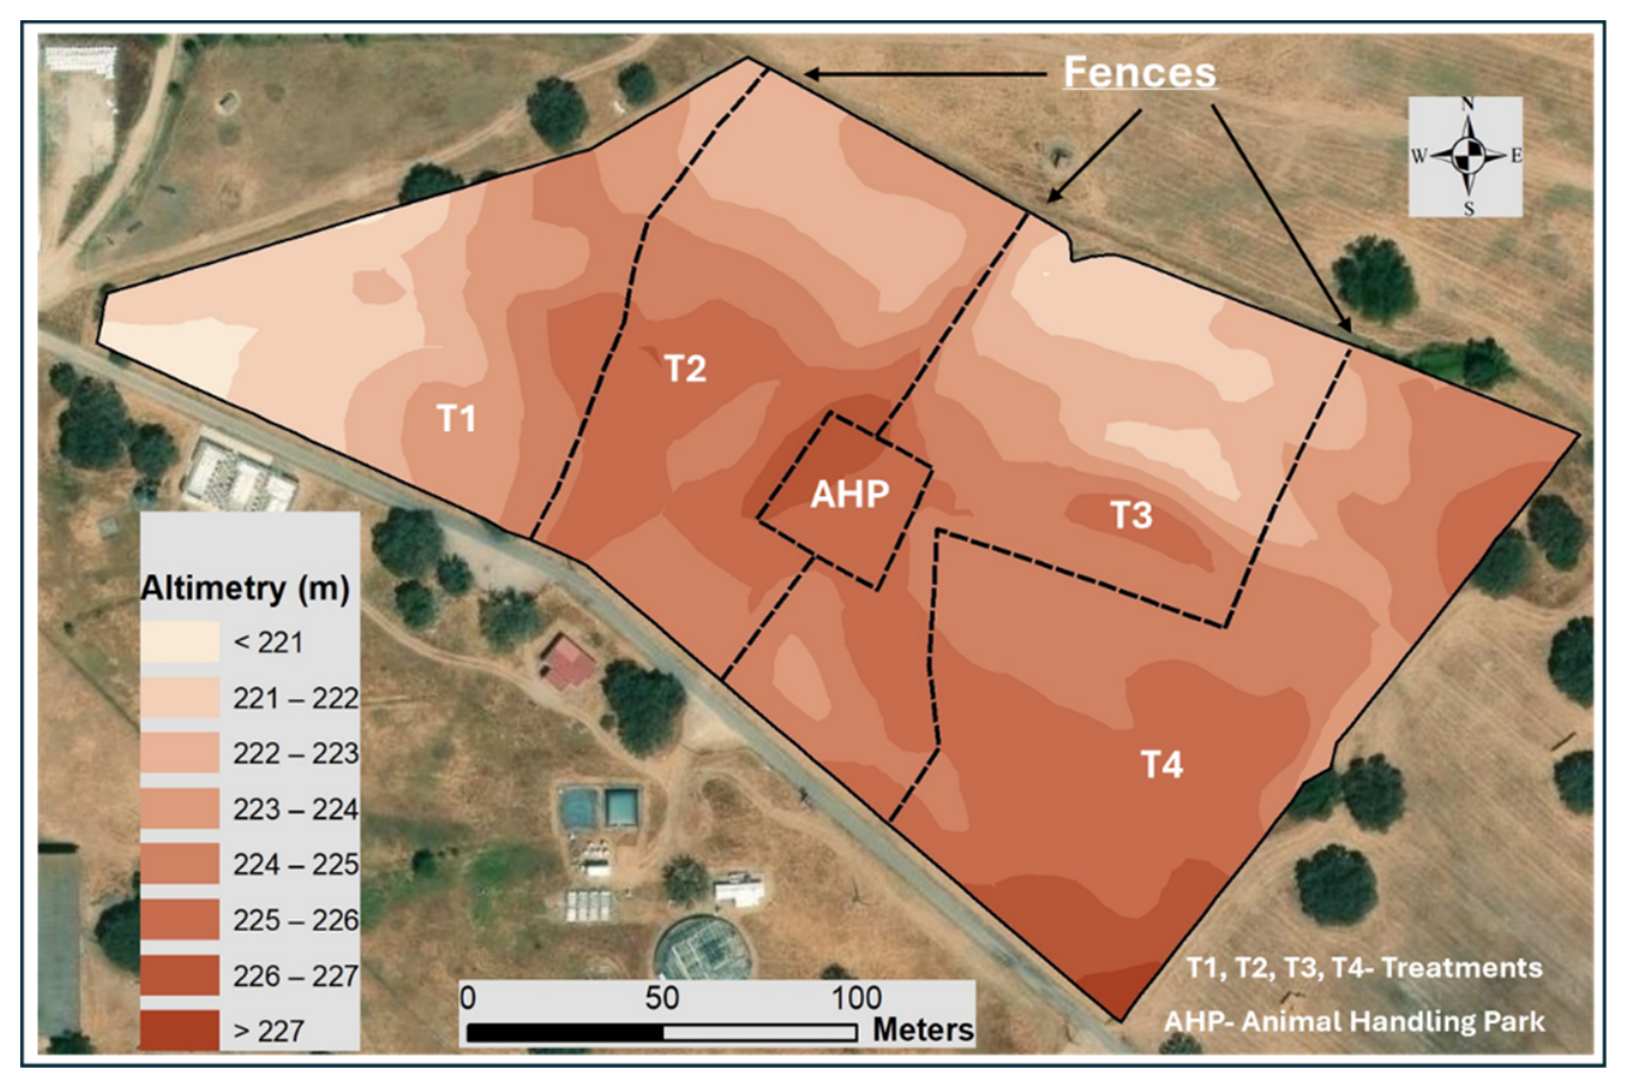
Figure 4.
Thermo-pluviometric diagram of Meteorological Station of Mitra (Évora, Portugal): monthly mean temperature between July 2023 and June 2024, and comparison of reference values of precipitation (monthly average of the period 1981–2010) with the period between July 2023 and June 2024. Is also indicated the annual rainfall accumulated.
Figure 4.
Thermo-pluviometric diagram of Meteorological Station of Mitra (Évora, Portugal): monthly mean temperature between July 2023 and June 2024, and comparison of reference values of precipitation (monthly average of the period 1981–2010) with the period between July 2023 and June 2024. Is also indicated the annual rainfall accumulated.
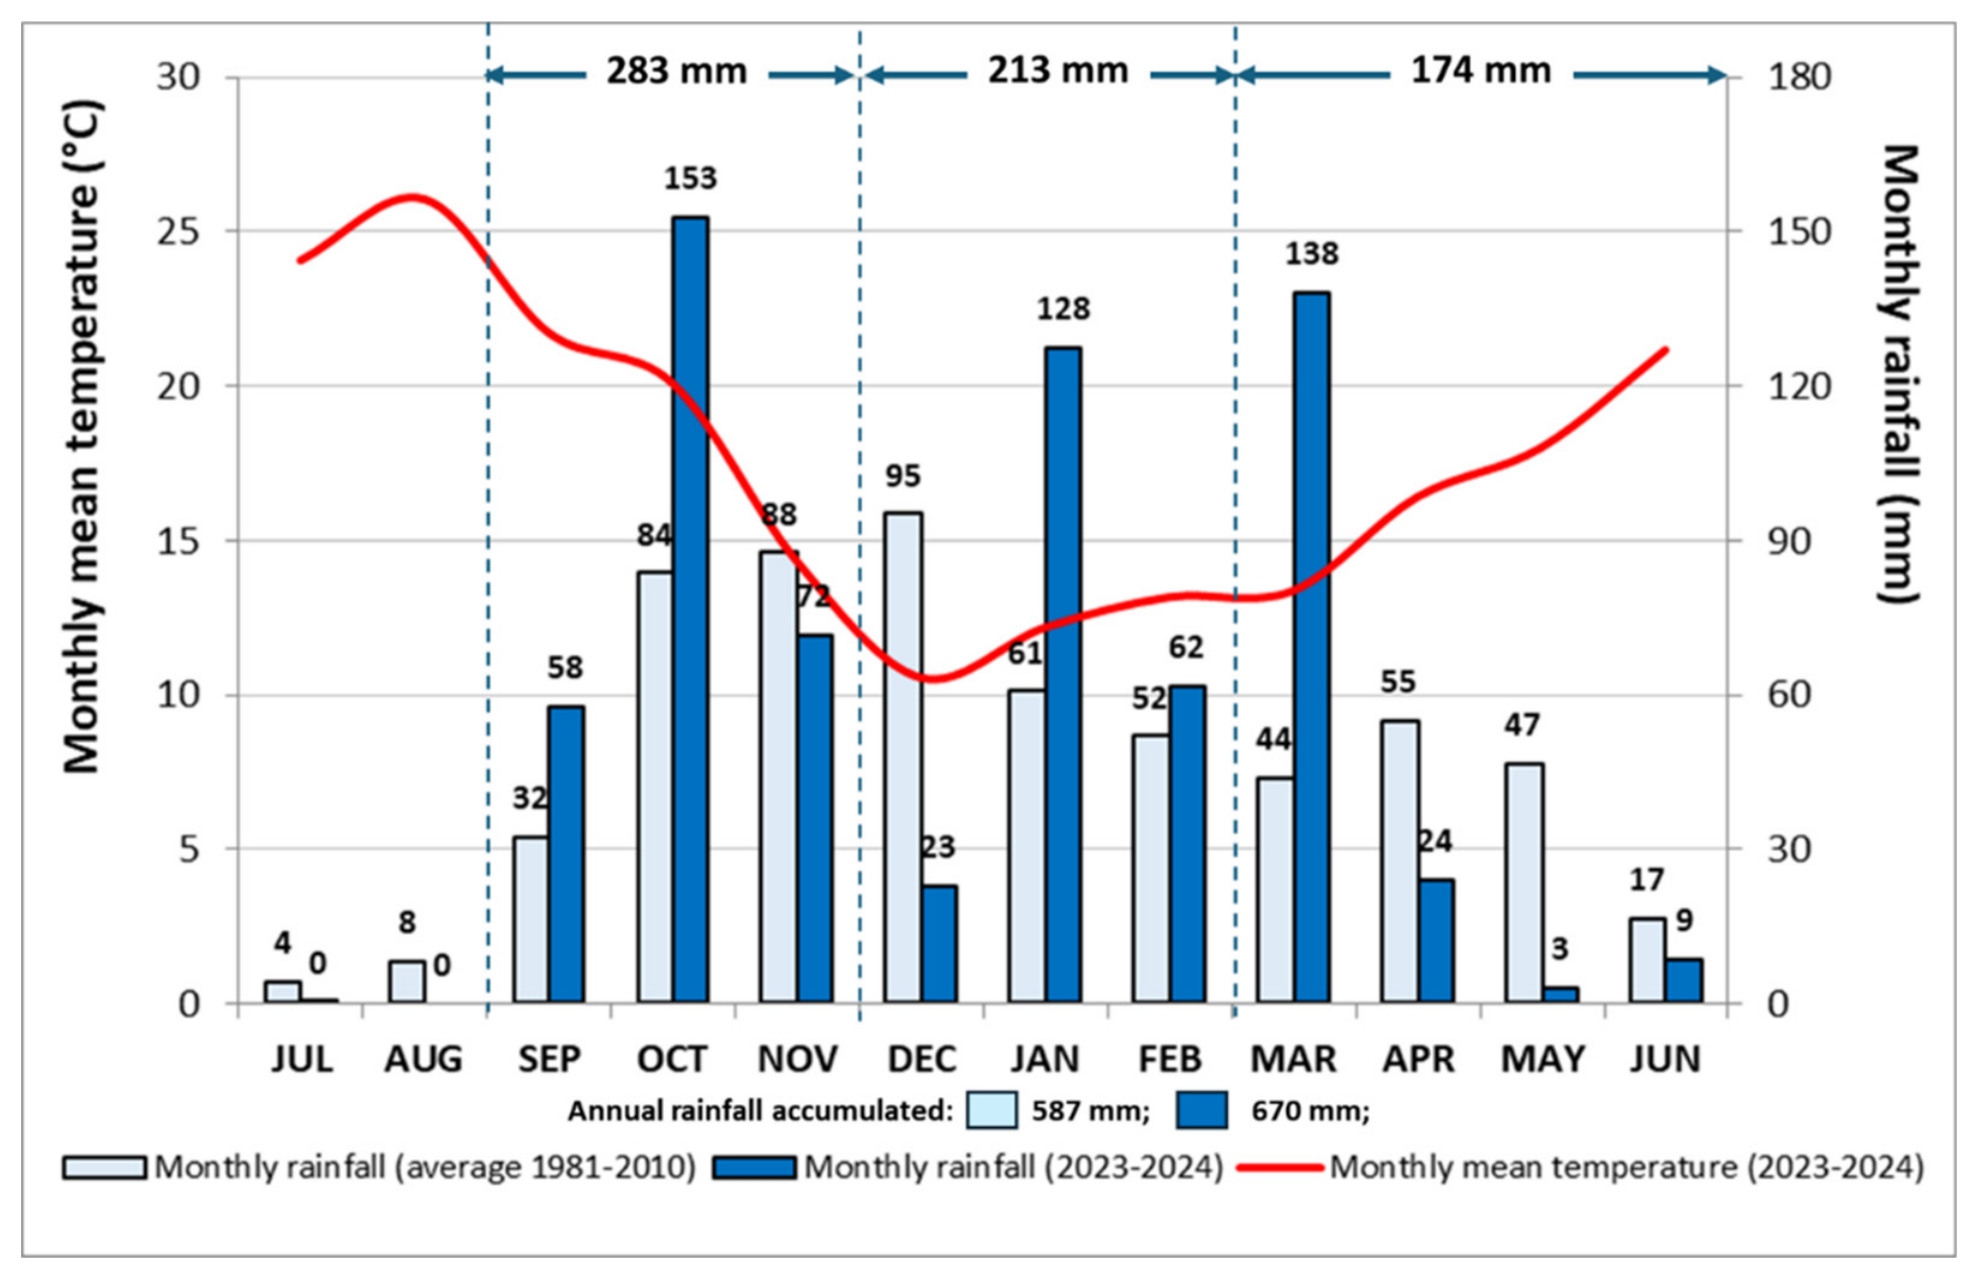
Figure 5.
Soil spatial distribution of sand (a), silt (b) and clay (c) content in June 2023.
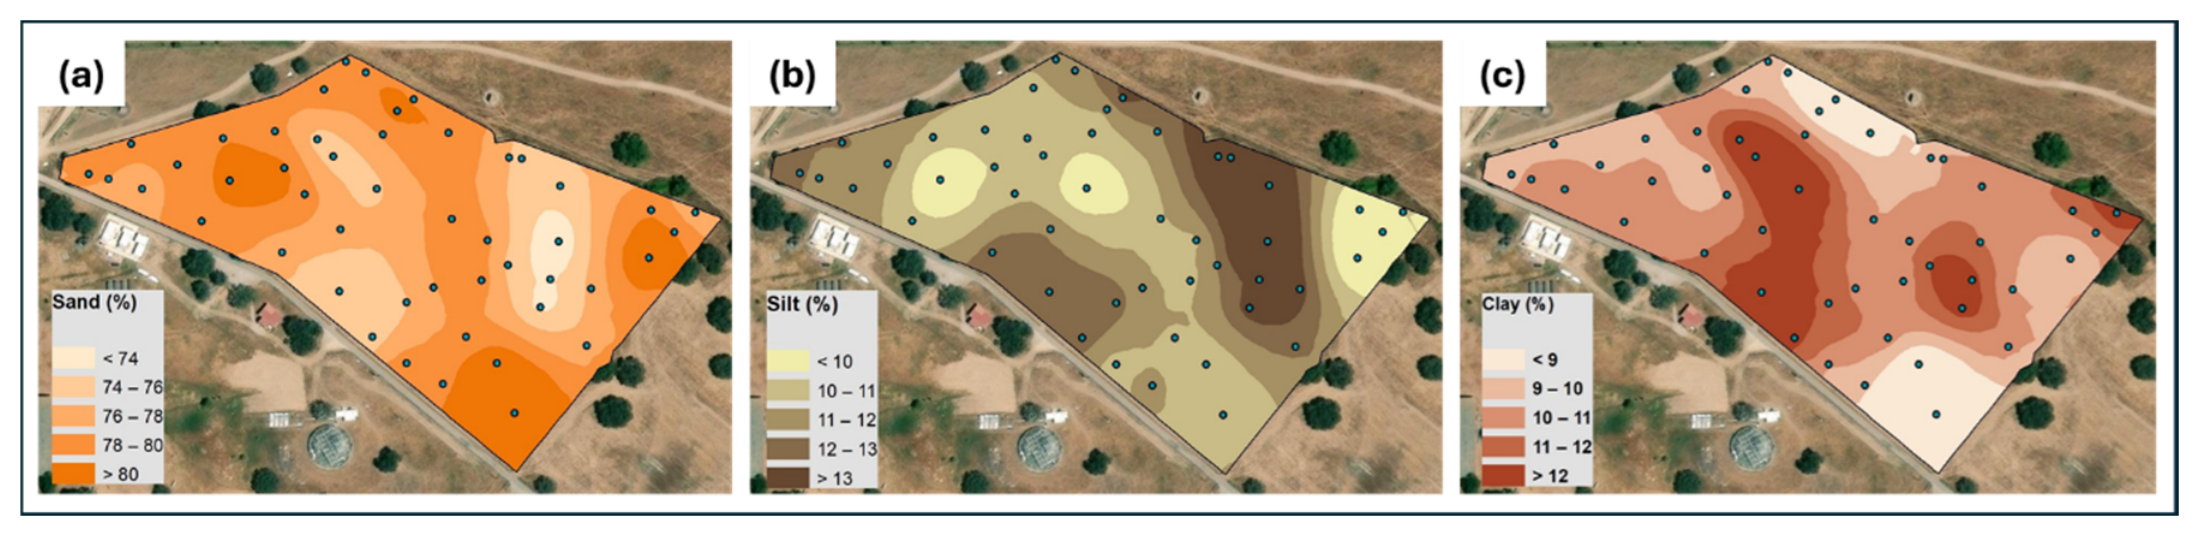
Figure 6.
Soil spatial distribution of organic matter, OM (a), cationic exchange capacity. CEC (b), pH (c) and P2O5 (d) in June 2023.
Figure 6.
Soil spatial distribution of organic matter, OM (a), cationic exchange capacity. CEC (b), pH (c) and P2O5 (d) in June 2023.
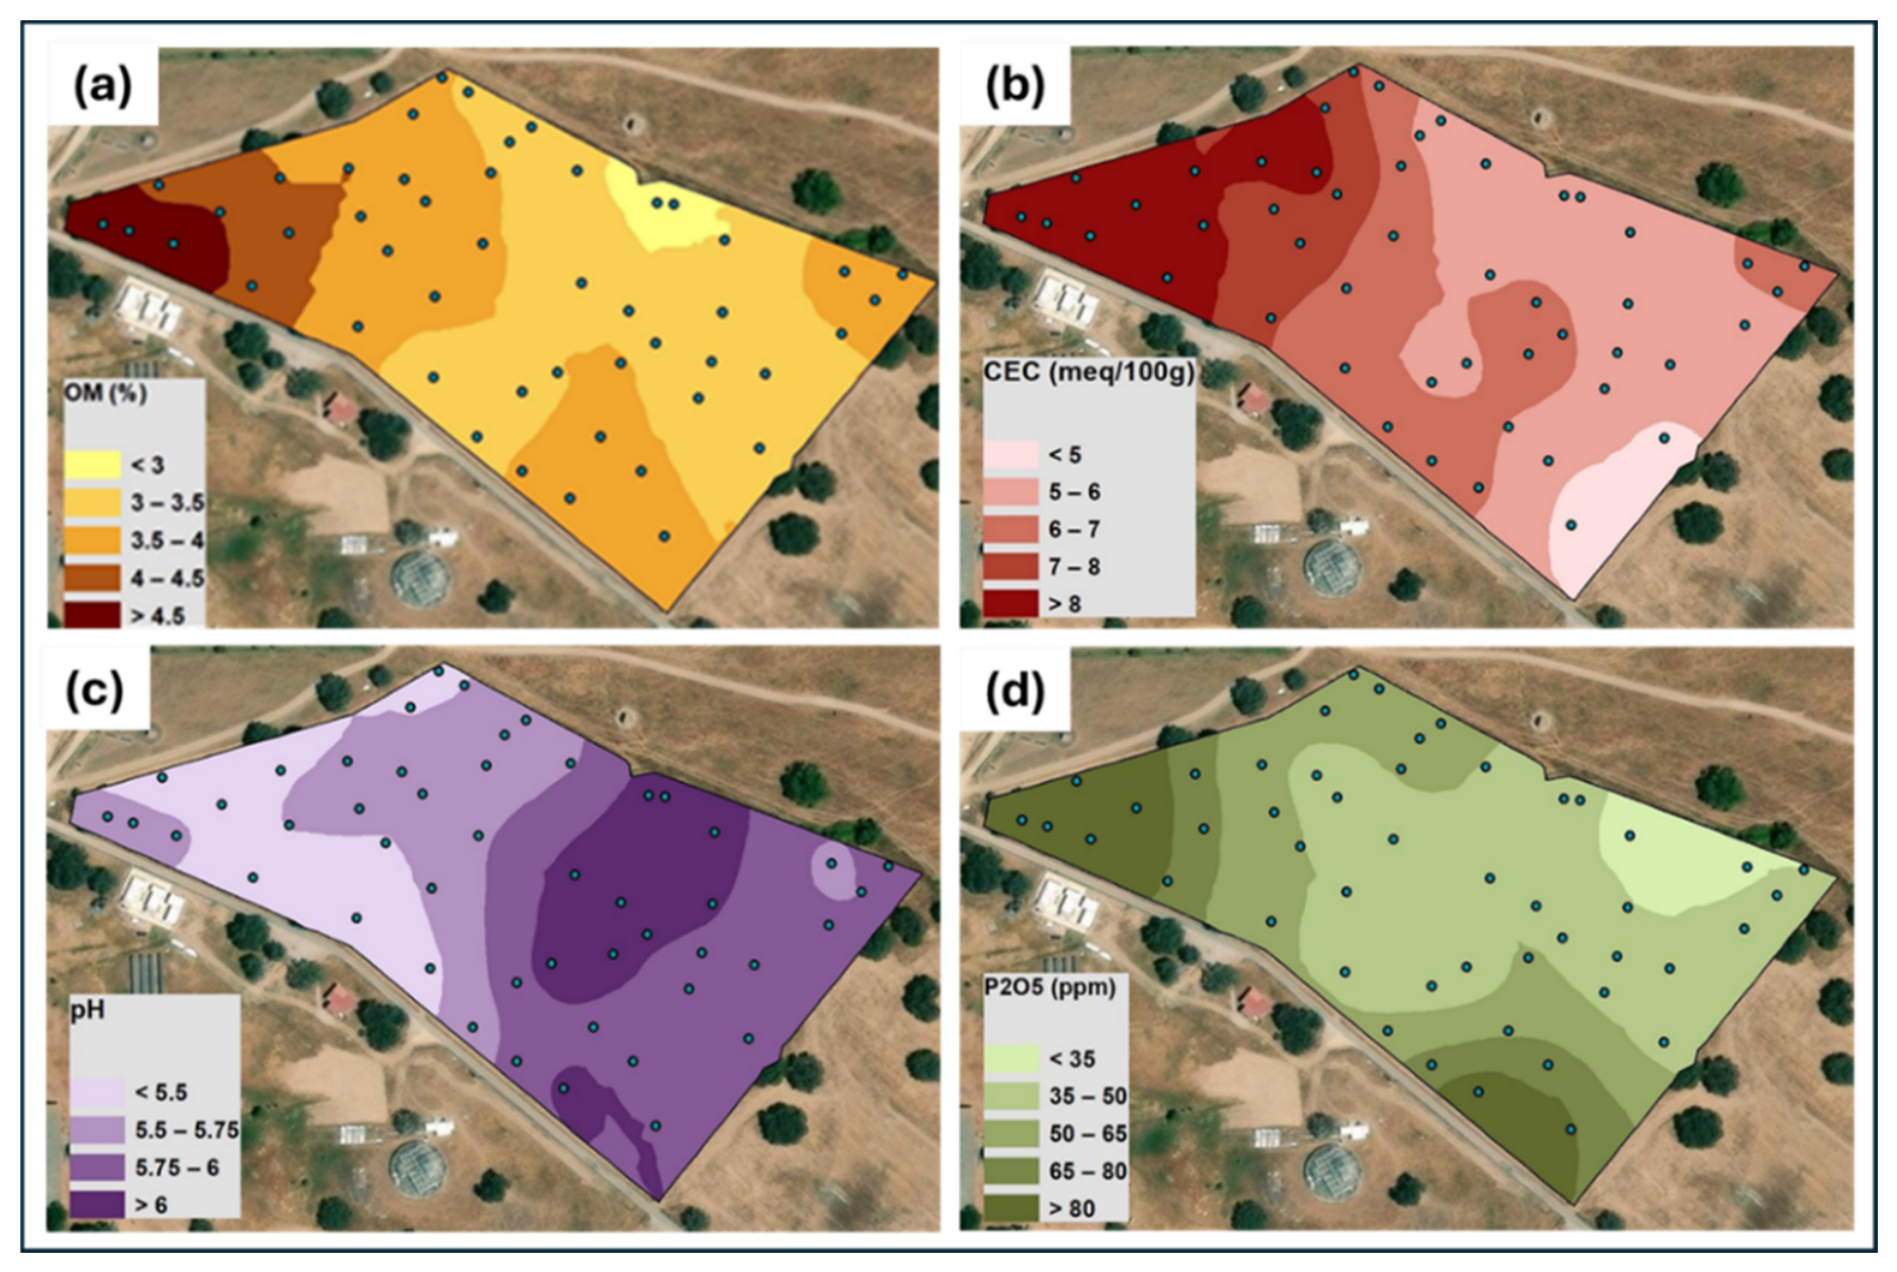
Figure 7.
Pearson correlation matrix of soil parameters (a) and respective dendrogram (b). OM-Organic matter; CEC— Cationic exchange capacity; P2O5— Phosphorus; K2O— Potassium; Mg— Magnesium; Mn— Manganese; SEB— Sum of the exchange bases; DBS— Degree of base saturation; ***— significant at the 0.001 level; **—significant at the 0.01 level. *— significant at the 0.05 level.
Figure 7.
Pearson correlation matrix of soil parameters (a) and respective dendrogram (b). OM-Organic matter; CEC— Cationic exchange capacity; P2O5— Phosphorus; K2O— Potassium; Mg— Magnesium; Mn— Manganese; SEB— Sum of the exchange bases; DBS— Degree of base saturation; ***— significant at the 0.001 level; **—significant at the 0.01 level. *— significant at the 0.05 level.
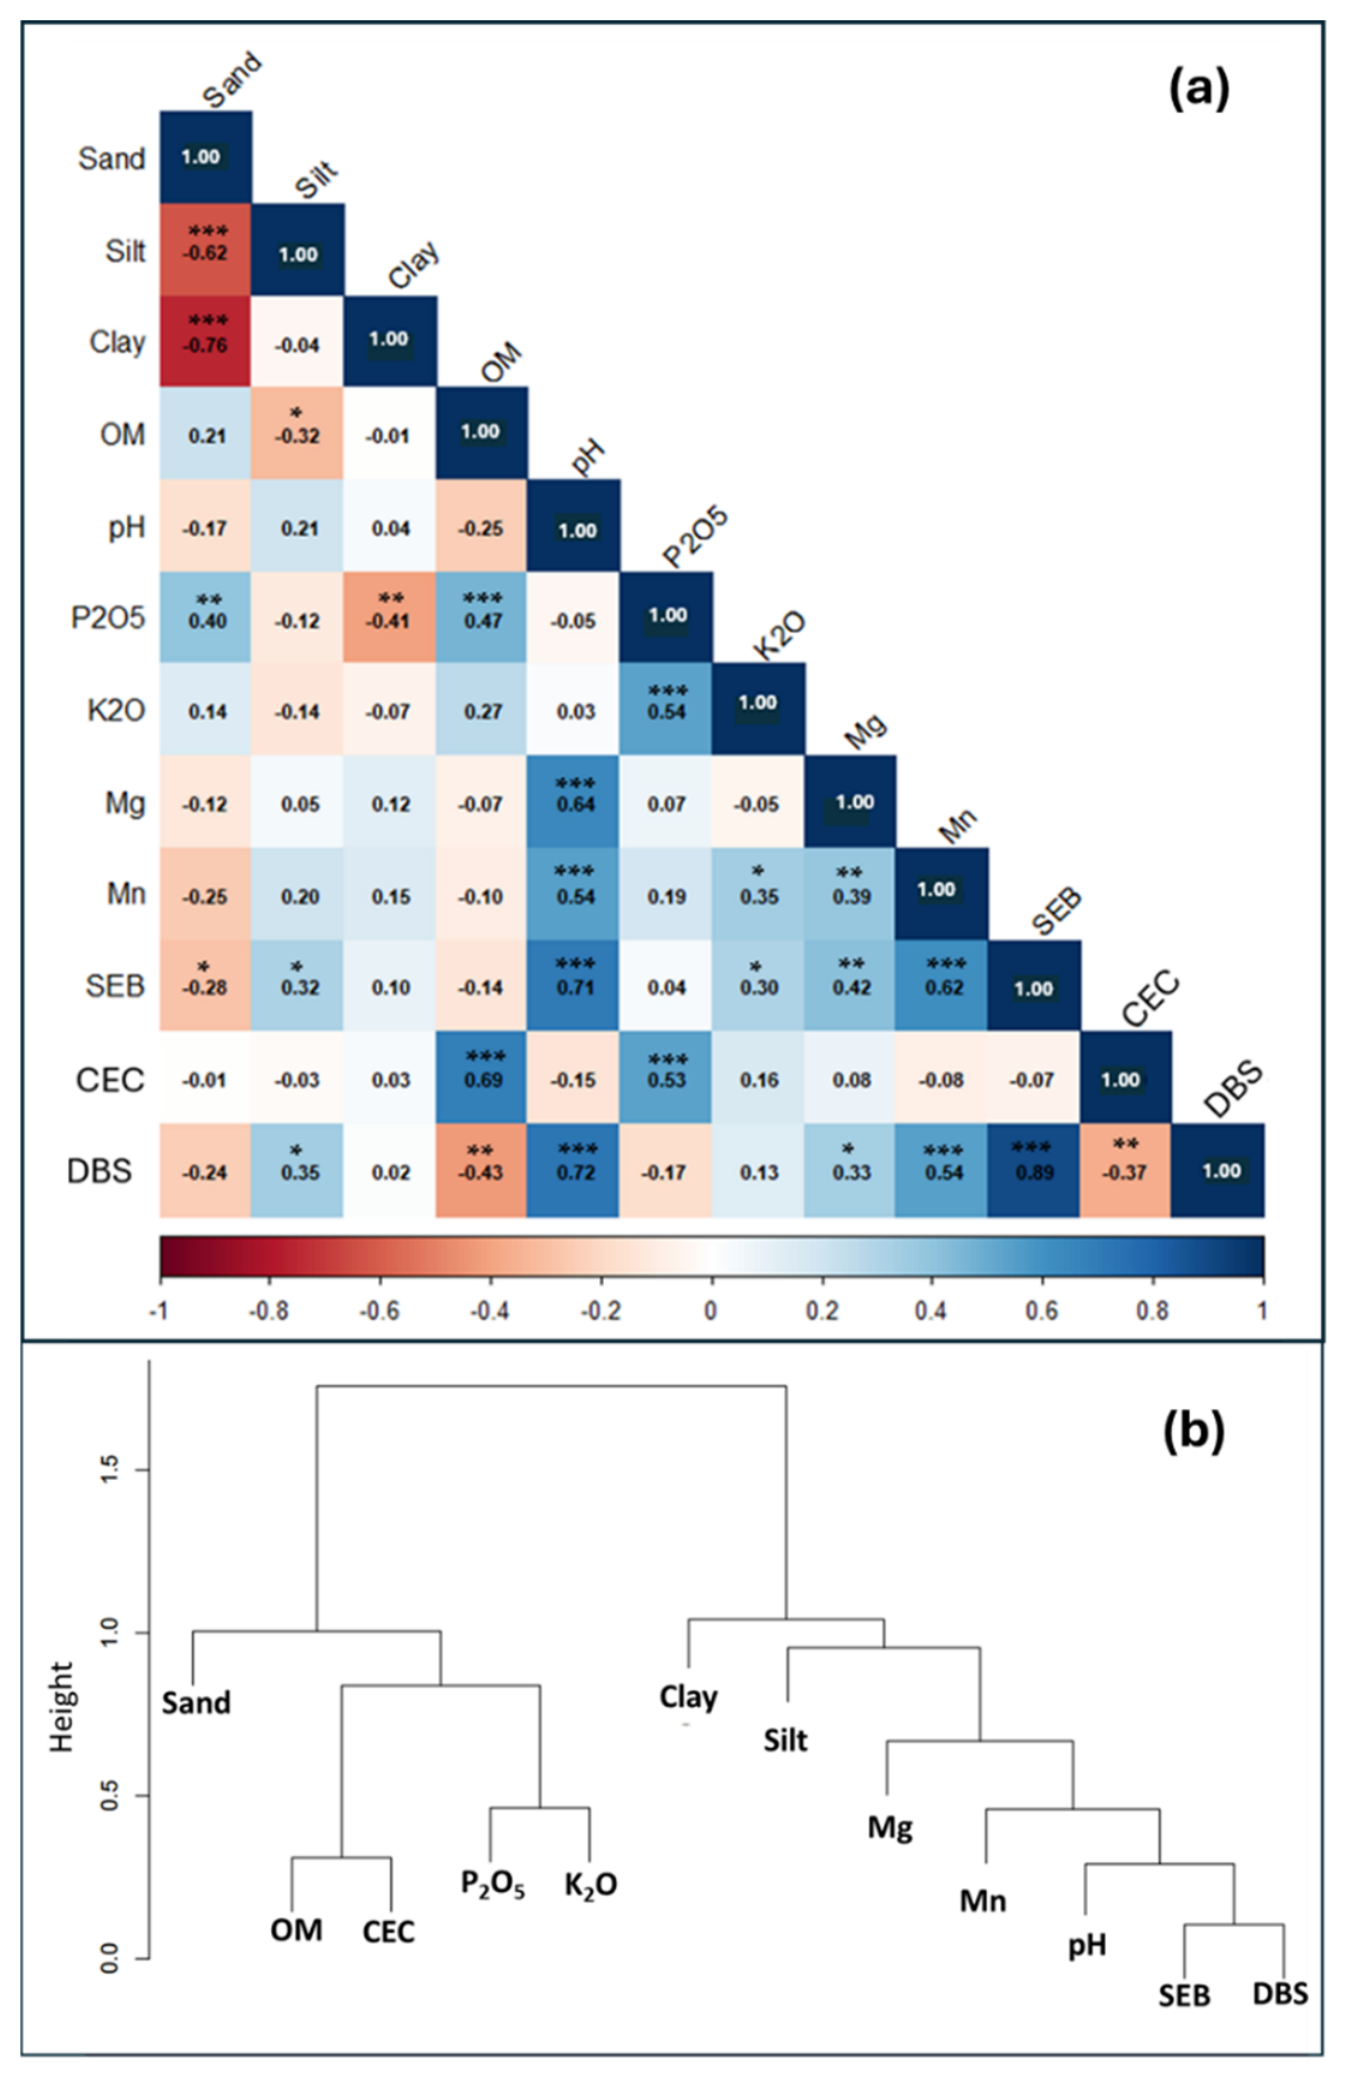
Figure 8.
Dendrogram between soil properties in each treatment (a to d). OM-Organic matter; CEC— Cationic exchange capacity; P2O5— Phosphorus; K2O— Potassium; Mg— Magnesium; Mn— Manganese; SEB— Sum of the exchange bases; DBS— Degree of base saturation.
Figure 8.
Dendrogram between soil properties in each treatment (a to d). OM-Organic matter; CEC— Cationic exchange capacity; P2O5— Phosphorus; K2O— Potassium; Mg— Magnesium; Mn— Manganese; SEB— Sum of the exchange bases; DBS— Degree of base saturation.
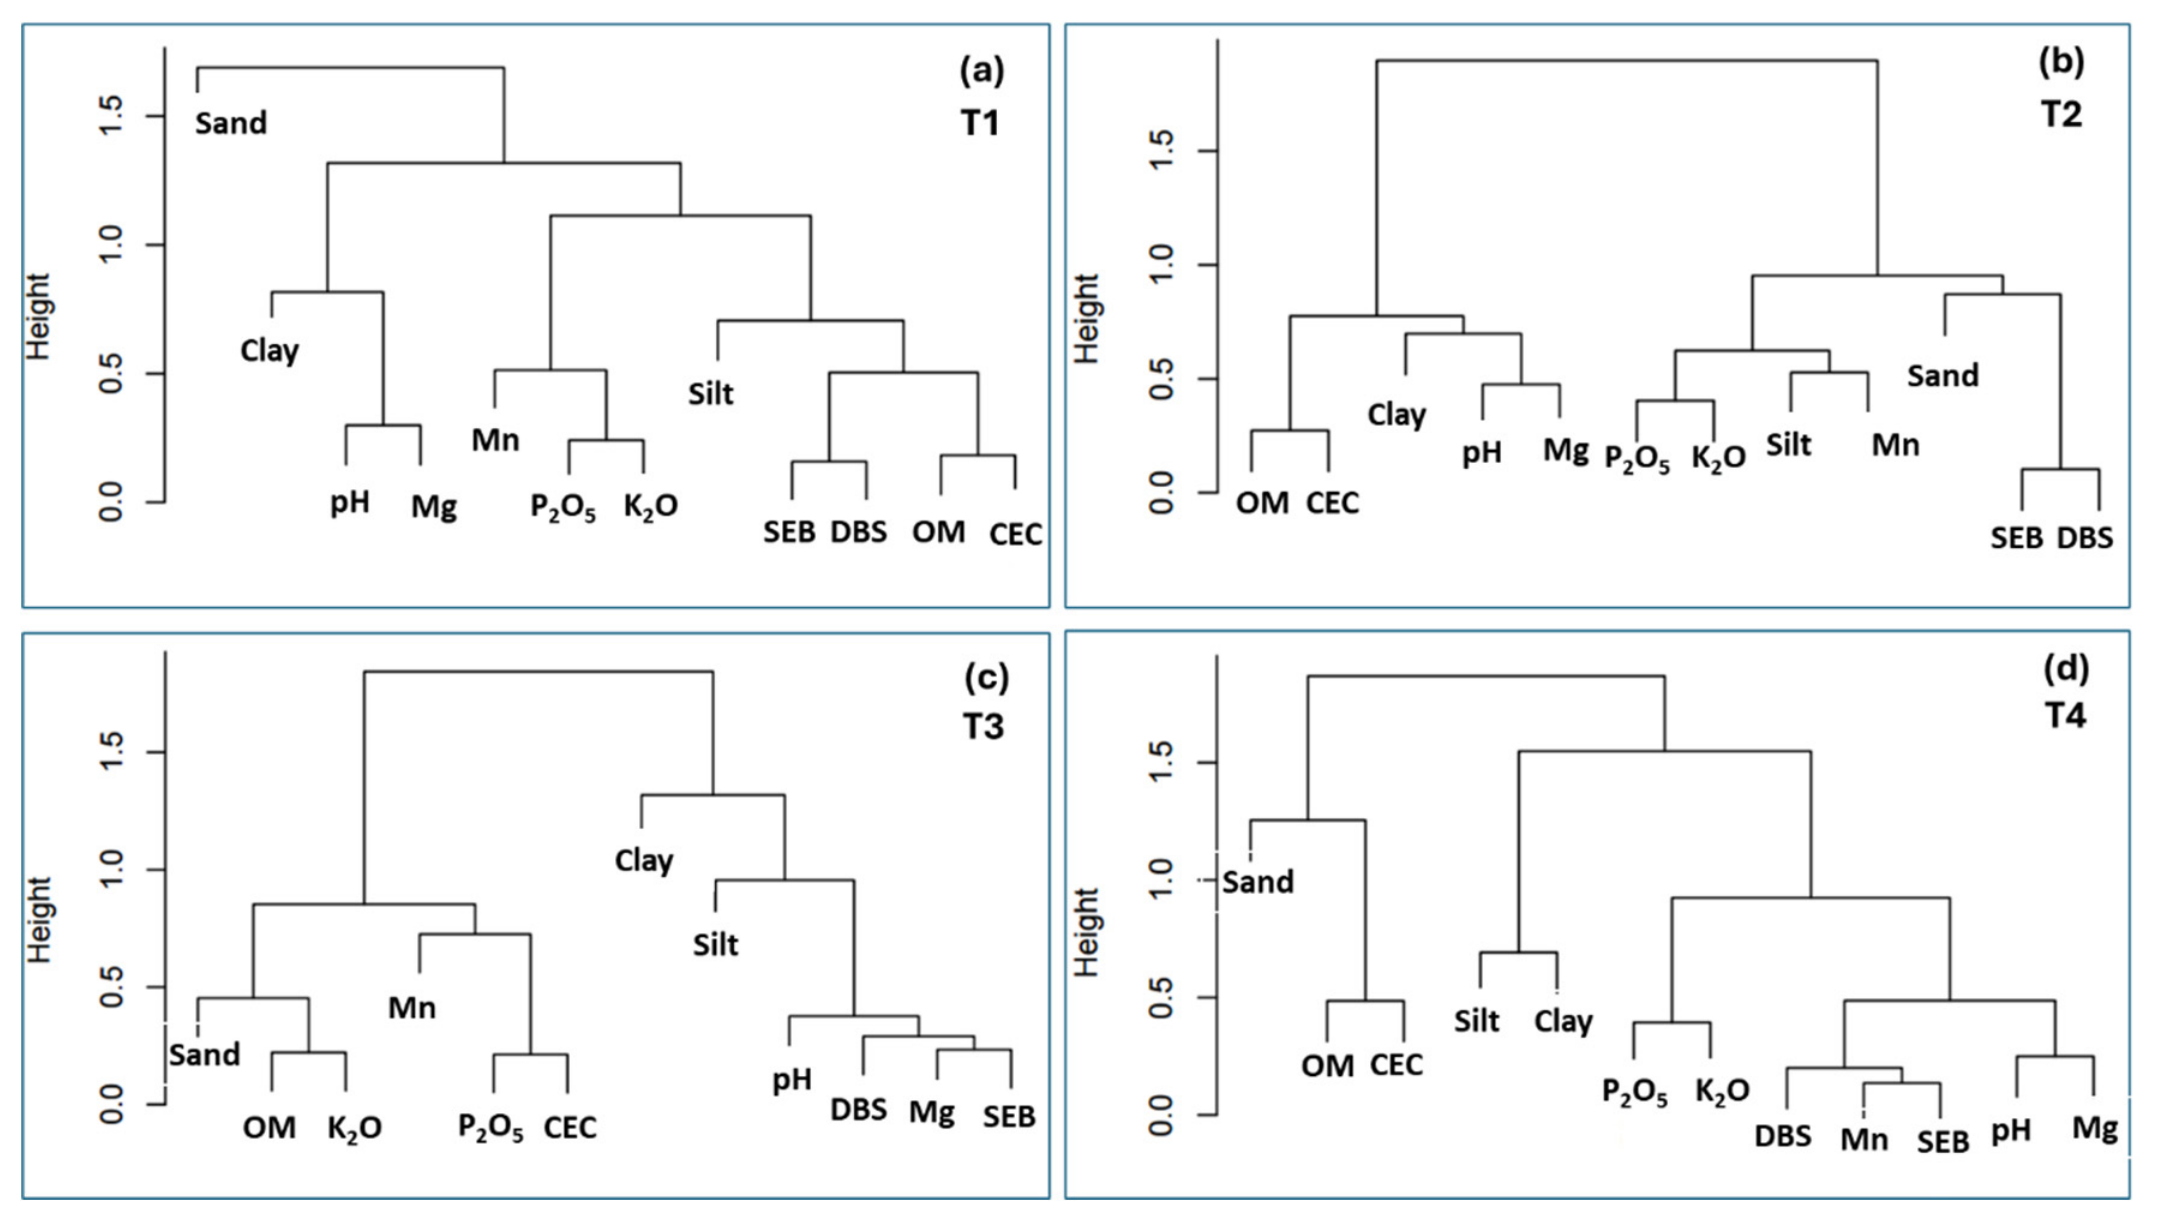
Figure 9.
Soil pH evolution (0−30 cm) of the experimental field throughout the monitoring period (2015−2024).
Figure 9.
Soil pH evolution (0−30 cm) of the experimental field throughout the monitoring period (2015−2024).
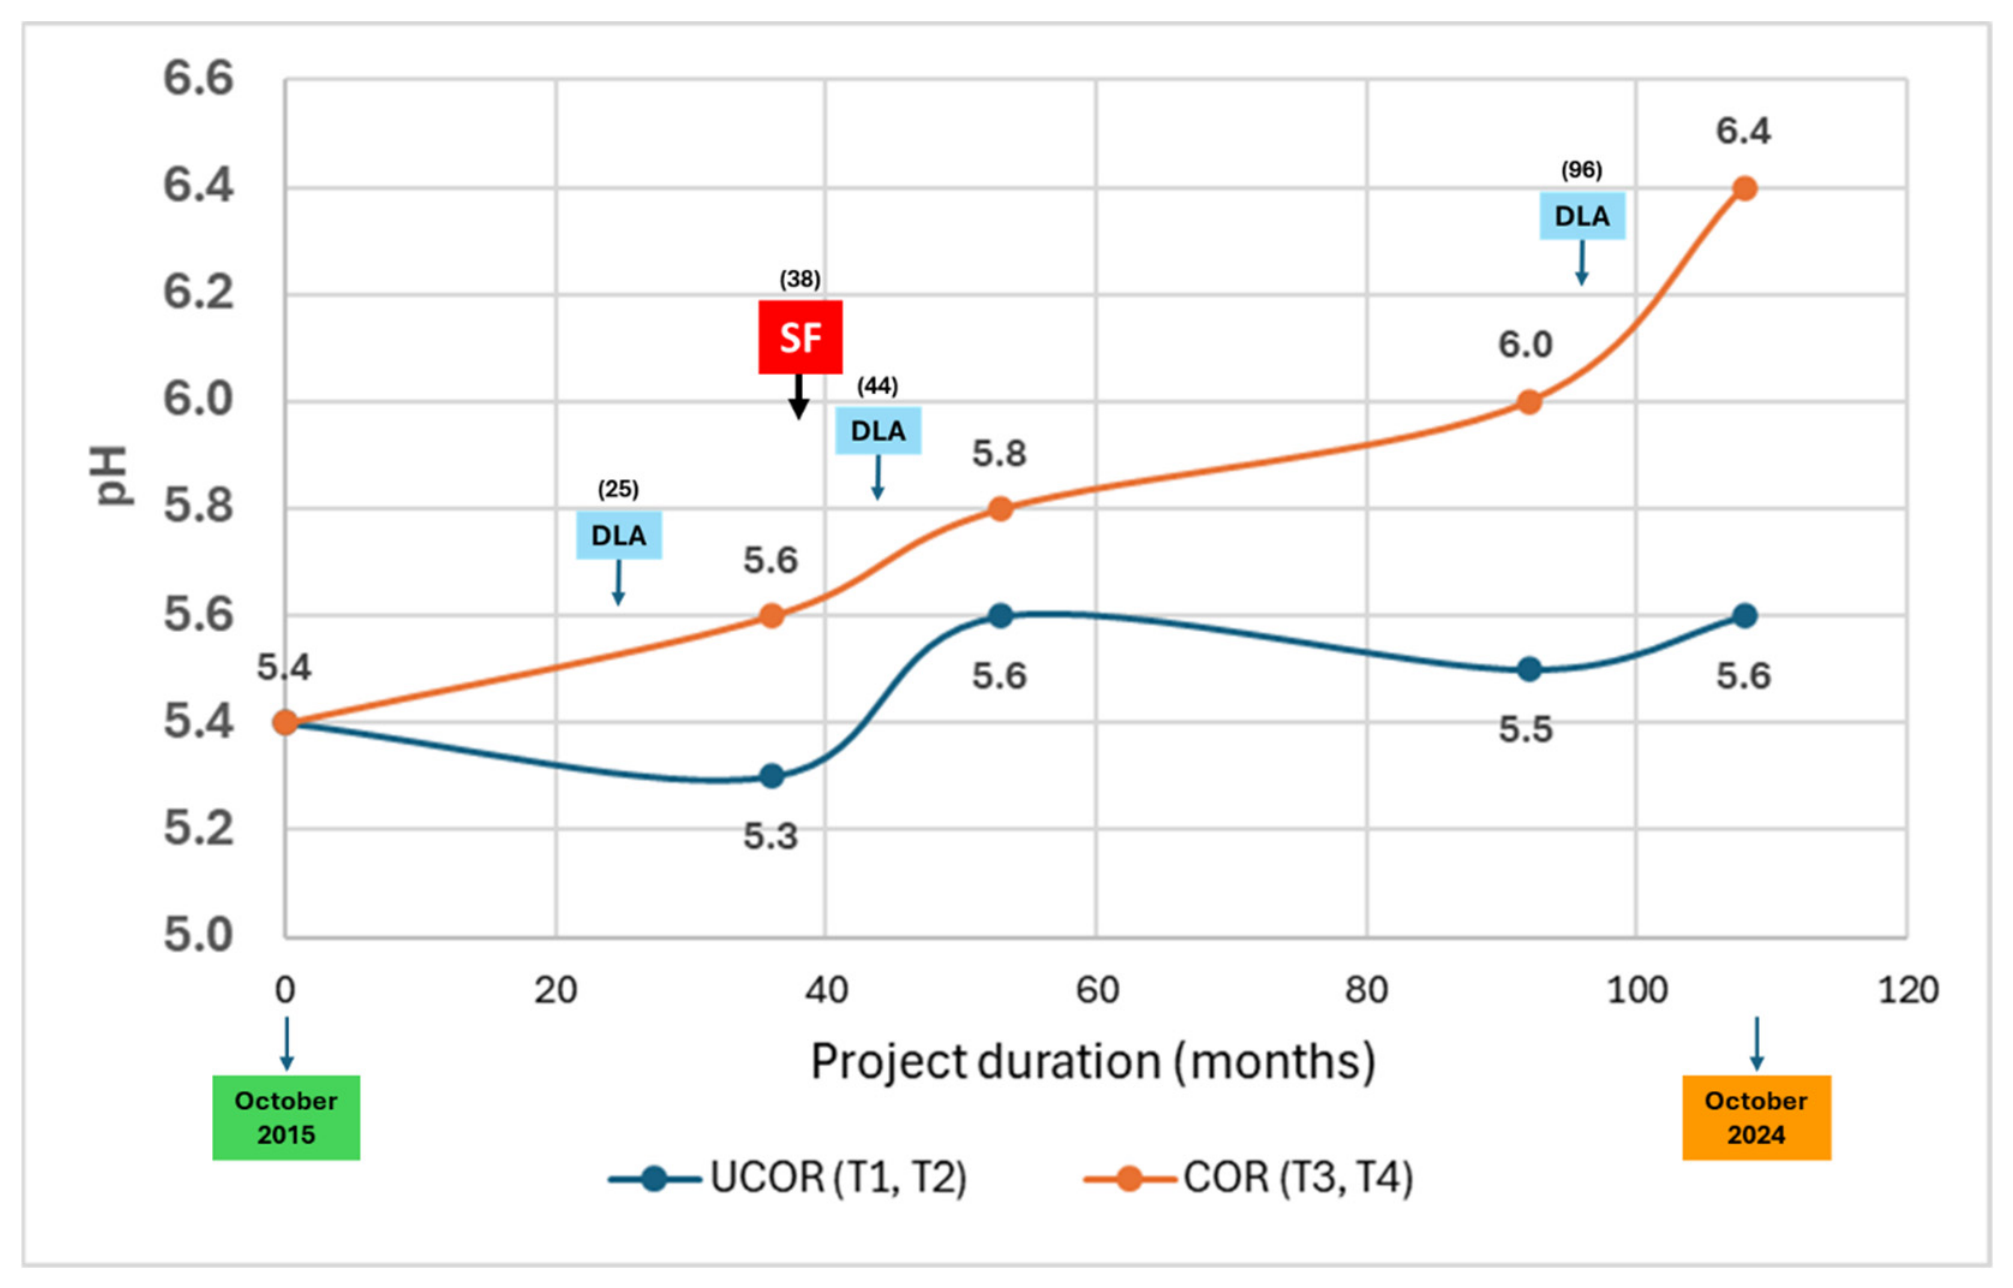
Figure 10.
Spatial grazing patterns – cumulative maps taking into account all grazing monitoring dates (four dates) during the spring 2024: (a) all observation periods of the day; (b) in the first observation period of the day (06h30 to 11h); (c) in the second observation period of the day (11h to 15h30); (d) in the third observation period of the day (15h30 to 20h).
Figure 10.
Spatial grazing patterns – cumulative maps taking into account all grazing monitoring dates (four dates) during the spring 2024: (a) all observation periods of the day; (b) in the first observation period of the day (06h30 to 11h); (c) in the second observation period of the day (11h to 15h30); (d) in the third observation period of the day (15h30 to 20h).
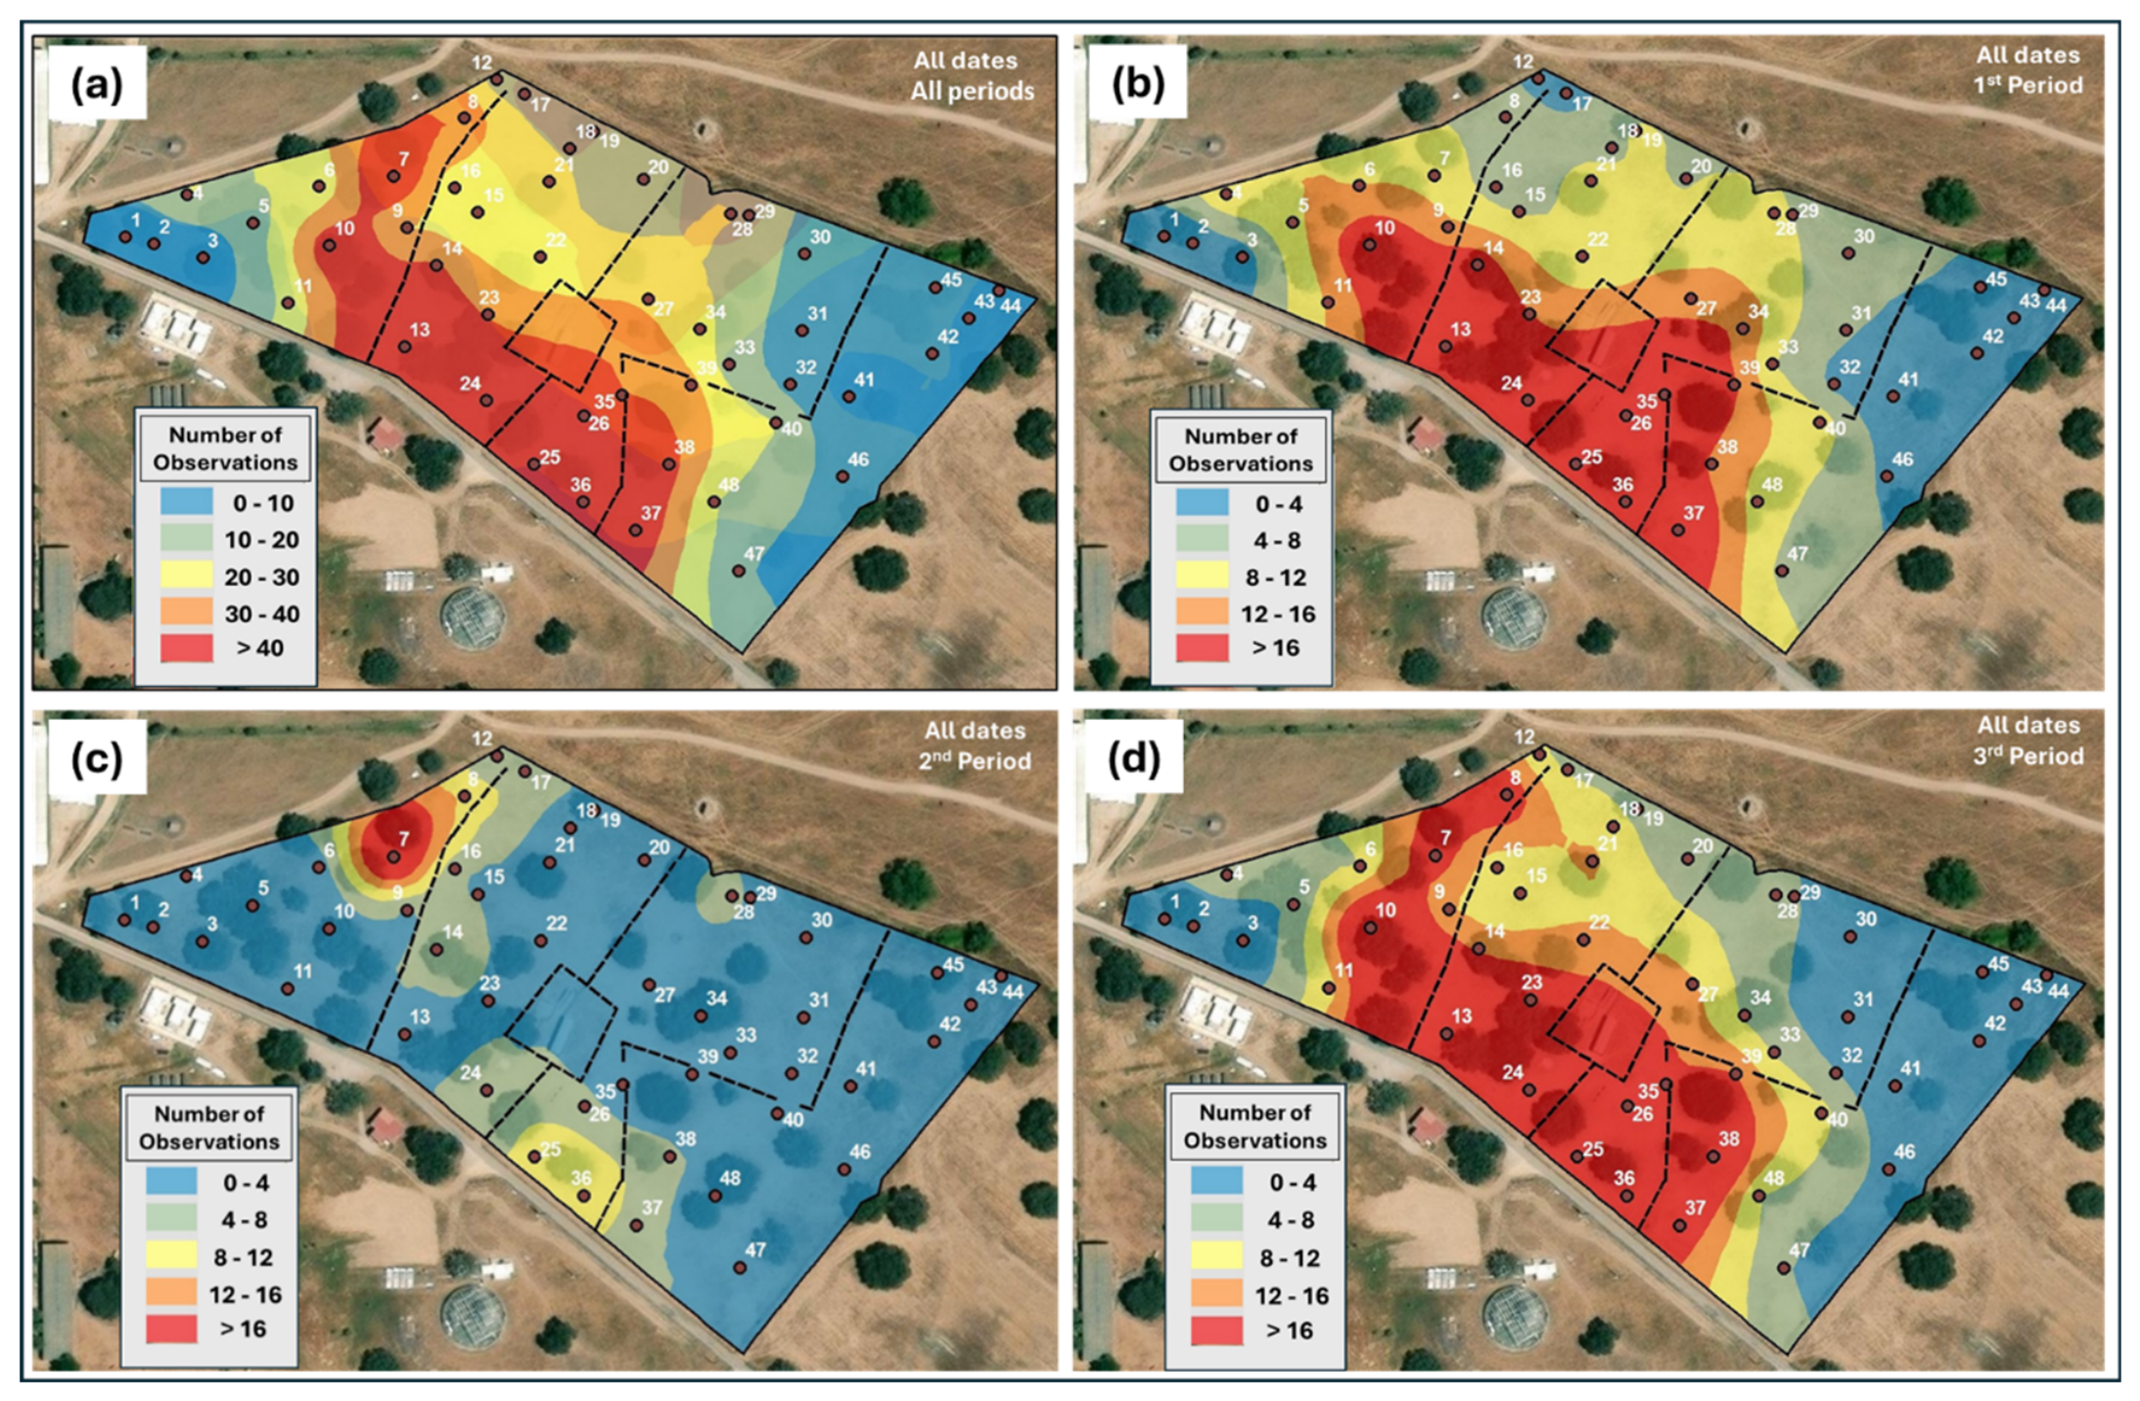
Figure 11.
Grazing density map (a); and results of mean cone index (CI, kPa), for two depths (0−10 cm and 10−20 cm), in five dates (b−f) and in low and high grazing density.
Figure 11.
Grazing density map (a); and results of mean cone index (CI, kPa), for two depths (0−10 cm and 10−20 cm), in five dates (b−f) and in low and high grazing density.
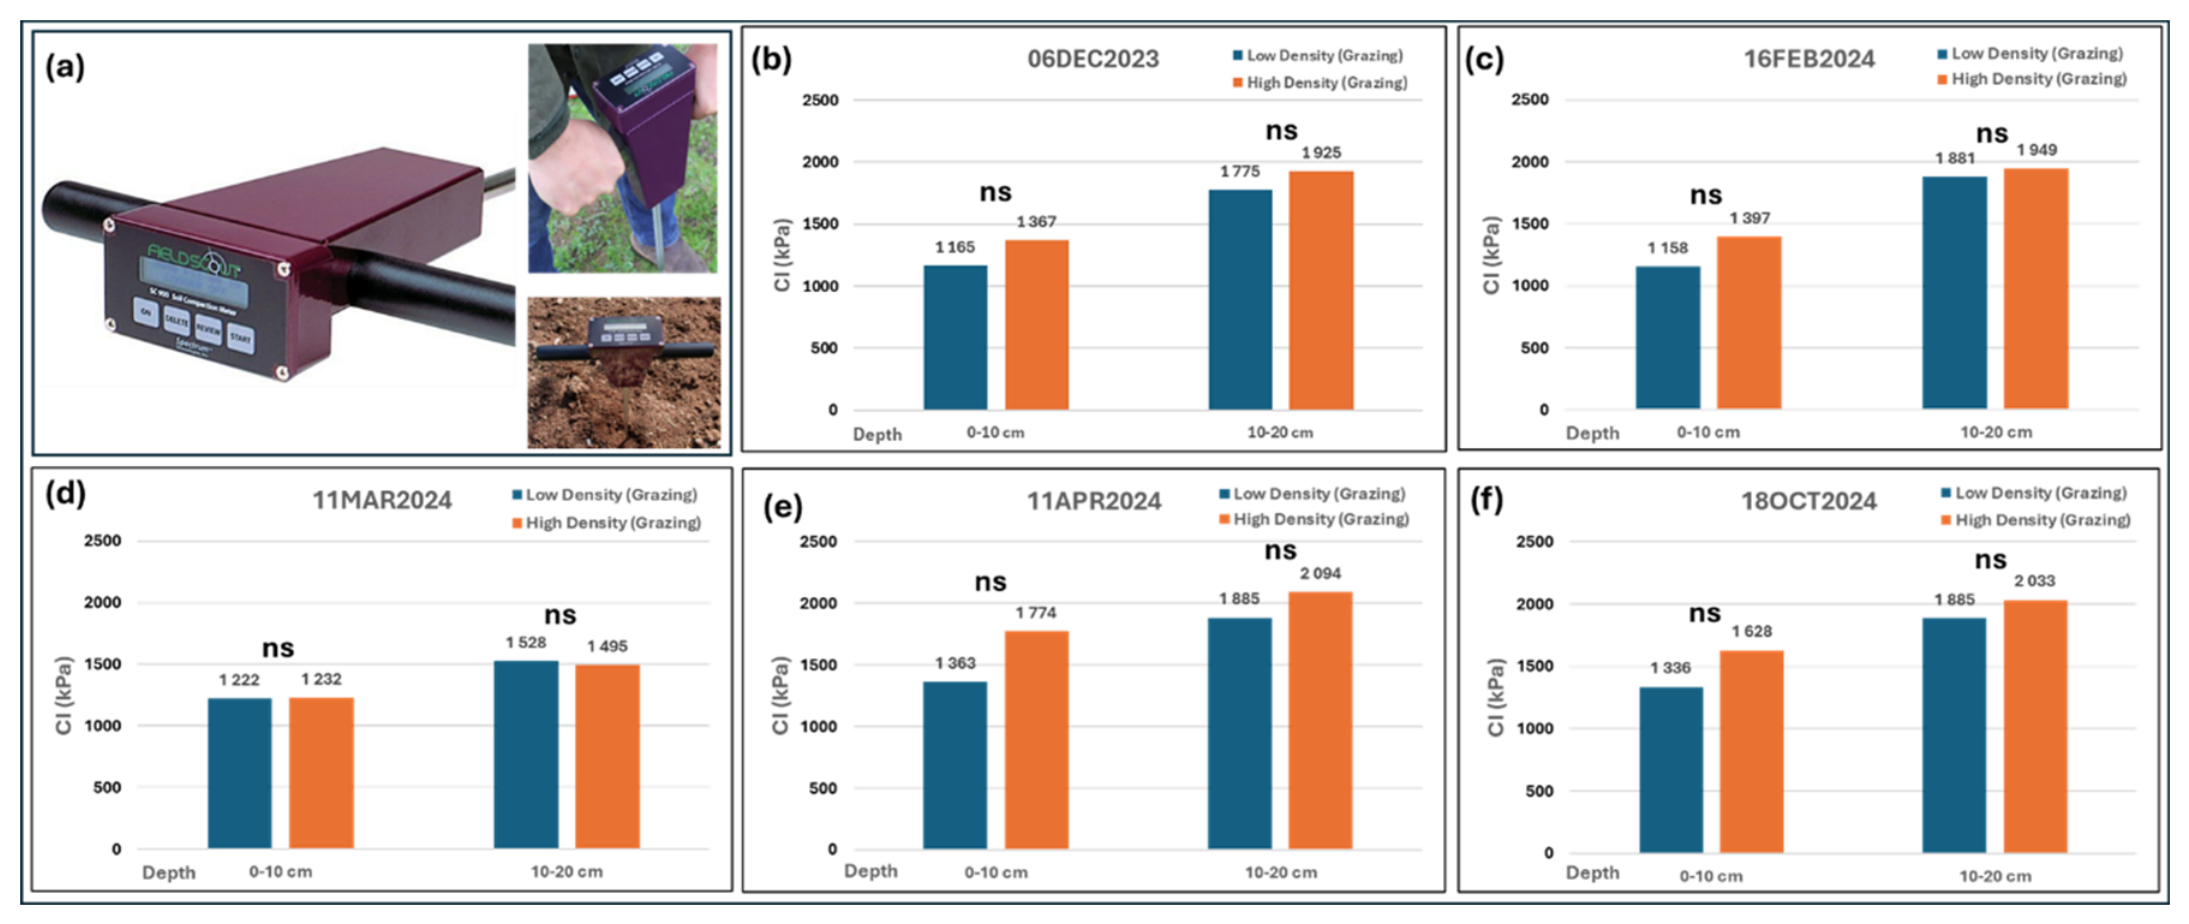
Figure 12.
Spatial distribution of the four botanical species more representative in each treatment.
Figure 12.
Spatial distribution of the four botanical species more representative in each treatment.
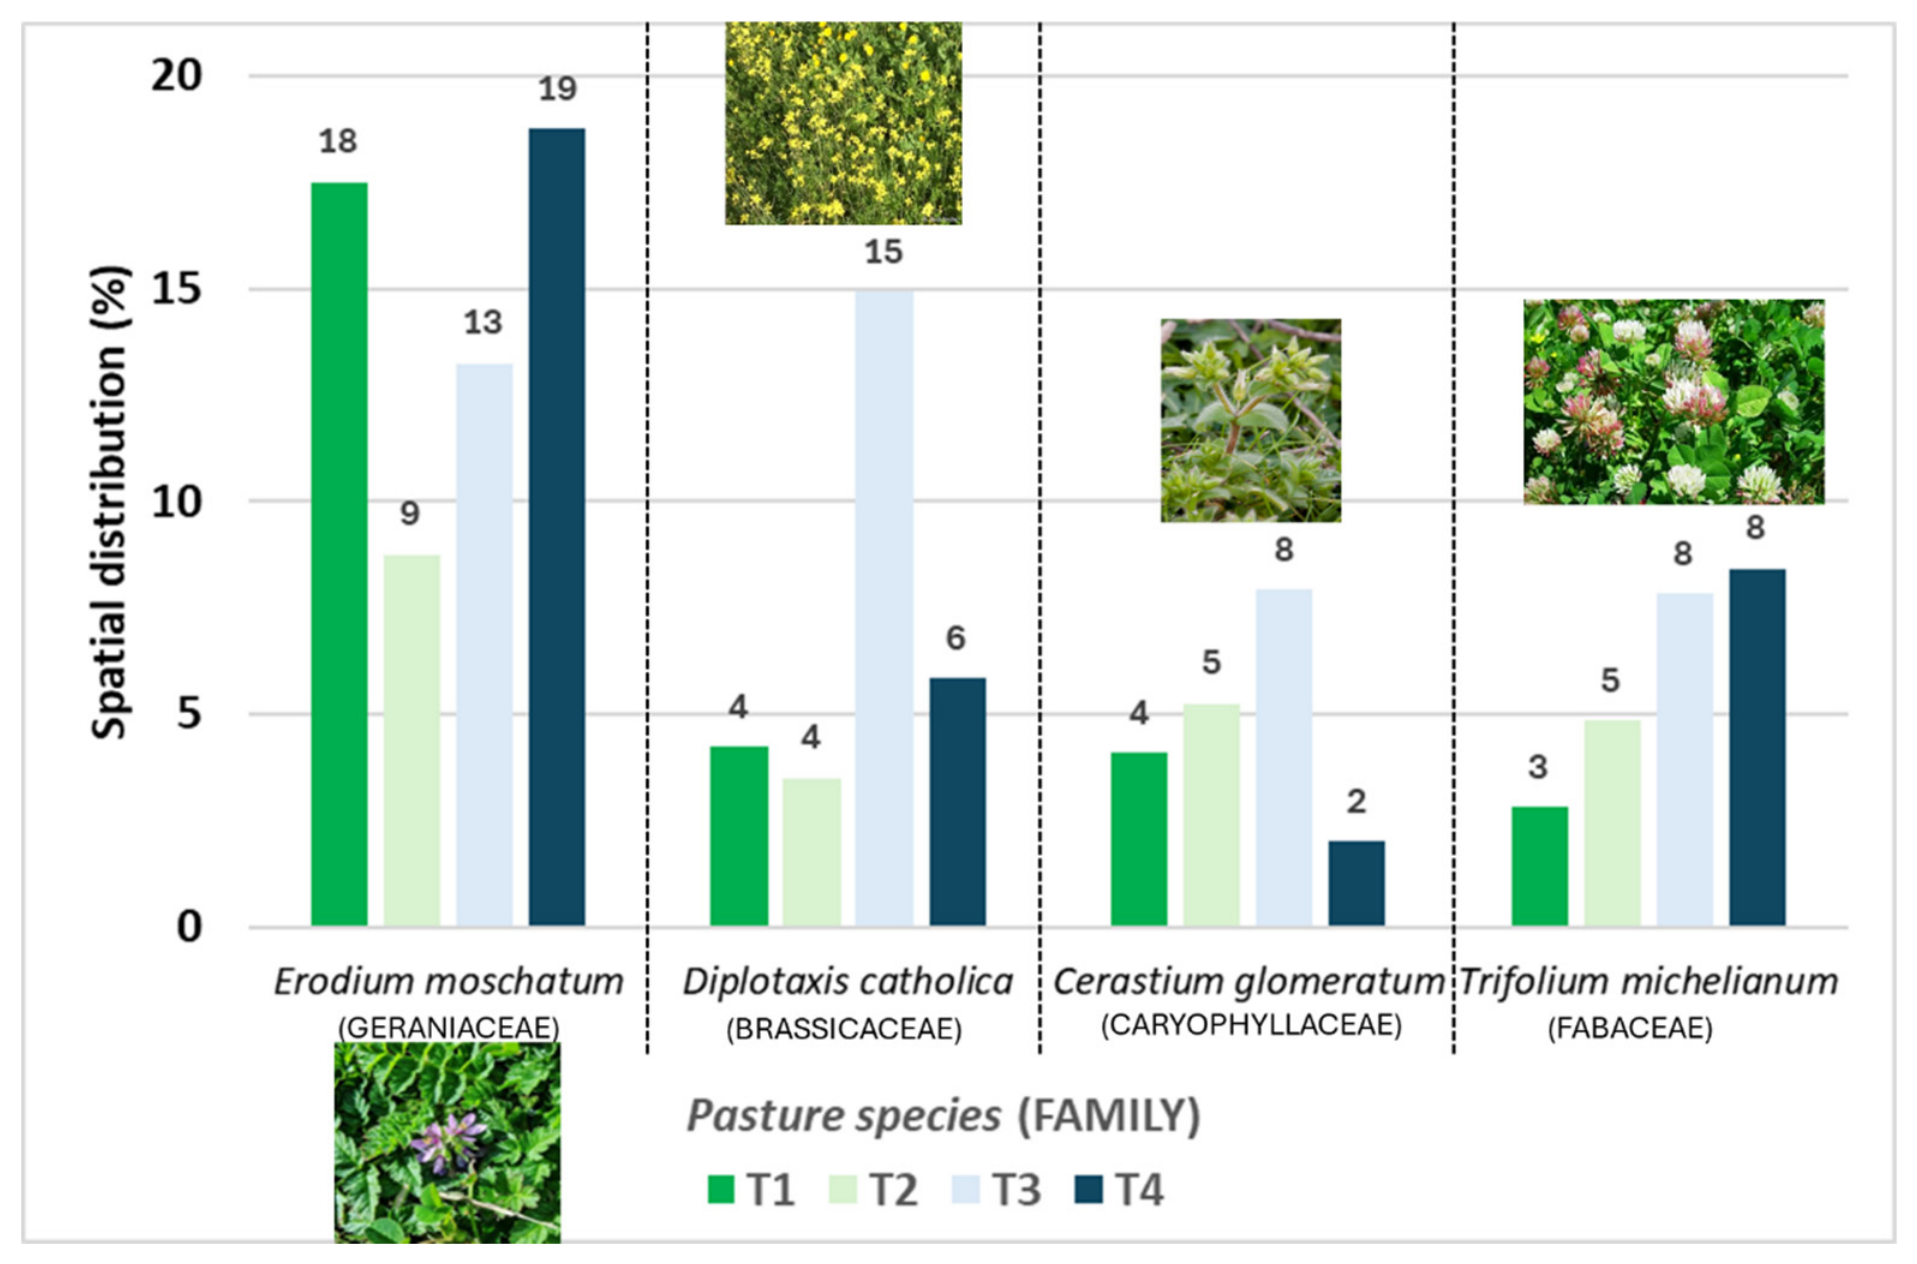
Figure 13.
Presence of four most representative botanical species on sampling areas of each treatment and in the global experimental field.
Figure 13.
Presence of four most representative botanical species on sampling areas of each treatment and in the global experimental field.
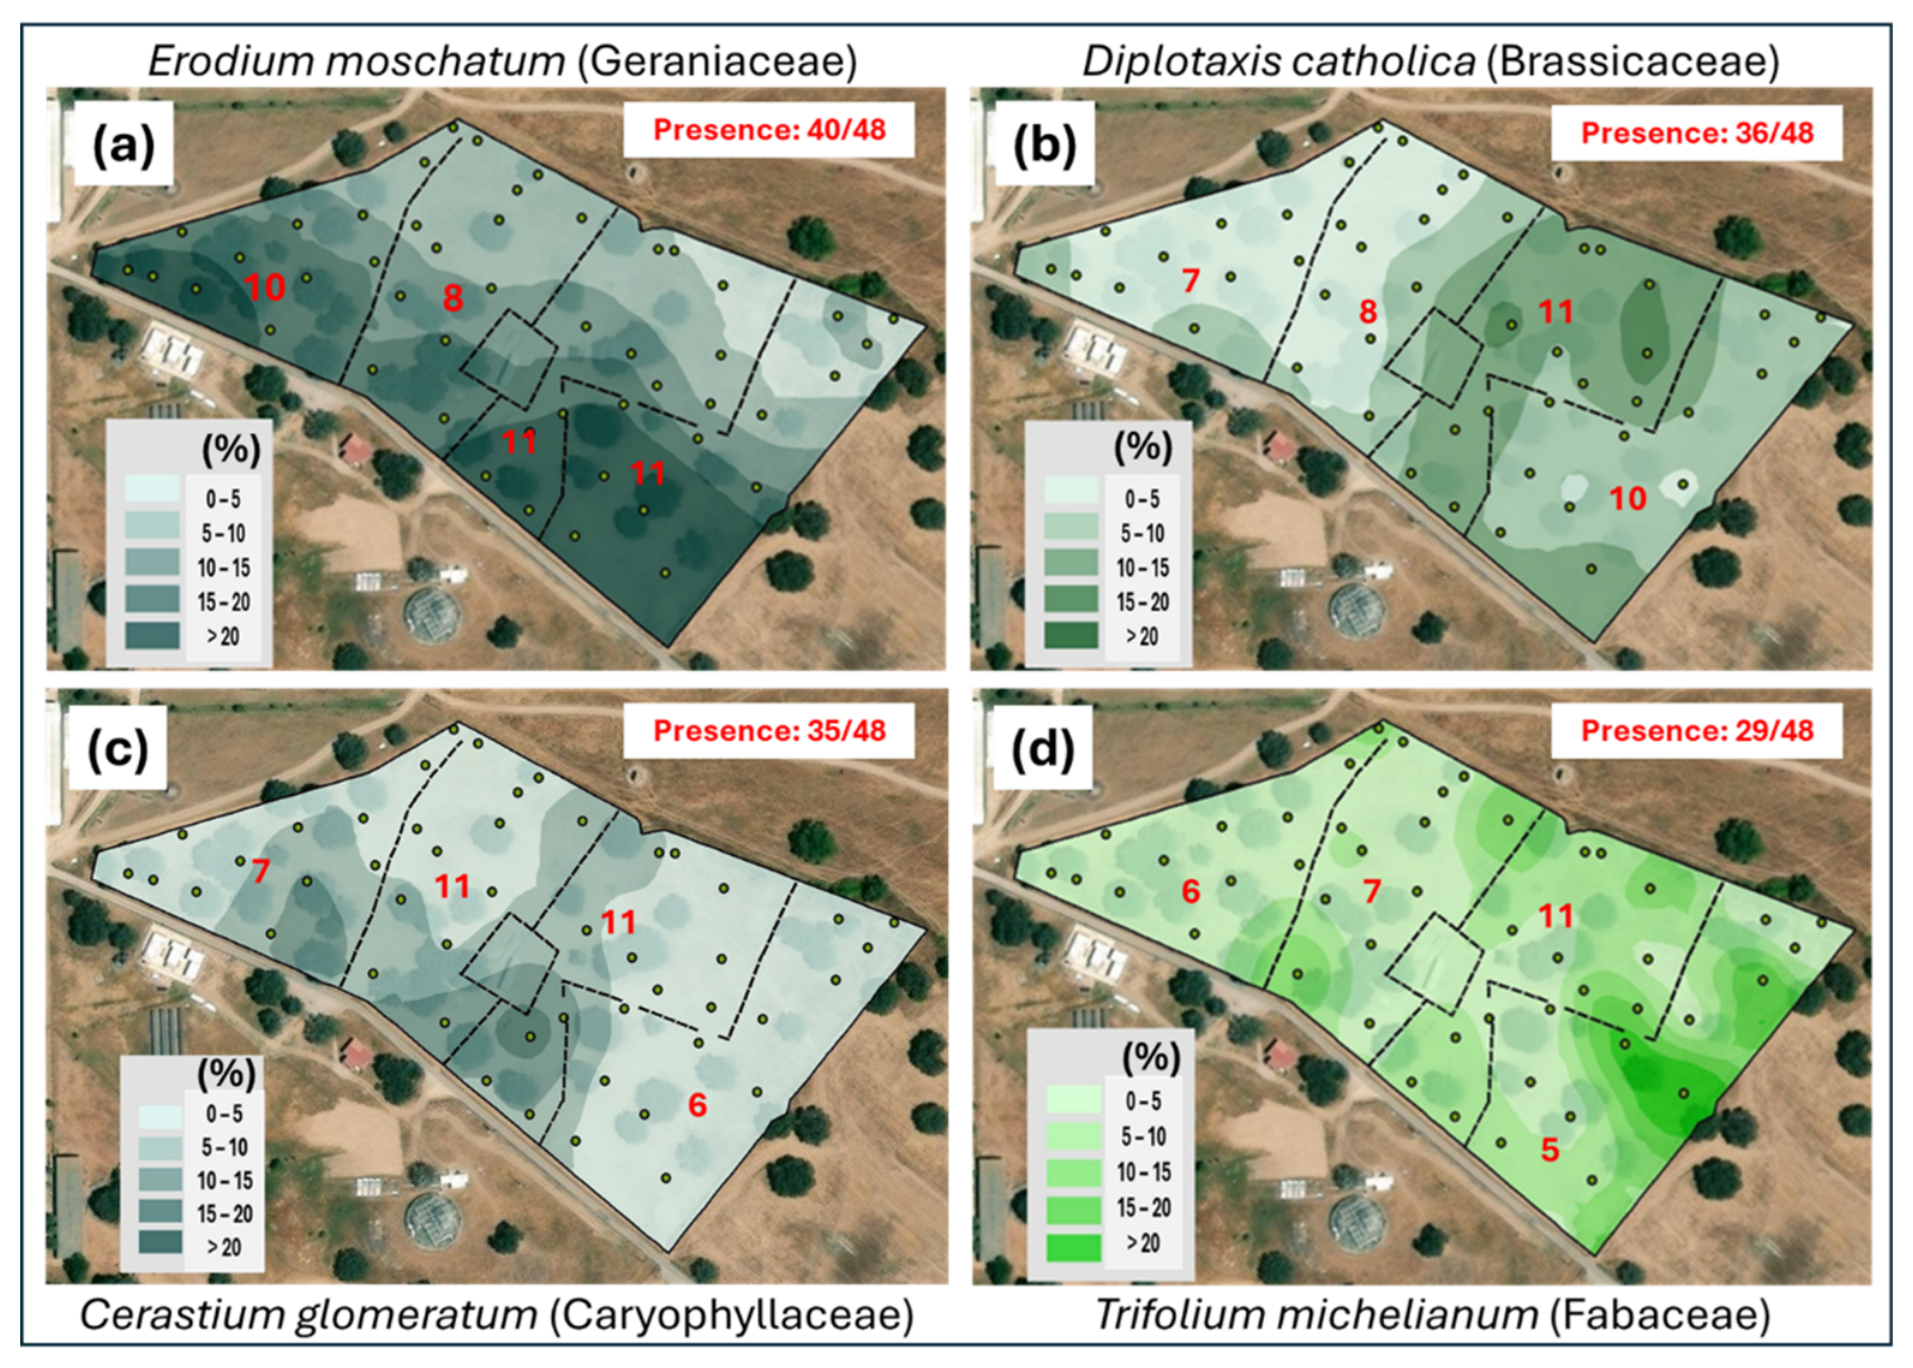
Figure 14.
Evolution of mean pasture quality index (PQI, in %), dry matter (DM) and crude protein (CP) availability (in kg ha-1), in each date (between December 2023 and June 2024).
Figure 14.
Evolution of mean pasture quality index (PQI, in %), dry matter (DM) and crude protein (CP) availability (in kg ha-1), in each date (between December 2023 and June 2024).
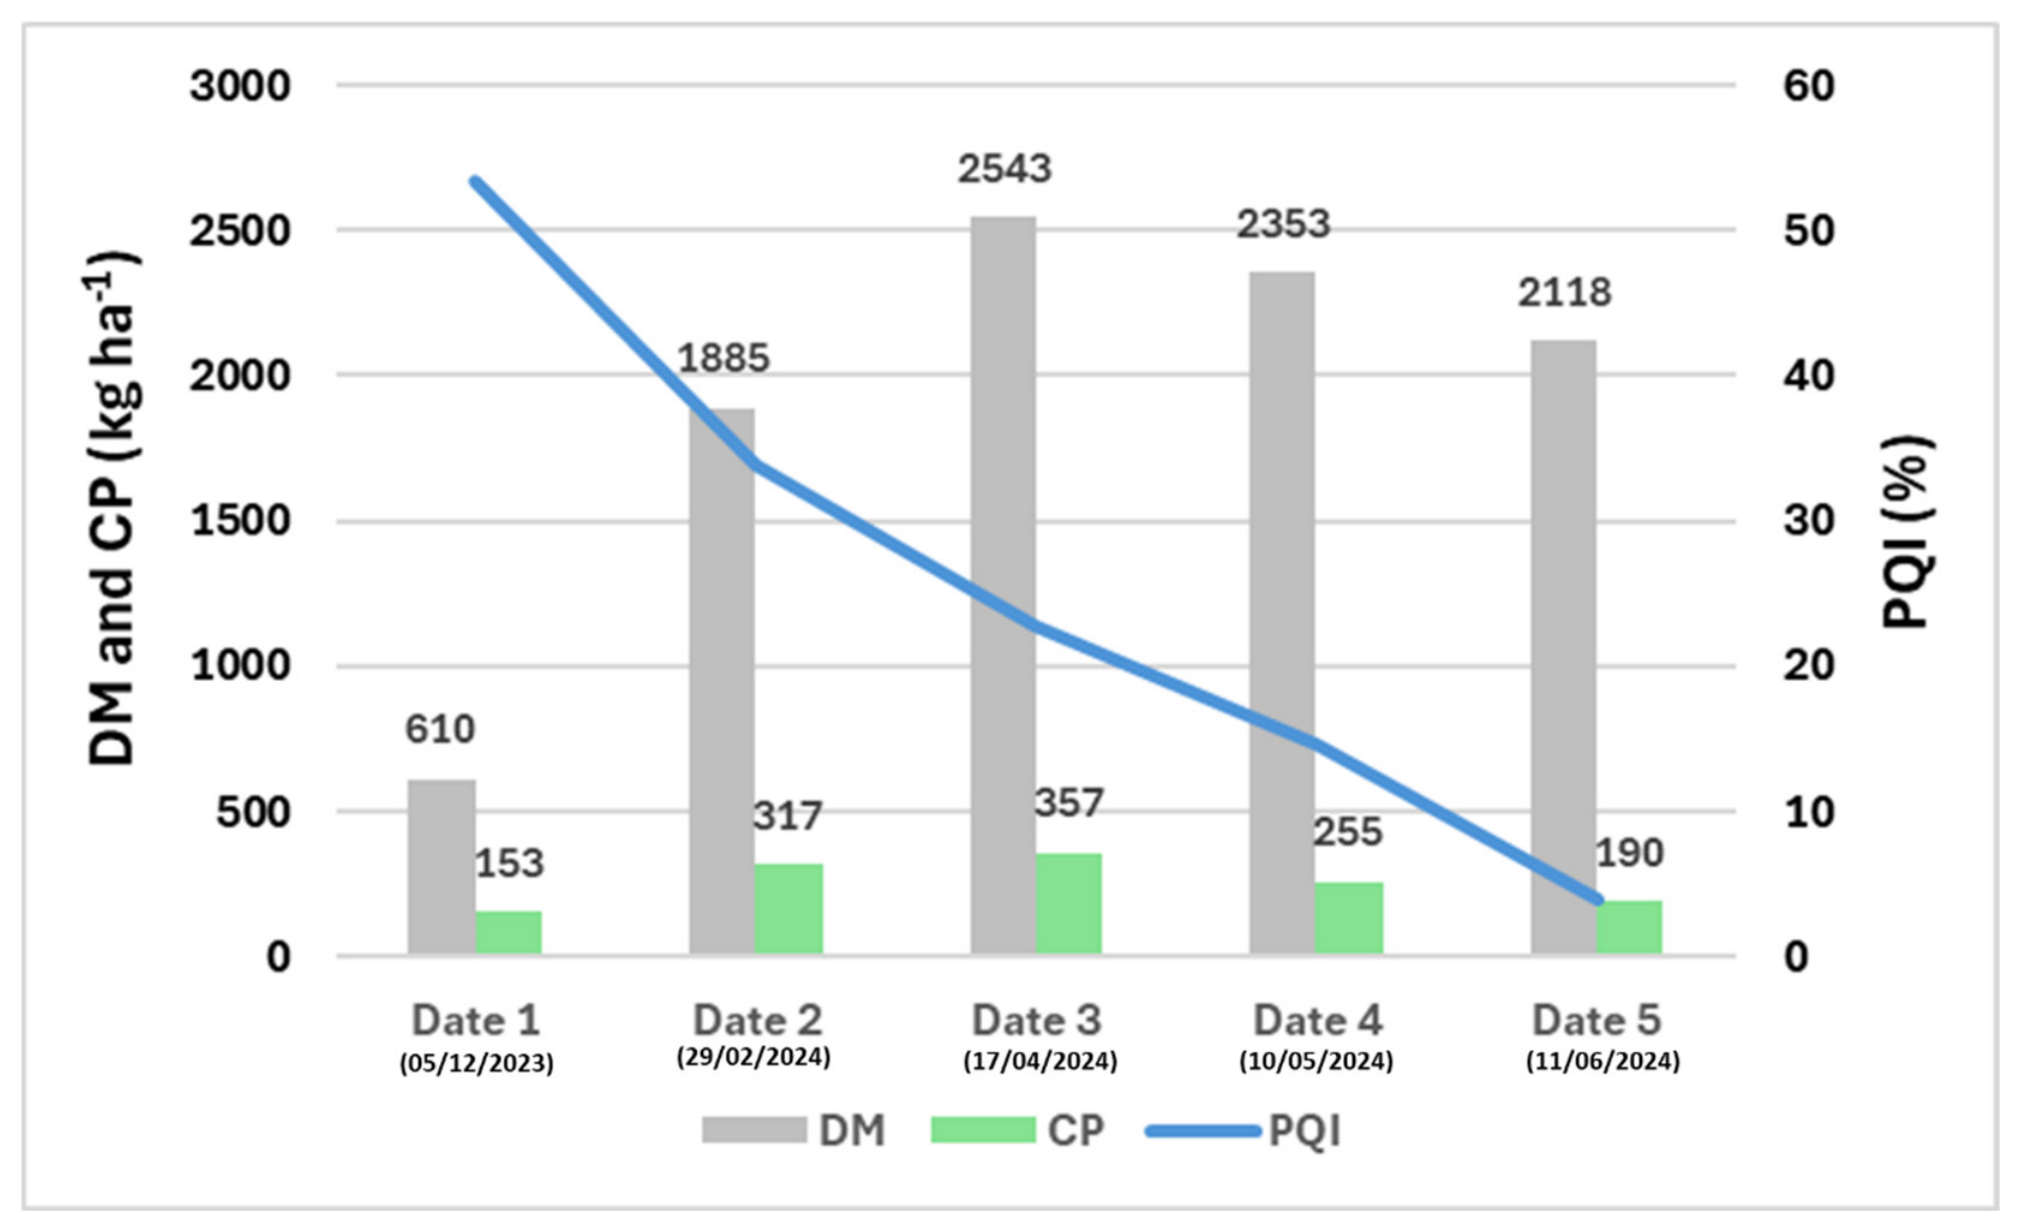
Figure 16.
Map of pasture quality index (PQI; in %) of the experimental field in 5 December 2023.
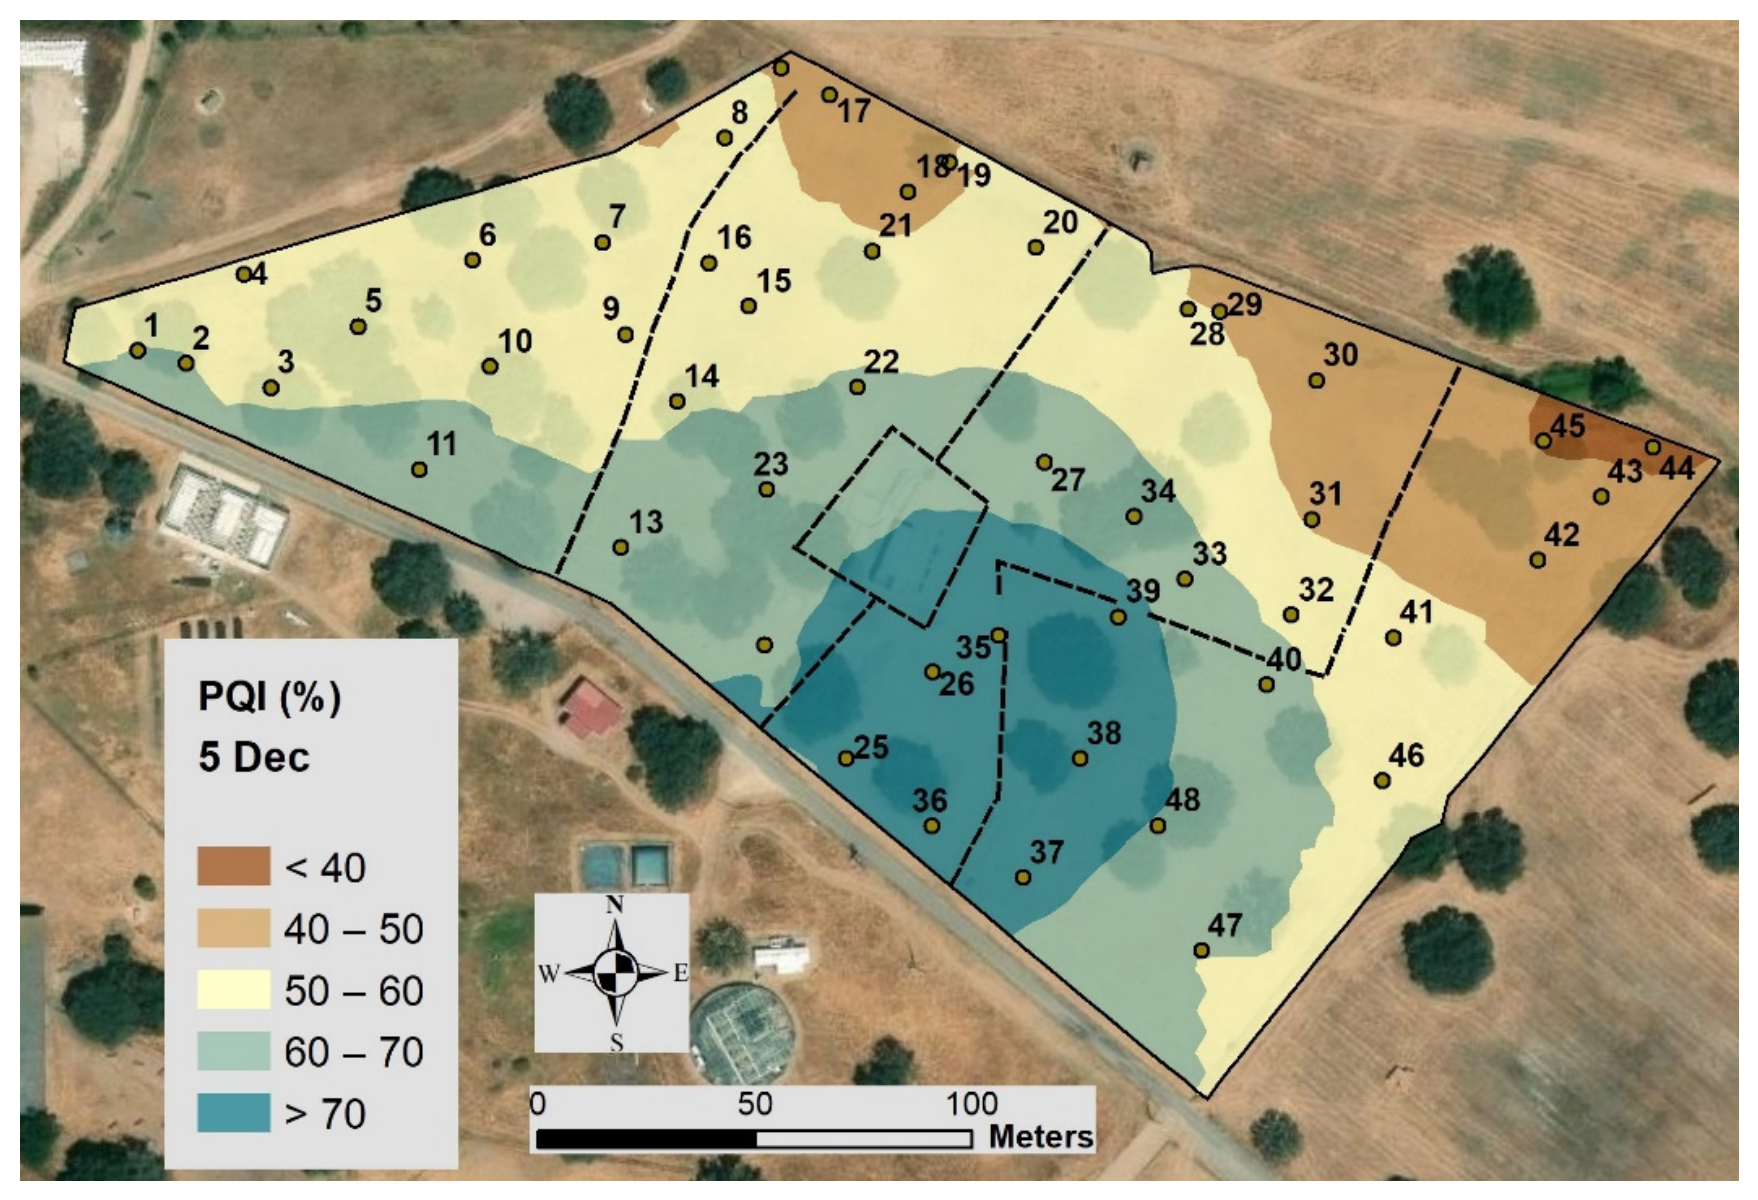
Figure 17.
Relation between pasture quality index (PQI) and grazing density (grazing preferences) in each date: February/March 2024 (a); April 2024 (b); May 2024 (c); and June 2024 (d). Pearson’s linear correlation coefficients (r), and the significance (p) are also indicated.
Figure 17.
Relation between pasture quality index (PQI) and grazing density (grazing preferences) in each date: February/March 2024 (a); April 2024 (b); May 2024 (c); and June 2024 (d). Pearson’s linear correlation coefficients (r), and the significance (p) are also indicated.
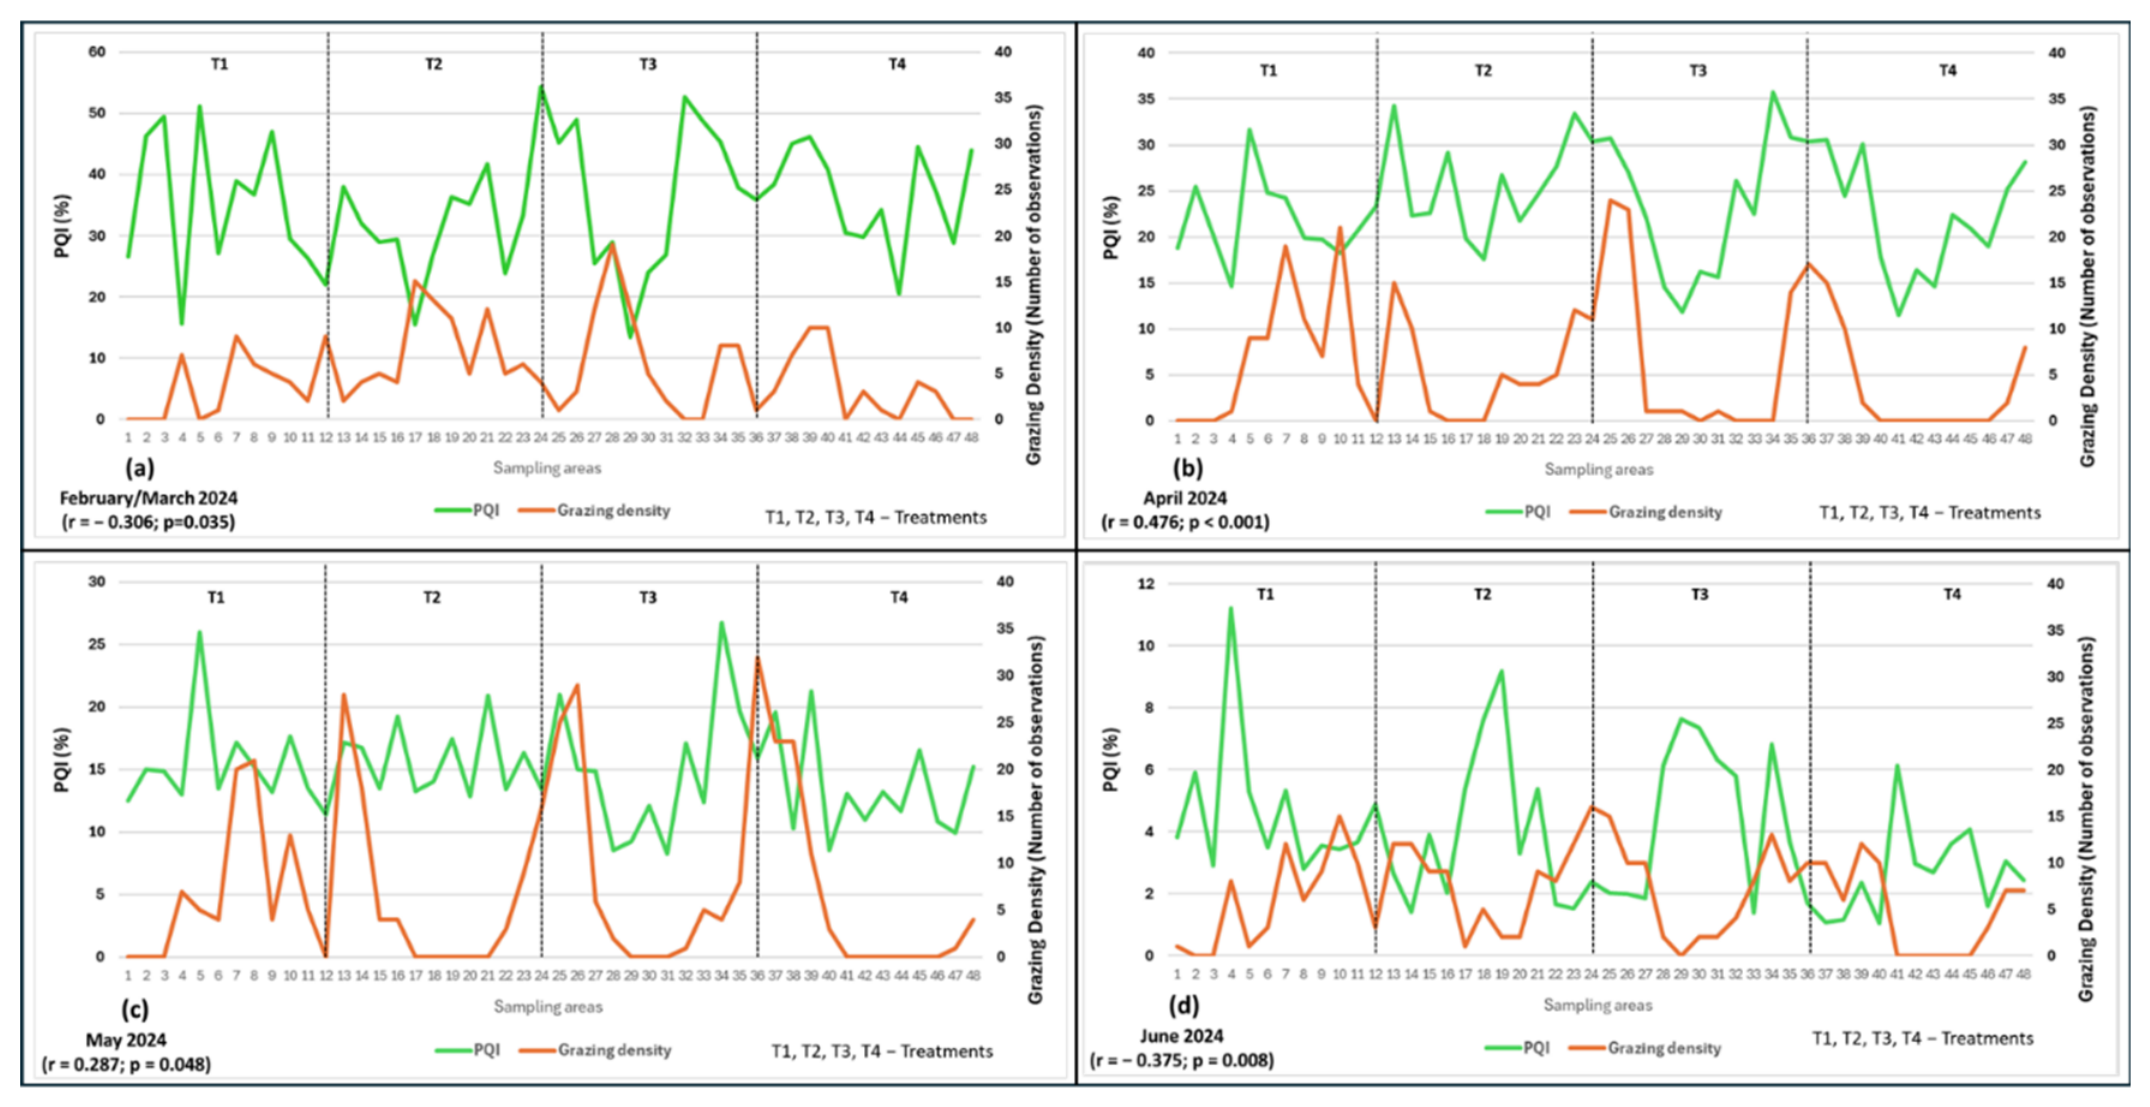
Figure 18.
Spatial correspondence between pasture quality index (PQI; (a)) and grazing density (grazing preferences; (b)) in February/March 2024.
Figure 18.
Spatial correspondence between pasture quality index (PQI; (a)) and grazing density (grazing preferences; (b)) in February/March 2024.
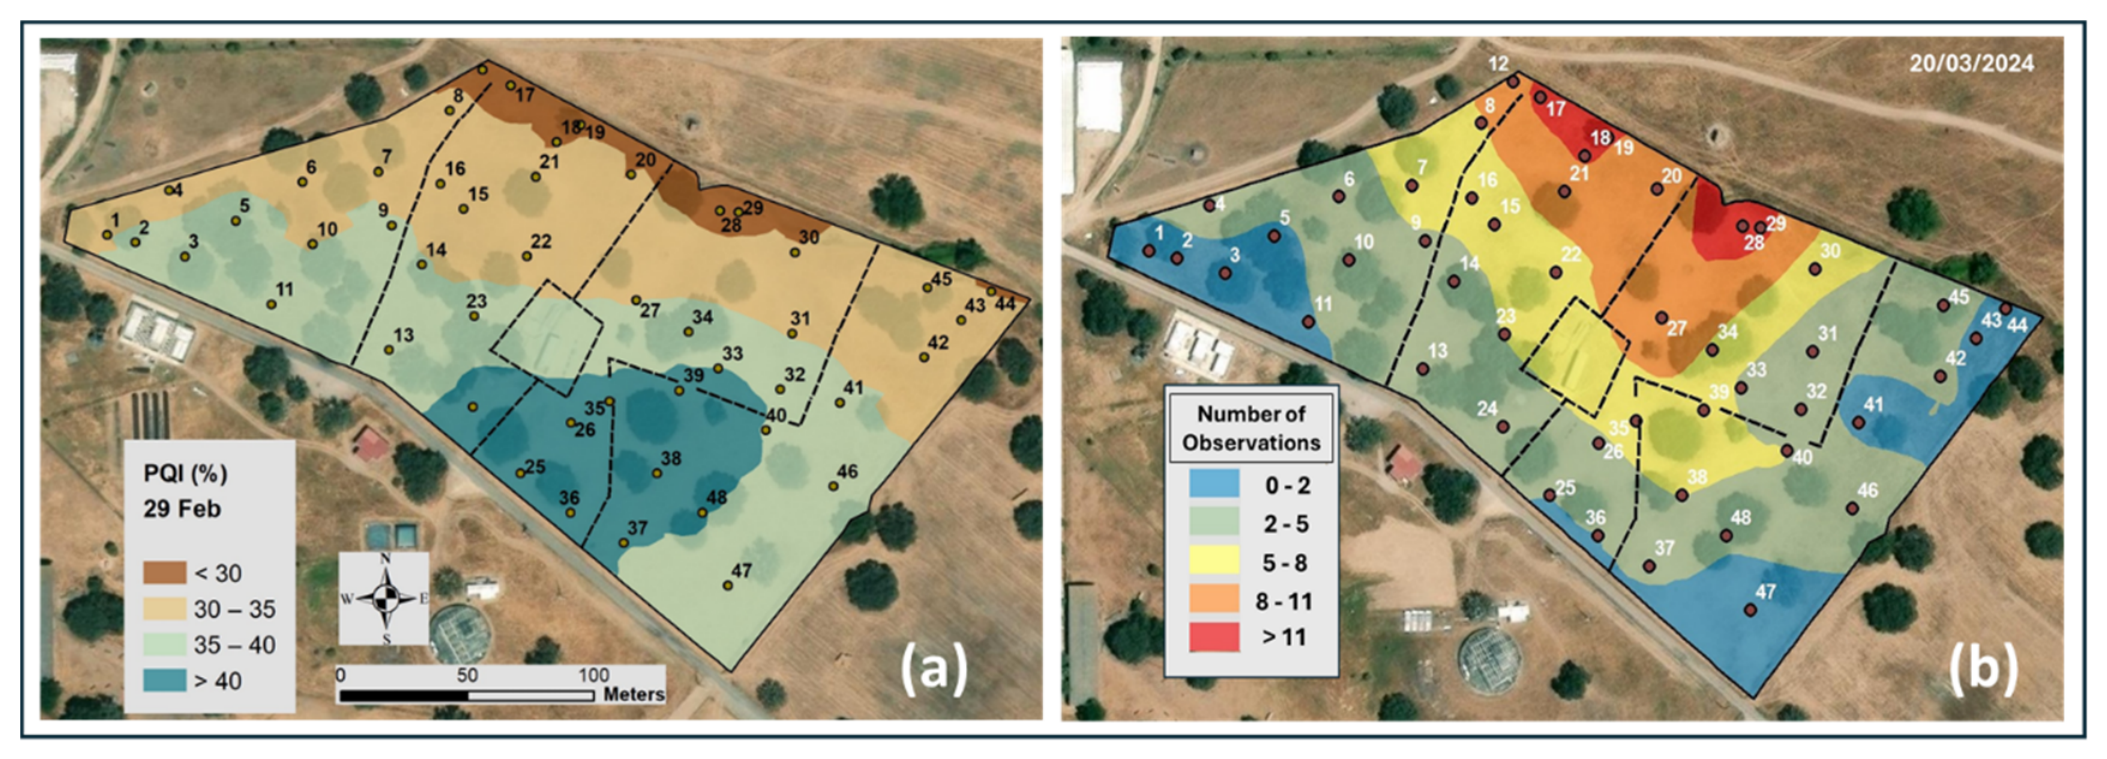
Figure 19.
Spatial correspondence between pasture quality index (PQI; (a)) and grazing density (grazing preferences; (b)) in April 2024.
Figure 19.
Spatial correspondence between pasture quality index (PQI; (a)) and grazing density (grazing preferences; (b)) in April 2024.
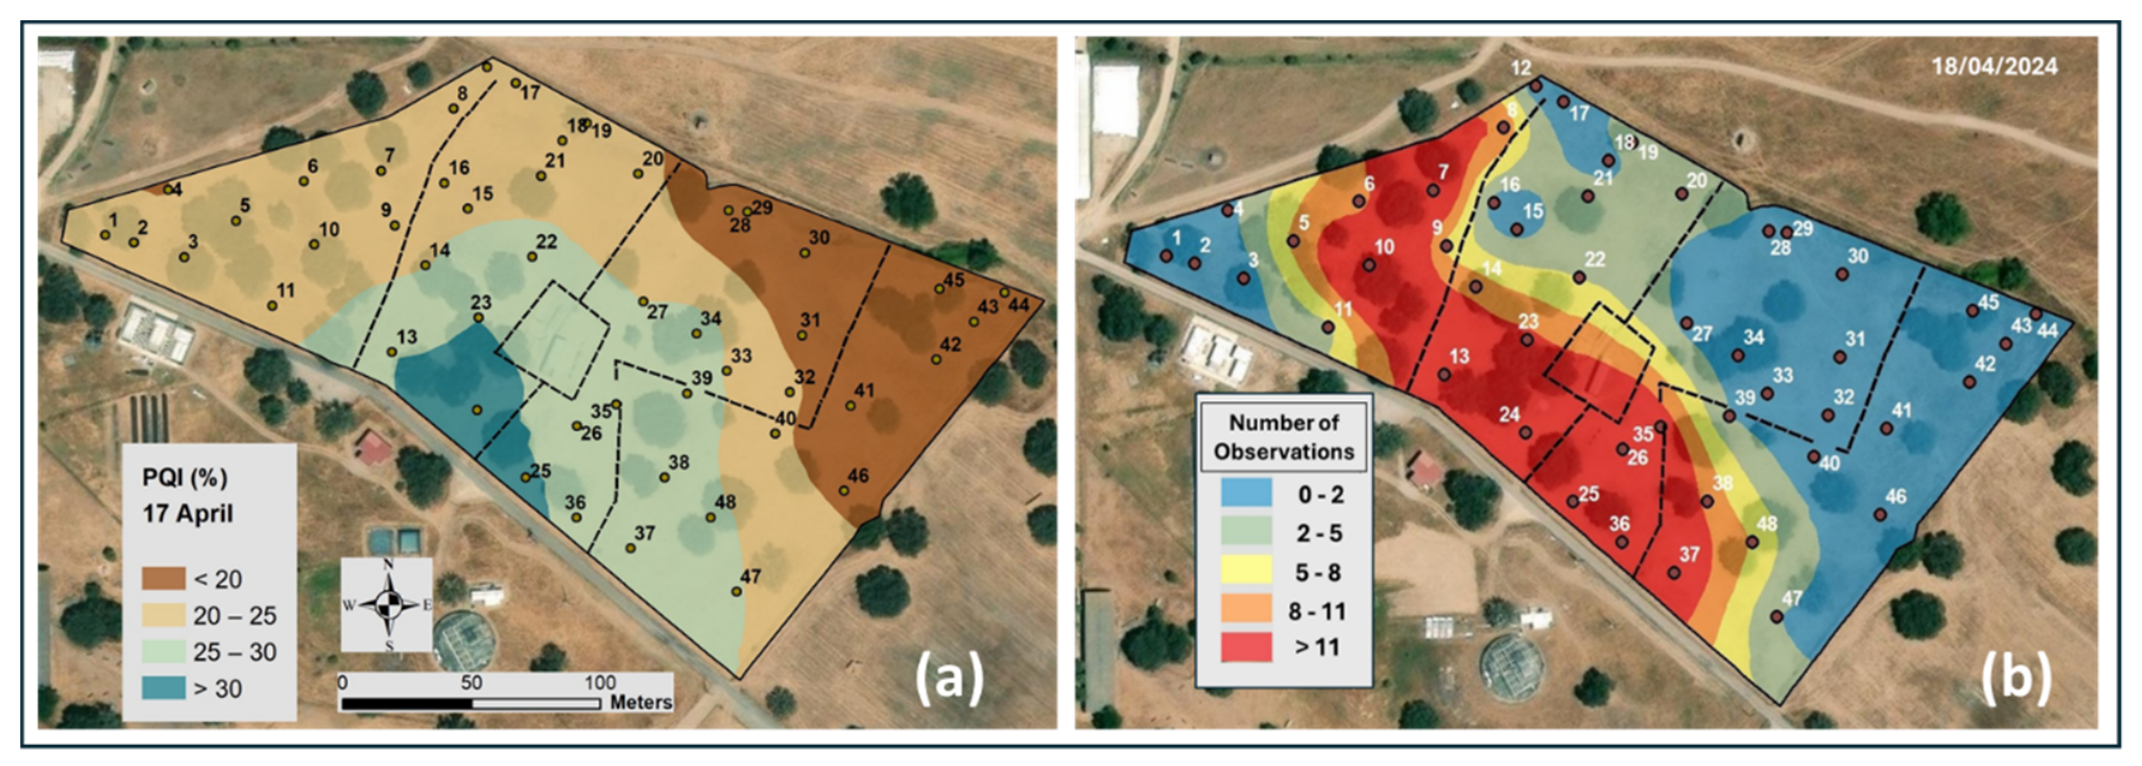
Figure 20.
Spatial correspondence between pasture quality index (PQI; (a)) and grazing density (grazing preferences; (b)) in May 2024.
Figure 20.
Spatial correspondence between pasture quality index (PQI; (a)) and grazing density (grazing preferences; (b)) in May 2024.
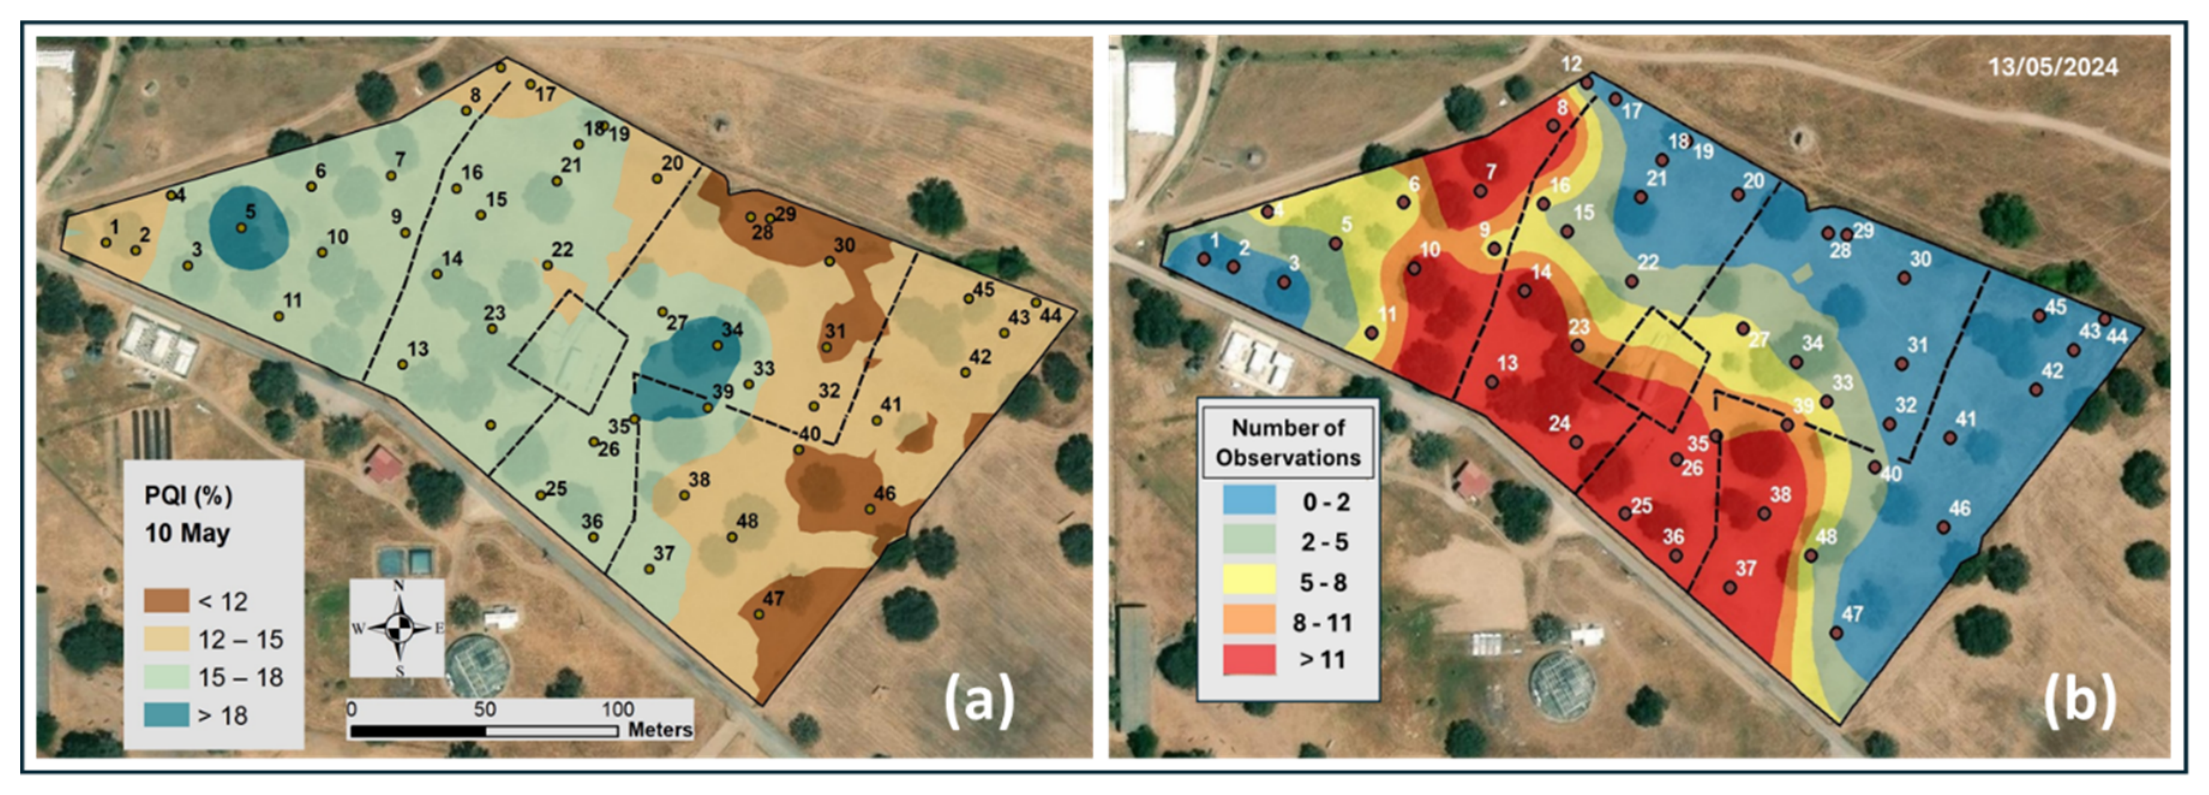
Figure 21.
Spatial correspondence between pasture quality index (PQI; (a)) and grazing density (grazing preferences; (b)) in June 2024.
Figure 21.
Spatial correspondence between pasture quality index (PQI; (a)) and grazing density (grazing preferences; (b)) in June 2024.
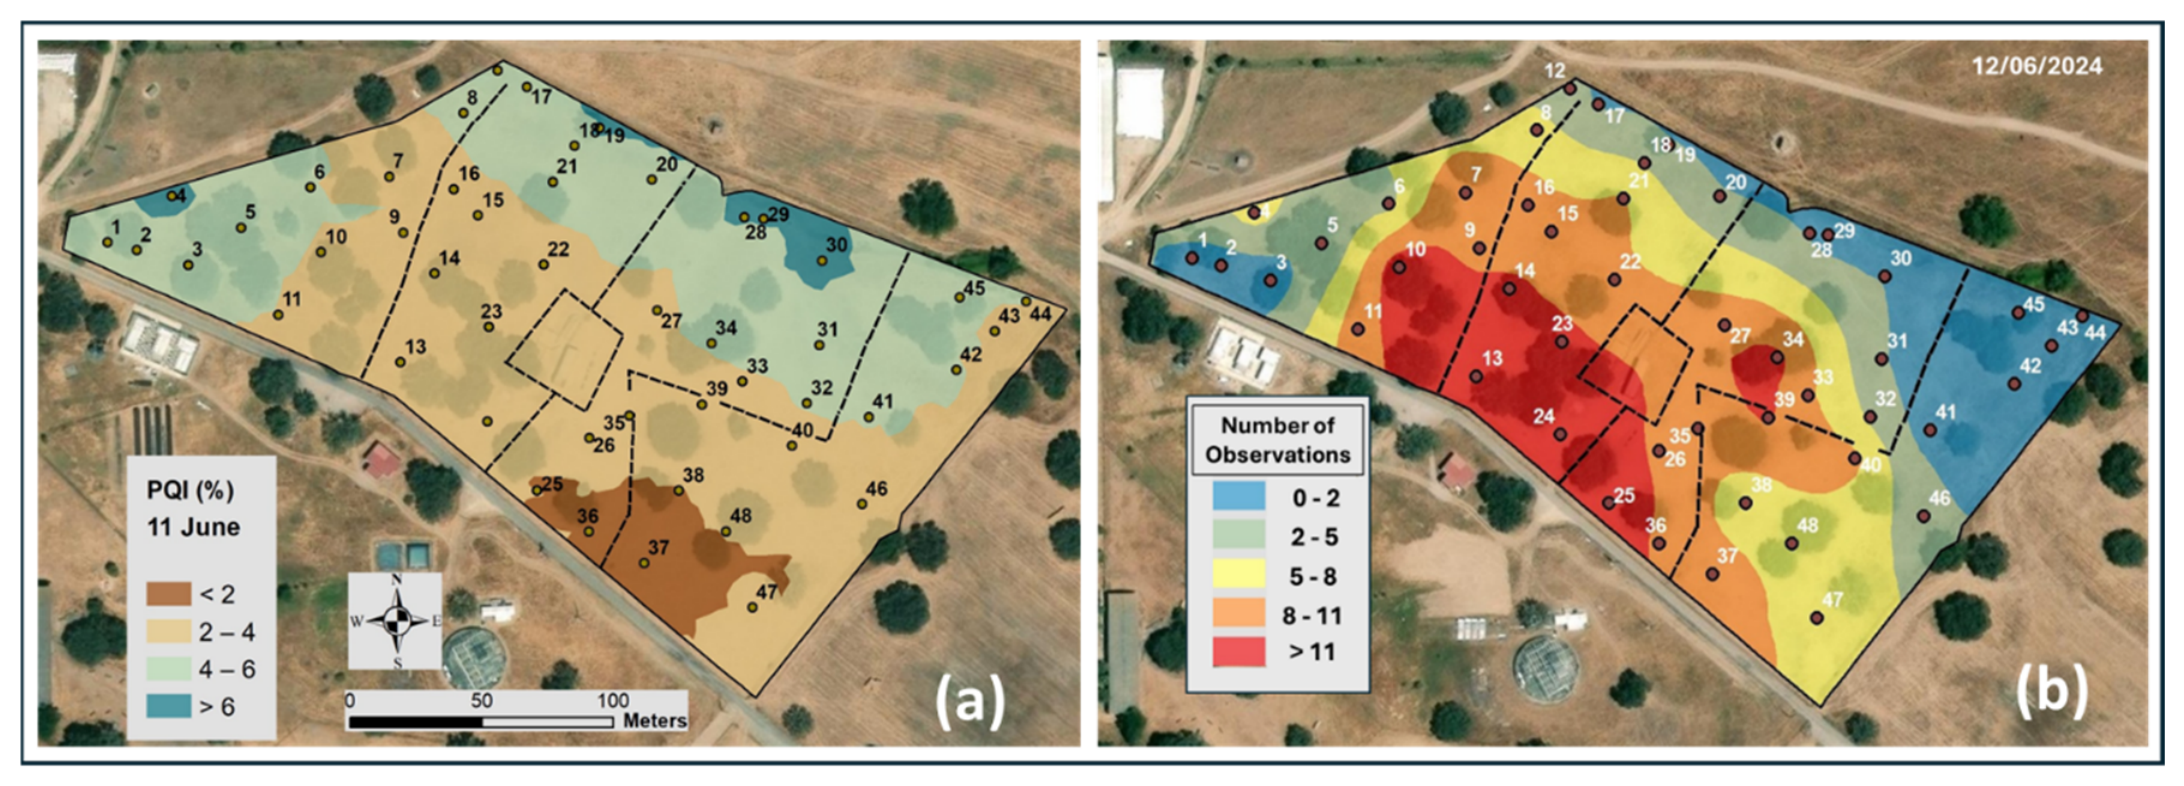
Figure 22.
Relation between grazing spatial patterns and pasture quality index (PQI): Influence of climatic parameters. *- Significant at the 0.05 level; **- Significant at the 0.01 level; ***- Significant at the 0.001 level.
Figure 22.
Relation between grazing spatial patterns and pasture quality index (PQI): Influence of climatic parameters. *- Significant at the 0.05 level; **- Significant at the 0.01 level; ***- Significant at the 0.001 level.
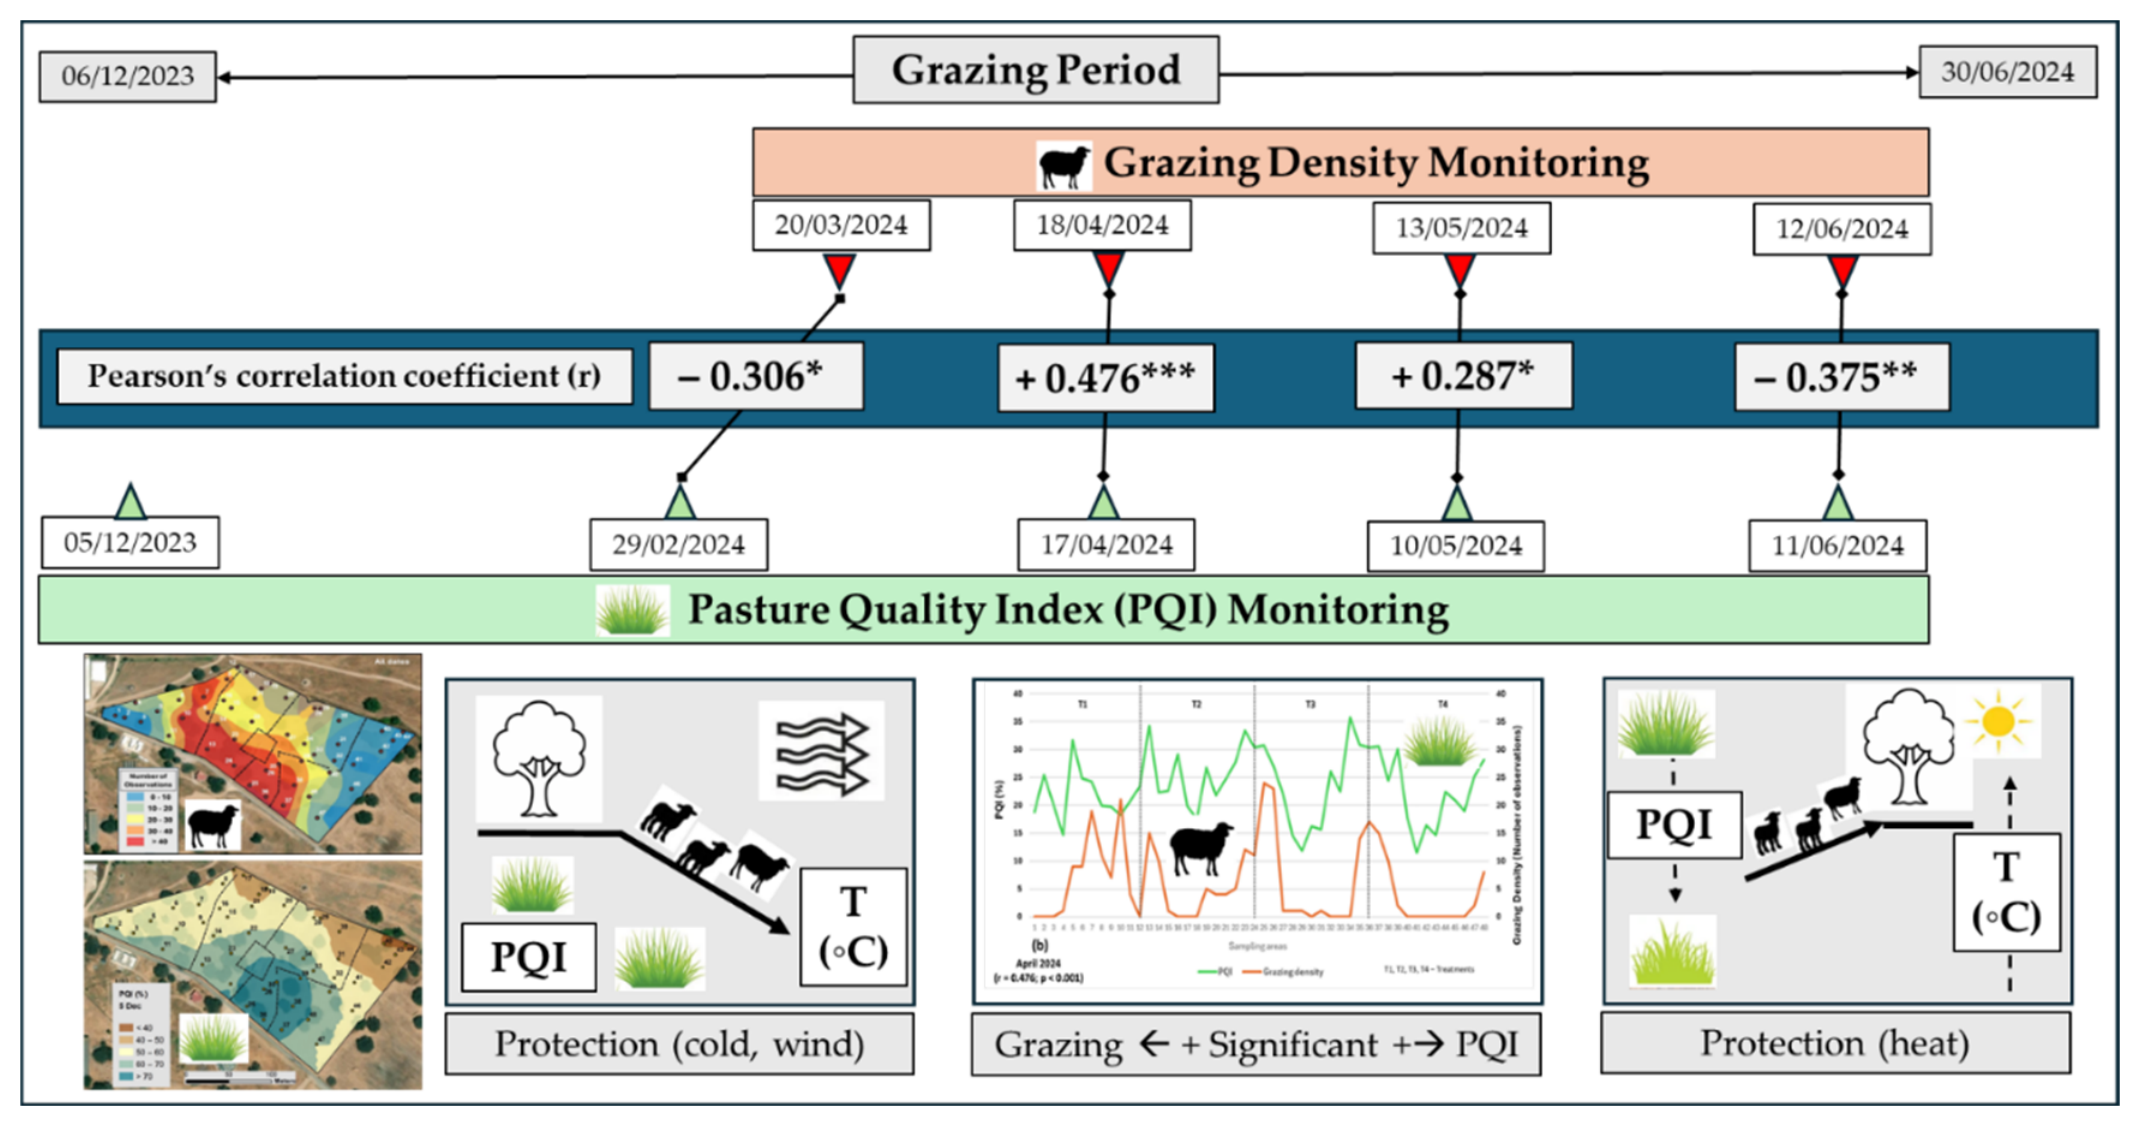
Figure 23.
Evolution of spatial grazing preferences between the early spring (March; (a)) and last spring (June; (b)).
Figure 23.
Evolution of spatial grazing preferences between the early spring (March; (a)) and last spring (June; (b)).
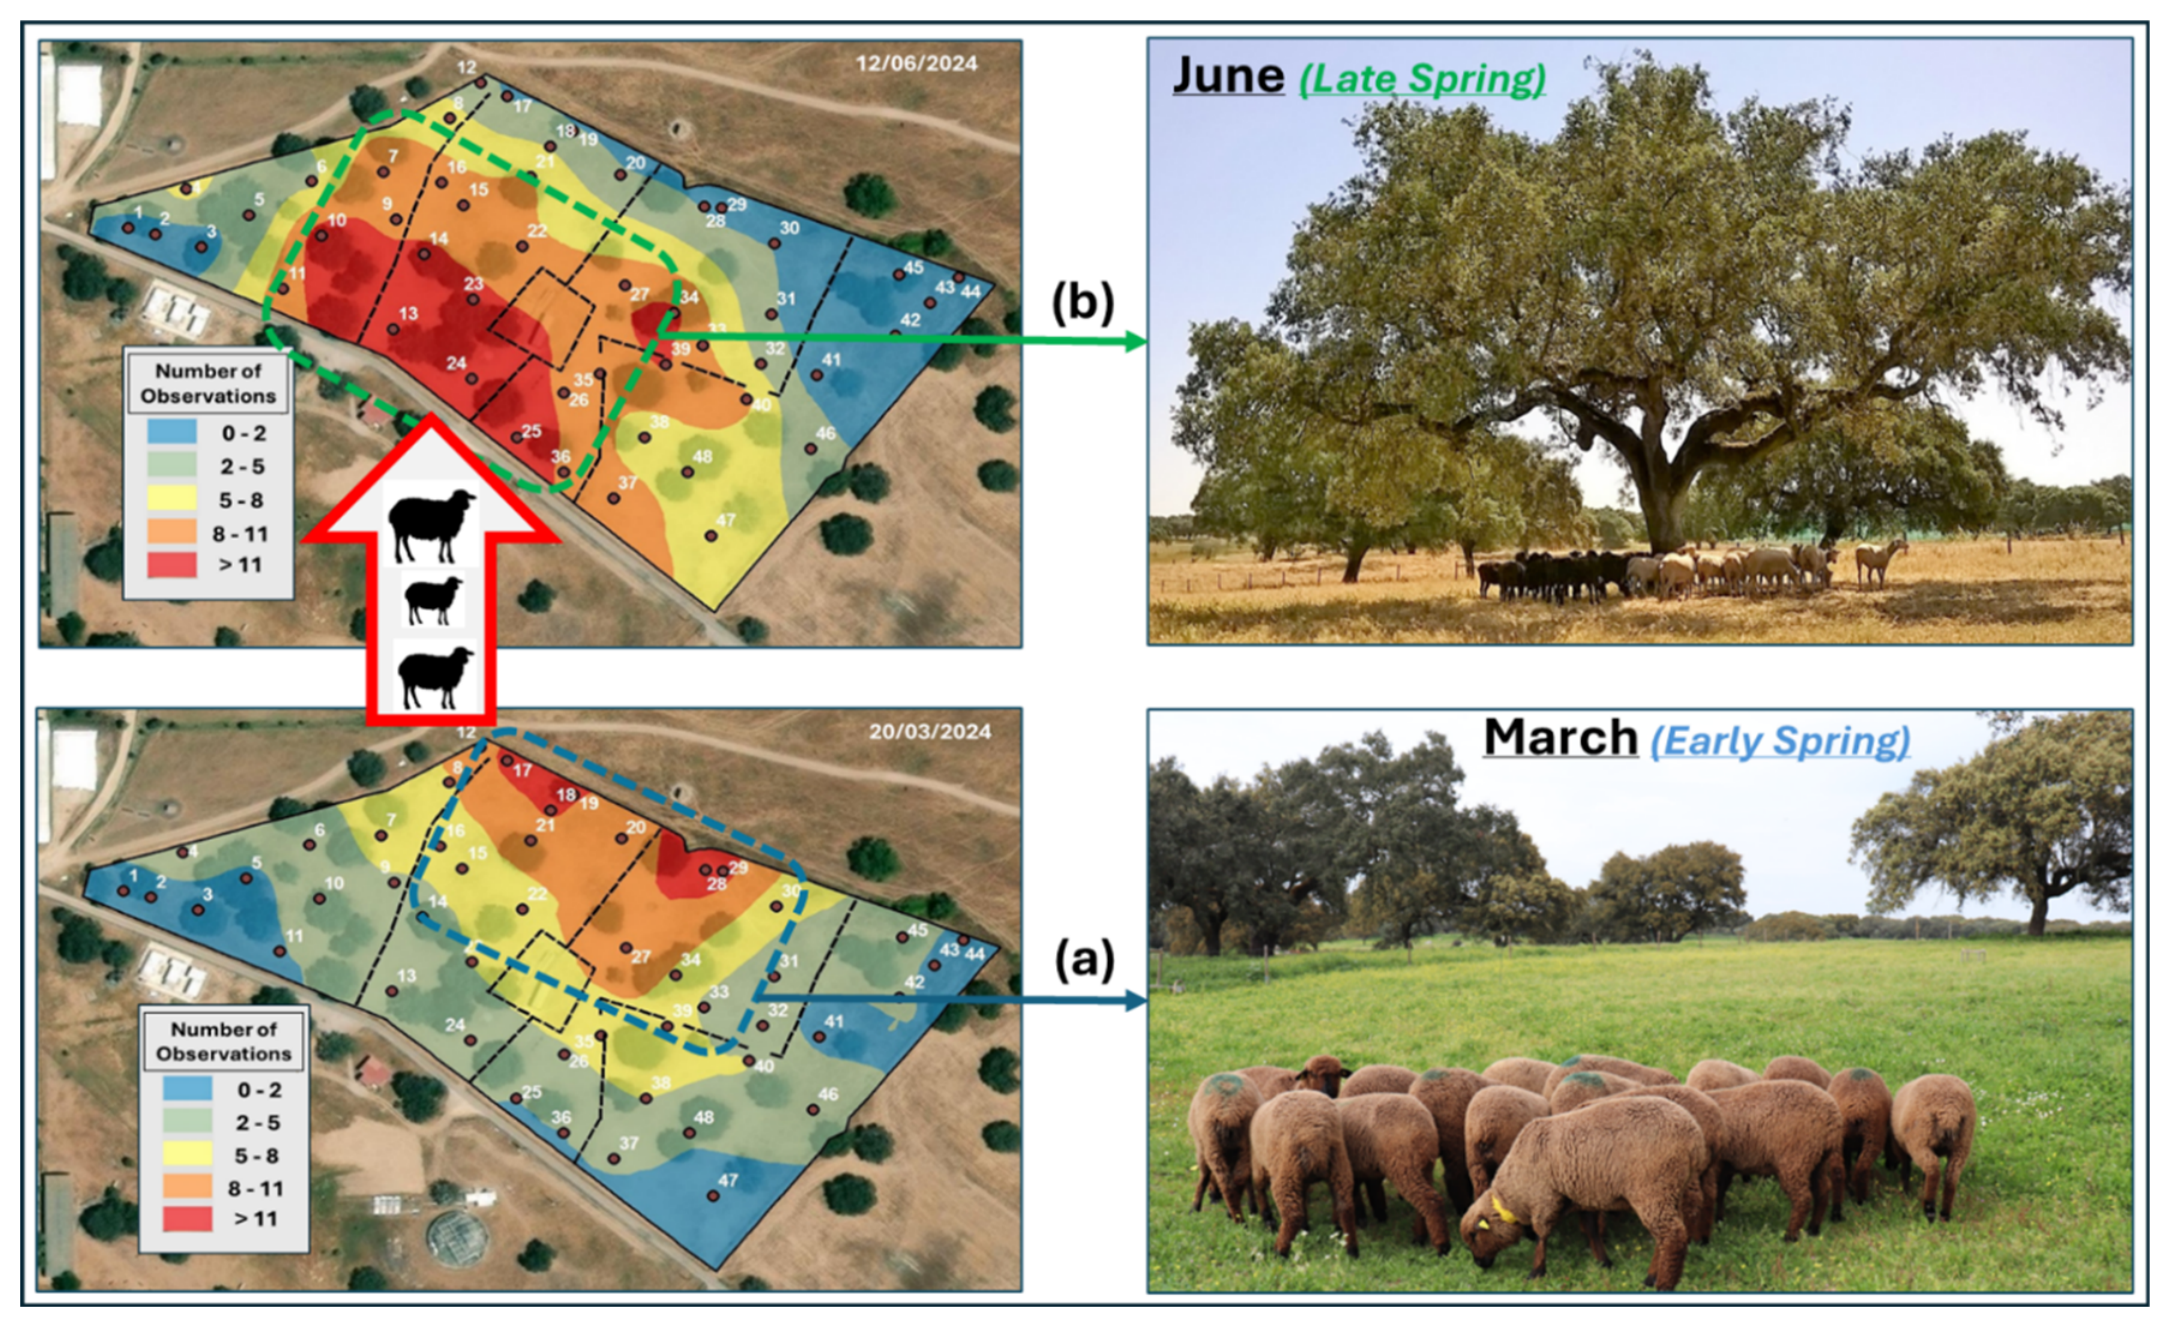

Table 1.
Soil parameters (mean ± standard deviation, SD and range), 0−30 cm depth, for each treatment in June 2023.
Table 1.
Soil parameters (mean ± standard deviation, SD and range), 0−30 cm depth, for each treatment in June 2023.
| Treatment | T1 | T2 | T3 | T4 | ||||
| Soil parameter | Mean±SD | Range | Mean±SD | Range | Mean±SD | Range | Mean±SD | Range |
| Sand (%) | 79.2±1.6 | 76.2−82.0 | 77.5±2.9 | 73.3−82.0 | 76.0±3.0 | 70.5−80.5 | 79.1±4.0 | 71.5−84.7 |
| Silt (%) | 11.0±1.4ab | 8.1−13.6 | 11.3±1.6ab | 8.2−14.5 | 13.0±2.5a | 9.8−18.6 | 10.7±2.1b | 7.7−14.3 |
| Clay (%) | 9.8±1.2 | 8.0−11.5 | 11.2±3.6 | 6.2−17.5 | 11.0±1.6 | 8.2−13.3 | 10.1±2.8 | 5.6−14.8 |
| OM (%) | 4.5±1.2a | 2.5−6.5 | 3.5±0.6b | 2.7−4.5 | 3.0±0.4b | 2.3−3.8 | 3.9±1.0ab | 2.6−6.7 |
| pH | 5.5±0.2b | 5.2−5.8 | 5.5±0.2b | 5.2−5.8 | 6.1±0.4a | 5.3−6.7 | 5.9±0.4a | 5.1−6.4 |
| P2O5 (mg kg-1) | 90.7±39.8a | 45.2−165.3 | 50.3±22.1b | 22.0−107.3 | 45.3±27.7b | 15.0−98.4 | 63.8±38.9ab | 20.9−156.9 |
| K2O (mg kg-1) | 89.9±62.1 | 7.5−214.0 | 100.8±65.1 | 25.9−203.4 | 94.8±67.0 | 26.8−230.0 | 129.5±69.2 | 40.2−257.0 |
| Mg (mg kg-1) | 95.8±25.8 | 60.0−145.0 | 90.8±26.9 | 60.0−130.0 | 110.4±29.6 | 75.0−190.0 | 101.7±45.6 | 15.0−185.0 |
| Mn (mg kg-1) | 39.7±13.4ab | 22.6−70.0 | 26.7±9.5b | 13.5−46.0 | 64.6±32.3a | 21.2−124.0 | 67.5±40.5a | 10.6−118.0 |
| SEB (cmol kg-1) | 2.14±1.52b | 0.89−4.71 | 3.42±1.71b | 0.95−6.39 | 5.63±0.87a | 4.70−7.85 | 5.45±1.73a | 3.02−8.78 |
| CEC (cmol kg-1) | 11.97±8.69a | 4.93−30.58 | 6.60±1.40b | 4.41−9.34 | 5.74±0.77b | 4.80−7.24 | 5.88±1.07b | 4.46−8.18 |
| DBS (%) | 26.1±8.2c | 16.1−38.5 | 58.0±28.4b | 22.4−104.1 | 99.6±18.3a | 65.3−135.1 | 92.6±22.1a | 46.8−130.8 |
T1, T2, T3 and T4- Experimental treatments; WDL- Without dolomitic limestone application; DL- With dolomitic limestone application; LSR- Low stocking rate; HSR- High stocking rate; OM- Organic matter; P2O5- Phosphorus; K2O- Potassium; Mg- Magnesium; Mn- Manganese; SEB- Sum of the exchange bases; CEC- Cationic exchange capacity; DBS- Degree of base saturation; Different letters indicate significant differences between groups according to the Tukey/Dunnett/Kruskal-Wallis test (p < 0.05).
Table 2.
Matrix of Baker’s distances between treatments.
| Treatments | T1 | T2 | T3 | T4 |
| T1 | 0.000 | 0.702 | 0.877 | 0.785 |
| T2 | 0.702 | 0.000 | 1.022 | 0.869 |
| T3 | 0.877 | 1.022 | 0.000 | 0.792 |
| T4 | 0.785 | 0.869 | 0.792 | 0.000 |
Table 3.
Mean of pasture parameters in five dates of the 2023/2024 vegetative cycle, and in each treatment.
Table 3.
Mean of pasture parameters in five dates of the 2023/2024 vegetative cycle, and in each treatment.
|
Date and Treatment |
GM (kg ha-1) |
DM (kg ha-1) |
PMC (%) |
CP (%) |
CP (kg ha-1) |
NDF (%) |
NDF (kg ha-1) |
| 05/12/2023 | |||||||
| T1 | 5371.1±2633.1 | 491.4±158.6 | 90.0±2.7 | 25.0±4.3 | 125.6±52.3 | 39.0±7.2 | 186.5±49.5 |
| T2 | 3970.8±1565.7 | 482.5±172.9 | 87.1±3.9 | 21.9±4.9 | 104.5±37.9 | 43.2±9.8 | 210.1±102.9 |
| T3 | 7632.8±5200.2 | 688.9±304.2 | 89.7±2.4 | 25.7±5.6 | 188.8±117.4 | 40.4±7.9 | 267.7±96.7 |
| T4 | 8041.4±5434.5 | 775.3±429.9 | 89.1±3.4 | 24.7±6.0 | 192.4±104.6 | 40.3±9.3 | 299.8±162.2 |
| 29/02/2024 | |||||||
| T1 | 13016.7±6562.8ab | 1861.4±831.3ab | 84.9±3.2 | 14.3±3.7 | 264.0±127.3ab | 36.6±6.0b | 670.0±319.7ab |
| T2 | 8520.3±3924.4b | 1318.6±392.6b | 83.5±2.7 | 16.1±3.0 | 220.4±102.0b | 42.2±5.8ab | 552.1±176.5b |
| T3 | 14435.0±7682.9ab | 2073.1±754.9ab | 84.2±3.9 | 17.0±3.7 | 365.7±182.1ab | 41.7±6.7ab | 859.6±322.1ab |
| T4 | 17052.8±7302.4a | 2288.9±769.2a | 85.8±2.7 | 18.1±3.2 | 418.8±158.0a | 43.0±3.5a | 972.7±313.2a |
| 17/04/2024 | |||||||
| T1 | 10636.1±4491.5b | 1988.9±842.6b | 80.9±2.7 | 13.2±1.7 | 258.1±104.8b | 49.7±5.1 | 982.2±437.1b |
| T2 | 10791.7±2892.5b | 1983.3±569.7b | 81.3±3.0 | 15.3±2.4 | 305.9±110.8b | 48.8±4.5 | 965.5±277.8b |
| T3 | 13358.3±5100.8ab | 2725.0±912.2ab | 79.0±3.4 | 14.0±3.5 | 398.4±196.0ab | 47.8±4.5 | 1301.0±433.9b |
| T4 | 17302.8±3825.4a | 3475.0±940.6a | 79.7±4.5 | 13.7±2.3 | 466.7±121.0a | 51.8±6.9 | 1834.6±658.3a |
| 10/05/2024 | |||||||
| T1 | 8614.7±3963.5ab | 2277.8±1019.4ab | 73.4±3.2 | 10.7±1.2 | 243.5±111.4ab | 53.0±7.0 | 1231.9±608.9ab |
| T2 | 6520.3±2264.2b | 1894.5±566.9b | 69.8±6.6 | 11.4±1.6 | 211.5±55.9b | 50.7±3.4 | 968.2±309.8b |
| T3 | 6370.6±2115.7b | 1911.1±613.7b | 69.5±5.3 | 11.0±3.0 | 207.9±86.1b | 51.9±5.0 | 996.7±332.0b |
| T4 | 11473.6±7270.0a | 3327.8±1422.2a | 66.7±9.7 | 10.8±1.3 | 355.5±150.7a | 54.7±4.4 | 1853.1±877.0a |
| 11/06/2024 | |||||||
| T1 | 4155.6±1574.4a | 2674.4±985.4ab | 34.4±12.4 | 8.1±2.1b | 208.4±63.1ab | 59.6±4.6 | 1608.6±660.4a |
| T2 | 2491.4±2300.9ab | 1499.7±711.6bc | 27.3±16.5 | 8.7±2.8ab | 126.0±61.1b | 61.8±2.8 | 921.7±432.0b |
| T3 | 1726.7±1139.8b | 1333.9±844.5c | 25.8±14.6 | 11.3±2.7a | 148.5±98.5b | 63.9±5.2 | 842.0±532.3b |
| T4 | 3969.2±2630.4a | 2964.2±1567.9a | 18.6±11.7 | 9.4±3.4ab | 276.1±181.4a | 62.9±4.1 | 1904.5±1089.7a |
GM- Green matter; DM- Dry matter; PMC- Pasture moisture content; CP- Crude protein; NDF- Neutral Detergent Fiber; T1, T2, T3 and T4- Experimental treatments. Means in the same column followed by different letters indicate significant differences (p<0.05).
Table 4.
Slope (on a logarithmic scale) of the relationship between pasture quality index (PQI) and grazing density according to the mixed model.
Table 4.
Slope (on a logarithmic scale) of the relationship between pasture quality index (PQI) and grazing density according to the mixed model.
| Date | Slope (log) | Conf. Int. (95%) | p-value (individual) | Significance |
| February/March | -0.031 | [-0.058 to -0.004] | 0.027 | Yes (negative) |
| April | 0.028 | [0.012 to 0.044] | 0.001 | Yes (positive) |
| May | 0.011 | [-0.003 to -0.025] | 0.126 | ns |
| June | -0.039 | [-0.112 to 0.034] | 0.295 | ns |
Conf. Int.- Confidence interval; ns- Not significant.
Disclaimer/Publisher’s Note: The statements, opinions and data contained in all publications are solely those of the individual author(s) and contributor(s) and not of MDPI and/or the editor(s). MDPI and/or the editor(s) disclaim responsibility for any injury to people or property resulting from any ideas, methods, instructions or products referred to in the content. |
© 2026 by the authors. Licensee MDPI, Basel, Switzerland. This article is an open access article distributed under the terms and conditions of the Creative Commons Attribution (CC BY) license (http://creativecommons.org/licenses/by/4.0/).
Copyright: This open access article is published under a Creative Commons CC BY 4.0 license, which permit the free download, distribution, and reuse, provided that the author and preprint are cited in any reuse.


