
Submitted:
02 July 2026
Posted:
03 July 2026
You are already at the latest version
Abstract
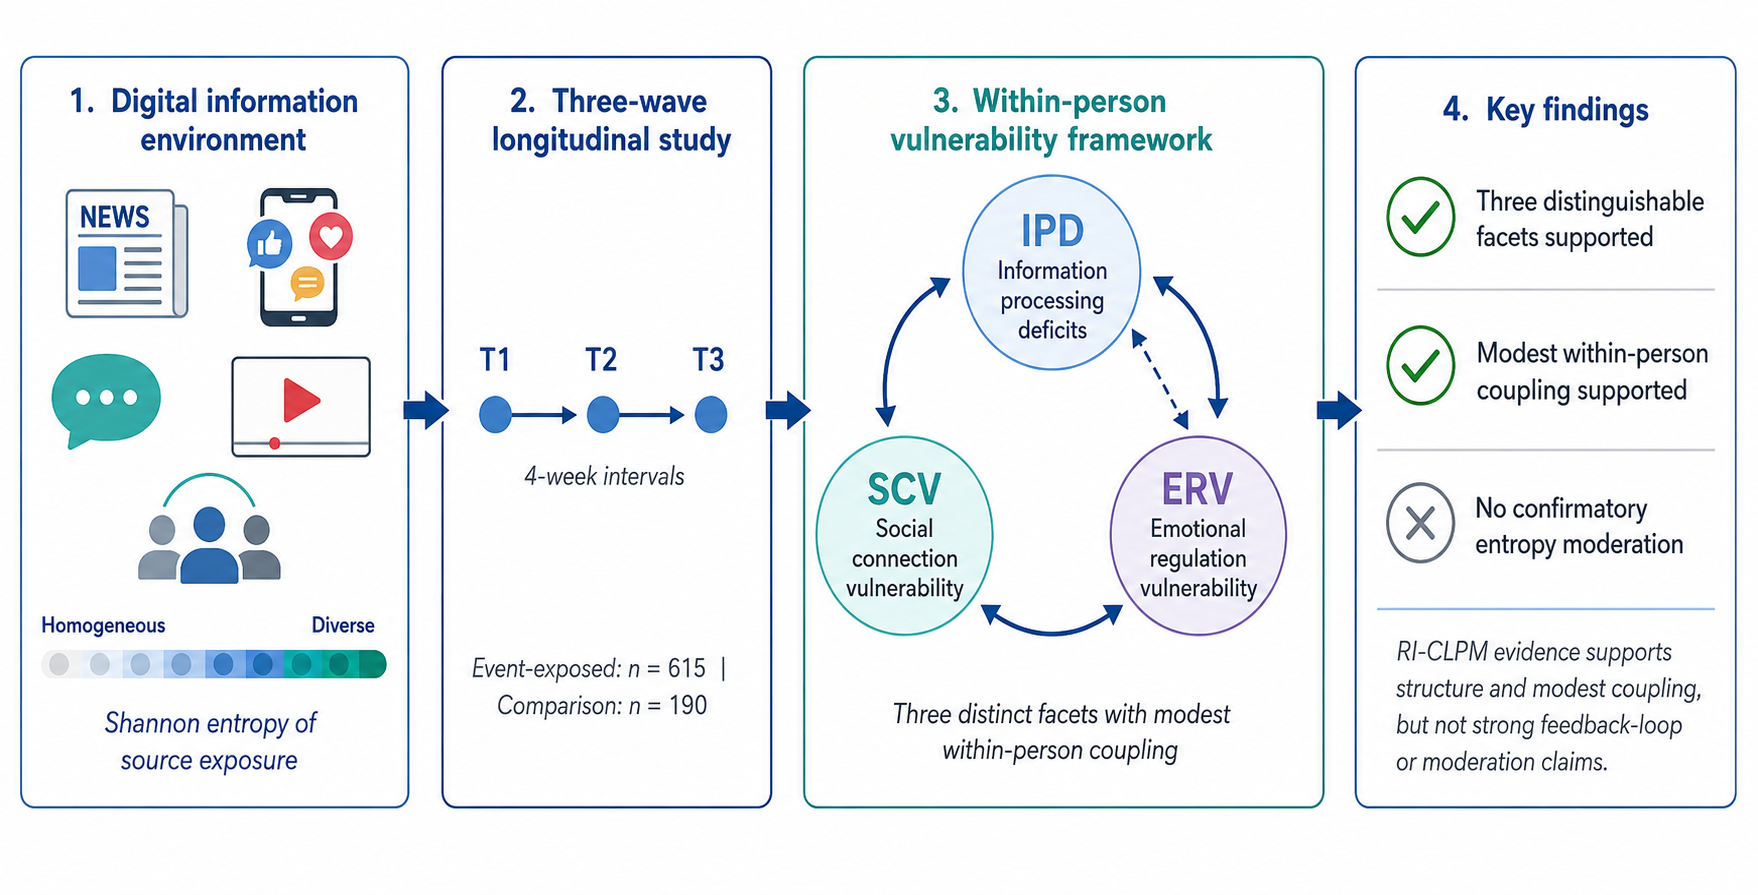
In information-saturated digital environments, students' vulnerabilities in information processing, emotion regulation, and social connection may fluctuate together within individuals, yet the role of information-environment homogeneity remains uncertain. Using a three-wave design with four-week intervals, we surveyed 615 students from two mainland Chinese universities that experienced qualifying campus public-discussion events and 190 comparison students from a third university. Analyses combined measurement modeling, RI-CLPM, latent growth modeling, and exploratory moderation tests using Shannon entropy of information-source exposure. A three-factor parcel-level model outperformed one- and two-factor alternatives. The RI-CLPM showed modest within-person coupling along all three primary paths after false discovery rate correction, but the IPD-ERV association was bidirectional, with the reverse ERV→IPD path numerically larger at the post-event lag. The linear three-wave LGCM indicated descriptive co-movement among growth indices but showed elevated RMSEA; H3 is therefore not interpreted as evidence of a well-fitting growth model. Neither global nor path-specific environmental moderation was supported. The SCV→IPD entropy interaction was directionally consistent but non-significant. Overall, the data support a distinguishable three-facet structure and modest within-person coupling, but not a strong ordered feedback loop, a well-fitting linear growth process, or confirmatory moderation by information-environment homogeneity.
Keywords:
cognitive vulnerability
; information processing
; emotion regulation
; social connection
; random-intercept cross-lagged panel model
; information environment
; Shannon entropy
; path-specific moderation
; longitudinal study
1. Introduction
Information-saturated digital environments expose students to misinformation, algorithmically amplified content, and rapid social circulation, creating conditions in which cognitive, affective, and social-information vulnerabilities may become behaviorally consequential (Allcott et al., 2019; Aral & Eckles, 2019; Bak-Coleman et al., 2021; Brady et al., 2020; Ecker et al., 2022; Lazer et al., 2018; Lorenz-Spreen et al., 2020; Vosoughi et al., 2018). Understanding these risks requires moving beyond unidimensional measures toward a framework that links how individuals evaluate information, regulate affect, and access heterogeneous social-information inputs. The present study treats such assessment as research-stage theory development rather than as a validated screening or management protocol.
Prior work offers two partly separate traditions. Psychological research emphasizes analytic reasoning, cognitive vulnerability, emotion regulation, and susceptibility to misinformation (Bago et al., 2020; Beck, 1976; Gross, 2015; Pennycook & Rand, 2019, 2021). Communication research emphasizes information environments, including selective exposure, network homophily, echo chambers, and algorithmic curation (Bakshy et al., 2015; Cinelli et al., 2021; Garrett, 2009; Pariser, 2011; Stroud, 2008; Thorson & Wells, 2016). Inoculation research connects these traditions (Lewandowsky & van der Linden, 2021; Roozenbeek et al., 2022), but few longitudinal studies test whether cognitive, affective, and social-information vulnerabilities are dynamically coupled within persons.
This gap motivates three requirements: a multidimensional framework bridging psychology and communication science, a longitudinal model separating stable between-person differences from within-person change, and an environmental indicator that can be tested as either a global moderator or a path-specific moderator of the SCV→IPD association.
1.1. A Three-Dimensional Framework of Cognitive Vulnerability
We distinguish three facets. Information processing deficits (IPD) capture limited analytic evaluation of information claims, drawing on dual-process and misinformation-susceptibility research (Kahneman, 2011; Pennycook & Rand, 2019). Emotional regulation vulnerability (ERV) captures difficulty regulating affective responses to information stimuli, consistent with process models of emotion regulation and findings on emotion-driven misinformation belief (Gross, 2015; Martel et al., 2020; Van Bavel & Pereira, 2018). Social connection vulnerability (SCV) captures restricted access to heterogeneous interpersonal and social-informational inputs, drawing on work on filter bubbles, homophily, curated flows, complex contagions, and diverse exposure (Bakshy et al., 2015; Barberá, 2015; Barberá et al., 2015; Centola, 2018; Cinelli et al., 2021; Thorson & Wells, 2016). A network-theoretic view further motivates treating these facets as distinct but coupled components rather than as a single latent trait (Borsboom, 2017).
The three facets are conceptually non-substitutable: evaluation capacity, affective regulation, and social-information diversity enter different points in the chain connecting incoming claims to later beliefs and actions. The relations among them are also plausibly directional. Faulty evaluation may trigger avoidable affective reactions; affective dysregulation may shape social interaction and exposure choices; and homogeneous social-information input may reduce corrective feedback that would improve later information processing. We therefore specified the primary path set IPD→ERV→SCV→IPD, while allowing reverse paths, especially the bidirectional IPD-ERV association, to be estimated rather than assumed away.
This framework is a working organizing model for longitudinal testing, not a finalized theory. Figure 1 summarizes the model and its empirical revision.
Figure 1.
The three-dimensional framework of cognitive vulnerability (DIM-CV). Note. IPD = information processing deficits; ERV = emotional regulation vulnerability; SCV = social connection vulnerability. The primary path set was specified as IPD→ERV→SCV→IPD, but the IPD-ERV pair is shown bidirectionally because the reverse ERV→IPD path was numerically larger than IPD→ERV at T2→T3. The dotted line indicates the exploratory entropy moderation candidate for SCV→IPD; this interaction was not significant and is retained only as a future hypothesis. Empirical coefficients are reported in Figure 2 and Table 4.
Figure 1.
The three-dimensional framework of cognitive vulnerability (DIM-CV). Note. IPD = information processing deficits; ERV = emotional regulation vulnerability; SCV = social connection vulnerability. The primary path set was specified as IPD→ERV→SCV→IPD, but the IPD-ERV pair is shown bidirectionally because the reverse ERV→IPD path was numerically larger than IPD→ERV at T2→T3. The dotted line indicates the exploratory entropy moderation candidate for SCV→IPD; this interaction was not significant and is retained only as a future hypothesis. Empirical coefficients are reported in Figure 2 and Table 4.
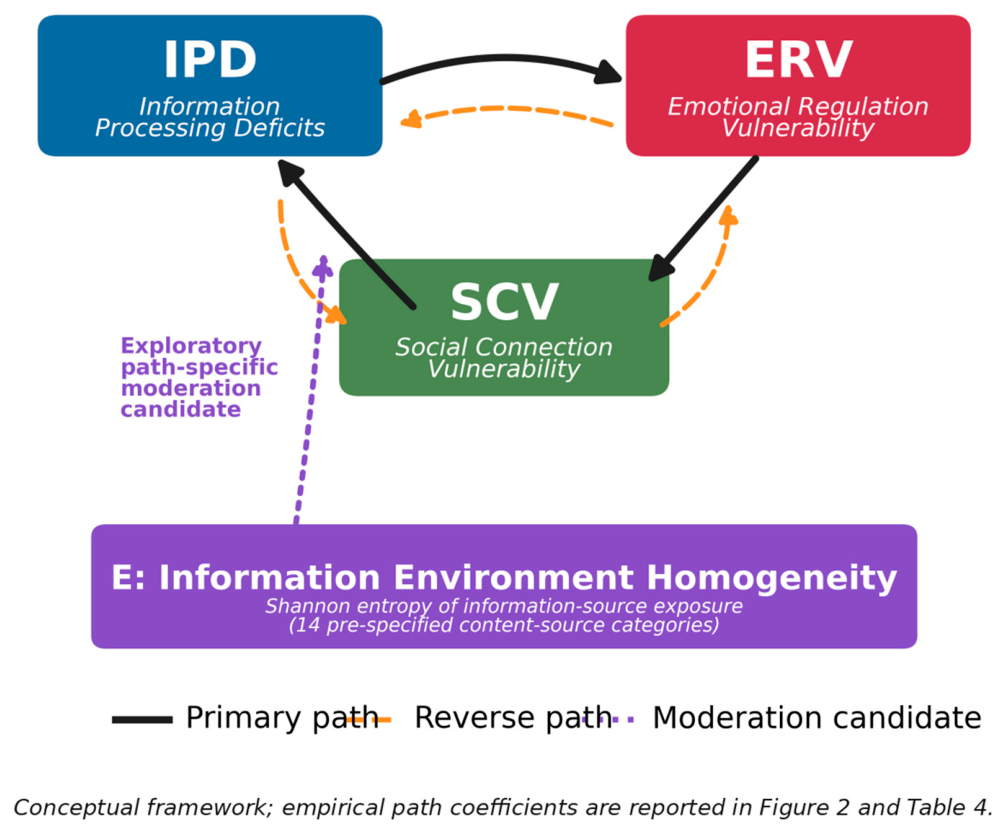
Figure 2.
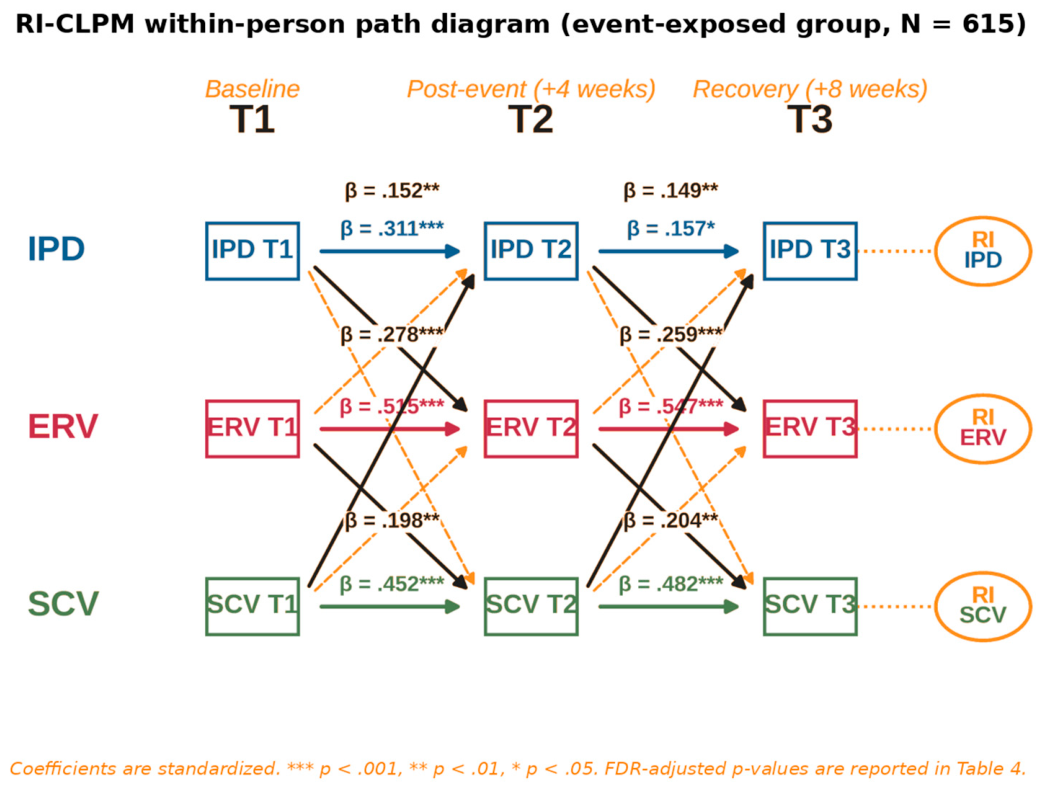
RI-CLPM within-person path diagram (event-exposed group). Note. Solid horizontal arrows show autoregressive paths; solid diagonal arrows show primary paths; dashed arrows show reverse paths. Labels are standardized coefficients for T1→T2 and T2→T3 matching Table 4. Dotted lines indicate random-intercept loadings.
Figure 2.
RI-CLPM within-person path diagram (event-exposed group). Note. Solid horizontal arrows show autoregressive paths; solid diagonal arrows show primary paths; dashed arrows show reverse paths. Labels are standardized coefficients for T1→T2 and T2→T3 matching Table 4. Dotted lines indicate random-intercept loadings.
1.2. Hypotheses
Four predictions followed. H1: the three-factor structure fits better than one- and two-factor alternatives. H2: the three primary paths (IPD→ERV, ERV→SCV, and SCV→IPD) are positive at the within-person level after stable trait-like differences are separated from within-person fluctuations; this is a coupling claim, not a claim of uniform directional dominance. H3: growth indices show positive covariance across waves, but inference is bounded by the linear three-wave LGCM and by its fit. H4a: lower entropy, indicating greater information-environment homogeneity, strengthens all three primary paths. H4b: if global moderation is not supported, homogeneity is expected to be most relevant to the SCV→IPD path because that link most directly involves diverse corrective inputs.
H1-H3 and H4a are tested as the primary SEM layer using CFA, RI-CLPM, LGCM, and moderation models. H4b is explicitly exploratory. Nonlinear threshold and rapid-transition hypotheses cannot be tested with three waves and are not part of the current claims.
1.3. The Present Study
The study pursued three objectives: to test the distinguishability and longitudinal comparability of IPD, ERV, and SCV; to estimate within-person cross-time coupling and descriptive growth co-movement; and to evaluate whether information-environment homogeneity operates globally or more specifically on SCV→IPD.
Its contributions are intentionally bounded. The study integrates psychological and communication-science constructs in a single RI-CLPM, incorporates an individual-level Shannon entropy measure of exposure to information sources, and applies the framework to a Chinese university sample observed during a natural campus public-discussion event window. The results are intended to guide early-stage research assessment rather than to validate a screening instrument.
What this study adds. The study estimates cognitive, affective, and social-information vulnerabilities jointly; tests global and path-specific information-environment moderation within the same framework; and uses department-level cluster-robust inference while acknowledging the limits of a three-university quasi-experimental design.
H1-H4a were specified in an internal analysis plan before T3 data release; the study was not publicly pre-registered. H4b and other deviations are marked as exploratory.
2. Materials and Methods
2.1. Participants
Participants were undergraduate students recruited through a non-public, access-controlled online survey platform from three major universities in one provincial capital in mainland China. A qualifying campus public-discussion event was defined a priori as an on-campus incident that generated university-wide discussion, persisted for more than three days, and reached more than one million combined Weibo/WeChat topic reads. During the 8-week window, two universities met these criteria, involving an academic-misconduct dispute and a campus-safety incident, and formed the event-exposed group (recruited n = 670; retained across three waves n = 615; attrition = 8.2%; M age = 21.3, SD = 2.0; 56.3% female). The third university formed the comparison group (recruited n = 207; retained n = 190; attrition = 8.2%). The retained full sample was 805. Baseline group differences on the three vulnerability dimensions were non-significant (all t < 1.24, p > .20). The sample covered 24 departments, including 18 in the event-exposed group and 6 in the comparison group; because only three universities were sampled, department was used as the cluster unit. Department-level ICCs were below .10 for all three dimensions.
The participating universities did not include the authors' home institution. Recruitment, data collection, and compensation were administered by trained research assistants from the participating universities, and participants were not informed of the authors' affiliation during data collection.
University students were selected because they are intensive social-media users and vary meaningfully in the vulnerabilities of interest. A priori power analysis in G*Power indicated (Faul et al., 2007) that detecting medium cross-lagged effects (f² = .10; β approximately .29) at α = .05 and power = .80 requires about 393 participants; the event-exposed group exceeded this threshold.
The protocol was approved by the authors' Institutional Review Board (IRB-2024-035, 8 March 2024). All participants provided written informed consent and were compensated for each completed wave.
2.2. Measures
2.2.1. Information Processing Deficits (IPD)
IPD combined a 7-item Cognitive Reflection Test (CRT; Frederick, 2005; Toplak et al., 2014) and a 12-item Critical News Literacy Scale (Vraga & Tully, 2021), capturing both analytic capacity and disposition to apply analytic processing to information evaluation. Pretesting (n = 120) supported a single factor for the two components (λ = .56 and .71), although the mixed ability/Likert response formats remain a limitation. The combined score was retained for theoretical comparability; sensitivity models separating CRT and news-literacy components, and a news-literacy-only RI-CLPM, preserved the direction of primary paths and are documented in the controlled materials.
2.2.2. Emotional Regulation Vulnerability (ERV)
ERV was measured with the 18-item Chinese short-form Difficulties in Emotion Regulation Scale (DERS; Gratz & Roemer, 2004; Li et al., 2018), scored so that higher values indicate greater vulnerability. An 8-item Public Issue Emotional Reactivity Scale was also administered as a domain-specific sensitivity indicator covering affective activation, persistence, anxiety, anger, helplessness, and impulse to react to generic public issues. Full wording and psychometric evidence are in Supplementary Materials S1.
2.2.3. Social Connection Vulnerability (SCV)
SCV was measured primarily with the 10-item Online Social Network Diversity Scale (SCV-ND), assessing restricted access to heterogeneous interpersonal and social-informational inputs, including concentrated ties, similar viewpoints, repeated information from the same circles, limited cross-circle discussion, and fewer corrective alternatives. Two items were reverse-coded so that higher scores indicate greater vulnerability. An entropy-adjacent Information Source Homogeneity Index (SCV-IH) was retained only for sensitivity analyses to avoid overlap with the environmental moderator.
2.2.4. Information Environment Homogeneity (E)
The moderator E was Shannon entropy of self-reported information-source exposure across 14 pre-specified content-source categories, including mainstream media, commercial news, Weibo, WeChat public accounts, short-video platforms, campus forums, academic/professional content, entertainment, friends, family, lifestyle, interest communities, international news, and other sources. Entropy was computed as E = -Σ p_j log p_j, where p_j = max(EXP_j - 1, 0) / Σ_k max(EXP_k - 1, 0), so the lowest frequency category contributed zero exposure, following entropy/diversity measurement conventions (Jost, 2006; Pielou, 1966). Higher entropy indicates more diverse exposure; lower entropy indicates greater homogeneity. E differed from SCV-IH by taxonomy, passive exposure rather than active engagement, and aggregation logic. Their T1 correlation was near zero (r = -.01), and adjacent-wave test-retest reliability for E was .92 and .86.
2.2.5. Validity Evidence
Pre-test EFA showed target loadings > .50 and cross-loadings < .30. Convergent validity was supported by correlations between IPD and misinformation discrimination (r = -.62), ERV and trait anxiety (r = .58; Spielberger, 1983), and SCV-ND and loneliness (r = .51; Russell, 1996), all p < .001. The self-developed scales were theory-generated, translated/back-translated, and reliable in the event-exposed group (ERS α = .924-.938; SCV-ND α = .951-.958), with strong loadings, AVE > .65, and acceptable HTMT/Fornell-Larcker evidence. Independent validation remains necessary because very high reliability may reflect item redundancy. Table 1 summarizes constructs, sensitivity indicators, and interpretive boundaries; details are in Supplementary Materials S1-S2.
2.3. Procedure
A three-wave longitudinal design used four-week intervals. T1 collected baseline data from all universities; T2 occurred 7-14 days after a qualifying event at an event-exposed university and in the same calendar window at the comparison university; T3 followed five weeks after T2.
Responses were collected through a password-protected online platform that produced questionnaire responses, timestamps, completion duration, and limited technical fields for quality screening. Before analysis and controlled sharing, records were de-identified and sensitive platform fields were removed, transformed into non-reversible indicators, or retained only in aggregate documentation. Controlled reproducibility materials include de-identified survey data, processed datasets, cleaning logs, codebooks, syntax, and model outputs, but not backend interfaces, unrestricted raw exports, or proprietary platform logs.
The duration_sec field was used only for the pre-specified quality rule excluding records below 90 s or at the 30-min timeout boundary. Minor timing discrepancies reflected expected differences in timestamp precision and device-specific recording, and are retained only as controlled documentation.
The design approximates a natural-setting quasi-experiment rather than random assignment. University differences and event-type differences cannot be ruled out, so results are interpreted as patterns consistent with the framework rather than as strict causal estimates. Event-type stratification is reported in Section 3.6.
Risk safeguards included administering T2 outside the acute event phase, avoiding items about direct involvement in the events, allowing item skipping and withdrawal without consequence, and providing counseling-resource information after each wave. No account handles, device identifiers, browsing logs, geolocation, or individual digital-trace data were collected. Event characteristics were taken from publicly visible Weibo/WeChat topic indices at the event level.
2.4. Data Analysis
Analyses used Mplus 8.10 with robust maximum likelihood (MLR). After pre-specified cleaning (completion_rate ≥ .80), retained respondents had complete item data, and attrition checks showed no T1 differences between completers and drop-outs; aggregate cleaning-rule exclusion counts are reported in Supplementary Table S8, and sample balance and attrition summaries are reported in Supplementary Table S9. Because participants were nested in departments and only three universities were sampled, models used department-level cluster-robust SEs (TYPE = COMPLEX; Asparouhov, 2005). Primary analyses used 18 event-exposed departments as clusters. Given this modest number, p-values are interpreted conservatively, with emphasis on effect sizes, FDR-adjusted patterns, and reproducibility-confirmed robustness.
Analyses tested competing CFA structures, longitudinal invariance, RI-CLPM primary and reverse paths, three-wave linear LGCM slope covariances, and H4 moderation through multi-group RI-CLPM and continuous interactions, with continuous-moderation sensitivity specifications summarized in Supplementary Table S5. Higher entropy indicated greater diversity, so negative interactions supported the homogeneity hypothesis. The single-step LMS RI-CLPM interaction model did not converge reliably and was treated as diagnostic; converged factor-score and product-indicator alternatives were centering-sensitive, so H4 was interpreted cautiously. Fit benchmarks were CFI/TLI ≥ .95, RMSEA ≤ .06, and SRMR ≤ .08.
Benjamini-Hochberg FDR control (Benjamini & Hochberg, 1995) at q = .05 was applied across 21 primary tests, with supplementary sub-family checks for measurement, RI-CLPM, and growth/moderation tests; the 21-test correction family is reported in Supplementary Table S3. Results converged for H1 and H2 and remained non-significant for H4a/H4b. 'Reproducibility-confirmed' means a second analyst independently re-ran the frozen package on another machine and Mplus build with fourth-decimal agreement; non-reproduced specifications are flagged.
Power was adequate for small-to-moderate primary paths but limited for moderated RI-CLPM effects. Moderation results, especially H4b, are therefore exploratory unless FDR-significant and stable across specifications.
RI-CLPM was the primary model because it separates stable between-person differences from within-person cross-time prediction (Hamaker et al., 2015; Mulder & Hamaker, 2021; Orth et al., 2021; Usami et al., 2019). Three-wave LGCM results are interpreted within linear-growth constraints because non-linear or piecewise slopes are not identified.
3. Results
3.1. Descriptive Statistics and Preliminary Analyses
All retained participants completed all three waves (event-exposed n = 615; comparison n = 190; attrition = 8.2% in each group). Retained participants had complete item data, and attrition checks showed no T1 differences from drop-outs. Variables showed acceptable skewness and kurtosis. As Table 2 shows, all three vulnerability dimensions increased from T1 to T2 and partially declined from T2 to T3 without fully returning to baseline. Cross-wave stability coefficients ranged from .65 to .83 and cross-dimension correlations from .29 to .65. Entropy descriptives appear in the note to Table 2 and Supplementary Table S4.
3.2. Measurement Model and Longitudinal Invariance
Table 3 reports competing T1 measurement models. The retained three-factor model fit well and clearly outperformed one- and two-factor alternatives (χ²(132) = 133.922, CFI = 1.000, RMSEA = .005, SRMR = .018). A four-factor model splitting SCV-ND from SCV-IH fit marginally better, but the gain was substantively small and SCV-IH overlaps conceptually with the entropy moderator. The three-factor model with SCV-ND as the primary SCV indicator was therefore retained.
Configural, metric, and scalar invariance models showed acceptable fit and change-in-fit indices (Putnick & Bornstein, 2016), supporting latent-mean comparison across waves while avoiding over-precise claims about perfect invariance.
Common-method bias was examined cautiously. Harman's first factor explained 46.7% of variance, but the one-factor CFA fit poorly and the three-factor model fit much better. Because parcel-level fit can overstate quality (Little et al., 2002, 2013), a longitudinal robustness check used nine wave-specific composites with lag-1 correlated residuals. M3 remained preferred (χ²(18) = 50.018, CFI = .992, RMSEA = .054), whereas one- and two-factor models fit worse; M4 fit comparably to M3. The retained conclusion is qualitative: three distinguishable facets are supported, while entropy-adjacent SCV variants remain sensitivity evidence.
3.3. Random-Intercept Cross-Lagged Panel Models (H2)
The reproducibility-confirmed RI-CLPM fit well (χ²(6) = 3.085, p = .798, CFI = 1.000, TLI = 1.000, RMSEA = .000, SRMR = .008). After FDR correction, all three primary paths were positive and significant: IPD→ERV (β = .278 at T1→T2; .259 at T2→T3), ERV→SCV (β = .198; .204), and SCV→IPD (β = .152; .149). These estimates support modest within-person coupling, not a strong ordered loop. Reverse paths were heterogeneous: ERV→IPD was significant at both lags, SCV→ERV mainly at T1→T2, and IPD→SCV was non-significant.
Autoregressive paths (IPD .311/.157; ERV .515/.547; SCV .452/.482) indicate state-to-state stability after random intercepts absorb trait-like variance. Participant-level semopy bootstrap estimates broadly matched the signs of the Mplus estimates but produced wider intervals, reinforcing the conclusion that primary-path effects are modest. Because the primary models use 18 event-exposed department clusters, cluster-robust p-values are interpreted conservatively and alongside effect sizes, FDR-adjusted patterns, and reproducibility checks.

Table 4.
Standardized path coefficients from the random-intercept cross-lagged panel model (event-exposed group, N = 615).
Table 4.
Standardized path coefficients from the random-intercept cross-lagged panel model (event-exposed group, N = 615).
| Path | β (T1 → T2) | p | β (T2 → T3) | p |
|---|---|---|---|---|
| Autoregressive paths | ||||
| IPD → IPD | .311*** | .157* | .045 | |
| ERV → ERV | .515*** | .547*** | ||
| SCV → SCV | .452*** | .482*** | ||
| Primary cross-lagged paths | ||||
| IPD→ERV | .278*** | .259*** | ||
| ERV→SCV | .198** | .007 | .204** | .007 |
| SCV→IPD | .152** | .006 | .149** | .006 |
| Reverse cross-lagged paths | ||||
| ERV → IPD | .278*** | .392*** | ||
| SCV → ERV | .131*** | .013 | .775 | |
| IPD → SCV | .064 | .307 | .079 | .122 |
Note. Entries are standardized RI-CLPM coefficients; * p < .05, ** p < .01, *** p < .001 (cells with *** but blank p column indicate p < .001). The equal rounded T1→T2 coefficients for IPD→ERV and ERV→IPD reflect standardization and three-decimal rounding, not equality constraints. FDR correction across 21 tests indicated that all three primary paths were significant. Standard errors were department-cluster robust using 18 event-exposed departments. IPD = information processing deficits; ERV = emotional regulation vulnerability; SCV = social connection vulnerability.
Random-intercept decomposition attributed on average 43.4% of IPD, 36.7% of ERV, and 40.2% of SCV indicator variance across waves to stable between-person differences (range 41–46% for IPD, 32–42% for ERV, 37–43% for SCV); the remaining variance supported within-person modeling.
The within-person RI-CLPM structure and reproducibility-confirmed path coefficients are shown in Figure 2.
3.3.1. Interpretation of Effect Sizes
The primary paths were small-to-moderate (β = .149-.278). H2 is therefore supported as positive within-person coupling, not directional dominance. For IPD-ERV, a joint Wald test rejected forward-equals-reverse equality across waves (Wald = 10.282, df = 3, p = .016, p_FDR < .05), with ERV→IPD numerically larger than IPD→ERV at T2→T3. The cognitive-affective link is best described as bidirectional. ERV→SCV and SCV→IPD exceeded their reverse paths at both lags, though the SCV→IPD effect was small.
Conventional CLPM and two-step factor-score models yielded similar signs but different magnitudes, as expected when trait variance is handled differently. RI-CLPM estimates are retained as the conservative within-person estimates.
3.4. Latent Growth Curve Models and Coordinated Change (H3)
The three-wave linear multivariate LGCM fit poorly on RMSEA and TLI (χ²(18) = 298.369, CFI = .931, TLI = .863, RMSEA = .159, SRMR = .044). The likely reason is design-imposed linearity: the observed trajectories increased from T1 to T2 and partially recovered from T2 to T3, a non-linear pattern that cannot be captured by a single linear slope. Piecewise or non-linear growth could not be identified with three waves.
Table 5 reports slope covariances. The joint test constraining all slope covariances to zero was rejected after FDR correction, but, because the linear LGCM misfit was substantial, this finding is interpreted only as descriptive co-movement. Two individual pairs (ERV-SCV and IPD-SCV) survived FDR correction, whereas IPD-ERV did not. H3 is therefore retained only as a bounded descriptive result; higher-frequency designs are needed to distinguish coupling-driven co-movement from co-movement driven by a common event-related factor.
3.4.1. Alternative-Explanation Tests: Common-Cause Model
A common-cause explanation remains plausible: the event may have elevated all three dimensions without cross-dimensional coupling. The slope-covariance test therefore does not rule out co-movement driven by a common event-related factor. Stronger tests require additional waves, repeated event-exposure measures, or a pre-specified common event-related factor model.
3.5. Global and Path-Specific Moderation by Information Environment Homogeneity (H4)
H4 analyses used SCV-ND alone to avoid overlap between the moderator and entropy-adjacent SCV-IH. Higher entropy indicated greater diversity; a negative interaction coefficient was therefore consistent with homogeneity-strengthened coupling.
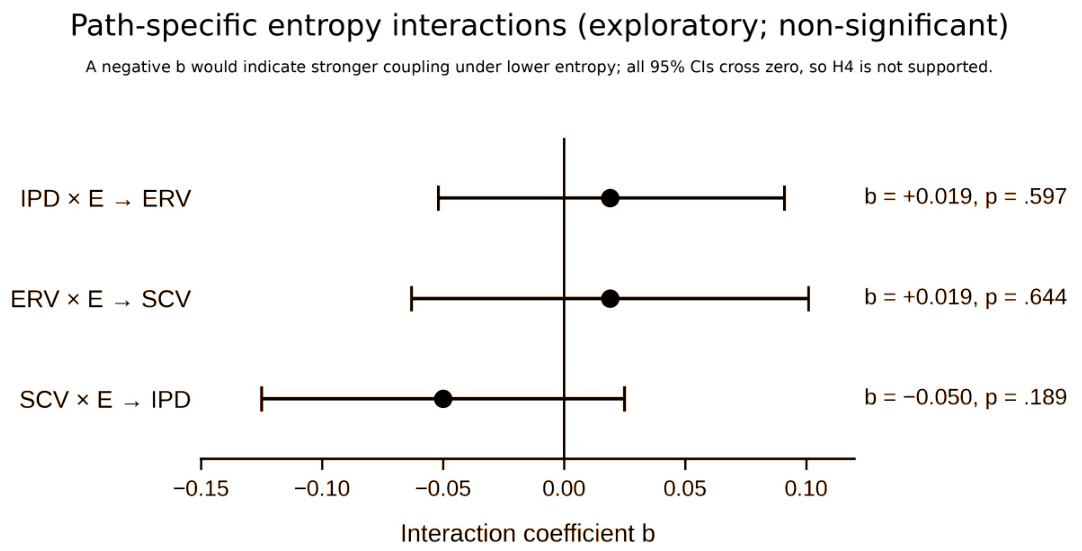
H4a was not supported. A T1 entropy median-split multi-group RI-CLPM (Md = 2.21481; low-diversity n = 305, high-diversity n = 310) did not show robust path differences (omnibus p_FDR = .577; see Supplementary Table S3), and estimable continuous-interaction models did not yield FDR-significant moderation across all primary paths (Supplementary Table S5). The nonconverged LMS model was not used for inference.
Exploratory analyses showed only one directionally consistent pattern: the SCV→IPD entropy interaction was negative across factor-score and observed-product specifications, whereas the other interactions were near zero or inconsistently signed. Across converged diagnostic specifications, however, this interaction was never statistically significant (Supplementary Table S5). Thus, H4a is not supported, and H4b is not supported as a confirmatory claim. The SCV→IPD moderation pattern is hypothesis-generating only.
3.5.1. Alternative-Explanation Test: Selective Exposure
Selective exposure was examined as an alternative explanation. Trait-level random-intercept factor scores explained little T1 entropy variance (R² = .004; cluster-robust omnibus p = .337), and individual predictors were non-significant. This does not rule out selective exposure, but it further supports treating the SCV→IPD moderation pattern as exploratory.
In summary, information-environment homogeneity did not reliably amplify the primary within-person paths. The only directionally consistent interaction, SCV→IPD, was non-significant and is not evidence of path-specific moderation.
Figure 3.
(Exploratory). Non-significant entropy interaction estimates. Note. Negative b values indicate stronger coupling under lower entropy. The SCV→IPD point estimate was directionally negative across converged specifications, but in every case the 95% CI crossed zero. The figure is hypothesis-generating only.
Figure 3.
(Exploratory). Non-significant entropy interaction estimates. Note. Negative b values indicate stronger coupling under lower entropy. The SCV→IPD point estimate was directionally negative across converged specifications, but in every case the 95% CI crossed zero. The figure is hypothesis-generating only.
3.6. Event-Type Stratification
Because the two event-exposed universities experienced different events, we explored event-type moderation with multi-group RI-CLPM. Sample sizes were n = 295 for academic misconduct and n = 320 for campus safety.
Primary-path directions were broadly preserved across event types, but magnitudes varied (Supplementary Table S6). Constraint tests did not yield FDR-significant event-type moderation (see Supplementary Tables S3 and S6), so these differences are descriptive rather than confirmatory.
The pattern suggests possible generality across campus public-discussion events while leaving open whether event content changes pathway salience.
3.7. Summary and Evidence Stratification
Evidence was stratified as follows. Robust findings: the three-factor structure outperformed one- and two-factor alternatives (H1), and all three primary within-person paths were positive and FDR-significant in the RI-CLPM (H2 supported as modest coupling). Model-bounded findings: the LGCM joint slope-covariance test indicated descriptive co-movement but not a well-fitting growth model (H3 bounded). Model-dependent findings: reverse paths and individual slope covariances were heterogeneous. Exploratory findings: H4a was not supported; H4b was not supported as a confirmatory claim because the SCV→IPD entropy interaction was non-significant; event-type differences were also exploratory.
Three-wave data cannot test nonlinear dynamics, rapid state transitions, or environmentally amplified feedback loops. The RI-CLPM primary-path coefficients (β = .149-.278) support modest within-person coupling only.
The study tested whether IPD, ERV, and SCV are distinguishable and temporally coupled, and whether entropy-indexed information-environment homogeneity moderates these dynamics. The findings support a conservative interpretation: the three facets are distinguishable and modestly coupled within persons, but strong ordered-loop, growth-model, and environmental-moderation claims are not supported.
4. Discussion
4.1. Main Findings and Evidence Boundaries
The measurement results support a three-facet structure spanning information evaluation, affect regulation, and social-information connection. The RI-CLPM results support modest positive associations along the primary paths, while the IPD-ERV pair is bidirectional. Thus, the evidence favors coupled vulnerabilities rather than either a single cognitive-vulnerability factor or a strong unidirectional feedback loop.
The LGCM results further qualify the dynamic claim. Although slope covariances indicated descriptive co-movement, the linear three-wave model fit poorly because the observed trajectories rose after the events and then partially recovered. H3 should therefore be read as co-movement under model limitations, not as a well-fitting coordinated-growth process.
The environmental hypotheses were not supported. Lower entropy did not globally strengthen primary paths, and the directionally consistent SCV→IPD interaction was non-significant. This pattern is theoretically useful because it identifies a possible mechanism for future testing, but it should not be described as a current finding.
4.2. Theoretical Contribution: Bridging Two Traditions
The framework bridges two traditions that often remain separate. Psychological accounts identify reasoning, emotion regulation, and vulnerability-stress mechanisms; communication accounts identify exposure structure, homophily, and curated flows. Treating IPD, ERV, and SCV as coupled but separable facets provides a tractable way to examine how individual processing and information ecology may intersect.
The strongest theoretical contribution is therefore integrative rather than confirmatory. The data support a multidimensional within-person coupling model, but they also reject an overly simple loop in which cognition, affect, social connection, and information environment form a uniform self-amplifying process. Future theory should specify when and for whom particular links dominate.
4.3. Methodological Contribution
Methodologically, the study illustrates why RI-CLPM is useful for this question. Conventional cross-lagged associations can mix stable between-person differences with within-person change, whereas random intercepts show that a substantial part of variance is trait-like while still leaving meaningful within-person fluctuation.
The study also shows the limits of three-wave SEM. Linear LGCM cannot represent the observed rise-and-recovery pattern, and moderation tests were underpowered and model-dependent. These limits are reported as part of the evidence rather than treated as technical details.
4.4. Design Hypotheses for Future Risk-Assessment Research
For future assessment research, the results suggest four design priorities. First, multi-facet measurement is justified because the three dimensions are distinguishable and coupled, but no screening instrument is validated here. Second, cognitive-affective links should be modeled bidirectionally rather than assumed to run from cognition to emotion alone. Third, SCV→IPD is a plausible future target for testing corrective-feedback mechanisms, but the current entropy moderation result is not significant. Fourth, models should distinguish global environmental amplification from path-specific moderation.
A sequential-monitoring interpretation remains premature. The primary paths are modest, the reverse ERV→IPD path is strong at one lag, and the environmental interaction is not significant. Research-stage monitoring should therefore focus on multimodal repeated measures and replication, not on immediate triage thresholds.
The SCV→IPD pathway has the clearest future design implication. If restricted social-information input reduces corrective feedback, then interventions increasing exposure diversity might weaken later information-processing deficits. However, this hypothesis requires direct manipulation or richer behavioral exposure measures before intervention claims can be made.
Similarly, the high reliability and strong structure of ERS and SCV-ND are encouraging but not sufficient for scale validation. Independent samples, item-reduction work, and tests across institutions and information ecosystems are needed before these instruments can be used beyond the present research context.
Overall, the practical value of the current framework is to guide future longitudinal measurement and study design. It does not yet justify individual diagnosis, risk classification, or administrative decision-making.
4.5. Practical Implications for Research Design
Practically, the findings support research designs that measure cognition, emotion regulation, and social-information connection jointly, use repeated waves, include information-environment indicators, and pre-specify whether environmental effects are expected to be global or path-specific.
4.6. Generalizability Boundaries
Generalizability is limited by the sample: students from three major universities in one provincial capital, with two event-exposed universities and one comparison university. Institutional type, discipline mix, and local governance climate may not generalize to other universities or regions.
The event context is also bounded. The two qualifying events differed in content and may have engaged different mechanisms. Although directions were broadly preserved, balanced event-type replication is needed before treating the framework as event-general.
The population is young, university-based, and highly digitally connected. Results may not generalize to adolescents, older adults, lower-exposure populations, or non-Chinese information ecosystems.
Because all environmental measures were self-reported, results may differ when source exposure is measured through platform logs, passive sensing, or network data. Such approaches would improve precision but must address privacy and consent constraints.
The study therefore supports a bounded theoretical model for a specific high-exposure student context rather than a universal account of cognitive vulnerability.
4.7. Limitations
Several limitations qualify the findings.
First, the quasi-experimental contrast was not randomly assigned. The comparison university may differ from the event-exposed universities in institutional and disciplinary characteristics, and the three-university sampling frame limits generalizability beyond this specific student context (Henrich et al., 2010).
Second, the design has only three waves. It permits RI-CLPM and a linear LGCM, but it cannot identify non-linear, piecewise, threshold, or rapid-transition dynamics; the LGCM result should therefore remain descriptive.
Third, the event-exposed sample used 18 department clusters. Department-level cluster-robust p-values are therefore interpreted cautiously and alongside effect sizes, FDR-adjusted patterns, and reproducibility checks.
Fourth, all primary measures are self-report except the CRT component of IPD. Shared method variance and recall bias may inflate associations, although the three-factor CFA, invariance checks, and RI-CLPM reduce but do not eliminate this concern. Future studies should add behavioral tasks, informant reports, and ethically feasible digital exposure measures.
Fifth, the IPD operationalization combines an ability test (CRT) with a self-report news-literacy scale. Their pretest loadings differed by λ = .15, below the study-specific separation threshold but not trivial. Sensitivity analyses using news-literacy-only and split-component specifications preserved primary-path directions, but future work should develop IPD measures with more homogeneous response formats.
Sixth, the entropy moderator is a coarse self-report measure of exposure diversity. It protects privacy by avoiding identifiable digital traces, but it cannot capture algorithmic ranking, source credibility, within-category heterogeneity, or real network structure. This limitation may partly explain the null moderation results.
Seventh, the LMS moderation model did not converge reliably, and estimable interaction models were centering-sensitive. H4 inference is therefore limited to converged, reproducibility-confirmed specifications and should not be treated as evidence against all possible environmental effects.
Eighth, the primary CFA used parcels, which can smooth item-level misfit. A longitudinal composite robustness check supported the same qualitative ordering, but item-level cross-validation remains necessary. The high reliability of ERS and SCV-ND may also reflect item redundancy, so independent validation and item reduction are required.
Finally, the study does not provide a clinical, educational, or administrative decision tool. Its contribution is to identify a reproducible but modest within-person coupling pattern and to delimit unsupported claims.
These limitations do not undermine H1 or the modest H2 coupling claim, but they bound H3 and rule out strong claims about causal or environmental moderation.
4.8. Future Directions
Future work should use higher-frequency longitudinal designs, experience sampling, ecological momentary assessment, passive sensing, or ethically governed behavioral-log data to test nonlinear coupling (Harari et al., 2016; Myin-Germeys et al., 2018; Shiffman et al., 2008). Replications should include more institutions, event types, age groups, and information ecosystems; manipulate or more precisely measure exposure diversity; cross-validate ERS and SCV-ND; refine IPD measurement; and link individual DIM-CV dynamics to real social-network structure.
5. Conclusions
Using three-wave data from 615 Chinese university students at two universities where qualifying campus incidents generated sustained online public discussion and from 190 comparison students at a third university, this study supports a distinguishable three-facet framework of cognitive vulnerability. IPD, ERV, and SCV fit better as separate but coupled dimensions than as one- or two-factor alternatives. RI-CLPM results showed modest within-person coupling on IPD→ERV, ERV→SCV, and SCV→IPD, while the IPD-ERV link was bidirectional and leaned toward ERV→IPD at the post-event lag. The LGCM results showed descriptive co-movement but not a well-fitting linear growth model. Information-environment homogeneity did not globally moderate the paths, and the exploratory SCV→IPD entropy interaction was directionally consistent but not significant. Thus, the evidence supports structure and modest coupling, but not a strong ordered feedback loop, a well-fitting coordinated-growth process, or confirmatory environmental moderation. The environmental pathway should remain a future hypothesis.
Supplementary Materials
The following supporting information can be downloaded at the website of this paper posted on Preprints.org. S1 (bilingual items, scoring, translation/back-translation, reliability, CFA loadings, AVE/CR, HTMT, Fornell-Larcker evidence, and ERS/SCV-ND rationale); S2 (measurement inventory and instrument details); Table S3 (21-test BH-FDR correction family); Table S4 (entropy descriptives); Table S5 (H4 continuous-moderation sensitivity specifications); Table S6 (event-type stratified RI-CLPM coefficient comparison); Table S7 (parcel-level CFA and longitudinal invariance summary); Table S7b (longitudinal nine-composite robustness check); Table S8 (cleaning-rule exclusion counts); and Table S9 (sample balance and attrition summaries). Full Mplus syntax and output files, raw FDR computation scripts, participant-level reproduction data, and restricted audit materials are available only through the controlled-access procedure described in the Data Availability Statement.
Author Contributions
Conceptualization, X.S. and D.W.; methodology, X.S. and D.W.; software, X.S.; validation, X.S., J.C. and D.W.; formal analysis, X.S.; investigation, X.S. and J.C.; resources, D.W.; data curation, J.C.; writing—original draft preparation, X.S.; writing—review and editing, X.S., J.C. and D.W.; visualization, X.S.; supervision, D.W.; project administration, D.W.; funding acquisition, X.S. All authors have read and agreed to the published version of the manuscript.
Funding
This research was funded by the National Social Science Fund of China, grant number [2025-SKJJ-D-078].
Institutional Review Board Statement
The study was conducted in accordance with the Declaration of Helsinki and was approved by the Institutional Review Board of the authors' institution (protocol code IRB-2024-035, approved on 8 March 2024). To protect participants and participating institutions in a sensitive campus public-discussion context, full ethics-approval documentation, recruitment materials, consent forms, and institution-specific implementation records are not publicly disclosed. These materials are available confidentially to the editorial office and reviewers upon reasonable request, subject to institutional and data-protection restrictions.
Informed Consent Statement
Informed consent was obtained from all participants involved in the study. This manuscript does not contain any individual person's identifiable data (images, videos, recordings, or personal details) in any form. All participant data reported are de-identified and presented in aggregate.
Data Availability Statement
Public supplementary documentation and aggregate materials are available in the OSF repository at https://doi.org/10.17605/OSF.IO/68ENP. These materials include measurement inventories, scoring rules, source-taxonomy files, aggregate entropy descriptives, measurement-model summaries, the 21-test BH-FDR summary table, moderation-sensitivity summaries, event-type stratified coefficient summaries, cleaning-rule counts, sample balance and attrition summaries, public scoring/codebook files, aggregate SEM skeleton matrices, and data-access boundary documentation. The manuscript itself is not deposited in the public OSF layer and will be available through the journal upon publication. Participant-level datasets, unrestricted analysis inputs, raw platform exports, backend records, proprietary logs, technical audit records, and identifiable or institution-sensitive materials are not publicly available. De-identified/pseudonymized participant-level datasets, processed datasets, controlled codebooks, Mplus syntax and .dat files, full model outputs, raw FDR computation scripts, and result workbooks are available from the corresponding author through controlled access, subject to ethics approval, consent restrictions, platform-access limits, and data-protection regulations. Controlled-access files are de-identified/pseudonymized rather than anonymous because exact scale-score vectors and encoded model covariates required for reproduction are retained. Restricted backend records, raw IDs, exact timestamps, source-channel fields, IP/device/geolocation records, account handles, browsing logs, event URLs, non-redacted screenshots, and technical audit evidence are not public. Redacted audit materials may be shared confidentially with editors or reviewers under the same restrictions.
Acknowledgments
The authors thank the participating universities and the student research assistants who assisted with data collection, and are grateful to colleagues who provided feedback on earlier drafts.
Conflicts of Interest
The authors declare no conflicts of interest. The funder had no role in the design of the study; in the collection, analyses, or interpretation of data; in the writing of the manuscript; or in the decision to publish the results.
Abbreviations
The following abbreviations are used in this manuscript:
CFA, confirmatory factor analysis; CFI, comparative fit index; CLPM, cross-lagged panel model; CRT, Cognitive Reflection Test; DERS, Difficulties in Emotion Regulation Scale; DIM-CV, Three-Dimensional Framework of Cognitive Vulnerability; E, entropy moderator; ERS, Public Issue Emotional Reactivity Scale; ERV, emotional regulation vulnerability; FDR, false discovery rate; IPD, information processing deficits; IRB, Institutional Review Board; LGCM, latent growth curve model; MLR, maximum likelihood with robust standard errors; RI-CLPM, random-intercept cross-lagged panel model; RMSEA, root mean square error of approximation; SCV, social connection vulnerability; SCV-IH, SCV-Information Source Homogeneity Index; SCV-ND, SCV-Online Social Network Diversity Scale; SEM, structural equation modeling; SRMR, standardized root mean square residual; TLI, Tucker-Lewis index.
References
- Allcott, H., Gentzkow, M., & Yu, C. (2019). Trends in the diffusion of misinformation on social media. Research & Politics, 6, 2053168019848554. [CrossRef]
- Aral, S., & Eckles, D. (2019). Protecting elections from social media manipulation. Science, 365, 858-861. [CrossRef] [PubMed]
- Asparouhov, T. (2005). Sampling weights in latent variable modeling. Structural Equation Modeling, 12, 411-434. [CrossRef] [PubMed]
- Bago, B., Rand, D. G., & Pennycook, G. (2020). Fake news, fast and slow: Deliberation reduces belief in false (but not true) news headlines. Journal of Experimental Psychology: General, 149, 1608-1613. [CrossRef] [PubMed]
- Bak-Coleman, J. B., Alfano, M., Barfuss, W., Bergstrom, C. T., Centeno, M. A., Couzin, I. D., Donges, J. F., Galesic, M., Gersick, A. S., Jacquet, J., et al. (2021). Stewardship of global collective behavior. Proceedings of the National Academy of Sciences of the United States of America, 118, e2025764118. [CrossRef] [PubMed]
- Bakshy, E., Messing, S., & Adamic, L. A. (2015). Exposure to ideologically diverse news and opinion on Facebook. Science, 348, 1130-1132. [CrossRef] [PubMed]
- Barberá, P. (2015). Birds of the same feather tweet together: Bayesian ideal point estimation using Twitter data. Political Analysis, 23, 76-91. [CrossRef]
- Barberá, P., Jost, J. T., Nagler, J., Tucker, J. A., & Bonneau, R. (2015). Tweeting from left to right: Is online political communication more than an echo chamber? Psychological Science, 26, 1531-1542. [CrossRef] [PubMed]
- Beck, A. T. (1976). Cognitive therapy and the emotional disorders. International Universities Press.
- Benjamini, Y., & Hochberg, Y. (1995). Controlling the false discovery rate: A practical and powerful approach to multiple testing. Journal of the Royal Statistical Society: Series B, 57, 289-300. [CrossRef]
- Borsboom, D. (2017). A network theory of mental disorders. World Psychiatry, 16, 5-13. [CrossRef] [PubMed]
- Brady, W. J., Crockett, M. J., & Van Bavel, J. J. (2020). The MAD model of moral contagion: The role of motivation, attention and design in the spread of moralized content online. Perspectives on Psychological Science, 15, 978-1010. [CrossRef] [PubMed]
- Centola, D. (2018). How behavior spreads: The science of complex contagions. Princeton University Press.
- Cinelli, M., De Francisci Morales, G., Galeazzi, A., Quattrociocchi, W., & Starnini, M. (2021). The echo chamber effect on social media. Proceedings of the National Academy of Sciences of the United States of America, 118, e2023301118. [CrossRef] [PubMed]
- Ecker, U. K. H., Lewandowsky, S., Cook, J., Schmid, P., Fazio, L. K., Brashier, N., Kendeou, P., Vraga, E. K., & Amazeen, M. A. (2022). The psychological drivers of misinformation belief and its resistance to correction. Nature Reviews Psychology, 1, 13-29. [CrossRef]
- Faul, F., Erdfelder, E., Lang, A. G., & Buchner, A. (2007). G*Power 3: A flexible statistical power analysis program for the social, behavioral, and biomedical sciences. Behavior Research Methods, 39, 175-191. [CrossRef] [PubMed]
- Frederick, S. (2005). Cognitive reflection and decision making. Journal of Economic Perspectives, 19, 25-42. [CrossRef]
- Garrett, R. K. (2009). Politically motivated reinforcement seeking: Reframing the selective exposure debate. Journal of Communication, 59, 676-699. [CrossRef]
- Gratz, K. L., & Roemer, L. (2004). Multidimensional assessment of emotion regulation and dysregulation: Development, factor structure, and initial validation of the Difficulties in Emotion Regulation Scale. Journal of Psychopathology and Behavioral Assessment, 26, 41-54. [CrossRef]
- Gross, J. J. (2015). Emotion regulation: Current status and future prospects. Psychological Inquiry, 26, 1-26. [CrossRef]
- Hamaker, E. L., Kuiper, R. M., & Grasman, R. P. P. P. (2015). A critique of the cross-lagged panel model. Psychological Methods, 20, 102-116. [CrossRef] [PubMed]
- Harari, G. M., Lane, N. D., Wang, R., Crosier, B. S., Campbell, A. T., & Gosling, S. D. (2016). Using smartphones to collect behavioral data in psychological science: Opportunities, practical considerations, and challenges. Perspectives on Psychological Science, 11, 838-854. [CrossRef] [PubMed]
- Henrich, J., Heine, S. J., & Norenzayan, A. (2010). The weirdest people in the world? Behavioral and Brain Sciences, 33, 61-83. [CrossRef] [PubMed]
- Jost, L. (2006). Entropy and diversity. Oikos, 113, 363-375. [CrossRef]
- Kahneman, D. (2011). Thinking, fast and slow. Farrar, Straus and Giroux.
- Lazer, D. M. J., Baum, M. A., Benkler, Y., Berinsky, A. J., Greenhill, K. M., Menczer, F., Metzger, M. J., Nyhan, B., Pennycook, G., Rothschild, D., et al. (2018). The science of fake news. Science, 359, 1094-1096. [CrossRef] [PubMed]
- Lewandowsky, S., & van der Linden, S. (2021). Countering misinformation and fake news through inoculation and prebunking. European Review of Social Psychology, 32, 348-384. [CrossRef]
- Li, J., Lei, Y., Zhang, W., Xu, X., Chen, X., & Yao, S. (2018). Psychometric properties of the Chinese version of the Difficulties in Emotion Regulation Scale (DERS) among adolescents and young adults. Psychological Assessment, 30, 1411-1416. [CrossRef] [PubMed]
- Little, T. D., Cunningham, W. A., Shahar, G., & Widaman, K. F. (2002). To parcel or not to parcel: Exploring the question, weighing the merits. Structural Equation Modeling, 9, 151-173. [CrossRef] [PubMed]
- Little, T. D., Rhemtulla, M., Gibson, K., & Schoemann, A. M. (2013). Why the items versus parcels controversy needn't be one. Psychological Methods, 18, 285-300. [CrossRef] [PubMed]
- Lorenz-Spreen, P., Lewandowsky, S., Sunstein, C. R., & Hertwig, R. (2020). How behavioural sciences can promote truth, autonomy and democratic discourse online. Nature Human Behaviour, 4, 1102-1109. [CrossRef] [PubMed]
- Martel, C., Pennycook, G., & Rand, D. G. (2020). Reliance on emotion promotes belief in fake news. Cognitive Research: Principles and Implications, 5, 47. [CrossRef] [PubMed]
- Mulder, J. D., & Hamaker, E. L. (2021). Three extensions of the random intercept cross-lagged panel model. Structural Equation Modeling, 28, 638-648. [CrossRef]
- Myin-Germeys, I., Kasanova, Z., Vaessen, T., Vachon, H., Kirtley, O., Viechtbauer, W., & Reininghaus, U. (2018). Experience sampling methodology in mental health research: New insights and technical developments. World Psychiatry, 17, 123-132. [CrossRef] [PubMed]
- Orth, U., Clark, D. A., Donnellan, M. B., & Robins, R. W. (2021). Testing prospective effects in longitudinal research: Comparing seven competing cross-lagged models. Journal of Personality and Social Psychology, 120, 1013-1034. [CrossRef] [PubMed]
- Pariser, E. (2011). The filter bubble: What the internet is hiding from you. Penguin Press.
- Pennycook, G., & Rand, D. G. (2019). Lazy, not biased: Susceptibility to partisan fake news is better explained by lack of reasoning than by motivated reasoning. Cognition, 188, 39-50. [CrossRef] [PubMed]
- Pennycook, G., & Rand, D. G. (2021). The psychology of fake news. Trends in Cognitive Sciences, 25, 388-402. [CrossRef] [PubMed]
- Pielou, E. C. (1966). The measurement of diversity in different types of biological collections. Journal of Theoretical Biology, 13, 131-144. [CrossRef]
- Putnick, D. L., & Bornstein, M. H. (2016). Measurement invariance conventions and reporting: The state of the art and future directions for psychological research. Developmental Review, 41, 71-90. [CrossRef] [PubMed]
- Roozenbeek, J., van der Linden, S., Goldberg, B., Rathje, S., & Lewandowsky, S. (2022). Psychological inoculation improves resilience against misinformation on social media. Science Advances, 8, eabo6254. [CrossRef] [PubMed]
- Russell, D. W. (1996). UCLA Loneliness Scale (version 3): Reliability, validity, and factor structure. Journal of Personality Assessment, 66, 20-40. [CrossRef] [PubMed]
- Shiffman, S., Stone, A. A., & Hufford, M. R. (2008). Ecological momentary assessment. Annual Review of Clinical Psychology, 4, 1-32. [CrossRef] [PubMed]
- Spielberger, C. D. (1983). Manual for the State-Trait Anxiety Inventory (Form Y). Consulting Psychologists Press.
- Stroud, N. J. (2008). Media use and political predispositions: Revisiting the concept of selective exposure. Political Behavior, 30, 341-366. [CrossRef]
- Thorson, K., & Wells, C. (2016). Curated flows: A framework for mapping media exposure in the digital age. Communication Theory, 26, 309-328. [CrossRef]
- Toplak, M. E., West, R. F., & Stanovich, K. E. (2014). Assessing miserly information processing: An expansion of the Cognitive Reflection Test. Thinking & Reasoning, 20, 147-168. [CrossRef]
- Usami, S., Murayama, K., & Hamaker, E. L. (2019). A unified framework of longitudinal models to examine reciprocal relations. Psychological Methods, 24, 637-657. [CrossRef] [PubMed]
- Van Bavel, J. J., & Pereira, A. (2018). The partisan brain: An identity-based model of political belief. Trends in Cognitive Sciences, 22, 213-224. [CrossRef] [PubMed]
- Vosoughi, S., Roy, D., & Aral, S. (2018). The spread of true and false news online. Science, 359, 1146-1151. [CrossRef] [PubMed]
- Vraga, E. K., & Tully, M. (2021). News literacy, social media behaviors, and skepticism toward information on social media. Information, Communication & Society, 24, 150-166. [CrossRef]
Table 1.
Measurement summary for primary constructs, sensitivity indicators, and interpretive boundaries.
Table 1.
Measurement summary for primary constructs, sensitivity indicators, and interpretive boundaries.
| Construct | Primary operationalization, sensitivity indicators, and interpretive boundary |
|---|---|
| IPD | Primary: 7-item Cognitive Reflection Test (CRT) plus 12-item Critical News Literacy composite. Sensitivity: IPD-Ability/IPD-Disposition split and news-literacy-only RI-CLPM. Boundary: mixed objective ability and Likert self-report formats; not a final validated IPD instrument. |
| ERV | Primary: 18-item Chinese short-form Difficulties in Emotion Regulation Scale (DERS). Secondary: 8-item Public Issue Emotional Reactivity Scale (ERS). Boundary: DERS anchors the main construct; ERS is domain-specific, self-developed, and requires external validation. |
| SCV | Primary: 10-item Online Social Network Diversity Scale (SCV-ND). Sensitivity: Information Source Homogeneity Index (SCV-IH). Boundary: SCV-ND avoids entropy overlap with the environmental moderator; the self-developed scale requires independent cross-validation. |
| E | Primary: Shannon entropy of self-reported exposure across 14 content-source categories; higher values indicate more diverse exposure. Sensitivity: median-split RI-CLPM and continuous interaction tests. Boundary: self-reported exposure is coarse; H4 moderation was not supported and should not guide current screening or triage decisions. |
Note. IPD = information processing deficits; ERV = emotional regulation vulnerability; SCV = social connection vulnerability; E = entropy moderator; RI-CLPM = random-intercept cross-lagged panel model. Detailed items, scoring rules, reliability evidence, and sensitivity outputs are in Supplementary Materials S1-S2 and controlled materials.
Table 2.
Descriptive statistics across three waves (event-exposed group, N = 615).
| Variable | Wave | M | SD | α | ω |
|---|---|---|---|---|---|
| IPD | T1 | 3.28 | 0.92 | .96 | .96 |
| T2 | 3.39 | 0.94 | .96 | .97 | |
| T3 | 3.29 | 0.98 | .97 | .97 | |
| ERV | T1 | 2.89 | 0.76 | .96 | .97 |
| T2 | 3.15 | 0.82 | .97 | .97 | |
| T3 | 3.04 | 0.88 | .97 | .98 | |
| SCV | T1 | 3.10 | 0.79 | .94 | .95 |
| T2 | 3.19 | 0.80 | .94 | .95 | |
| T3 | 3.14 | 0.84 | .95 | .96 |
Note. IPD = information processing deficits; ERV = emotional regulation vulnerability; SCV = social connection vulnerability; α/ω are event-exposed-group reliability estimates. Entropy E: T1 M = 2.17, SD = 0.26, Md = 2.215; T2 M = 2.16, SD = 0.27, Md = 2.203; T3 M = 2.15, SD = 0.28, Md = 2.197.
Table 3.
Competing measurement-model fit indices (T1, N = 615).
| Model | χ² | df | CFI | RMSEA | SRMR |
|---|---|---|---|---|---|
| M1: One factor | 5699.740 | 135 | .523 | .259 | .223 |
| M2a: Two factors (IPD+ERV vs SCV) | 4653.727 | 134 | .612 | .234 | .213 |
| M2b: Two factors (IPD+SCV vs ERV) | 3370.682 | 134 | .723 | .198 | .208 |
| M3: Three factors (retained) | 133.922 | 132 | 1.000 | .005 | .018 |
| M4: Four factors (SCV split) | 122.417 | 129 | 1.000 | .000 | .017 |
Note. M3 significantly outperformed M1 and both two-factor models after FDR correction. M4 is reported as a sensitivity model but not retained because it separates an entropy-adjacent SCV component. CFI = comparative fit index; RMSEA = root mean square error of approximation; SRMR = standardized root mean square residual.
Table 5.
Growth-slope covariances and joint test of slope-covariance heterogeneity.
| Slope-covariance pair | Estimate | raw p | p_FDR | Interpretation |
|---|---|---|---|---|
| IPD slope with ERV slope | .013 | .065 | .098 | n.s. after FDR |
| ERV slope with SCV slope | .019** | .003 | .008 | Significant |
| IPD slope with SCV slope | .017** | .002 | .006 | Significant |
| Joint test (3 pairs) | - | 2.71e-05 | 8.12e-05 | Significant |
Note. p_FDR = FDR-adjusted p-value across the 21-test family. The joint test constrains all three slope-covariance pairs to zero in the linear LGCM. Three waves do not identify phase-specific rise and recovery covariances.
Disclaimer/Publisher’s Note: The statements, opinions and data contained in all publications are solely those of the individual author(s) and contributor(s) and not of MDPI and/or the editor(s). MDPI and/or the editor(s) disclaim responsibility for any injury to people or property resulting from any ideas, methods, instructions or products referred to in the content. |
© 2026 by the authors. Licensee MDPI, Basel, Switzerland. This article is an open access article distributed under the terms and conditions of the Creative Commons Attribution (CC BY) license (http://creativecommons.org/licenses/by/4.0/).
Copyright: This open access article is published under a Creative Commons CC BY 4.0 license, which permit the free download, distribution, and reuse, provided that the author and preprint are cited in any reuse.


