

Submitted:
01 July 2026
Posted:
03 July 2026
You are already at the latest version
Abstract
This study presents a comprehensive numerical and machine learning framework for the classification of localized surface plasmon resonance (LSPR) extinction spectra generated from gold nanospheres and nanorods. This work presents a compu- tational proof-of-concept demonstrating that physics-based synthetic LSPR spectra can be used to benchmark machine-learning classifiers for nanoparticle geometry and refractive-index discrimination. The extinction spectra were simulated using Mie theory for spherical nanoparticles and Gans theory for rod-shaped particles, accounting for particle size, aspect ratio, and variations in the surrounding refractive index across the visible to near-infrared range (400–1100 nm). Synthetic spectral datasets were systematically generated for nanospheres with varying radii (50–100 nm), nanorods with controlled lengths (100–150 nm) and widths (30–80 nm), and environmental refractive indices (1.33–1.39). These datasets were utilized to train and evaluate multiple supervised machine learning classifiers, including Support Vector Machines (SVM), Random Forests (RF), K-Nearest Neighbors (KNN), Decision Trees (DT), Naïve Bayes, and Logistic Regression. The classifiers demonstrated excellent performance in identifying geometric variations, achieving near-perfect accuracy across all models. However, classification performance declined for refractive index variations, where more subtle spectral shifts posed challenges for some models. Overall, the study demonstrates that coupling accurate physical modeling of LSPR with machine learning provides a promising route for automated nanoparticle characterization and sensing applications. The developed framework may serve as a valuable computational tool to support experimental biosensing and nanoparticle-based diagnostic platforms.
Keywords:
machine learning
; plasmonics
; biosensing
1. Introduction
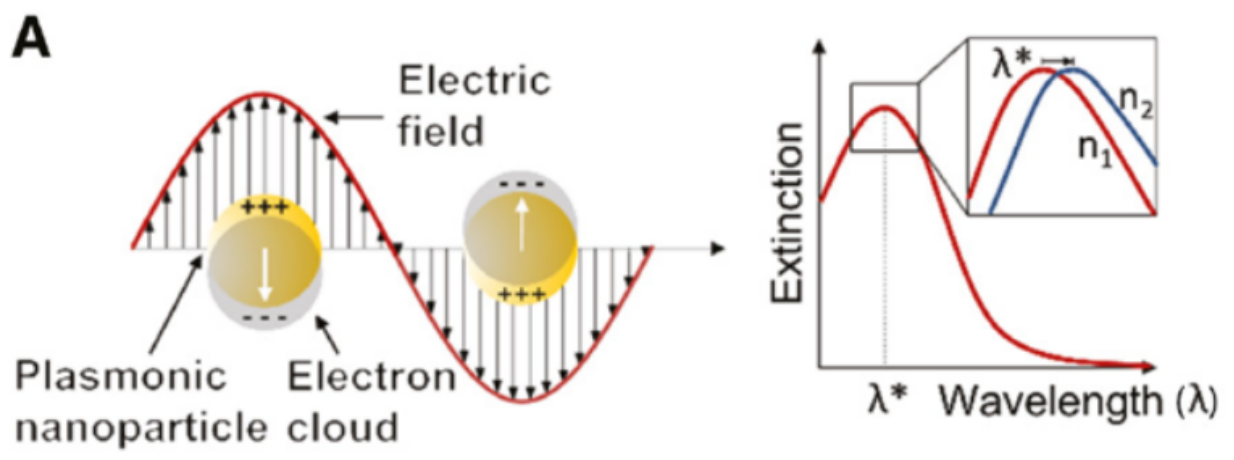
Gold nanoparticles have garnered significant attention due to their unique Localized Surface Plasmon Resonance (LSPR) properties, which are highly sensitive to the particles’ size, shape, and dielectric environment [1]. Due to its short field decay length, LSPR is highly sensitive to changes in the local refractive index near the nanoparticle’s surface. This feature makes LSPR sensitive to subtle reactions and small sample volumes, which are advantages that distinguish it [2]. Consequently, LSPR has been utilized in fields such as biosensing, therapeutics, and imaging. With a growing interest in biosensors, new potential biomedical applications are anticipated to emerge [3], e.g, in genetic mutation detection [4], in HIV diagnostics [5,6,7,8,9], TB diagnostics [10,11,12], and other applications [13,14]. In various applications, LSPR is employed for spectroscopy and sensing; in both instances, the peak wavelength shift in extinction or scattering is crucial [2]. This maximum wavelength shift in LSPR extinction () is sensitive to the refractive index () induced by the adsorbate. The relationship is expressed as Eq. 1:
where is the change in the refractive index induced by the adsorbate, m is the bulk refractive index sensitivity of the nanoparticle, d is the effective thickness of the adsorbate layer, and is the decay length of the electromagnetic field. The maximum extinction peak of a nanoparticle within the visible wavelength ((Figure 4A)), where the plasmon resonance frequency is observed, is influenced by the surrounding medium’s refractive index; this is fundamental to LSPR sensing applications [15]. The extinction spectrum of a nanoparticle with radius a is calculated as in Eq. :
where and are the real and imaginary parts of the nanoparticle’s dielectric function, respectively, is the nanoparticle’s shape factor (with typically representing a sphere), and is the dielectric constant of the surrounding medium.
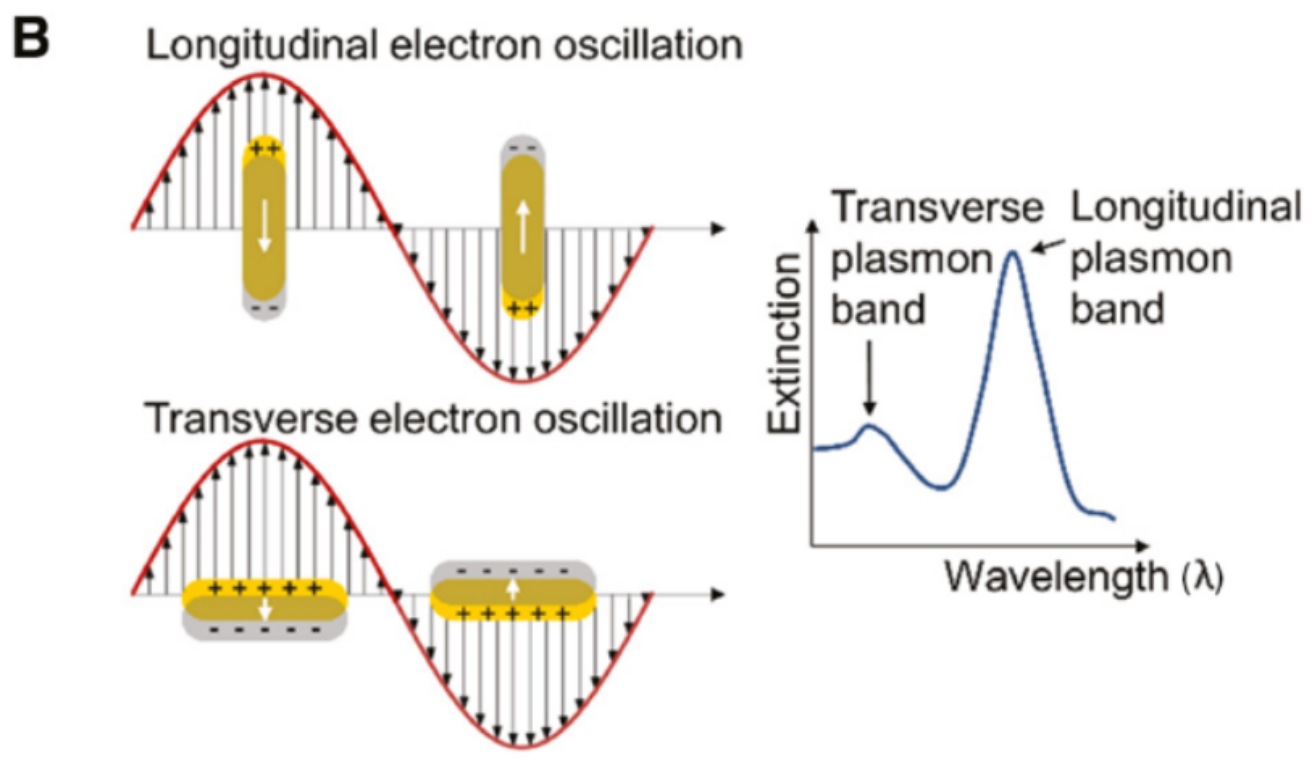
Gold nanorods (AuNRs), unlike spherical nanocrystals (Figure 4), exhibit two LSPRs due to their geometric asymmetry [16]. These correspond to the transverse and longitudinal dimensions, where the transverse resonance appears at shorter wavelengths and the longitudinal resonance at longer wavelengths. The aspect ratio (length/width) strongly influences their refractive index sensitivity, making AuNRs especially useful in enhanced LSPR applications [17]. In contrast, spherical nanoparticles exhibit a single plasmonic band due to their symmetry, with a significantly shorter decay length, making their resonance highly dependent on the immediate dielectric environment [18].
Figure 1.
Localized surface plasmon resonance excitation for spherical nanoparticles (A) and nanorods (B). The nanosphere shows a single LSPR band, sensitive to shape and refractive index. The nanorod exhibits two LSPR bands due to its longitudinal and transverse axes. Both bands shift with refractive index. Adapted from [19].
Figure 1.
Localized surface plasmon resonance excitation for spherical nanoparticles (A) and nanorods (B). The nanosphere shows a single LSPR band, sensitive to shape and refractive index. The nanorod exhibits two LSPR bands due to its longitudinal and transverse axes. Both bands shift with refractive index. Adapted from [19].
Various techniques can be employed to characterize nanoparticles for qualitative assessment and optimization. Optical methods such as Ultraviolet-Visible-Near Infrared (UV-Vis-NIR) spectroscopy and electron microscopy such as Transmission Electron Microscopy (TEM) are commonly used to determine nanoparticle characteristics like size, shape, and resonance wavelength [20]. The optical characterization offers rapid and real-time analysis, while electron microscopy (e.g., TEM) is ex-situ, more accurate for shape analysis but time-consuming and limited in sample size.
Figure 2.
Workflow of nanoparticle synthesis, characterization using UV-Vis-NIR spectroscopy and electron microscopy. Traditional methods are often slow and laborious. Predictive analytics using machine learning and computational modeling of extinction spectra offers a faster, automated alternative.
Figure 2.
Workflow of nanoparticle synthesis, characterization using UV-Vis-NIR spectroscopy and electron microscopy. Traditional methods are often slow and laborious. Predictive analytics using machine learning and computational modeling of extinction spectra offers a faster, automated alternative.
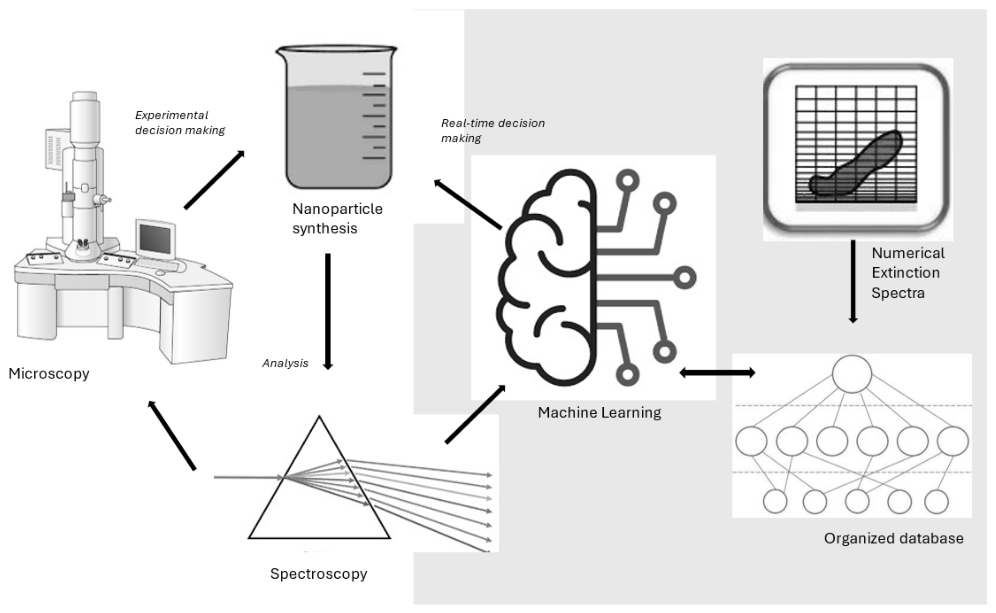
Machine learning (ML) techniques, particularly those based on supervised learning, have shown immense potential in automating the analysis of complex optical datasets [21,22,23]. When applied to extinction spectra arising from plasmonic nanostructures, ML algorithms can uncover subtle patterns and correlations that may be difficult to discern through conventional analytical approaches. Hence, by training models on synthetic or experimental spectral data, ML facilitates robust classification and regression tasks such as identifying nanoparticle geometries, predicting surrounding refractive indices, or monitoring physicochemical changes in the environment. The integration of ML with LSPR analysis enables not only enhanced sensitivity and specificity in nanoparticle characterization but also scalable, real-time decision-making frameworks for applications ranging from biosensing and environmental monitoring to smart diagnostics and lab-on-a-chip technologies [24,25,26,27]. This data-driven approach thus accelerates the development of intelligent plasmonic systems capable of adaptive learning and predictive performance [28,29,30,31].
Some previous work has been done attempting to combine LSPR and machine learning for example the study by Sestaioni [32] which presents a systematic strategy for selecting peptide epitopes to enhance molecular imprinting in polynorepinephrine (PNE)-based biosensors. By integrating LSPR, machine learning, and SPR, the authors classify epitopes based on imprinting efficiency. Feature extraction from peptide descriptors enables the identification of physicochemical properties that correlate with successful receptor formation. Validation via SPR confirms the predictive power of this approach. The workflow offers a scalable, green alternative to antibody-based detection and sets the stage for data-driven receptor design in biosensing. The work by Liang [33] presents a novel method for rapid and accurate detection of SARS-CoV-2 virus particles using LSPR sensors integrated with microscopic imaging and machine learning. By extracting detailed color features from sensor images and applying support vector machine (SVM) models, the system achieved over 97% accuracy in classifying virus presence and predicting viral concentration with values exceeding 0.95. The work done by Wang [34] introduces a deep learning-based method to evaluate the quality of optical fiber biosensor fabrication by converting LSPR spectral data into color images and analyzing them using the VGG16 model combined with PCA for visualization. The approach effectively distinguishes successful, partial, and failed nanoparticle additions, providing a fast and scientific way to assess sensor preparation.
Recent advancements have demonstrated the transformative potential of machine learning in biomedical plasmonic diagnostics, particularly in the analysis of surface plasmon resonance (SPR) and LSPR data for rapid, label-free detection of biomolecular interactions. By learning complex spectral patterns associated with disease biomarkers or molecular bindings, machine learning models can significantly enhance sensitivity, specificity, and throughput in biosensing platforms. Emerging frontiers now explore quantum machine learning (QML) for even greater analytical efficiency, leveraging quantum algorithms and study biomedical datasets [35,36,37,38,39,40,41,42]. Furthermore, quantum-enhanced plasmonic sensors, integrating entangled photon sources or quantum states of light, offer new pathways for ultra-sensitive detection, marking a convergence of quantum sensing and plasmonics with profound implications for next-generation diagnostics [43,44].
Numerical modeling of nanoparticle optical responses allows systematic study without the cost and complexity of synthesis. Mie theory (for spheres) and Gans theory (for ellipsoids) provide analytical solutions to Maxwell’s equations, predicting extinction, scattering, and absorption with high accuracy. Although Gans theory is formally derived for ellipsoids under the quasi-static approximation, its use for cylindrical nanorods with hemispherical caps is a common and practical simplification in LSPR modeling. The geometry used in this work deviates from a perfect ellipsoid, and thus Gans theory provides an approximate rather than exact description of the extinction cross-section. This approximation remains widely accepted because it reproduces the dominant spectral characteristics (e.g., transverse and longitudinal modes), but it cannot capture geometric effects such as sharp curvature transitions or size-dependent retardation effects that occur outside the quasi-static regime. This study thus aims to demonstrate an alternative characterization approach by integrating computationally generated spectra with ML to enable rapid, automated classification of nanoparticle characteristics advancing the development of high-throughput, cost-effective plasmonic sensors (Figure 5). This work looks at multiclass classification, to the best knowledge of the authors, this implementation is new and has not been implemented previously.
2. Methodology
This section details the numerical methods and computational approaches utilized for simulating the extinction spectra of spherical gold nanoparticles and gold nanorods.
2.1. Generation of Python-Based LSPR Simulations
2.1.1. Spherical Nanoparticle Simulations (Mie Theory)
The extinction spectra of spherical nanoparticles were calculated using Mie theory, implemented through the Python package miepython. Mie theory provides an analytical solution to Maxwell’s equations for electromagnetic scattering by spherical particles. The complex refractive index of gold was expressed as:
where and represent the wavelength-dependent real and imaginary refractive indices, respectively, sourced from Johnson and Christy (1972). The dimensionless size parameter x was defined as,
where r is the nanoparticle radius and is the incident wavelength. The extinction efficiency was calculated from Mie theory, and the extinction cross-section was then computed:
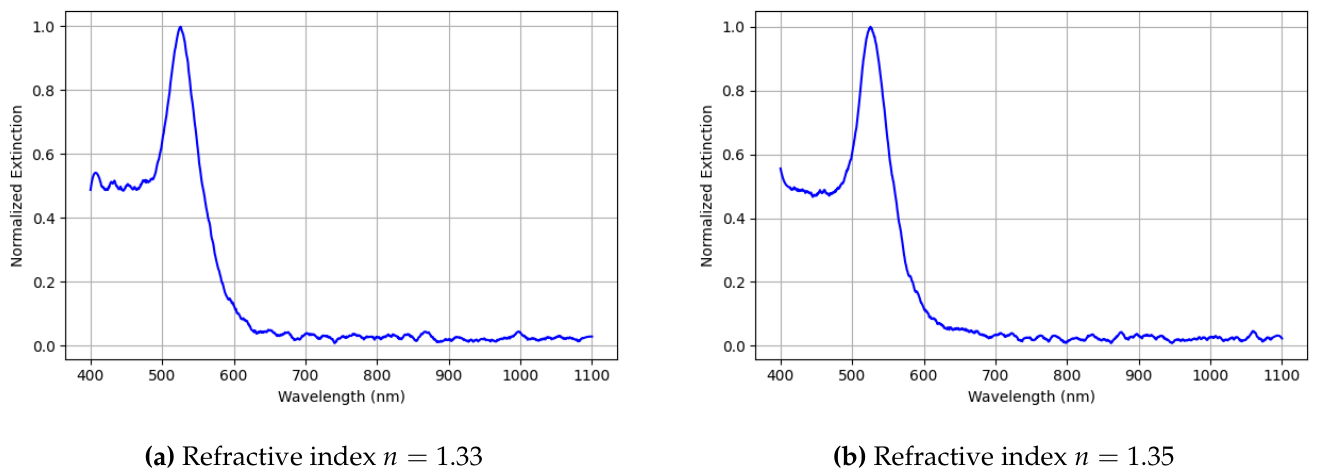
The computational implementation involved interpolation of refractive indices using NumPy and SciPy libraries, with simulated data visualized through matplotlib. Figure 3 shows the normalized extinction spectra of gold nanospheres with a radius of 50 nm in two different refractive index environments. As expected for LSPR, an increase in the surrounding refractive index from 1.33 to 1.35 results in a red-shift of the plasmon resonance peak. This shift illustrates the sensitivity of LSPR to changes in the local dielectric environment, which forms the basis for its application in biosensing and chemical sensing.
Figure 3.
Normalized extinction spectra of gold nanospheres (radius = 50 nm) at different refractive indices. The LSPR peak red-shifts as the refractive index increases, illustrating sensitivity to dielectric environment changes. These are example spectra generated in this work.
Figure 3.
Normalized extinction spectra of gold nanospheres (radius = 50 nm) at different refractive indices. The LSPR peak red-shifts as the refractive index increases, illustrating sensitivity to dielectric environment changes. These are example spectra generated in this work.
Noise Model
To assess the robustness of the machine learning model to variations in spectral quality, additive Gaussian noise was applied to the numerically generated extinction spectra. The noise followed a normal distribution , where was selected as a small fraction of the peak extinction intensity to introduce perturbations without significantly distorting the underlying spectral features. The use of Gaussian noise is a common preliminary approach for simulating measurement variability; however, it is acknowledged that this model does not fully capture the complexity of real experimental noise, which may include wavelength-dependent detector noise, baseline fluctuations, and environmental drift. Future work will incorporate empirically measured noise characteristics from UV–Vis–NIR spectrometers to construct a more realistic noise model.
2.1.2. Nanorod Simulations (Gans Theory)
For nanorods, extinction spectra were simulated using Gans theory, a generalization of Mie theory suitable for ellipsoidal shapes. Gold nanorods were modeled as cylindrical rods with hemispherical ends. The geometrical parameters were the width w and length L, with the aspect ratio . Depolarization factors (longitudinal and transverse) were computed as:
where the eccentricity e is defined as . The extinction cross-section was calculated from Gans theory as follows:
Simulations were performed using Python, incorporating interpolation for dielectric constants and geometric considerations. Gaussian noise was added to spectra to mimic experimental conditions, and the resulting spectra were normalized for consistency. These computational methods provide robust datasets to investigate nanoparticle optical properties systematically and underpin subsequent analytical techniques such as machine learning classification. Figure 4 presents the extinction spectra of gold nanorods with a length of 100 nm and a width of 30 nm in two different dielectric environments. As the refractive index increases from 1.33 to 1.35, the longitudinal LSPR peak exhibits a pronounced red-shift, demonstrating the enhanced sensitivity of nanorods to changes in the surrounding medium compared to nanospheres.
3. Numerical Generation of Extinction Spectra
3.1. Theoretical Foundations
The interaction of light with metallic nanoparticles is governed by classical electrodynamics, where the size, shape, and dielectric environment of the particle play critical roles in determining the LSPR response. For spherical nanoparticles, Mie theory offers an exact analytical solution to Maxwell’s equations, describing the scattering, absorption, and extinction of electromagnetic waves by a homogeneous sphere. This theory is particularly powerful as it accounts for multipolar contributions beyond the dipole approximation, becoming essential when particle sizes approach or exceed the Rayleigh regime. In contrast, the optical response of anisotropic particles such as nanorods cannot be accurately modeled using Mie theory alone due to their non-spherical geometry. Instead, Gans theory extends the quasi-static approximation of Mie theory by incorporating depolarization factors along different axes of ellipsoidal particles. This allows the calculation of resonance conditions and extinction cross-sections that are sensitive to both the particle’s aspect ratio and the polarization direction of incident light. The incorporation of these shape-dependent parameters enables Gans theory to predict the longitudinal and transverse plasmon modes characteristic of nanorods, providing a more realistic model for anisotropic nanoparticle behavior in LSPR sensing.
3.2. Simulation Parameters
The LSPR extinction spectra were generated using established optical models for gold nanoparticles, specifically tailored to simulate realistic experimental conditions. The key simulation parameters are summarized below:
- Wavelength Range: Simulations were conducted over a spectral range from 400 nm to 1100 nm to fully capture the visible to near-infrared LSPR signatures.
- Material Properties: The complex dielectric function of gold was sourced from the canonical dataset by Johnson and Christy (1972), ensuring high-fidelity modeling of plasmonic behavior.
- Surrounding Medium: The refractive index of the embedding medium was varied from to , corresponding to aqueous environments with slight compositional variation, relevant for biological and chemical sensing applications.
-
Particle Geometries:
- −
- Nanospheres: Radii were varied from 3 nm to 100 nm to explore size-dependent plasmonic effects across the Rayleigh to Mie scattering regimes.
- −
- Nanorods: Simulations considered widths ranging from 6 nm to 40 nm and aspect ratios from 1 (spherical) to 5 (elongated rods), enabling the study of spectral shifts in both transverse and longitudinal plasmon modes.
3.3. Computational Approach
All simulations were implemented using a Python-based computational framework, leveraging numerical libraries such as NumPy and Matplotlib for efficiency and visualization. The approach was tailored to accommodate both spherical and anisotropic geometries:
- Nanospheres: The extinction efficiency was computed using Mie theory. This was subsequently converted to extinction cross-sections by incorporating the particle’s physical radius and the geometrical optics framework. These spectra served as input for the classification of particle size and surrounding refractive index.
- Nanorods: Gans theory was applied to calculate extinction cross-sections. Depolarization factors along the longitudinal and transverse axes were derived based on the aspect ratio, and incorporated into the dielectric function model. The simulation allowed for the decomposition of LSPR spectra into distinct modal contributions, enabling classification based on subtle spectral features.
This simulation pipeline ensured that the generated spectra closely resembled experimentally measurable results, and the controlled variation of physical parameters allowed for the creation of labeled datasets suitable for supervised machine learning. The spectral trends captured by the simulations, such as red-shifts due to increasing refractive index or aspect ratio are well aligned with established experimental observations in LSPR literature.
4. Machine Learning-Based Classification of LSPR Spectra
4.1. Dataset Preparation
To facilitate machine learning classification, synthetic LSPR extinction spectra were generated for both nanospheres and nanorods under systematically varied physical and environmental conditions. These included changes in particle size (diameter for nanospheres; length and width for nanorods) as well as changes in the refractive index of the surrounding medium. For each parameter set, spectral data were mathematically computed using well-established plasmonic modeling techniques and then visualized as 2D grayscale images to emulate experimental spectroscopic outputs. Each spectrum image was preprocessed to ensure consistency and compatibility with machine learning algorithms. This preprocessing pipeline included: (i) resizing all images to a uniform dimension, (ii) conversion to grayscale to simplify the input space and reduce computational load, and (iii) flattening of the 2D image arrays into 1D feature vectors. These vectors served as the input features for the classification models. The dataset was then labeled according to the parameter being studied (e.g., refractive index class or particle dimension class), resulting in multiple structured classification tasks for both nanosphere and nanorod spectra.
4.2. Machine Learning Models
A comparative analysis of classification performance was conducted using a selection of classical machine learning algorithms with varied complexity and decision boundaries. The following supervised learning classifiers were employed:
- Support Vector Machine [45]: A margin-based classifier effective for high-dimensional data, optimized using a radial basis function kernel.
- Random Forest [46]: An ensemble learning method leveraging multiple decision trees to improve generalization and reduce variance.
- K-Nearest Neighbors [47]: A non-parametric, instance-based classifier relying on Euclidean distance to assign class labels based on majority voting from neighboring samples.
- Decision Tree [48]: A tree-based model that recursively partitions the feature space to minimize classification entropy.
- Naïve Bayes [49]: A probabilistic classifier based on Bayes’ theorem, assuming conditional independence between features.
- Logistic Regression [50]: A linear model that estimates class probabilities using the logistic (sigmoid) function to map input features into a bounded probability space.
All models were implemented using the scikit-learn Python library. The data for each classification task were split into an 80:20 train-test partition. The training subset was used to fit each model, while the performance evaluation was conducted on the held-out test set. Standard metrics including accuracy, precision, recall, and F1-score were computed to compare performance across classifiers. Where applicable, confusion matrices were also analyzed to assess classification fidelity at a per-class level, particularly for closely spaced refractive indices and geometrical configurations.
To evaluate the classification models, multiple standard metrics were employed [51]:
- Accuracy: The proportion of correctly classified samples out of the total samples.
- Precision: The proportion of true positives out of all predicted positives.
- Recall (Sensitivity): The proportion of true positives out of all actual positives.
- F1-score: The harmonic mean of precision and recall, providing a balanced measure.
Where (true positives), (true negatives), (false positives), and (false negatives) are derived from the confusion matrices of each classifier.
Dataset Size Considerations
The datasets used in this study consisted of 600–700 images per class, generated from numerical spectra. These dataset sizes were selected as practical values for training and testing the machine learning models; however, no formal analysis was conducted to determine whether these sample sizes were statistically sufficient or whether performance had converged with respect to dataset size. Common practices such as learning curve analysis, variance estimation across increasing sample sizes, or convergence diagnostics were not implemented. As such, the dataset sizes used here should be viewed as heuristic choices rather than statistically optimized values.
5. Results
In this section we show the results of the machine learning analysis.
5.1. Classification of Nanosphere LSPR Spectra by Refractive Index
In this section 700 images were generated for classification, and the dataset was balanced. Figure 5, Figure 6 and Figure 7 present the confusion matrices for the classification of nanosphere LSPR spectra, where models were trained to distinguish between surrounding media with refractive indices ranging from to . Among all evaluated models, logistic regression (LR) consistently outperformed the others, achieving an average classification accuracy of 85.00%, correctly classifying 121 out of 140 images. In contrast, K-nearest neighbor (KNN) and naïve Bayes (NB) recorded the lowest accuracy (40.71% and 45.00% respectively).
A detailed per-class analysis revealed that LR maintained high performance across all refractive indices, with particularly strong classification of to , where more than 17 correct classifications were consistently achieved. Misclassifications were primarily between adjacent refractive indices (e.g., images of were often confused with and ), which is expected given the subtle spectral differences these variations induce.
While models like SVM, DT, and RF showed moderate accuracy (approximately 67–82%), they were more prone to confusion between neighboring classes. Notably, NB exhibited the highest confusion for higher refractive indices, suggesting limitations in capturing subtle spectral shifts inherent to index variation. F1-score analysis confirmed these findings, with LR achieving a superior score of 0.85, while NB fell to 0.43. These results collectively affirm that while all models are challenged by the small spectral changes induced by refractive index variation, linear models like LR are better suited for capturing such minimal differences due to their robustness and simplicity. The quantitative performance metrics for all models, including precision, recall, and F1-scores, are summarized in Table 1, providing a comparative overview of classifier effectiveness across the evaluated scenarios.
5.2. Classification of Nanosphere LSPR Spectra by Particle Size
In this section 600 images were generated for classification, and the dataset was balanced. The classification performance for nanosphere LSPR spectra generated at varying particle sizes (radii 50 nm to 100 nm) was remarkably high across all machine learning models evaluated. In contrast to the classification challenges observed for refractive index variations, the size-dependent spectral changes provided highly distinctive features that facilitated near-perfect separability of the classes. The confusion matrices presented in Figure 8, Figure 9 and Figure 10 summarize the classification performance of the machine learning models for nanosphere size classification. As shown, the SVM, RF, KNN, and LR models achieved perfect classification, with no misclassifications across any of the six particle size classes. DT exhibited minor misclassifications between neighboring sizes, specifically between the 50 nm and 60 nm radius classes, but still maintained a high overall accuracy of 98.33%. The naïve Bayes model showed slightly more substantial misclassifications, particularly for the 60 nm and 70 nm classes, where a small portion of samples were assigned to incorrect neighboring classes. Nonetheless, NB still achieved an overall accuracy of 94.17%. These results clearly illustrate that size-dependent spectral features in nanospheres provide highly discriminative information for machine learning classifiers, resulting in near-perfect separability for most algorithms.
The SVM, LR, RF, and KNN models all achieved perfect classification accuracy of 100%, correctly identifying all images in both training and testing sets without any misclassifications. Their corresponding precision, recall, and F1-scores were uniformly 1.00 across all particle size classes, indicating flawless performance. This suggests that particle size introduces sufficiently strong spectral shifts, both in peak wavelength and extinction magnitude, allowing these algorithms to easily distinguish between classes.
The DT model also performed exceptionally well, achieving an accuracy of 98.33%. Minor misclassifications were observed between the closely spaced radii of 50 nm and 60 nm, where one sample from each class was incorrectly assigned to its neighboring class. Despite these minor errors, the DT model still demonstrated high precision and recall across most size classes, with an overall F1-score averaging 0.98. The NB algorithm, while still performing strongly relative to its performance on refractive index classification, achieved a slightly lower accuracy of 94.17%. The primary misclassifications occurred for the 60 nm and 70 nm radii, where some samples were incorrectly assigned to neighboring size classes. This decline in performance can be attributed to the algorithm’s simplifying assumptions regarding feature independence, which may not fully capture the complex correlations in extinction spectra as particle size increases.
Overall, these results confirm that particle size variations in nanospheres yield highly separable LSPR spectral features, making them more straightforward for machine learning algorithms to classify compared to subtle refractive index changes. The clear size-dependent shifts in plasmon resonance peaks serve as strong discriminatory features, allowing even relatively simple classifiers to perform with excellent accuracy. Table 2 shows the parameters for each of the algorithms used.
Interpretation of Model Performance
The near-perfect classification accuracy obtained using the synthetic datasets should be interpreted with caution. Because the numerical spectra were generated under controlled and idealized conditions with limited sources of variability, the resulting classes exhibit clear separability that may not be representative of experimental LSPR data. In practice, real nanoparticle spectra often display peak broadening, wavelength shifts, baseline drift, and increased inter-class similarity, making classification considerably more challenging. The high accuracy therefore reflects the internal consistency of the synthetic dataset rather than a proven ability of the model to generalize to experimental spectra. While Logistic Regression and Decision Tree classifiers were included to provide interpretable baselines, their interpretability was not formally analyzed in this study. In principle, LR coefficients can identify wavelength regions with the greatest discriminative power, and DTs enable visualization of the specific spectral thresholds used for classification. However, this work focused primarily on comparative performance metrics rather than interpretability. As a result, the physically relevant spectral features learned by these models were not examined, and no feature importance measures or coefficient analyses were reported. The classification results for nanoparticle diameter and geometric size demonstrate 100% accuracy across the discrete dimensions used in this study (e.g., 50, 60, 70, 80, 90, and 100 nm). However, these results rely on the assumption that particles exist only at these idealized sizes. In practical nanoparticle synthesis, precise and discrete dimensions are rarely achieved; instead, real samples typically exhibit continuous size distributions with intermediate values such as 62 nm, 74 nm, or broader polydispersity ranges. Because the simulated dataset does not contain such intermediate sizes, the classification task becomes artificially simplified, leading to clearly separable spectral classes and inflated performance metrics. This represents a key limitation of the present approach, as real experimental spectra often arise from overlapping size distributions rather than perfectly discrete particle populations.
5.3. Classification of Nanorod LSPR Spectra by Length
In this section 600 images were generated for classification, and the dataset was balanced. The classification results for nanorod LSPR spectra by length demonstrated outstanding performance across all machine learning models. As seen in Figure 11, Figure 12 and Figure 13, every classifier, i.e., SVM, DT, RF, KNN, NB, and LR, achieved perfect classification with 100% accuracy, precision, recall, and F1-score for all nanorod lengths. Unlike the more subtle spectral shifts observed in refractive index and nanosphere size classification, the nanorod length variations introduce distinct plasmon resonance shifts due to anisotropy effects, leading to well-separated feature distributions. The elongated geometry of nanorods results in more pronounced longitudinal plasmon modes, which directly correlate with length, thus producing highly distinguishable extinction spectra. This allowed the models to easily learn and separate the synthetic image features, making the task linearly separable even for simpler algorithms like naïve bayes. These results further confirm the power of synthetic spectra generation, where controlled parameter variations (in this case, nanorod lengths from 100 nm to 150 nm) translate into highly discriminative features in the image datasets. Table 3 summarizes the complete performance metrics for all classifiers.
5.4. Classification of Nanorod LSPR Spectra by Width
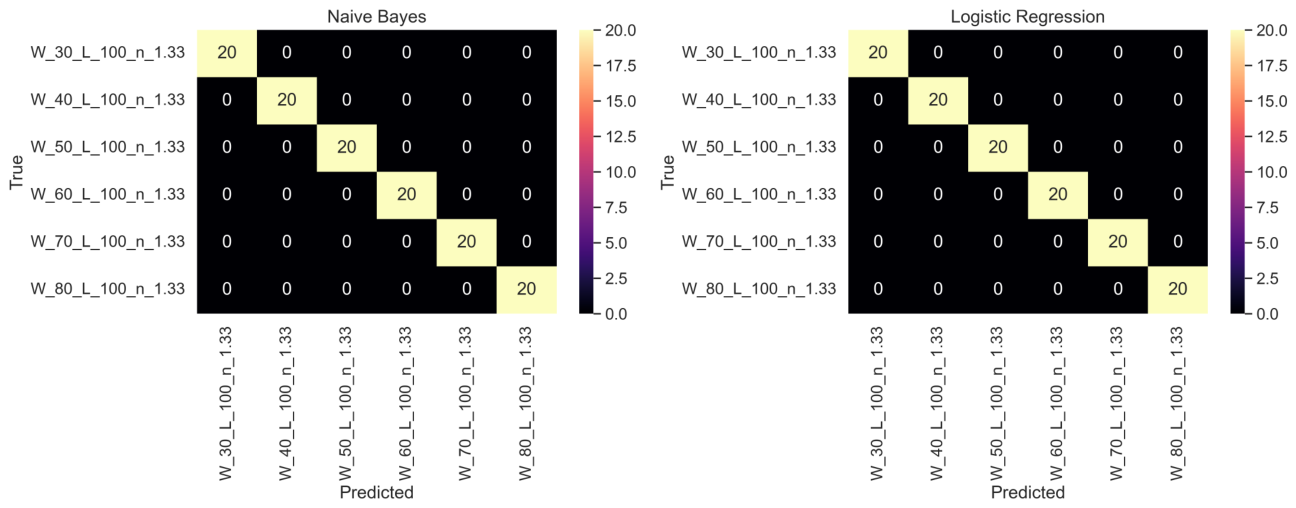
In this section 600 images were generated for classification, and the dataset was balanced. The classification performance for nanorod width-based LSPR spectra demonstrated perfect results across all six machine learning models evaluated. As summarized in Figure 14 to Figure 16, each classifier, including SVM, DT, RF, KNN, NB, and LR achieved 100% accuracy, precision, recall, and F1-score for all width classes. The superior classification performance for width variation can be attributed to the distinct plasmonic resonance shifts induced by changes in nanorod width while holding length constant. Width variations alter the transverse plasmon modes, yielding highly distinguishable spectral patterns. These distinct features resulted in highly separable feature spaces that enabled all models, even the simpler naïve bayes algorithm, to achieve flawless classification. The complete classification metrics are presented in Table 4.
Figure 14.
Confusion matrices for SVM and DT for nanorod width classification. Both models achieved 100% classification accuracy.
Figure 14.
Confusion matrices for SVM and DT for nanorod width classification. Both models achieved 100% classification accuracy.
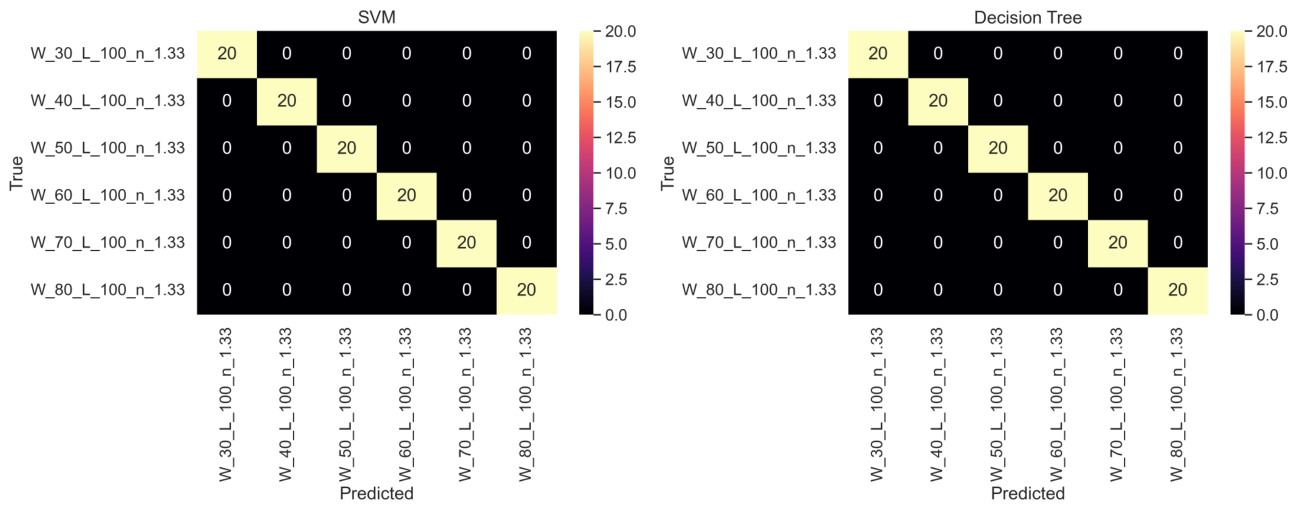
Figure 15.
Confusion matrices for RF and KNN for nanorod width classification. Both classifiers performed perfectly across all width classes.
Figure 15.
Confusion matrices for RF and KNN for nanorod width classification. Both classifiers performed perfectly across all width classes.
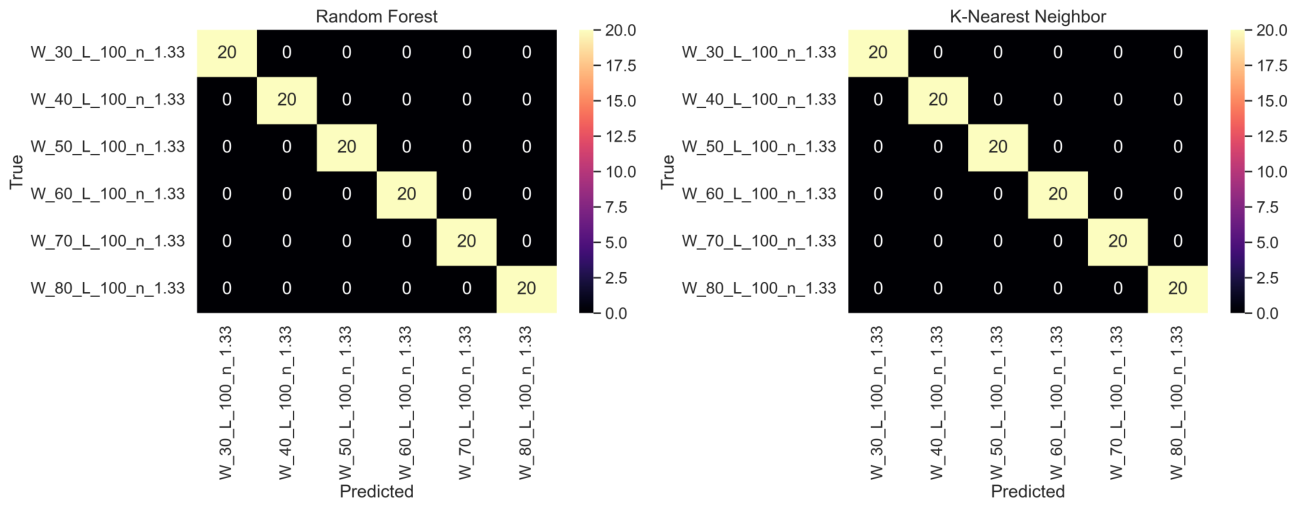
Figure 16.
Confusion matrices for NB and LR for nanorod width classification. Both classifiers achieved perfect classification accuracy.
Figure 16.
Confusion matrices for NB and LR for nanorod width classification. Both classifiers achieved perfect classification accuracy.
5.5. Classification of Nanorod LSPR Spectra by Refractive Index
In this section 600 images were generated for classification, and the dataset was balanced. The classification performance for nanorod spectra with varying refractive indices demonstrated perfect performance across all machine learning models evaluated. As seen in Figure 17, Figure 18 and Figure 19, each classifier, including SVM, DT, RF, KNN, NB, and LR achieved 100% accuracy, precision, recall, and F1-score across all refractive index classes. In this experiment, refractive index variations introduced distinct spectral shifts due to the sensitivity of the localized surface plasmon resonance to the surrounding medium. This resulted in well-separated spectral features across the classes, enabling all models to perform flawless classification. The consistency observed further demonstrates the strength of LSPR in detecting small changes in the surrounding medium’s dielectric environment when synthetic data are carefully designed.
6. Discussion
The nanorod extinction spectra in this study were generated solely using Gans theory without benchmarking against experimentally measured spectra or numerical full-wave simulations (e.g., FDTD, BEM, FEM). Because the modeled nanorods deviate from perfect ellipsoids, the geometry assumed in Gans theory, the absence of such validation introduces uncertainty regarding the fidelity of the simulated longitudinal and transverse plasmon modes, especially for larger aspect ratios or diameters approaching the non-quasi-static regime. This section presents the performance of multiple machine learning classifiers applied to synthetically generated LSPR spectra for both nanospheres and nanorods. The classifiers evaluated include SVM, DT, RF, KNN, NB, and LR. Four classification tasks were performed: nanosphere classification by particle size, nanosphere classification by surrounding refractive index, nanorod classification by length, and nanorod classification by width.
6.1. Classification of Nanosphere LSPR Spectra by Refractive Index
The classification task using refractive index variations (from to ) proved more challenging due to the subtler shifts in the spectral data. Logistic Regression demonstrated the highest classification accuracy at 85.00%, followed by Random Forest at 81.43%, and SVM at 76.43%. Decision Tree, KNN, and Naïve Bayes showed lower accuracies of 67.14%, 40.71%, and 45.00% respectively. The degradation in performance can be attributed to the smaller spectral shifts introduced by refractive index changes, which resulted in significant overlap between adjacent classes. This overlap reduced the separability of the data in feature space. The confusion matrices and classification reports are presented in Figure 5, Figure 6 and Figure 7 and Table 1.
6.2. Classification of Nanosphere LSPR Spectra by Particle Size
The models achieved exceptional performance when classifying nanosphere spectra by particle size (radii ranging from 50 nm to 100 nm). All classifiers, except for Naïve Bayes and Decision Tree, attained perfect classification accuracy of 100%. Both Decision Tree and Naïve Bayes achieved accuracies of 98.33% and 94.17%, respectively. These results highlight the strong spectral distinction between size classes, which allowed most classifiers to perfectly separate the features. The confusion matrices for all classifiers are illustrated in Figure 8, Figure 9 and Figure 10, and detailed performance metrics are summarized in Table 2.
6.3. Classification of Nanorod LSPR Spectra by Length
When classifying nanorods based on their length (ranging from 100 nm to 150 nm), all classifiers achieved 100% accuracy. The high accuracy can be attributed to the stronger plasmonic sensitivity to nanorod aspect ratio changes, which result in more pronounced spectral shifts and better separability of features. This suggests that nanorod length variations introduce highly linearly separable features in the LSPR spectra, facilitating perfect classification by even simple classifiers. The confusion matrices for this task are shown in Figure 11, Figure 12 and Figure 13, and summarized in Table 3.
6.4. Classification of Nanorod LSPR Spectra by Width
Similarly, classification based on nanorod width (ranging from 30 nm to 80 nm) resulted in perfect classification accuracy (100%) across all models. This again highlights the significant sensitivity of the extinction spectra to geometric variations in nanorods. The resulting spectral features were sufficiently distinct to allow full separability across all width categories. Confusion matrices for this experiment are illustrated in Figure 14, Figure 15 and Figure 16, and full performance metrics are provided in Table 4.
6.5. Summary of Classifier Performance for All Experiments
The overall classification accuracy across all experiments and models is summarized in Table 6, highlighting that most classifiers achieved perfect accuracy for geometry-based classification (nanorod length and width, and nanosphere size), while refractive index classification of nanospheres proved more challenging, particularly for KNN and Naïve Bayes.
7. Limitations
The present study was intentionally formulated as a theoretical proof-of-concept based on analytically generated spectra, and several methodological limitations must therefore be acknowledged. All data were derived from a single synthetic generation framework without independent external test sets, and model evaluation relied on a single 80:20 train–test split without cross-validation or uncertainty estimation, which may lead to optimistic performance estimates. Discrete and widely spaced geometric classes, together with idealized Gaussian noise modeling, likely produce overly separable feature distributions compared to realistic polydisperse nanoparticle ensembles and experimental spectroscopy conditions. Furthermore, the transformation of one-dimensional spectra into two-dimensional grayscale images was adopted for computational convenience and was not benchmarked against direct one-dimensional learning approaches, leaving the data representation methodologically unsupported. No hyperparameter optimization or feature importance analysis was performed, preventing assessment of whether classification decisions rely on physically meaningful plasmonic features or on artefacts of the synthetic dataset. Consequently, the reported results should be interpreted as a feasibility demonstration under controlled theoretical conditions rather than as evidence of robust generalization to experimentally measured LSPR spectra.
Despite the strong performance of the machine learning models demonstrated in this work, several limitations must be acknowledged. First, the application of Gans theory to model gold nanorods introduces inherent geometric approximations. Gans theory is formally valid only for ideal ellipsoids in the quasi-static limit; however, in this study the nanorods were represented as cylinders with hemispherical caps, a geometry that deviates from true ellipsoidal shapes. While this approximation captures the dominant longitudinal and transverse plasmon modes, it does not fully account for curvature discontinuities, higher-order multipolar contributions, or deviations arising from the non-ellipsoidal boundaries of real nanorods. As such, the simulated extinction spectra may not perfectly reflect the optical response of experimentally synthesized nanorods. A second limitation is the absence of validation against either experimental measurements or full-wave electromagnetic simulations. The extinction spectra generated using Gans theory were not benchmarked against UV–Vis–NIR measurements or numerical solutions of Maxwell’s equations (such as finite-difference time-domain (FDTD), finite element method (FEM), or boundary element method (BEM) simulations). Such validation would enable quantification of the modeling error introduced by applying Gans theory to non-ellipsoidal nanorod geometries. Without this benchmarking, the fidelity of the synthetic spectra used to train the machine learning classifiers remains unverified, and the perfect classification accuracies reported for nanorod geometrical variations should therefore be interpreted with caution. These limitations highlight the importance of incorporating more rigorous electromagnetic modeling and experimental benchmarking to ensure that numerically generated LSPR spectra accurately reflect real nanoparticle behavior. Although this study employed inherently interpretable machine learning models such as LR and DT, no analysis of feature importance or model interpretability was provided. For spectral classification tasks, interpretability is critical for understanding which wavelength regions or spectral features contribute most strongly to model decisions. The absence of such analysis limits the ability to assess whether the models are learning physically meaningful spectral patterns, such as peak positions, peak widths, or refractive-index-induced shifts. Furthermore, without feature importance or decision-rule inspection, it is difficult to determine whether the models exploit artefacts of the synthetic dataset rather than robust plasmonic signatures.
Another limitation of this study is the conversion of one-dimensional extinction spectra into two-dimensional grayscale images for machine learning classification. While this transformation enables the use of convolutional neural networks, it introduces additional dimensionality that does not naturally arise from the underlying physical data. The process of mapping a 1D signal onto a 2D pixel grid may distort spectral relationships, alter peak shapes, or introduce interpolation artefacts that are not present in the raw spectral domain. Since no explicit justification was provided for why a 2D representation is advantageous over direct 1D feature learning, the added dimensionality may be unnecessary and could obscure physically meaningful spectral trends. Future work should evaluate whether 1D models, such as CNNs designed for sequential data, recurrent neural networks, or transformer-based architectures, offer more appropriate representations for LSPR spectra. A further limitation of this study is the use of a single 80:20 train–test split for model evaluation without additional validation techniques. Reliance on a single partitioning of the data risks overfitting to the specific split and may lead to an overestimation of the model’s true generalization performance. Standard practices in machine learning, such as k-fold cross-validation or repeated random subsampling, provide more robust performance estimates by averaging results over multiple train–test configurations. The absence of such procedures in the present work means that the reported classification accuracies should be interpreted with caution, as they may not fully reflect the model’s performance on unseen or experimentally measured spectra. The machine learning models in this study achieved perfect (100%) classification accuracy across several tasks. While these results demonstrate that the synthetic datasets are internally consistent and easily separable, such high performance also indicates that the generated spectra may lack the level of variability, overlap, and noise typically present in real experimental measurements. Synthetic spectra generated under idealized conditions, combined with simplified noise models, may not fully reflect the heterogeneity arising from fabrication tolerances, instrumental drift, wavelength calibration errors, baseline instability, or environmental fluctuations. As a result, the reported accuracies likely overestimate the true generalization capability of the classifier when applied to real-world LSPR datasets.
8. Future Work
Future work will focus on addressing the geometric and electromagnetic modeling limitations identified in this study. A key direction will be the validation of the Gans-theory-generated nanorod spectra through direct comparison with experimentally measured extinction spectra obtained from gold nanorods synthesized with controlled width, length, and aspect ratio distributions. Such benchmarking will provide a quantitative measure of the deviation between Gans theory predictions and real nanoparticle optical responses, particularly for cylindrical nanorods with hemispherical caps. In addition to experimental validation, future investigations will incorporate full-wave electromagnetic simulations to overcome the geometric restrictions of Gans theory. Methods such as finite-difference time-domain (FDTD), finite element method (FEM), and boundary element method (BEM) solve Maxwell’s equations without relying on the quasi-static or ellipsoidal approximations, thereby offering high-fidelity predictions of extinction spectra. Comparing Gans-theory-derived results with these numerical approaches will enable identification of systematic discrepancies and guide the development of correction factors or hybrid modeling frameworks. Finally, integrating experimentally validated or full-wave simulated spectra into the machine learning pipeline will produce more realistic training datasets and enhance the generalizability of classification models to real-world nanoparticle systems. Future work will also will also investigate deep learning architectures, spectral feature engineering, and data augmentation strategies to further strengthen the performance and robustness of automated LSPR-based nanoparticle characterization. Future work will aswell incorporate explicit interpretability analyses for LR, DT, and other transparent models. For LR, coefficient inspection and regularization-path analysis will be used to identify the most informative wavelength regions. For DTs, feature importance scores and rule extraction will be examined to determine which spectral features drive classification. Additionally, model-agnostic interpretability tools such as SHAP or LIME will be applied to evaluate feature contributions across different model families. These approaches will clarify whether the classifiers rely on physically meaningful plasmonic features or on artefacts introduced during synthetic data generation. Future work will also incorporate comprehensive error analysis and uncertainty quantification in both the simulation and classification pipelines. Monte Carlo sampling of geometric parameters, stochastic noise realizations, and perturbations to the dielectric function will be employed to generate uncertainty bounds on the simulated spectra. For the machine learning models, repeated cross-validation, bootstrapping, and confidence interval estimation will be used to quantify variability in classification accuracy. These steps will provide a more statistically rigorous assessment of model robustness and improve the reliability of conclusions drawn from both numerical and machine learning analyses. Future work will incorporate training and testing on independent datasets to more accurately assess model generalizability. This includes generating separate simulation batches with varied particle geometries, noise characteristics, and dielectric perturbations, as well as evaluating the classifier on experimental LSPR spectra not seen during training. Such strategies will help determine whether the model can robustly distinguish spectral features under realistic variability conditions. In addition, domain adaptation and transfer learning techniques will be explored to bridge the gap between synthetic and experimental data distributions. Future work will include detailed spectral visualizations that present representative LSPR extinction curves under varying particle diameters, nanorod aspect ratios, and refractive index conditions. Such figures will explicitly show the red-shift behavior and quantify the corresponding peak wavelength shift () as particle dimensions change. These spectral trends will also be correlated with the machine learning classification results to provide clearer physical interpretation and to support the development of more robust regression-based models for continuous particle size prediction. The earlier inconsistency in the reported particle size range may have caused confusion regarding the scope of the simulations. Only particles between 50 nm and 100 nm were modeled, meaning that size-dependent quantum effects expected for particles below 20–30 nm were not included. Future work will consider a broader and experimentally validated range of nanoparticle sizes.
9. Conclusions
This work successfully integrates robust numerical modeling techniques with classical machine learning approaches for gold nanoparticle characterization. The generated datasets provide a strong foundation for extending machine learning applications to nanoparticle size and aspect ratio classification, offering a powerful complement to experimental spectroscopy. In this study, we demonstrated the feasibility of applying machine learning algorithms to classify LSPR spectra generated from mathematically simulated nanosphere and nanorod models. The classification tasks covered four key variations: nanosphere size, nanosphere refractive index, nanorod length, and nanorod width. The findings confirm that geometric variations, both in size and aspect ratio, induce sufficiently distinct spectral signatures that enable near-perfect classification by most machine learning algorithms tested. In particular, nanorod length and width variations produced fully separable datasets, leading to perfect accuracy across all classifiers. Conversely, refractive index variations resulted in more challenging classification scenarios, with LR and RF outperforming other models due to their better generalization on subtle spectral shifts. These outcomes suggest that machine learning offers a highly promising tool for automated LSPR-based sensing and diagnostics, particularly for geometric classification of nanoparticles. For refractive index-based sensing, further work incorporating advanced feature extraction techniques, such as principal component analysis, convolutional neural networks, or spectral feature engineering, may improve model sensitivity and accuracy. This work has the capacity to drive the development of next-generation biosensors. Future studies will focus on expanding this framework to experimentally acquired spectra, exploring additional particle shapes, data augmentation, deep learning algorithms and incorporating noise and variability inherent to practical biosensing environments. As well, in future work we will look at hyperparameter optimization to improve low-accuracy models.
Author Contributions
M.M., K.M., and N.T. contributed to the analysis and writing of the paper. M.L., T.L., C.W., and P.M. contributed to the review.
Funding
This research was supported by the CSIR and DSI. K.M. was also supported by the South African Quantum Technology Initiative (SAQuTi) and South African Medical Research Council (SAMRC).
Institutional Review Board Statement
not applicable.
Informed Consent Statement
not applicable.
Data Availability Statement
The plasmonic dataset used for this work is available at https://github.com/mpofukelvintafadzwa/Plasmonic-dataset-generated.
Acknowledgments
In this section you can acknowledge any support given which is not covered by the author contribution or funding sections. This may include administrative and technical support, or donations in kind (e.g., materials used for experiments).
Conflicts of Interest
The authors declare that they have no competing interests.
Abbreviations
The following abbreviations are used in this manuscript:
| ML | Machine Learning |
| LSPR | Localized Surface Plasmon Resonance |
| SPR | Surface Plasmon Resonance |
| SVM | Support Vector Machine |
| RF | Random Forest |
| KNN | K-Nearest Neighbors |
| DT | Decision Tree |
| NB | Naïve Bayes |
| LR | Logistic Regression |
| QML | Quantum Machine Learning |
| QSP | Quantum Sensing Plasmonics |
| RI | Refractive Index |
| F1 | F1-score (Harmonic mean of precision and recall) |
| AUC | Area Under the Curve |
| PCA | Principal Component Analysis |
| ROC | Receiver Operating Characteristic |
References
- Mayer, K.M.; Hafner, J.H. Localized surface plasmon resonance sensors. Chem. Rev. 2011, 111, 3828–3857. [Google Scholar] [CrossRef] [PubMed]
- Willets, K.A.; Van Duyne, R.P. Localized surface plasmon resonance spectroscopy and sensing. Annu. Rev. Phys. Chem. 2007, 58, 267–297. [Google Scholar] [CrossRef] [PubMed]
- Singh, P. LSPR biosensing: Recent advances and approaches. In Reviews in Plasmonics; 2016 2017; pp. 211–238. [Google Scholar]
- Mcoyi, M.; Lugongolo, M.; Williamson, C.; Mpofu, K.; Ombinda-Lemboumba, S.; Mthunzi-Kufa, P. Detection of mutations using a localized surface plasmon resonance biosensor. Proc. Opt. Interact. With Tissue Cells XXXV. SPIE 2024, Vol. 12840, 62–68. [Google Scholar] [CrossRef]
- Kabir, M.A.; Zilouchian, H.; Caputi, M.; Asghar, W. Advances in HIV diagnosis and monitoring. Crit. Rev. Biotechnol. 2020, 40, 623–638. [Google Scholar] [CrossRef] [PubMed]
- Lee, J.H.; Kim, B.C.; Oh, B.K.; Choi, J.W. Highly sensitive localized surface plasmon resonance immunosensor for label-free detection of HIV-1. Nanomed. Nanotechnol. Biol. Med. 2013, 9, 1018–1026. [Google Scholar] [CrossRef]
- Gulati, S.; Singh, P.; Diwan, A.; Mongia, A.; Kumar, S. Functionalized gold nanoparticles: promising and efficient diagnostic and therapeutic tools for HIV/AIDS. RSC Med. Chem. 2020, 11, 1252–1266. [Google Scholar] [CrossRef] [PubMed]
- Lee, J.H.; Oh, B.K.; Choi, J.W. Development of a HIV-1 virus detection system based on nanotechnology. Sensors 2015, 15, 9915–9927. [Google Scholar] [CrossRef] [PubMed]
- Mpofu, K. Quantum plasmonic sensing with application to hiv research. PhD thesis, 2020. [Google Scholar]
- Gupta, A.K.; Singh, A.; Singh, S. Diagnosis of tuberculosis: nanodiagnostics approaches. NanoBioMedicine 2020, 261–283. [Google Scholar] [CrossRef]
- Sun, W.; Yuan, S.; Huang, H.; Liu, N.; Tan, Y. A label-free biosensor based on localized surface plasmon resonance for diagnosis of tuberculosis. J. Microbiol. Methods 2017, 142, 41–45. [Google Scholar] [CrossRef] [PubMed]
- Chauke, S.H.; Nzuza, S.; Ombinda-Lemboumba, S.; Abrahamse, H.; Dube, F.S.; Mthunzi-Kufa, P. Advances in the detection and diagnosis of Tuberculosis using optical-based devices. Photodiagnosis Photodyn. Ther. 2024, 45, 103906. [Google Scholar] [PubMed]
- Mpofu, K.; Chauke, S.; Thwala, L.; Mthunzi-Kufa, P. Aptamers and antibodies in optical biosensing. Discov. Chem. 2025, 2, 23. [Google Scholar] [CrossRef]
- Mcoyi, M.; Lugongolo, M.; Williamson, C.; Mpofu, K.; Ombinda-Lemboumba, S.; Ndlovu, S.; Mthunzi-Kufa, P. Evaluation of the limit of detection of the localized surface plasmon resonance label-free biosensor. Proc. Opt. Interact. With Tissue Cells XXXV. SPIE 2024, Vol. 12840, 104–110. [Google Scholar]
- Mcoyi, M.P.; Mpofu, K.T.; Sekhwama, M.; Mthunzi-Kufa, P. Developments in localized surface plasmon resonance. Plasmonics 2024, 1–40. [Google Scholar]
- Zheng, J.; Cheng, X.; Zhang, H.; Bai, X.; Ai, R.; Shao, L.; Wang, J. Gold nanorods: the most versatile plasmonic nanoparticles. Chem. Rev. 2021, 121, 13342–13453. [Google Scholar] [CrossRef] [PubMed]
- Ruan, Q.; Fang, C.; Jiang, R.; Jia, H.; Lai, Y.; Wang, J.; Lin, H.Q. Highly enhanced transverse plasmon resonance and tunable double Fano resonances in gold@ titania nanorods. Nanoscale 2016, 8, 6514–6526. [Google Scholar] [CrossRef] [PubMed]
- Ghosh, S.K.; Pal, T. Interparticle coupling effect on the surface plasmon resonance of gold nanoparticles: from theory to applications. Chem. Rev. 2007, 107, 4797–4862. [Google Scholar] [CrossRef] [PubMed]
- Xavier, J.; Vincent, S.; Meder, F.; Vollmer, F. Advances in optoplasmonic sensors–combining optical nano/microcavities and photonic crystals with plasmonic nanostructures and nanoparticles. Nanophotonics 2018, 7, 1–38. [Google Scholar]
- Belauzaran Sanz, X. Data-driven prediction of nanoparticle geometry in real time. 2021. [Google Scholar]
- Musumeci, F.; Rottondi, C.; Nag, A.; Macaluso, I.; Zibar, D.; Ruffini, M.; Tornatore, M. An overview on application of machine learning techniques in optical networks. IEEE Commun. Surv. Tutor. 2018, 21, 1383–1408. [Google Scholar] [CrossRef]
- Tsebesebe, N.; Mpofu, K.; Ndlovu, S.; Sivarasu, S.; Mthunzi-Kufa, P. Detection of SARS-CoV-2 from raman spectroscopy data using machine learning models. Proc. MATEC Web Conf. EDP Sci. 2023, Vol. 388, 07002. [Google Scholar]
- Mpofu, K.T.; Mthunzi-Kufa, P. Recent advances in artificial intelligence and machine learning based biosensing technologies. 2025. [Google Scholar] [CrossRef] [PubMed]
- Sekhwama, M.; Mpofu, K.; Sudesh, S.; Mthunzi-Kufa, P. Integration of microfluidic chips with biosensors. Discov. Appl. Sci. 2024, 6, 458. [Google Scholar] [CrossRef]
- Sekhwama, M.; Mpofu, K.; Sivarasu, S.; Mthunzi-Kufa, P. Applications of microfluidics in biosensing. Discov. Appl. Sci. 2024, 6, 303. [Google Scholar] [CrossRef]
- Tsebesebe, N.T.; Mpofu, K.; Sivarasu, S.; Mthunzi-Kufa, P. Arduino-based devices in healthcare and environmental monitoring. Discov. Internet Things 2025, 5, 1–31. [Google Scholar] [CrossRef]
- Thwala, L.N.; Ndlovu, S.C.; Mpofu, K.T.; Lugongolo, M.Y.; Mthunzi-Kufa, P. Nanotechnology-based diagnostics for diseases prevalent in developing countries: current advances in point-of-care tests. Nanomaterials 2023, 13, 1247. [Google Scholar] [PubMed]
- Mpofu, K.; Lee, C.; Maguire, G.; Kruger, H.; Tame, M. Experimental measurement of kinetic parameters using quantum plasmonic sensing. J. Appl. Phys. 2022, 131. [Google Scholar] [CrossRef]
- Mpofu, K.; Lee, C.; Maguire, G.; Kruger, H.; Tame, M. Measuring kinetic parameters using quantum plasmonic sensing. Phys. Rev. A 2022, 105, 032619. [Google Scholar] [CrossRef]
- Mpofu, K.; Ombinda-Lemboumba, S.; Mthunzi-Kufa, P. Classical and quantum surface plasmon resonance biosensing. Int. J. Opt. 2023, 2023, 5538161. [Google Scholar] [CrossRef]
- Mpofu, K.; Mthunzi-Kufa, P. Enhanced signal-to-noise ratio in quantum plasmonic image sensing including loss and varying photon number. Phys. Scr. 2023, 98, 115115. [Google Scholar]
- Sestaioni, D.; Ciacci, G.; Barucci, A.; Palladino, P.; Scarano, S. Rational Design of Peptides for Epitope Imprinting of Polynorepinephrine: A Plasmonic and Machine Learning Integrated Approach. Biosens. Bioelectron. X 2025, 100638. [Google Scholar]
- Liang, J.; Zhang, W.; Qin, Y.; Li, Y.; Liu, G.L.; Hu, W. Applying machine learning with localized surface plasmon resonance sensors to detect SARS-CoV-2 particles. Biosensors 2022, 12, 173. [Google Scholar] [PubMed]
- Wang, J.; Ran, P.; Luo, Y.; Tian, P.; Mao, Y. The Study of LSPR Biosensor Data Processing Based on Deep Learning. In Proceedings of the 2021 5th International Conference on Communication and Information Systems (ICCIS); IEEE, 2021; pp. 124–128. [Google Scholar]
- Rani, S.; Pareek, P.K.; Kaur, J.; Chauhan, M.; Bhambri, P. Quantum machine learning in healthcare: Developments and challenges. In Proceedings of the 2023 IEEE International Conference on Integrated Circuits and Communication Systems (ICICACS); IEEE, 2023; pp. 1–7. [Google Scholar]
- Swati, I.U.H.; Khanna, A. Quantum Machine Learning (QML) Algorithms for Smart Biomedical Applications. In Artificial Intelligence and Optimization Techniques for Smart Information System Generations; CRC Press; pp. 150–171.
- Ullah, U.; Garcia-Zapirain, B. Quantum machine learning revolution in healthcare: a systematic review of emerging perspectives and applications. IEEE Access 2024, 12, 11423–11450. [Google Scholar] [CrossRef]
- Li, R.Y.; Gujja, S.; Bajaj, S.R.; Gamel, O.E.; Cilfone, N.; Gulcher, J.R.; Lidar, D.A.; Chittenden, T.W. Quantum processor-inspired machine learning in the biomedical sciences. Patterns 2021, 2. [Google Scholar] [CrossRef] [PubMed]
- Maheshwari, D.; Garcia-Zapirain, B.; Sierra-Sosa, D. Quantum machine learning applications in the biomedical domain: A systematic review. Ieee Access 2022, 10, 80463–80484. [Google Scholar] [CrossRef]
- Mpofu, K.; Mthunzi-Kufa, P. Quantum convolutional neural networks for malaria cell classification: A comparative study with classical CNNs. Proc. MATEC Web Conf. EDP Sci. 2024, Vol. 406, 06001. [Google Scholar] [CrossRef]
- Mpofu, K.; Mthunzi-Kufa, P. Application of quantum computers to phase-based quantum biosensing experiments. In Proceedings of the Proceedings of the 9th military information and communication symposium of South Africa (MICSSA 2023), 2023; CSIR. CSIR; pp. 29–36. [Google Scholar]
- Mpofu, K.; Mthunzi-Kufa, P. Parametrized Quantum Circuits for Reinforcement Learning. In Proceedings of the 2024 4th International Multidisciplinary Information Technology and Engineering Conference (IMITEC); IEEE, 2024; pp. 240–251. [Google Scholar]
- Mpofu, K.T.; Mthunzi-Kufa, P. Recent Advances in Quantum Biosensing Technologies. 2024. [Google Scholar] [CrossRef] [PubMed]
- Mpofu, K.T.; Tsebesebe, N.; Manoto, S. Classical and Quantum Artificial Intelligence and Blockchain Technologies for Next-Generation Biosensing Systems. 2026. [Google Scholar] [CrossRef] [PubMed]
- Mammone, A.; Turchi, M.; Cristianini, N. Support vector machines. Wiley Interdiscip. Rev. Comput. Stat. 2009, 1, 283–289. [Google Scholar] [CrossRef]
- Parmar, A.; Katariya, R.; Patel, V. A review on random forest: An ensemble classifier. In Proceedings of the International conference on intelligent data communication technologies and internet of things, 2018; Springer; pp. 758–763. [Google Scholar]
- Kramer, O.; Kramer, O. K-nearest neighbors. Dimens. Reduct. With Unsupervised Nearest Neighbors 2013, 13–23. [Google Scholar] [CrossRef]
- De Ville, B. Decision trees. Wiley Interdiscip. Rev. Comput. Stat. 2013, 5, 448–455. [Google Scholar] [CrossRef]
- Webb, G.I. Naïve bayes. In Encyclopedia of machine learning and data mining; Springer, 2017; pp. 895–896. [Google Scholar]
- Hosmer, D.W., Jr.; Lemeshow, S.; Sturdivant, R.X. Applied logistic regression; John Wiley & Sons, 2013. [Google Scholar]
- Erickson, B.J.; Kitamura, F. Magician’s corner: 9. Performance metrics for machine learning models. 2021. [Google Scholar] [CrossRef] [PubMed]
Figure 4.
Normalized extinction spectra of gold nanorods (length = 100 nm, width = 30 nm) at different refractive indices. A red-shift in the longitudinal plasmon resonance peak is observed as the refractive index increases from 1.33 to 1.35, highlighting the nanorod’s strong sensitivity to the local dielectric environment.
Figure 4.
Normalized extinction spectra of gold nanorods (length = 100 nm, width = 30 nm) at different refractive indices. A red-shift in the longitudinal plasmon resonance peak is observed as the refractive index increases from 1.33 to 1.35, highlighting the nanorod’s strong sensitivity to the local dielectric environment.
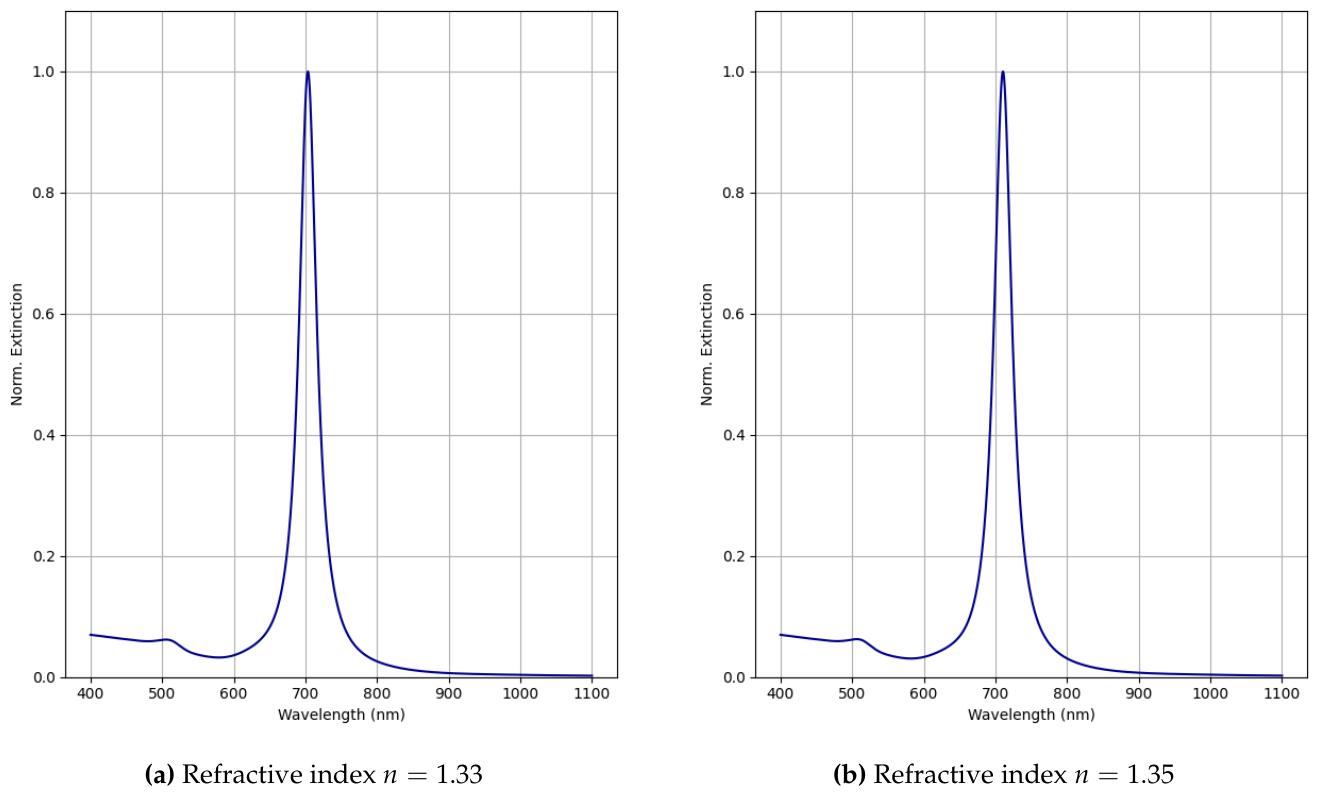
Figure 5.
Confusion matrices for SVM and DT algorithms for changing refractive index. R50 stands for a radius of 50 nm, and n1.33 is a refractive index of 1.33.
Figure 5.
Confusion matrices for SVM and DT algorithms for changing refractive index. R50 stands for a radius of 50 nm, and n1.33 is a refractive index of 1.33.
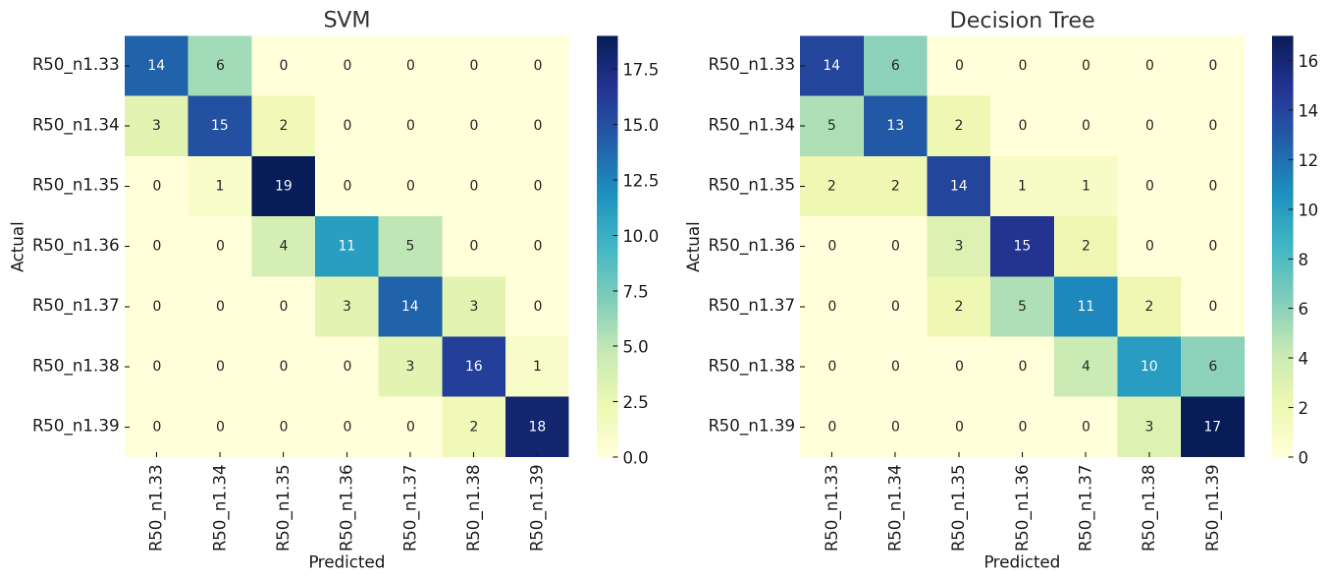
Figure 6.
Confusion matrices for RF and KNN. R50 stands for a radius of 50 nm, and n1.33 is a refractive index of 1.33.
Figure 6.
Confusion matrices for RF and KNN. R50 stands for a radius of 50 nm, and n1.33 is a refractive index of 1.33.
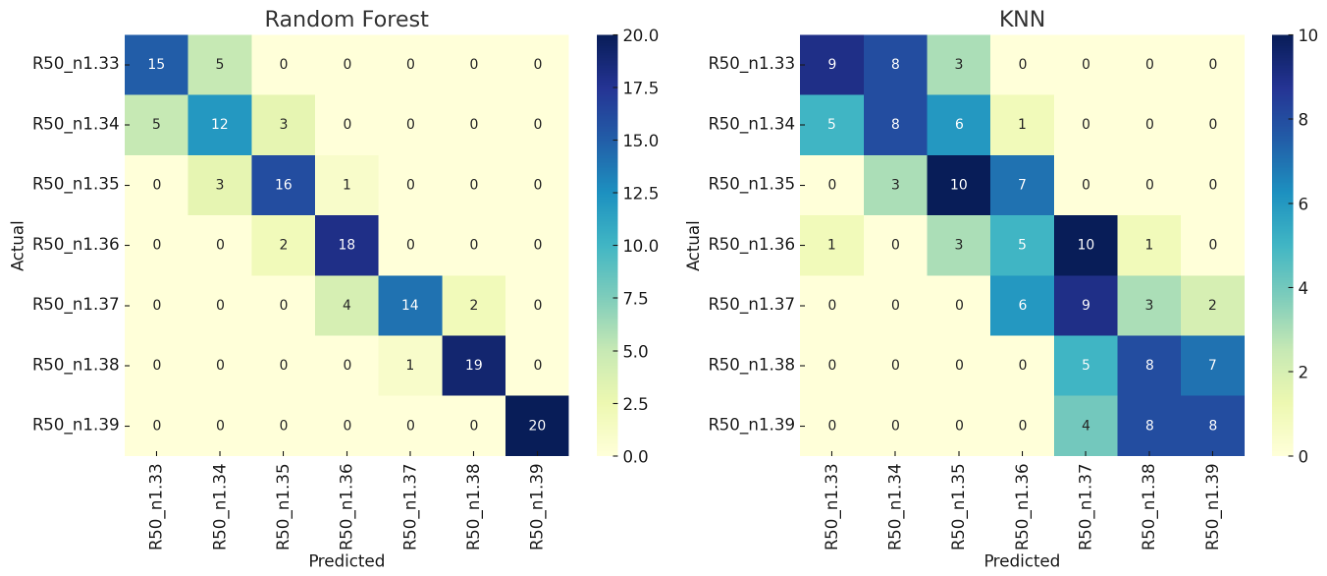
Figure 7.
Confusion matrices for NB and LR. R50 stands for radius of 50 nm, and n1.33 is a refractive index of 1.33.
Figure 7.
Confusion matrices for NB and LR. R50 stands for radius of 50 nm, and n1.33 is a refractive index of 1.33.
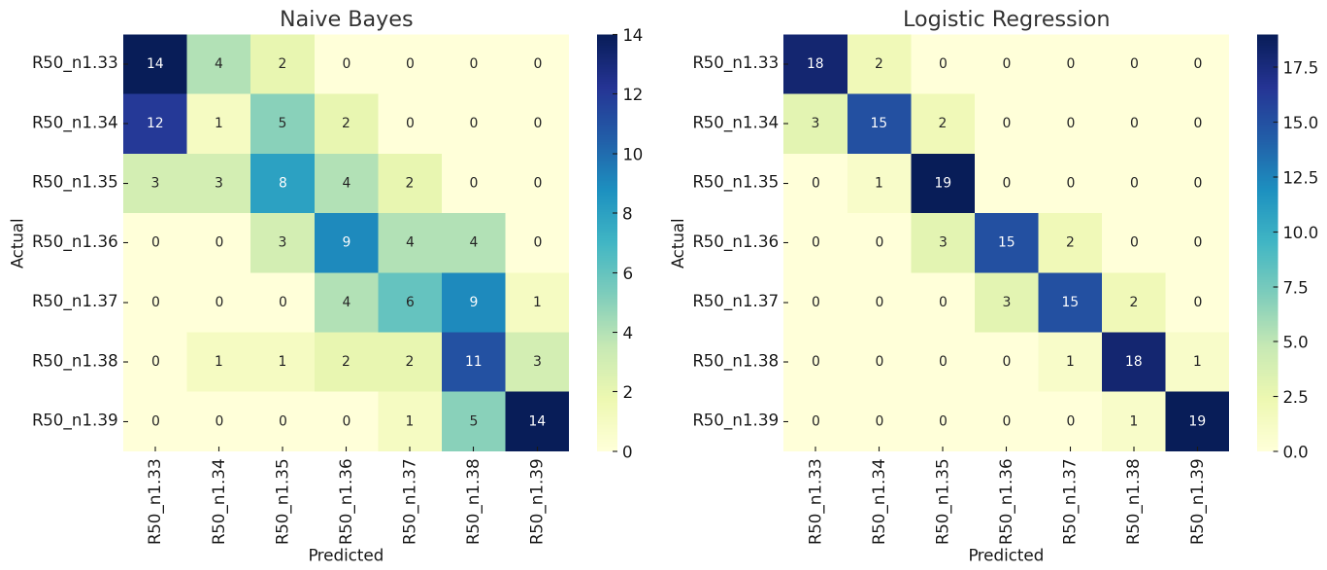
Figure 8.
Confusion matrices for SVM and DT for nanosphere size classification. Both models demonstrated strong classification performance, with SVM achieving perfect classification and DT showing minor misclassifications between adjacent size classes.
Figure 8.
Confusion matrices for SVM and DT for nanosphere size classification. Both models demonstrated strong classification performance, with SVM achieving perfect classification and DT showing minor misclassifications between adjacent size classes.
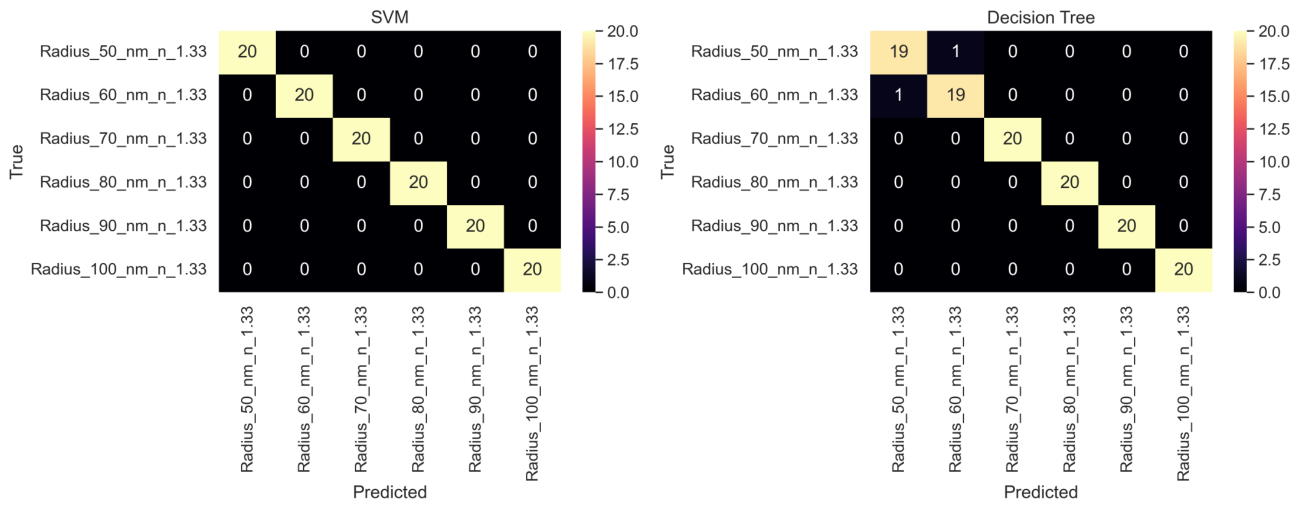
Figure 9.
Confusion matrices for RF and KNN for nanosphere size classification. Both models achieved perfect classification across all nanosphere sizes.
Figure 9.
Confusion matrices for RF and KNN for nanosphere size classification. Both models achieved perfect classification across all nanosphere sizes.
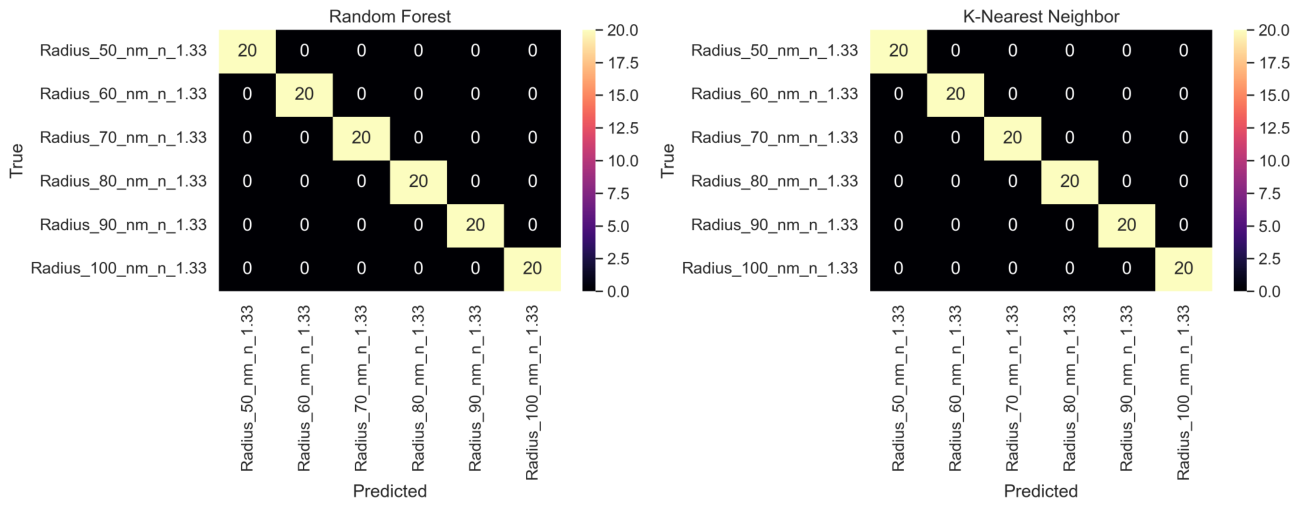
Figure 10.
Confusion matrices for NB and LR for nanosphere size classification. While logistic regression achieved perfect accuracy, the naïve bayes classifier exhibited moderate misclassifications, particularly for the 60 nm and 70 nm size classes.
Figure 10.
Confusion matrices for NB and LR for nanosphere size classification. While logistic regression achieved perfect accuracy, the naïve bayes classifier exhibited moderate misclassifications, particularly for the 60 nm and 70 nm size classes.
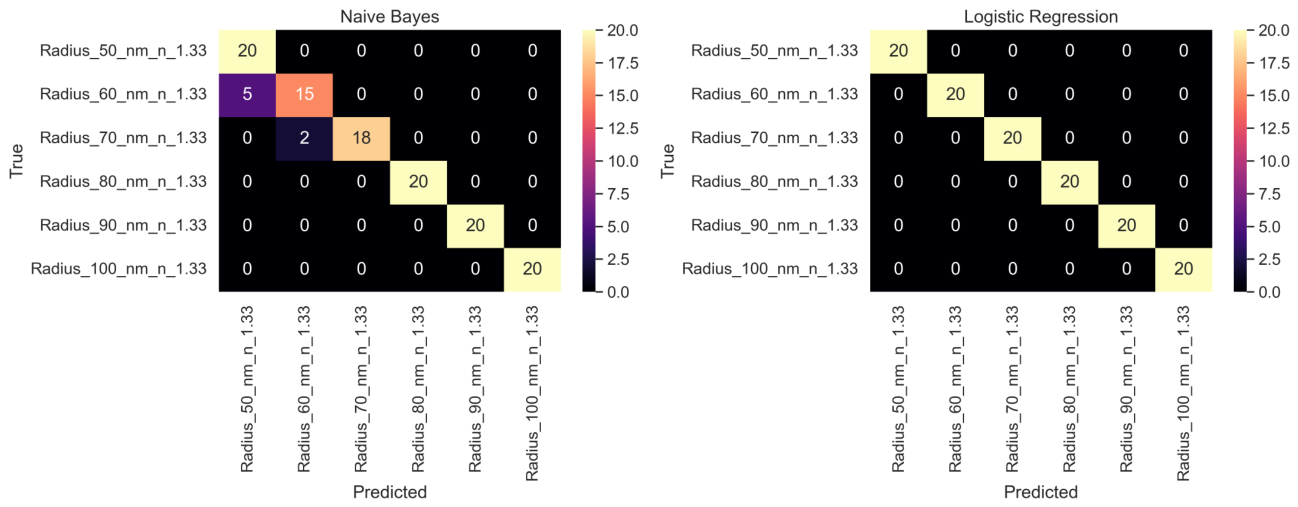
Figure 11.
Confusion matrices for SVM and DT for nanorod length classification. Both models achieved perfect classification across all nanorod length classes.
Figure 11.
Confusion matrices for SVM and DT for nanorod length classification. Both models achieved perfect classification across all nanorod length classes.
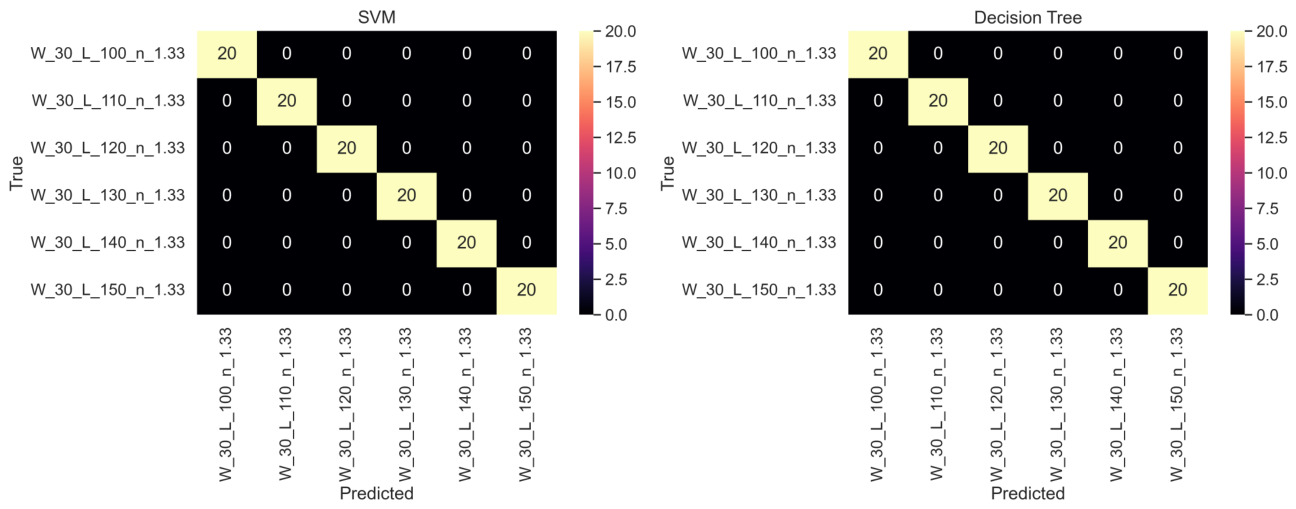
Figure 12.
Confusion matrices for RF and KNN for nanorod length classification. Both models achieved 100% accuracy across all length categories.
Figure 12.
Confusion matrices for RF and KNN for nanorod length classification. Both models achieved 100% accuracy across all length categories.
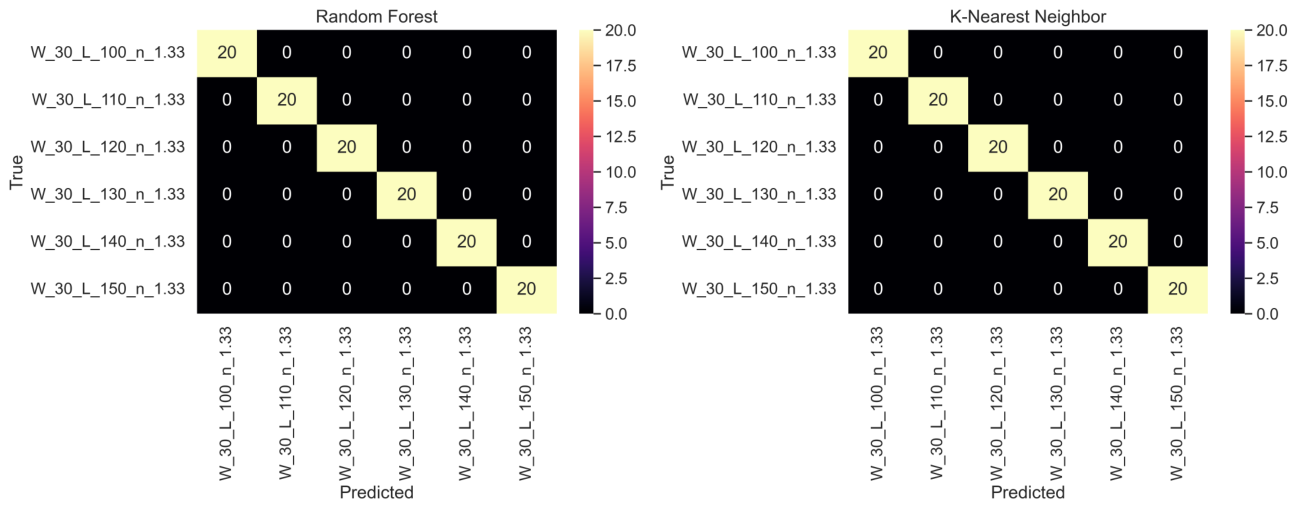
Figure 13.
Confusion matrices for NB and LR for nanorod length classification. Both models perfectly classified all the nanorod spectra.
Figure 13.
Confusion matrices for NB and LR for nanorod length classification. Both models perfectly classified all the nanorod spectra.
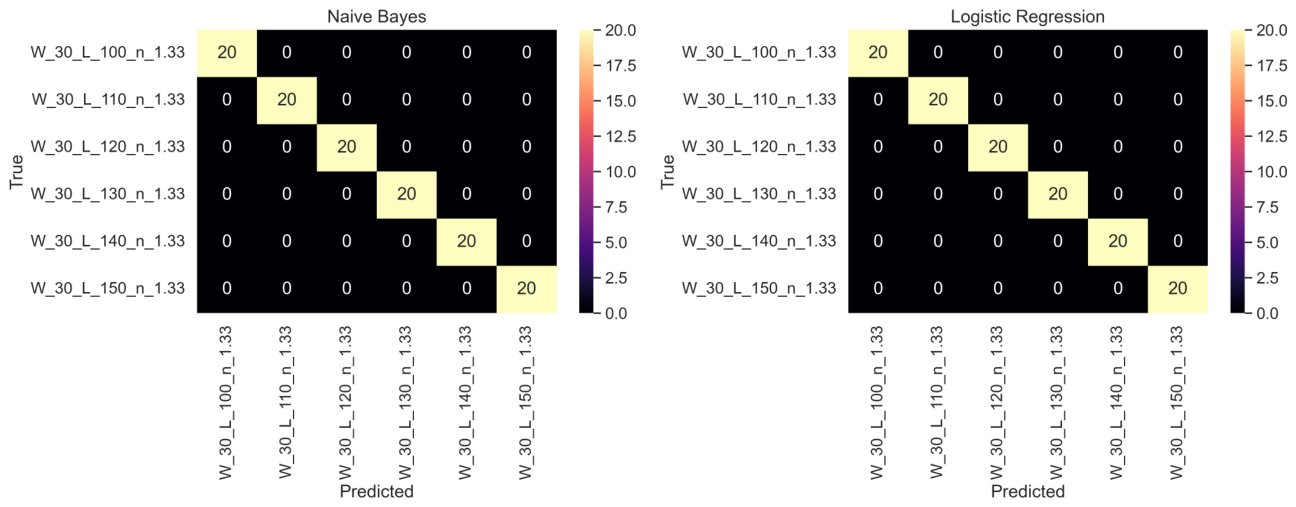
Figure 17.
Confusion matrices for SVM and DT for nanorod refractive index classification. Both models achieved 100% classification accuracy.
Figure 17.
Confusion matrices for SVM and DT for nanorod refractive index classification. Both models achieved 100% classification accuracy.
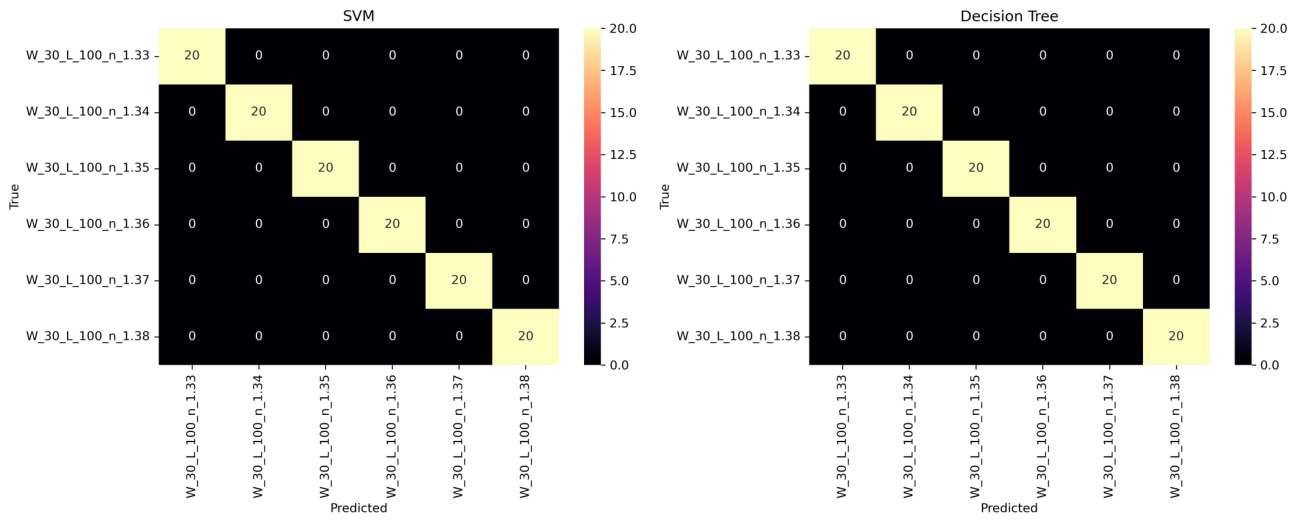
Figure 18.
Confusion matrices for RF and KNN for nanorod refractive index classification. Both classifiers performed perfectly across all refractive index classes.
Figure 18.
Confusion matrices for RF and KNN for nanorod refractive index classification. Both classifiers performed perfectly across all refractive index classes.
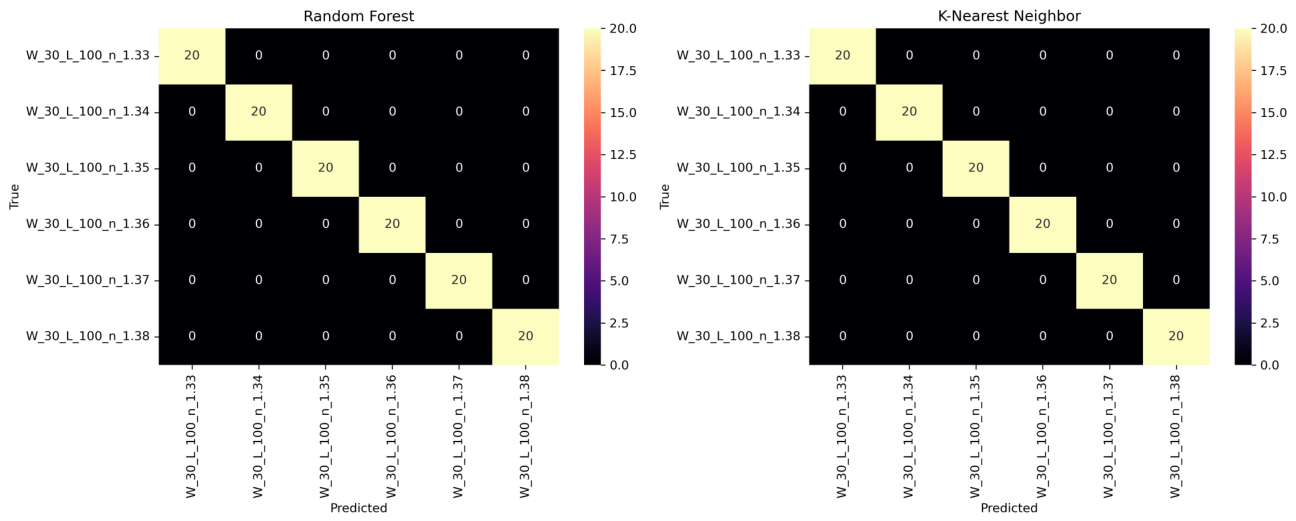
Figure 19.
Confusion matrices for NB and LR for nanorod refractive index classification. Both classifiers achieved perfect classification accuracy.
Figure 19.
Confusion matrices for NB and LR for nanorod refractive index classification. Both classifiers achieved perfect classification accuracy.
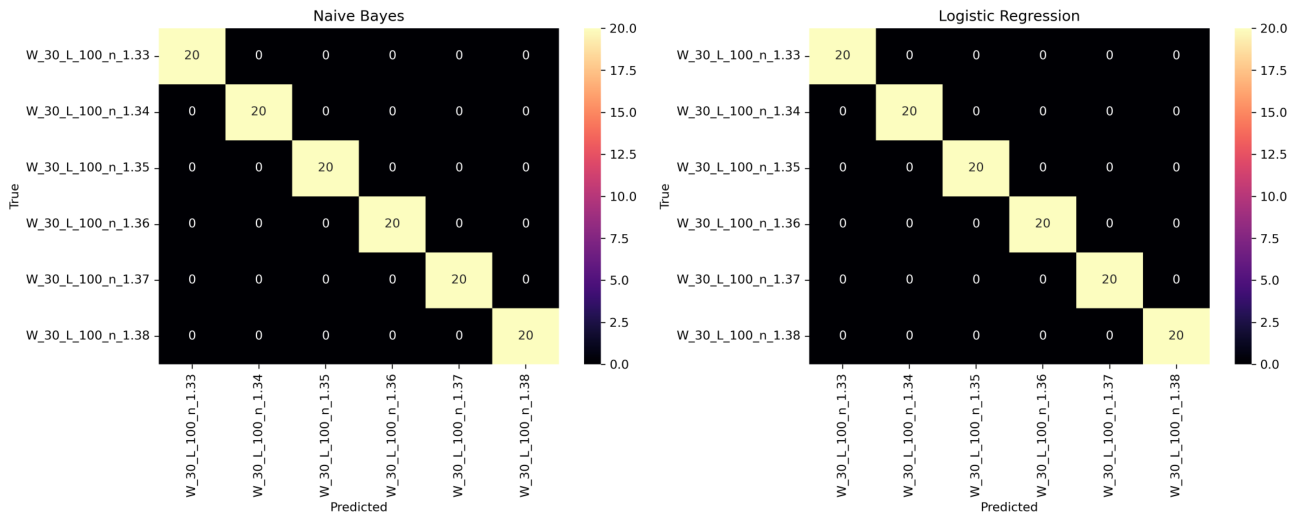

Table 1.
Performance of machine learning classifiers for nanosphere refractive index classification.
Table 1.
Performance of machine learning classifiers for nanosphere refractive index classification.
| Model | Accuracy (%) | Precision (%) | Recall (%) | F1-Score (%) |
|---|---|---|---|---|
| SVM | 76.43 | 77 | 76 | 76 |
| DT | 67.14 | 67 | 67 | 67 |
| RF | 81.43 | 82 | 81 | 81 |
| KNN | 40.71 | 42 | 41 | 41 |
| NB | 45.00 | 43 | 45 | 43 |
| LR | 85.00 | 85 | 85 | 85 |
Table 2.
Performance metrics for nanosphere size classification using different machine learning models.
Table 2.
Performance metrics for nanosphere size classification using different machine learning models.
| Model | Accuracy (%) | Precision (%) | Recall (%) | F1-score (%) |
|---|---|---|---|---|
| SVM | 100.00 | 100.00 | 100.00 | 100.00 |
| RF | 100.00 | 100.00 | 100.00 | 100.00 |
| KNN | 100.00 | 100.00 | 100.00 | 100.00 |
| LR | 100.00 | 100.00 | 100.00 | 100.00 |
| DT | 98.33 | 98.00 | 98.00 | 98.00 |
| NB | 94.17 | 95.00 | 94.00 | 94.00 |
Table 3.
Classification report for nanorod LSPR spectra by length using different machine learning models.
Table 3.
Classification report for nanorod LSPR spectra by length using different machine learning models.
| Model | Accuracy (%) | Precision (%) | Recall (%) | F1-score (%) |
|---|---|---|---|---|
| SVM | 100.00 | 100.00 | 100.00 | 100.00 |
| RF | 100.00 | 100.00 | 100.00 | 100.00 |
| KNN | 100.00 | 100.00 | 100.00 | 100.00 |
| LR | 100.00 | 100.00 | 100.00 | 100.00 |
| DT | 100.00 | 100.00 | 100.00 | 100.00 |
| NB | 100.00 | 100.00 | 100.00 | 100.00 |
Table 4.
Classification performance metrics for nanorod width classification.
| Model | Accuracy (%) | Precision (%) | Recall (%) | F1-score (%) |
|---|---|---|---|---|
| SVM | 100.00 | 100.00 | 100.00 | 100.00 |
| Decision Tree | 100.00 | 100.00 | 100.00 | 100.00 |
| Random Forest | 100.00 | 100.00 | 100.00 | 100.00 |
| KNN | 100.00 | 100.00 | 100.00 | 100.00 |
| Naive Bayes | 100.00 | 100.00 | 100.00 | 100.00 |
| Logistic Regression | 100.00 | 100.00 | 100.00 | 100.00 |
Table 5.
Classification performance metrics for nanorod refractive index classification.
| Model | Accuracy (%) | Precision (%) | Recall (%) | F1-score (%) |
|---|---|---|---|---|
| SVM | 100.00 | 100.00 | 100.00 | 100.00 |
| Decision Tree | 100.00 | 100.00 | 100.00 | 100.00 |
| Random Forest | 100.00 | 100.00 | 100.00 | 100.00 |
| KNN | 100.00 | 100.00 | 100.00 | 100.00 |
| Naive Bayes | 100.00 | 100.00 | 100.00 | 100.00 |
| Logistic Regression | 100.00 | 100.00 | 100.00 | 100.00 |
Table 6.
Summary of classifier performance across all experiments (Accuracy in %). NS is the nanosphere size, N-RI is the nanosphere refractive index, NL is the nanorod length, NW is the nanorod width, Na-RI is the nanorod refractive index.
Table 6.
Summary of classifier performance across all experiments (Accuracy in %). NS is the nanosphere size, N-RI is the nanosphere refractive index, NL is the nanorod length, NW is the nanorod width, Na-RI is the nanorod refractive index.
| Model | NS | N-RI | NL | NW | Na-RI |
|---|---|---|---|---|---|
| SVM | 100.0 | 76.4 | 100.0 | 100.0 | 100.0 |
| DT | 98.3 | 67.1 | 100.0 | 100.0 | 100.0 |
| RF | 100.0 | 81.4 | 100.0 | 100.0 | 100.0 |
| KNN | 100.0 | 40.7 | 100.0 | 100.0 | 100.0 |
| NB | 94.2 | 45.0 | 100.0 | 100.0 | 100.0 |
| LR | 100.0 | 85.0 | 100.0 | 100.0 | 100.0 |
Disclaimer/Publisher’s Note: The statements, opinions and data contained in all publications are solely those of the individual author(s) and contributor(s) and not of MDPI and/or the editor(s). MDPI and/or the editor(s) disclaim responsibility for any injury to people or property resulting from any ideas, methods, instructions or products referred to in the content. |
© 2026 by the authors. Licensee MDPI, Basel, Switzerland. This article is an open access article distributed under the terms and conditions of the Creative Commons Attribution (CC BY) license (http://creativecommons.org/licenses/by/4.0/).
Copyright: This open access article is published under a Creative Commons CC BY 4.0 license, which permit the free download, distribution, and reuse, provided that the author and preprint are cited in any reuse.


