

Submitted:
30 June 2026
Posted:
02 July 2026
You are already at the latest version
Abstract
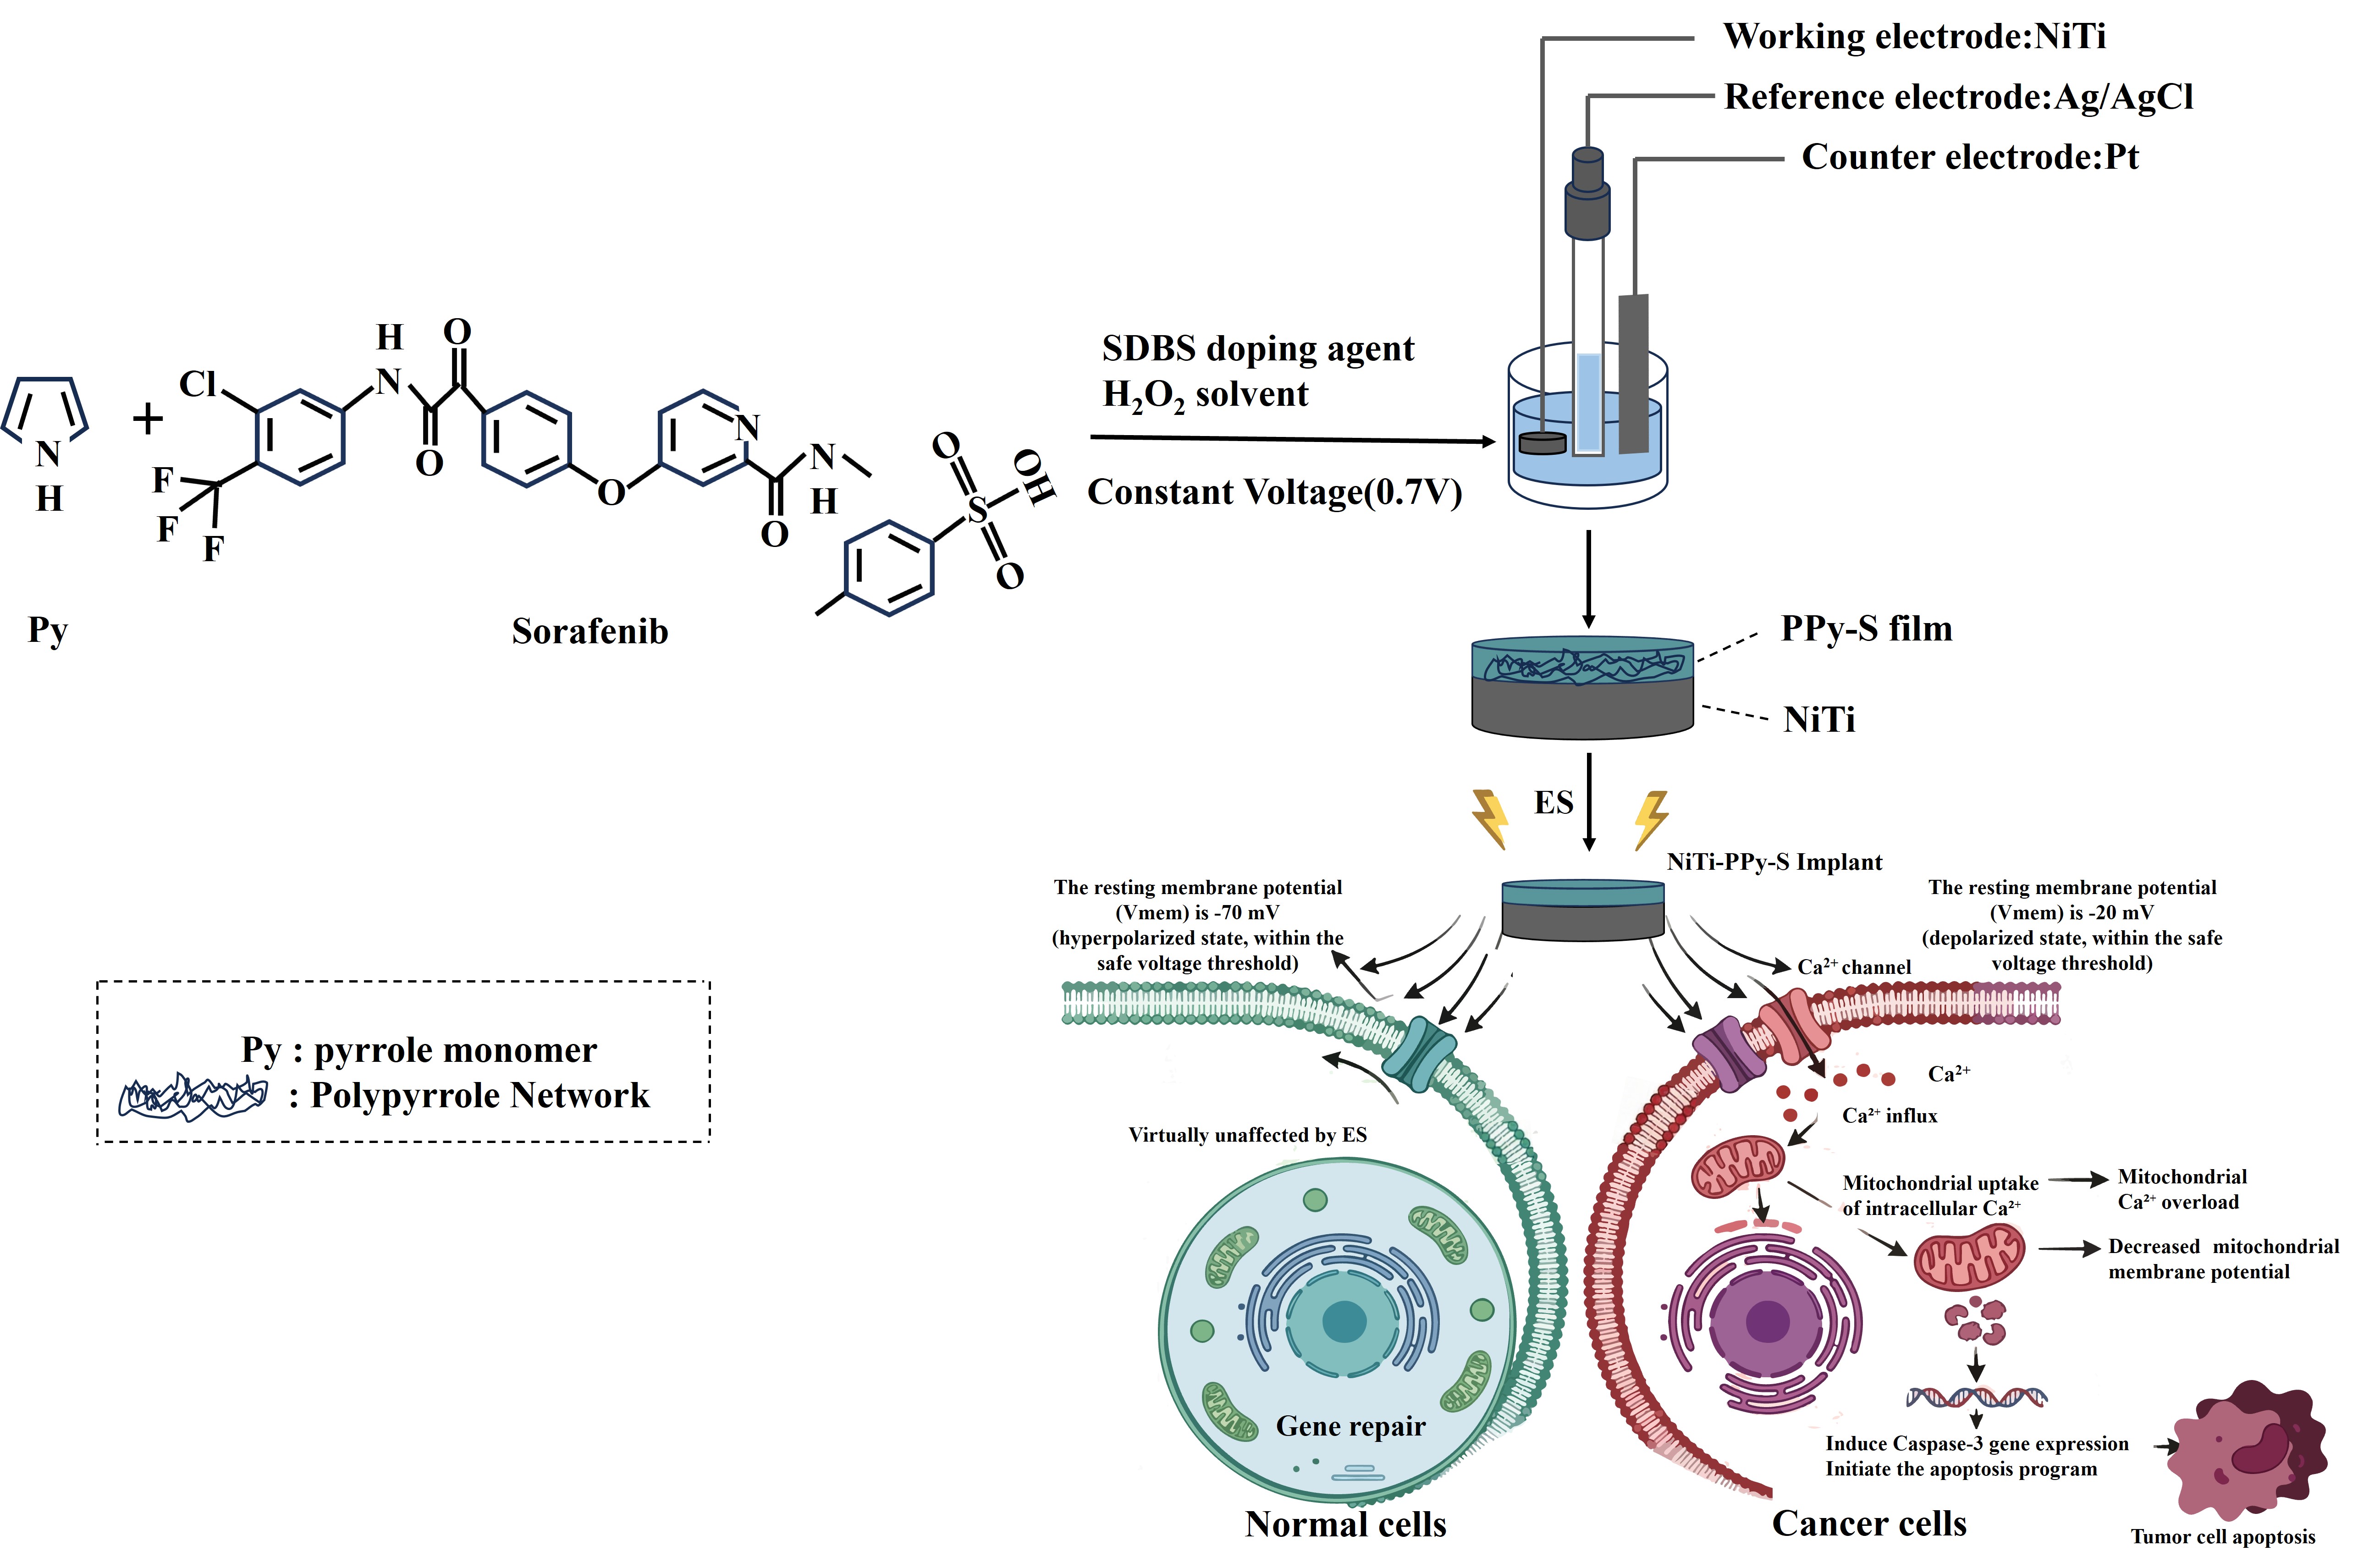
Nickel-titanium (NiTi) stents have been widely used for the palliative treatment of portal vein tumor thrombi due to their excellent mechanical strength and biocompatibility. However, traditional NiTi implants lack active antitumor functions, which can easily lead to tumor re-invasion and subsequent restenosis. Electro-stimulation (ES)-based ablation therapy offers a controllable physical strategy for local tumor clearance; however, the naturally formed TiO₂ layer on the NiTi surface limits its interfacial electrical activity. In this study, an electro-responsive sorafenib-loaded polypyrrole (PPy) film (NiTi-PPy-S) was fabricated on the NiTi surface via electrochemical deposition. The results indicate that the electrochemically deposited PPy film increases the electrical conductivity of NiTi from approximately 1.3 S cm⁻¹ to 3.4 S cm⁻¹. After loading with sorafenib, NiTi-PPy-S retains good electrochemical responsiveness and exhibits voltage-dependent drug release characteristics. Mechanistically, the antitumor effect is closely associated with ES-triggered Ca²⁺ influx, mitochondrial Ca²⁺ overload, mitochondrial membrane potential collapse, and activation of the Caspase-3 apoptotic pathway. This study demonstrates that electro-responsive PPy can transform passive NiTi implants into active antitumor therapeutic interfaces, providing a promising strategy for the development of multifunc-tional implants for the treatment of portal vein tumor thrombi.
Keywords:
nickel-titanium alloy
; polypyrrole
; electrical stimulation
; sorafenib
; electrically controlled drug release
; tumor ablation
1. Introduction
Portal vein tumor thrombus (PVTT) is a common and serious complication of advanced hepatocellular carcinoma [1,2]. Because primary liver cancer has a strong tendency to invade blood vessels, tumor cells can invade the portal venous system, obstruct blood flow, cause portal hypertension, and form a portal vein tumor thrombus. For patients who are no longer candidates for curative surgery, stent implantation has become an important palliative treatment strategy, used to reopen obstructed vessels or luminal structures and maintain local patency.
The use of NiTi stents to dilate obstructed sites represents an emerging palliative treatment strategy for portal vein tumor thrombi [3]; nickel-titanium (NiTi) alloy stents have been widely adopted in clinical practice due to their superior biocompatibility and mechanical strength [4,5]. However, due to the inherent lack of anticancer activity in NiTi alloys [6], residual tumor tissue around the implant is difficult to completely remove. This limitation makes the stents highly susceptible to re-occlusion caused by tumor re-invasion [7], thereby severely limiting their long-term efficacy. Therefore, there is an urgent need to develop a novel stent treatment modality that can efficiently eliminate tumor cells while ensuring safety.
Electroablation (ES) is a technique that induces irreversible damage to tumor cells by implanting electrodes into tumor tissue and applying external electrical pulses, thereby utilizing electrical energy [8,9]. Nickel-titanium alloy stents, which are used to dilate obstructed sites during interventional treatment of portal vein tumor thrombi, possess inherent electrical conductivity and thus hold promise for use as tumor ablation electrodes. However, the NiTi surface is prone to oxidation, forming a titanium dioxide (TiO₂) film with poor electrical conductivity [10], thereby limiting their application potential.
Surface electroactive modification is an effective strategy for overcoming the aforementioned limitations. Polypyrrole (PPy) is a typical conductive polymer that has been widely used in biomedical electrodes [11,12], biosensors [13,14], and electrically controlled drug delivery systems [15] due to its excellent electrical conductivity [16,17], chemical stability [18], biocompatibility [19], and reversible doping/dedoping behavior [20]. During electrochemical polymerization, anionic drug molecules can be incorporated into the PPy network to balance the positively charged polymer backbone [21,22]. Under an applied electrical stimulus, the redox transition of PPy drives ion exchange and structural expansion or contraction, thereby enabling the on-demand release of the loaded anionic drugs. Therefore, the fabrication of a PPy thin-film coating on a NiTi surface is expected to simultaneously enhance surface conductivity and serve as an electro-responsive drug reservoir platform.
Based on this, this study employed electrochemical deposition to fabricate a PPy thin film loaded with the antitumor drug sorafenib (NiTi-PPy-S) on a NiTi alloy surface. First, preparation parameters were optimized to obtain a film with good conductivity and structural stability,The deposited PPy film increased the surface electrical conductivity of the NiTi alloy from 1.3 S cm⁻¹ to 3.4 S cm⁻¹. Subsequently, a series of characterization techniques confirmed that the anticancer drug sorafenib forms a chemical bond with the polypyrrole network via electrostatic interactions. This study further focused on investigating whether this electro-responsive coating could improve interfacial charge transfer to enable voltage-dependent sorafenib release, thereby producing synergistic antitumor effects.
2. Materials and Methods
2.1. Chemical Reagents
This study used analytical-grade reagents of pyrrole (Py), sodium dodecylbenzenesulfonate (SDBS), acetone, ethanol, hydrofluoric acid (HF), nitric acid (HNO₃), and phosphate-buffered saline (PBS). The Py monomer was purified by distillation under atmospheric pressure prior to use. Mouse liver cancer cells (Hepa1-6) and human umbilical vein endothelial cells (HUVEC) were used for cytological evaluation.
2.1.1. Pretreatment of NiTi Substrates
NiTi sheets were cut into circular discs with a diameter of 20 mm and a thickness of 2 mm. The samples were sequentially polished with 600-, 800-, 1,200-, and 2,000-grit sandpaper to remove surface contaminants and the oxide layer. The samples were then sequentially ultrasonically cleaned in acetone, ethanol, and deionized water. To further activate the surface, the NiTi discs were etched for 5 minutes in a mixture of HF, HNO₃, and deionized water prepared in a 1:5:34 volume ratio, followed by ultrasonic cleaning with ethanol and deionized water. The pretreated samples were dried at room temperature and set aside for use.
2.1.2. Preparation of NiTi-PPy Films
PPy films were electrodeposited onto NiTi substrates using an electrochemical workstation and a standard three-electrode system. A pretreated NiTi disc served as the working electrode, a saturated calomel electrode as the reference electrode, and a platinum foil as the counter electrode. Purified Py (0.1 M) was added to a solution of SDBS (0.04 M) at a specific concentration and stirred for 1 hour under light-shielded conditions to obtain the polymerization electrolyte. To optimize the PPy film formation process, an electrochemical deposition voltage of 0.7 V and a deposition time of 500 s were employed. After deposition, the samples were thoroughly rinsed with deionized water to remove residual monomers and loosely attached dopants, and then dried at 37 °C. The resulting samples were designated as NiTi-PPy.
2.1.3. Preparation of Sorafenib-Loaded NiTi-PPy Films
To prepare NiTi-PPy-S, sorafenib was first dispersed in deionized water and mixed with SDBS (0.04 M) under stirring. Purified Py (0.1 M) was then added, and stirring was continued under light-shielded conditions. Electrochemical deposition was performed using the same three-electrode system. After deposition, the samples were repeatedly rinsed with deionized water to remove unreacted monomers and loosely bound sorafenib. The resulting samples were designated as NiTi-PPy-S. The abbreviations for each sample group and the experimental groupings are shown in Table 1.
2.2. Characterization of Material Surface Structure and Composition
2.2.1. Morphological Characterization, Chemical Structure, and Compositional Analysis
The surface morphologies of NiTi, NiTi-PPy, and NiTi-PPy-S were examined using a scanning electron microscope (SEM). Prior to observation, the samples were mounted on the sample stage and sputter-coated with gold to enhance conductivity. SEM images were acquired at an acceleration voltage of 15 kV.
Fourier transform infrared spectroscopy (FTIR) was used to analyze the molecular structure and characteristic functional groups of the samples in the range of 400–4,000 cm⁻¹. X-ray diffraction (XRD) was employed to evaluate the phase and structural characteristics of the substrate and the deposited film. X-ray photoelectron spectroscopy (XPS) was used to determine the elemental composition and chemical state of the sample surface, with binding energy calibration performed using the C 1s line. Zeta potential analysis was used to assess changes in the surface charge of the samples before and after sorafenib loading.
2.3. Electrochemical Properties and Conductivity Testing
Electrochemical testing was conducted at room temperature using a three-electrode system with 0.01 M PBS as the electrolyte. Prior to testing, all samples were soaked in PBS for 1 hour to stabilize the open-circuit potential. Cyclic voltammetry (CV) was used to evaluate the redox activity of the films. Electrochemical impedance spectroscopy (EIS) was employed to analyze interfacial charge transfer capability over a frequency range of 0.1 Hz to 100 kHz and an AC perturbation amplitude of 10 mV. The surface conductivity of different samples was measured using the four-point probe method. Measurements were repeated at multiple locations on each sample, and the average values were used for analysis.
2.4. Electro-Responsive Release of Sorafenib
First, a calibration curve was established by measuring the absorbance of the sorafenib solution at its characteristic absorption wavelength. In the electrochemical release assay, NiTi-PPy-S samples were immersed in a 0.9% NaCl solution, and different voltages (0, 0.3, 0.6, and 0.9 V) were applied. The release solution was collected at predetermined time points, and the sorafenib concentration was determined by UV-visible spectrophotometry.
2.5. Subsection
This section may be divided by subheadings. It should provide a concise and precise description of the experimental results, their interpretation, as well as the experimental conclusions that can be drawn.
2.5.1. Cell Culture
Hepa1-6 cells and HUVECs were cultured in complete medium in a humidified environment at 37 °C and 5% CO₂. The medium was changed periodically based on cell growth, and the cells were passaged every 2–3 days.
2.5.2. Cytotoxicity and Proliferation Assays
Hepa1-6 cells and HUVECs were seeded on NiTi, NiTi-PPy, and NiTi-PPy-S surfaces, respectively. To evaluate the intrinsic biocompatibility of the materials, cells were cultured on the different sample surfaces under ES-free conditions. To assess the cytotoxic effects of ES, cells were cultured on the sample surfaces and then exposed to ES. Cell viability was evaluated using Calcein-AM/PI live/dead staining. Cell proliferation and survival were further quantified at predetermined time points using the CCK-8 assay.
2.5.3. Apoptosis Analysis
Apoptosis was analyzed using Annexin V-FITC/PI staining and flow cytometry. Hepa1-6 cells and HUVECs were cultured on the surfaces of different samples. After treatment with or without ES, the cells were harvested, washed with PBS, and stained according to the kit instructions. The proportions of live cells, early apoptotic cells, late apoptotic/necrotic cells, and dead cells were analyzed.
2.5.4. Mitochondrial Membrane Potential
Mitochondrial membrane potential in Hepa1-6 cells and HUVECs following ES treatment was assessed using JC-1 staining. Red fluorescence indicates JC-1 aggregates in healthy mitochondria, suggesting a stable membrane potential; green fluorescence indicates JC-1 monomers, suggesting mitochondrial membrane depolarization.
2.5.5. Intracellular Ca²⁺ Detection
Fluo-4 AM staining was used to detect intracellular Ca²⁺ levels. Cells were cultured on the surfaces of different samples, treated with ES, incubated with Fluo-4 AM staining solution, and observed using a confocal microscope.
2.5.6. Mitochondrial Ca²⁺ Assay
Mitochondrial Ca²⁺ accumulation was assessed using Rhod-2 AM staining. Following ES treatment, cells were stained with Rhod-2 AM and imaged to evaluate mitochondrial Ca²⁺ overload.
2.5.7. RT-qPCR Analysis
Following ES treatment, total RNA was extracted from cells on the surfaces of different samples. After reverse transcription of the RNA into cDNA, the expression of apoptosis-related genes such as Caspase-3 and Bcl-2 was analyzed by RT-qPCR. Relative gene expression levels were calculated using an appropriate internal control gene.
2.6. In-Vivo Tumor Ablation
A subcutaneous Hepa1-6 tumor model was established in healthy Balb/c nude mice. After tumor formation, the mice were randomly divided into six groups: -ES-NiTi, -ES-NiTi-PPy, -ES-NiTi-PPy-S, +ES-NiTi, +ES-NiTi-PPy, and +ES-NiTi-PPy-S. The corresponding samples were implanted into the tumor region. The ES group received daily electrical stimulation at 0.9 V for 20 minutes. Tumor volume, total body weight, and post-tumor resection weight were recorded during the treatment period. After 13 days, the mice were euthanized, and tumor tissue and major organs were collected for histological analysis.
2.7. Histology and Immunofluorescence Staining
Tumor tissues were fixed in 4% paraformaldehyde, embedded in paraffin, and sectioned. Hematoxylin and eosin (H&E) staining was used to evaluate tumor morphology and necrosis, while Masson’s staining was used to assess tissue structure and collagen distribution. TUNEL staining was employed to detect apoptotic cells in the tumor tissue. Major organs, including the heart, liver, spleen, lungs, and kidneys, were also stained with H&E to evaluate systemic biosafety.
2.8. Statistical Analysis
All quantitative data are expressed as mean ± standard deviation. Comparisons among multiple groups were performed using one-way analysis of variance (ANOVA), followed by post-hoc tests. Statistical significance is defined as *P < 0.05, **P < 0.01, ***P < 0.001, or ****P < 0.0001.
3. Results
3.1. Morphology, Structure, and Electrochemical Properties of the Film
Figure 1 shows the morphology and chemical composition of the NiTi, NiTi-PPy, and NiTi-PPy-S samples. As shown in Figure 1a, the polished NiTi substrate surface is relatively smooth. Figure 1b shows that, following PPy electrodeposition, the NiTi surface is covered with a PPy film exhibiting a typical cauliflower-like microstructure. When sorafenib is incorporated into the PPy film network, the microstructure of the film surface undergoes significant changes. In Figure 1c, it is clearly visible that numerous bright, fine particles have appeared on the surface of the originally rounded, cauliflower-like PPy particles. This morphological change indicates that sorafenib has been incorporated into the PPy network and has influenced the film’s polymerization or deposition process. Measurements of the zeta potential of different samples also confirm the successful incorporation of sorafenib into the PPy film. As shown in Figure 1d, the NiTi-PPy surface exhibits a distinct negative charge, whereas in the NiTi-PPy-S sample, the surface charge shifts from negative to positive. This change is typically attributed to the interaction between sorafenib and PPy. Sorafenib molecules contain functional groups such as amino groups, which may become protonated and carry a positive charge under specific pH conditions. Alternatively, the molecular structure of sorafenib may mask the original negative charge sites on the PPy surface during the adsorption process, thereby causing the overall surface potential to shift from negative to positive.
Figure 1e shows the FTIR spectrum, which further confirms the successful deposition of PPy and the loading of sorafenib. The peaks near 1540–1450 cm⁻¹ correspond to the stretching vibrations of the C=C and C–N bonds in the PPy ring, 987 cm⁻¹ corresponds to the typical out-of-plane C–H bending vibration of PPy, indicating the successful electro-polymerization of PPy onto the NiTi substrate. The region around 1100–1200 cm⁻¹ likely includes benzene ring vibration signals from the dopant SDBS as well as in-plane bending of PPy. When loaded with sorafenib, the infrared spectrum exhibits characteristic peaks specific to sorafenib. A distinct broad or multiple peak appears near 3000 cm⁻¹, corresponding to the C–H stretching vibrations of the aromatic rings in the sorafenib molecule. Near 1120 cm⁻¹, the peaks correspond to the trifluoromethyl (-CF₃) and C–F bonds in the sorafenib structure, while the peak at 930 cm⁻¹ corresponds to the characteristic vibration of the sorafenib aromatic ring or a characteristic peak related to the urea group. Figure 1f shows the XRD patterns of different samples. It can be seen that the NiTi substrate exhibits multiple sharp and intense crystal plane diffraction peaks between 2θ = 40° and 45°, which are typical crystalline peaks of NiTi alloys, representing the austenitic or martensitic phase structure of the substrate. These sharp peaks indicate that the substrate possesses a high degree of crystallinity. The NiTi-PPy sample exhibits a very distinct, broad, diffuse “doughnut-shaped” peak at 2θ = 22°–25°, with the originally strong metallic peaks of the substrate almost disappearing or being significantly masked. This broad peak is a typical amorphous feature of PPy, arising from the stacking of π-π bonds between pyrrole rings. The disappearance of the substrate’s metallic peaks indicates that the PPy film formed by electropolymerization has attained a certain thickness and density, effectively shielding the substrate from X-ray detection. When sorafenib was loaded onto the PPy film, a more complex peak pattern than that of NiTi-PPy appeared. This may be related to the dispersion state of sorafenib in the PPy matrix and the relatively loose structure observed by SEM, possibly indicating that sorafenib molecules form a composite network with PPy.
XPS analysis further confirmed the successful formation of the film. The appearance of an N signal following PPy deposition confirmed the formation of nitrogen-containing PPy (Figure 1g). The results showed that the composition of the positively charged polarizons changed after drug loading, indicating that the introduction of sorafenib altered the doping state and polarization of the PPy chains. Figure 1h The signal at approximately 687 eV in the high-resolution F 1s spectrum indicates that, compared to pure PPy, the N 1s peak is significantly broadened after sorafenib incorporation and can be resolved into neutral pyrrole nitrogen, polarized nitrogen, and positively charged N⁺ components. The increased peak area near 401–402 eV suggests the presence of electrostatic interactions, hydrogen bonding, or doping effects between the drug molecules and the PPy network. Meanwhile, the signals from the amide nitrogen, urea nitrogen, and pyrrole nitrogen in the sorafenib molecules overlap with the N 1s peak of PPy, resulting in a more complex peak shape. Figure 1i shows the F 1s XPS peaks (binding energy 678–698 eV), whose intensity is significantly higher than that of NiTi-PPy, indicating that the sorafenib drug has been successfully incorporated into the PPy network.
3.2. Electrochemical Properties
The electrochemical deposition curves for NiTi-PPy and NiTi-PPy-S are shown in Figure 2a. The initial decrease in current corresponds to the charging of the double layer at the electrode surface. Subsequently, the current rises rapidly, indicating that Py monomers undergo oxidation and nucleation on the NiTi surface [23]. As polymerization proceeds, the PPy nuclei gradually expand and interconnect to form a continuous film [24]. The current eventually stabilizes, indicating that the film has entered a stable growth phase. Compared to NiTi-PPy, NiTi-PPy-S exhibits a steeper current rise slope in the early stages, possibly because sorafenib alters the ionic strength of the solution or adsorbs onto the electrode surface, thereby lowering the nucleation energy barrier and promoting PPy deposition [25,26]. The electrochemical performance of NiTi-PPy-S was further evaluated using CV and EIS. The CV curve in Figure 2b shows that NiTi-PPy-S still exhibits significant redox activity, indicating that the loading of sorafenib did not impair the electrochemical responsiveness of PPy. A more pronounced oxidation peak appears near approximately −0.42 V, which may be attributed to the film structure becoming more porous and loose after drug incorporation, thereby promoting ion diffusion within the PPy matrix [27]. The EIS results in Figure 2c show that bare NiTi exhibits the largest semicircle due to the presence of a TiO₂ passivation layer on its surface and high charge transfer resistance [28,29]. The NiTi-PPy sample exhibited the smallest semicircular arc, indicating that the conductive PPy film significantly reduced interfacial impedance and improved ion/electron transport. The semicircular arc of the NiTi-PPy-S sample was larger than that of NiTi-PPy but still superior to that of bare NiTi, suggesting that the non-conductive sorafenib molecules partially hindered electron and ion transport without eliminating the coating’s electroactive function. Conductivity measurements further support these findings. Figure 2d shows the conductivity of the different composites; the surface conductivity of bare NiTi is approximately 1.3 S cm⁻¹. After PPy deposition, the conductivity increased to approximately 3.4 S cm⁻¹, confirming that the optimized cauliflower-like PPy film effectively enhances charge transport. After sorafenib loading, the NiTi-PPy-S system still maintained a conductivity of approximately 2.3 S cm⁻¹; although lower than that of NiTi-PPy, it remained higher than that of bare NiTi. These results indicate that NiTi-PPy-S can serve as an electroactive interface for electroosmosis (ES) delivery and electro-responsive drug release.
3.3. Electrically Controlled Sorafenib Release
To prepare a standard curve for sorafenib, a 1000 μg/mL sorafenib solution was first prepared, and a full-wavelength scan was performed in the 200–350 nm range using a UV–Vis spectrophotometer. As shown in Figure 3a, sorafenib exhibited a distinct absorption peak at 285 nm, indicating that 285 nm could be used as its characteristic absorption wavelength for subsequent quantitative analysis. Subsequently, standard solutions of sorafenib at different concentrations were prepared, and their absorbance values were measured at a wavelength of 285 nm using a microplate reader. A standard curve was plotted based on the relationship between concentration and absorbance, and a linear fit was performed; the results are shown in Figure 3b. The fitted equation is:
The correlation coefficient R² = 0.99715 indicates a strong linear relationship between sorafenib concentration and absorbance within the measured concentration range, making it suitable for the quantitative analysis of drug release concentrations in subsequent experiments.
Figure 3c shows the sorafenib release behavior of NiTi-PPy-S at different voltages. Under no electrical stimulation (0 V), only a small amount of sorafenib release was observed initially, after which the concentration remained essentially constant. When a 0.3 V electrical stimulus was applied, the drug release rate was relatively fast during the first 12 hours, after which the release rate began to slow down. When the voltage was increased to 0.6 or 0.9 V, rapid release occurred during the first 6 hours, followed by a plateau. These results indicate that the release of sorafenib from NiTi-PPy-S is voltage-dependent. This is likely because the applied voltages of 0.6 V and 0.9 V are significantly higher than the redox potential of the NiTi-PPy-S samples, leading to a faster release rate of sorafenib. Previous studies have shown that anionic drugs can be incorporated into oxidized PPy networks as counterions to neutralize the positive charges on the polymer backbone [30]. Under electrical stimulation, changes in the redox state and charge density of PPy weaken electrostatic interactions, leading to ion exchange between the dopant anions and electrolyte ions, thereby promoting drug release from the polymer matrix [31,32]. This mechanism explains the voltage-dependent release behavior observed in this system, namely that applying a higher potential accelerates and enhances the release of sorafenib.
3.4. Selective Tumor Cell Ablation
To distinguish between cytotoxic effects induced by electrical stimulation and the intrinsic toxicity of the material, the intrinsic biocompatibility of NiTi-PPy-S was first evaluated under two conditions: electrical stimulation (ES) and non-electrical stimulation (-ES). Under electrical stimulation conditions, as shown by the live/dead staining in Figure 4a,b, Hepa1-6 cells exhibited a gradual trend toward cell death during the culture period, which stood in stark contrast to the growth pattern of HUVEC cells. Figure 4c,d show the CCK-8 quantitative analysis results for the two cell types under electrical stimulation conditions, respectively. The survival rate of Hepa1-6 cells dropped to 20% after 5 days of culture. In contrast, Figure 4e,f indicate that under non-electrical stimulation conditions, both Hepa1-6 and HUVEC cells maintained normal growth on the NiTi, NiTi-PPy, and NiTi-PPy-S surfaces. Intense green fluorescence was observed in all groups, with only minimal red fluorescence. As shown in the CCK-8 quantitative results in Figure 4g,h, the survival rates of both cell types remained at high levels of 89% or higher.
Under the influence of electric stimulation (ES), Hepa1-6 cells and HUVEC cells exhibited markedly different biological responses on different sample surfaces. As shown in Figure 5a, as the stimulation voltage increased from 0 V to 0.9 V, the survival rate of Hepa1-6 cells decreased in a voltage-dependent manner. At 0.6 V and 0.9 V, red fluorescence became dominant, while green fluorescence significantly diminished, indicating extensive tumor cell death. In contrast, HUVEC cells maintained a high survival rate across various material surfaces within the same voltage range (Figure 5b). This differential cellular response suggests that electrical stimulation activates the selective antitumor effects of the thin film. The increase in voltage likely enhances electrochemical interactions at the material-cell interface, leading to gradual damage to tumor cells, whereas normal endothelial cells exhibit greater tolerance to the electrical microenvironment and remain largely unaffected. These findings suggest that NiTi-PPy-S can serve as an electro-responsive therapeutic switch. Under conditions without electrical stimulation, the film exhibits good biocompatibility; under electrical stimulation, it selectively induces tumor cell apoptosis while maintaining the viability of HUVEC cells.
Flow cytometry further quantitatively confirmed that NiTi-PPy-S exhibits a selective pro-apoptotic effect under electric field stimulation (ES). In the +ES-NiTi-PPy-S group, the proportion of surviving Hepa1-6 cells decreased to approximately 39%, while the number of cells in the early apoptosis and late apoptosis/necrosis stages increased significantly (Figure 6a,c). The total cell death rate of tumor cells reached approximately 61%, indicating that this system possesses a strong ability to induce apoptosis. Figure 5b,d show that under conditions without ES, the proportion of surviving Hepa1-6 cells remained at approximately 85%–90%, whereas the cell death rate in the NiTi-PPy-S group was only about 12.77%. For HUVEC cells, regardless of ES application, the vast majority of cells in all groups were located in the survival quadrant (Figure 6e and Figure 6f). Quantitative analysis in Figure 6g,h indicated a mortality rate of approximately 20%, with no significant differences observed between groups. These results suggest that the cytotoxicity of NiTi-PPy-S does not stem from the toxicity of the coating itself, but is primarily due to ES activation.
To elucidate the mechanism of selective tumor cell apoptosis, mitochondrial membrane potential was first evaluated using JC-1 staining. The results of JC-1 fluorescence staining and quantitative analysis indicated that the NiTi-PPy-S system exhibited a significant cell-selective disruption of mitochondrial membrane potential under ES conditions. As shown in Figure 7a, for Hepa1-6 cells, the NiTi-PPy-S group induced intense green fluorescence (Monomers); in Figure 7b, the average fluorescence intensity was significantly higher than that of the NiTi group, indicating that the mitochondrial membrane potential () of Hepa1-6 cells had severely collapsed, entering the early stage of apoptosis. In sharp contrast, normal HUVEC endothelial cells maintained predominantly red fluorescence (Aggregates) across all experimental groups. As shown in Figure 7c, their mitochondrial membrane potential remained stable, and quantitative results also indicated a lower degree of disruption (Figure 7d).
Fluo-4 AM, a commonly used calcium ion fluorescent probe, was used to perform fluorescent staining analysis of calcium ion influx in Hepa1-6 cells and HUVEC cells on the surfaces of the three materials—NiTi, NiTi-PPy, and NiTi-PPy-S—under electrical stimulation. As shown in Figure 7e, under ES conditions, the three materials exhibited distinctly different effects on intracellular calcium influx. For the pure NiTi group, the fluorescence signal remained weak, showing little change compared to the -ES group. This indicates that the bare NiTi surface is not conducive to effectively transmitting the ES signal to the cells to induce calcium influx. In contrast, the PPy-modified NiTi substrate effectively transmits the electrical stimulation signal to the cells, promoting the opening of calcium channels on the cell membrane and triggering extracellular Ca²⁺ influx. Similarly, the NiTi-PPy-S group also exhibited enhanced post-stimulation fluorescence signals, presenting extensive, high-intensity clusters of green fluorescence. This indicates that, compared to the NiTi group, NiTi modified with a PPy film possesses superior electrophysiological properties. As shown in Figure 7f, under identical +ES treatment conditions, the green fluorescence signal within HUVEC cells was weak in the NiTi, NiTi-PPy, and NiTi-PPy-S groups, showing no significant difference from the control and -ES groups. Rhod-2 AM staining revealed a similar trend in mitochondrial Ca²⁺ accumulation. Figure 7g demonstrates that ES-induced Ca²⁺ influx in Hepa1-6 cells further leads to mitochondrial Ca²⁺ overload. Excessive mitochondrial Ca²⁺ uptake can disrupt mitochondrial homeostasis, trigger mitochondrial membrane potential collapse, and activate downstream apoptotic signaling. As shown in Figure 7h, under identical +ES treatment conditions, the red fluorescence signal in HUVEC cells was faint in the NiTi, NiTi-PPy, and NiTi-PPy-S groups, with no significant difference compared to the control and -ES groups.
RT-qPCR analysis further confirmed the activation of apoptosis-related pathways (the pro-apoptotic protein Caspase-3 and the anti-apoptotic protein Bcl-2). Compared with the NiTi group, the NiTi-PPy and NiTi-PPy-S groups exhibited a highly significant upregulation of Caspase-3 expression. As shown in Figure 8a,c, following ES treatment, Hepa1-6 cells exhibited the strongest upregulation of Caspase-3 expression on the NiTi-PPy-S surface (approaching 3.1), while the corresponding Bcl-2 gene also showed enhanced expression (approaching 3.5). In contrast, in the control group without electrical stimulation (ES), gene expression in cells across all groups was relatively low. In contrast, Figure 8c,d show that in the comparison between the presence and absence of electrical stimulation (±ES), the expression levels of the pro-apoptotic gene Caspase-3 and the anti-apoptotic gene Bcl-2 in HUVEC cells remained stable, with no significant differences between groups. Under the action of electrical stimulation (ES), NiTi-PPy-S significantly upregulated the expression of Caspase-3 in Hepa1-6 cells, while the anti-apoptotic response in HUVEC cells remained relatively stable.
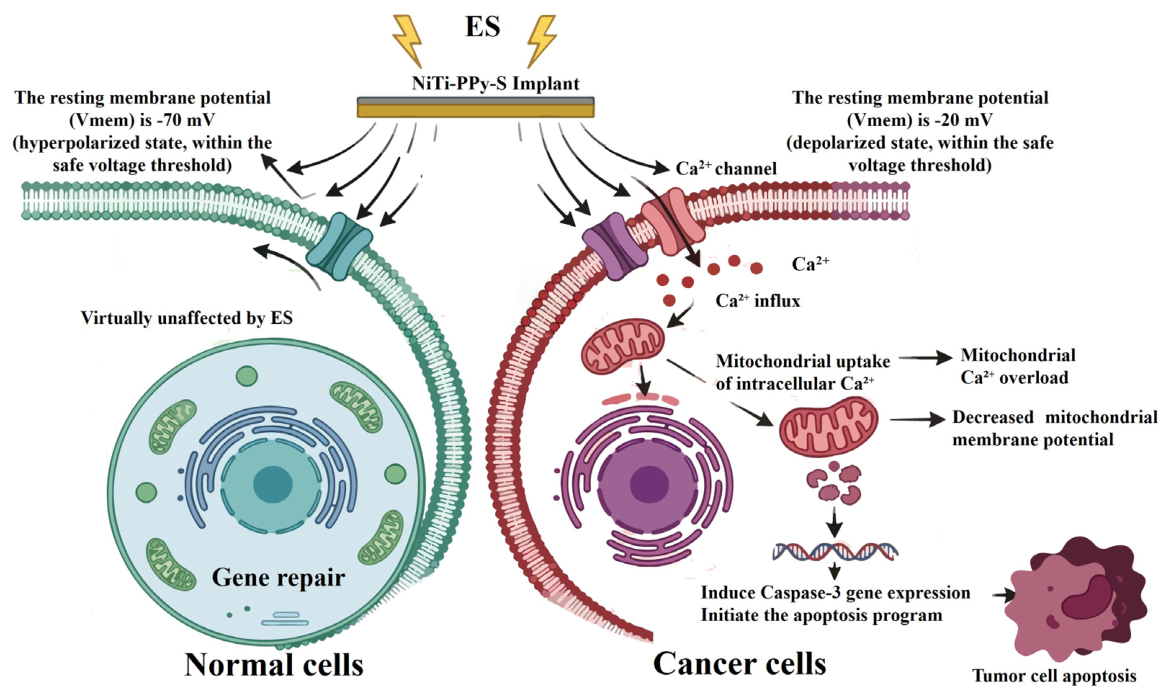
Previous studies have shown that there is a significant difference in the resting membrane potential (Vmem) between normal cells and tumor cells [33]. Figure 7 illustrates the mechanism by which the NiTi-PPy-S electro-responsive film induces apoptosis in tumor cells. The Vmem of normal cells is -70 mV, placing them in a hyperpolarized state, which serves as a voltage safety buffer. In contrast, the Vmem of tumor cells is -20 mV, placing them in a highly depolarized state. When subjected to electric field (ES) interference, tumor cells are more prone to reaching the voltage threshold for apoptosis, which is a characteristic bioelectric feature of tumors. In contrast, when normal cells are subjected to electric field pulses, their cell membranes exhibit stronger resistance to breakdown and greater repair capacity [34]. Frandsen et al. compared intracellular calcium flux in normal fibroblasts and various tumor cells under electric field stimulation [35]. Due to the potential difference between tumor and normal cells, tumor cells are more prone to calcium-induced perforation, whereas normal cells are virtually unaffected by the electric field. Based on the above investigation into the mechanism by which the NiTi-PPy-S electro-responsive film kills tumor cells, it is evident that, under the influence of an external electric field (ES), the NiTi-PPy-S conductive implant applies an electric field to the tumor tissue, causing Ca²⁺ channels in the tumor cell membrane to open and triggering a massive influx of free Ca²⁺. The sharply elevated intracellular Ca²⁺ is taken up in large quantities by mitochondria, leading to mitochondrial calcium overload, which in turn disrupts mitochondrial homeostasis and causes a significant decrease in mitochondrial membrane potential. This critical mitochondrial damage event triggers downstream apoptotic signaling, promoting the release of the pro-apoptotic enzyme caspase-3 and inducing the expression of caspase-3-dependent apoptotic genes, thereby initiating the apoptotic program and ultimately leading to tumor cell death.
Figure 9.
Schematic diagram of the mechanism by which NiTi-PPy-S electro-responsive films induce apoptosis in tumor cells.
Figure 9.
Schematic diagram of the mechanism by which NiTi-PPy-S electro-responsive films induce apoptosis in tumor cells.
3.5. In Vivo Antitumor Activity
The in vivo antitumor effects of NiTi-PPy-S were further evaluated in a Hepa1-6 tumor-bearing mouse model. After implanting different samples, ES was applied to the corresponding groups. Figure 10a shows photographs of excised tumors; the tumor volume in the group without ES was larger, indicating active tumor growth. In contrast, the tumor volume in the ES-treated groups was smaller, with the most pronounced effect observed in the +ES-NiTi-PPy-S group. Quantitative tumor volume curves revealed that tumor growth in the +ES-NiTi-PPy-S group was strongly inhibited, with the growth curve remaining nearly flat throughout the treatment period. This indicates a strong synergistic effect between the electro-responsive sorafenib-loaded PPy film and ES. Systemic safety was assessed by monitoring body weight. During treatment, the total body weight of mice in all groups increased steadily, from approximately 20 g to 24 g. Since total body weight includes tumor weight, body weight excluding tumors was further analyzed. The results in Figure 10 b–d show that body weight excluding tumors also increased steadily, indicating that the treatment did not cause significant systemic toxicity or serious health damage.
Histological analysis further confirmed the antitumor effects. Figure 10e shows that TUNEL immunofluorescence revealed significantly enhanced apoptotic signals in the +ES-NiTi-PPy-S group. Masson staining also demonstrated that tumor tissue structure became loose and disrupted following ES treatment, a finding that was particularly pronounced in the NiTi-PPy-S group. These results confirm that this system can induce tumor cell apoptosis in vivo. Figure 8f H&E staining shows that in the ES-free control group, tumor tissue cells were tightly packed, with distinct nuclei and intact tissue structure, indicating active tumor proliferation. In the +ES-NiTi group, only limited tissue damage was observed, indicating that bare NiTi struggles to achieve efficient ES delivery. In the +ES-NiTi-PPy and +ES-NiTi-PPy-S groups, tumor tissue exhibited widespread areas of pale eosinophilic staining, nuclear condensation, fragmentation, and structural disruption, consistent with the characteristics of coagulative necrosis. Among these, the +ES-NiTi-PPy-S group exhibited the most severe tissue destruction.
The biosafety of the therapeutic system was evaluated by H&E staining of major organs, including the heart, liver, spleen, lungs, and kidneys. The H&E-stained specimens were examined under a light microscope. As shown in Figure 11, compared with the control groups (–ES-NiTi group, –ES-NiTi-PPy group, and –ES-NiTi-PPy-S group), mice treated with different material compositions and ES intervention exhibited no morphological changes in cellular structures, no inflammatory cell infiltration, and no obvious tissue damage or lesions in the five major organs. This indicates that the samples and treatment systems in the -ES-NiTi group, -ES-NiTi-PPy group, -ES-NiTi-PPy-S group, +ES-NiTi group, +ES-NiTi-PPy group, and +ES-NiTi-PPy-S group all exhibit good biocompatibility.
4. Conclusions
In this study, we developed an electro-responsive sorafenib-loaded PPy film on a NiTi surface, endowing the metal implant with enhanced conductivity, on-demand drug delivery, and antitumor therapeutic capabilities. The film significantly increased the electrical conductivity of the NiTi surface, maintained good electrochemical activity after sorafenib loading, and enabled voltage-dependent drug release. In vitro results demonstrate that NiTi-PPy-S exhibits good biocompatibility in the absence of electrical stimulation, whereas under electrical stimulation, it selectively kills Hepa1-6 tumor cells while protecting normal endothelial cells by inducing Ca²⁺ influx, mitochondrial dysfunction, and Caspase-3 activation. In vivo experiments further confirmed that this system, combined with electrical stimulation, effectively inhibits tumor growth, promotes tumor necrosis and apoptosis, and exhibits no significant systemic toxicity. In summary, NiTi-PPy-S shows promise as a functional implantable platform for the treatment of malignant obstruction, particularly recurrent portal vein tumor thrombi.
Author Contributions
Lele Liu performed data organization and analysis and drafted the manuscript. Peng Gu, Yonghao Wen, and Yaohong Wu conducted the animal experiments and collected and organized the experimental data. Donghui Wang provided important suggestions regarding key concepts, secured funding, and revised the manuscript. All authors reviewed the manuscript and provided feedback.
Funding
National Natural Science Foundation of China (52271245), Natural Science Foundation of Tianjin (24JCYBJC01100), Natural Science Foundation of Hebei Province (C2026202004, H2022202007).
Institutional Review Board Statement
All animal procedures were approved by the Institutional Animal Care and Use Committee of Guangdong Provincial People’s Hospital (KY2023-821-01).
Informed Consent Statement
Not applicable.
Data Availability Statement
All data generated or analyzed during this study are included in this paper. For further inquiries, please contact the corresponding author.
Acknowledgments
The author would like to express sincere gratitude to the Department of Spinal Surgery at Ganzhou People’s Hospital for their support of this study.
Conflicts of Interest
The authors declare that this study was conducted in the absence of any commercial or financial relationships that could be considered potential conflicts of interest.
Abbreviations
The following abbreviations are used in this manuscript:
| +ES | Apply an electrical stimulus |
| –ES | No electrical stimulation is applied |
| NiTi | Nickel-Titanium |
| PPy | Polypyrrole |
| S | Sorafenib |
| Py | Pyrrole monomer |
References
- Bray, F.; Laversanne, M.; Sung, H.; Ferlay, J.; Siegel, R.L.; Soerjomataram, I.; Jemal, A. Global cancer statistics 2022: GLOBOCAN estimates of incidence and mortality worldwide for 36 cancers in 185 countries. CA A Cancer J. Clin. 2024, 74, 229–263. [Google Scholar] [CrossRef] [PubMed]
- Zhou, X.-H.; Li, J.-R.; Zheng, T.-H.; Chen, H.; Cai, C.; Ye, S.-L.; Gao, B.; Xue, T.-C. Portal vein tumor thrombosis in hepatocellular carcinoma: molecular mechanism and therapy. Clin. Exp. Metastasis 2022, 40, 5–32. [Google Scholar] [CrossRef] [PubMed]
- Zurstrassen, C.E.; Bitencourt, A.G.V.; Guimaraes, M.D.; Cavalcante, A.C.B.S.; Tyng, C.J.; Amoedo, M.K.; Junior, J.P.K.M.; Szklaruk, J.; Marchiori, E.; Chojniak, R. Percutaneous stent placement for the treatment of malignant biliary obstruction: nitinol versus elgiloy stents. Radiol. Bras. 2017, 50, 97–102. [Google Scholar] [CrossRef] [PubMed]
- Du, N.; Ma, J.; Zhang, Z.; Zhou, Y.; Yang, M.; Zhang, W.; Luo, J.; Yan, Z. Development of a Novel Endovascular Brachytherapy Stent: A Proof-of-concept Study. J. Clin. Transl. Hepatol. 2021. [Google Scholar] [CrossRef] [PubMed]
- Zhang, L.; Wang, J.; Li, Y.; Hou, L.; Xia, J.; Shen, J. Implanting Iodine-125 Seed Strand Inside the Portal Vein Stent: An Improved Approach to Endovascular Brachytherapy for Treatment of Patients with Hepatocellular Carcinoma and Main Portal Vein Tumor Thrombus. J. Hepatocell. Carcinoma 2023, 10, 2187–2196. [Google Scholar] [CrossRef] [PubMed]
- Zhang, Z.; Yang, Y.; Zhang, J.; Sha, P.; Xu, Z.; Li, P.; Yu, Z.; Guo, Y.; Ren, L.; Yan, D. Antibacterial activity of additive manufactured NiTi alloy improved by zinc oxide-doped DCPD-PCL composite coating. Ceram. Int. 2023, 50, 897–908. [Google Scholar] [CrossRef]
- Jang, J.K.; Song, H.-Y.; Kim, J.H.; Song, M.; Park, J.-H.; Kim, E.Y. Tumor Overgrowth After Expandable Metallic Stent Placement: Experience in 583 Patients With Malignant Gastroduodenal Obstruction. Am. J. Roentgenol. 2011, 196, W831–W836. [Google Scholar] [CrossRef] [PubMed]
- Pan, Y.; Zhang, Y.; Shi, X.; Li, D.; Xu, X.; Xiao, B.; Piao, Y.; Xiang, J.; Shao, S.; Ho, F.C.-Y.; et al. Electrical stimulation induces anti-tumor immunomodulation via a flexible microneedle-array-integrated interdigital electrode. Sci. Bull. 2023, 68, 2779–2792. [Google Scholar] [CrossRef] [PubMed]
- Zeng, C.; Hua, S.; Zhou, J.; Zeng, T.; Chen, J.; Su, L.; Jiang, A.; Zhou, M.; Tang, Z. Oral microalgae-based biosystem to enhance irreversible electroporation immunotherapy in hepatocellular carcinoma. Adv. Sci. 2025, 12, 2409381. [Google Scholar]
- Elahinia, M.H.; Hashemi, M.; Tabesh, M.; Bhaduri, S.B. Manufacturing and processing of NiTi implants: A review. Prog. Mater. Sci. 2012, 57, 911–946. [Google Scholar] [CrossRef]
- Wu, C.; Duan, X.; He, X.; Weng, W.; Zhou, H.; Han, G.; Chen, Z.; Chen, W.; Cheng, K. Alleviation of neuroinflammation on electrode interface by biomimetic electrical microenvironment modulation based on collagen/polypyrrole composite film. Colloids Surf. B Biointerfaces 2025, 255, 114885. [Google Scholar] [CrossRef] [PubMed]
- Wu, C.; He, X.; Weng, W.; Zhou, H.; Han, G.; Chen, Z.; Cheng, K. Interfacial modification by using collagen/polypyrrole composite films with different structures for improving electrical and biological effects of bioelectrodes. Prog. Org. Coat. 2025, 208. [Google Scholar] [CrossRef]
- Er, S.G.; Bulathsinghala, R.; Kizilates, S.B.; Li, B.; Ryan, R.; Tabish, T.A.; Dharmasena, I.; Edirisinghe, M. Multifunctional Conductive Nanofibers for Self-Powered Glucose Biosensors. Adv. Sci. 2025, 12, e2416320. [Google Scholar] [CrossRef] [PubMed]
- Di Pasquale, G.; Pollicino, A. Conducting polymers for electrochemical sensing: from materials and metrology to intelligent and sustainable biointerfaces. Sensors 2026, 26, 908. [Google Scholar] [CrossRef] [PubMed]
- Huang, J.; Yap, N.; Walter, M.; Green, A.; Smith, C.; Johnson, J.; Saigal, R. 3D-Printed Polypyrrole Microneedle Arrays for Electronically Controlled Transdural Drug Release. ACS Biomater. Sci. Eng. 2022, 8, 1544–1553. [Google Scholar] [CrossRef] [PubMed]
- Vafa, Z.J.; Zare, E.N.; Eslam, M.R.F.; Makvandi, P. Development of ecofriendly, biodegradable electrically conductive double-layer bio-hydrogel nanocomposite for sustainable medical device applications. Adv. Compos. Hybrid. Mater. 2025, 8, 1–21. [Google Scholar] [CrossRef]
- Tian, R.; Zhang, Y.; Sun, Y.; Liu, J.; Tang, X.; Gao, J.; Lv, G.; Jiang, Y.; Fu, J. Vapor-phase polymerization of polypyrrole in PVA hydrogels for enhanced electrical conductivity in multimodal sensing applications. Chem. Eng. J. 2025, 525. [Google Scholar] [CrossRef]
- Yeasmin, S.; Jain, A.; Sobczak, K.; Sarmah, K.; Dobrotvorska, M.V.; Lewandowski, M.; Mahanta, D. A Facile In Situ Template Method to Fabricate Hollow Polypyrrole Nanoparticles for Asymmetric Electrochemical Capacitors with Enhanced Cyclic Stability. ChemSusChem 2025, 18, e202501334. [Google Scholar] [CrossRef] [PubMed]
- Cui, S.; Mao, J.; Rouabhia, M.; Elkoun, S.; Zhang, Z. A biocompatible polypyrrole membrane for biomedical applications. RSC Adv. 2021, 11, 16996–17006. [Google Scholar] [CrossRef] [PubMed]
- Xie, C.; Li, P.; Han, L.; Wang, Z.; Zhou, T.; Deng, W.; Wang, K.; Lu, X. Electroresponsive and cell-affinitive polydopamine/polypyrrole composite microcapsules with a dual-function of on-demand drug delivery and cell stimulation for electrical therapy. NPG Asia Mater. 2017, 9, e358. [Google Scholar] [CrossRef]
- Tian, G.; Yang, D.; Chen, C.; Duan, X.; Kim, D.-H.; Chen, H. Simultaneous Presentation of Dexamethasone and Nerve Growth Factor via Layered Carbon Nanotubes and Polypyrrole to Interface Neural Cells. ACS Biomater. Sci. Eng. 2023, 9, 5015–5027. [Google Scholar] [CrossRef] [PubMed]
- Yang, Y.; Chen, B.Z.; Zhang, X.P.; Zheng, H.; Li, Z.; Zhang, C.Y.; Guo, X.D. Conductive Microneedle Patch with Electricity-Triggered Drug Release Performance for Atopic Dermatitis Treatment. ACS Appl. Mater. Interfaces 2022, 14, 31645–31654. [Google Scholar] [CrossRef] [PubMed]
- de Boer, K.; Schroën, K. Real-time polypyrrole electrodeposition kinetics monitored by surface plasmon resonance: impact of the deposition method and dopamine copolymerization. Langmuir 2025, 41, 19332–19343. [Google Scholar] [CrossRef] [PubMed]
- Pham, D.; Gouafong, R.; Irvin, J.; McKinney, B.; Dileonardi, J.; Cox, M.; Aphale, A. Evolution of polypyrrole electrode during electropolymerization and its effect on energy storage performance. Sci. Rep. 2026, 16. [Google Scholar] [CrossRef] [PubMed]
- Puerres, J.; Ortiz, P.; Cortés, M.T. Effect of Electrosynthesis Potential on Nucleation, Growth, Adhesion, and Electronic Properties of Polypyrrole Thin Films on Fluorine-Doped Tin Oxide (FTO). Polymers 2021, 13, 2419. [Google Scholar] [CrossRef] [PubMed]
- Alkahtani, M.E.; Elbadawi, M.; Chapman, C.A.R.; Green, R.A.; Gaisford, S.; Orlu, M.; Basit, A.W. Electroactive Polymers for On-Demand Drug Release. Adv. Heal. Mater. 2023, 13, e2301759. [Google Scholar] [CrossRef] [PubMed]
- Krawczyk, S.; Golba, S.; Neves, C.; Tedim, J. Chlorpromazine–Polypyrrole Drug Delivery System Tailored for Neurological Application. Molecules 2024, 29, 1531. [Google Scholar] [CrossRef] [PubMed]
- Liu, M.; Zhu, J.; Popovich, V.A.; Borisov, E.; Mol, J.M.C.; Gonzalez-Garcia, Y. Corrosion and passive film characteristics of 3D-printed NiTi shape memory alloys in artificial saliva. Rare Met. 2023, 42, 3114–3129. [Google Scholar] [CrossRef]
- Abbas, A.; Hung, H.-Y.; Lin, P.-C.; Yang, K.-C.; Chen, M.-C.; Lin, H.-C.; Han, Y.-Y. Atomic layer deposited TiO2 films on an equiatomic NiTi shape memory alloy for biomedical applications. J. Alloy. Compd. 2021, 886. [Google Scholar] [CrossRef]
- Miar, S.; Ong, J.L.; Bizios, R.; Guda, T. Electrically Stimulated Tunable Drug Delivery from Polypyrrole-Coated Polyvinylidene Fluoride. Front. Chem. 2021, 9. [Google Scholar] [CrossRef] [PubMed]
- Pérez-Nava, A.; González-Campos, J.B.; Frontana-Uribe, B.A. Conducting Polymers for In Situ Drug Release Triggered via Electrical Stimulus. ACS Appl. Polym. Mater. 2024, 6, 9375–9395. [Google Scholar] [CrossRef]
- Wu, C.; He, X.; Zhu, Y.; Weng, W.; Cheng, K.; Wang, D.; Chen, Z. Electrochemical deposition of Ppy/Dex/ECM coatings and their regulation on cellular responses through electrical controlled drug release. Colloids Surf. B Biointerfaces 2022, 222, 113016. [Google Scholar] [CrossRef] [PubMed]
- Yang, M.; Brackenbury, W.J. Membrane potential and cancer progression. Front. Physiol. 2013, 4, 185. [Google Scholar] [CrossRef] [PubMed]
- Frandsen, S.K.; Krüger, M.B.; Mangalanathan, U.M.; Tramm, T.; Mahmood, F.; Novak, I.; Gehl, J. Normal and Malignant Cells Exhibit Differential Responses to Calcium Electroporation. Cancer Res. 2017, 77, 4389–4401. [Google Scholar] [CrossRef] [PubMed]
- Geboers, B.; Scheffer, H.J.; Graybill, P.M.; Ruarus, A.H.; Nieuwenhuizen, S.; Puijk, R.S.; van den Tol, P.M.; Davalos, R.V.; Rubinsky, B.; De Gruijl, T.D.; et al. High-Voltage Electrical Pulses in Oncology: Irreversible Electroporation, Electrochemotherapy, Gene Electrotransfer, Electrofusion, and Electroimmunotherapy. Radiology 2020, 295, 254–272. [Google Scholar] [CrossRef] [PubMed]
Figure 1.
(a) SEM image of NiTi;(b) SEM image of NiTi-PPy;(c) SEM image of NiTi-PPy-S sample;(d) Zeta potential plots of NiTi-PPy and NiTi-PPy-S samples;(e) FT-IR spectra of NiTi, NiTi-PPy, and NiTi-PPy-S samples; (f) XRD patterns of NiTi, NiTi-PPy, and NiTi-PPy-S samples;(g) XPS patterns of NiTi, NiTi-PPy, and NiTi-PPy-S samples;(h) high-resolution N 1s spectra;(i) high-resolution F 1s spectra of NiTi, NiTi-PPy, and NiTi-PPy-S samples.
Figure 1.
(a) SEM image of NiTi;(b) SEM image of NiTi-PPy;(c) SEM image of NiTi-PPy-S sample;(d) Zeta potential plots of NiTi-PPy and NiTi-PPy-S samples;(e) FT-IR spectra of NiTi, NiTi-PPy, and NiTi-PPy-S samples; (f) XRD patterns of NiTi, NiTi-PPy, and NiTi-PPy-S samples;(g) XPS patterns of NiTi, NiTi-PPy, and NiTi-PPy-S samples;(h) high-resolution N 1s spectra;(i) high-resolution F 1s spectra of NiTi, NiTi-PPy, and NiTi-PPy-S samples.
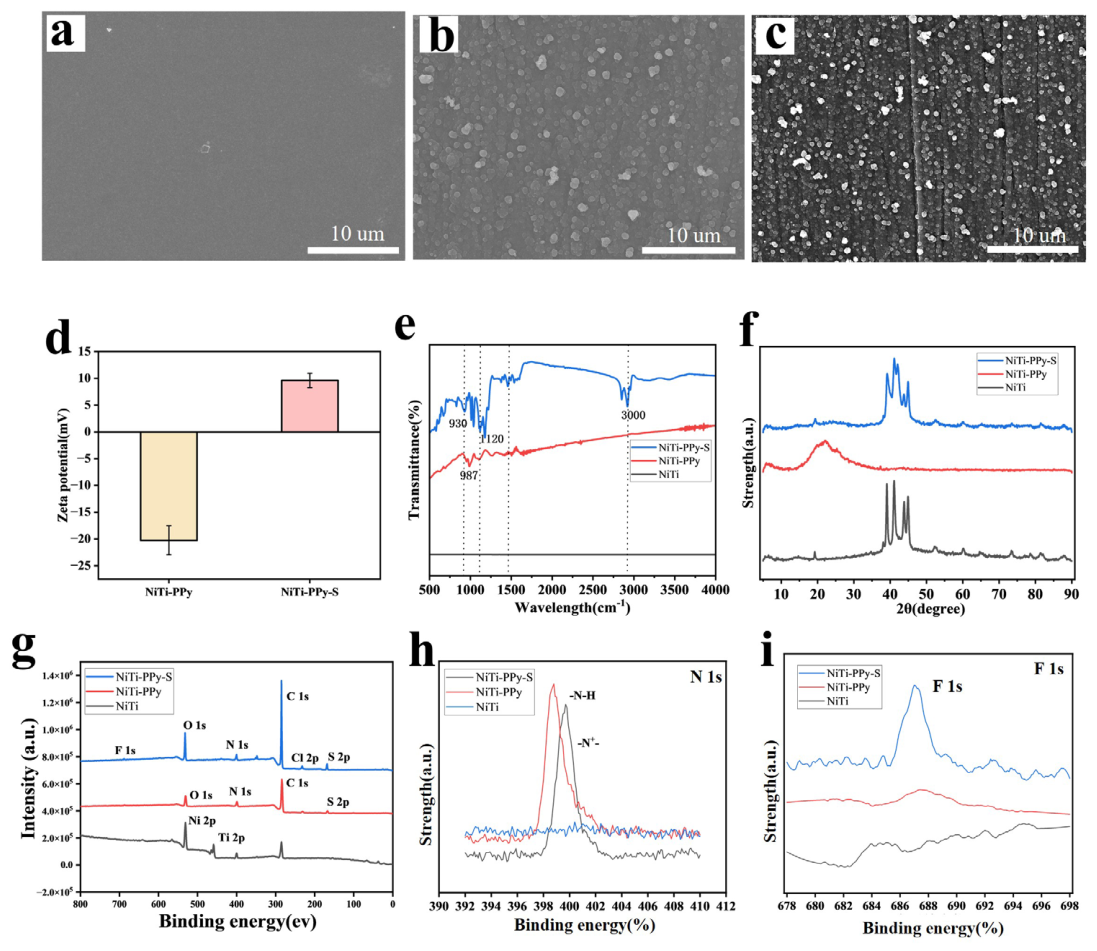
Figure 2.
(a) Current-time (I-t) curves of NiTi-PPy and NiTi-PPy-S;(b) Redox Cyclic Voltammetry Curves of NiTi-PPy and NiTi-PPy-S Samples;(c) Nyquist plots of NiTi, NiTi-PPy, and NiTi-PPy-S;(d) Conductivity of NiTi, NiTi-PPy, and NiTi-PPy-S. Data are presented as mean ± standard deviation (n = 3); *P < 0.05, **P < 0.01, ***P < 0.001.
Figure 2.
(a) Current-time (I-t) curves of NiTi-PPy and NiTi-PPy-S;(b) Redox Cyclic Voltammetry Curves of NiTi-PPy and NiTi-PPy-S Samples;(c) Nyquist plots of NiTi, NiTi-PPy, and NiTi-PPy-S;(d) Conductivity of NiTi, NiTi-PPy, and NiTi-PPy-S. Data are presented as mean ± standard deviation (n = 3); *P < 0.05, **P < 0.01, ***P < 0.001.
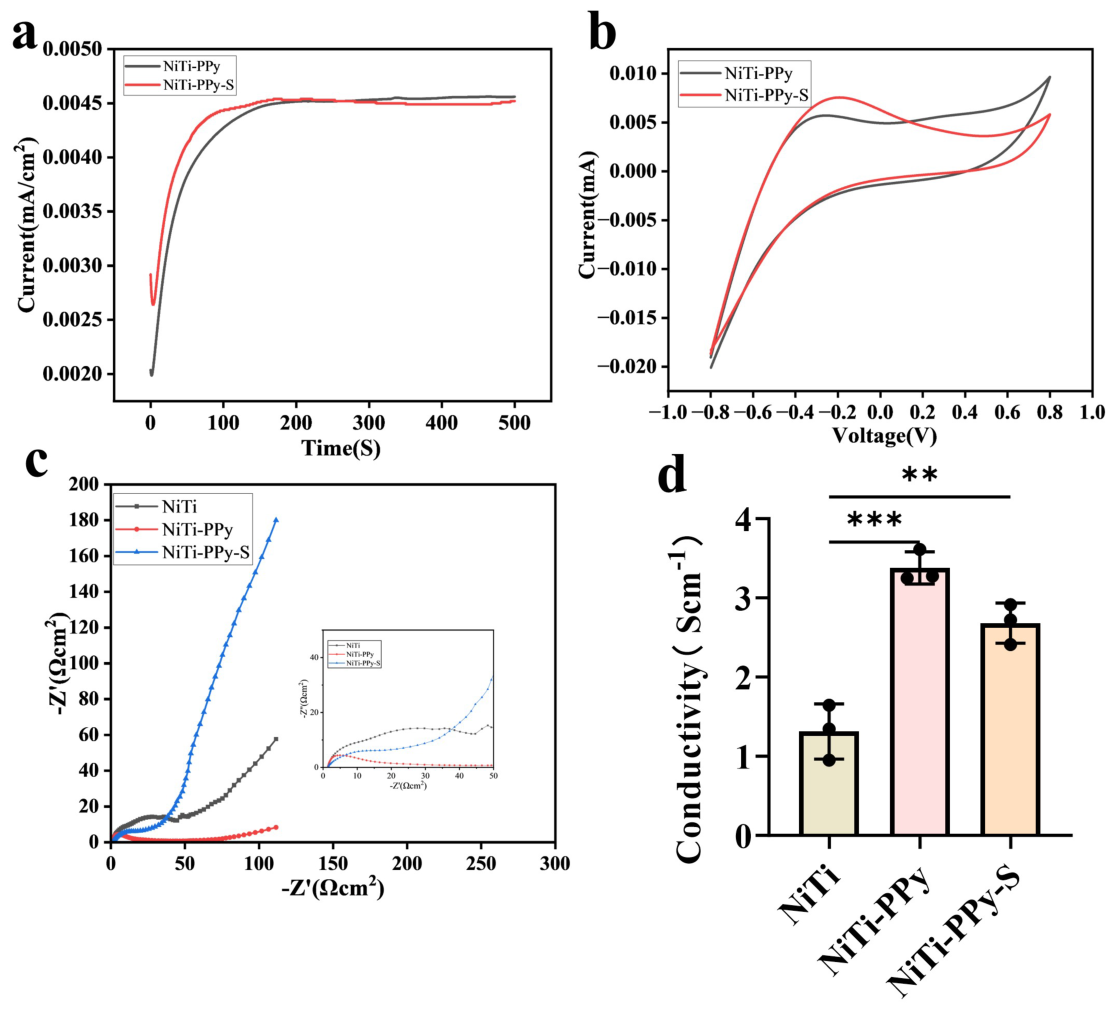
Figure 3.
(a) UV absorption spectrum of sorafenib; (b) Calibration curve for sorafenib; (c) The electro-release control curve of Sorafenib.
Figure 3.
(a) UV absorption spectrum of sorafenib; (b) Calibration curve for sorafenib; (c) The electro-release control curve of Sorafenib.
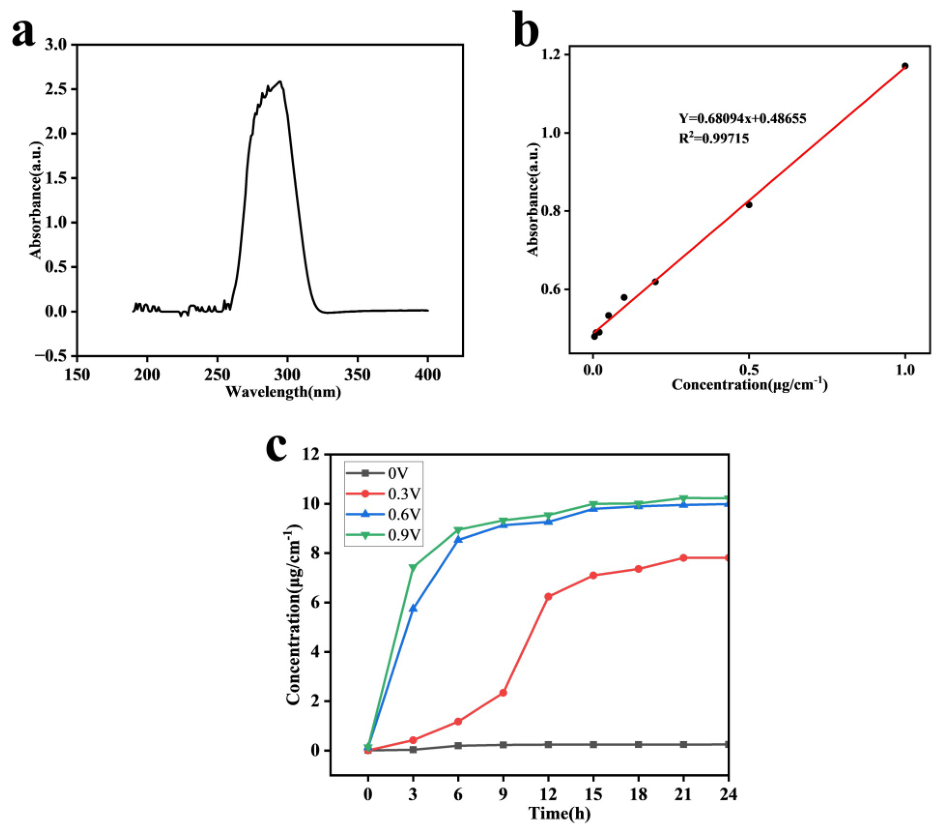
Figure 4.
(a) Fluorescence images of Calcein-AM/PI staining in Hepa1-6 cells and (b) HUVEC cells cultured on NiTi, NiTi-PPy, and NiTi-PPy-S surfaces for 1, 3, and 5 days under ES conditions; (c) corresponding CCK-8 quantitative survival rate analysis for Hepa1-6 cells and (d) HUVEC cells under ES conditions; (e) Fluorescence images of Calcein-AM/PI staining in (e) Hepa1-6 cells and (f) HUVEC cells cultured on NiTi, NiTi-PPy, and NiTi-PPy-S surfaces for 1, 3, and 5 days under non-ES conditions; (g) corresponding CCK-8 quantitative survival rate analysis for (g) Hepa1-6 cells and (h) HUVEC cells under non-ES conditions. Data are presented as mean ± standard deviation (n = 3); *P < 0.05, **P < 0.01, ***P < 0.001, ****P < 0.0001.
Figure 4.
(a) Fluorescence images of Calcein-AM/PI staining in Hepa1-6 cells and (b) HUVEC cells cultured on NiTi, NiTi-PPy, and NiTi-PPy-S surfaces for 1, 3, and 5 days under ES conditions; (c) corresponding CCK-8 quantitative survival rate analysis for Hepa1-6 cells and (d) HUVEC cells under ES conditions; (e) Fluorescence images of Calcein-AM/PI staining in (e) Hepa1-6 cells and (f) HUVEC cells cultured on NiTi, NiTi-PPy, and NiTi-PPy-S surfaces for 1, 3, and 5 days under non-ES conditions; (g) corresponding CCK-8 quantitative survival rate analysis for (g) Hepa1-6 cells and (h) HUVEC cells under non-ES conditions. Data are presented as mean ± standard deviation (n = 3); *P < 0.05, **P < 0.01, ***P < 0.001, ****P < 0.0001.
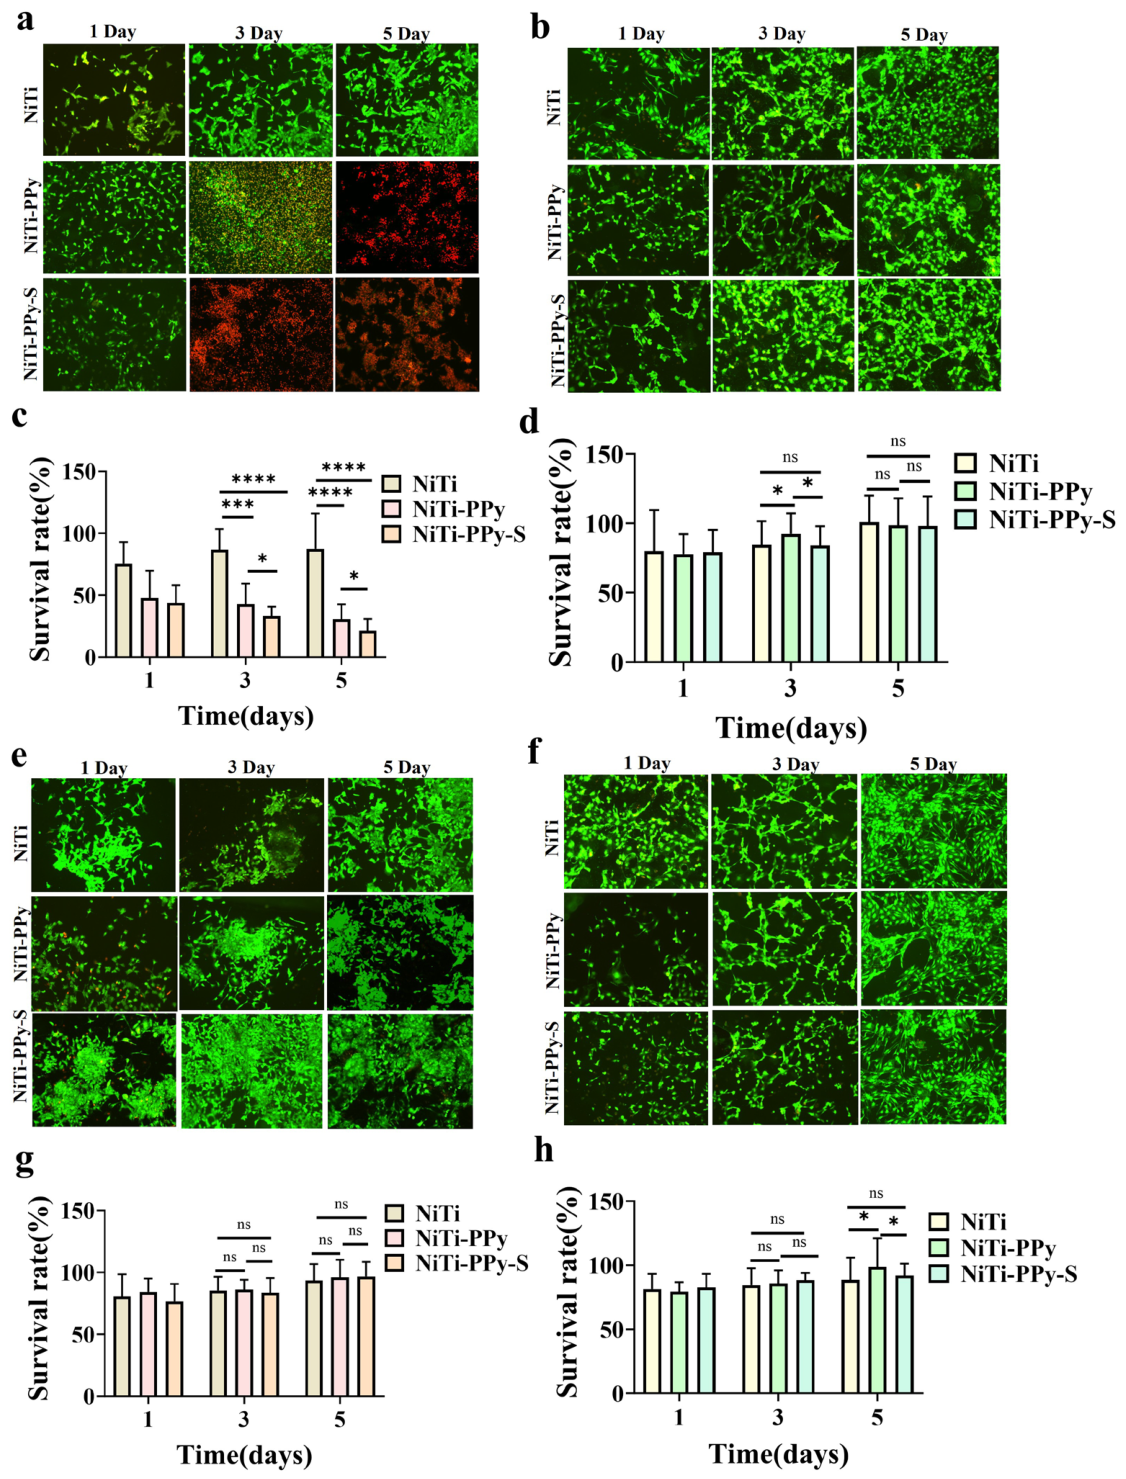
Figure 5.
Fluorescent images of live/dead cell staining in (a) Hepa1-6 cells and (b) HUVEC cells 24 hours after treatment with different voltages (0 V, 0.3 V, 0.6 V, 0.9 V).
Figure 5.
Fluorescent images of live/dead cell staining in (a) Hepa1-6 cells and (b) HUVEC cells 24 hours after treatment with different voltages (0 V, 0.3 V, 0.6 V, 0.9 V).
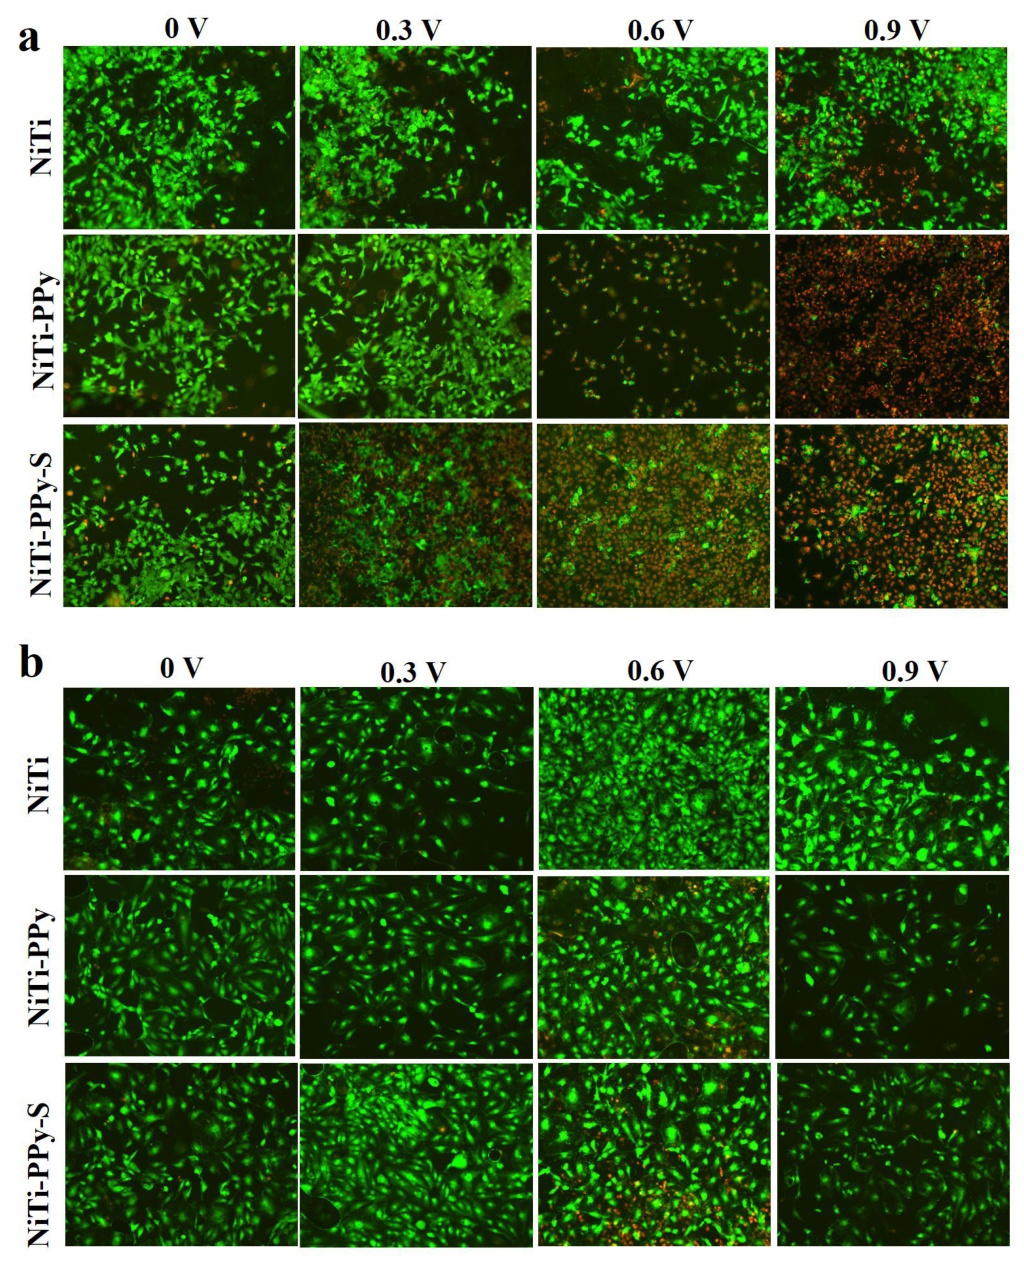
Figure 6.
(a) Annexin V-FITC/PI flow cytometry plots of Hepa1-6 cells treated with ES in the NiTi, NiTi-PPy, and NiTi-PPy-S groups, and (b) those treated without ES; (c) Quantitative analysis of total cell death in Hepa1-6 cells treated with ES and (d) those treated without ES;(e) Annexin V-FITC/PI flow cytometry plots of HUVEC cells treated with ES in the NiTi, NiTi-PPy, and NiTi-PPy-S groups, and(f) those treated without ES;(g) Quantitative analysis of total cell death in HUVEC cells treated with ES and (h) those treated without ES. Data are presented as mean ± standard deviation (n = 3); *P < 0.05, **P < 0.01, ***P < 0.001.
Figure 6.
(a) Annexin V-FITC/PI flow cytometry plots of Hepa1-6 cells treated with ES in the NiTi, NiTi-PPy, and NiTi-PPy-S groups, and (b) those treated without ES; (c) Quantitative analysis of total cell death in Hepa1-6 cells treated with ES and (d) those treated without ES;(e) Annexin V-FITC/PI flow cytometry plots of HUVEC cells treated with ES in the NiTi, NiTi-PPy, and NiTi-PPy-S groups, and(f) those treated without ES;(g) Quantitative analysis of total cell death in HUVEC cells treated with ES and (h) those treated without ES. Data are presented as mean ± standard deviation (n = 3); *P < 0.05, **P < 0.01, ***P < 0.001.
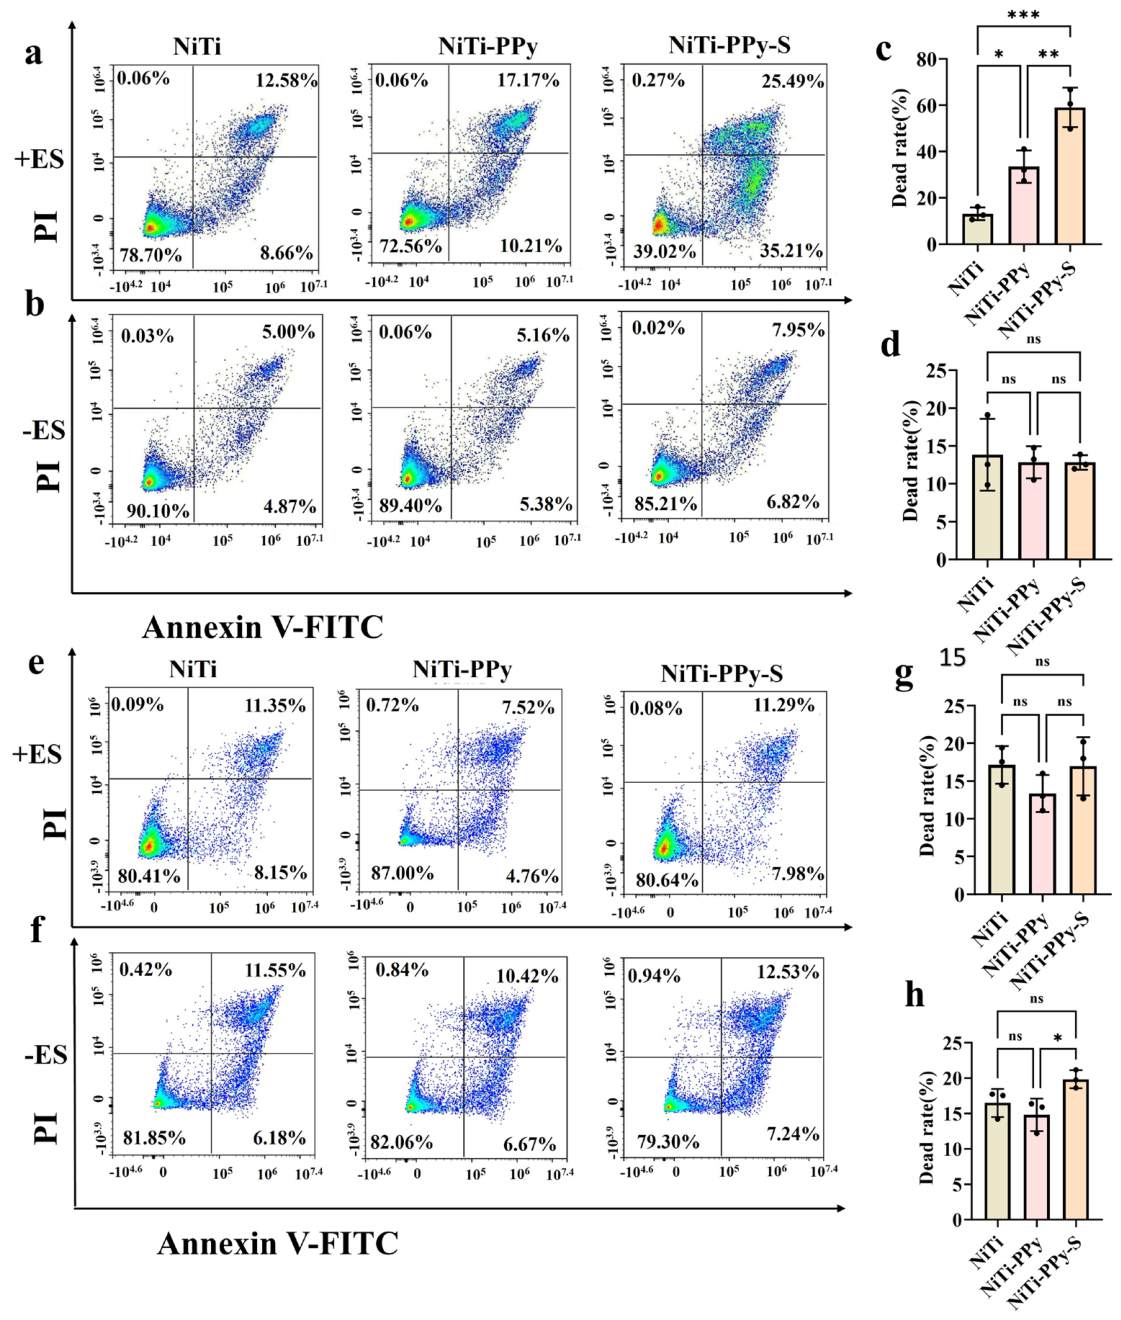
Figure 7.
(a) Representative microscopic images of Hepa1-6 cells and (c) HUVEC cells stained with the JC-1 fluorescent probe; (b) and (d) show quantitative analyses of the average fluorescence intensity of green fluorescence in the two cell types, respectively; (e) Calcium influx in Hepa1-6 cells; (f) Calcium influx in HUVEC cells; (g) Mitochondrial calcium influx in Hepa1-6 cells; (h) Mitochondrial calcium influx in HUVEC cells. Data are presented as mean ± standard deviation (n = 3); *P < 0.05, **P < 0.01, ***P < 0.001, ****P < 0.0001.
Figure 7.
(a) Representative microscopic images of Hepa1-6 cells and (c) HUVEC cells stained with the JC-1 fluorescent probe; (b) and (d) show quantitative analyses of the average fluorescence intensity of green fluorescence in the two cell types, respectively; (e) Calcium influx in Hepa1-6 cells; (f) Calcium influx in HUVEC cells; (g) Mitochondrial calcium influx in Hepa1-6 cells; (h) Mitochondrial calcium influx in HUVEC cells. Data are presented as mean ± standard deviation (n = 3); *P < 0.05, **P < 0.01, ***P < 0.001, ****P < 0.0001.
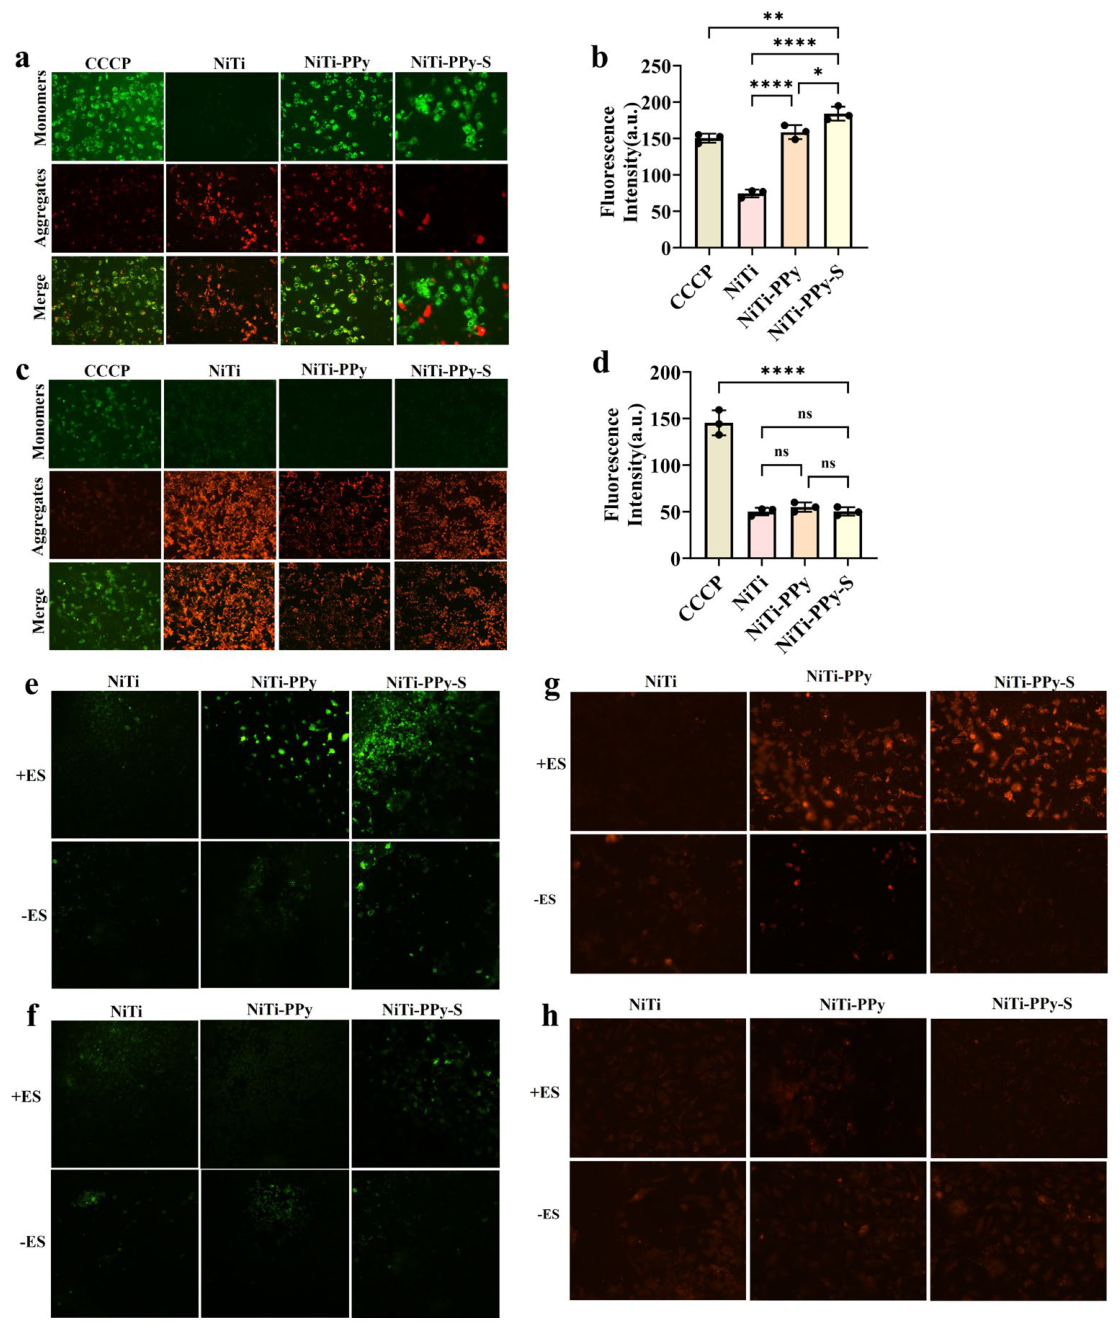
Figure 8.
(a) The effects of various components on Caspase-3 gene expression and (c) Bcl-2 gene expression in Hepa1-6 cells under conditions with and without electrical stimulation (±ES); (b) The effects of various components on Caspase-3 gene expression and (d) Bcl-2 gene expression in HUVEC cells under conditions with and without electrical stimulation (±ES). Data are presented as mean ± standard deviation (n = 3); *P < 0.05, **P < 0.01, ***P < 0.001, ****P < 0.0001.
Figure 8.
(a) The effects of various components on Caspase-3 gene expression and (c) Bcl-2 gene expression in Hepa1-6 cells under conditions with and without electrical stimulation (±ES); (b) The effects of various components on Caspase-3 gene expression and (d) Bcl-2 gene expression in HUVEC cells under conditions with and without electrical stimulation (±ES). Data are presented as mean ± standard deviation (n = 3); *P < 0.05, **P < 0.01, ***P < 0.001, ****P < 0.0001.
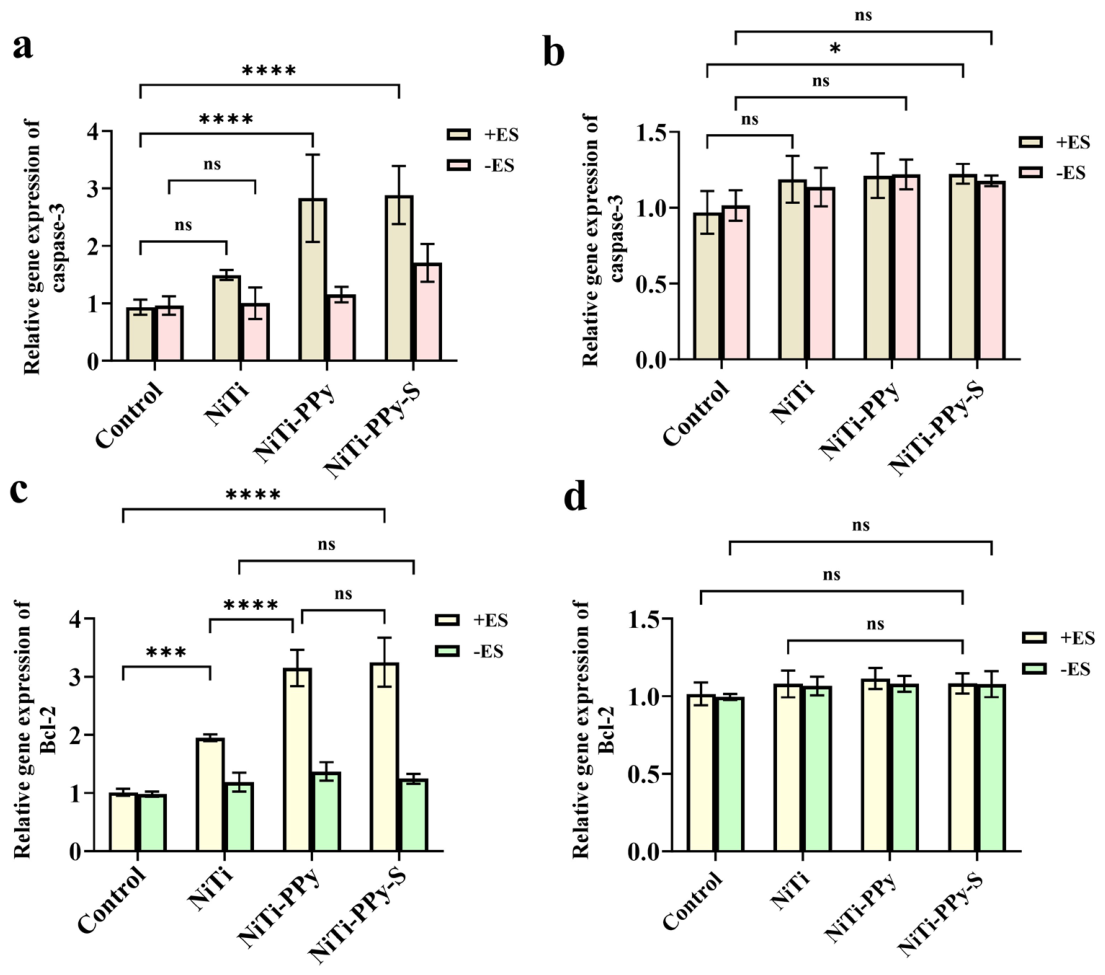
Figure 10.
(a) Photographs of ex vivo tumor morphology; (b) Curve showing changes in total body weight of mice; (c) Curve showing tumor volume growth; (d) Curve showing changes in tumor-free body weight of mice;(e) Histopathological analysis of tumor tissues from different treatment groups;(f) Analysis of immunofluorescence staining of tumor tissue following ES ablation.
Figure 10.
(a) Photographs of ex vivo tumor morphology; (b) Curve showing changes in total body weight of mice; (c) Curve showing tumor volume growth; (d) Curve showing changes in tumor-free body weight of mice;(e) Histopathological analysis of tumor tissues from different treatment groups;(f) Analysis of immunofluorescence staining of tumor tissue following ES ablation.
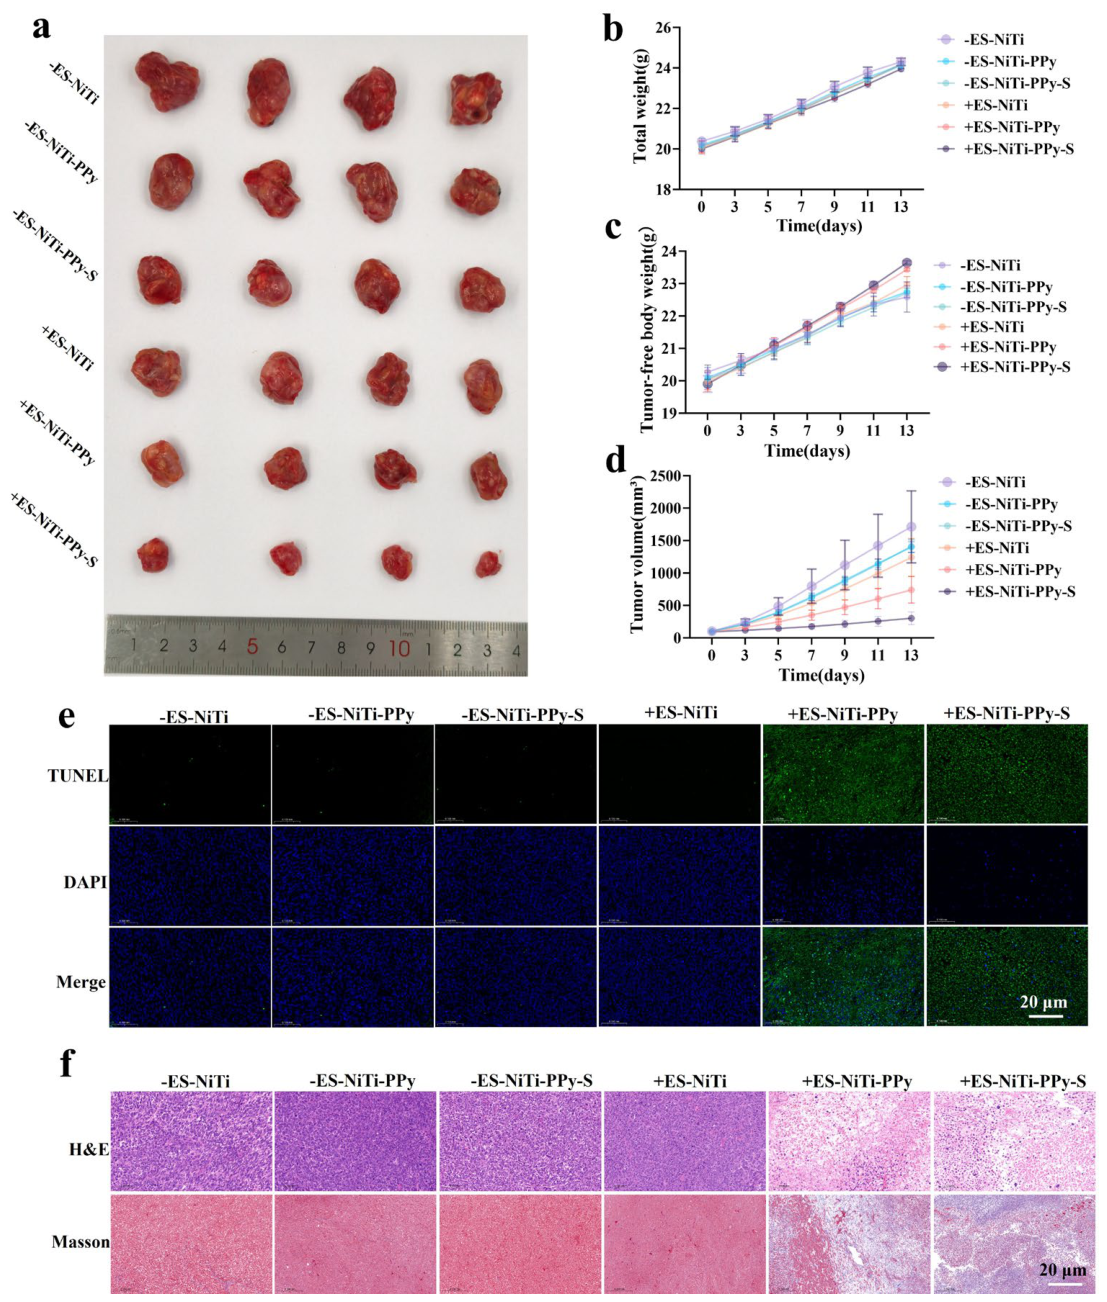
Figure 11.
Histopathological analysis of tumor tissues from different treatment groups.
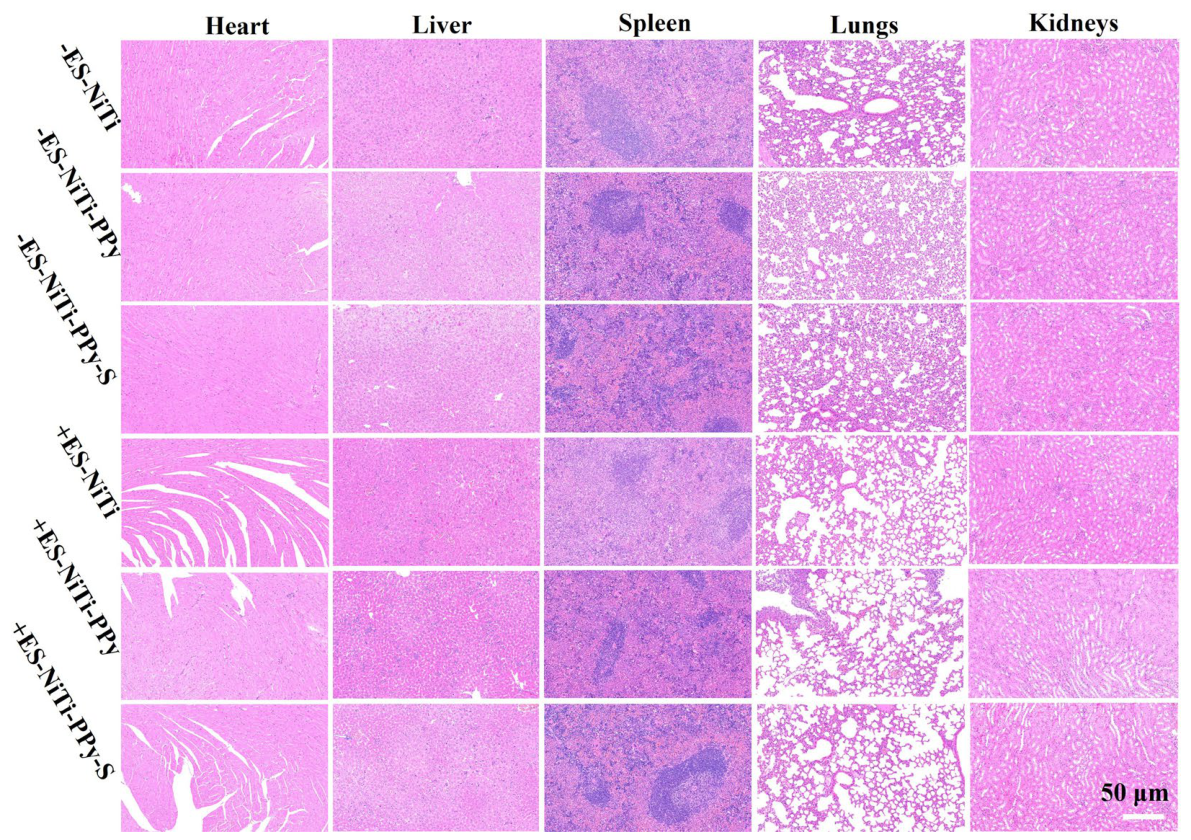

Table 1.
Abbreviations for different sample components.
| Sample Code | Surface Composition | Sorafenib loading dose | ES |
|---|---|---|---|
| NiTi | Polished and etched NiTi alloy | None | ±ES |
| NiTi-PPy | Deposition of a PPy film on a NiTi | None | ±ES |
| NiTi-PPy-S | NiTi-coated PPy films loaded with sorafenib | Yes | ±ES |
Disclaimer/Publisher’s Note: The statements, opinions and data contained in all publications are solely those of the individual author(s) and contributor(s) and not of MDPI and/or the editor(s). MDPI and/or the editor(s) disclaim responsibility for any injury to people or property resulting from any ideas, methods, instructions or products referred to in the content. |
© 2026 by the authors. Licensee MDPI, Basel, Switzerland. This article is an open access article distributed under the terms and conditions of the Creative Commons Attribution (CC BY) license.
Copyright: This open access article is published under a Creative Commons CC BY 4.0 license, which permit the free download, distribution, and reuse, provided that the author and preprint are cited in any reuse.


