

Submitted:
30 June 2026
Posted:
01 July 2026
You are already at the latest version
Abstract
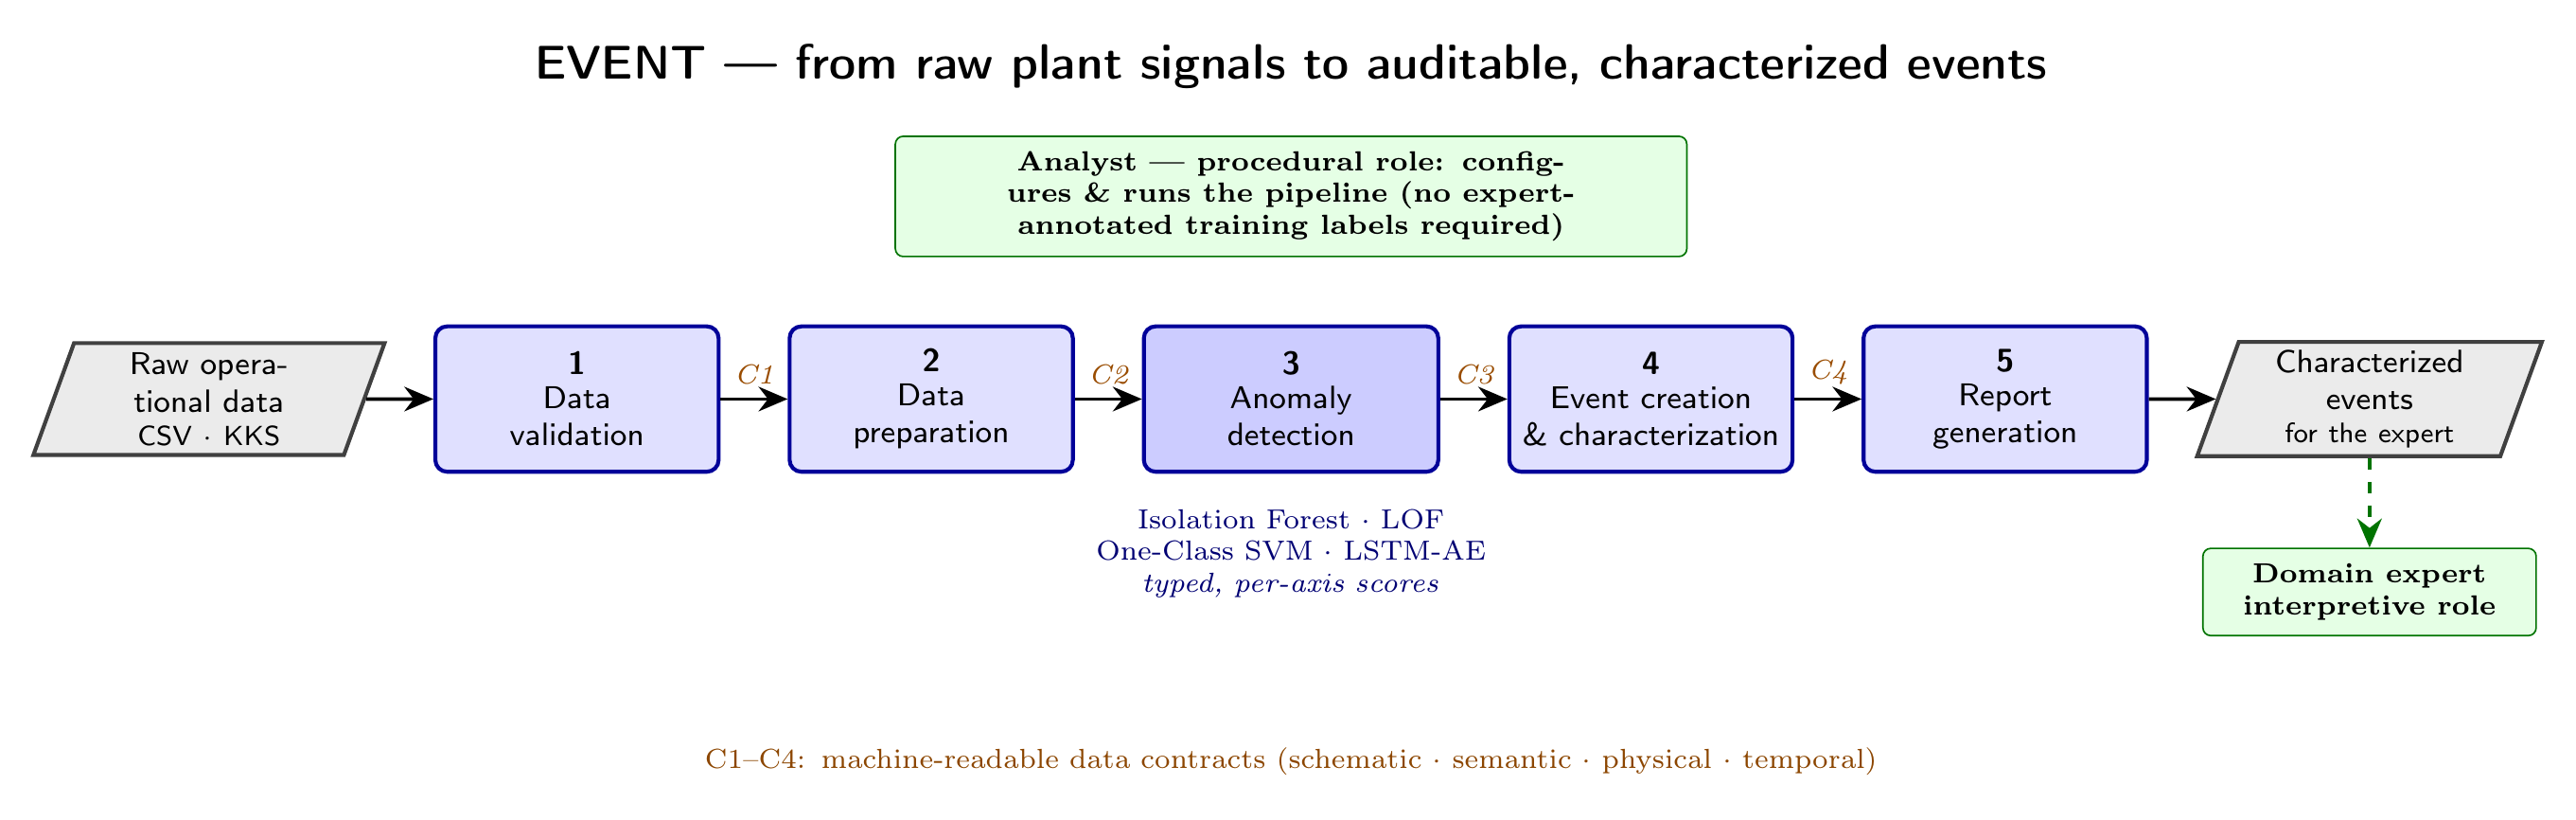
Operational data from thermal power plants is interpreted through the judgment of experienced experts, following procedures that are often only partly documented and hard to reproduce. The literature offers many algorithmic techniques, yet workflow-level methodologies that bind validation, detection, event creation and expert review into an auditable whole remain scarce. This article proposes EVENT (Expert eValuation of ENumerated Typed events), a semi-automated methodology for offline analysis of operational time-series data. It is organized as five steps – data validation, data preparation, anomaly detection, event creation and report generation – linked by machine-readable data contracts covering schematic, semantic, physical and temporal checks. Two design choices set it apart. The reporting unit is the event, not the isolated anomalous sample, and the procedural role of the analyst is kept distinct from the interpretive role of the domain expert. As a proof of concept, the method ran on a one-year anonymized dataset labeled with the KKS coding standard. A controlled injection of seventy constructed faults across eleven categories was caught in full by the contract checks, and the pipeline ran end to end on the annual record. These results verify the workflow, but they are not a statistical validation of detection performance.
Keywords:
anomaly detection
; thermal power plant
; operational data
; EVENT methodology
; data contracts
; semi-automation
; analyst–expert role separation
; ensemble methods
; event characterization
1. Introduction
Modern thermal power plants are technological complexes with extensive measurement instrumentation. Their operational information systems record hundreds to thousands of signals across the life cycle of the equipment, and this data stream underlies several tasks of operational analytics and maintenance, among them fault detection and diagnosis (FDD), predictive maintenance and the documentation of operational events for incident investigation. The catalog of validated anomaly-detection algorithms is by now extensive [1]. The practice built on top of it is not. Analysis in the field tends to stay fragmented and to rest on a narrow circle of experienced experts, because procedures are passed on tacitly, the choice of algorithm is intuitive and the results are hard to reproduce. What has received less attention is the workflow level: a disciplined, reproducible procedure that would place the available algorithms in the hands of an analyst without a narrow domain specialization, comparable to the role that established process frameworks play in adjacent data-analysis disciplines but not yet common in operational FDD practice. The recent PRISMA systematic review of FDD by Zhao et al. [2] points the same way, stressing the need to connect methodological innovation with deployment practicality.
There is a direct operational reason to analyze this data stream, since the availability and safe running of the generating unit depend on it. A thermal power plant works under heavy thermal and mechanical load, and the slow degradation of a feedwater, turbine or generator subsystem moves the operating point of the affected equipment well before any protection threshold is reached; catching such deviations early is what condition-based maintenance and the avoidance of unplanned outages rest upon. The decisions taken by operation and maintenance staff are made at the level of the event: when to schedule an inspection or an overhaul, how to investigate an operational event for incident and root-cause analysis, whether a unit may keep running within its safe envelope. A point alarm, taken on its own, does not inform any of these. The same event record also supports efficiency decisions, because a slow departure of temperatures, pressures or flows from the established baseline is a common sign of the fouling, leakage or instrumentation drift that erodes the heat rate. An account that preserves the time extent of an event, the signals it affects and the kind of deviation therefore ties the analytical output to maintenance planning and to the safe and efficient operation of the unit.
EVENT (Expert eValuation of ENumerated Typed events) is the response proposed here: a semi-automated pipeline of five processing steps linked by data contracts. It separates the role of the analyst from that of the domain expert, moves the output from point anomalies to characterized events that carry a temporal extent and a set of affected signals [3], accepts different formats of operational data and signal-naming conventions including the KKS standard, and is evaluated as a proof of concept on real operational data from a thermal power plant.
2. Related Work
2.1. Fault Detection in Thermal Power Plants
FDD in thermal power plants is a traditionally well-developed area of engineering data analysis. Early work established individual algorithmic tools. Chen [4] demonstrated the practical applicability of support vector machines for plant-equipment fault detection, Ajami and Daneshvar [5] applied independent component analysis to separate fault signatures from multivariate turbine data, and Mulongo [6] examined a broader family of machine-learning and neural-network algorithms for anomaly detection in generating units. Li [7] extended the topic to unsupervised deep generative models in nuclear energy, where the absence of labeled fault data makes the classical supervised approach impracticable. Zhang et al. [8] combined several detectors into a composite anomaly-detection system for data-driven power-plant condition monitoring, an early instance of the detector-composition idea that EVENT generalizes into a full workflow. Transparent statistical approaches have also been validated in this domain. Vilas Boas et al. [9] applied control charts and adapted Nelson rules to the supervisory data of internal-combustion engines and validated the identified non-standard states against the operational log, which illustrates the value of interpretability and of validation against operational records, although that work addresses neither a general modular pipeline nor the conversion of point-level findings into characterized events. A related line concerns the fusion of physical knowledge into data-driven models, for which Al Rashdan et al. [10] propose a qualitative strategy for choosing between empirical and hybrid, physics-informed models for process anomaly detection. EVENT relates to this line through the physical layer of its data contract, while its detection ensemble remains predominantly data-driven.
Among the review works, Khalid [1] classifies FDD methods into model-based, data-driven and statistical groups, and the recent PRISMA systematic review by Zhao [2] maps the state of FDD across the chemical, petrochemical and energy industries and identifies the roles of large language models, digital twins and explainable artificial intelligence as open directions. Either way, these works contribute algorithmic tools or taxonomic overviews. The layer between the two is where the present work sits: a procedure for composing such algorithms into a reproducible workflow, with an explicit account of how each algorithm is used, parameterized and audited at every step.
2.2. Semi-Automated Systems and Human-in-the-Loop
A second relevant line consists of systems that integrate the human into the analytical process. Knowledge-based and fuzzy expert systems are the classical reference. Lee [11] published a fuzzy expert system for integrated fault diagnosis in a power transmission network and substations, and Nan [12] described a knowledge-based expert system for real-time fault diagnosis. The common feature of these works is the value of explicitly encoded expert knowledge, alongside its known drawbacks of rigid rules, difficult maintenance and limited portability between installations. More recent approaches seek to overcome these limits. Bikaun and Hodkiewicz [13] proposed a semi-automated estimation of reliability indicators from informal maintenance work-order records, and Schwarzinger et al. [14] propose a semi-automated, knowledge-based approach that derives time-series event specifications from a system model using abstract reasoning rules, allowing integrators to add the specifications that cannot be derived automatically. The LLM-TSFD method [15] places a large language model in the role of a coordinator of data processing and decision-making under human supervision. Closer to the operational reality of a power plant, Stojic et al. [16] presented an ANFIS-based assistive system for thermal-plant management that supports the operator in estimating operating parameters and shows that the residual between the predicted and the actual value can indicate an operational anomaly. EVENT shares the semi-automation philosophy of these works but differs from them in two respects. It formalizes the role of the analyst as a distinct actor of the methodology, instead of relying on a single undifferentiated user role, and it keeps each intermediate output as a traceable data artifact, not as the internal state of a model. Compared with assistive systems focused on a specific operating task, EVENT is formulated as a more general offline workflow for data validation, detector composition, event creation and subsequent expert interpretation, and unlike the classical expert systems [11,12] it does not require faults to be encoded in advance, presenting instead candidate events whose domain interpretation is left to the expert.
2.3. The Point-Level Versus the Event-Level Perspective
A third line, central to positioning EVENT, is the difference between the point-level and the event-level granularity of anomaly detection. The majority of detection algorithms produce an output at the level of individual samples, assigning a score or a binary label to each time point, which holds for the dominant representatives such as Isolation Forest, Local Outlier Factor and One-Class SVM [17,18]. This granularity is convenient for sample-level metrics but impractical for interpretation, because an operational expert needs to know what happened in the plant within a given time interval and which equipment was concerned, and not in which individual samples a threshold was exceeded. The shift towards the event level has become visible in the literature only recently. Zhevnenko [3] evaluated fourteen detection models on five public and two industrial datasets at the event level, with augmentations simulating real fault scenarios. The study reported no universal winner and a domain dependence of the optimal model – a finding that both supports the event-level perspective and motivates an ensemble at the detection level. In EVENT the event is used not only for evaluation, as in Zhevnenko, or for specifying detection rules, as in Schwarzinger [14], but as the organizing unit of the whole pipeline, since Step 4 creates and characterizes events and Step 5 produces a report organized around events instead of anomalous samples.
2.4. Identified Gaps and the Position of EVENT
The review exposes four gaps that EVENT is built to close. One is the workflow level itself: concrete algorithms [4,18] and framing overviews [1,2] are easy to find, yet the layer between them – a formal procedure that composes those algorithms in a controlled way – stays underdeveloped. Roles are a second gap. Schwarzinger [14] separates the domain expert from the system integrator who authors event specifications, and the LLM-TSFD method [15] hands the integrator role to a language model, but neither treats the procedural analyst as an actor distinct from the interpretive domain expert inside the detection pipeline. That separation is what EVENT introduces. Granularity is a third: practical tooling stays organized around samples even where event-level evaluation is recognized as relevant [3]. Portability is the last. Industrial datasets arrive with KKS labeling, with plain signal names, or in mixed form, and each demands a validation and mapping layer that current tools seldom provide. Table 1 summarizes where EVENT stands relative to the most relevant reference lines.
3. The EVENT Methodology
This section describes the methodology at the level of its design principles and of what distinguishes it from existing work. Established detection algorithms are referenced, not re-derived, and the per-step operational detail is kept to the minimum needed to follow the argument.
3.1. Separation of the Analyst and Expert Roles
In current practice the analysis of thermal-plant operational data is usually conceived as an iterative collaboration between a data analyst and a domain expert that recurs at every processing step, which tends to be demanding on the expert’s time, since the expert is consulted during data validation, threshold setting and detector configuration. The EVENT methodology introduces a formal separation of the two roles, designed to reduce, rather than eliminate, the need for plant-specific knowledge during preprocessing and detector configuration. The analyst proceeds primarily according to documented decision rules and configuration templates, with only a limited need for the interpretation of individual signals, whereas the expert enters mainly at the stage of interpreting the characterized events in the final report and therefore assesses a largely finished output. This separation is treated as part of the methodology and not as a mere organizational measure, and it follows the human-in-the-loop approach and the emphasis on transparent and traceable decision-making discussed in the literature [13,14]. It is realized through three connected artifacts: a documented workflow for the analyst, a structured report for the expert, and the data contracts that act as interfaces between the steps.
3.2. Architecture: Five Steps Linked by Data Contracts
The methodology is realized as a pipeline of five processing steps (data validation, data preparation, anomaly detection, event creation and characterization, and report generation), in which each step is an independent module and each pair of consecutive steps is joined by a formal data contract (Figure 1). The input is a raw operational file, typically a CSV with heterogeneous encoding and national number and date conventions, and the output is an auditable report listing the characterized events together with their time windows, priority and contextual visualizations. A data contract is a machine-readable document (JSON in the current implementation) that specifies the schema of the transferred data and is structured into four layers: schematic (column types, presence, timestamp format and type-level value ranges), semantic (KKS identifier, physical quantity and unit for each signal), physical (value ranges and maximum rates of change admissible for the equipment) and temporal (continuity and monotonicity of the time axis and the absence of duplicate records). The contracts support auditability and interoperability across input formats, and the modular structure allows individual steps to be re-run with modified parameters, while a component can be replaced provided it satisfies the corresponding input and output contracts.
3.3. Definitions: Events and Typed Scoring
To make the output of the methodology precise, two objects are defined. First, the point-level result for a sample is not a single anomaly label but a typed vector in which each axis of the fault taxonomy contributes the fields flag, confidence, intensity and provenance, so that the type of the manifested deviation is retained instead of being collapsed into a scalar by a voting rule. Second, an event is represented as a tuple , where is the time interval, S the set of affected physical signals (the engineered features used for detection are attributed back to their source signal), the per-signal deviation pattern, an algorithmic priority score derived from the relative deviation from the baseline, the number of affected signals and the duration, and a descriptor reserved for cascade propagation between signals over time. This priority score orders candidate events for review but does not constitute an expert severity assessment. In the current implementation is recorded only in a simplified form, and the full characterization of cascade propagation is not yet evaluated. Step 4 represents each event as an explicit data record of this form, and Step 5 organizes the report around these records. A real example of such a typed event, produced by a run over the reference dataset, is shown in Figure 2.
3.4. The Five Steps in Brief
Step 1 (data validation) detects the encoding, the column and decimal separators and the timestamp format, infers the signal type from the naming convention (simple prefixes such as T-, P- and F-, or the KKS code recognized by regular expressions), attaches a confidence level to each assignment and emits the data contract. Step 2 (data preparation) runs a sequence of cleaning and feature operations. It removes sentinel error values, frozen-sensor segments and implausible peaks, and imputes missing values by a procedure graded according to the proportion of gaps [19,20]. It then normalizes the signals and derives lag, rolling, cyclic and derivative features [21,22]. Finally, it splits the series chronologically, not randomly, to avoid the data leakage characteristic of time series. Step 3 (anomaly detection) applies a typed composition of detectors. Isolation Forest [23] and Local Outlier Factor [24] (see also [17,18]) cover point and local anomalies, an LSTM-Autoencoder [25] covers gradual drift, and a One-Class SVM [26] provides a stable baseline. The scores are normalized so as to be comparable across methods. Instead of being merged by a voting rule, they are retained as the typed per-axis result defined in Section 3.3. Thresholds may be updated between analysis runs on the basis of previously reviewed reports and plant-specific operating experience, without assuming the availability of labeled fault data. During a given run, the analyst follows the documented configuration. Step 4 (event creation and characterization) groups anomalous points that are close in time and lie on related signals into candidate events, evaluates which signals vary in a correlated manner, encapsulates a validated group into an event in the sense of Section 3.3, and removes isolated short excursions that lack internal coherence. Step 5 (report generation) ranks the events by priority, generates time-series plots, correlation heatmaps and contextual views for the selected events, and assembles an HTML or PDF report that records the methodology version, the detector parameters and the references to the data contracts, so that a run can be reconstructed afterwards.
4. Implementation
A reference implementation accompanies the methodology. It is written in Python (3.10+) and uses the standard scientific stack (pandas [27], NumPy [28], SciPy [29] and scikit-learn [30]) for data handling and for the classical detectors, PyTorch [31] for the LSTM-Autoencoder, Streamlit and Plotly for an interactive interface, and Apache Parquet for inter-step persistence. The repository mirrors the five-step architecture: each step is a separate module with explicitly defined inputs and outputs, and the modules communicate through the data contracts and Parquet files. A central orchestrator runs the steps in a deterministic order and checks the consistency of the contracts between consecutive steps. If a contract check fails, the pipeline is stopped and the error context is recorded for an audit.
Two properties of the implementation are relevant to the methodology. The first is configurability without programming: the parameters that typically change between deployments (the signal-type detection rules, the detector hyperparameters, the event-creation parameters and the stored normalization parameters) are kept in external configuration files that are validated against a formal schema at start-up, so that the analyst adapts the behavior of the methodology by editing commented text files instead of writing code. The second concerns traceability: a manifest file (repro_manifest.json) records SHA-256 checksums of the input dataset, of the configuration, of the Step 4 output and of the Git version of the methodology. The manifest does not by itself guarantee full computational reproducibility, which additionally depends on the software environment and on the deterministic settings of the algorithms used, but it provides a machine-checkable record of the analyzed data, the configuration and the selected outputs. The contract thus serves as a formal interface between steps and as an audit record of the implemented checks, and selected contract information can also be included in the expert report.
The methodology is made available to the analyst through an interactive application built on Streamlit, organized into five tabs that mirror the five steps and that visualize and configure the intermediate results without themselves implementing any computation. The computational logic remains in the Python modules and can also be run from the command line, with identical results. In the evaluated version, all five steps were implemented and the pipeline was executed end to end on the reference dataset. Steps 1 to 3 are more mature in the current implementation, whereas Steps 4 and 5 provide a functional baseline that does not yet cover the full range of the planned characterization methods, in particular the characterization of cascade-propagation patterns, which is the subject of the current development phase.
5. Validation
The validation in this article is of a proof-of-concept nature. After a description of the dataset (Section 5.1), two checks are reported: a quantitative synthetic validation of the data-contract mechanism by controlled fault injection (Section 5.2) and a functional verification of the end-to-end pipeline run over real operational data (Section 5.3); a sensitivity analysis and a pointwise baseline (Section 5.4) then characterize the behavior of the methodology under its configuration. The aim is to demonstrate the functionality of the key mechanisms of the methodology. A rigorous empirical validation over a larger set of expert-annotated real events lies beyond the scope of this article and is left to a dedicated empirical study.
5.1. Dataset
The dataset is an annual operational record from a thermal power plant, with signals labeled according to the KKS coding standard. It was obtained in cooperation with an industrial partner under an anonymity agreement and was provided in anonymized form. After validation it comprises 38,972 timestamped records and 40 signals (temperature, pressure, flow and power quantities). The development and tuning of the methodology were carried out on a one-month subset of these data, whereas the measurements reported below were obtained on the full annual record.
5.1.0.1. Engineering context of the dataset.
The 40 signals span the principal subsystems of the unit, as delimited by their KKS function-key groups: the turbine–generator machine set, the feedwater and condensate system, the steam generator, the electrical subsystems. The measured quantities are the ones that govern the thermodynamic and electrical state of the plant – temperatures, pressures, flows and electrical readings – and together they fix the working point of the equipment. Across a full year the record passes through several operating regimes. Steady-load running and load changes alternate with extended near-zero intervals consistent with shutdown periods, and these intervals are plainly visible in the signals: the electrical output and the main flows drop close to zero over long contiguous stretches, the longest of them lasting on the order of weeks. The baseline against which deviations are judged therefore spans the normal operational variability of the plant, well beyond any single steady state. Because each signal is tied to identifiable equipment through its KKS code, a deviation can be traced back to a physical subsystem – the prerequisite for the diagnostic and prognostic reading that the domain expert gives to the resulting events.
The four axes of the taxonomy map onto manifestations recognizable to an engineer in the operational record. A drift may indicate equipment degradation or fouling, a slow migration of the operating point. A point anomaly may correspond to an abrupt instrumentation fault or a dropout in the measurement. A contextual anomaly is the subtle case: values that are each admissible on their own yet do not belong together, a flow that is inconsistent with the prevailing temperature and pressure. A deviation from the baseline is an excursion past the established operating envelope. The mapping is meant as an interpretive aid; it is not a diagnostic rule fixed in advance, and assigning an event to a physical cause stays with the domain expert.
5.2. Synthetic Validation (Controlled Fault Injection)
The synthetic check consists of a controlled injection of 70 deliberately constructed fault patterns across 11 categories over the reference test dataset. The categories cover typical pathologies of sensor data and their structural violations, namely non-conformity with the KKS convention, unit errors, violation of the column structure, disruption of temporal properties (duplicates and dropouts), exceedance of the physical range, exceedance of the maximum rate of change, frozen sensors, null values in mandatory fields and violations of the downstream contracts. For each injection it is evaluated whether the relevant contract layer (schematic, semantic, physical or temporal) catches the fault. Because the injections are constructed, a known ground truth is available for evaluating the recall. For the constructed injections, all violations were detected by the intended contract layer (Table 2). This result verifies the implemented contract checks on the selected fault patterns, and it does not measure the detection performance on naturally occurring faults.
5.3. Functional Verification over Real Data
The functional check verifies that the methodology runs end to end over the annual operational data, from Step 1 (validation) to Step 5 (report), and produces the typed point-level output fields (flag, confidence, intensity and provenance) together with the subsequent events and report. Of these, the three numeric fields per axis, together with the timestamp, constitute the 13 columns of the persisted detection output reported in Table 3; provenance is retained as a categorical label and is not counted among the numeric per-axis columns. The annual record of 38,972 samples was processed into 197 features and, on the chronological test split of 11,692 samples, the pipeline produced 23 events. The per-step latency and peak memory use are given in Table 3. The total latency is about 46 s, dominated by the data-preparation and detection steps, and the peak memory use of roughly 3.1 GB occurs in the detection step, which remains within the reach of a standard workstation. The run is deterministic by construction, through a fixed random seed and CPU execution, and the SHA-256 checksums of the per-step outputs are recorded in the reproducibility manifest. The measurement serves as evidence of a working whole and not as a benchmark, and the assessment of detection quality is deferred to that later study, which also addresses the loose flag density seen here.
5.4. Sensitivity to Configuration and a Pointwise Baseline
To characterize how the output of the methodology responds to its principal configuration parameters, a small sensitivity sweep was run over the same annual test split of 11,692 samples, with all other settings held fixed. Two parameters were varied independently: the detection calibration parameter c, which defines the upper-tail cutoff on the empirical training-score distribution (flagging samples whose normalized confidence exceeds the training quantile, with ) and the temporal grouping gap of the event-creation step ( s). For each configuration the any-flag density (the share of samples carrying at least one axis flag), the number of constructed events, the mean number of samples per event and the mean event duration were recorded (Table 4). Because no expert-annotated ground truth is available for this record, these figures characterize the behavior of the methodology under configuration and are not a measure of detection accuracy. The value of c therefore does not prescribe the fraction of flagged samples in the annual test split; the elevated test-set densities are interpreted as a shift of the annual test period relative to the training calibration distribution and motivate the subsequent grouping into typed events, rather than constituting a standalone detection-accuracy claim. The output is found to respond monotonically and interpretably to both parameters. A looser detection threshold raises the flag density (from about 85 % to about 92 %) yet yields fewer events, since a denser flagging fills the temporal gaps between flagged segments and thereby merges them into fewer but longer events; a larger grouping gap acts in the same direction by construction. The reference configuration of Section 5.3 (, s) is reproduced exactly, with 23 events. It falls in the interior of the tested grid, not at an endpoint of it, while the event count stays responsive to both parameters.
A minimal pointwise baseline was computed on the reference configuration to illustrate, qualitatively, what the typed composition and the event-creation step contribute to the structure of the output. Taken on its own, the Isolation Forest point-anomaly axis flags 3,942 of the 11,692 samples (); merging only its temporally adjacent flags, without typing or cross-signal correlation, yields 120 undifferentiated segments (mean length 33 samples). The full methodology, by contrast, composes the four scoring axes, the temporal grouping and the cross-signal correlation into 23 typed events (mean length 446 samples), each carrying a dominant and secondary axis, the affected signals with their correlations and an algorithmic priority. The two views differ in the structure of what is reported rather than in any measured accuracy: the baseline returns a flat list of point alarms, whereas the methodology returns a small set of characterized events. No claim of superior detection quality is made on this basis; the comparison is an ablation of output structure, and a quantitative evaluation of detection capability remains for the empirical study to come.
6. Discussion
6.1. Position Relative to Current Trends
A review of work from 2025 and 2026 reveals several trends against which EVENT can be delineated and which also expose its limits. The use of large language models in industrial diagnosis, represented by the LLM-TSFD framework [15], places a language model in the role of a central coordinator of data processing and decision-making. EVENT keeps the decision logic outside the model, which supports verifiability but at the same time does not make use of the reasoning that an integrated language model can provide, and in EVENT a language model is considered only for the generation of textual descriptions in Step 5. Explainable artificial intelligence, represented by the SHAP-based analysis of Prantikos et al. [32] for incipient anomalies in a molten-salt heat exchanger, adds interpretability on top of an otherwise opaque model, whereas EVENT addresses interpretability structurally, through a transparent five-step pipeline. This transparency, however, operates at the level of the pipeline, not of the individual detector, and a component such as the LSTM-Autoencoder remains internally opaque, so that the two approaches are complementary. The event-level evaluation of Zhevnenko [3] supports the shift from points to characterized events that EVENT adopts, with the difference that Zhevnenko evaluates models at the event level whereas EVENT uses the event as its output unit. The integration with digital twins [33] and the handling of signals with different sampling frequencies [34] are not addressed in the current implementation and would require separate methodological work. Relative to the systematizing PRISMA review [2], EVENT contributes an implemented workflow with formal data contracts.
6.2. Limitations
The most consequential limitation is the scope of the empirical validation. It has the character of a proof of concept and rests on a single dataset from a single thermal power plant. The synthetic check provides a quantitative measure against a controlled ground truth, but the injected faults cannot, by their nature, span the full range of real operational pathologies, and the functional check demonstrates end-to-end operability and not the statistical reliability of detection. A statistically meaningful evaluation of the detection capability would require a larger set of expert-annotated real events together with a cross-domain and long-term validation, which is left to future work and is not claimed here. In the same spirit, the intended accessibility of the workflow to an analyst without a narrow domain specialization is a design goal of the methodology, not an empirically demonstrated effect; confirming it would call for a dedicated user study, which is not attempted here. Several further limitations apply. EVENT is designed for the offline analysis of historical data and not for real-time monitoring, which is consistent with its purpose of supporting retrospective evaluation but excludes applications that require an immediate response to an emerging fault. It depends on a minimum quality of the input data, assuming at least 1000 samples, the presence of a timestamp and the numeric character of the signals, and it is not usable without modification on datasets that do not meet these assumptions. It does not provide universal parameters, since the detection thresholds, the time windows for event grouping and the imputation parameters are domain-dependent, so that the first analyses of a given plant typically call for iterative tuning and closer expert review, a property inherent to data-driven approaches. The final interpretation of the results still requires the expert, which is a deliberate design choice and not a defect, since the aim is to relieve the expert and not to replace them.
6.3. Applicability Beyond Thermal Power Plants
Although EVENT is presented here on thermal-plant data, its main principles are intended to be reusable in related settings. The separation of the analyst and expert roles is an organizational and methodological construct that is in principle transferable to other sectors that process operational data, and the algorithmic basis (Isolation Forest, Local Outlier Factor, One-Class SVM and an LSTM-Autoencoder in a typed composition) is likewise general. The domain-specific component is the automatic signal-type detection, where the KKS pattern matching reflects the power-plant standard, while simpler conventions such as the prefixes T-, P- and F- are common in the process industry. A transfer to the chemical and petrochemical industry, to water management or to discrete manufacturing would probably require changes mainly in the configuration layer, the signal taxonomy and the physical constraints and not in the pipeline core. This assumption, however, has not yet been empirically tested and remains a subject of the follow-up work.
7. Conclusions
This article has introduced EVENT, a semi-automated methodology for the offline analysis of thermal-plant operational data. The main contribution is an implemented workflow that connects data validation, preparation, anomaly detection, event creation and reporting through explicit data contracts, and that separates the procedural role of the analyst from the final interpretive role of the domain expert. The methodology uses characterized events, rather than isolated anomalous samples, as the reporting unit, in line with the recently formulated event-level perspective [3], and it accommodates different operational-data formats and signal-naming conventions, including the KKS standard. The validation reported here is of a proof-of-concept nature and demonstrates the functionality of these mechanisms on a real operational dataset and not the statistical reliability of detection, which, together with a cross-domain and long-term evaluation and an empirical comparison of the detector ensemble, is the subject of a planned empirical study. In its present form, EVENT is a step towards making reproducible operational-data analysis accessible to analysts without a narrow domain specialization.
Author Contributions
Conceptualization, M.J. and J.Š.; methodology and software, M.J.; validation, M.J.; writing—original draft preparation, M.J.; writing—review and editing, K.S., M.V. and J.Š.; supervision, J.Š. All authors have read and agreed to the published version of the manuscript.
Funding
This research received no external funding.
Institutional Review Board Statement
Not applicable.
Informed Consent Statement
Not applicable.
Data Availability Statement
The operational data used in this study were provided by an industrial partner and are not publicly available due to confidentiality restrictions.
Code Availability
The reference implementation of the methodology, the synthetic fault-injection scripts and the reproducibility manifest (the SHA-256 checksums of the per-step outputs) are available from the corresponding author on reasonable request. They are maintained separately from the operational dataset, which remains subject to the confidentiality restrictions stated above.
Acknowledgments
The authors thank the industrial partner for providing the operational data used in the validation of the methodology.
Use of Artificial Intelligence
In accordance with the recommendations of Brno University of Technology, the authors state that generative artificial intelligence was used in the preparation of this article within the Kerberos multi-agent orchestration system (designed and implemented by the first author), in particular the Claude model (Anthropic) and, additionally, the Gemini model (Google) and a locally run Llama 3.2 model (Ollama). The tools were used for language editing, consistency checking and preliminary literature-search support. They were not used to generate data, to perform analyses or to make methodological decisions. All AI-assisted text and all cited sources were checked by the authors against the original sources or indexing databases, and the authors take full responsibility for the manuscript.
Conflicts of Interest
The authors declare no conflict of interest.
References
- Khalid, S.; Song, J.; Raouf, I.; Kim, H.S. Advances in fault detection and diagnosis for thermal power plants: A review of intelligent techniques. Mathematics 2023, 11, 1767. [Google Scholar] [CrossRef]
- Zhao, S.; Yang, H.; Kareck, T.L.; Khan, F.; Wang, Q. Data-driven fault detection and diagnosis in industrial process systems: A systematic review and perspective. Reliab. Eng. Syst. Saf. 2026, 270, 112159. [Google Scholar] [CrossRef]
- Zhevnenko, D.; Makarov, I.; Kovalenko, A.; Meshchaninov, F.; Kozhukhov, A.; Travnikov, V.; Ippolitov, M.; Yashunin, K.; Katser, I. Benchmarking IoT Time-Series AD with Event-Level Augmentations. arXiv 2026, arXiv:2602.15457. [Google Scholar] [CrossRef]
- Chen, K.Y.; Chen, L.S.; Chen, M.C.; Lee, C.L. Using SVM based method for equipment fault detection in a thermal power plant. Comput. Ind. 2011, 62, 42–50. [Google Scholar] [CrossRef]
- Ajami, A.; Daneshvar, M. Data driven approach for fault detection and diagnosis of turbine in thermal power plant using Independent Component Analysis (ICA). Int. J. Electr. Power Energy Syst. 2012, 43, 728–735. [Google Scholar] [CrossRef]
- Mulongo, J.; Atemkeng, M.; Ansah-Narh, T.; Rockefeller, R.; Nguegnang, G.M.; Garuti, M.A. Anomaly detection in power generation plants using machine learning and neural networks. Appl. Artif. Intell. 2020, 34, 64–79. [Google Scholar] [CrossRef]
- Li, X.; Huang, T.; Cheng, K.; Qiu, Z.; Tan, S. Research on anomaly detection method of nuclear power plant operation state based on unsupervised deep generative model. Ann. Nucl. Energy 2022, 167, 108785. [Google Scholar] [CrossRef]
- Zhang, Y.; Dong, Z.Y.; Kong, W.; Meng, K. A composite anomaly detection system for data-driven power plant condition monitoring. IEEE Trans. Ind. Inform. 2019, 16, 4390–4402. [Google Scholar] [CrossRef]
- Vilas Boas, F.M.; Borges-da Silva, L.E.; Villa-Nova, H.F.; Bonaldi, E.L.; Oliveira, L.E.L.; Lambert-Torres, G.; Assuncao, F.d.O.; Costa, C.I.d.A.; Campos, M.M.; Sant’Ana, W.C.; et al. Condition Monitoring of Internal Combustion Engines in Thermal Power Plants Based on Control Charts and Adapted Nelson Rules. Energies 2021, 14, 4924. [Google Scholar] [CrossRef]
- Al Rashdan, A.Y.; Abdel-Khalik, H.S.; Giraud, K.M.; Cole, D.G.; Farber, J.A.; Clark, W.W.; Alemu, A.; Allen, M.C.; Spangler, R.M.; Varuttamaseni, A. A Qualitative Strategy for Fusion of Physics into Empirical Models for Process Anomaly Detection. Energies 2022, 15, 5640. [Google Scholar] [CrossRef]
- Lee, H.J.; Park, D.Y.; Ahn, B.S.; Park, Y.M.; Park, J.K.; Venkata, S.S. A fuzzy expert system for the integrated fault diagnosis. IEEE Trans. Power Deliv. 2000, 15, 833–838. [Google Scholar] [CrossRef]
- Nan, C.; Khan, F.; Iqbal, M.T. Real-time fault diagnosis using knowledge-based expert system. Process Saf. Environ. Prot. 2008, 86, 55–71. [Google Scholar] [CrossRef]
- Bikaun, T.; Hodkiewicz, M. Semi-automated estimation of reliability measures from maintenance work order records. PHM Soc. Eur. Conf. 2021, 6, 1–12. [Google Scholar] [CrossRef]
- Schwarzinger, T.; Steindl, G.; Frühwirth, T.; Diwold, K. Semi-Automated Event Specification for Knowledge-Based Event Detection. In Proceedings of the 2024 IEEE 29th International Conference on Emerging Technologies and Factory Automation (ETFA), 2024; pp. 1–8. [Google Scholar] [CrossRef]
- Zhang, Q.; Xu, C.; Li, J.; Sun, Y.; Bao, J.; Zhang, D. LLM-TSFD: An industrial time series human-in-the-loop fault diagnosis method based on a large language model. Expert Syst. With Appl. 2025, 264, 125861. [Google Scholar] [CrossRef]
- Stojic, A.; Kvascev, G.; Djurovic, Z. An Assistive System for Thermal Power Plant Management. Energies 2025, 18, 2977. [Google Scholar] [CrossRef]
- Cheng, Z.; Zou, C.; Dong, J. Outlier detection using isolation forest and local outlier factor. In Proceedings of the Proceedings of the Conference on Research in Adaptive and Convergent Systems, 2019; pp. 161–168. [Google Scholar] [CrossRef]
- Xu, H.; Pang, G.; Wang, Y.; Wang, Y. Deep isolation forest for anomaly detection. IEEE Trans. Knowl. Data Eng. 2023, 35, 12591–12604. [Google Scholar] [CrossRef]
- Luo, Y.; Szolovits, P.; Dighe, A.S.; Baron, J.M. 3D-MICE: integration of cross-sectional and longitudinal imputation for multi-analyte longitudinal clinical data. J. Am. Med. Inform. Assoc. 2018, 25, 645–653. [Google Scholar] [CrossRef] [PubMed]
- Wu, R.; Hamshaw, S.D.; Yang, L.; Kincaid, D.W.; Etheridge, R.; Ghasemkhani, A. Data imputation for multivariate time series sensor data with large gaps of missing data. IEEE Sens. J. 2022, 22, 10671–10683. [Google Scholar] [CrossRef]
- Schneider, T.; Helwig, N.; Schütze, A. Industrial condition monitoring with smart sensors using automated feature extraction and selection. Meas. Sci. Technol. 2018, 29, 094002. [Google Scholar] [CrossRef]
- Shah, D.; Wang, J.; He, Q.P. Feature engineering in big data analytics for IoT-enabled smart manufacturing — Comparison between deep learning and statistical learning. Comput. Chem. Eng. 2020, 141, 106970. [Google Scholar] [CrossRef]
- Liu, F.T.; Ting, K.M.; Zhou, Z.H. Isolation Forest. In Proceedings of the 2008 Eighth IEEE International Conference on Data Mining (ICDM), 2008; pp. 413–422. [Google Scholar] [CrossRef]
- Breunig, M.M.; Kriegel, H.P.; Ng, R.T.; Sander, J. LOF: Identifying Density-Based Local Outliers. In Proceedings of the Proceedings of the 2000 ACM SIGMOD International Conference on Management of Data, 2000; pp. 93–104. [Google Scholar] [CrossRef]
- Malhotra, P.; Ramakrishnan, A.; Anand, G.; Vig, L.; Agarwal, P.; Shroff, G. LSTM-based Encoder-Decoder for Multi-sensor Anomaly Detection. arXiv 2016, arXiv:1607.00148. [Google Scholar] [CrossRef]
- Schölkopf, B.; Platt, J.C.; Shawe-Taylor, J.; Smola, A.J.; Williamson, R.C. Estimating the Support of a High-Dimensional Distribution. Neural Comput. 2001, 13, 1443–1471. [Google Scholar] [CrossRef] [PubMed]
- McKinney, W. Data structures for statistical computing in Python. In Proceedings of the Proceedings of the 9th Python in Science Conference, 2010; pp. 56–61. [Google Scholar] [CrossRef]
- Harris, C.R.; Millman, K.J.; van der Walt, S.J.; Gommers, R.; Virtanen, P.; Cournapeau, D.; Wieser, E.; Taylor, J.; Berg, S.; Smith, N.J.; et al. Array programming with NumPy. Nature 2020, 585, 357–362. [Google Scholar] [CrossRef] [PubMed]
- Virtanen, P.; Gommers, R.; Oliphant, T.E.; Haberland, M.; Reddy, T.; Cournapeau, D.; Burovski, E.; Peterson, P.; Weckesser, W.; Bright, J.; et al. SciPy 1.0: fundamental algorithms for scientific computing in Python. Nat. Methods 2020, 17, 261–272. [Google Scholar] [CrossRef] [PubMed]
- Pedregosa, F.; Varoquaux, G.; Gramfort, A.; Michel, V.; Thirion, B.; Grisel, O.; Blondel, M.; Prettenhofer, P.; Weiss, R.; Dubourg, V.; et al. Scikit-learn: Machine learning in Python. J. Mach. Learn. Res. 2011, 12, 2825–2830. [Google Scholar]
- Paszke, A.; Gross, S.; Massa, F.; Lerer, A.; Bradbury, J.; Chanan, G.; Killeen, T.; Lin, Z.; Gimelshein, N.; Antiga, L.; et al. PyTorch: An Imperative Style, High-Performance Deep Learning Library. Proc. Adv. Neural Inf. Process. Syst. 2019, 32(NeurIPS 2019), 8024–8035. [Google Scholar] [CrossRef]
- Prantikos, K.; Lee, T.; Hua, T.Q.; Tsoukalas, L.H.; Heifetz, A. Explainable machine learning for incipient anomaly detection in compact molten salt heat exchanger with overlapping feature distributions. Sci. Rep. 2026, 16, 8293. [Google Scholar] [CrossRef] [PubMed]
- Alabbad, S.; Altınkaya, H. An Intelligent Predictive Maintenance Architecture for Substation Automation: Real-World Validation of a Digital Twin and AI Framework of the Badra Oil Field Project. Electronics 2026, 15, 416. [Google Scholar] [CrossRef]
- Xie, J.; Li, Y.; Yin, S.; Zhao, Y. A cross-frequency iterative learning-based imputation and prediction model for industrial data with missing values. Inf. Sci. 2026, 749, 123528. [Google Scholar] [CrossRef]
Figure 1.
Data flow in the EVENT methodology: five processing steps linked by four data contracts, from the input CSV to the auditable report for the expert.
Figure 1.
Data flow in the EVENT methodology: five processing steps linked by four data contracts, from the input CSV to the auditable report for the expert.
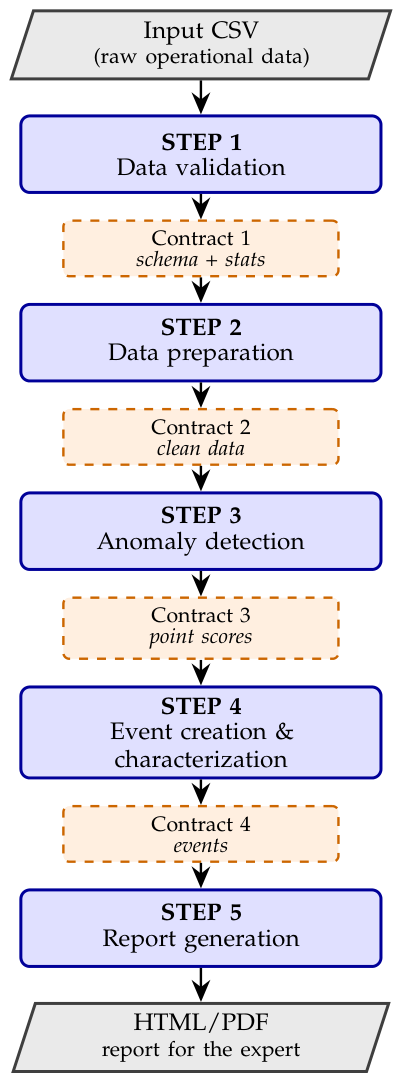
Figure 2.
Real example of a typed event (Step 4 output over the reference dataset). The event spans all four taxonomy axes; priority is a derived service value flagged for specialist assessment.
Figure 2.
Real example of a typed event (Step 4 output over the reference dataset). The event spans all four taxonomy axes; priority is a derived service value flagged for specialist assessment.
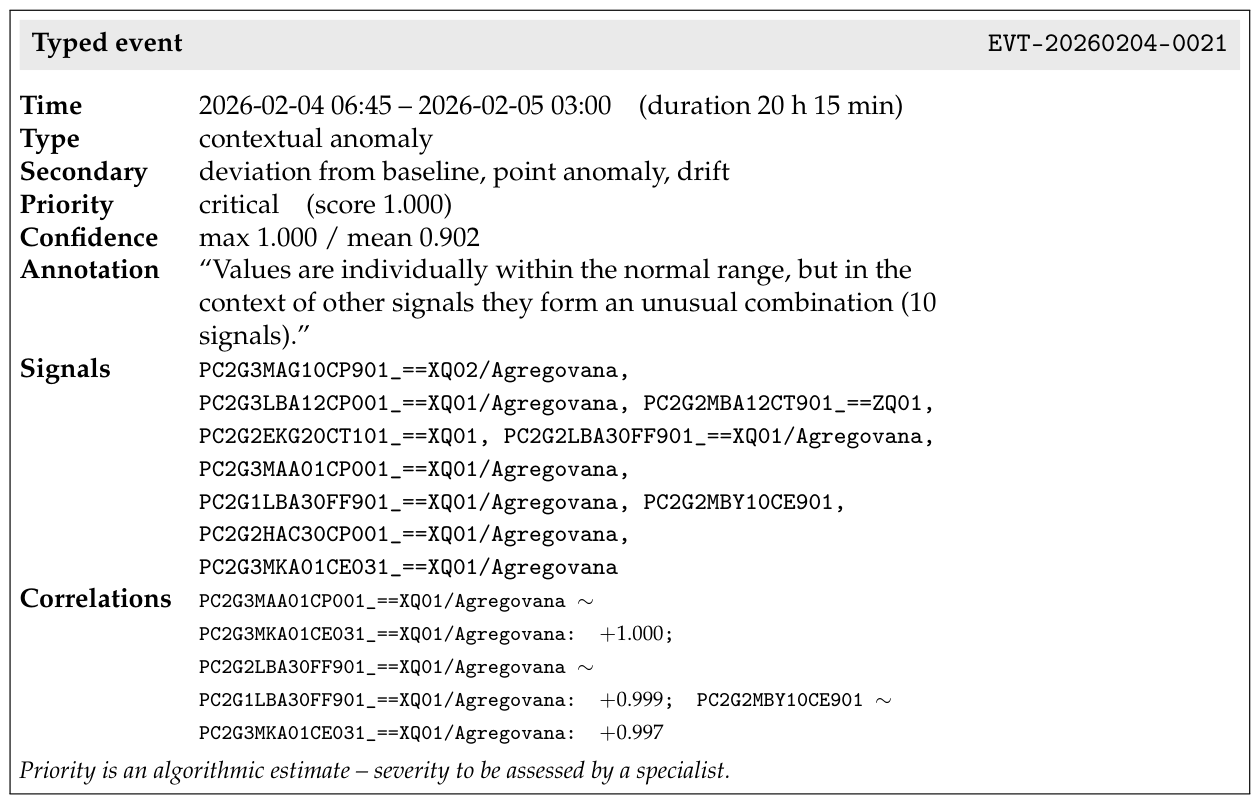

Table 1.
Position of the EVENT methodology relative to selected reference lines.
| Reference / line | Type of contribution | Granularity | Relation to EVENT |
|---|---|---|---|
| Khalid [1], Zhao [2] | FDD review and taxonomy | — | an implemented workflow rather than a survey |
| Chen, Ajami, Mulongo, Li | individual detection algorithms | point | controlled composition of algorithms into a pipeline |
| Cheng, Xu | isolation- and density-based point detectors | point | a methodological layer above the individual detectors |
| Vilas Boas [9] | statistical control charts (thermal plant) | point | modular pipeline and event characterization |
| Al Rashdan [10] | physics-informed model selection | — | a physical contract layer over a data-driven ensemble |
| Lee, Nan | knowledge-based expert systems | — | candidate generation instead of a priori rules |
| Schwarzinger [14] | semi-automated event specification | event | the analyst role formalized in the methodology |
| Stojic [16] | ANFIS operator assistance (thermal plant) | — | a more general workflow than narrow assistance |
| LLM-TSFD [15] | LLM as a hidden integrator under supervision | — | auditable intermediate outputs |
| Zhevnenko [3] | benchmarking of detectors | event (eval.) | the event as the organizing unit of the pipeline |
Table 2.
Data-contract detection per category of injected faults (70 injections across 11 categories over the reference dataset).
Table 2.
Data-contract detection per category of injected faults (70 injections across 11 categories over the reference dataset).
| Category | Instances | Caught | Missed | Catch rate |
|---|---|---|---|---|
| Physical range | 10 | 10 | 0 | 100 % |
| Rate of change | 8 | 8 | 0 | 100 % |
| Structure | 8 | 8 | 0 | 100 % |
| Temporal properties | 8 | 8 | 0 | 100 % |
| Downstream structure | 6 | 6 | 0 | 100 % |
| Frozen sensor | 6 | 6 | 0 | 100 % |
| KKS | 6 | 6 | 0 | 100 % |
| Missing values | 6 | 6 | 0 | 100 % |
| Downstream null | 4 | 4 | 0 | 100 % |
| Downstream temporal | 4 | 4 | 0 | 100 % |
| Units | 4 | 4 | 0 | 100 % |
| Total | 70 | 70 | 0 | 100 % |
Table 3.
Latency and peak memory use per pipeline step for the end-to-end run on the annual dataset (38,972 records, 40 signals; CPU, fixed seed). Per-step latencies are rounded to two decimals.
Table 3.
Latency and peak memory use per pipeline step for the end-to-end run on the annual dataset (38,972 records, 40 signals; CPU, fixed seed). Per-step latencies are rounded to two decimals.
| Step | Latency [s] | Peak memory [MB] | Output |
|---|---|---|---|
| Step 1: Validation | 0.68 | 249 | 38,972 × 41, contract: 0 violations |
| Step 2: Preparation | 21.60 | 580 | 197 features; split 27,280 / 11,692 |
| Step 3: Detection | 22.43 | 3147 | 11,692 × 13 (timestamp and four axes × three numeric fields) |
| Step 4: Events | 0.77 | 314 | 23 events |
| Step 5: Report | 0.80 | 239 | HTML/PDF |
| Total | 46.28 |
Table 4.
Sensitivity of the output to the detection threshold and to the event-grouping gap, over the annual test split (11,692 samples; all other settings fixed). Panel A varies the detection calibration parameter c (the upper-tail cutoff on the training-score distribution) at s; Panel B varies at . The shared row (, s) reproduces the reference run of Section 5.3. Figures characterize behavior under configuration, not detection accuracy.
Table 4.
Sensitivity of the output to the detection threshold and to the event-grouping gap, over the annual test split (11,692 samples; all other settings fixed). Panel A varies the detection calibration parameter c (the upper-tail cutoff on the training-score distribution) at s; Panel B varies at . The shared row (, s) reproduces the reference run of Section 5.3. Figures characterize behavior under configuration, not detection accuracy.
| Configuration | Any-flag | Events | Mean samples | Mean duration |
|---|---|---|---|---|
| density | per event | [days] | ||
| Panel A: detection threshold ( s) | ||||
| (training cutoff 0.98) | 85.1 % | 40 | 249 | 2.6 |
| (training cutoff 0.95) | 87.7 % | 23 | 446 | 4.6 |
| (training cutoff 0.90) | 92.2 % | 15 | 719 | 7.5 |
| Panel B: event-grouping gap () | ||||
| s | 87.7 % | 30 | 342 | 3.6 |
| s | 87.7 % | 23 | 446 | 4.6 |
| s | 87.7 % | 19 | 541 | 5.6 |
Disclaimer/Publisher’s Note: The statements, opinions and data contained in all publications are solely those of the individual author(s) and contributor(s) and not of MDPI and/or the editor(s). MDPI and/or the editor(s) disclaim responsibility for any injury to people or property resulting from any ideas, methods, instructions or products referred to in the content. |
© 2026 by the authors. Licensee MDPI, Basel, Switzerland. This article is an open access article distributed under the terms and conditions of the Creative Commons Attribution (CC BY) license (http://creativecommons.org/licenses/by/4.0/).
Copyright: This open access article is published under a Creative Commons CC BY 4.0 license, which permit the free download, distribution, and reuse, provided that the author and preprint are cited in any reuse.


