

Submitted:
29 June 2026
Posted:
30 June 2026
You are already at the latest version
Abstract
Although numerous biological phenomena have been elucidated at the molecular level, a unifying principle explaining fundamental phenomena such as why organisms grow to defined sizes, mature, and die after species-specific lifespanis still lacking. To resolve these mysteries, here we propose the Epigenetic Integration Clock (EIC), an hourglass model wherein environmental and physiological signals accumulate as molecular memory until threshold-dependent phase transitions occur. A central prediction is the Epigenetic Area-Constancy (EAC) rule: different combinations of signal intensity and duration trigger the transition once their integrated area reaches a fixed threshold. Molecularly, this threshold may be implemented by chromatin mechanisms—including histone modification[1], Polycomb-mediated memory[2,3], and liquid–liquid phase separation (LLPS)[4,5], which can convert gradual accumulation into switch-like commitment. Applying this framework to the mystery of animal size reveals muscle-derived systemic factors as the primary integration inputs dictating final body mass. This paradigm shift from spatial thresholds to temporal integration unifies plant vernalization[6], insect metamorphosis[7,8], vertebrate maturation[9,10], aging[11,12], cellular reprogramming[12,13], and allometric scaling laws[14] through a shared architecture. The EIC posits not a universal molecule, but a conserved logic—integration, area constancy, threshold detection, phase transition, and memory—through which living systems generate, limit, and reset their own time.
Keywords:
size determination
; myoglianin
; myostatin
; CPTN
; epigenetic integration clock
; epigenetic area-constancy rule
; allometry
Introduction
On Earth, a diversity of animals and plants thrives, manifested most visibly in the immense variation of their physical dimensions. Animal body masses span several orders of magnitude, ranging from microscopic insects weighing less than one milligram to colossal elephants and whales weighing multiple tons. Moreover, allometric scaling laws demonstrate a universal quarter-power relationship between vertebrate body mass and lifespan[14,15], strongly predicting the existence of a shared underlying mechanism across vertebrates. What specific mechanisms genetically dictate these defined bodily dimensions, however, remains a fundamental mystery.
To address this question, we have turned our attention to the hemimetabolous cricket, Gryllus bimaculatus (G. bimaculatus) (Box 1 Figure 1a). Historically, the elucidation of universal biological principles has repeatedly relied on the small fruit fly, Drosophila melanogaster (D. melanogaster), which served as the premier model for pioneering discoveries in genetics[16], the homeobox[17,18], and the circadian clock[19,20,21]. However, as a holometabolous (complete metamorphosis) insect, D. melanogaster undergoes a drastic morphological reorganization from larva to pupa and finally to adult, which somewhat obscures the continuous tracing of pure size regulation (Figure 1a). In contrast, the hemimetabolous cricket, whose nymphal stages (nymphs) share a highly conserved body plan with the adult, offers an ideal, unobstructed system for observing and quantifying temporal changes in macroscopic size (Figure 1a).
Box 1 Figure 1.
The Myoglianin Paradox and the conserved TGF-β–Juvenile Hormone endocrine axis. a, Comparison of developmental timelines between wild-type (WT) and myo KO crickets (G. bimaculatus). While WT individuals progress normally through nymphal instars to reach reproductive adulthood, myo KO individuals exhibit permanent developmental arrest as diminutive nymphs, failing to execute metamorphosis but displaying a profound extension of chronological lifespan (~2x lifespan). b, Anatomical evidence of localversus- systemic decoupling in myo KO crickets. Despite their systemic developmental stasis as miniature nymphs, their legs paradoxically display pronounced local muscle hypertrophy and distorted segmental proportions (tibia, Ti; tarsus, Ta; femur, Fe; indicated by pink arrows), unmasking the severe multi-layered paradox that shatters conventional spatial mass-sensing (For more detailed information, refer to Supplementary Note 3-6). c, Spatiotemporal endocrine dynamics across sequential nymphal instars. The fluctuating color intensities schematically illustrate the cyclic titers of major molting hormones, Juvenile Hormone (JH) and Ecdysteroids, during successive developmental stages. Superimposed on this background, muscle-derived Myo continuously accumulates over chronological time (represented by the orange wedge), eventually overlapping with a specific developmental window highly sensitive to JH status to license the final metamorphic transition (For more detailed information, refer to Supplementary Note 3-8).d, Schematic of the systemic and intracellular signaling cascade governing the insect metamorphic timer within the corpus allatum. Muscle- and glial cellsderived Myo acts as a long-range endocrine hormone; upon binding to its type I receptor Baboon (Babo), it activates the phosphorylated Smox pathway to robustly suppress the transcription of jhamt, thereby gating the clearance of JH required for pubertal transition. e, The classical vertebrate spatial paradigm of Myostatin (MSTN) signaling. Genetic mutation of mstn in mice[26] yields a striking hypermuscular (“double-muscled”) phenotype, establishing its traditional role as an instantaneous spatial mass chalone. f, Morphological architecture of normal, sexually mature adult male and female G. bimaculatus, a final developmental state completely inaccessible to myo KO individuals
Box 1 Figure 1.
The Myoglianin Paradox and the conserved TGF-β–Juvenile Hormone endocrine axis. a, Comparison of developmental timelines between wild-type (WT) and myo KO crickets (G. bimaculatus). While WT individuals progress normally through nymphal instars to reach reproductive adulthood, myo KO individuals exhibit permanent developmental arrest as diminutive nymphs, failing to execute metamorphosis but displaying a profound extension of chronological lifespan (~2x lifespan). b, Anatomical evidence of localversus- systemic decoupling in myo KO crickets. Despite their systemic developmental stasis as miniature nymphs, their legs paradoxically display pronounced local muscle hypertrophy and distorted segmental proportions (tibia, Ti; tarsus, Ta; femur, Fe; indicated by pink arrows), unmasking the severe multi-layered paradox that shatters conventional spatial mass-sensing (For more detailed information, refer to Supplementary Note 3-6). c, Spatiotemporal endocrine dynamics across sequential nymphal instars. The fluctuating color intensities schematically illustrate the cyclic titers of major molting hormones, Juvenile Hormone (JH) and Ecdysteroids, during successive developmental stages. Superimposed on this background, muscle-derived Myo continuously accumulates over chronological time (represented by the orange wedge), eventually overlapping with a specific developmental window highly sensitive to JH status to license the final metamorphic transition (For more detailed information, refer to Supplementary Note 3-8).d, Schematic of the systemic and intracellular signaling cascade governing the insect metamorphic timer within the corpus allatum. Muscle- and glial cellsderived Myo acts as a long-range endocrine hormone; upon binding to its type I receptor Baboon (Babo), it activates the phosphorylated Smox pathway to robustly suppress the transcription of jhamt, thereby gating the clearance of JH required for pubertal transition. e, The classical vertebrate spatial paradigm of Myostatin (MSTN) signaling. Genetic mutation of mstn in mice[26] yields a striking hypermuscular (“double-muscled”) phenotype, establishing its traditional role as an instantaneous spatial mass chalone. f, Morphological architecture of normal, sexually mature adult male and female G. bimaculatus, a final developmental state completely inaccessible to myo KO individuals
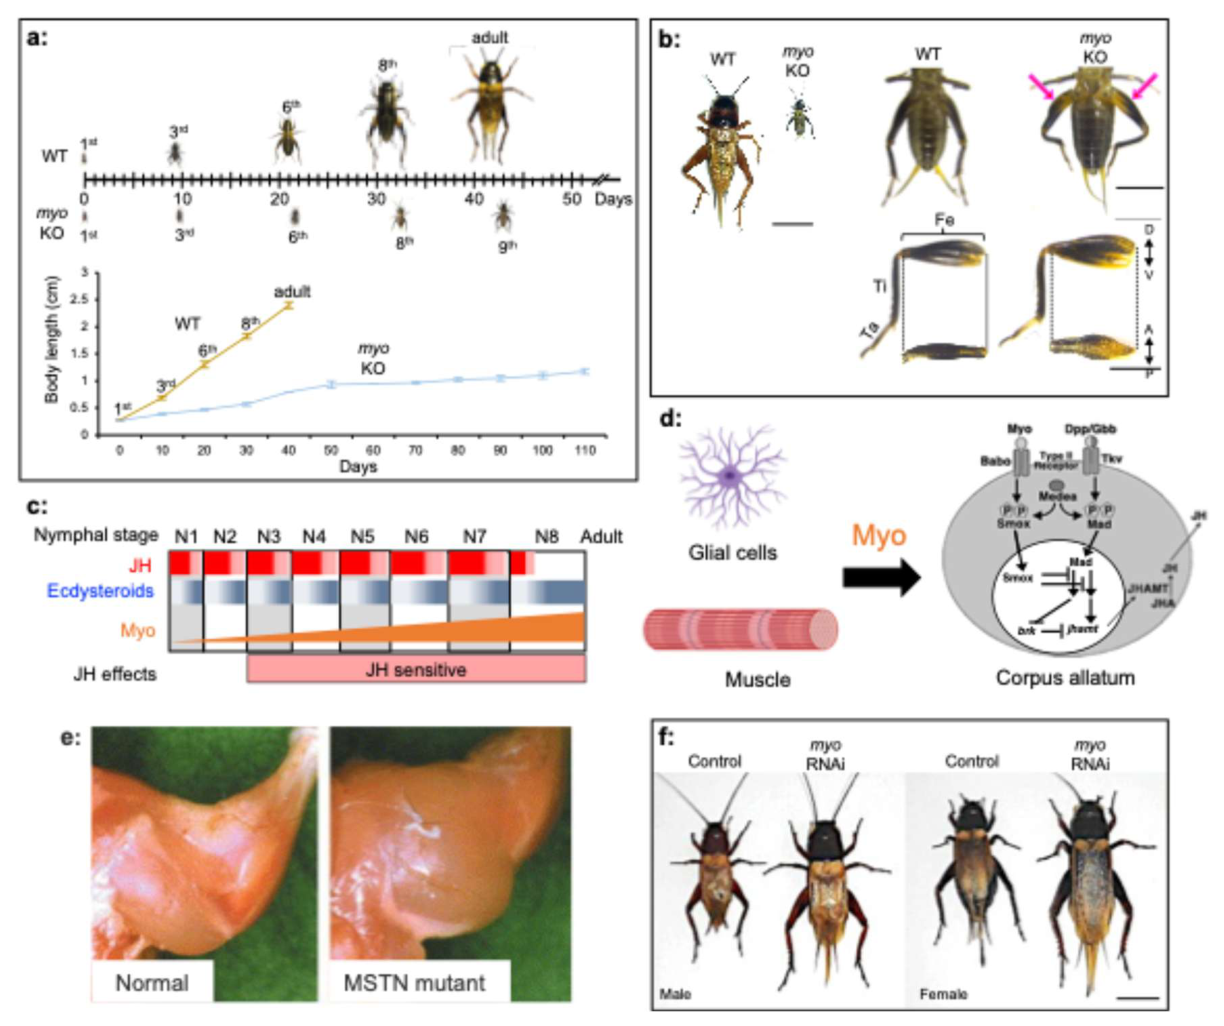
Figure 1.
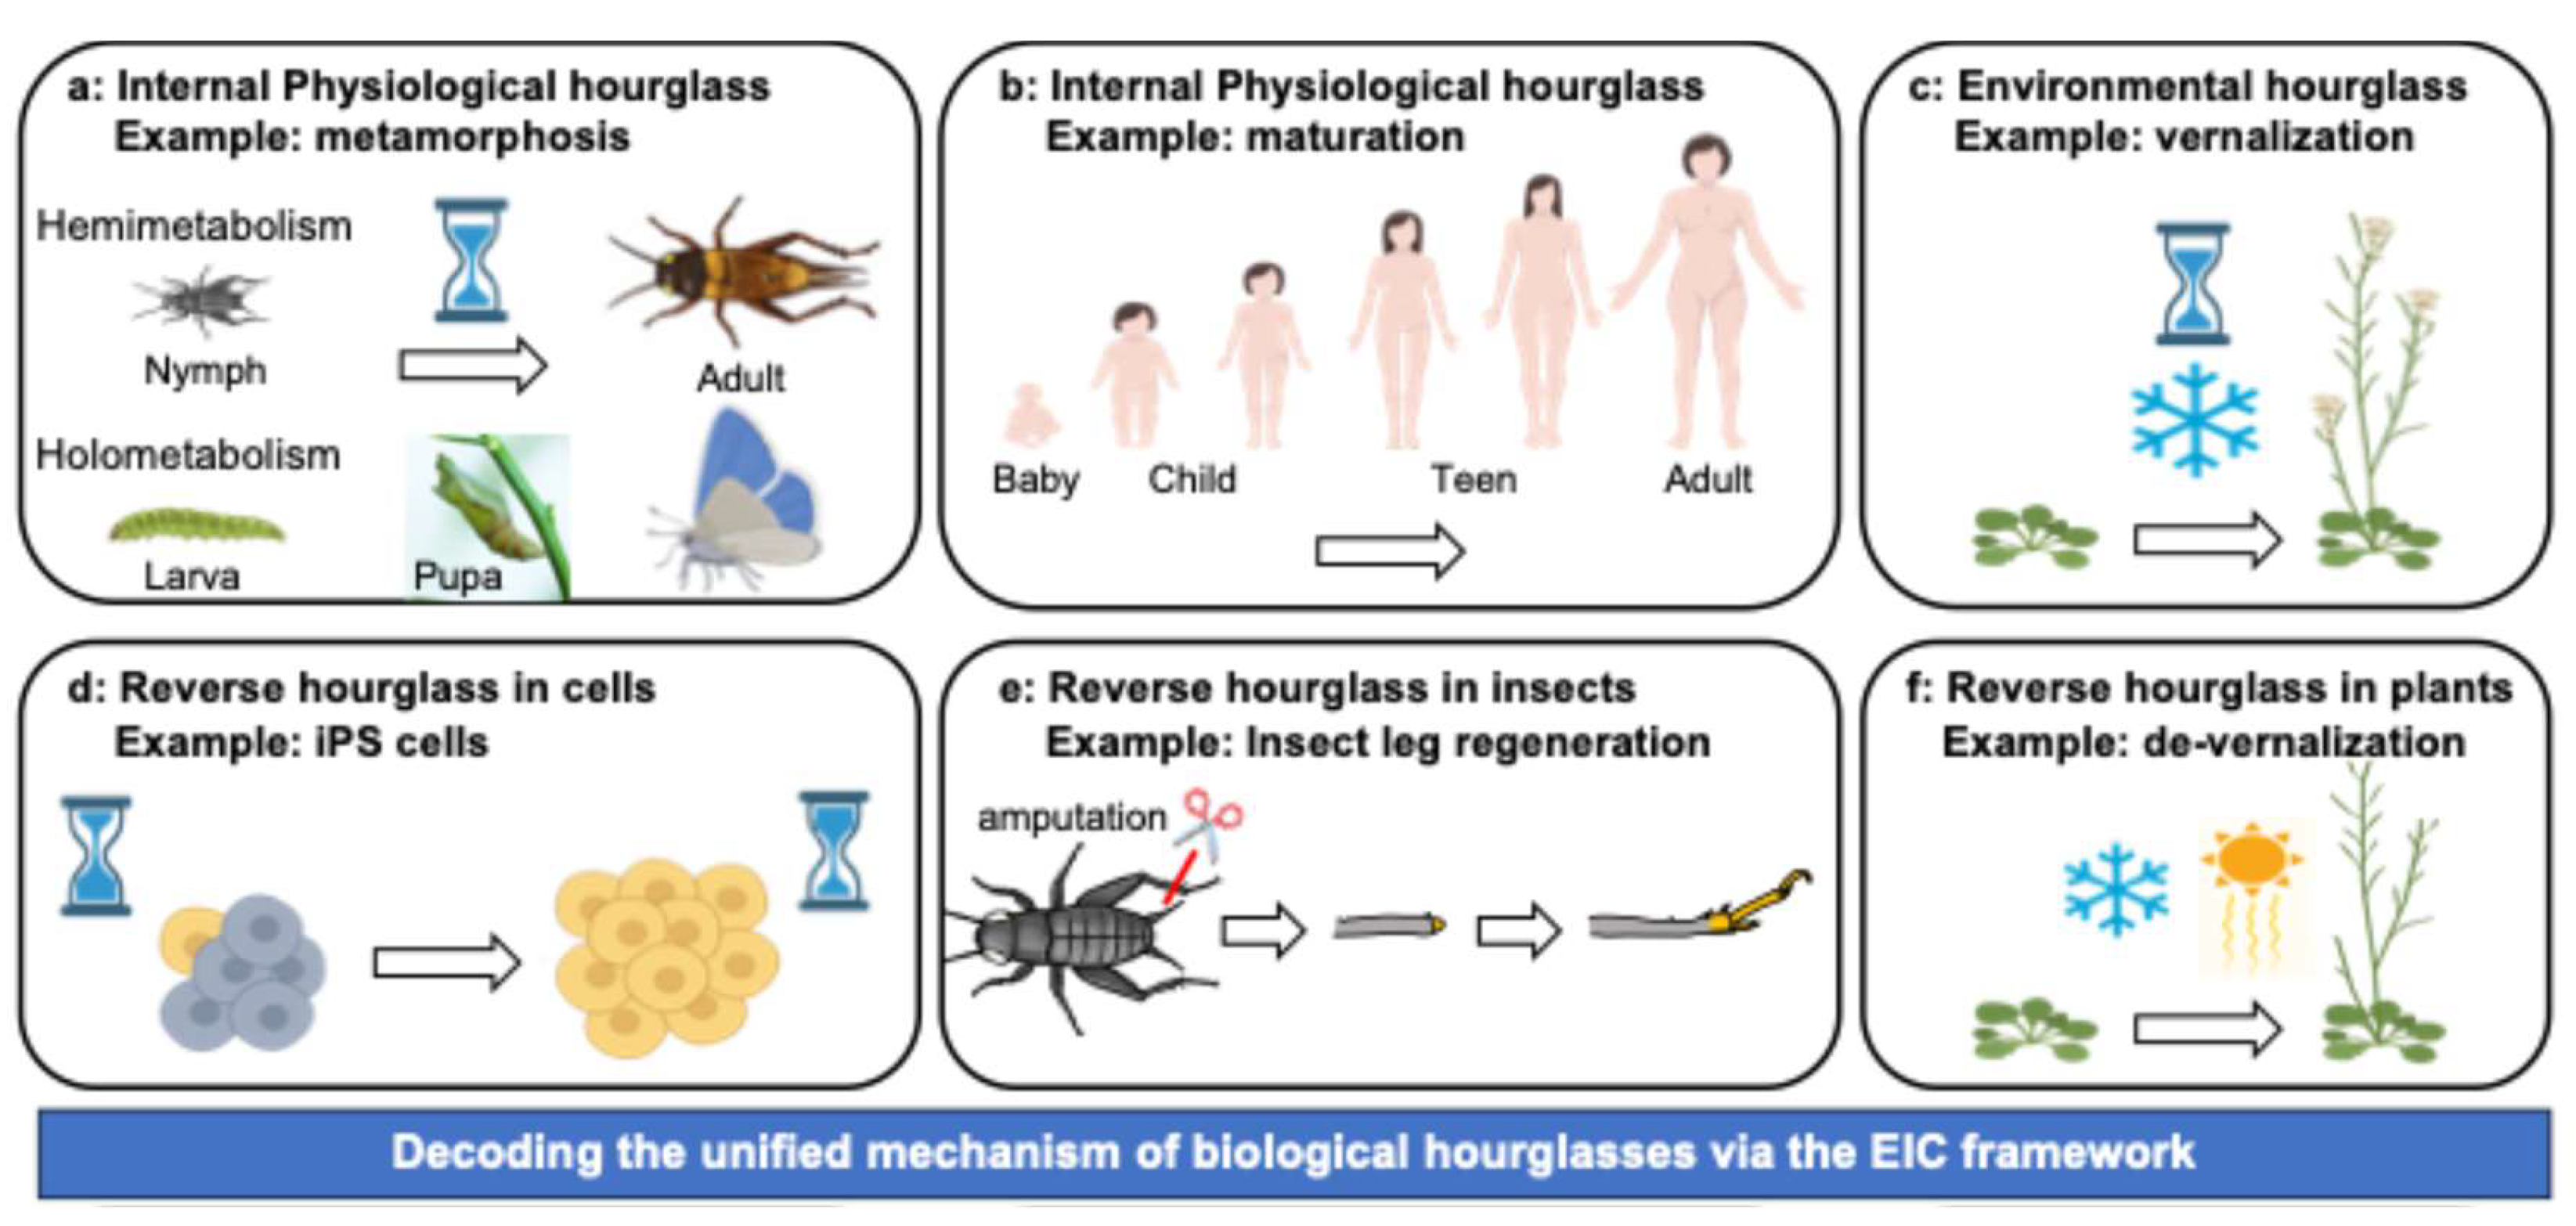
The hourglass architecture of biological time and the Epigenetic Integration Clock (EIC). a-f, The EIC provides a universal mathematical logic that unifies disparate biological phase transitions into distinct classes of biological hourglasses. a and b: Internal physiological hourglasses integrate endogenous systemic signals to dictate insect metamorphosis (a)[7] and vertebrate maturation (b)[9]. c: Environmental hourglasses integrate external cues, such as prolonged winter cold during plant vernalization[2]. Conversely, reverse hourglasses (d-f) demonstrate the symmetric plasticity of biological time, where the accumulated epigenetic “sand” can be artificially rewound to reset molecular spacetime, as seen in cellular reprogramming to pluripotency[76] (d), insect appendage regeneration[81] (For more detailed information, refer to Supplementary Note 3-7) (e), and plant de-vernalization (f)[13].
Figure 1.
The hourglass architecture of biological time and the Epigenetic Integration Clock (EIC). a-f, The EIC provides a universal mathematical logic that unifies disparate biological phase transitions into distinct classes of biological hourglasses. a and b: Internal physiological hourglasses integrate endogenous systemic signals to dictate insect metamorphosis (a)[7] and vertebrate maturation (b)[9]. c: Environmental hourglasses integrate external cues, such as prolonged winter cold during plant vernalization[2]. Conversely, reverse hourglasses (d-f) demonstrate the symmetric plasticity of biological time, where the accumulated epigenetic “sand” can be artificially rewound to reset molecular spacetime, as seen in cellular reprogramming to pluripotency[76] (d), insect appendage regeneration[81] (For more detailed information, refer to Supplementary Note 3-7) (e), and plant de-vernalization (f)[13].
Even within the insect world, body size varies from less than a milligram to dozens of grams, yet the underlying biophysical mechanism determining these limits has remained elusive. In insects, final size is ultimately determined by the precise timing of metamorphosis—the critical juncture marking the irreversible phase transition from the somatic growth phase to the reproductive phase (Box 1 Figure 1a).
In studying G. bimaculatus, we discovered that Myoglianin (Myo) acts as a central determinant of both body size and metamorphic timing[7,22,23] (Box 1 Figure 1a-d). Given that Myo is the direct insect ortholog of vertebrate Myostatin—a renowned spatial chalone that strictly restricts muscle growth[24] (Supplementary Note 1-1) and its loss to yield hypertrophic muscular vertebrates[25,26] (Box 1 Figure 1e), one would conventionally predict its loss to yield hypertrophic, overgrown giant crickets. Strikingly, however, contrary to these classic spatial expectations, the complete genetic ablation of myo does not produce overgrown giants[27] (Box 1 Figure 1a and b). Instead, although their cricket legs became hypertrophic (Box 1 Figure 1b), it leads to permanent developmental arrest as diminutive nymphs that fail to execute metamorphosis, while surviving approximately twice as long as their normal counterparts (Box 1 Figure 1a). This unexpected paradox became the intellectual origin of this Perspective.
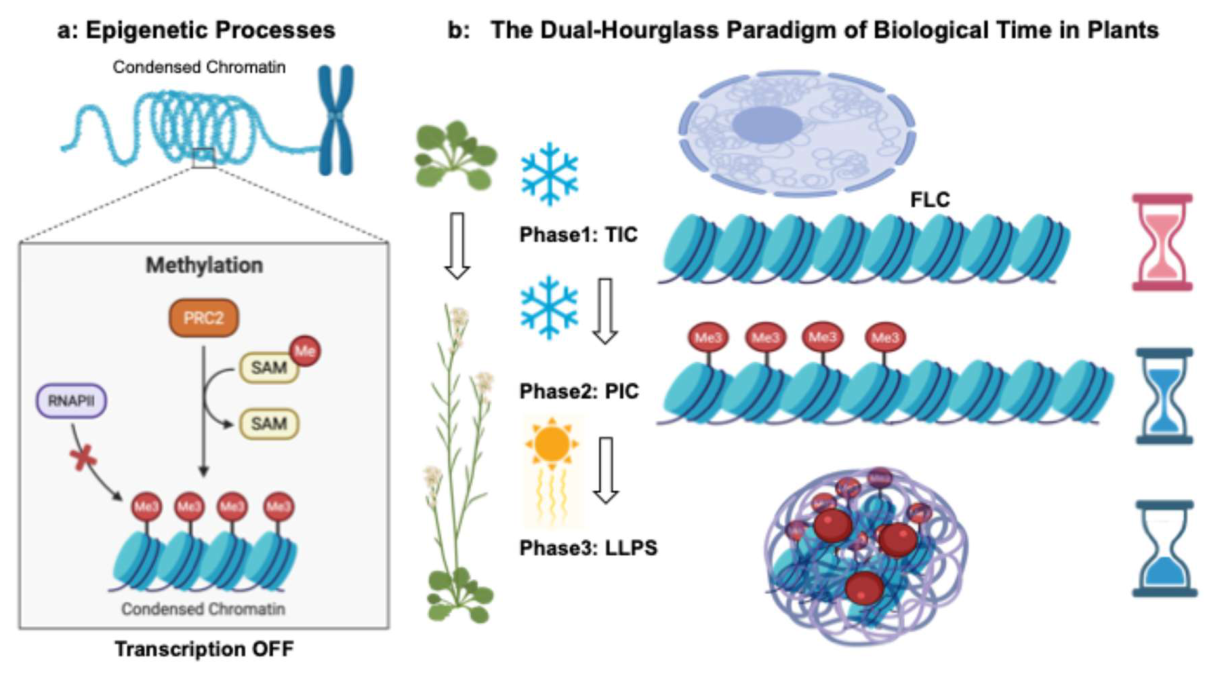
Seeking a mechanistic explanation for this paradox, we found a compelling parallel in the molecular logic of plant vernalization, where the timing of flowering is set by the progressive, time-dependent accumulation of repressive histone marks at the Flowering Locus C (FLC)—the most extensively studied biological hourglass[2,3,6,28] (Box 2 Figure 1a and b). This cross-kingdom analogy revealed a unifying principle: biological phase transitions are gated not by instantaneous spatial thresholds, but by the continuous temporal integration of signals toward a critical epigenetic commitment point. Once formalized, this framework proved capable of reinterpreting a remarkably broad range of previously disparate phenomena—from insect metamorphosis (Figure 1a), vertebrate puberty (Figure 1b), and plant vernalization (Figure 1c) to cellular reprogramming (Figure 1d), regeneration (Figure 1e), de-vernalization (Figure 1f)—unifying them within a single mathematical architecture, drawing on previously published data from G. bimaculatus genetics (Box1), plant vernalization (Box 2), vertebrate developmental genetics, and the Horvath epigenetic clock[11].
Box 2 Figure 1.
The dual-hourglass paradigm of biological time in plant vernalization. a, Core epigenetic processes. Prolonged cold exposure drives the directional deposition of H3K27me3 marks by PRC2, transitioning the FLC locus into condensed, transcriptionally inactive chromatin. b, The multi-phase integration architecture. Phase 1 (TIC) provides rapid, reversible RNA-mediated shielding. Phase 2 (PIC) serves as the core integrator, slowly accumulating H3K27me3 to record the true winter duration. Upon return to warmth, Phase 3 executes the final threshold-triggered commitment via liquid-liquid phase separation (LLPS), irreversibly locking the locus to license flowering.
Box 2 Figure 1.
The dual-hourglass paradigm of biological time in plant vernalization. a, Core epigenetic processes. Prolonged cold exposure drives the directional deposition of H3K27me3 marks by PRC2, transitioning the FLC locus into condensed, transcriptionally inactive chromatin. b, The multi-phase integration architecture. Phase 1 (TIC) provides rapid, reversible RNA-mediated shielding. Phase 2 (PIC) serves as the core integrator, slowly accumulating H3K27me3 to record the true winter duration. Upon return to warmth, Phase 3 executes the final threshold-triggered commitment via liquid-liquid phase separation (LLPS), irreversibly locking the locus to license flowering.
We therefore propose that developmental timing is not triggered by a spatial size threshold but is an emergent consequence of temporal integration toward a physical commitment threshold—a framework we conceptualize as the Epigenetic Integration Clock (EIC) (Figure 2). Deciphering the mechanisms underlying this clock offers more than just a theoretical shift; it provides a roadmap for the artificial manipulation of biological time. Controlling these mechanisms will lead to transformative advancements, ranging from the optimization of agricultural crop cycles to interventions in human growth and aging.
Generalizing the EIC: From Molecular Kinetics to Conserved Logic
The Master Equation of Hourglass Architecture (Figure 2a)
Building upon the molecular architecture reported in plant vernalization (Box 2 Figure 1a and b), we now abstract these empirical observations into a unified mathematical formalism to derive the universal principles governing hourglass architecture. This transition from a specific botanical phenomenon to a unifying theory necessitates a paradigm shift in developmental biology: macroscopic phase transitions are triggered not by instantaneous spatial size-sensing, but by the continuous temporal integration of inputs.
Figure 2.
Molecular architecture and mathematical formulation of the EIC and the Epigenetic Area-Constancy (EAC) rule. a, The mechanism of the EIC. Systemic or environmental signals (S(t)) are continuously integrated over chronological time as cumulative chromatin memory, mathematically formalized as A(t) = k. This analog timeline is bio-physically stored via the progressive deposition of specific histone modifications, such as Polycomb-mediated H3K27me3 marks on master target loci, operating analogously to the continuous accumulation of sand within an hourglass. b, Threshold detection executed by a macromolecular phase transition. When the historical integral reaches a critical physical capacity (A(t) = Θ), the local density of epigenetic marks may promote condensate-like chromatin organization, converting the gradual, analog accumulation into a digital, switch-like biological commitment. c, Geometric properties of the EAC rule. The total biophysical work required to breach the threshold (Θ) is conserved, establishing a strict hyperbolic trade-off between the signal intensity (proportional to final body weight, W) and the developmental duration (D). An accelerated growth velocity allows the system to reach the threshold rapidly at higher somatic mass (Area = 2WD), whereas a depressed growth rate under stress mathematically extends the required timeline to achieve the identical integrated area (Area = W2D), satisfying the universal invariant relation: Weight (W) x Duration (D) constant.
Figure 2.
Molecular architecture and mathematical formulation of the EIC and the Epigenetic Area-Constancy (EAC) rule. a, The mechanism of the EIC. Systemic or environmental signals (S(t)) are continuously integrated over chronological time as cumulative chromatin memory, mathematically formalized as A(t) = k. This analog timeline is bio-physically stored via the progressive deposition of specific histone modifications, such as Polycomb-mediated H3K27me3 marks on master target loci, operating analogously to the continuous accumulation of sand within an hourglass. b, Threshold detection executed by a macromolecular phase transition. When the historical integral reaches a critical physical capacity (A(t) = Θ), the local density of epigenetic marks may promote condensate-like chromatin organization, converting the gradual, analog accumulation into a digital, switch-like biological commitment. c, Geometric properties of the EAC rule. The total biophysical work required to breach the threshold (Θ) is conserved, establishing a strict hyperbolic trade-off between the signal intensity (proportional to final body weight, W) and the developmental duration (D). An accelerated growth velocity allows the system to reach the threshold rapidly at higher somatic mass (Area = 2WD), whereas a depressed growth rate under stress mathematically extends the required timeline to achieve the identical integrated area (Area = W2D), satisfying the universal invariant relation: Weight (W) x Duration (D) constant.
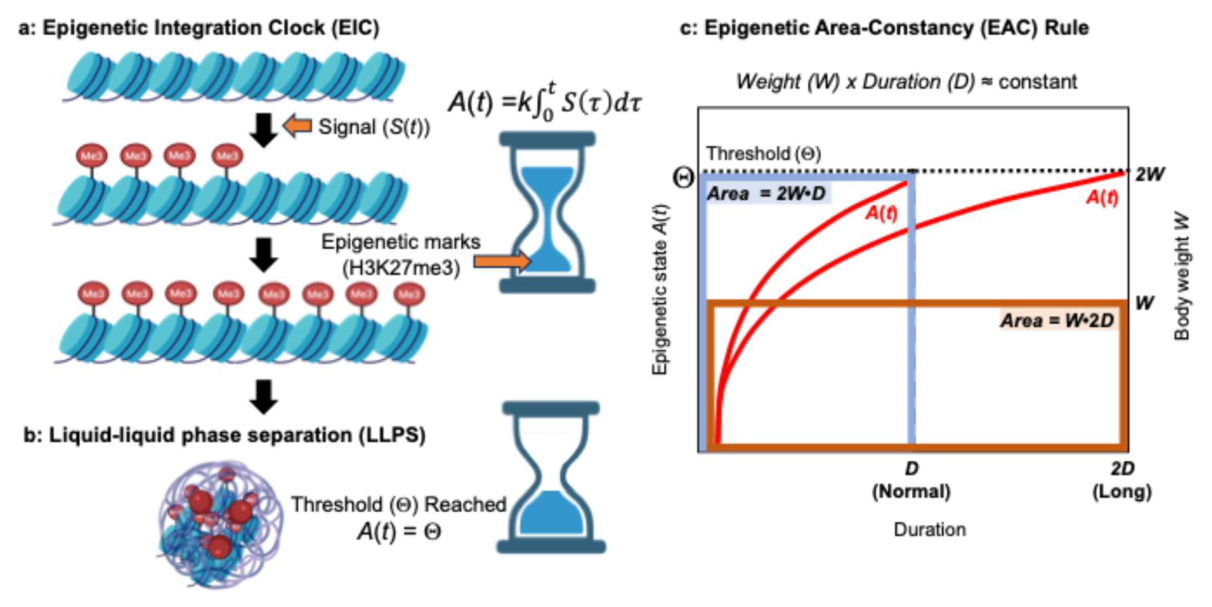
To formalize this mechanism across diverse living systems, we introduce the foundational framework of the EIC (Figure 2a). The EIC operates via an internal state variable, A(t), which continuously integrates the intensity of a driving physiological or environmental stimulus, S(t), over developmental time. Mathematically, this baseline integration process is defined as:
where k represents the sensitivity coefficient of the epigenetic integration rate (e.g., enzymatic efficiency or chromatin accessibility) (Figure 2a), and denotes the internal time variable. A developmental phase transition is licensed exclusively when this accumulated state reaches a critical readiness threshold (Θ), governed by physical phenomena such as LLPS (Figure 2b and Supplementary Note 1-2):
A(D) = Θ
Crucially, at the precise developmental duration (t = D) when the phase transition is executed, the accumulated internal state perfectly satisfies this threshold condition. By decomposing the driving signal S(t) into its biophysical components, we can derive universal macroscopic rules for life. In physical terms, the total “epigenetic work” performed across an organism depends not only on the intrinsic intensity of the cue (C), but also on the extent of the biological space (W) generating or receiving that signal.
To visualize this, consider heating a room: the total thermal energy required depends on both the heater’s output (C) and the volume of the room (W). Similarly, the effective systemic signal in biology can be formalized as S(t) ∝ C·W. In sessile plants, the target biological space (W)—such as the physical subnuclear arena or the cell count of the shoot apical meristem—is practically fixed during dormant periods, allowing the system to strictly integrate environmental exposure (C), such as winter cold. In mobile animals, this becomes a dynamic feedback system where growing muscle mass serves as the physical space (W). Muscle tissue, being the primary source of systemic myokines, dictates the total signaling power (C·W) released into the circulation (the simplified steady-state invariants derived from this linear relationship are detailed in Supplementary Note 1-3).
The Serially Coupled Circuit: Integrating Under Planetary Noise
To encompass the dynamic, fluctuating real-world environments that organisms navigate, and inspired by the molecular mechanism of vernalization in Arabidopsis thaliana (A. thaliana), the single integrator model must be extended to a system of serially coupled differential equations tracking two distinct temporal resolutions of the internal state: the Transient Integration Clock (TIC, ATIC) and the Persistent Integration Clock (PIC, APIC) (Box 2 Figure 1b):
where k represents the respective integration efficiencies, β denotes the molecular turnover or decay rates, and (ATIC) is a switch-like gating function that becomes active ( = 1) only when the rapid TIC reaches its fluid phase-separation threshold (ΘTIC). Furthermore, when organisms are exposed to fluctuating natural environments, the TIC/PIC architecture generates two additional emergent rules—a noise-filtering mechanism that prevents premature commitment during transient signals, and a memory grace-period that defines the maximum tolerable gap in sustained input—the mathematical derivations of which are detailed in Supplementary Note 1-4 – 1-6.
The Epigenetic Area-Constancy (EAC) Rule
Under a sustained, constant environmental cue where memory turnover is negligible (), the serially coupled TIC/PIC network (Eqs. 3, 4) mathematically converges into a fundamental thermodynamic invariant. For a sessile organism exposed to a steady environmental input (C), the generalized temporal integration reduces to a remarkably simple geometric principle—the EAC rule (Figure 2c):
C·D = Θ / k ≈ constant
This elegant master equation dictates that to execute an identical macroscopic phase transition, any reduction in external signal intensity (C) must be strictly and symmetrically compensated for by an expansion of temporal duration (D) to ensure the integrated history area remains constant (the complete, step-by-step mathematical derivations from the coupled differential equations to this spatial-temporal invariant are detailed in Supplementary Note 1-7).
The EAC rule provides a robust biophysical foundation for biological timekeeping, demonstrating seamless backward compatibility with classical, static empirical phenological laws—such as the legendary “400-degree rule in Tokyo” for Cherry Blossom blooming kinetics (wherein flowering is triggered when cumulative daily temperatures reach a fixed thermal threshold of 400-degree)[29] (Supplementary Note 2-1) or Wilbur-Collins life-history paradigm[30] (which models how organisms dynamically extend developmental duration under slow growth to balance size (W) and duration (D), W·D constant)—by reinterpreting them as macroscopic readouts of underlying chromatin integration history.
Empirical Validation and Plant Phenological Analysis
The predictive and explanatory power of this derived EAC rule (Eq. 5) extends across a striking breadth of plant biological phenomena, unifying previously isolated, system-specific empirical rules within a single physical framework. First, re-examining historical vernalization datasets from Duncan et al.[31] through the quantitative lens of the EIC reveals a virtually invariant product of C·D 1100 across tested winter temperatures (Supplementary Note 2-2). This mathematical consistency demonstrates that the extended vegetative duration observed under milder chilling conditions reflects a strict, biophysical area-compensation required to cross the epigenetic threshold (Θ), rather than biological inefficiency or stochastic delay.
Beyond vernalization, this identical integration-to-threshold logic predictively governs fruit maturation driven by source-to-sink metabolic flux. The traditional “1000-degree rule”[32] long utilized in commercial tomato cultivation emerges naturally as a macroscopic manifestation of the EAC rule, where the plant integrates localized carbohydrate signals over time until a metabolic tipping point is satisfied (Supplementary Note 2-3). Similarly, classical thermal and hydrotime models for seed germination—historically treated as useful empirical approximations in ecology[33]—are shown to be direct mathematical consequences of the EIC master equation under varying hydration profiles (Supplementary Note 2-4).
Finally, the hyperbolic nature of this integration threshold carries a sobering warning for a warming planet. As the winter cold signal (C) approaches zero, the required vernalization duration (D) increases non-linearly (D ∝ 1/C). The EAC rule thus predicts a catastrophic collapse in seasonal phase transitions that outpaces linear projections, necessitating climate-resilient crop management (Supplementary Note 2-5).
Taken together, the EIC framework and its derived the EAC rule provide, for the first time, a unified biophysical foundation that qualitatively explains a broad spectrum of empirical rules in plant biology—from vernalization kinetics and cherry blossom phenology to fruit maturation and seed germination—that had previously been treated as isolated, system-specific observations.
Universality of the EIC in Insects
Metamorphosis and the Resolution of the Myo Paradox
The evolutionary transition from sessile plants to mobile unitary animals does not alter the fundamental biophysical necessity of hourglass architecture: the discontinuous shift from growth to reproduction must be safely governed by history-integration rather than instantaneous cues. In insects, this macroscopic phase transition manifests as metamorphosis (Box 1).
For over a century, developmental biology has operated under the spatial “critical weight” paradigm, assuming that metamorphosis is triggered mechanically once an organism senses a specific physical mass[34,35,36,37] (Figure 3a). However, this spatial dogma fails to explain life-history plasticity; when reared under nutritional stress, organisms routinely transition into markedly smaller adults rather than delaying maturation indefinitely until the absolute mass threshold is met, as observed also in Drosophila[38,39] and the water strider Gerris buenoi[40].
Figure 3.
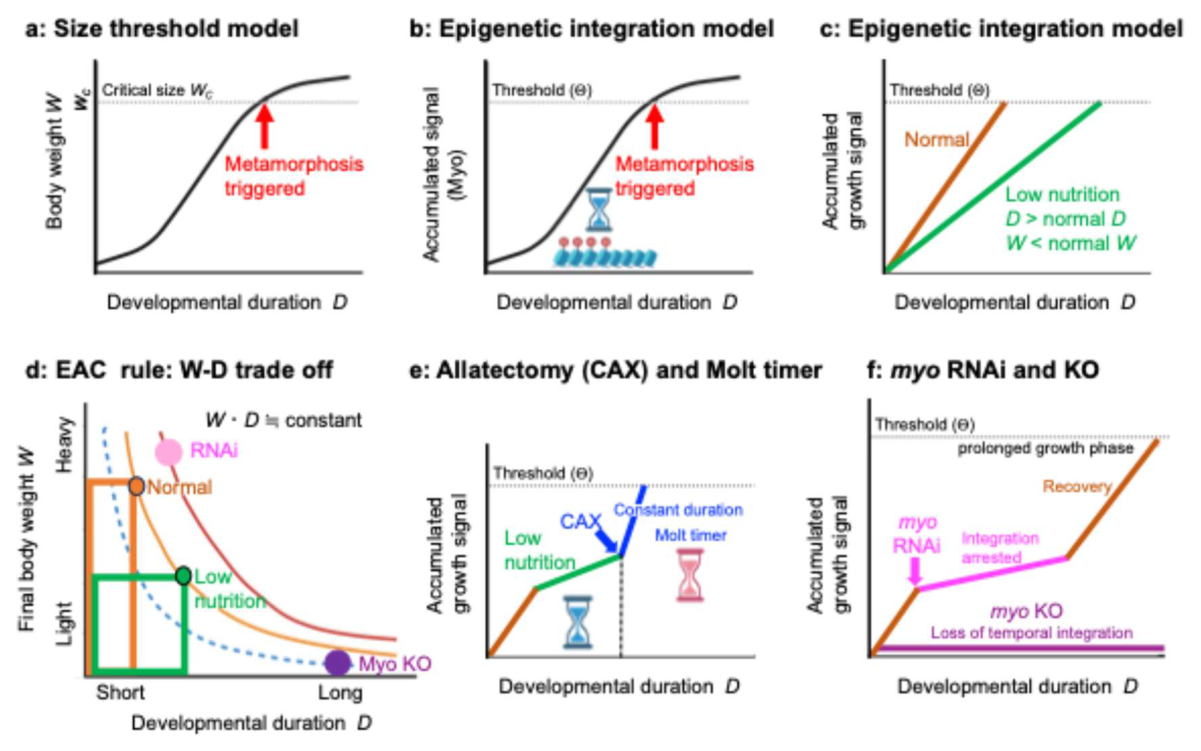
Distinct dynamical regimes of developmental progression decoded by the EIC framework. a, Classical size threshold model, where metamorphosis is triggered instantly upon the organism reaching a critical physical body weight (Wc). b, The EIC model, where systemic growth signals (e.g., Myoglianin; Myo) are continuously integrated over chronological time as chromatin memory until an absolute biophysical threshold (Θ) is breached. c, Simulation of nutritional stress within the EIC framework. Reduced nutrient availability decreases the integration velocity (slope), mathematically extending the developmental duration (D) while restricting the final attained body weight (W). Low nutrition moves the system along the original EAC curve producing longer duration and smaller final size. d, The EAC rule governing the geometric size-time trade-off. Low nutrition moves the system along the original EAC curve, producing longer duration and smaller final size. In contrast, myo RNAi reduces the effective Myo input, thereby expanding the apparent EAC area and shifting the trajectory to an outer hyperbola, producing both longer duration and larger final size, contrasting with the complete integration failure of myo KO. e, Mathematical replication of the classical “molt timer” via allatectomy (CAX)[41]. Surgical removal of the primary clock under specific nutritional windows unmasks an alternative backup mechanism; here, a flatlined internal state is rescued by a sharp, late-acting signal surge, ensuring a constant metamorphic duration despite early growth delays. f, Systemic integration dynamics under severe genetic ablation of the master growth signal. The myo RNAi architecture captures a prolonged, arrested integration phase followed by a rapid, recovery-driven surge that forcefully crosses the threshold, whereas the complete knockout (myo KO) results in a flatlined, permanent loss of temporal integration.
Figure 3.
Distinct dynamical regimes of developmental progression decoded by the EIC framework. a, Classical size threshold model, where metamorphosis is triggered instantly upon the organism reaching a critical physical body weight (Wc). b, The EIC model, where systemic growth signals (e.g., Myoglianin; Myo) are continuously integrated over chronological time as chromatin memory until an absolute biophysical threshold (Θ) is breached. c, Simulation of nutritional stress within the EIC framework. Reduced nutrient availability decreases the integration velocity (slope), mathematically extending the developmental duration (D) while restricting the final attained body weight (W). Low nutrition moves the system along the original EAC curve producing longer duration and smaller final size. d, The EAC rule governing the geometric size-time trade-off. Low nutrition moves the system along the original EAC curve, producing longer duration and smaller final size. In contrast, myo RNAi reduces the effective Myo input, thereby expanding the apparent EAC area and shifting the trajectory to an outer hyperbola, producing both longer duration and larger final size, contrasting with the complete integration failure of myo KO. e, Mathematical replication of the classical “molt timer” via allatectomy (CAX)[41]. Surgical removal of the primary clock under specific nutritional windows unmasks an alternative backup mechanism; here, a flatlined internal state is rescued by a sharp, late-acting signal surge, ensuring a constant metamorphic duration despite early growth delays. f, Systemic integration dynamics under severe genetic ablation of the master growth signal. The myo RNAi architecture captures a prolonged, arrested integration phase followed by a rapid, recovery-driven surge that forcefully crosses the threshold, whereas the complete knockout (myo KO) results in a flatlined, permanent loss of temporal integration.
The EIC framework seamlessly resolves this contradiction by defining the universal boundary condition of hourglass architecture through a generalized convolution integral (Figure 3b):
When environmental conditions are held perfectly constant (C(t) = C) and the insect grows at a stable, linear velocity (W(t) = R t), this generalized convolution integral (Eq. 6) yields an explicit analytical solution incorporating memory decay:
Under laboratory settings where memory turnover is negligible due to the absence of environmental fluctuations (), taking the mathematical limit of this solution via Taylor expansion collapses the historical integration directly into a simplified spatial boundary condition:
This convergence represents the “critical weight”—the classical biological checkpoint where an insect irreversibly commits to metamorphosis regardless of subsequent starvation.
Our EIC framework redefines this static spatial milestone not as the output of an instantaneous mass-sensor, but as the exact physical mass achieved when continuous temporal integration satisfies the epigenetic threshold (Θ). Consequently, the traditional critical weight is merely a constrained special solution that breaks down under natural planetary noise where growth velocity and temporal integration uncouple. The comprehensive mathematical configurations and parameter settings are detailed in Supplementary Note 1-8.
To fully bridge this temporal framework with classical entomological paradigms, we comprehensively re-interpret historical size-determination experiments, multi-layered endocrine networks, and the integration of nutrient-sensing pathways (IIS/TOR) across diverse insect taxa (Details are noted in Supplementary Note 3-1).
The EIC framework decodes these distinct dynamical regimes of developmental progression under environmental and genetic perturbations (Figure 3c–f). Specifically, while normal conditions exhibit linear progression, low nutrition reduces the integration velocity, mathematically extending the developmental duration (D) while restricting the final attained body weight (W) (Figure 3c). This geometric size-time trade-off is captured by the hyperbolic WD constant curve of the EAC rule, mapping both environmental stress such as low nutrition and internal changes due to RNAi onto predictable analytical trajectories (Figure 3d).
Furthermore, the framework accommodates alternative physiological strategies, such as the classical “molt timer” observed upon allatectomy (CAX)[41] (Figure 3e). This simulation strongly indicates that while the primary epigenetic clock resides within the corpora allata, its surgical removal under specific nutritional windows unmasks an alternative, backup developmental timer; here, a flatlined internal state is rescued by a sharp, late-acting signal surge, ensuring a constant metamorphic duration despite early growth delays. Finally, this exact same operational logic comprehensively encompasses severe genetic perturbations of the master growth signal itself (Figure 3f). This architecture captures the prolonged, arrested integration phase of myo RNAi followed by an explosive surge upon myo recovery[7], as well as the complete, flatlined loss of temporal integration in myo knockout (KO)[27] (Figure 3f)—a profound molecular paradox explored in detail in the following section.
These systematic case studies, expanded across hemimetabolous and holometabolous lineages in Supplementary Note 3-2 and 3-3, respectively, collectively reinforce that seemingly rigid spatial checkpoints are emergent macroscopic readouts generated exclusively when internal time-integration and physical growth rates happen to be synchronized.
The Myoglianin Paradox: Shattering the Spatial Dogma
To test the explanatory power of the EIC framework against traditional spatial models, we analyzed the phenotypic consequences of myo perturbation in G. bimaculatus (Box 1). The central paradox is the decoupling of local tissue growth from systemic developmental time. Complete myo KO crickets exhibit pronounced local muscle hypertrophy in their legs (Box 1 Figure 1b)[27], yet their whole-body developmental progression is permanently arrested (Figure 3f). These animals remain trapped in a nymphal state without executing metamorphosis, while surviving approximately twice as long as wild-type controls (Box 1 Figure 1a).
This coexistence of local overgrowth and systemic stasis is difficult to reconcile with a simple spatial size-threshold model. If physical size or muscle volume alone instructed maturity, hypertrophic tissues should have promoted, or at least permitted, metamorphic progression. Instead, loss of myo separates the organism’s spatial growth from its temporal developmental program. This contradiction becomes intelligible if Myo is not viewed solely as a growth inhibitor, but also as the systemic input that advances the metamorphic hourglass (Figure 3d and f). This interpretation naturally leads to a quantitative formulation within the EIC framework, in which developmental progression is governed by the temporal integration of systemic signals rather than by instantaneous body size.
Unified Mathematical Resolution via the EIC
In the EIC framework, Myo functions not only as a static spatial inhibitor, but also as a time-dependent systemic input. We define the effective metamorphic signal as
where (C(t)) represents circulating Myo activity and W(t) represents body or muscle mass. The accumulated internal state at developmental duration (D) is given by Eq. (6). Furthermore, under steady laboratory conditions, if (C(t)=C), (W(t)=R⋅t), and memory decay is negligible, this reduces to Eq. (8) or:
S(t) ∝ C(t)⋅W(t)
This equation clarifies why low nutrition and myo RNAi have opposite effects on final size. Under low nutrition, the growth rate (R ↓) decreases, but the Myo-dependent integration efficiency remains largely intact. Therefore, the apparent EAC area is approximately conserved, and longer duration (D ↑) is coupled to smaller final size (Wfinal ↓) (Figure 3c and d). In contrast, myo RNAi directly reduces the effective Myo input (lowering (C ↓)), thereby reducing the effective integration rate and expanding the apparent EAC area. Thus, myo RNAi is not simply a case of slow growth; it slows the metamorphic clock itself (Figure 3d and f).
During the early RNAi phase, circulating Myo is strongly reduced, so the trajectory of (A(t)) becomes nearly flat and the nymph remains in the growth phase. During this extended delay, chronological time and body mass continue to accumulate. Importantly, RNAi is transient rather than absolute. As the RNAi effect weakens, myo expression partially recovers. By that time, however, (W(t)) has already become enlarged. Because the total systemic input scales as (C(t) ⋅ W(t)), even partial recovery of myo is amplified by the enlarged muscle mass, causing a rapid late increase in (A(t)). The internal state then finally crosses (Θ), triggering metamorphosis and producing an oversized adult (Box1 Figure 1f).
Conversely, the permanent nymphal arrest of the myo KO is decoded by our analytical solution for leaky integration. In the complete absence of the ligand, the systemic stimulus is abolished, reducing the effective input kPICC(t) to nearly zero. Consequently, according to our master leaky equation, the maximum saturation capacity of the persistent clock becomes zero (Amax = 0) (Figure 3f). Because this flatlined internal capacity sits permanently below the required physical threshold (Amax < Θ), the insect’s internal clock is mathematically frozen in a perpetual sub-threshold state.
Crucially, transcriptomic validation confirms that this molecular standstill is driven by the sustained elevation of the histone methyltransferase NSD2 (Supplementary Note 3-4). By depositing active H3K36me2 marks that allosterically inhibit PRC2 activity, this persistent NSD2 upregulation physically locks the metamorphic clock at the juvenile hormone acid methyltransferase (jhamt) locus, providing transcriptomic support for a molecular blockade of EIC progression. The organism is locked in a temporal standstill, uncoupled from the continuous local spatial expansion of its muscle mass. Thus, myo RNAi delays the clock and expands the apparent EAC area, producing gigantism, whereas myo KO eliminates the clock input itself, producing permanent nymphal arrest.
Evolutionary and Ecological Implications
This theoretical resolution provides strong support for the existence of an insect epigenetic clock, demonstrating that the serially coupled equations originally mapped out in plant genomes predictively govern animal maturation boundaries. Furthermore, this overarching space-time trade-off predictively decodes macro-environmental plasticity across diverse taxa. Under nutritional stress (low growth velocity R), an organism must characteristically extend its duration D to satisfy the integration threshold Θ. Because the integral product is conserved, a lower R dictates that the attained final mass (Wfinal) must mathematically contract, providing the long-sought mechanistic basis for the classical Wilbur-Collins hypothesis[30,42] originally formulated in amphibians which share the conserved GDF8/11 integration system discussed in the next section.
Ultimately, this Myo-driven integration architecture may have been the foundational evolutionary prerequisite for the emergence of holometaboly. By intrinsically linking the temporal developmental countdown to the total accumulated muscle mass—the primary protein and amino acid reservoir required for pupal tissue reconstruction[43]—the organism physically ensures that the irreversible phase transition of pupation is licensed exclusively when sufficient material and energetic fuels have been integrated (Supplementary Note 3-5).
Evolutionary Liberation of Allometry: Subfunctionalization of GDF8 and GDF11
To scale this temporal integration framework from individual life histories to macro-evolutionary lineages, we focus on the radical expansion of body plans in vertebrates. In invertebrates, the single ancestral ligand Myo simultaneously governs both spatial growth brakes and temporal metamorphic countdowns, inherently constraining organismal plasticity. However, during the dawn of vertebrate evolution, whole-genome duplications triggered the subfunctionalization of this single ligand into two distinct paralogs: Myostatin (MSTN/GDF8) and GDF11 (Figure 4a), effectively decoupling space from time (Supplementary Note 4-1). This evolutionary decoupling of space and time liberated vertebrate allometry, allowing the generation of diverse body plans from mice to whales.
Figure 4.
The EIC governs vertebrate maturation, lifespan, and allometry. a, Evolutionary continuity of the master integrator. The ancestral dual-function TGF-β ligand Myoglianin underwent subfunctionalization into Myostatin (GDF8) and GDF11 (proposed temporal integrator), liberating spatial constraints from temporal progression. b, Tissue-specific modular signaling. Myostatin acts as a spatial chalone limiting muscle size, while systemically circulating GDF11 provides a continuous temporal baseline. c, Puberty and epiphyseal closure as an internal hourglass. The macroscopic phase transition of epiphyseal growth plate closure is strictly licensed only when the integrated hormonal history reaches a critical physical threshold (Θ). d, Lifespan hourglass and allometric scaling. The continuous temporal integration toward a terminal senescence threshold is constrained by mass-specific metabolic rates. Consequently, the required integration duration scales precisely with body mass, providing a possible molecular interpretation of quarter-power lifespan (Lifespan ∝ Weight1/4).
Figure 4.
The EIC governs vertebrate maturation, lifespan, and allometry. a, Evolutionary continuity of the master integrator. The ancestral dual-function TGF-β ligand Myoglianin underwent subfunctionalization into Myostatin (GDF8) and GDF11 (proposed temporal integrator), liberating spatial constraints from temporal progression. b, Tissue-specific modular signaling. Myostatin acts as a spatial chalone limiting muscle size, while systemically circulating GDF11 provides a continuous temporal baseline. c, Puberty and epiphyseal closure as an internal hourglass. The macroscopic phase transition of epiphyseal growth plate closure is strictly licensed only when the integrated hormonal history reaches a critical physical threshold (Θ). d, Lifespan hourglass and allometric scaling. The continuous temporal integration toward a terminal senescence threshold is constrained by mass-specific metabolic rates. Consequently, the required integration duration scales precisely with body mass, providing a possible molecular interpretation of quarter-power lifespan (Lifespan ∝ Weight1/4).
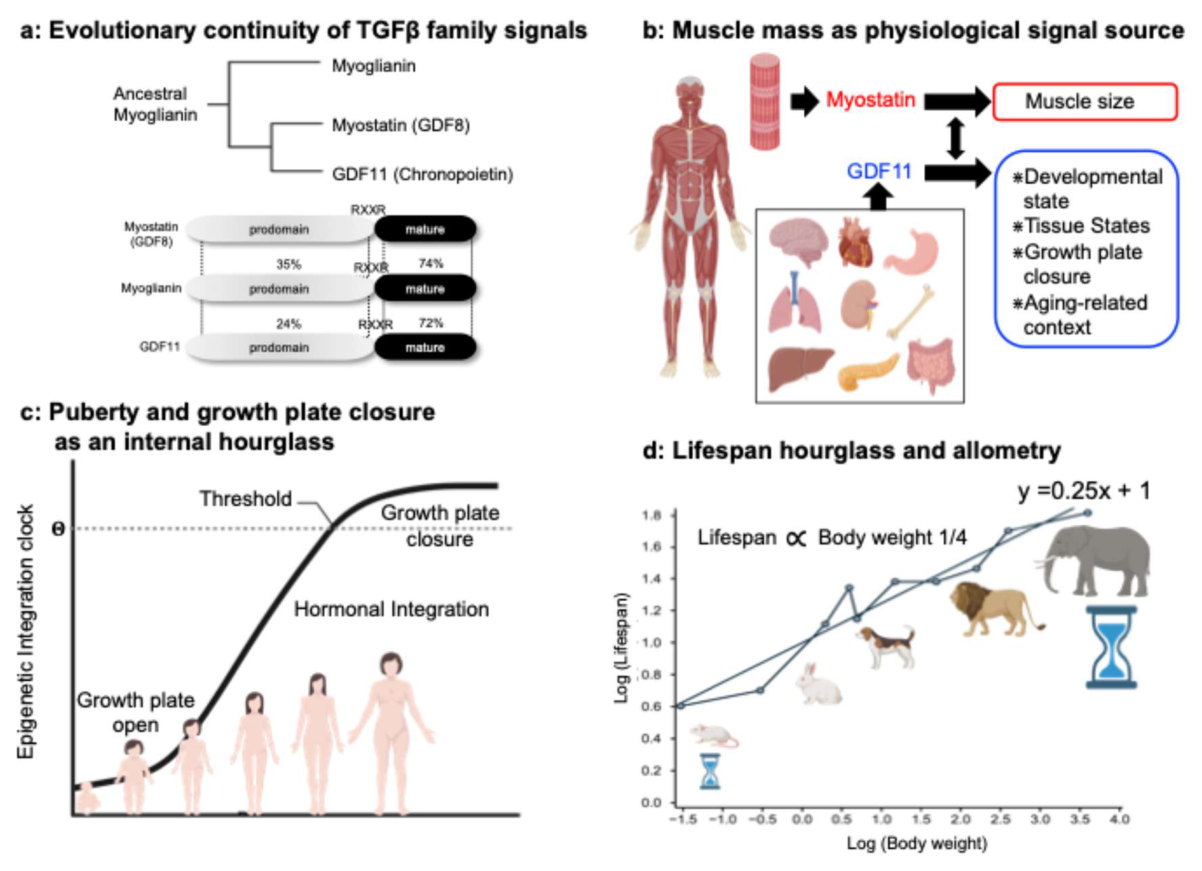
These two paralogs share a nearly identical signaling architecture, both acting through the Activin A Receptor Type 2B (ActRIIB) receptor to activate the Smad2/3 pathway[44,45]. While the precise in vivo dynamics of circulating GDF11—including its concentration changes during aging and the extent to which it is functionally distinct from GDF8 in adult tissues—remain actively debated[46], its well-established role in axial patterning via Hox gene regulation provides a basis for proposing a temporal integration function[47,48,49,50]. Within this EIC framework, we propose that GDF8 and GDF11 are functionally decoupled to manage distinct dimensions of hourglass architecture (Figure 4b).
The Spatial Chalone (Myostatin (MSTN/GDF8)) (Figure 4b): Primarily produced by muscle, GDF8 functions as a classical tissue-specific chalone (Supplementary Note 1-1)[24,51]. Within the EIC framework, it dictates the maximum allowable muscle volume (Wmuscle(t) ∝ 1 / MSTN). Notably, mstn KO mice exhibit normal skeletal lengths, proving that muscle mass alone does not mechanically dictate vertebrate chronological time.
The Temporal Baseline (GDF11) (Figure 4b): Operating through the same ActRIIB-Smad2/3 architecture, GDF11 provides the systemic temporal baseline signal that is less tightly coupled to instantaneous muscle volume than MSTN. Based on its newly conceptualized role as the candidate temporal baseline signal of the epigenetic hourglass, we here tentatively refer to GDF11 as “Chronopoietin (CPTN)” (the time-generator), standing as the proposed temporal counterpart to the spatial chalone MSTN. Its role in embryonic Hox axial patterning[52,53] highlights its origin as the core temporal segmentation clock. While its rejuvenation effects[54] in heterochronic parabiosis remain debated, its capacity to modulate tissue-specific timelines across the lifespan reinforces its status as a testable temporal integrator of hourglass architecture (Supplementary Note 4-2).
The vertebrate skeletal framework integrates decoupled spatial and temporal cues via an additive architecture driven by both GDF8 (MSTN) and GDF11 (CPTN). The epigenetic clock at the epiphyseal growth plate and other tissues can be mathematically formalized as:
whereW8(t) and W11(t) represent the respective tissue source masses (muscle and systemic baselines), C denotes signaling intensities, and k is the integration efficiency. The relations between this equation and mechanics of organ interlocking[55] (Hippo signaling) are noted in Supplementary Notes 5-1, 5-2, and 5-3.
Vertebrate Stature: Additive Integration and Growth Plate Closure
Within the EIC framework, the ultimate termination of linear skeletal growth via epiphyseal plate closure is reinterpreted not as an instantaneous spatial checkpoint, but as a multi-layered biochemical and biophysical integration cascade executed in three distinct phases.
Phase 1: The Tonic Integration Ledger and Endocrine Convergence
Initially, linear bone length is maintained by proliferating chondrocytes. Mechanistically, muscle-derived mechanical loading and mass-dependent myokines[56] synergize with somatic GDF11 (CPTN) as continuous baseline integration inputs (S(t)). Upon receptor binding, GDF11 triggers the steady phosphorylation and nuclear accumulation of Smad2/3 within these chondrocytes, establishing a localized, persistent molecular ledger that integrates chronological time by modulating downstream Retinoic Acid (RA) availability[57]. This signaling pathway establishes direct physical cross-talk with histone modification machinery, such as the recruitment of H3K27me3/H3K9me3 modifiers to target loci[58,59]. As the organism reaches sexual maturation, the central nervous system orchestrates the onset of puberty, broadcasting a systemic endocrine surge of Estrogen (E2) into the bloodstream[60]. In the nuclei of proliferating chondrocytes, this newly arrived systemic estrogen signal binds to Estrogen Receptor α (ERα), which physically converges and cross-talks with the localized RAR/RXR complex and the accumulated Smad2/3 ledger[61]. These pathways do not act in isolation; instead, they assemble into a highly coordinated macromolecular nuclear complex driven probably by ligand-dependent liquid-liquid phase separation (LLPS) directly on the promoters of master skeletal target loci[62] (the functional analog to insect juvenile hormone dynamics is noted in Supplementary Note 4-3 and 4-4.)
Phase 2: Threshold Breaching, Genic Inversion, and Biophysical Phase Transition
The growth potential of the epiphyseal plate relies on a strict transcriptional equilibrium between two opposing master regulators: Sox9, which preserves the cartilaginous matrix[63], and Runx2, which drives terminal hypertrophy[64] (Supplementary Note 5-3). As the continuous historical integral of the combined nuclear receptor and Smad signaling breaches the critical physical saturation threshold (Θplate), it triggers a rapid genic inversion—effectively flushing Sox9 out of its target promoters while simultaneously upregulating Runx2. This time-dependent transcriptional rewiring alters chromatin accessibility and dictates the sequential activation of posterior Hox genes (Hox10-13)[65,66] which are the definitive molecular stoppers that arrest longitudinal bone elongation. To render this digital commitment entirely irreversible, the system may execute a secondary, histone-density-triggered LLPS event at the Sox9 locus[4]. This localized biophysical phase transition drives a multi-valent “spreading” of H3K27me3 marks, condensing the entire Sox9 chromatin into a highly compacted, permanently locked, and transcriptionally inaccessible heterochromatin state[67]—a subnuclear architecture structurally isomorphic to the Polycomb-mediated FLC silencing observed during plant vernalization.
Phase 3: Histological Execution of Epiphyseal Fusion
Once Sox9 is silenced and Runx2 dominates, the growth plate executes its terminal program[68]. Deprived of Sox9, proliferating chondrocytes cease division and undergo hypertrophy, secreting Matrix metalloproteinases (MMPs) and vascular endothelial growth factor (VEGF) to calcify the matrix[69,70] before undergoing apoptosis[71]. This structural scaffold is immediately invaded by blood vessels and osteoblasts, replacing the cartilaginous matrix with lamellar bone[68]. This histological execution eliminates the growth plate and fixes adult stature.
Macroscopic Validations: Pubertal Plasticity and the Universal Lifespan Clock
The predictive capacity of this Human Stature Clock is supported by classic clinical anomalies and life-history trade-offs across vertebrates. In human development, the EAC rule is manifested during the pubertal growth spurt. Under conditions of restricted nutrition or lower growth velocities (R), the required integration duration (D) must be mathematically extended to satisfy the threshold (Θ). Because the total integral work is conserved (Wfinal⋅D ≈ constant), this prolonged duration paired with depressed velocity yields a characteristically smaller final adult stature (Wfinal), whereas optimal conditions accelerate threshold attainment to achieve a larger final mass, satisfying the classical Wilbur-Collins life-history paradigm[30,42] with mathematical precision.
When genetic or environmental perturbations uncouple these components, the EIC framework provides a parsimonious explanation for the resulting pathologies. For instance, severe estrogen receptor deficiency in humans[72] prevents the cumulative historical input from ever satisfying the required biophysical threshold (Θplate) (Supplementary Note 5-4). As our leaky model dictates (Amax < Θ), the internal clock flatlines, resulting in unbounded, continuous linear skeletal growth that persists into advanced chronological age. Conversely, Hutchinson-Gilford Progeria Syndrome (HGPS)[73] represents a premature biophysical collapse of the threshold barrier (Θ) itself, driven by progressive defects in nuclear architecture and epigenetic heterochromatin stability[74], leading to a drastically accelerated clash with terminal phase transitions (Supplementary Note 5-4). The deep conservation of this downstream logical architecture—from Insulin/TOR regulating growth velocity (R) to the TGF-β superfamily orchestrating temporal duration (D)—operates as a blueprint of metazoan life history (Supplementary Note 4-4).
Epigenetic Spacetime: Lifespan Allometry, Aging Ledgers, and Reversibility
The EIC’s kinematic countdown extends beyond reproductive maturation to dictate species-specific longevity. We propose that Steve Horvath’s celebrated epigenetic aging clock[11] is not an independent timer, but the downstream ledger recording this continuous integration, molecularly driven by the sequential transition from fluid Polycomb-mediated histone memory to permanent DNA-mediated silencing thresholds (Θaging).
At the macroscale, this framework resolves the enigmatic quarter-power scaling law between vertebrate body mass and lifespan (L ∝ M1/4))[75], demonstrating that the near-constancy of lifetime heartbeats across mammals is an emergent signature of mass-dependent hourglass architecture. The explicit molecular logic of this “Sand-to-Lock” senescence mechanism and the mathematical derivations of allometric invariants are detailed in Supplementary Note 6-1 and 6-2.
Crucially, unlike physical entropy, this hourglass architecture exhibits inherent mathematical reversibility. Resetting the epigenetic integral—whether through OSKM-mediated cellular reprogramming (Yamanaka factors)[76], chemical devernalization in plants, or localized tissue regeneration—corresponds to forcibly unwinding the internal state variable back to zero (A(t) = 0). This area-preserving epigenetic resetting allows the system to cleanly restart its biological clock.
This multi-source integration framework successfully decodes not only the progressive locking of cell fates but also its reversal. While pioneer factors like OSKM drive this rollback[76,77] (Supplementary Note 7-1), the system can also be reset by purely chemical means. As demonstrated in chemical reprogramming (CiPSC)[78,79], small-molecule cocktails that inhibit HDACs or TGF-β signaling effectively lower the biophysical and epigenetic threshold barriers (Θ), unlocking the compacted heterochromatin to permit a return to pluripotency[80].
In Arabidopsis, the small-molecule devernalizer DVR06 acts as a negative integration signal, erasing H3K27me3 marks to reactivate FLC and rewind the environmental hourglass[13]. Analogously, during cricket leg regeneration, localized epigenetic resetting re-establishes positional identity, whereas embryonic depletion of the Polycomb Repressive Complex 2 (PRC2) component Enhancer of Zeste (E(z)) stalls this clock to expand morphogenetic phases[81]. This cross-kingdom capacity to erase integrated history and reboot the cellular timeline provides the independent support of the EIC, establishing a conceptual framework for organismal rejuvenation strateges[12,82]. The comprehensive extension of this reversible temporal architecture to natural organismal aging, premature senescence syndromes, and the physical principles governing systemic rejuvenation is elaborated in Supplementary Note 7-2.
Conclusion
The EIC and the EAC rule provide a unifying mathematical framework for hourglass architecture. Rather than relying on chronological time or a single master molecule, living systems operate via an internal hourglass that integrates history to reach biophysical thresholds, triggering switch-like phase transitions. This conserved logic seamlessly links plant vernalization, insect metamorphosis, vertebrate allometry, lifespan, and cellular reprogramming. The explicit molecular parameters conserved neuroendocrine axes, and profound mathematical isomorphisms that substantiate this universal biological strategy across divergent kingdoms are comprehensively organized in Supplementary Note 4-4 (Supplementary Table 1) and 8. While molecular details across taxa remain to be fully mapped, the predictive power of the EIC guides future experimentation by explicitly defining parameters like the integration rate k and threshold Θ. Deciphering and manipulating this shared architecture could open future opportunities in growth control, regeneration, aging biology and climate-resilient agriculture.
📦 Box 1 The Metamorphic Cascade to Determine the Insect Size: Crosstalk Between the Epigenetic Clock and Endocrine Networks
To understand how unified mathematical rules govern mobile unitary organisms, insect metamorphosis provides an ideal macroscopic testing ground. The life history of insects is defined by a drastic, discontinuous phase transition from a vegetative, growth-oriented larval stage to a reproductive adult stage.
At the endocrine level, this irreversible commitment is universally gated by the precise molecular crosstalk between two master counteracting hormones: Juvenile Hormone (JH), which maintains the status quo of the juvenile state[83], and the molting hormone Ecdysone (specifically its active form, 20-hydroxyecdysone; 20E), which drives morphogenetic alterations[8].
In the hemimetabolous cricket G. bimaculatus, high JH titers are sustained during early juvenile instars by Dpp/Gbb signaling, which actively promotes the expression of jhamt—the key rate-limiting enzyme for JH biosynthesis within the corpora allata (CA) gland (Box 1 Figure 1d, right)[7]. This high systemic JH concentration induces the downstream zinc-finger transcription factor Krüppel-homolog 1 (Kr-h1). Kr-h1 acts as a powerful transcriptional repressor that directly blocks the expression of Ecdysone-induced protein 93 (E93), the universal adult-specifier gene, thereby preventing premature metamorphosis despite transient ecdysone fluctuations (Supplementary Figure 5).
The initiation of metamorphosis requires the systematic dismantling of this juvenile brake, a process operated by the PIC (Box 2 Figure 1b). The upstream inducer of this clock is Myo, a highly conserved TGF-β superfamily ligand primarily secreted by growing skeletal muscles and glial cells, serving as a circulating proxy for acquired total physical mass and growth history (Box 1 Figure 1d). Systemic Myo signals to the CA gland, where it counteracts Dpp/Gbb signaling and drives the progressive epigenetic silencing—hypothesized to be mediated by localized H3K27me3 accumulation—at the jhamt locus.[7]
Crucially, the resulting temporal decay of jhamt and the subsequent depletion of circulating JH remove the Kr-h1-mediated molecular block on the E93 promoter. This endocrine clearance officially licenses the downstream genomic arena to respond to the final, high-amplitude seasonal 20E pulses. In the absence of Kr-h1, the 20E signal synergistically and irreversibly upregulates E93 expression. Because E93 and Kr-h1 form a mutually inhibitory, bistable transcriptional switch, this genomic handover triggers a threshold-dependent, non-linear biophysical phase transition—potentially stabilized by subnuclear macromolecular condensates—that permanently locks the insect into its adult fate.
📦 Box 2 Vernalization as the Dual-Hourglass Paradigm of Biological Time
Much like Drosophila melanogaster serves as the foundational model for animal genetics due to its rapid life cycle, A. thaliana is the premier model for plant biology. Under standard laboratory conditions, rapid-cycling accessions (e.g., Col-0) typically flower within 3–4 weeks after germination. In contrast, winter-annual accessions require a prolonged period of winter cold—vernalization—to initiate flowering.
The molecular mechanism of seasonal vernalization in A. thaliana provides an elegant, extensively elucidated prototype for biological timekeeping. In winter-annual accessions, the transition to flowering is initially blocked by a master repressor gene, FLC[84]. During winter, prolonged cold acts as a continuous environmental stimulus integrated by the cellular machinery. Rather than relying on a single, static molecular step, the underlying epigenetic clock operates through a hierarchical, multi-phase mechanism in which LLPS is sequentially deployed across two distinct temporal scales to balance acute environmental responsiveness with long-term memory.
While the proposed involvement of LLPS in FLC silencing is an intriguing hypothesis, direct experimental evidence remains limited. In contrast to the well-established HP1-mediated condensates associated with H3K9-methylated heterochromatin in animals[4,85], clear liquid-like condensates associated with H3K27me3 domains have not yet been convincingly demonstrated in plants. Likewise, for the major Polycomb components LIKE HETEROCHROMATIN PROTEIN1 (LHP1) and CURLY LEAF (CLF), current evidence does not provide definitive support for canonical LLPS behavior, and localization studies have not clearly revealed dynamic droplet-like condensates analogous to those observed in animal systems[86,87] .
Nevertheless, several observations at the FLC locus are broadly consistent with condensate-based regulatory mechanisms. These include FLOWERING CONTROL LOCUS A (FCA)– FLC EXPRESSOR-LIKE 2 (FLL2) condensates involved in RNA 3′-end processing and FLC repression[88], FCA-associated m6A writer complexes containing Methyltransferase A (MTA) and B (MTB) that couple RNA processing to chromatin regulation[89], R-loop–dependent chromatin organization linked to Polycomb recruitment[90], and hnRNP R-LIKE PROTEIN (HRLP) assemblies associated with nascent FLC transcripts[91]. Collectively, these studies suggest that dynamic RNA–protein assemblies may form around the FLC locus and its transcripts and contribute to chromatin regulation and epigenetic silencing. At present, RNA-associated condensates and transcript-linked assemblies provide more direct experimental support for condensate-mediated regulation at the FLC locus than models invoking H3K27me3- or Polycomb-driven LLPS itself. Further evidence demonstrating liquid-like behavior and functional relevance of Polycomb-associated condensates at FLC would therefore be required to establish such a mechanism conclusively.
To derive the universal logic of this biological hourglass, the vernalization process is structured into three distinct phases.
Phase 1: Reversible Shielding via the TIC
Flowering is initially blocked by a repressor gene, FLC[84]. During winter, prolonged cold acts as a continuous signal (S(t)). This duration is quantitatively measured by upstream cold-sensors, such as the NAC with transmembrane motif1-like 8 (NTL8) protein[92] (Supplementary Note 2-6), which acts as a modular temperature signal by assessing winter length through growth-dependent cellular dilution, acting in concert with C-repeat-Binding Factor (CBF) transcription factors.
Upon the initial onset of winter cold, the system triggers the TIC. Long non-coding antisense transcripts (COOLAIR) are rapidly induced from the FLC locus via cold-responsive transcription factors[93]. COOLAIR-associated RNA-binding complexes may form dynamic condensate-like assemblies. such as the FCA-FLL2 assembly, into functional nuclear condensates. These fast-acting, transcriptionally driven fluid droplets effectively isolate the FLC locus and clear active chromatin marks. Critically, this initial RNA-mediated phase transition is rapidly reversible and dissolves within hours upon a return to warm temperatures. The TIC thus functions as a highly sensitive biological low-pass filter, shielding the locus without creating a permanent record during transient, deceptive cold spells.
Phase 2: Cumulative Record via the PIC
As the winter cold persists and proves to be sustained, the permissive chromatin environment established by the TIC licenses the activation of the downstream PIC. In this secondary phase, cold-induced accessory factors like Vernalization-insensitive 3 (VIN3) successfully recruit the PRC2 to the FLC locus. Operating as the core molecular integrator of the system, PRC2 continuously and progressively deposits repressive H3K27me3 marks. Crucially, during this cold-integration phase, this histone methylation is concentrated initially at a localized “nucleation region” near the 5’ end of the transcript[2], serving as a reliable molecular hourglass where the slowly increasing localized density of H3K27me3 reliably captures a stable, cumulative ledger of true winter duration[28,94].
Phase 3: Irreversible Commitment and the Spreading Tipping Point
The culmination of this serial integration is a final, threshold-triggered biophysical phase transition executed upon a return to warm spring temperatures.
Once the slow-ticking PIC drives the local density of H3K27me3 past a critical physical saturation threshold (Θ) within the nucleation region during winter[3], multivalent chromatin-binding proteins, including Like Heterochromatin Protein 1 (LHP1), are robustly recruited to the locus. This threshold crossing precipitates a secondary, high-density LLPS event[95], driving an irreversible “spreading” of H3K27me3 marks across the entire FLC locus[96]. This localized phase transition condenses the entire FLC chromatin into a highly compacted, permanently locked, and transcriptionally inaccessible heterochromatin state, definitively silencing the repressor and licensing the systemic release of florigen to execute flowering.
Reflecting the ‘persistent’ rather than strictly immutable nature of this timeline prior to final chromatin compaction, this architecture retains an explicit window of reversibility. Small molecule devernalizers such as DVR06 act by interfering with the maintenance of the vernalized state[13], probably affecting somehow the biological hourglass.
Supplementary Materials
The following supporting information can be downloaded at the website of this paper posted on Preprints.org.
Author Contributions
Y.I., T.M., S.I., K.K., T.B., O.H., K.T. and T.W. performed the previously published experiments on Gryllus bimaculatus and discussed the experimental data. S.N. and Y.I. conceived the theoretical framework and developed the mathematical model. A.T. and T.I. performed experiment published so far on plants and discussed the experimental data. S.N., Y.I. and T.M. discussed theoretical analyses and wrote the manuscript. All authors have read and agreed to the published version of the manuscript.
Institutional Review Board Statement
Not applicable.
Informed Consent Statement
Not applicable.
Data Availability Statement
No new data were created or analyzed in this study. Data sharing is not applicable to this article.
Use of Artificial Intelligence
During the preparation of this manuscript, the authors used ChatGPT, Gemini and DeepL to assist with English language editing, structural refinement, and the articulation of theoretical concepts. After using this tool, the authors thoroughly reviewed and edited the manuscript and take full responsibility for the final content of the publication.
Acknowledgments
We thank the members of the Mito Laboratory for their helpful comments on early drafts of this manuscript.
Conflicts of Interest
The authors declare no conflict of interest.
References
- Schuettengruber, B.; Bourbon, H.M.; Di Croce, L.; Cavalli, G. Genome Regulation by Polycomb and Trithorax: 70 Years and Counting. Cell 2017, 171(1), 34–57. [Google Scholar] [CrossRef] [PubMed]
- Angel, A.; Song, J.; Dean, C.; Howard, M. A Polycomb-based switch underlying quantitative epigenetic memory. Nature 2011, 476(7358), 105–8. [Google Scholar] [CrossRef] [PubMed]
- Berry, S.; Hartley, M.; Olsson, T.S.; Dean, C.; Howard, M. Local chromatin environment of a Polycomb target gene instructs its own epigenetic inheritance. Elife 2015, 4doi. [Google Scholar] [CrossRef] [PubMed]
- Strom, A.R.; Emelyanov, A.V.; Mir, M.; Fyodorov, D.V.; Darzacq, X.; Karpen, G.H. Phase separation drives heterochromatin domain formation. Nature 2017, 547(7662), 241–245. [Google Scholar] [CrossRef] [PubMed]
- Tatavosian, R.; Kent, S.; Brown, K.; et al. Nuclear condensates of the Polycomb protein chromobox 2 (CBX2) assemble through phase separation. J. Biol. Chem. 2019, 294(5), 1451–1463. [Google Scholar] [CrossRef] [PubMed]
- Dean, C.; Howard, M. Graded versus ON/OFF control in quantitative gene expression and epigenetic memory. EMBO J. 2026, 45(9), 2869–2881. [Google Scholar] [CrossRef] [PubMed]
- Ishimaru, Y.; Kawamoto, K.; Noji, S.; Mito, T. TGF-β-dependent regulation of juvenile hormone biosynthesis in insect development and metamorphosis. Curr. Opin. Insect Sci. 2026, 75, 101490. [Google Scholar] [CrossRef] [PubMed]
- Truman, J.W.; Riddiford, L.M. Regulation of metamorphosis in holometabolous insects. Curr. Opin. Insect Sci. 2026, 76, 101508. [Google Scholar] [CrossRef] [PubMed]
- Lui, J.C.; Garrison, P.; Nguyen, Q.; et al. EZH1 and EZH2 promote skeletal growth by repressing inhibitors of chondrocyte proliferation and hypertrophy. Nat. Commun. 2016, 7, 13685. [Google Scholar] [CrossRef] [PubMed]
- Jee, Y.H.; Baron, J. The Biology of Stature. J. Pediatr. 2016, 173, 32–8. [Google Scholar] [CrossRef] [PubMed]
- Horvath, S.; Lu, A.T.; Haghani, A.; et al. DNA methylation clocks for dogs and humans. Proc. Natl. Acad. Sci. U S A 2022, 119(21), e2120887119. [Google Scholar] [CrossRef] [PubMed]
- Lu, Y.; Brommer, B.; Tian, X.; et al. Reprogramming to recover youthful epigenetic information and restore vision. Nature 2020, 588(7836), 124–129. [Google Scholar] [CrossRef] [PubMed]
- Otsuka, N.; Yamaguchi, R.; Sawa, H.; et al. Small molecules and heat treatments reverse vernalization via epigenetic modification in Arabidopsis. Commun. Biol. 2025, 8(1), 108. [Google Scholar] [CrossRef] [PubMed]
- West, G.B.; Brown, J.H.; Enquist, B.J. A general model for the origin of allometric scaling laws in biology. Science 1997, 276(5309), 122–6. [Google Scholar] [CrossRef] [PubMed]
- Speakman, J.R. Body size, energy metabolism and lifespan. J. Exp. Biol. 2005, 208 Pt 9, 1717–30. [Google Scholar] [CrossRef] [PubMed]
- Morgan, T.H. SEX LIMITED INHERITANCE IN DROSOPHILA. Science 1910, 32(812), 120–2. [Google Scholar] [CrossRef] [PubMed]
- Lewis, E.B. A gene complex controlling segmentation in Drosophila. Nature 1978, 276(5688), 565–70. [Google Scholar] [CrossRef] [PubMed]
- Nüsslein-Volhard, C.; Wieschaus, E. Mutations affecting segment number and polarity in Drosophila. Nature 1980, 287(5785), 795–801. [Google Scholar] [CrossRef] [PubMed]
- Zehring, W.A.; Wheeler, D.A.; Reddy, P.; et al. P-element transformation with period locus DNA restores rhythmicity to mutant, arrhythmic Drosophila melanogaster. Cell. 1984, 39 2 Pt 1, 369–76. [Google Scholar] [CrossRef] [PubMed]
- Bargiello, T.A.; Jackson, F.R.; Young, M.W. Restoration of circadian behavioural rhythms by gene transfer in Drosophila. Nature 1984 Dec 20-1985 Jan 2 1984, 312(5996), 752–4. [Google Scholar] [CrossRef] [PubMed]
- Anna, G.; Kannan, N.N. Post-transcriptional modulators and mediators of the circadian clock. Chronobiol. Int. 2021, 38(9), 1244–1261. [Google Scholar] [CrossRef] [PubMed]
- Ishimaru, Y.; Tomonari, S.; Matsuoka, Y.; et al. TGF-β signaling in insects regulates metamorphosis via juvenile hormone biosynthesis. Proc. Natl. Acad. Sci. U S A 2016, 113(20), 5634–9. [Google Scholar] [CrossRef] [PubMed]
- Ishimaru, Y.; Tomonari, S.; Watanabe, T.; Noji, S.; Mito, T. Regulatory mechanisms underlying the specification of the pupal-homologous stage in a hemimetabolous insect. Philos. Trans. R Soc. Lond. B Biol. Sci. 2019, 374(1783), 20190225. [Google Scholar] [CrossRef] [PubMed]
- Lee, S.J. Myostatin: A Skeletal Muscle Chalone. Annu Rev. Physiol. 2023, 85, 269–291. [Google Scholar] [CrossRef] [PubMed]
- McPherron, A.C.; Lawler, A.M.; Lee, S.J. Regulation of skeletal muscle mass in mice by a new TGF-beta superfamily member. Nature 1997, 387(6628), 83–90. [Google Scholar] [CrossRef] [PubMed]
- Nishi, M.; Yasue, A.; Nishimatu, S.; et al. A missense mutant myostatin causes hyperplasia without hypertrophy in the mouse muscle. Biochem Biophys. Res. Commun. 2002, 293(1), 247–51. [Google Scholar] [CrossRef] [PubMed]
- Kawamoto, K.; Ishimaru, Y.; Tomonari, S.; Watanabe, T.; Noji, S.; Mito, T. Myoglianin is a crucial factor for the transition to the juvenile hormone-dependent phase during hemimetabolous nymphal development. Insect Biochem Mol. Biol. 2025, 178, 104274. [Google Scholar] [CrossRef] [PubMed]
- Whittaker, C.; Dean, C. The FLC Locus: A Platform for Discoveries in Epigenetics and Adaptation. Annu Rev. Cell Dev. Biol. 2017, 33, 555–575. [Google Scholar] [CrossRef] [PubMed]
- Aono, Y. K.K. Prediction of Flowering Date of Cherry Blossom, <i data-index-in-node=“87” data-path-tonode=“ 10,1,0”>Prunus yedoensis, Using Chill Unit and Number of Days Transformed to Standard Temperature. J. Agri Meteor. 1993, 49, 153–172. [Google Scholar]
- Wilbur, H.M.; Collins, J.P. Ecological Aspects of Amphibian Metamorphosis: Nonnormal distributions of competitive ability reflect selection for facultative metamorphosis. Science 1973, 182(4119), 1305–14. [Google Scholar] [CrossRef] [PubMed]
- Duncan, S.; Holm, S.; Questa, J.; Irwin, J.; Grant, A.; Dean, C. Seasonal shift in timing of vernalization as an adaptation to extreme winter. Elife 2015, 4doi. [Google Scholar] [CrossRef] [PubMed]
- Rachma, D. F.; Munyanont, M.; Maeda, K.L.; N. Takagaki, M. Tomato quality is more dependent on temperature than on photosynthetically active radiation. Agronomy 2024, 14, 3074. [Google Scholar] [CrossRef]
- GR, J. The Effect of Constant Temperatures and Osmotic Potentials on the Germination of Sugar Beet. J. Exp. Bot. 1986, 37(6), 729–741. [Google Scholar] [CrossRef]
- Nijhout, H.F.; Riddiford, L.M.; Mirth, C.; Shingleton, A.W.; Suzuki, Y.; Callier, V. The developmental control of size in insects. Wiley Interdiscip. Rev. Dev. Biol. 2014, 3(1), 113–34. [Google Scholar] [CrossRef] [PubMed]
- Grunert, L.W.; Clarke, J.W.; Ahuja, C.; Eswaran, H.; Nijhout, H.F. A Quantitative Analysis of Growth and Size Regulation in Manduca sexta: The Physiological Basis of Variation in Size and Age at Metamorphosis. PLoS ONE 2015, 10(5), e0127988. [Google Scholar] [CrossRef] [PubMed]
- He, L.L.; Shin, S.H.; Wang, Z.; et al. Mechanism of threshold size assessment: Metamorphosis is triggered by the TGF-beta/Activin ligand Myoglianin. Insect Biochem Mol. Biol. 2020, 126, 103452. [Google Scholar] [CrossRef] [PubMed]
- Callier, V.; Pahren, R.; Wu, S.; Bolling, V.; Nijhout, H.F. Control of metabolism by hypoxia and starvation and the consequences for the pattern of ecdysone secretion in Manduca sexta. J. Exp. Biol. 2026, 229(3). [Google Scholar] [CrossRef] [PubMed]
- Shingleton, A.W.; Das, J.; Vinicius, L.; Stern, D.L. The temporal requirements for insulin signaling during development in Drosophila. PLoS Biol. 2005, 3(9), e289. [Google Scholar] [CrossRef] [PubMed]
- Mirth, C.; Truman, J.W.; Riddiford, L.M. The role of the prothoracic gland in determining critical weight for metamorphosis in Drosophila melanogaster. Curr. Biol. 2005, 15(20), 1796–807. [Google Scholar] [CrossRef] [PubMed]
- Klingenberg CPS, J. On the role of body size for life-history evolution. Ecol. Entomol. Ecological Entomol. 1997, 22, 55–68. [Google Scholar] [CrossRef]
- Suzuki, Y.; Koyama, T.; Hiruma, K.; Riddiford, L.M.; Truman, J.W. A molt timer is involved in the metamorphic molt in Manduca sexta larvae. Proc. Natl. Acad. Sci. U S A 2013, 110(31), 12518–25. [Google Scholar] [CrossRef] [PubMed]
- Day, T.; Rowe, L. Developmental thresholds and the evolution of reaction norms for age and size at life-history transitions. Am. Nat. 2002, 159(4), 338–50. [Google Scholar] [CrossRef] [PubMed]
- Zhao, C.; Ang, Y.; Wang, M.; et al. Contribution to understanding the evolution of holometaboly: transformation of internal head structures during the metamorphosis in the green lacewing Chrysopa pallens (Neuroptera: Chrysopidae). BMC Evol. Biol. 2020, 20(1), 79. [Google Scholar] [CrossRef] [PubMed]
- Rebbapragada, A.; Benchabane, H.; Wrana, J.L.; Celeste, A.J.; Attisano, L. Myostatin signals through a transforming growth factor beta-like signaling pathway to block adipogenesis. Mol. Cell Biol. 2003, 23(20), 7230–42. [Google Scholar] [CrossRef] [PubMed]
- Walker, R.G.; Poggioli, T.; Katsimpardi, L.; et al. Biochemistry and Biology of GDF11 and Myostatin: Similarities, Differences, and Questions for Future Investigation. Circ. Res. 2016, 118(7), 1125–41; discussion 1142. [Google Scholar] [CrossRef] [PubMed]
- Driss, L.B.; Lian, J.; Walker, R.G.; et al. GDF11 and aging biology - controversies resolved and pending. J. Cardiovasc Aging 2023, 3(4). [Google Scholar] [CrossRef] [PubMed]
- Akiyama, M.; Ishigaki, K.; Sakaue, S.; et al. Characterizing rare and low-frequency height-associated variants in the Japanese population. Nat. Commun. 2019, 10(1), 4393. [Google Scholar] [CrossRef] [PubMed]
- Aires, R.; de Lemos, L.; Nóvoa, A.; et al. Tail Bud Progenitor Activity Relies on a Network Comprising Gdf11, Lin28, and Hox13 Genes. Dev. Cell. 2019, 48(3), 383–395.e8. [Google Scholar] [CrossRef] [PubMed]
- Gaunt, S.J.; George, M.; Paul, Y.L. Direct activation of a mouse Hoxd11 axial expression enhancer by Gdf11/Smad signalling. Dev. Biol. 2013, 383(1), 52–60. [Google Scholar] [CrossRef] [PubMed]
- Yao, W.; Wei, Z.; Tian, X.; Tan, J.; Liu, J. Gdf11 regulates left-right asymmetry development through TGF-β signal. Cell Prolif. 2025, 58(3), e13765. [Google Scholar] [CrossRef] [PubMed]
- BULLOUGH, W.S. The control of mitotic activity in adult mammalian tissues. Biol. Rev. Camb. Philos. Soc. 1962, 37, 307–42. [Google Scholar] [CrossRef] [PubMed]
- Matsubara, Y.; Hirasawa, T.; Egawa, S.; et al. Anatomical integration of the sacral-hindlimb unit coordinated by GDF11 underlies variation in hindlimb positioning in tetrapods. Nat. Ecol. Evol. 2017, 1(9), 1392–1399. [Google Scholar] [CrossRef] [PubMed]
- Hauswirth, G.M.; Garside, V.C.; Wong, L.S.F.; et al. Breaking constraint of mammalian axial formulae. Nat. Commun. 2022, 13(1), 243. [Google Scholar] [CrossRef] [PubMed]
- Loffredo, F.S.; Steinhauser, M.L.; Jay, S.M.; et al. Growth differentiation factor 11 is a circulating factor that reverses age-related cardiac hypertrophy. Cell 2013, 153(4), 828–39. [Google Scholar] [CrossRef] [PubMed]
- Guo, P.; Wan, S.; Guan, K.L. The Hippo pathway: Organ size control and beyond. Pharmacol. Rev. 2025, 77(2), 100031. [Google Scholar] [CrossRef] [PubMed]
- Brotto, M.; Bonewald, L. Bone and muscle: Interactions beyond mechanical. Bone 2015, 80, 109–114. [Google Scholar] [CrossRef] [PubMed]
- Lee, Y.J.; McPherron, A.; Choe, S.; et al. Growth differentiation factor 11 signaling controls retinoic acid activity for axial vertebral development. Dev. Biol. 2010, 347(1), 195–203. [Google Scholar] [CrossRef] [PubMed]
- Akizu, N.; Estarás, C.; Guerrero, L.; Martí, E.; Martínez-Balbás, M.A. H3K27me3 regulates BMP activity in developing spinal cord. Development 2010, 137(17), 2915–25. [Google Scholar] [CrossRef] [PubMed]
- Fei, T.; Xia, K.; Li, Z.; et al. Genome-wide mapping of SMAD target genes reveals the role of BMP signaling in embryonic stem cell fate determination. Genome Res. 2010, 20(1), 36–44. [Google Scholar] [CrossRef] [PubMed]
- Weise, M.; De-Levi, S.; Barnes, K.M.; Gafni, R.I.; Abad, V.; Baron, J. Effects of estrogen on growth plate senescence and epiphyseal fusion. Proc. Natl. Acad. Sci. U S A 2001, 98(12), 6871–6. [Google Scholar] [CrossRef] [PubMed]
- Ferguson, C.M.; Schwarz, E.M.; Reynolds, P.R.; Puzas, J.E.; Rosier, R.N.; O’Keefe, R.J. Smad2 and 3 mediate transforming growth factor-beta1-induced inhibition of chondrocyte maturation. Endocrinology 2000, 141(12), 4728–35. [Google Scholar] [CrossRef] [PubMed]
- Nair, S.J.; Yang, L.; Meluzzi, D.; et al. Phase separation of ligand-activated enhancers licenses cooperative chromosomal enhancer assembly. Nat. Struct. Mol. Biol. 2019, 26(3), 193–203. [Google Scholar] [CrossRef] [PubMed]
- Zhou, Z.Q.; Ota, S.; Deng, C.; Akiyama, H.; Hurlin, P.J. Mutant activated FGFR3 impairs endochondral bone growth by preventing SOX9 downregulation in differentiating chondrocytes. Hum. Mol. Genet 2015, 24(6), 1764–73. [Google Scholar] [CrossRef] [PubMed]
- Iwamoto, M.; Kitagaki, J.; Tamamura, Y.; et al. Runx2 expression and action in chondrocytes are regulated by retinoid signaling and parathyroid hormone-related peptide (PTHrP). Osteoarthr. Cartil. 2003, 11(1), 6–15. [Google Scholar] [CrossRef] [PubMed]
- Soshnikova, N.; Duboule, D. Epigenetic temporal control of mouse Hox genes in vivo. Science 2009, 324(5932), 1320–3. [Google Scholar] [CrossRef] [PubMed]
- Jurberg, A.D.; Aires, R.; Varela-Lasheras, I.; Nóvoa, A.; Mallo, M. Switching axial progenitors from producing trunk to tail tissues in vertebrate embryos. Dev. Cell. 2013, 25(5), 451–62. [Google Scholar] [CrossRef] [PubMed]
- Plys, A.J.; Davis, C.P.; Kim, J.; et al. Phase separation of Polycomb-repressive complex 1 is governed by a charged disordered region of CBX2. Genes Dev. 2019, 33(13-14), 799–813. [Google Scholar] [CrossRef] [PubMed]
- Kronenberg, H.M. Developmental regulation of the growth plate. Nature 2003, 423(6937), 332–6. [Google Scholar] [CrossRef] [PubMed]
- Vu, T.H.; Shipley, J.M.; Bergers, G.; et al. MMP-9/gelatinase B is a key regulator of growth plate angiogenesis and apoptosis of hypertrophic chondrocytes. Cell 1998, 93(3), 411–22. [Google Scholar] [CrossRef] [PubMed]
- Gerber, H.P.; Vu, T.H.; Ryan, A.M.; Kowalski, J.; Werb, Z.; Ferrara, N. VEGF couples hypertrophic cartilage remodeling, ossification and angiogenesis during endochondral bone formation. Nat. Med. 1999, 5(6), 623–8. [Google Scholar] [CrossRef] [PubMed]
- Akiyama, H.; Chaboissier, M.C.; Martin, J.F.; Schedl, A.; de Crombrugghe, B. The transcription factor Sox9 has essential roles in successive steps of the chondrocyte differentiation pathway and is required for expression of Sox5 and Sox6. Genes Dev. 2002, 16(21), 2813–28. [Google Scholar] [CrossRef] [PubMed]
- Smith, E.P.; Boyd, J.; Frank, G.R.; et al. Estrogen resistance caused by a mutation in the estrogen-receptor gene in a man. N Engl. J. Med. 1994, 331(16), 1056–61. [Google Scholar] [CrossRef] [PubMed]
- Eriksson, M.; Brown, W.T.; Gordon, L.B.; et al. Recurrent de novo point mutations in lamin A cause Hutchinson-Gilford progeria syndrome. Nature 2003, 423(6937), 293–8. [Google Scholar] [CrossRef] [PubMed]
- Goldman, R.D.; Shumaker, D.K.; Erdos, M.R.; et al. Accumulation of mutant lamin A causes progressive changes in nuclear architecture in Hutchinson-Gilford progeria syndrome. Proc. Natl. Acad. Sci. U S A 2004, 101(24), 8963–8. [Google Scholar] [CrossRef] [PubMed]
- West, G.B.; Brown, J.H. The origin of allometric scaling laws in biology from genomes to ecosystems: towards a quantitative unifying theory of biological structure and organization. J. Exp. Biol. 2005, 208 Pt 9, 1575–92. [Google Scholar] [CrossRef] [PubMed]
- Takahashi, K.; Yamanaka, S. Induction of pluripotent stem cells from mouse embryonic and adult fibroblast cultures by defined factors. Cell 2006, 126(4), 663–76. [Google Scholar] [CrossRef] [PubMed]
- Macip, C.C.; Hasan, R.; Hoznek, V.; et al. Gene Therapy-Mediated Partial Reprogramming Extends Lifespan and Reverses Age-Related Changes in Aged Mice. Cell Reprogram 2024, 26(1), 24–32. [Google Scholar] [CrossRef] [PubMed]
- Guan, J.; Wang, G.; Wang, J.; et al. Chemical reprogramming of human somatic cells to pluripotent stem cells. Nature 2022, 605(7909), 325–331. [Google Scholar] [CrossRef] [PubMed]
- Izadi, E.; Mohammadi, S.S.; Ganjalikhani Hakemi, M.; et al. Current biological, chemical and physical gene delivery approaches for producing induced pluripotent stem cells (iPSCs). Eur. J. Pharmacol. 2025, 1003, 177786. [Google Scholar] [CrossRef] [PubMed]
- Huangfu, D.; Osafune, K.; Maehr, R.; et al. Induction of pluripotent stem cells from primary human fibroblasts with only Oct4 and Sox2. Nat. Biotechnol. 2008, 26(11), 1269–75. [Google Scholar] [CrossRef] [PubMed]
- Bando, T.; Mito, T.; Hamada, Y.; Ishimaru, Y.; Noji, S.; Ohuchi, H. Molecular mechanisms of limb regeneration: insights from regenerating legs of the cricket Gryllus bimaculatus. Int. J. Dev. Biol. 2018, 62(6-7-8), 559–569. [Google Scholar] [CrossRef] [PubMed]
- Rando, T.A.; Chang, H.Y. Aging, rejuvenation, and epigenetic reprogramming: resetting the aging clock. Cell 2012, 148(1-2), 46–57. [Google Scholar] [CrossRef] [PubMed]
- Riddiford, L.M. Juvenile hormone: the status of its “status quo” action. Arch. Insect Biochem Physiol. 1996, 32(3-4), 271–86. [Google Scholar] [CrossRef]
- Michaels, S.D.; Amasino, R.M. Loss of FLOWERING LOCUS C activity eliminates the late-flowering phenotype of FRIGIDA and autonomous pathway mutations but not responsiveness to vernalization. Plant Cell. 2001, 13(4), 935–41. [Google Scholar] [CrossRef] [PubMed]
- Larson, A.G.; Elnatan, D.; Keenen, M.M.; et al. Liquid droplet formation by HP1α suggests a role for phase separation in heterochromatin. Nature 2017, 547(7662), 236–240. [Google Scholar] [CrossRef] [PubMed]
- Wang, H.; Jiang, D.; Axelsson, E.; et al. LHP1 Interacts with ATRX through Plant-Specific Domains at Specific Loci Targeted by PRC2. Mol. Plant 2018, 11(8), 1038–1052. [Google Scholar] [CrossRef] [PubMed]
- Schubert, D.; Primavesi, L.; Bishopp, A.; et al. Silencing by plant Polycomb-group genes requires dispersed trimethylation of histone H3 at lysine 27. EMBO J. 2006, 25(19), 4638–49. [Google Scholar] [CrossRef] [PubMed]
- Fang, X.; Wang, L.; Ishikawa, R.; et al. Arabidopsis FLL2 promotes liquid-liquid phase separation of polyadenylation complexes. Nature 2019, 569(7755), 265–269. [Google Scholar] [CrossRef] [PubMed]
- Song, Y.; Zhang, X.; Li, M.; et al. The direct targets of CBFs: In cold stress response and beyond. J. Integr. Plant Biol. 2021, 63(11), 1874–1887. [Google Scholar] [CrossRef] [PubMed]
- Xu, C.; Wu, Z.; Duan, H.C.; Fang, X.; Jia, G.; Dean, C. R-loop resolution promotes co-transcriptional chromatin silencing. Nat. Commun. 2021, 12(1), 1790. [Google Scholar] [CrossRef] [PubMed]
- Zhang, Y.; Fan, S.; Hua, C.; et al. Phase separation of HRLP regulates flowering time in Arabidopsis. Sci. Adv. 2022, 8(25), eabn5488. [Google Scholar] [CrossRef] [PubMed]
- Zhao, Y.; Antoniou-Kourounioti, R.L.; Calder, G.; Dean, C.; Howard, M. Temperature-dependent growth contributes to long-term cold sensing. Nature 2020, 583(7818), 825–829. [Google Scholar] [CrossRef] [PubMed]
- Jeon, M.; Jeong, G.; Yang, Y.; et al. Vernalization-triggered expression of the antisense transcript. Elife 2023, 12doi. [Google Scholar] [CrossRef] [PubMed]
- Antoniou-Kourounioti, R.L.; Hepworth, J.; Heckmann, A.; et al. Temperature Sensing Is Distributed throughout the Regulatory Network that Controls FLC Epigenetic Silencing in Vernalization. Cell Syst. 2018, 7(6), 643–655.e9. [Google Scholar] [CrossRef] [PubMed]
- Fang, X.; Wu, Z.; Raitskin, O.; et al. The 3’ processing of antisense RNAs physically links to chromatin-based transcriptional control. Proc. Natl. Acad. Sci. U S A 2020, 117(26), 15316–15321. [Google Scholar] [CrossRef] [PubMed]
- Yang, H.; Berry, S.; Olsson, T.S.G.; Hartley, M.; Howard, M.; Dean, C. Distinct phases of Polycomb silencing to hold epigenetic memory of cold in. Science 2017, 357(6356), 1142–1145. [Google Scholar] [CrossRef] [PubMed]
Disclaimer/Publisher’s Note: The statements, opinions and data contained in all publications are solely those of the individual author(s) and contributor(s) and not of MDPI and/or the editor(s). MDPI and/or the editor(s) disclaim responsibility for any injury to people or property resulting from any ideas, methods, instructions or products referred to in the content. |
© 2026 by the authors. Licensee MDPI, Basel, Switzerland. This article is an open access article distributed under the terms and conditions of the Creative Commons Attribution (CC BY) license (http://creativecommons.org/licenses/by/4.0/).
Copyright: This open access article is published under a Creative Commons CC BY 4.0 license, which permit the free download, distribution, and reuse, provided that the author and preprint are cited in any reuse.