

Submitted:
29 June 2026
Posted:
01 July 2026
You are already at the latest version
Abstract
Leg-spring hysteresis quantifies the mechanical energy dissipated within the force–length loop during ground contact and serves as a proxy for stretch-shortening cycle (SSC) efficiency. Whether international-level track-and-field athletes and club-level multi-sport athletes differ in their hysteresis responses to increasing drop height, and whether hysteresis predicts jump height, remains unclear. Forty athletes (15 international-level, 25 club-level) performed bilateral (BLJ), dominant-leg (DOM), and non-dominant-leg (NDOM) drop jumps from 0.26 m and 0.42 m. Three-dimensional kinematics (500 Hz) and ground reaction forces were used to compute leg-spring stiffness, hysteresis, and jump height. Significant group × drop-height interactions emerged for hysteresis in all three conditions (η2p = 0.647, 0.507, 0.466; p < .001): international-level athletes became increasingly negative (greater SSC enhancement) at 0.42 m, whereas club-level athletes showed positive hysteresis (net dissipation). Between-group hysteresis differences at 0.42 m were large (DOM d = −1.73; NDOM d = −1.95), and jump height was consistently higher in international-level athletes (d = 1.14–1.77). Pooled across groups, hysteresis was associated with jump height (R2 = 0.44–0.60), although this estimate is inflated by caliber differences and within-group associations were moderate and condition-dependent. Leg-spring hysteresis is a mechanically meaningful and practically relevant discriminator of reactive-jumping capacity.
Keywords:
stretch-shortening cycle
; elastic energy storage
; drop jump
; reactive strength
; leg stiffness
; sport performance
1. Introduction
The spring-mass model provides a productive mechanical framework for characterizing lower-extremity behavior during bouncing gaits and reactive jumping tasks [1,2]. Within this framework, the lower limb is idealized as a massless spring, whose compression and recoil during ground contact govern the energetics of the stance phase. Leg spring stiffness, defined as the ratio of the peak vertical ground reaction force to the maximum leg compression, has been consistently associated with running economy, jump height, and sprint performance across diverse athletic populations [3,4,5]. However, stiffness alone does not fully characterize the elastic energy storage and return cycles. An idealized spring recovers all stored strain energy upon unloading, whereas biological musculotendinous tissues inevitably dissipate a proportion of mechanical energy through viscoelastic damping [6,7]. At the tissue level, tendons exhibit hysteresis values of approximately 5–15% under physiological loading rates, reflecting the inherent viscoelastic behavior of collagenous structures [8]. Critically, longitudinal evidence has demonstrated that 12 weeks of plyometric training significantly reduces tendon hysteresis during ballistic contractions while concurrently increasing active muscle stiffness and jump performance, indicating that the efficiency of elastic energy return is a trainable mechanical property [9]. At the whole-limb level, hysteresis is quantified from the force–length loop traced by the leg spring during ground contact, as the signed difference between the mechanical energy absorbed during the braking (loading) phase and the energy returned during the propulsion (unloading) phase, expressed relative to the energy absorbed [10,11]. A strictly passive viscoelastic spring returns less energy than it absorbs and therefore yields positive hysteresis (net dissipation); in an active musculotendinous system, concentric muscle work performed during propulsion can return more mechanical energy than was absorbed during braking, reversing the orientation of the loop and producing negative hysteresis (net energy amplification) — the mechanistic signature of effective SSC utilisation [10,11]. The sign convention and its computation are detailed in Section 2.4 and illustrated in Figure 1.
The stretch-shortening cycle (SSC) is defined as a rapid sequence of eccentric loading and concentric unloading of the musculotendinous unit, during which the elastic strain energy stored in the series elastic components is recovered to augment propulsive force output [7,12,13]. Pre-activation of the relevant musculature before ground contact, precise timing of the eccentric-to-concentric transition, and adequate musculotendinous stiffness are necessary conditions for effective elastic energy return [14]. Drop-jump tasks operationalize these requirements by imposing a controlled eccentric loading stimulus whose magnitude scales with box height, rendering them a validated and widely employed paradigm for probing SSC mechanics across various performance levels [11,15,16]. A recent systematic review and meta-analysis confirmed that reactive strength index (RSI) is meaningfully associated with independent markers of athletic performance [17], and plyometric jump training reliably improves RSI across diverse athlete populations [18]. International-level athletes consistently demonstrate higher leg spring stiffness, shorter ground contact times, and superior RSI values compared with recreationally trained or club-level populations [4,15,16], differences attributable in part to long-term plyometric training adaptations [9,19]. Despite this body of evidence, whether international-level track and field athletes and club-level multi-sport athletes differ in their hysteresis responses to systematically increasing drop heights and whether such differences predict jump performance remains unknown.
Therefore, this study addressed three primary aims: (i) to compare leg spring hysteresis and jump height between groups across bilateral (BLJ), dominant-leg (DOM), and non-dominant-leg (NDOM) drop-jump conditions performed from two systematically varied box heights; (ii) to determine whether a significant group × box-height interaction existed for hysteresis and jump height; and (iii) to quantify the predictive validity of hysteresis for jump height at Box 2 (0.42 m). It was hypothesized that (H1) international-level athletes would exhibit markedly lower (more negative) hysteresis values at Box 2 relative to Box 1, reflecting progressive SSC enhancement with increasing eccentric load; (H2) a significant group × box-height interaction would emerge for hysteresis across all three jump conditions; and (H3) hysteresis would be a significant and strong independent predictor of jump height at Box 2.
2. Materials and Methods
2.1. Participants
Forty athletes participated in this study, comprising 15 international-level track and field athletes (5 females, 10 males) and 25 club-level multi-sport athletes (15 females, 10 males). Demographic and anthropometric characteristics are presented in Table 1. The two groups were well matched for height, body mass, and BMI. International-level athletes were significantly older than club-level athletes (U = 314.0, p < .001, d = 0.69). The dominant leg was operationally defined as the preferred take-off leg, determined using a standardized ball-kicking preference test. The gender distribution did not differ significantly between groups (χ2(1) = 1.71, p = .191).
International-level athletes were track and field competitors with at least five years of continuous competition experience who had competed at major international championships (European Athletics Championships or equivalent). The group included high jumpers (n = 2), triple jumpers (n = 1), shot put athletes (n = 1), hurdlers (n = 2), javelin throwers (n = 2), sprinters (n = 4), pole vaulters (n = 1), and long jumpers (n = 2). Club-level athletes included track and field athletes (n = 2), basketball players (n = 14), handball players (n = 2), and volleyball players (n = 7). All participants had a minimum of one year of structured plyometric or athletic training experience before data collection.
Participants were excluded if they had a history of lower extremity surgery, current lower extremity injury, or any musculoskeletal injury in the preceding 12 months. All participants provided written informed consent prior to testing. The study was approved by the Non-Interventional Clinical Research Ethics Committee [Institution blinded for review] (Approval No. 232; date: 30 November 2022). All procedures were conducted in accordance with the ethical standards of the Declaration of Helsinki (revised 2013).
2.2. Procedure
All athletes completed a standardized 10-minute warm-up consisting of five minutes of light jogging, followed by five minutes of dynamic lower-extremity stretching. Submaximal countermovement jumps and familiarization drop jumps were subsequently performed. Participants were instructed to land on the forefoot and immediately perform a maximum-effort vertical jump, minimizing ground-contact time while maximizing jump height [11,15]. Sixty-one retroreflective markers were placed on anatomical landmarks following a full-body marker set based on the Plug-in Gait convention, implemented in Visual3D (v6, C-Motion, Germantown, MD, USA). Following static calibration, eight markers used exclusively for anatomical calibration were removed, leaving 53 tracking markers for the dynamic trials.
Participants performed bilateral drop jumps (BLJ), dominant-leg drop jumps (DOM), and non-dominant-leg drop jumps (NDOM) from two fixed box heights: Box 1 (0.26 m) and Box 2 (0.42 m). These heights were selected to represent a low-to-moderate loading range consistent with prior drop-jump research [11,16]. The order of jump conditions and box heights was fully counterbalanced across participants using Research Randomizer software [20]. Each participant completed three maximal trials per condition, and the trial producing the highest jump height was retained for analysis [11]. Rest intervals of 60 s between trials and 2 min between conditions were enforced [15].
2.3. Instrumentation and Data Capture
Three-dimensional kinematic data were collected at 500 Hz using seven Oqus 7+ infrared cameras (Qualisys Track Manager v2020.3; Qualisys AB, Gothenburg, Sweden). Ground reaction forces (GRF) were recorded synchronously at 500 Hz using a six-component force platform (Bertec FP6090-15-TM; Bertec Corporation, Columbus, OH, USA). Kinematic data were filtered using a fourth-order, zero-lag, dual-pass Butterworth low-pass filter with a cutoff frequency of 12 Hz. Kinetic (GRF) data were left unfiltered prior to calculation of leg spring stiffness and hysteresis to prevent artificial attenuation of the impact transient. Because leg length was derived from low-pass-filtered kinematics whereas force was retained unfiltered, the two axes of the force–length loop were not subjected to identical frequency conditioning, which may introduce a small distortion of the computed loop area during the early braking phase. All data were processed using Visual3D (v6, C-Motion) to generate rigid-body segment models and compute whole-body center-of-mass (COM) trajectories. The hip joint center (HJC) was estimated using the regression method of Bell et al. [21].
2.4. Data Analysis
Jump height was calculated from the vertical displacement of the whole-body COM between take-off and the apex of the flight phase. Leg length was defined as the three-dimensional Euclidean distance between the HJC and the instantaneous center of pressure. Leg-spring stiffness (k) was computed as the slope of a linear ordinary least-squares regression fitted to the loading-phase force–length curve [5,11]. Hysteresis was quantified as:
The force–length loop for each contact was constructed by plotting the vertical ground reaction force against instantaneous leg length from touchdown to take-off, and was partitioned at the instant of maximum leg compression into a loading (braking) branch and an unloading (propulsion) branch. The energy absorbed during loading (A_ascending) and the energy returned during unloading (A_descending) were each computed as the magnitude of the work integral ∫F dL along the respective branch, evaluated numerically by the trapezoidal rule, with the signed enclosed loop area defined as A_loop = A_ascending − A_descending:
Hysteresis (%) = (Aloop/Aascending) × 100
Positive values arise when the unloading branch lies below the loading branch (A_descending < A_ascending), indicating net energy dissipation, as expected of a passive viscoelastic spring; negative values arise when the unloading branch lies above the loading branch (A_descending > A_ascending), indicating that concentric muscle work returned more mechanical energy than was absorbed during braking — net energy amplification and the mechanical signature of effective SSC utilisation [10,11]. The two cases are illustrated schematically in Figure 1.
Between-group comparisons were conducted using independent-samples t-tests or Mann–Whitney U tests as appropriate based on Shapiro–Wilk normality testing; for all independent-samples t-tests, Welch’s correction was applied because group sizes were unequal and variances heterogeneous across several conditions, so degrees of freedom are reported as non-integer values. Group × box-height interactions were examined using 2 × 2 mixed-design ANOVAs. Hierarchical regression models predicting jump height from hysteresis were constructed in two steps: a linear model (Step 1), followed by the addition of a quadratic term (Step 2). Leg spring stiffness was entered as a second predictor in exploratory Step 3. An ANCOVA with chronological age as a covariate was conducted to verify that the significant between-group age difference did not account for the primary biomechanical outcomes; age was an admissible covariate because it varied within both groups with overlapping distributions. Sport discipline and biological gender could not be modelled as covariates or factors alongside group, because both were structurally confounded with group membership, and their potential influence was therefore examined descriptively (Section 3.4) and addressed as a design limitation (Section 4.5) rather than through statistical adjustment, which the nested data structure does not support. Because multiple inferential tests were conducted, interpretation emphasises the magnitude and cross-condition consistency of effects rather than the significance of any single comparison; no familywise correction was applied, and the exploratory analyses (Section 3.4 and Section 3.5) are identified as such. Effect sizes were reported as Cohen’s d (between-group comparisons), η2p (ANOVA interactions), and Pearson r (bivariate associations) [22]. Intra-session reliability was quantified using the Intraclass Correlation Coefficient (ICC) and Coefficient of Variation (CV%) across all three recorded trials per participant, employing a two-way mixed-effects, single-measurement, absolute-agreement model (ICC[A,1] in McGraw–Wong terminology) [23]; because the primary analyses used the single best (highest) trial per condition rather than the across-trial mean, these coefficients characterise the trial-to-trial consistency of the measurement rather than the precision of the specific maximal value retained for analysis. Because hysteresis values frequently approach or cross zero (inflating CV%), the absolute Standard Error of Measurement (SEM = SDₚₒₒₗₑᵈ × √(1 − ICC)) was calculated for hysteresis instead. All statistical analyses were performed using IBM SPSS Statistics (version 29.0; IBM Corp., Armonk, NY, USA). Because the sample size was fixed by athlete availability, a sensitivity analysis was conducted in G*Power (version 3.1.9.7) [24] to establish the smallest effects the design could reliably detect rather than to estimate post hoc observed power. With α = .05 and power = .80 and the realised group sizes (n = 15 and n = 25), the minimum detectable effect was Cohen’s d = 0.94 for the between-group comparisons and partial η2 = 0.17 (Cohen’s f = 0.46) for a single-degree-of-freedom F test, the latter serving as a conservative reference for both the group × drop-height interaction and the single-predictor regression; the primary effects reported below (|d| = 1.14–1.95; interaction η2p = 0.47–0.65; regression R2 = 0.44–0.60) substantially exceeded these thresholds, whereas smaller effects could not be reliably detected, so non-significant findings are interpreted as inconclusive rather than as evidence of absence.
3. Results
3.1. Reliability of Hysteresis and Jump Height
Intra-session reliability for jump height was excellent across all conditions, with ICC(3,1) values ranging from 0.94 to 0.98 and CV% ranging from 3.2% to 5.8%. For leg-spring hysteresis, reliability was good to excellent, with ICC(3,1) values ranging from 0.85 to 0.92 [23]. The SEM for hysteresis ranged from 8.5% to 12.4%, indicating acceptable trial-to-trial measurement stability. Crucially, the observed between-group differences in hysteresis at Box 2 (International-level: −49.67% vs. Club-level: +1.00%; absolute difference ≈ 51 percentage points) exceeded the largest SEM value by a factor of approximately five, confirming that the group contrasts reflected genuine mechanical differences.

Table 2.
Intra-session reliability metrics for Jump Height and Leg-Spring Hysteresis across all drop-jump conditions (n = 40).
Table 2.
Intra-session reliability metrics for Jump Height and Leg-Spring Hysteresis across all drop-jump conditions (n = 40).
| Condition | Jump Height | Hysteresis | ||
|---|---|---|---|---|
| ICC (95% CI) | CV (%) | ICC (95% CI) | SEM (%) | |
| BLJ_0.26 m | 0.97 (0.94–0.98) | 3.5 | 0.89 (0.81–0.94) | 10.2 |
| BLJ_0.42 m | 0.98 (0.95–0.99) | 3.2 | 0.92 (0.86–0.96) | 8.5 |
| DOM_0.26 m | 0.95 (0.91–0.97) | 4.8 | 0.85 (0.74–0.91) | 12.4 |
| DOM_0.42 m | 0.96 (0.93–0.98) | 4.1 | 0.88 (0.79–0.93) | 11.1 |
| NDOM_0.26 m | 0.94 (0.89–0.97) | 5.8 | 0.86 (0.76–0.92) | 12.1 |
| NDOM_0.42 m | 0.95 (0.91–0.97) | 5.2 | 0.87 (0.78–0.93) | 11.6 |
Note. ICC = Intraclass Correlation Coefficient (Two-way mixed effects, absolute agreement, single measurement). CV = Coefficient of Variation. SEM = Standard Error of Measurement (SD×√(1−ICC)). CV% was not calculated for hysteresis due to the mathematical instability of dividing by near-zero means; SEM is provided as the absolute index of measurement error.
3.2. Participant Characteristics
The demographic characteristics are presented in Table 1. The two groups were well matched for height (t(33.4) = 0.27, p = .792), body mass (U = 195.0, p = .845), and BMI (U = 198.0, p = .780). International-level athletes were significantly older than club-level athletes (U = 314.0, p < .001, d = 0.69).
3.3. Between-Group Comparisons of Hysteresis and Jump Height
Descriptive statistics and between-group comparisons are shown in Table 3. Jump height was consistently and substantially higher in international-level athletes across all six conditions (Cohen’s d range: 1.14–1.77; all p < .01). At Box 1 (0.26 m), hysteresis did not differ significantly between groups in any condition (BLJ: p = .635; DOM: p = .074; NDOM: p = .302). At Box 2 (0.42 m), the international-level group exhibited markedly more negative hysteresis values across all conditions (BLJ: U = 30.0, p < .001, d = −1.78; DOM: t(34.1) = −5.55, p < .001, d = −1.73; NDOM: t(19.6) = −5.23, p < .001, d = −1.95), indicating net active energy contribution (SSC enhancement). Club-level athletes demonstrated positive mean hysteresis values at Box 2 across all conditions, indicating net energy dissipation.
3.4. Sensitivity Analyses: Within-Group Discipline Comparison and Age Adjustment
The international-level group comprised athletes from disciplines with divergent demands on lower-extremity SSC mechanics, permitting a limited test of whether the negative-hysteresis signature was specific to a single discipline within the elite cohort. An exploratory within-group comparison for the Box 2 bilateral drop-jump condition indicated that elastic specialists (jumpers, sprinters, and hurdlers; n = 12) and throwing athletes (shot put and javelin; n = 3) both exhibited strongly negative hysteresis (−46.06 ± [SD1]% and −63.81 ± [SD2]%, respectively), with comparable jump heights across subgroups (0.301 m vs. 0.305 m). Because the throwing subgroup was very small (n = 3), this comparison is illustrative only and was not subjected to inferential testing; it indicates that the negative-hysteresis pattern was present across mechanically dissimilar track-and-field disciplines rather than confined to elastic-recoil specialists. Separately, an ANCOVA with chronological age as a covariate confirmed that the significant between-group age difference did not account for the group effect: the main effect of group on both hysteresis and jump height at Box 2 remained significant across all three conditions (all p ≤ .002). Because sport discipline and biological gender were nested within group, neither could be entered as a covariate; their influence is addressed as a design limitation (Section 4.5).
3.5. Prevalence of SSC Enhancement
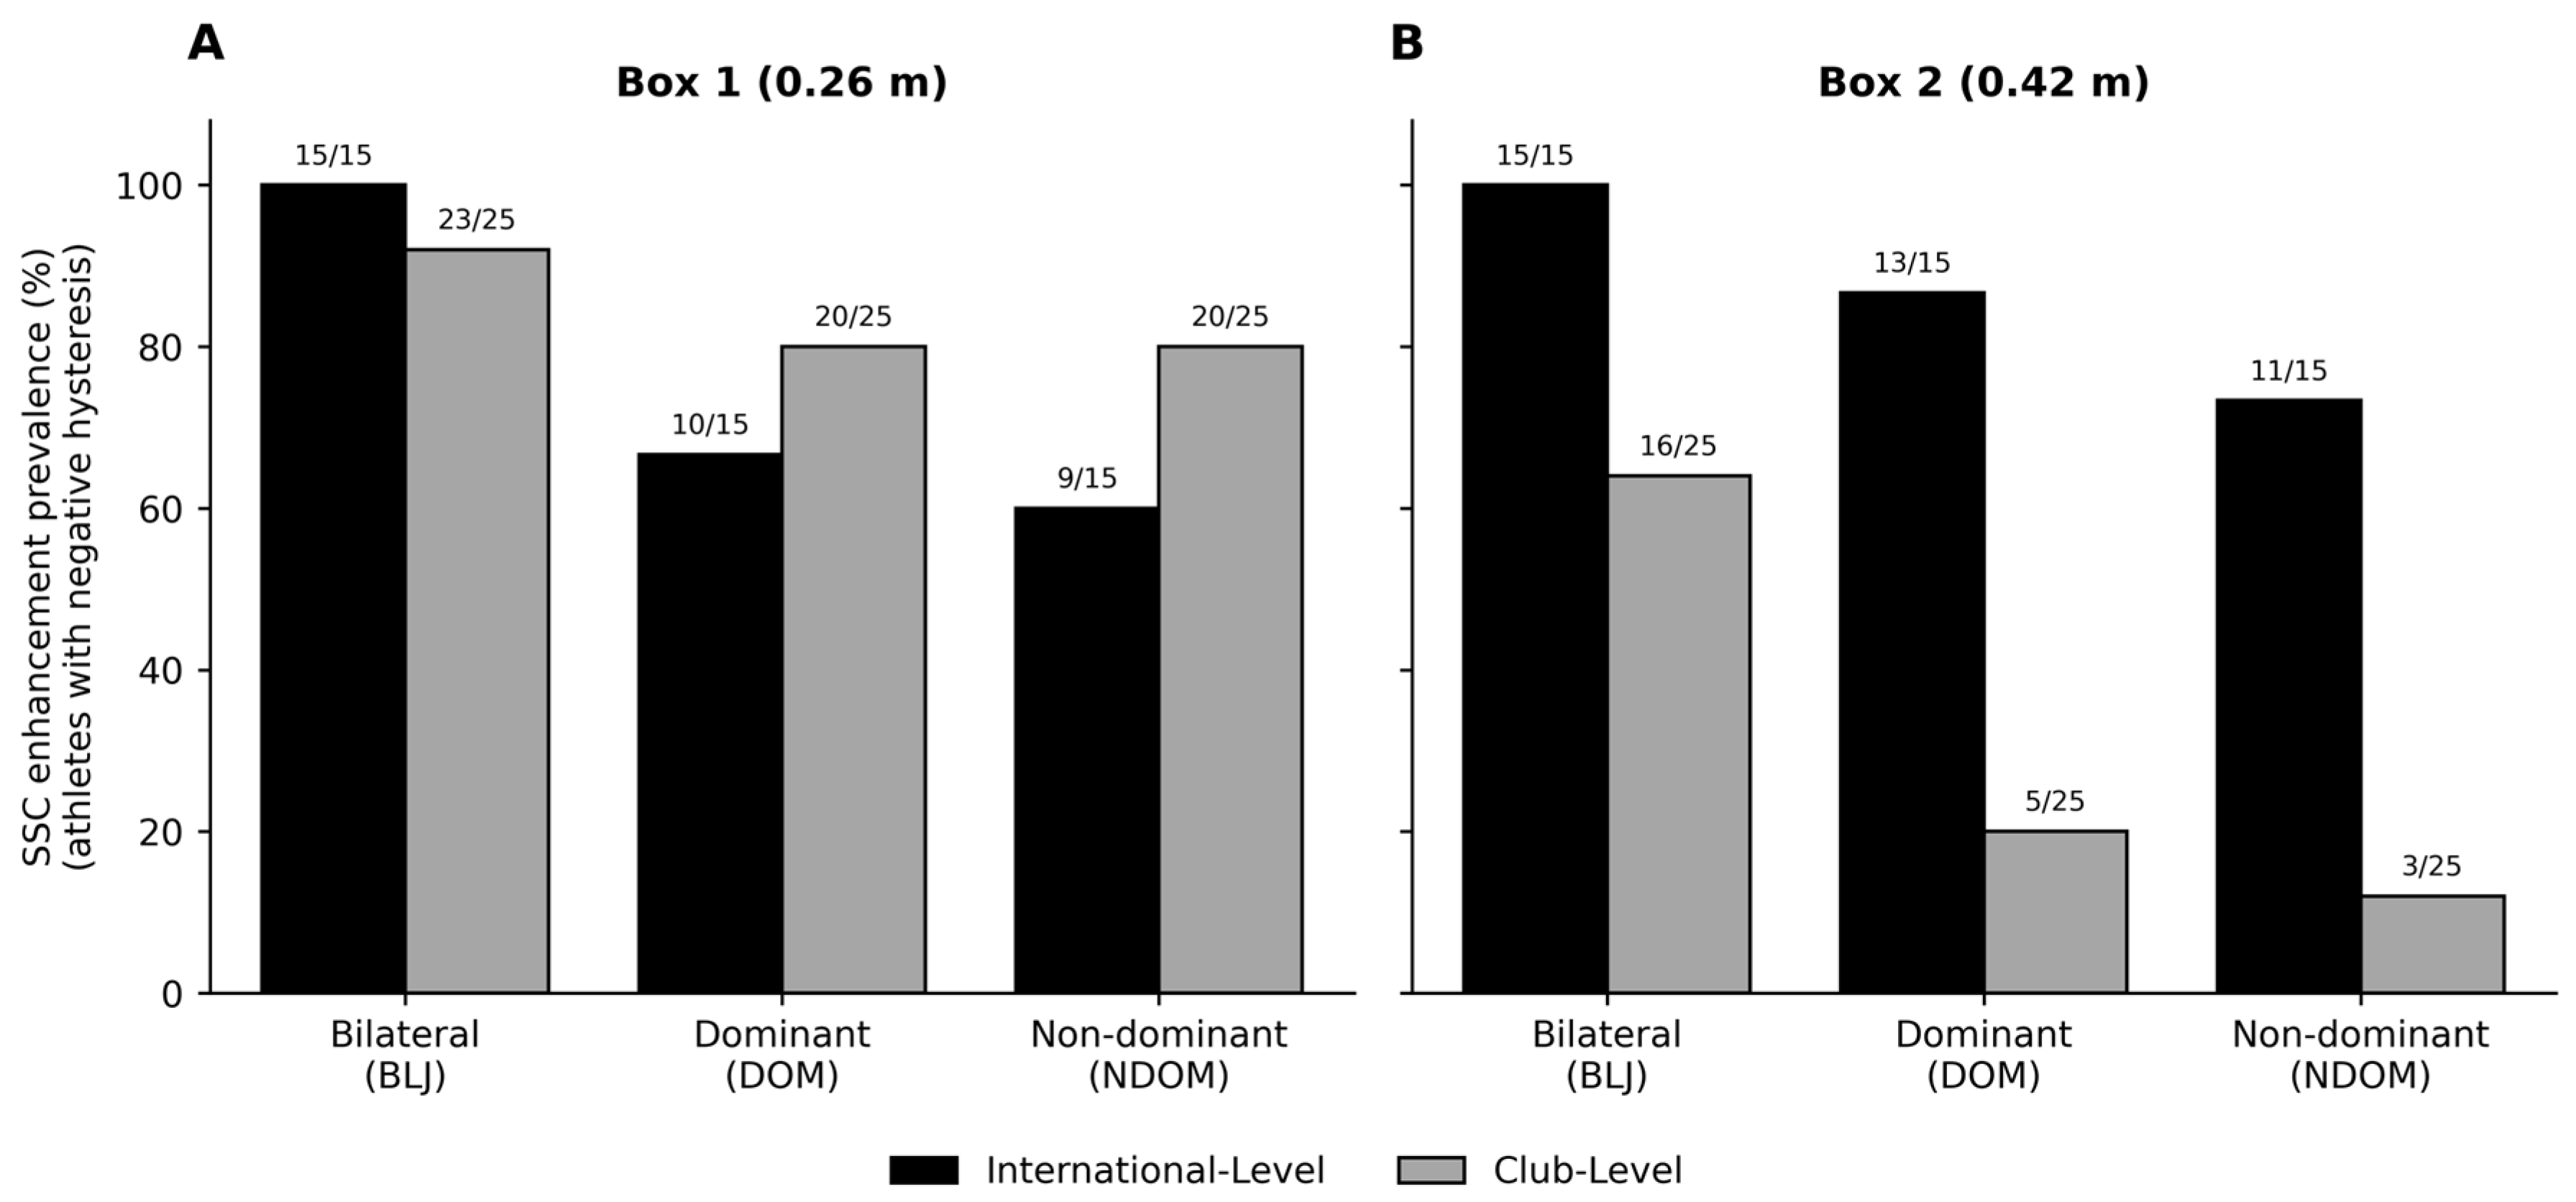
At Box 1 (0.26 m), SSC enhancement prevalence (negative hysteresis) was high in both groups across all conditions (International-level: 87–100%; Club-level: 64–80%), with no marked between-group difference. At Box 2 (0.42 m), international-level athletes maintained near-universal SSC enhancement in the bilateral condition (100%), with 87% and 73% prevalence in the dominant and non-dominant unilateral conditions, respectively. In contrast, SSC enhancement prevalence in club-level athletes collapsed substantially at Box 2 (BLJ: 64%; DOM: 20%; NDOM: 12%), indicating that 80–88% of club-level athletes failed to achieve net elastic energy amplification under unilateral high-load conditions.
Figure 2.
Prevalence of SSC enhancement (proportion of athletes exhibiting negative hysteresis) across group and condition. BLJ = bilateral drop jump; DOM = dominant-leg drop jump; NDOM = non-dominant-leg drop jump. Black bars = International-Level; Grey bars = Club-Level. Box 1 = 0.26 m; Box 2 = 0.42 m.
Figure 2.
Prevalence of SSC enhancement (proportion of athletes exhibiting negative hysteresis) across group and condition. BLJ = bilateral drop jump; DOM = dominant-leg drop jump; NDOM = non-dominant-leg drop jump. Black bars = International-Level; Grey bars = Club-Level. Box 1 = 0.26 m; Box 2 = 0.42 m.
3.6. Group × Drop-Height Interaction: Hysteresis and Jump Height
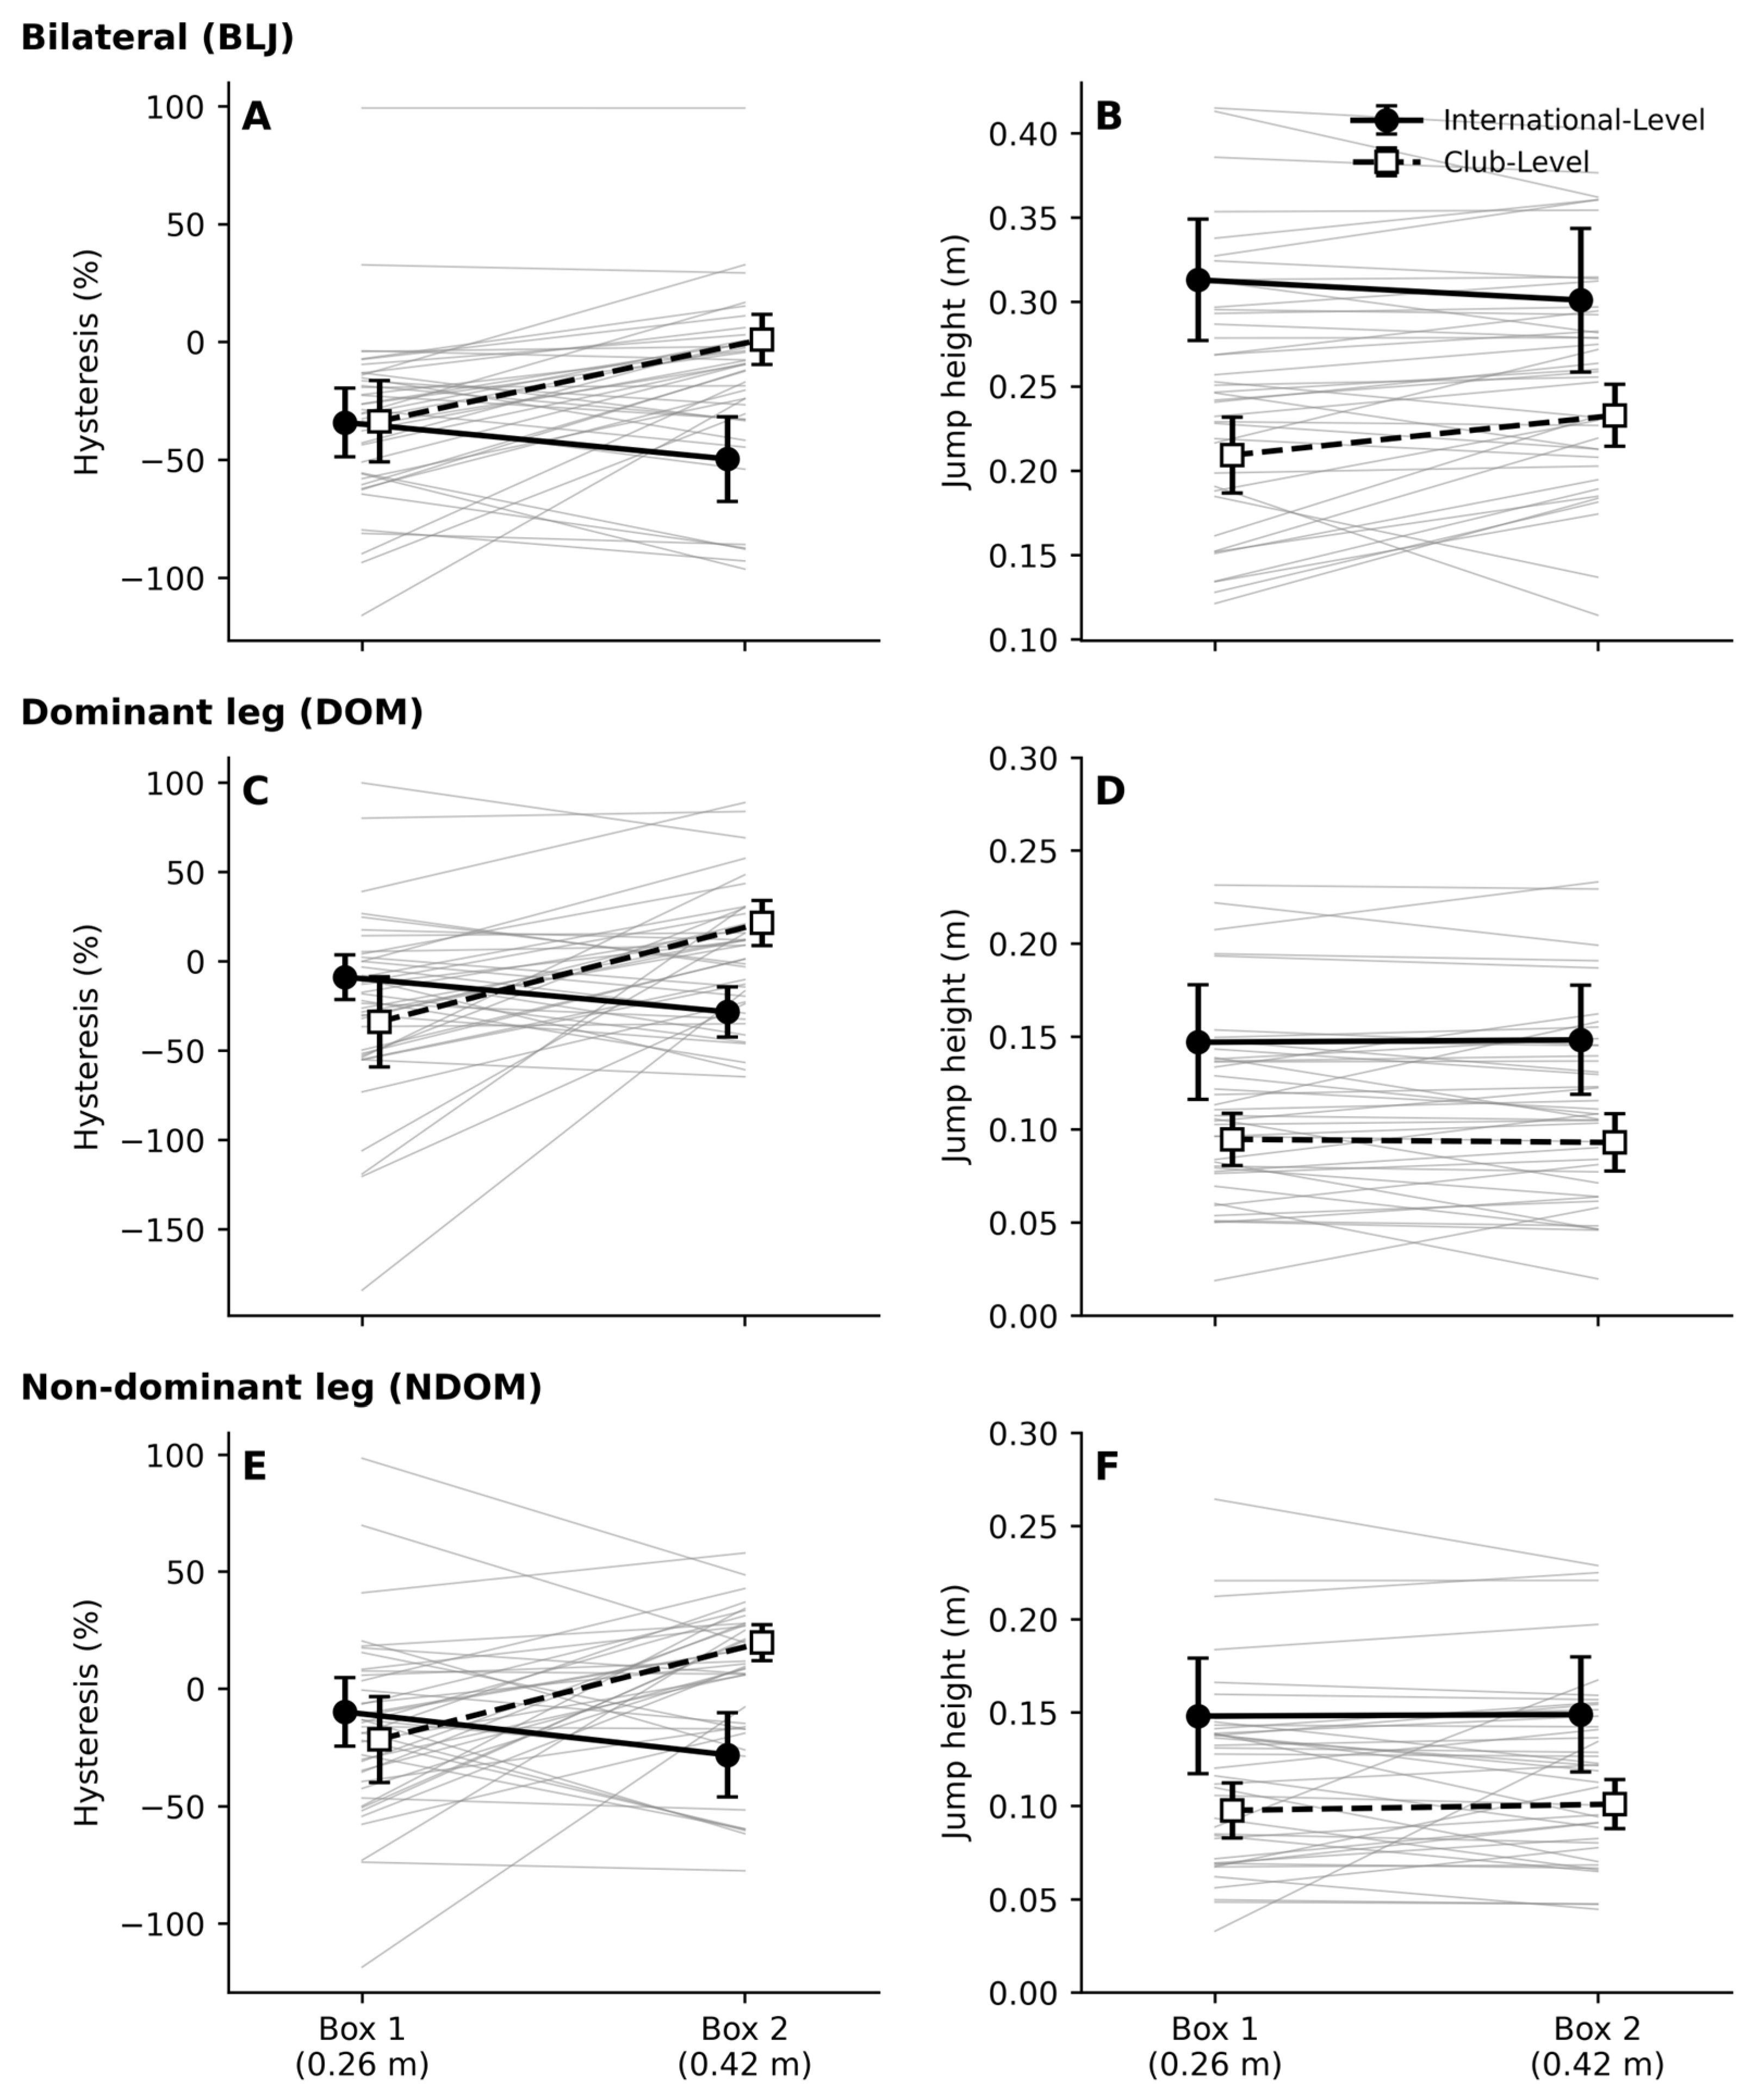
Significant group × box-height interactions were observed for hysteresis in all three conditions: BLJ (F(1,38) = 69.64, p < .001, η2p = 0.647), DOM (F(1,38) = 39.12, p < .001, η2p = 0.507), and NDOM (F(1,38) = 33.23, p < .001, η2p = 0.466). These represent very large interaction effects [22], indicating that the groups responded to increasing box height with qualitatively opposite hysteresis trajectories. For jump height, a significant group × box-height interaction was observed only in the bilateral condition (F(1,38) = 14.48, p < .001, η2p = 0.276). Unilateral jump height was statistically invariant across box heights in both groups (DOM: F(1,38) = 0.21, p = .647; NDOM: F(1,38) = 0.07, p = .788). Full results are presented in Table 4.
Figure 3.
Individual-level trajectories for leg-spring hysteresis (left panels) and jump height (right panels) from Box 1 (0.26 m) to Box 2 (0.42 m). Group means with 95% confidence intervals are overlaid on individual data lines. Upper panels: bilateral (BLJ); middle: dominant-leg (DOM); lower: non-dominant-leg (NDOM). Filled circles and solid lines = International-Level; open squares and dashed lines = Club-Level.
Figure 3.
Individual-level trajectories for leg-spring hysteresis (left panels) and jump height (right panels) from Box 1 (0.26 m) to Box 2 (0.42 m). Group means with 95% confidence intervals are overlaid on individual data lines. Upper panels: bilateral (BLJ); middle: dominant-leg (DOM); lower: non-dominant-leg (NDOM). Filled circles and solid lines = International-Level; open squares and dashed lines = Club-Level.
3.7. Regression Analysis: Prediction of Jump Height from Hysteresis
The regression models are presented in Table 4 (Panel A), and scatterplots are shown in Figure 4. Because the sample spanned the full caliber spectrum, these models were fitted to the pooled cohort (n = 40) and therefore describe the hysteresis–jump-height relationship across, rather than within, performance levels. Fitted to the pooled sample, hysteresis was a significant predictor of jump height in all three conditions at Box 2: BLJ (β = −.714, R2 = 0.510, F(1,38) = 39.50, p < .001), DOM (β = −.688, R2 = 0.474, F(1,38) = 34.18, p < .001), and NDOM (β = −.661, R2 = 0.437, F(1,38) = 29.48, p < .001). The addition of a quadratic hysteresis term significantly improved model fit in the bilateral condition (ΔR2 = 0.092, ΔF(1,37) = 8.52, p = .006; total R2 = 0.601), and the inclusion of leg-spring stiffness as a second predictor yielded R2 = 0.560, with stiffness contributing a small but significant independent effect (β = .225, p = .046); both refinements were likewise estimated on the pooled sample.
Within-group correlations, which isolate the association within a homogeneous caliber stratum, were more modest and condition-dependent (Table 4, Panel B). In the international-level group the relationship was strong for bilateral jumps (r = −0.772, p < .01) but did not reach significance in the non-dominant unilateral condition (r = −0.505, p > .05); in the club-level group the bilateral correlation was non-significant (r = −0.373, p = .066), whereas the dominant and non-dominant correlations were moderate and significant (r = −0.562 and −0.518, respectively, both p < .01). Across the six group × condition cells the within-stratum coefficients corresponded to 14–60% of explained variance, consistently at or below the pooled estimates, indicating that the larger pooled R2 values partly reflect the between-group separation in both hysteresis and jump height rather than a uniformly strong within-athlete dependency.
4. Discussion
This study examined leg spring hysteresis and jump height in international-level track and field athletes and club-level multi-sport athletes across bilateral and unilateral drop-jump conditions from two box heights. Three principal findings were obtained. First, the two groups responded to increasing box heights with qualitatively opposite hysteresis trajectories. Second, these divergent adaptations were reflected in very large group × drop-height interaction effects for hysteresis (η2p = .466–.647), without corresponding interactions for unilateral jump height. Third, hysteresis was a strong predictor of jump height at Box 2 (R2 = 0.44–0.60), with the bilateral condition exhibiting a unique curvilinear relationship.
4.1. Differential Hysteresis Responses as a Marker of SSC Adaptation
The divergent hysteresis trajectories align with the theoretical expectation that international-level athletes possess superior musculotendinous stiffness regulation capacities, allowing them to exploit increased eccentric loading at Box 2 [10,11,25]. Negative hysteresis reflects the superimposition of active muscle force production on the elastic recoil mechanism, requiring precisely coordinated pre-activation and short ground-contact times [14,19]. The 100% SSC enhancement prevalence in international-level athletes during bilateral jumps and the near-complete collapse in club-level athletes at Box 2 (20–64% depending on condition) are consistent with international-level athletes possessing neuromuscular and musculotendinous stiffness profiles that better preserve elastic energy return as drop height increases. This interpretation is consistent with cross-sectional evidence of lower tendon hysteresis in trained versus untrained individuals [8] and extends this evidence base to the whole-limb spring level.
The neuromechanical basis for this international-level advantage likely operates through multiple interdependent pathways. First, the temporal precision of pre-activation is critical: activation of the plantar flexors, quadriceps, and hip extensors before ground contact stiffens the musculotendinous unit prior to impact [26,27]. Second, direct ultrasonographic evidence has established that, in trained athletes, the gastrocnemius fascicles maintain a relatively isometric length during the braking phase while the Achilles tendon undergoes predominant elongation—a functional decoupling termed the catapult mechanism [28,29]. Third, the rapidly increasing eccentric loading rate at impact triggers a short-latency myotatic reflex response whose potentiation in trained athletes augments force production during the early concentric phase [27]. Structural adaptation through chronic loading is further evidenced by low-hysteresis tendons in trained athletes that transfer a greater proportion of stored energy into the propulsive phase [9,30].
4.2. Interaction Effects and the Role of Drop Height as a Diagnostic Load
The absence of a significant group × drop-height interaction for unilateral jump height, despite highly significant interactions for hysteresis under the same conditions, represents an important mechanistic dissociation. Jump height does not fully capture the mechanical quality of the SSC response: international-level athletes achieve higher unilateral jump height regardless of drop height but via qualitatively different mechanical strategies. The Box 1 condition was insufficient to reveal between-group differences in elastic energy management, as the mechanical stimulus did not exceed the adaptive capacity of club-level athletes. Therefore, the Box 2 condition serves as a more diagnostically sensitive loading condition, particularly in unilateral contexts.
These findings are consistent with and extend prior investigations of stiffness and performance across skill levels. Laffaye et al. [16] reported that expert male jumpers exhibited substantially higher leg spring stiffness than recreational controls during submaximal drop-jump conditions. The present study advances this observation by demonstrating that stiffness alone—without concurrent evaluation of the force–length loop area—can obscure a mechanically fundamental distinction: two athletes may display comparable stiffness magnitudes yet differ radically in their capacity to recover stored elastic energy, as indexed by the sign and magnitude of hysteresis. The absence of between-group hysteresis differences at 0.26 m, despite substantial jump height differences (Cohen’s d = 1.14–1.77), parallels observations by Healy et al. [15] that drop heights must be sufficiently demanding to unmask inter-individual differences in reactive-jumping capacity. The 0.42 m condition used here corresponds to a gravitational potential energy approximately 62% greater than the 0.26 m condition, and the resulting eccentric loading impulse appears to exceed the adaptive capacity of club-level musculotendinous systems, unmasking the divergence in hysteresis trajectories [4,11,31].
4.3. Hysteresis as a Predictor of Jump Performance
The pooled associations between hysteresis and jump height (R2 = 0.44–0.60) indicate that energy-return efficiency is mechanically relevant to vertical jump performance across the caliber spectrum sampled here. This pooled estimate should, however, be read with two constraints. First, because performance level separated both hysteresis and jump height, the pooled coefficients incorporate between-group (caliber) variance; the within-stratum associations were more modest and condition-dependent (|r| = 0.37–0.77; 14–60% of variance), so the relationship is better characterised as moderate within a given caliber level and amplified when athletes spanning the performance range are pooled. Second, hysteresis and jump height were both derived from the kinematics and kinetics of the same trials, so the association is partly one of shared mechanical origin rather than prediction of an independent outcome, and the present cross-sectional design cannot establish that altering hysteresis would change jump height. With these caveats, the unstandardised slopes (B ≈ −0.00094 to −0.00127) translate to approximately a 0.9–1.3 mm change in jump height per percentage-point change in hysteresis. The curvilinear improvement in the bilateral model (ΔR2 = 0.092, p = .006) and the small but significant stiffness contribution (β = 0.225, p = .046), both estimated on the pooled sample, suggest a nonlinear bilateral force–length relationship and confirm that stiffness and hysteresis capture partially distinct variance.
4.4. Bilateral–Unilateral Asymmetry in Hysteresis
The bilateral condition exhibited substantially larger η2p values for both the group × drop-height interaction (η2p = 0.647) and jump height interaction (η2p = 0.276) than the unilateral conditions. Under bilateral loading, the total eccentric impulse is shared between both lower extremities, effectively halving the per-limb mechanical demand relative to the unilateral case [32]. This load-sharing configuration likely provides a more favorable mechanical environment for SSC enhancement, explaining why even club-level athletes maintained relatively higher SSC enhancement prevalence in bilateral conditions at Box 2 (64%) compared with the near-complete collapse under unilateral high-load conditions (DOM: 20%; NDOM: 12%). The dissociation between the significant bilateral jump height interaction and the absence of significant unilateral jump height interactions, despite highly significant unilateral hysteresis interactions, reveals that scalar performance metrics can be preserved through compensatory joint-level strategies even when the global elastic energy-return mechanism is compromised [5]. International-level athletes appear to achieve superior unilateral jump height via a mechanically efficient elastic mechanism, whereas club-level athletes at high unilateral loads may rely more heavily on rate-of-force development and impulse duration. This pattern is tentatively consistent with the bilateral deficit phenomenon documented in power athletes [33], although the mechanistic relevance of this concept to reactive-jumping hysteresis requires direct empirical verification.
4.5. Limitations
The principal limitation is that athletic caliber was structurally confounded with both sport discipline and biological gender. The international-level group consisted exclusively of track-and-field athletes, whereas the club-level group was predominantly composed of ball-sport athletes (only 2 of 25 were track-and-field competitors); the groups also differed in gender composition (10 M/5 F versus 10 M/15 F). Because discipline and gender were nested within group, neither could be statistically adjusted for — an analysis of covariance cannot isolate the effect of caliber from a factor that does not vary within the comparison groups. Consequently, the present data cannot determine whether the divergent hysteresis trajectories reflect performance caliber per se, the long-term mechanical specialisation of track-and-field training, gender-related differences in musculotendinous hysteresis, or some combination of these. Two observations bound this ambiguity without resolving it: the negative-hysteresis signature was present across mechanically dissimilar track-and-field disciplines within the elite group (Section 3.4), and the group effect was robust to adjustment for the one confounder that did vary within groups, namely chronological age. Definitive separation of caliber, discipline, and gender requires replication in discipline-matched and gender-balanced cohorts. Additional limitations include the constrained and unequal sample size (n = 40; 15 versus 25), the forefoot-landing instruction that constrains natural foot-strike patterns, the bilateral midpoint HJC approximation that assumes symmetrical limb loading, and the use of absolute rather than stature- or leg-length-normalised drop heights.
4.6. Practical Implications
Leg spring hysteresis constitutes a sensitive biomechanical marker for differentiating international-level from club-level reactive jumping capacity. Practitioners should consider incorporating multi-height bilateral and unilateral drop-jump assessments into performance profiling batteries, as a single 0.26 m drop height is insufficient to reveal the full spectrum of differences in elastic energy management. The finding that 80–88% of club-level athletes failed to achieve SSC enhancement in unilateral conditions at 0.42 m identifies elastic energy return efficiency as a specific adaptive target for plyometric training interventions. Systematic escalation of unilateral drop-jump loading should be introduced only after an athlete demonstrates sustained negative hysteresis under bilateral conditions. In laboratory settings where force platforms are available, real-time display of the force–length loop represents a promising biofeedback modality for operationalizing the elastic energy return objective.
5. Conclusions
This study demonstrated that international-level track and field athletes and club-level multi-sport athletes diverge fundamentally in their leg spring hysteresis responses to increasing box heights: international-level athletes exploit elevated box heights through progressively enhanced elastic energy return (increasingly negative hysteresis), whereas club-level athletes respond with net mechanical energy dissipation at Box 2. These qualitatively distinct responses were captured by very large group × drop-height interactions for hysteresis across bilateral and unilateral conditions (η2p = 0.466–0.647) and were not apparent at 0.26 m, confirming that a mechanically demanding eccentric loading threshold is necessary to unmask between-group differences in elastic energy management capacity. The near-universal prevalence of SSC enhancement in international-level athletes under bilateral loading (100%) and its collapse in the majority of club-level athletes under unilateral high-load conditions (DOM: 20%; NDOM: 12%) identifies a fundamental single-limb musculotendinous capacity threshold that bilateral testing alone cannot reveal. Notably, a significant group × drop-height interaction for jump height emerged only in the bilateral condition, indicating that scalar performance metrics may be preserved through compensatory mechanical strategies even when the elastic energy-return mechanism is compromised. Pooled across the sampled caliber range, hysteresis accounted for 44–60% of the variance in jump height at 0.42 m, with leg-spring stiffness contributing small additional independent variance in the bilateral model; within a single caliber stratum this association was more modest and condition-dependent. These findings suggest that the integration of multi-height, bilateral, and unilateral force–length loop analysis into biomechanical performance screening may offer meaningful diagnostic sensitivity beyond conventional jump height metrics.
Author Contributions
Conceptualization, Ö.K., M.Y.K and A.A.; methodology, Ö.K. and M.Y.K.; software, M.Y.K.; validation, Ö.K., M.Y.K. and B.K.; formal analysis, M.Y.K.; investigation, Ö.K. and B.K.; resources, Ö.K.; data curation, writing-original draft preparation, Ö.K.; writing-review and editing, Ö.K., M.Y.K., B.K., and A.A.; visualization; A.A.; supervision, project administration, Ö.K. All authors have read and agreed to the published version of the manuscript.
Funding
This research received no external funding.
Institutional Review Board Statement
The study was conducted in accordance with the Declaration of Helsinki, and approved by the Non-Interventional Clinical Research Ethics Committee of [Institution name] (Approval No. 232; date: 30 November 2022).
Informed Consent Statement
Informed consent was obtained from all subjects involved in the study.
Data Availability Statement
The data presented in this study are available on request from the corresponding author. The data are not publicly available due to privacy restrictions.
Conflicts of Interest
The authors declare no conflicts of interest.
References
- Blickhan, R. The spring-mass model for running and hopping. Journal of Biomechanics 1989, 22, 1217–1227. [Google Scholar] [CrossRef] [PubMed]
- McMahon, T.A.; Cheng, G.C. The mechanics of running: How does stiffness couple with speed? Journal of Biomechanics 1990, 23 (Suppl. 1), 65–78. [Google Scholar] [CrossRef] [PubMed]
- Rogers, S.A.; Whatman, C.S.; Pearson, S.N.; Kilding, A.E. Assessments of mechanical stiffness and relationships to performance determinants in middle-distance runners. International Journal of Sports Physiology and Performance 2017, 12, 1329–1334. [Google Scholar] [CrossRef] [PubMed]
- Arampatzis, A.; Brüggemann, G.P.; Metzler, V. The effect of speed on leg stiffness and joint kinetics during human running. Journal of Biomechanics 1999, 32, 1349–1353. [Google Scholar] [CrossRef]
- Maloney, S.J.; Fletcher, I.M. Lower limb stiffness testing in athletic performance: A critical review. Sports Biomechanics 2021, 20, 109–130. [Google Scholar] [CrossRef] [PubMed]
- Ker, R.F. Dynamic tensile properties of the plantaris tendon of sheep (Ovis aries). Journal of Experimental Biology 1981, 93, 283–302. [Google Scholar] [CrossRef] [PubMed]
- Cavagna, G.A.; Dusman, B.; Margaria, R. Positive work done by a previously stretched muscle. Journal of Applied Physiology 1968, 24, 21–32. [Google Scholar] [CrossRef] [PubMed]
- Maganaris, C.N.; Paul, J.P. Tensile properties of the in vivo human gastrocnemius tendon. Journal of Biomechanics 2002, 35, 1639–1646. [Google Scholar] [CrossRef] [PubMed]
- Kubo, K.; Ikebukuro, T.; Yata, H. Effects of plyometric training on muscle–tendon mechanical properties and behavior of fascicles during jumping. Physiological Reports 2021, 9, e15073. [Google Scholar] [CrossRef] [PubMed]
- Arampatzis, A.; Schade, F.; Walsh, M.; Brüggemann, G.P. Influence of leg stiffness and its effect on myodynamic jumping performance. Journal of Electromyography and Kinesiology 2001, 11, 355–364. [Google Scholar] [CrossRef] [PubMed]
- Struzik, A. Measuring Leg Stiffness During Vertical Jumps: Theory and Methods; Springer: Cham, Switzerland, 2019. [Google Scholar] [CrossRef]
- Komi, P.V. Physiological and biomechanical correlates of muscle function: Effects of muscle structure and stretch-shortening cycle on force and speed. Exercise and Sport Sciences Reviews 1984, 12, 81–121. [Google Scholar] [CrossRef] [PubMed]
- Bosco, C.; Komi, P.V. Potentiation of the mechanical behavior of the human skeletal muscle through prestretching. Acta Physiologica Scandinavica 1979, 106, 467–472. [Google Scholar] [CrossRef] [PubMed]
- Kuitunen, S.; Komi, P.V.; Kyröläinen, H. Knee and ankle joint stiffness in sprint running. Medicine & Science in Sports & Exercise 2002, 34, 166–173. [Google Scholar] [CrossRef] [PubMed]
- Healy, R.; Kenny, I.C.; Harrison, A.J. Reactive strength index: A poor indicator of reactive strength? International Journal of Sports Physiology and Performance 2018, 13, 802–809. [Google Scholar] [CrossRef] [PubMed]
- Laffaye, G.; Bardy, B.G.; Durey, A. Leg stiffness and expertise in men jumping. Medicine & Science in Sports & Exercise 2005, 37, 536–543. [Google Scholar] [CrossRef]
- Jarvis, P.; Turner, A.; Read, P.J.; Bishop, C. Reactive strength index and its associations with measures of physical and sports performance: A systematic review with meta-analysis. Sports Medicine 2022, 52, 301–330. [Google Scholar] [CrossRef] [PubMed]
- Ramirez-Campillo, R.; Thapa, R.K.; Afonso, J.; Perez-Castilla, A.; Bishop, C.; Byrne, P.J.; Granacher, U. Effects of plyometric jump training on the reactive strength index in healthy individuals across the lifespan: A systematic review with meta-analysis. Sports Medicine 2023, 53, 1029–1053. [Google Scholar] [CrossRef] [PubMed]
- Farris, D.J.; Sawicki, G.S. The mechanics and energetics of human walking and running: A joint level perspective. Journal of the Royal Society Interface 2012, 9, 110–118. [Google Scholar] [CrossRef] [PubMed]
- Urbaniak, G.C.; Plous, S. Research Randomizer (Version 4.0) [Computer software]. Retrieved 17 June 2024. Available online: http://www.randomizer.org.
- Bell, A.L.; Brand, R.A.; Pedersen, D.R. Prediction of hip joint centre location from external landmarks. Human Movement Science 1990, 9, 257–273. [Google Scholar] [CrossRef]
- Cohen, J. Statistical Power Analysis for the Behavioral Sciences, 2nd ed.; Lawrence Erlbaum Associates: Hillsdale, NJ, USA, 1988. [Google Scholar]
- Koo, T.K.; Li, M.Y. A guideline of selecting and reporting intraclass correlation coefficients for reliability research. Journal of Chiropractic Medicine 2016, 15, 155–163. [Google Scholar] [CrossRef] [PubMed]
- Faul, F.; Erdfelder, E.; Lang, A.-G.; Buchner, A. G*Power 3: A flexible statistical power analysis program for the social, behavioral, and biomedical sciences. Behavior Research Methods 2007, 39, 175–191. [Google Scholar] [CrossRef] [PubMed]
- Komi, P.V. (Ed.) Strength and Power in Sport, 2nd ed.; Blackwell Publishing: Oxford, UK, 2003. [Google Scholar]
- Gollhofer, A.; Strojnik, V.; Rapp, W.; Schweizer, L. Behaviour of triceps surae muscle-tendon complex in different jump conditions. European Journal of Applied Physiology and Occupational Physiology 1992, 64, 283–291. [Google Scholar] [CrossRef] [PubMed]
- Avela, J.; Komi, P.V. Reduced stretch reflex sensitivity and muscle stiffness after exhausting stretch-shortening cycle (SSC) exercise. European Journal of Applied Physiology and Occupational Physiology 1998, 78, 403–410. [Google Scholar] [CrossRef] [PubMed]
- Kurokawa, S.; Fukunaga, T.; Fukashiro, S. Behavior of fascicles and tendinous structures of human gastrocnemius during vertical jumping. Journal of Applied Physiology 2001, 90, 1349–1358. [Google Scholar] [CrossRef] [PubMed]
- Kawakami, Y.; Muraoka, T.; Ito, S.; Kanehisa, H.; Fukunaga, T. In vivo muscle fibre behaviour during counter-movement exercise in humans reveals a significant role for tendon elasticity. Journal of Physiology 2002, 540, 635–646. [Google Scholar] [CrossRef] [PubMed]
- Wiesinger, H.-P.; Rieder, F.; Kösters, A.; Müller, E.; Seynnes, O.R. Sport-specific capacity to use elastic energy in the patellar and Achilles tendons of elite athletes. Frontiers in Physiology 2017, 8, 132. [Google Scholar] [CrossRef] [PubMed]
- Wilson, G.J.; Wood, G.A.; Elliott, B.C. Optimal stiffness of series elastic component in a stretch-shorten cycle activity. Journal of Applied Physiology 1991, 70, 825–833. [Google Scholar] [CrossRef] [PubMed]
- Howard, J.D.; Enoka, R.M. Maximum bilateral contractions are modified by neurally mediated interlimb effects. Journal of Applied Physiology 1991, 70, 306–316. [Google Scholar] [CrossRef] [PubMed]
- Pain, M.T.G.; Young, F.; Kim, J.; Forrester, S.E. Considerations for single and double leg drop jumps: Bilateral deficit, standardizing drop height, and equalizing training load. Journal of Applied Biomechanics 2014, 30, 722–730. [Google Scholar] [CrossRef]
Figure 1.
Schematic of the leg-spring force–length loop and the hysteresis sign convention. Vertical ground reaction force is plotted against leg compression during ground contact; the solid curve denotes the loading (braking) branch and the dashed curve the unloading (propulsion) branch, with arrows indicating the direction of loop traversal. The shaded region is the energy absorbed during loading (A_ascending). (a) When the unloading branch lies below the loading branch (A_ascending > A_descending), the loop is traversed clockwise, less energy is returned than absorbed, and hysteresis is positive (net dissipation). (b) When concentric muscle work raises the unloading branch above the loading branch (A_ascending < A_descending), the loop is traversed counter-clockwise, more mechanical energy is returned than absorbed, and hysteresis is negative (net energy amplification). Hysteresis (%) = (A_loop/A_ascending) × 100, with A_loop = A_ascending − A_descending. Curves are illustrative and not drawn from measured data.
Figure 1.
Schematic of the leg-spring force–length loop and the hysteresis sign convention. Vertical ground reaction force is plotted against leg compression during ground contact; the solid curve denotes the loading (braking) branch and the dashed curve the unloading (propulsion) branch, with arrows indicating the direction of loop traversal. The shaded region is the energy absorbed during loading (A_ascending). (a) When the unloading branch lies below the loading branch (A_ascending > A_descending), the loop is traversed clockwise, less energy is returned than absorbed, and hysteresis is positive (net dissipation). (b) When concentric muscle work raises the unloading branch above the loading branch (A_ascending < A_descending), the loop is traversed counter-clockwise, more mechanical energy is returned than absorbed, and hysteresis is negative (net energy amplification). Hysteresis (%) = (A_loop/A_ascending) × 100, with A_loop = A_ascending − A_descending. Curves are illustrative and not drawn from measured data.
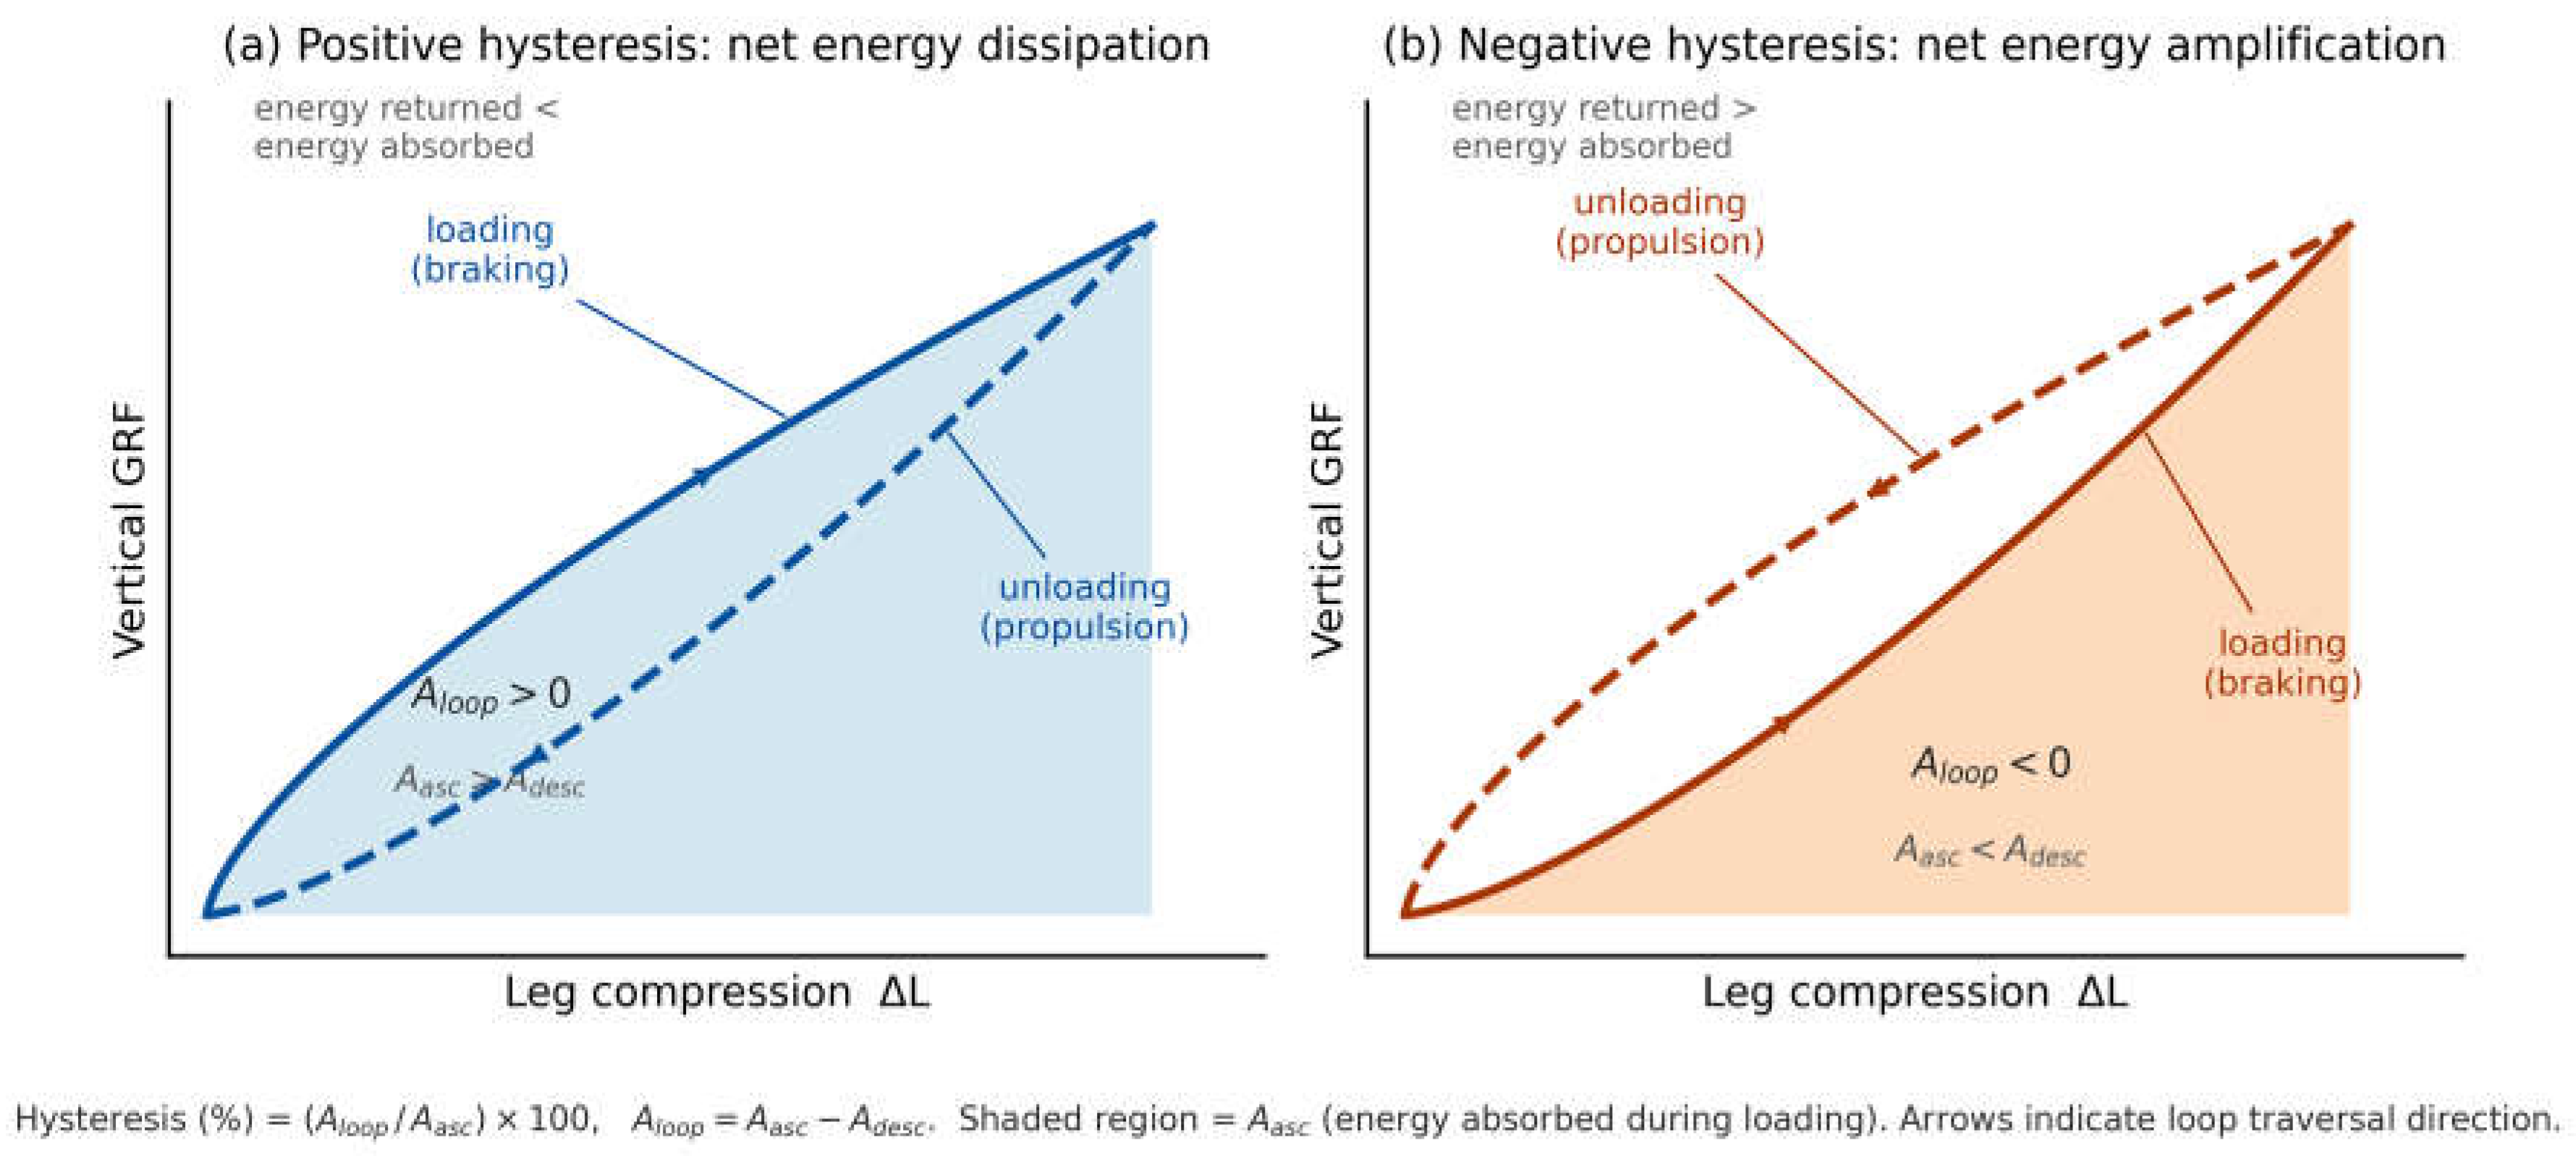
Figure 4.
Scatterplots of jump height as a function of leg-spring hysteresis at Box 2 (0.42 m) for (a) bilateral (BLJ), (b) dominant-leg (DOM), and (c) non-dominant-leg (NDOM) drop jumps. International-level athletes are represented by filled circles; club-level athletes by open squares. Linear (dashed line) and quadratic (solid line; panel a only) regression fits are shown for the full sample. Pearson r, linear R2, and quadratic R2 (panel a) are reported in inset boxes. ***p < .001 for all regression coefficients.
Figure 4.
Scatterplots of jump height as a function of leg-spring hysteresis at Box 2 (0.42 m) for (a) bilateral (BLJ), (b) dominant-leg (DOM), and (c) non-dominant-leg (NDOM) drop jumps. International-level athletes are represented by filled circles; club-level athletes by open squares. Linear (dashed line) and quadratic (solid line; panel a only) regression fits are shown for the full sample. Pearson r, linear R2, and quadratic R2 (panel a) are reported in inset boxes. ***p < .001 for all regression coefficients.
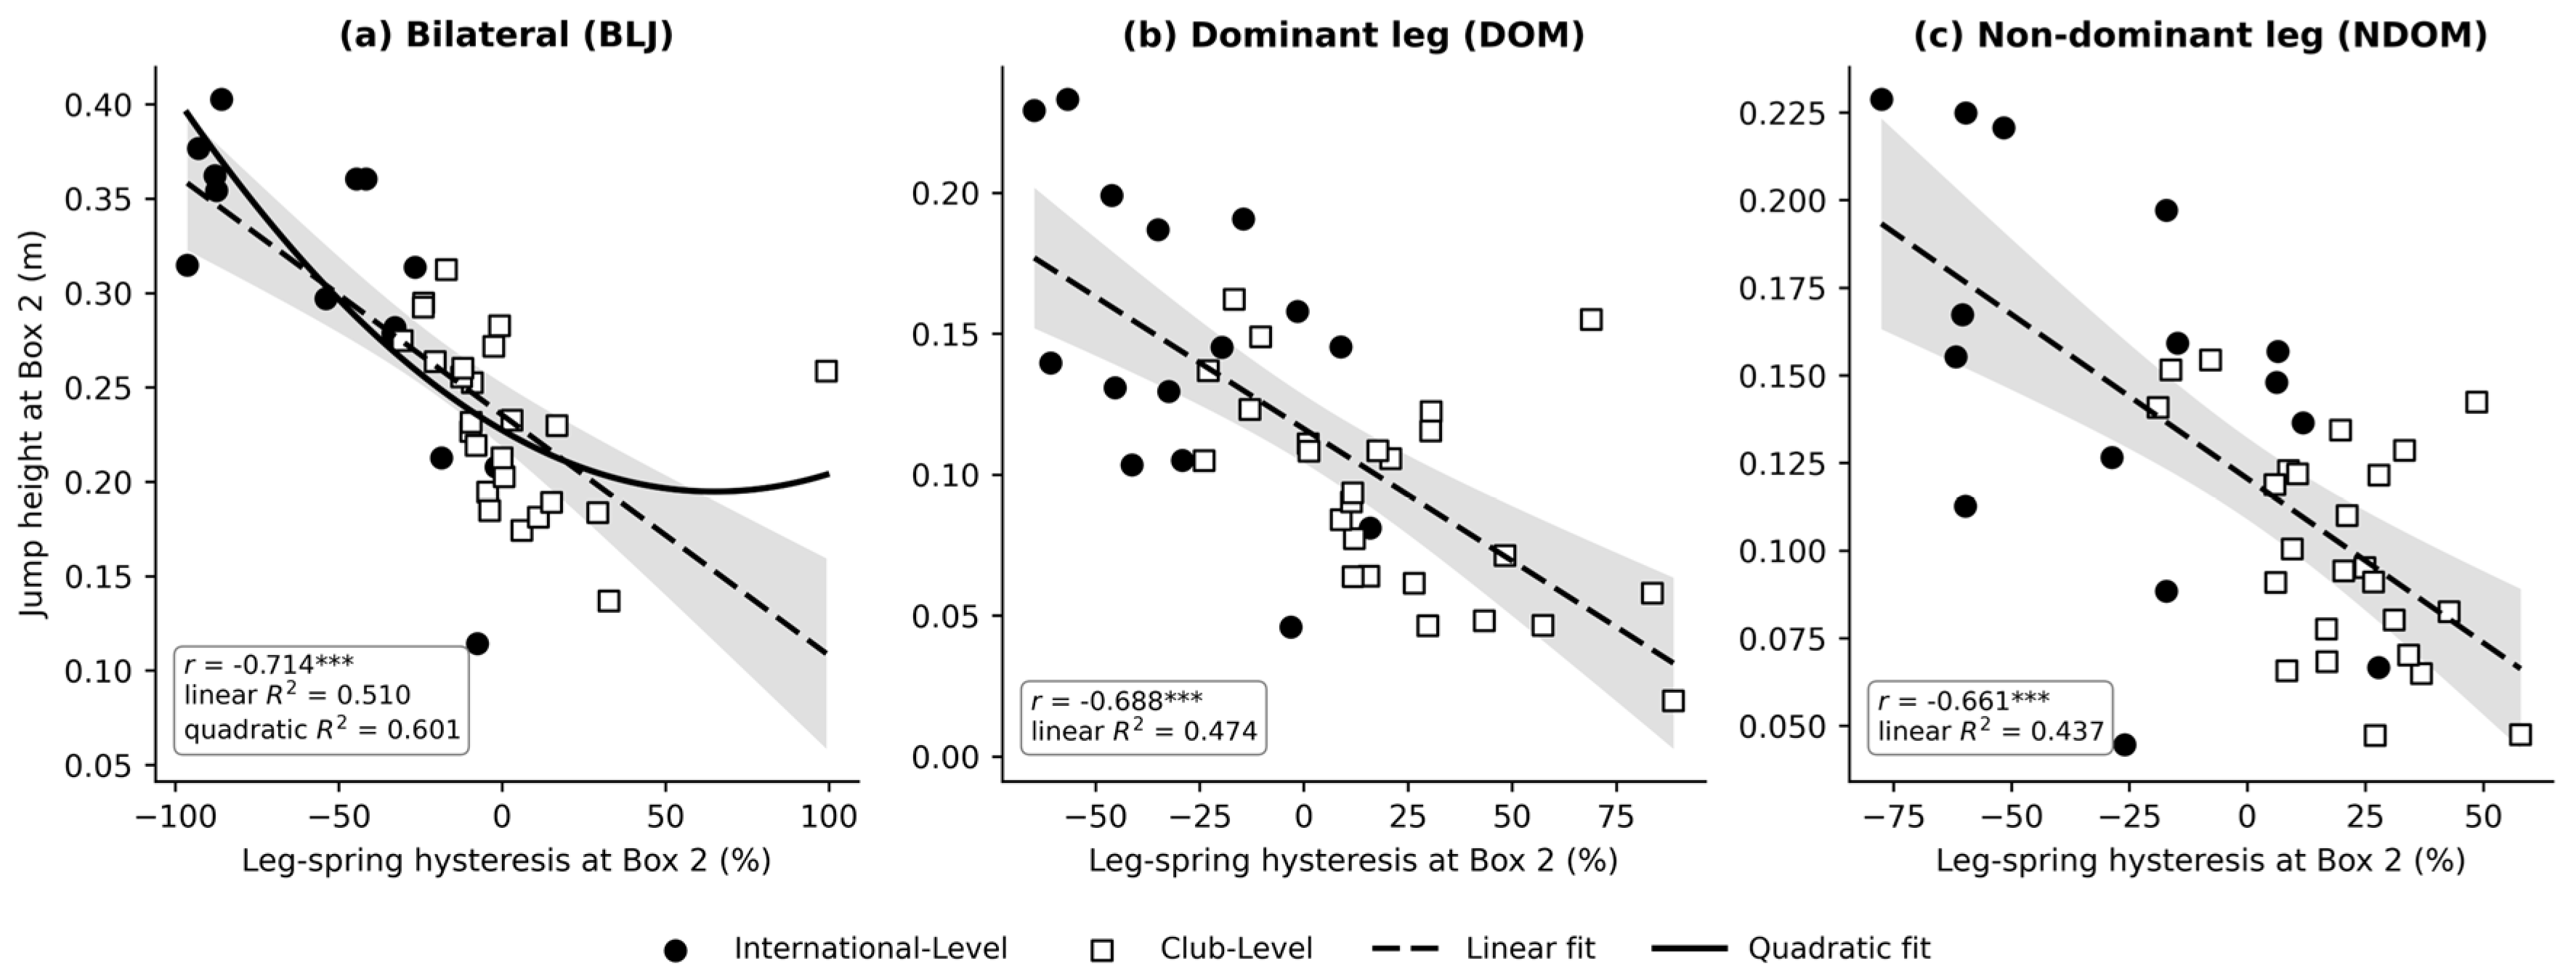
Table 1.
Demographic and anthropometric characteristics by group.
| Variable | Total (n = 40) | International-Level (n = 15) | Club-Level (n = 25) | Test Statistic | p |
|---|---|---|---|---|---|
| Age (years) | 22.1 ± 2.6 | 23.9 ± 2.4 | 21.0 ± 2.1 | U = 314.0 | < .001 |
| Height (cm) | 180.3 ± 10.7 | 180.9 ± 9.7 | 180.0 ± 11.4 | t(33.4) = 0.27 | .792 |
| Body mass (kg) | 74.7 ± 15.9 | 75.1 ± 15.9 | 74.5 ± 16.1 | U = 195.0 | .845 |
| BMI (kg/m2) | 22.8 ± 3.5 | 22.7 ± 2.8 | 22.9 ± 3.8 | U = 198.0 | .780 |
| Gender (M/F) | 20/20 | 10/5 | 10/15 | χ2(1) = 1.71 | .191 |
Note. Values are M ± SD unless otherwise noted. Test choice was guided by Shapiro–Wilk normality: independent-samples t-test was used when both groups satisfied normality (height); the Mann–Whitney U test was used when at least one group violated normality (age, body mass, BMI). Gender distribution was tested with Pearson’s chi-square. BMI = body mass index.
Table 3.
Descriptive statistics and between-group comparisons of hysteresis and jump height by condition and drop height.
Table 3.
Descriptive statistics and between-group comparisons of hysteresis and jump height by condition and drop height.
| Condition | Hysteresis (%) | Jump Height (m) | ||||||||
|---|---|---|---|---|---|---|---|---|---|---|
| International-Level M±SD | Club-Level M±SD | Test Stat. | p | d | International-Level M±SD | Club-Level M±SD | Test Stat. | p | d | |
| BLJ_0.26 m | −34.19 ± 26.36 | −33.66 ± 41.87 | U = 205.0 | .635 | −0.01 | 0.313 ± 0.065 | 0.209 ± 0.055 | t(25.8) = 5.18 | < .001 | 1.77 |
| BLJ_0.42 m | −49.67 ± 32.44 | 1.00 ± 25.74 | U = 30.0 | < .001 | −1.78 | 0.301 ± 0.077 | 0.233 ± 0.045 | t(19.8) = 3.12 | .005 | 1.17 |
| DOM_0.26 m | −8.96 ± 22.66 | −33.97 ± 61.07 | t(33.3) = 1.85 | .074 | 0.50 | 0.147 ± 0.056 | 0.095 ± 0.034 | t(20.3) = 3.25 | .004 | 1.21 |
| DOM_0.42 m | −28.37 ± 25.31 | 21.35 ± 30.61 | t(34.1) = −5.55 | < .001 | −1.73 | 0.148 ± 0.053 | 0.093 ± 0.037 | t(22.3) = 3.54 | .002 | 1.26 |
| NDOM_0.26 m | −9.85 ± 26.45 | −21.57 ± 44.35 | t(38.0) = 1.05 | .302 | 0.30 | 0.148 ± 0.056 | 0.098 ± 0.036 | t(21.0) = 3.10 | .005 | 1.14 |
| NDOM_0.42 m | −28.15 ± 32.40 | 19.72 ± 18.50 | t(19.6) = −5.23 | < .001 | −1.95 | 0.149 ± 0.056 | 0.101 ± 0.032 | t(19.6) = 3.04 | .007 | 1.14 |
Note. Values are M ± SD. n = 15 (International-Level) and n = 25 (Club-Level) for all cells. BLJ = bilateral drop jump; DOM = dominant-leg drop jump; NDOM = non-dominant-leg drop jump. The Mann–Whitney U test was used for BLJ hysteresis comparisons due to violations of normality (Shapiro–Wilk p < .05) in the club-level group (see Supplementary Table S1); independent-samples t-tests were used for all other comparisons. Cohen’s d was computed using the pooled SD; |d| ≥ 0.80 represents a large effect (Cohen, 1988). Negative d for hysteresis = more negative hysteresis (greater SSC enhancement) in the international-level group. Negative hysteresis = net active energy contribution during the concentric phase (SSC enhancement); positive = net energy dissipation.
Table 4.
Regression modelling of jump height and group × drop-height mixed ANOVA results.
| Panel A. Regression models predicting jump height from hysteresis at 0.42 m (n = 40) | ||||||||||||||
| Condition | Predictor | B ± SE(B) | β | ΔR2 | R2 | F | p | |||||||
| Linear model | ||||||||||||||
| BLJ | Hysteresis | −0.00127 ± 0.00020 | −.714 | — | .510 | 39.50 | < .001 | |||||||
| DOM | Hysteresis | −0.00094 ± 0.00016 | −.688 | — | .474 | 34.18 | < .001 | |||||||
| NDOM | Hysteresis | −0.00094 ± 0.00017 | −.661 | — | .437 | 29.48 | < .001 | |||||||
| Quadratic model (BLJ only) | ||||||||||||||
| BLJ | Hys; Hys2 | Hys: −0.00100; Hys2: 7.69×10⁻⁶ | — | .092 | .601 | 27.92 (model) | < .001 | |||||||
| Multiple model: Hysteresis + Stiffness | ||||||||||||||
| BLJ | Hysteresis | −0.00126 ± 0.00020 | −.706 | .560 | 23.57 | < .001 | ||||||||
| Stiffness (k) | 0.00137 ± 0.00066 | .225 | .046 | |||||||||||
| DOM | Hysteresis | −0.00087 ± 0.00017 | −.635 | .491 | 17.84 | < .001 | ||||||||
| Stiffness (k) | 0.00093 ± 0.00083 | .142 | .268 | |||||||||||
| NDOM | Hysteresis | −0.00092 ± 0.00019 | −.648 | .438 | 14.43 | < .001 | ||||||||
| Stiffness (k) | 0.00022 ± 0.00074 | .039 | .766 | |||||||||||
| Panel B. 2 × 2 mixed ANOVA (group × drop height) and within-group correlations at 0.42 m | ||||||||||||||
| Condition/DV | Group Main Effect | Drop Main Effect | Group × Drop Interaction | Within-Group r at 0.42 m | ||||||||||
| F | p | η2p | F | p | η2p | F | p | η2p | International-Level | Club-Level | ||||
| BLJ – Hysteresis (%) | 6.14 | .018 | .139 | 29.73 | < .001 | .439 | 69.64 | < .001 | .647 | −.772** | −.373 | |||
| BLJ – Jump Height (m) | 21.52 | < .001 | .362 | 5.11 | .030 | .119 | 14.48 | < .001 | .276 | — | — | |||
| DOM – Hysteresis (%) | 1.06 | .310 | .027 | 22.27 | < .001 | .369 | 39.12 | < .001 | .507 | −.537* | −.562** | |||
| DOM – Jump Height (m) | 15.06 | < .001 | .284 | 0.03 | .854 | .001 | 0.21 | .647 | .006 | — | — | |||
| NDOM – Hysteresis (%) | 3.82 | .058 | .091 | 14.32 | < .001 | .274 | 33.23 | < .001 | .466 | −.505 | −.518** | |||
| NDOM – Jump Height (m) | 13.62 | < .001 | .264 | 0.29 | .595 | .008 | 0.07 | .788 | .002 | — | — | |||
Note. Panel A: B = unstandardised regression coefficient; SE(B) = standard error of B; β = standardised regression coefficient; ΔR2 = change in R-squared. For the quadratic BLJ model, the F value (27.92) represents the overall model F with df = (2, 37); the incremental F-change for the quadratic term is F-change(1, 37) = 8.52, p = .006. Quadratic term not significant in DOM (p = .124) or NDOM (p = .610). Multiple-model F has (2, 37) df. VIF < 1.20 in all models. Panel B: All F statistics have (1, 38) df. η2p = partial eta-squared; η2p ≥ .01 small, ≥ .06 medium, ≥ .14 large (Cohen, 1988). Within-group r = Pearson correlation between hysteresis and jump height at 0.42 m, reported on hysteresis rows only. *p < .05; **p < .01.
Disclaimer/Publisher’s Note: The statements, opinions and data contained in all publications are solely those of the individual author(s) and contributor(s) and not of MDPI and/or the editor(s). MDPI and/or the editor(s) disclaim responsibility for any injury to people or property resulting from any ideas, methods, instructions or products referred to in the content. |
© 2026 by the authors. Licensee MDPI, Basel, Switzerland. This article is an open access article distributed under the terms and conditions of the Creative Commons Attribution (CC BY) license (http://creativecommons.org/licenses/by/4.0/).
Copyright: This open access article is published under a Creative Commons CC BY 4.0 license, which permit the free download, distribution, and reuse, provided that the author and preprint are cited in any reuse.


