

Submitted:
26 June 2026
Posted:
30 June 2026
You are already at the latest version
Abstract
Electroencephalographic (EEG) recordings simultaneously contain information about neurophysiological dynamics and subject-specific characteristics. While this duality may enable biomarker discovery and individual identification, it also raises concerns that machine-learning models may achieve high predictive performance by exploiting subject identity rather than physiologically relevant information. In this study, we investigated whether generalized weighted ordinal patterns (GWOP), a statistical-complexity representation incorporating both temporal ordering and amplitude fluctuations, support sleep-stage classification while minimizing identity-related confounding. Sleep EEG recordings from 31 healthy subjects segmented into 30-second epochs and represented using 3,150 GWOP features derived from multiple embedding dimensions, time delays, and entropic indices. XGBoost classifiers were evaluated under intra-subject and inter-subject validation schemes to quantify the impact of EEG fingerprinting on sleep-stage classification performance. An additional subject-identification analysis was conducted using the same feature representation. Sleep-stage classification generalized well to previously unseen subjects, with accuracy decreasing only from 79.2% to 75.8% between intra-subject and inter-subject evaluations. Feature-importance analysis using SHAP revealed an almost perfect correspondence between the features driving classification in both validation schemes (Spearman ρ = 0.998), indicating minimal reliance on subject-specific information. In contrast, GWOP features also supported subject identification with 63.9% accuracy across the 31 individuals, demonstrating that GWOP preserve substantial fingerprinting information. The most informative features for subject identification showed little overlap with those governing sleep-stage classification, suggesting a partial separation between identity-related and biomarker-related information within the same feature space. These findings suggest that EEG fingerprinting and biomarker extraction are not necessarily competing objectives and support GWOP-based statistical-complexity measures as a promising framework for robust, generalizable sleep EEG analysis and precision-neuroscience applications.
Keywords:
electroencelography (EEG)
; sleep stage classification
; statistical complexity
; fingerprinting
; identity confounding
1. Introduction
Predictive analysis applies multivariate statistical models and machine learning (ML) to leverage information from feature sets with the purpose of forecasting unknown, prognostically valuable outcomes. This methodological approach gained prominence in biomedical research, where a recent influx of research results is showing its potential to yield biomarkers capable of impacting both clinical practice and public health. Electroencephalography (EEG) —a widely utilized technique for characterizing neural activity— constitutes a particular focal point of extensive investigation aimed at identifying specific biomarkers associated with neurological and psychiatric disorders. A salient challenge in these investigations is an adequate identification and quantification of underlying confounding biases that may arise [1]. This is specially the case in EEG signals, where highly individualized patterns of brain activity are sufficiently stable to enable subject identification across recording sessions, a phenomenon known as EEG fingerprinting [2]. These subject-specific signatures may arise from a combination of anatomical, physiological, and functional factors, including stable oscillatory profiles, connectivity patterns, and large-scale network dynamics [3]. The existence of such information offers valuable opportunities for personalized medicine and longitudinal monitoring. However, it also introduces methodological challenges in finding adequate biomarkers in EEG research, specifically if these are sought after using machine learning techniques. In particular, strong individual components present in EEG recordings can give rise to identity confounding, a form of data leakage in which predictive models inadvertently learn subject-specific rather than disease-related features [4]. This issue is especially relevant in studies where inadequate train-test partitioning may allow information pertaining to the same individual to appear in both datasets. Under these conditions, models can achieve inflated classification performance in using stable personal characteristics that may be unrelated to the actual pathology under investigation.
Conceptually, fingerprinting and identity confounding represent two manifestations of the same underlying property, that is, the presence of robust subject-related information in the EEG signal [5]. As such, this may be either advantageous or problematic depending on the specific task at hand. Whereas fingerprinting explicitly seeks to quantify and leverage this information, identity confounding becomes problematic when the goal is to detect pathological, physiological, or behavioral biomarkers that generalize across individuals [6]. Consequently, rigorous subject-wise validation procedures have become essential to warrant that reported classification performance reflects genuinely generalized disease-specific features rather than subject-based recognition. This consideration is particularly critical in the study of sleep disorders, where individual variability present in overnight EEG activity recording sessions can be substantial and may exceed the magnitude of pathology-related effects [7,8,9]. In these situations, the use of parts of the same session in the train-test split potentially compromises the generalizability and reproducibility of the results [4,10].
From the brain sciences standpoint, however, there is an intriguing possibility that some biomarkers are expressed through the fingerprint itself [11]. For example, a neurodegenerative disorder may not simply add an abnormal EEG pattern, but instead it may progressively alter the individual’s characteristic dynamical signature. In such cases, the most sensitive biomarker may be the deviation of a person’s current EEG from their own historical fingerprint rather than from a population average. This idea is particularly worth pursuing in sleep EEG research, because sleep recordings are rich, repeatedly acquired, and strongly individualized [6]. Consequently, EEG-based sleep research may increasingly focus on distinguishing stable personal traits, transient physiological states, and pathology-related changes, rather than treating fingerprinting solely as a nuisance circumstance to be eliminated, as is mostly the case with current feature-based learning models. In other words, new signal analysis techniques are required with the capacity of extracting latent information in which both population-wise trends and individuals’ characteristics are orthogonally represented in the model’s feature space.
To address this challenge, here we focus on the potential applicability of statistical complexity, in particular on the use of ordinal patterns, as adequate features in sleep EEG signals [12,13,14]. EEG signals are known to contain stable individual characteristics that arise from anatomical, physiological, and functional properties of the brain, enabling reliable identification of subjects across recording sessions. At the same time, sleep EEG recordings also capture state- and disease-related alterations related to insomnia, obstructive sleep apnea, narcolepsy, or other sleep pathologies. Consequently, a single EEG signal may simultaneously encode information about individual identity and pathological status. We evaluated whether ordinal-pattern features derived from Generalized Weighted Permutation Entropy (GWPE) [15] provide robust representations for EEG sleep-stage classification without producing strong subject-specific fingerprinting effects. To investigate this, we compare sleep stage classifier performance under two validation schemes: an intra-subject (“record-wise”) setup, where epochs from the same subjects appear in both training and testing sets, and a subject-independent (“subject-wise”) setup, where unseen subjects are used exclusively for testing. In a second analysis, we trained a subject classifier using the same features extracted across all sleep stages. We found that the presence of subject-specific EEG complexity signatures does not preclude the identification of clinically relevant biomarkers, in this case, supervised labeled sleep stages. Our results show that both sources of latent information may coexist within the same recordings. These results were assessed using SHapley Additive exPlanations (SHAP) to evaluate the partial dependency of the models with respect to feature contributions [16]. This perspective suggests that fingerprinting and biomarker discovery should not necessarily be viewed as competing objectives, but rather as complementary aspects of brain dynamics operating at different layers of organization.
2. Materials and Methods
2.1. Datasets
We analyzed the polysomnographic records available in the Sleep-EDF Database Expanded [17], a publicly accessible resource distributed via PhysioNet [18]. This repository comprises whole-night polysomnographic recordings derived from two independent protocols: the Sleep Cassette Study and the Sleep Telemetry Study. The Sleep Cassette Study was designed to evaluate age-related alterations in sleep architecture among healthy, unmedicated participants. Each subject contributed two consecutive overnight recordings, yielding a total of 153 polysomnographic sessions. The Sleep Telemetry Study investigated the effects of temazepam on sleep physiology in healthy individuals reporting mild sleep-onset difficulties. This protocol includes 44 recordings obtained from 22 subjects. Both studies encompass electroencephalography (EEG), electrooculography (EOG), and chin electromyography (EMG) signals. EEG data were acquired using the Fpz-Cz and Pz-Oz derivations, with a sampling rate of 100 Hz, and partitioned in nonoverlapping segments of 30 seconds (called “epochs").
Expert sleep-stage annotations were provided for each epoch. In the present work, we exclusively utilized the Fpz-Cz EEG channel. For the Sleep Cassette Study, we retained only the first night of recording per subject. For the Sleep Telemetry Study, we included only recordings from subjects who did not receive active medication (i.e., placebo or no-treatment conditions). The final analytical sample comprised male and female participants aged between 18 and 40 years (mean age: , standard deviation: ). A total of subjects were included in the analysis, comprising 18 females (mean age: , standard deviation: ) and 13 males (mean age: , standard deviation: ). Epochs containing recording artifacts were removed from the analysis. Specifically, epochs in which the EEG signal remained constant over time were excluded, since this behavior indicates a failure in signal acquisition rather than physiological brain activity. A temporal windowing function was applied to retain only epochs within a biologically relevant sleep window. Specifically, the analysis was restricted to the 30 minutes before the first non-Wake epoch and the 30 minutes after the last non-Wake epoch of each recording. This removes artifactual wakefulness at the edges of the recordings and focuses the analysis on the actual sleep period. No downsampling or filtering procedures were applied to minimize potential preprocessing-related biases and to avoid removing meaningful variability in brain activity across subjects. This also grants the robustness and generalizability of the results.
2.2. Ordinal Pattern Analysis
The characterization of these EEG signals were conducted using the analysis of Ordinal Patterns (OPs), a robust non-linear methodology originally introduced by Bandt and Pompe [12] to evaluate permutation entropy patterns in signals and time series. This framework is grounded in the symbolic representation of time series through the ranking of amplitude values within successive (and likely delay-embedded) vectors, thereby enabling the quantification of local temporal orderings in the signal. A widely acknowledged advantage of this approach lies in its capacity to effectively capture underlying dynamic structures and phase-space trajectories in chaotic dynamical systems, distinguishing apart stationary regimes from transient deterministic behavior (chaotic) and randomness [19]. Consequently, OPs preserve the intrinsic temporal correlations of time series while remaining computationally efficient and resilient to monotonic transformations of the data. This has been advantageous in the analysis of neurophysiological processes without imposing strict stationarity assumptions on the signal. In the context of sleep EEG analysis, this framework facilitates the characterization of nonlinear, nonstationary dynamical properties, such as complexity, regularity, and information content, across distinct sleep stages and physiological states [20].
2.2.1. Ordinal Pattern Construction
For a given EEG time series , symbolic mapping is performed based on the relative order of data points within vectors of dimension D (representing the embedding dimension or window length). These vectors are constructed by introducing a time delay or lag () between consecutive samples of the pattern, defined as follows:
The vector is represented with an OP , which is determined by the permutation that sorts the amplitude values of the segment in ascending order. In particular, let be the unique permutation of such that:
In the event of ties (i.e., identical amplitude values within the same embedding vector due to signal quantization), ranks are resolved deterministically using chronological ordering, assigning the lower rank to the temporally preceding sample. This corresponds to the stable sorting convention (lexicographic resolution). Then the associated ordinal pattern is defined as . Each sample segment of length D maps injectively onto one of the possible OPs, providing a symbolic encoding of its local temporal structure. We analyzed window lengths of points and lag values of . Each window length yields a total of possible permutations (e.g., 6, 24, and 120 OPs, respectively), which define the symbolic alphabet of the underlying brain dynamics. Hence, selecting a larger D enables wider variety of local amplitude rank orderings within the delay-embedded time series. This increased pattern diversity facilitates a more detailed representation of the signal’s nonlinear dynamics, enhancing sensitivity to subtle temporal variabilities, structural complexities, and regime-specific neural signatures.
In a given signal, each segment will be injected into a unique OP embedding, and thus each of the OPs () will be represented with a relative frequency (i.e., the empirical probability of observing this OP within the delay-embedded time series). The empirical probability distribution over the possible patterns constitutes a feature set that enables advanced signal analysis and characterization. In the context of sleep EEG analysis, a sufficiently large D supports a richer and more detailed characterization of neurophysiological states. Varying , in turn, functions as a downsampling filter, capturing rapid biological rhythms when , or isolating lower-frequency sleep dynamics (such as delta and theta waves) as the delay increases. It is worth noting that both parameters (D and ) operate independently, and that the set of OPs produced under different combinations are not redundant (i.e., for a given signal and a given , the six OPs produced with are likely to be statistically independent to the 120 OPs produced with ). In other words, the combined use of different signal embeddings may enrich the feature space significantly, allowing the development of more advanced ML-based analyses.
2.2.2. Generalized Weighted Ordinal Patterns (GWOP) and Entropic Index q
So far, the signal embedding technique described above relies exclusively on sequential ordering, and is thus invariant under monotonic transformations, and neglects amplitude fluctuations. Consequently, either low-intensity background noise or high amplitude synchronized waves —such as K-complexes or delta wave bursts— may handled identically. To overcome this limitation, we adopted a generalization of the Bandt-Pompe schema, namely the Generalized Weighted Permutation Entropy (GWPE) formalism [15,21]. Under this framework, patterns within the signal do not contribute uniformly to the analysis. Instead, each occurrence is weighted by its local variance raised to an exponent q, usually known as entropic index. The generalized probability of occurrence for each OP is then calculated as follows:
Here, denotes the variance (amplitude fluctuation) of the analyzed segment. Positive q values emphasize the contribution of segments with large amplitude fluctuations, which is crucial for isolating high-energy macro-structures such as deep-sleep delta waves (N3 stage). Negative q values, in turn, favor small amplitude fluctuations, enabling the study of baseline noise or subtle transitions during micro-arousals and REM sleep. When , the model consistently reduces to the standard unweighted Bandt-Pompe ordinal probability distribution.
As already mentioned, EEG recordings were segmented into 30-second epochs. Each epoch was labeled according to its corresponding sleep stage. For each epoch, the GWOP were computed using embedding dimensions and 5 using time delays =1,2, and 3 and entropic indices q from to 5. These values were selected based on the robustness and significance reported in previous studies [20,22]. These features will be used to develop ML-based analyses to evaluate the extent to which GWOP provide reliable representations for the classification of EEG-derived sleep stages while avoiding strong subject-specific fingerprinting. The total amount of features is summarized in Table 1.
2.3. Experimental Design
To evaluate the influence of subject-specific fingerprinting on the proposed classification model, two complementary evaluation schemes were implemented. First, sleep-stage classification performance was compared under intra-subject and inter-subject conditions, i.e., when the classifier was tested on epochs from subjects included in the training set versus epochs from previously unseen subjects. This analysis was designed to evaluate whether subject-specific characteristics contribute to sleep-stage classification performance beyond sleep-related dynamics. Second, a subject-identification analysis was performed using the same feature representation, with subject identity as the classification target instead of the sleep stage. This experiment provided a direct evaluation of the extent to which the extracted features encode subject-specific information. The entire workflow is illustrated in Fig. Figure 1.
2.3.1. Sleep Stage Classification
As already mentioned, sleep stage classification models were trained and assessed under two distinct scenarios: an intra-subject condition, where the test set comprised data from subjects present during training (internal split), and an inter-subject condition, where the test set consisted of data from four previously unseen randomly selected subjects. A leave-group-out validation procedure was conducted across 24 trials to evaluate performance under these two conditions. In each trial the experimental procedure was performed as follows:
- 1.
- Features were extracted from all 30-second EEG epochs corresponding to the 31 subjects included in the study (see SubSection 2.2.2).
- 2.
- For each trial, four subjects were randomly selected and excluded from the training process. These subjects formed the inter-subject test group.
- 3.
- The remaining 27 subjects were used for model development. Their epochs were randomly divided into training and test subsets using a 85%/15% split. This split was used for intra-subject evaluation, since epochs from the same subjects were present in both subsets.
- 4.
- The same trained model was then evaluated on all epochs belonging to the four held-out subjects. This evaluation corresponds to the inter-subject validation scheme, since the model was tested on subjects not seen during training.
2.3.2. Subject Identification
To further assess the presence of subject-specific information within the GWOP representation, an additional subject-identification analysis was conducted regardless of sleep stages using the same GWOP feature set. In contrast to the sleep-stage classification task, the objective of this analysis was to determine whether these features contain sufficient information to discriminate individual subjects.
2.4. Classification Algorithm
Sleep stage classification and subject identification models were developed using the XGBoost algorithm based on the 3150 previously described GWOP features. Class balancing and hyperparameter tuning were performed using RandomizedSearchCV from the scikit-learn library [23]. For sleep stage classification, models were trained on epochs from the 27 subjects included in the training set of each of the 24 cross-validation trials. To mitigate class imbalance, sleep stage classes were balanced on a per-subject basis. Specifically, for each subject, the number of epochs in each sleep stage was randomly downsampled to match the size of the minority class. As a result, the total number of epochs available for training varied across trials, depending on the specific composition of subjects in each training set. Following class balancing, the data for each trial were split into training (85%) and testing (15%) sets. The mean number of training epochs was (mean ± standard deviation). The mean number of epochs used for intra-subject testing was , whereas the mean number of epochs used for inter-subject testing was . The larger number of epochs in the inter-subject testing set is due to the inclusion of all available epochs from the four held-out subjects, whose data were not used during training.
For hyperparameter tuning, an initial search was first conducted using a random intra-subject split. This preliminary optimization used 10-fold cross-validation and 75 random parameter combinations. The resulting hyperparameters were then used as the starting point for the optimization performed during the 24 experimental trials. For each trial, a second hyperparameter optimization was carried out using 7-fold cross-validation and 20 random parameter combinations. Model performance was evaluated using classification accuracy.
Feature contributions to the XGBoost sleep stage classification models were evaluated using SHapley Additive exPlanations (SHAP). SHAP values were computed with the TreeExplainer algorithm [24] for each trained model on a random subset of 1,000 epochs. As the classifier addresses a multiclass problem, aggregate feature importance was defined as the mean absolute SHAP value, averaged across all sleep stages and the 24 experimental trials. Subsequently, stage-specific feature importance patterns were examined independently for each sleep stage. To compare feature relevance across known and unseen subjects, separate analyses were conducted for intra-subject and inter-subject evaluation conditions. Finally, feature rankings were assessed using Spearman correlation and top-feature overlap to quantify the stability, consistency, and potential subject specificity of the GWOP representations.
For the intra-subject evaluation, class balancing was performed prior to the train-test split. This test set, despite representing an artificial distribution, forces the classifier to optimize for subtle morphological transitions (e.g., N1 vs. REM) rather than exploiting majority class prevalence. Consequently, this guarantees that the subsequent feature importance analysis (via SHAP values) captures genuine neurophysiological fingerprints instead of artifactual class base-rates. Conversely, the inter-subject validation naturally retains the original, unbalanced physiological distribution to assess real-world generalizability.
For the subject identification analysis, the classifier was trained using GWOP features extracted from epochs belonging to all sleep stages and all 31 subjects. To mitigate class imbalance, the number of epochs for each subject was randomly reduced to match the size of the minority class. After balancing, a total of 24552 epochs were available for analysis, corresponding to 792 epochs per subject. The dataset was randomly partitioned into training and testing subsets using an 85%/15% split, resulting in 20869 training epochs and 3683 testing epochs. Hyperparameter optimization was performed using RandomizedSearchCV with 7-fold cross-validation and 100 randomly sampled hyperparameter combinations. The optimal hyperparameters were subsequently used to train the final subject-identification model.
3. Results
In this section we present the main results obtained from the intra- and inter-subject sleep stage classifiers, as well as the findings from the subject identification analysis. A substantial part of this presentation is devoted to investigating the extent to which the GWOP features may exhibit a detrimental fingerprinting effect. Accordingly, special attention was paid to identifying which of the 3,150 features were the most important within each model according to SHAP analysis, and to which extents these features overlap.
3.1. Sleep Stage Classification
Table 2 provides a comprehensive summary of the mean accuracy, balanced accuracy, macro F1-score, and Cohen’s for sleep stage classification performance under both intra-subject and inter-subject conditions, averaged across 24 independent trials. The mean value and standard deviation of the optimal hyperparameters distribution across the 24 trials are summarized in Table 3. Figure 2 displays the normalized average confusion matrices for the two conditions, highlighting the fact that systematic differences in classification patterns are not present. All evaluated metrics slightly declined when moving from the intra-subject to the inter-subject setting. The most pronounced drop was observed for the macro-averaged F1 score (=0.084), followed by Cohen’s (=0.061). Smaller decreases were noted for balanced accuracy and mean accuracy, which highlights the relative low sensitivity of the F1 score to cross-subject variability. The per-trial evolution of accuracy and macro F1 score is illustrated in Figure 3, which reveals only minor trial-to-trial fluctuations and confirms the robustness of the observed performance across individual runs.
To investigate whether the classifier relied on subject-specific identity signals, the top-N intra and inter SHAP feature sets were compared for increasing values of N (Table 4). Features that are present only in the intra ranking are potential candidates for fingerprinting, as their presence would suggest that the model uses subject identity rather than sleep stage information to make predictions about subjects that have been seen before. The stability of SHAP feature rankings between trials was assessed by computing the Spearman rank correlation coefficient for all trial pairs. For each pair of trials, the correlation () measures how consistently the 3150 features are ranked by importance: indicates identical rankings, while indicates no agreement. The results are summarized in Table 5.
Table 6 lists the ten highest-ranked features by global mean absolute SHAP value. Notably, the ranking is identical under both test conditions, and the importance values coincide to four decimal places. The Spearman rank correlation between the full intra- and inter-subject importance vectors (across all 3150 features) was (), indicating near-perfect agreement. Figure 4 shows that the distribution of D and among the top-50 features for intra- and inter-subject conditions.
3.2. Subject Classification Analysis
To directly evaluate whether subject-specific information is present in the GWOP feature space, we conducted a subject-identification analysis using the same feature representations that were employed for sleep-stage classification. This analysis was performed across all available epochs, regardless of their assigned sleep stage, to ensure a comprehensive assessment of subject discriminability. The resulting performance is visualized in Figure 5, which presents the normalized confusion matrix for subject identification. Table 7 shows the evaluation metrics for the classifier. During hyperparameter optimization, the best-performing model achieved a Macro-F1 standard deviation of 0.006 across the seven cross-validation folds. Table 8 summarizes the corresponding hyperparameter values.
To further investigate whether the GWOP features encode subject-specific information independently of sleep stage, we compared the SHAP-based feature rankings derived from the sleep-stage classifier with those obtained from the subject-identification classifier. This comparison allowed us to assess the degree of overlap between the most significant GWOP features for each task. Table 9 reports the overlap between the top-N most important features for sleep-stage classification and those for subject identification. Figure 6 illustrates the cumulative relative feature importance for both classifier. Features exclusive to subject identification, exclusive to sleep-stage classification, and shared between both models are distinguished by color. For , the overlap between the two feature sets is zero, implying that most important features for sleep-stage classification do not overlap at all with the features used for subject identification. The first feature overlap occurs at top-50, and the third at top-70, meaning that 4% of the 70 most important ordinal pattern features are shared between the two models. The distribution of D, and q among the top-50 is shown in Figure 7. This implies that at the top of their respective ranking lists, the two classifiers rely on different features of the feature space. In other words, these results suggest that the features driving sleep-stage classification are largely distinct from those that carry subject identity information.
4. Discusion
Generalized weighted ordinal-pattern (GWOP) features extracted from sleep EEG signals can support accurate sleep-stage classification while minimizing the detrimental effects of EEG fingerprinting and identity confounding. However, and although GWOP features contain sufficient information to discriminate individual subjects, they also preserve robust sleep-stage representations that generalize well to previously unseen individuals. Taken together, these findings suggest that fingerprinting and biomarker extraction should not necessarily be viewed as competing objectives, but rather as complementary information embedded within the same neurophysiological signal. A primary concern motivating this work was the possibility that sleep-stage classification performance could be artificially inflated by subject-specific information. Consistent with previous reports on EEG fingerprinting, the subject-identification analysis demonstrated that GWOP features retain substantial individual information, achieving an accuracy of 63.9% across 31 subjects, a value far above the expected chance level of 3.2%. This provides evidence that the GWOP feature space preserves highly discriminative, stable individual traits embedded within the sleep EEG dynamics, even when ignoring traditional macrostructural sleep-stage labeling. The efficacy of the GWOP framework in person authentication stems from its ability to retain amplitude fluctuation dynamics through the entropic index q. While standard unweighted permutation entropy () treats low-intensity background noise and high-amplitude synchronized waves identically, the inclusion of generalized weights allows the model to capture personalized micro-structures. Specifically, positive q values accentuate robust, individualized macro-structures (such as characteristic delta wave bursts in N3), whereas negative q values isolate baseline noise or unique transient signatures during REM micro-arousals. The results imply that the exact distribution of these multi-scale amplitude variations forms a highly specific, idiosyncratic neural signature (an EEG fingerprint) that remains remarkably stable across subjects and sleep states.
However, if sleep-stage classification performance were primarily driven by such fingerprinting effects, a marked degradation would be expected when moving from intra-subject to inter-subject validation. Instead, the observed reduction in performance was relatively modest. Mean classification accuracy decreased by only 3.4 percentage points, while balanced accuracy decreased by 4.8 percentage points. This moderate performance drop observed from intra to inter-subject condition () may be attributable to natural physiological between-subject variability rather than to fingerprinting. The GWOP features that drive classification, particularly those with and , appear to encode genuinely generalizable sleep stage information. Moreover, confusion matrices remained qualitatively similar across validation schemes, indicating that the classifier learned sleep-stage representations that largely generalized to unseen subjects.
The most important features under SHAP analysis for sleep-stage classification were virtually identical under intra-subject and inter-subject evaluation. The overlap between the top-ranked features exceeded 98% across a broad range of feature-set sizes, and the complete SHAP importance vectors exhibited an almost perfect correlation. Within the top-30 most important features, complete agreement was observed between conditions. Divergence only emerged at larger N, reaching 2.4% at top-500 (12 out of 500 features). This pattern, combined with the Spearman correlation of across the full feature vector, provides strong evidence that the classifier does not exploit subject-specific signals to achieve its intra-subject performance. The moderate between-trial stability of SHAP rankings () further reflects the expected variability arising from differences in subject group composition across trials, and is not indicative of a systematic fingerprinting effect. Also, the mean correlation was virtually identical between the intra- and inter-subject conditions (difference of , well within one standard deviation of ). This indicates that the trial-to-trial variability in feature rankings is not systematically affected by whether the model is evaluated on seen or unseen subjects. If fingerprinting were present, intra-subject rankings would be expected to be substantially more stable than inter-subject rankings, as the model would consistently exploit subject-specific signals when predicting on known subjects. The absence of such a difference provides further evidence against the presence of fingerprinting in the GWOP feature set. This implies that classifiers rely on the same underlying physiological signatures regardless of whether subjects were previously observed during training.
Perhaps the most important result emerges from the comparison between sleep-stage classification and subject-identification models. Despite both analyses using the same GWOP feature space, the highest-ranked features for the two tasks showed almost no overlap. In fact, among the 100 most important features, only a small number contributed substantially to both models. This dissociation suggests that GWOP representations encode multiple forms of information simultaneously, with some features preferentially capturing sleep-stage dynamics and others reflecting stable individual characteristics. From a machine-learning perspective, this observation implies a partial orthogonality between biomarker-related and identity-related information. Such a property is highly desirable because it enables the extraction of clinically meaningful biomarkers without necessarily eliminating the individualized structure inherent to EEG signals. From a neurophysiological standpoint, these findings are consistent with emerging views that sleep EEG activity contains multiple layers of organization operating at different temporal and biological scales. Sleep stages reflect transient global brain states characterized by distinct oscillatory and dynamical regimes, whereas EEG fingerprints likely emerge from stable anatomical, physiological, and network-level properties of individual brains. Ordinal-pattern representations appear capable of capturing both dimensions simultaneously. This may explain why the same feature framework can support accurate sleep-stage classification while also enabling subject recognition.
5. Conclusion
We presented a comprehensive study on the use of ordinal-pattern-based analysis in sleep EEG characterization. The presented results demonstrate that GWOP features simultaneously encode individualized and sleep-stage-specific information, yet these two forms of information appear to be largely distinct within the feature space. Rather than constituting an unavoidable source of confounding, EEG fingerprinting may coexist with clinically relevant biomarkers in a manner that permits reliable generalization across subjects. The capacity to characterize an individual’s baseline neural signature enhances the sensitivity of biomarker detection by establishing a personalized reference frame. This individualized benchmark allows pathological deviations —whether functional or structural— to be measured relative to a subject’s own normative state rather than against heterogeneous population averages. This distinguishes stable trait-related information from disease-related effects, while granting that predictive models generalize to previously unseen individuals. As a consequence, GWOP features reduce inter-individual variability, increases statistical power, and may improve the sensitivity in identifying neural patterns associated with disease onset or progression. This concept is closely aligned with emerging precision medicine approaches that emphasize within-subject trajectories rather than solely population-level comparisons. Our findings support the use of ordinal-pattern-based complexity measures as a promising framework for sleep EEG analysis and suggest that future biomarker discovery efforts may benefit from explicitly modeling, rather than suppressing, the individualized nature of brain dynamics. This may help developing frameworks capable of jointly representing identity and pathology, allowing researchers to quantify their respective contributions to EEG variability. Under these conditions, the ability to characterize an individual’s baseline neural signature can enhance the sensitivity of biomarker detection by providing a personalized reference against which pathological deviations can be measured.
Several limitations should nevertheless be acknowledged. The analysis was restricted to a single EEG derivation and a relatively homogeneous cohort of healthy young adults. Additional studies involving larger populations, multiple recording sites, and clinically diagnosed sleep disorders will be necessary to determine whether the observed separation between fingerprinting and biomarker information remains stable under more heterogeneous conditions. Furthermore, although SHAP analysis provides valuable insights into feature importance, it does not directly characterize the geometric structure of the latent feature space. Future work could employ representation-learning approaches, manifold analysis, or information-theoretic frameworks to quantify the degree of independence between subject-specific and sleep-related information.
Author Contributions
Conceptualization, C.D. Duarte, C. A Delrieux and F.R. Iaconis; methodology, C.D. Duarte and C.A Delrieux; software, C.D. Duarte and A. Arlengui; validation, C.D. Duarte, A. Arlenghi, F.R. Iaconis, G, Gassaneo and C. A. Delrieux.; formal analysis,C.D. Duarte, A. Arlenghi, F.R. Iaconis and C. A. Delrieux.; investigation, C.D. Duarte, A. Arlenghi, F.R. Iaconis, G, Gassaneo and C. A. Delrieux.; resources, C.D. Duarte and C. A. Delrieux.; data curation, C.D. Duarte, A. Arlenghi; writing—original draft preparation, C.D. Duarte, A. Arlenghi, F.R. Iaconis and C. A. Delrieux.; writing—review and editing, C.D. Duarte, A. Arlenghi, F.R. Iaconis, G, Gassaneo and C. A. Delrieux.; visualization, C.D. Duarte, A. Arlenghi and C. A. Delrieux.; supervision, C. A. Delrieux.; project administration, C. A. Delrieux.; funding acquisition, G, Gassaneo and C. A. Delrieux. All authors have read and agreed to the published version of the manuscript.
Funding
This research was funded by the Science and Technology Office of the Universidad Nacional del Sur (Argentina) under grants PGI 24/K093 and PGI 24/F089.
Institutional Review Board Statement
Not applicable.
Data Availability Statement
Models are available from the corresponding author upon reasonable request.
Conflicts of Interest
The authors declare no conflicts of interest.
References
- Spisak, T. Statistical quantification of confounding bias in machine learning models. GigaScience 2022, 11, giac082. [Google Scholar] [CrossRef] [PubMed]
- Chaibub Neto, E.; Pratap, A.; Perumal, T.M.; Tummalacherla, M.; Snyder, P.; Bot, B.; Trister, A.; Friend, S.; Mangravite, L.; Omberg, L. Detecting the impact of subject characteristics on machine learning-based diagnostic applications. npj Digit. Med. 2019, 2. [Google Scholar] [CrossRef] [PubMed]
- Demuru, M.; Fraschini, M. EEG fingerprinting: Subject-specific signature based on the aperiodic component of power spectrum. Comput. Biol. Med. 2020, 120, 103748. [Google Scholar] [CrossRef] [PubMed]
- Brookshire, G.; Kasper, J.; Blauch, N.M.; Wu, Y.C.; Glatt, R.; Merrill, D.A.; Gerrol, S.; Yoder, K.J.; Quirk, C.; Lucero, C. Data leakage in deep learning studies of translational EEG. Front. Neurosci. 2024, 18, 1373515. [Google Scholar] [CrossRef] [PubMed]
- Lin, Y.; Huang, S.; Mao, J.; Li, M.; Haihambo, N.; Wang, F.; Liang, Y.; Chen, W.; Han, C. The neural oscillatory mechanism underlying human brain fingerprint recognition using a portable EEG acquisition device. Neuroimage 2024, 294, 120637. [Google Scholar] [CrossRef] [PubMed]
- Albaiati, A.E.; Akbar, M.F.; Hssayeni, M.D.; Khalil, A.; Ab Wahab, M.N.; Weli, S.S.; Raheema, E.A. Deep Learning Approaches for EEG-Based Biometrics: A Systematic Review. IEEE Access, 2025. [Google Scholar]
- Finelli, L.A.; Achermann, P.; Borbély, A.A. Individual ‘fingerprints’ in human sleep EEG topography. Neuropsychopharmacology 2001, 25, S57–S62. [Google Scholar] [CrossRef] [PubMed]
- De Gennaro, L.; Marzano, C.; Fratello, F.; Moroni, F.; Pellicciari, M.C.; Ferlazzo, F.; Costa, S.; Couyoumdjian, A.; Curcio, G.; Sforza, E.; et al. The electroencephalographic fingerprint of sleep is genetically determined: a twin study. Ann. Neurol. 2008, 64, 455–460. [Google Scholar] [CrossRef] [PubMed]
- Zhang, X.; Yao, L.; Kanhere, S.S.; Liu, Y.; Gu, T.; Chen, K. Mindid: Person identification from brain waves through attention-based recurrent neural network. Proc. ACM Interact. Mob. Wearable Ubiquitous Technol. 2018, 2, 1–23. [Google Scholar]
- Unnisa, Z.; Tariq, A.; Din, I.U.; Shehzad, D.; Serhani, M.A.; Belkacem, A.N.; Sarwar, N. Threats and Mitigation Strategies for Electroencephalography-Based Person Authentication. Int. J. Telemed. Appl. 2025, 2025, 3946740. [Google Scholar] [PubMed]
- Didaci, L.; Pani, S.M.; Frongia, C.; Fraschini, M. How time window influences biometrics performance: An eeg-based fingerprint connectivity study. Signals 2024, 5, 597–604. [Google Scholar] [CrossRef]
- Bandt, C.; Pompe, B. Permutation entropy: a natural complexity measure for time series. Phys. Rev. Lett. 2002, 88, 174102. [Google Scholar] [CrossRef] [PubMed]
- Bandt, C. A new kind of permutation entropy used to classify sleep stages from invisible EEG microstructure. Entropy 2017, 19, 197. [Google Scholar] [CrossRef]
- Berger, S.; Schneider, G.; Kochs, E.F.; Jordan, D. Permutation entropy: Too complex a measure for EEG time series? Entropy 2017, 19, 692. [Google Scholar] [CrossRef]
- Stosic, D.; Stosic, D.; Stosic, T.; Stosic, B. Generalized weighted permutation entropy. Chaos An. Interdiscip. J. Nonlinear Sci. 2022, 32, 103105. Available online: https://pubs.aip.org/aip/cha/article-pdf/doi/10.1063/5.0107427/19804706/103105_1_online.pdf. [CrossRef] [PubMed]
- Lundberg, S.M.; Lee, S.I. A Unified Approach to Interpreting Model Predictions. Proc. Adv. Neural Inf. Process. Syst. 2017, Vol. 30, 4765–4774. [Google Scholar]
- Kemp, B.; Zwinderman, A.; Tuk, B.; Kamphuisen, H.; Oberye, J. Analysis of a sleep-dependent neuronal feedback loop: the slow-wave microcontinuity of the EEG. IEEE Trans. Biomed. Eng. 2000, 47, 1185–1194. [Google Scholar] [CrossRef] [PubMed]
- Goldberger, A.; Amaral, L.; Glass, L.; Hausdorff, J.; Ivanov, P.; Mark, R.; Mietus, J.; Moody, G.; Peng, C.; Stanley, H.; et al. PhysioNet: componentes de um novo recurso de pesquisa para sinais fisiológicos complexos. Circulation 2000, 101, e215–e220. [Google Scholar] [PubMed]
- Leyva, I.; Martínez, J.H.; Masoller, C.; Rosso, O.A.; Zanin, M. 20 years of ordinal patterns: Perspectives and challenges. Europhys. Lett. 2022, 138, 31001. [Google Scholar] [CrossRef]
- Duarte, C.D.; Meo, M.M.; Iaconis, F.R.; Wainselboim, A.; Gasaneo, G.; Delrieux, C. A Permutation Entropy Method for Sleep Disorder Screening. Brain Sci. 2025, 15, 691. [Google Scholar] [CrossRef] [PubMed]
- Fadlallah, B.; Chen, B.; Keil, A.; Principe, J. Weighted-permutation entropy: A complexity measure for time series incorporating amplitude information. Phys. Rev. E Stat. Nonlinear Soft Matter Phys. 2013, 87, 022911. [Google Scholar] [CrossRef] [PubMed]
- Duarte, C.D.; Pacheco, M.; Iaconis, F.R.; Rosso, O.A.; Gasaneo, G.; Delrieux, C.A. Statistical complexity analysis of sleep stages. Entropy 2025, 27, 76. [Google Scholar] [CrossRef] [PubMed]
- Pedregosa, F.; Varoquaux, G.; Gramfort, A.; Michel, V.; Thirion, B.; Grisel, O.; Blondel, M.; Prettenhofer, P.; Weiss, R.; Dubourg, V.; et al. Scikit-learn: Machine Learning in Python. J. Mach. Learn. Res. 2012, 12. [Google Scholar]
- Lundberg, S.M.; Erion, G.; Chen, H.; DeGrave, A.; Prutkin, J.M.; Nair, B.; Katz, R.; Himmelfarb, J.; Bansal, N.; Lee, S.I. From Local Explanations to Global Understanding with Explainable AI for Trees. Nat. Mach. Intell. 2020, 2, 56–67. [Google Scholar] [CrossRef] [PubMed]
Figure 1.
Processing workflow performed in this study.
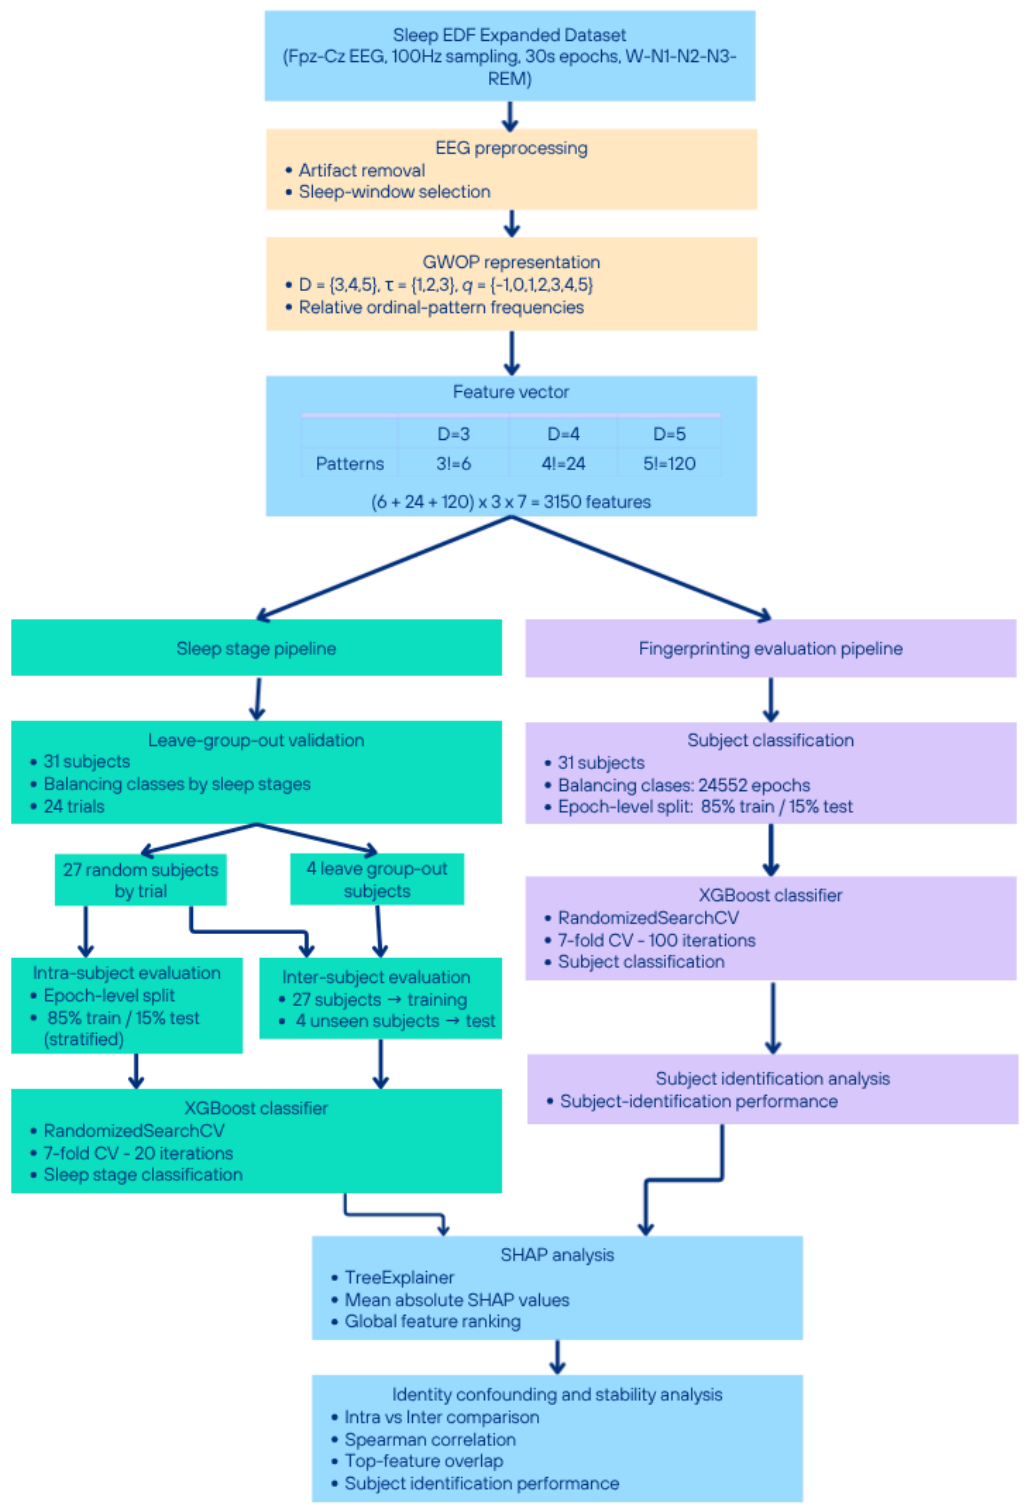
Figure 2.
Normalized confusion matrices averaged over 24 trials for intra-subject validation (left) and inter-subject validation (right).
Figure 2.
Normalized confusion matrices averaged over 24 trials for intra-subject validation (left) and inter-subject validation (right).
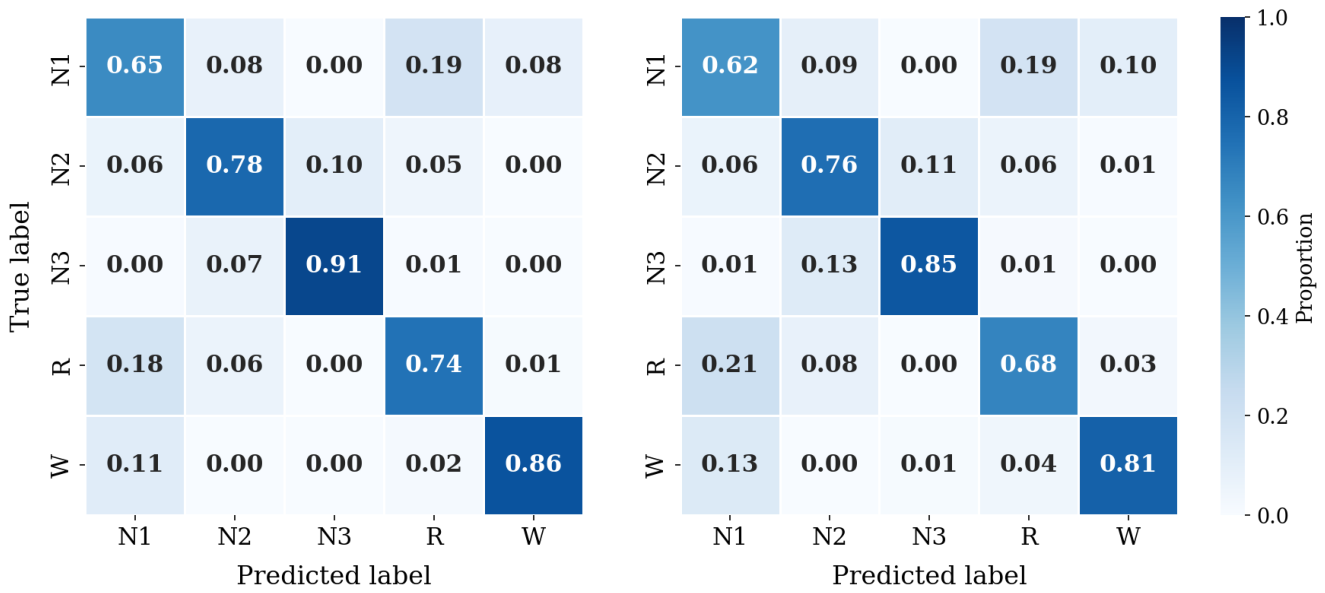
Figure 3.
Accuracy and Macro-F1 scores obtained across the 24 validation trials for the intra-subject and inter-subject evaluation schemes.
Figure 3.
Accuracy and Macro-F1 scores obtained across the 24 validation trials for the intra-subject and inter-subject evaluation schemes.
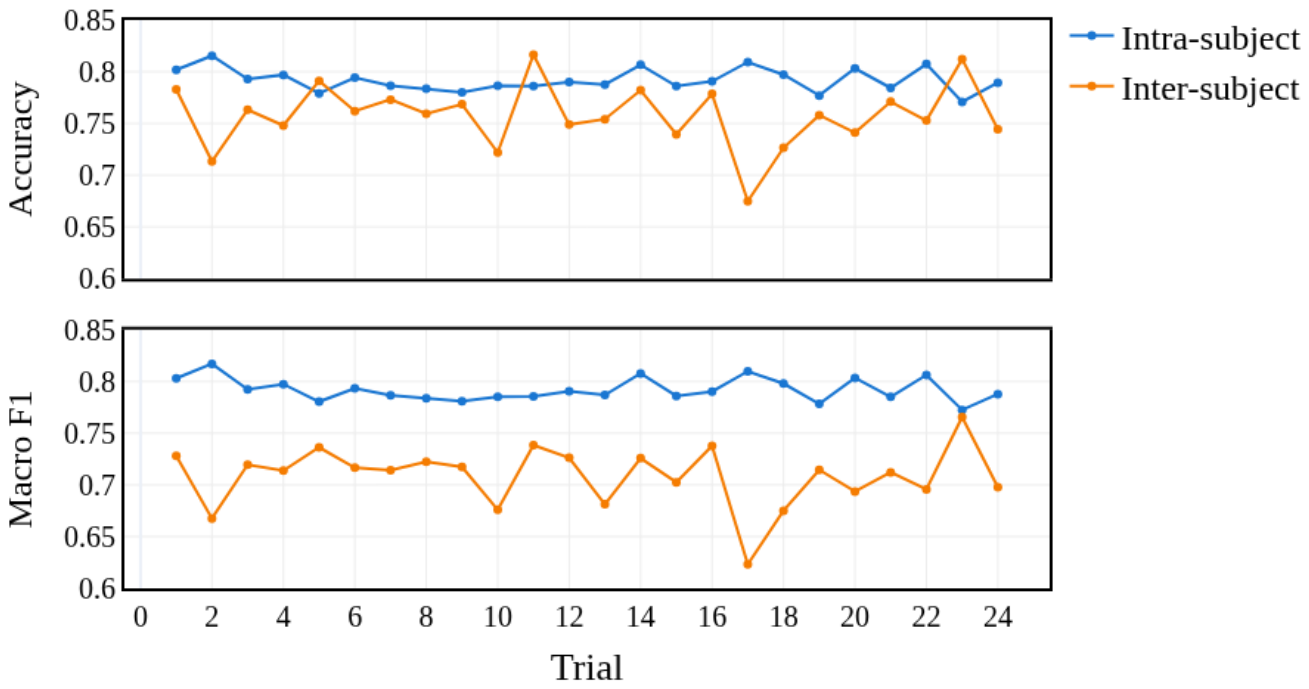
Figure 4.
Distribution of embedding dimension (D), time delay (), and entropic index (q) among the top-50 GWOP features ranked by global mean absolute SHAP value for sleep stage classification. The upper panel shows the number of features for each value of D. The middle panels show the distribution of within each group of D. The lower panels show a heatmap for de of the joint distribution of q and for each value of D.
Figure 4.
Distribution of embedding dimension (D), time delay (), and entropic index (q) among the top-50 GWOP features ranked by global mean absolute SHAP value for sleep stage classification. The upper panel shows the number of features for each value of D. The middle panels show the distribution of within each group of D. The lower panels show a heatmap for de of the joint distribution of q and for each value of D.
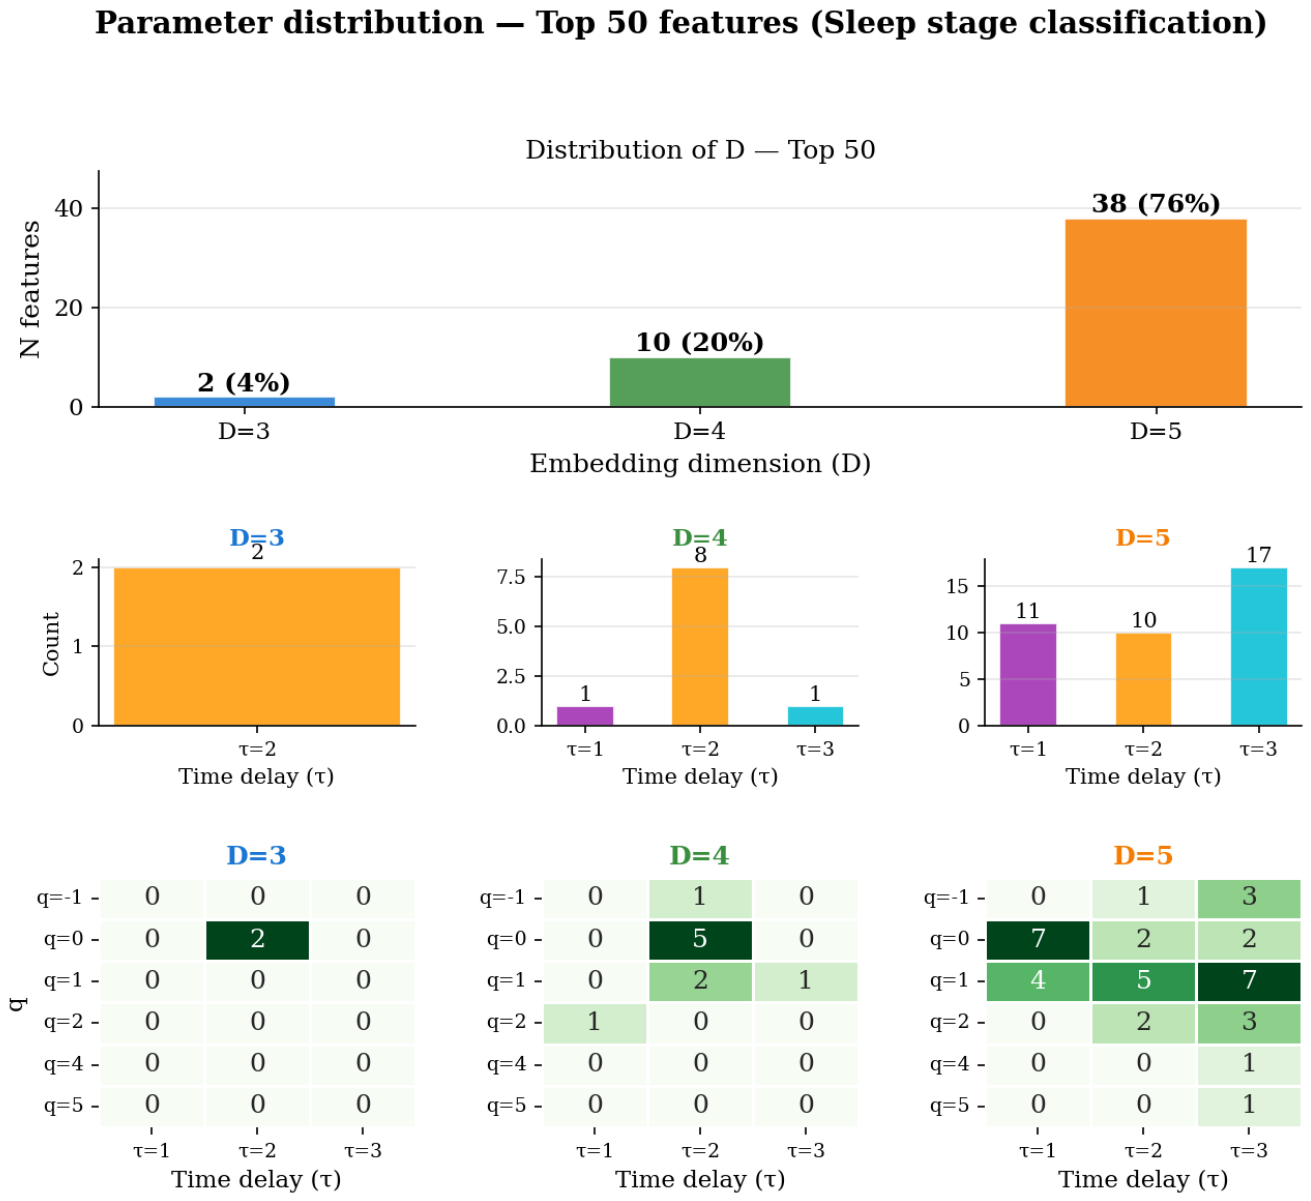
Figure 5.
Confusion matrix for subject classification.
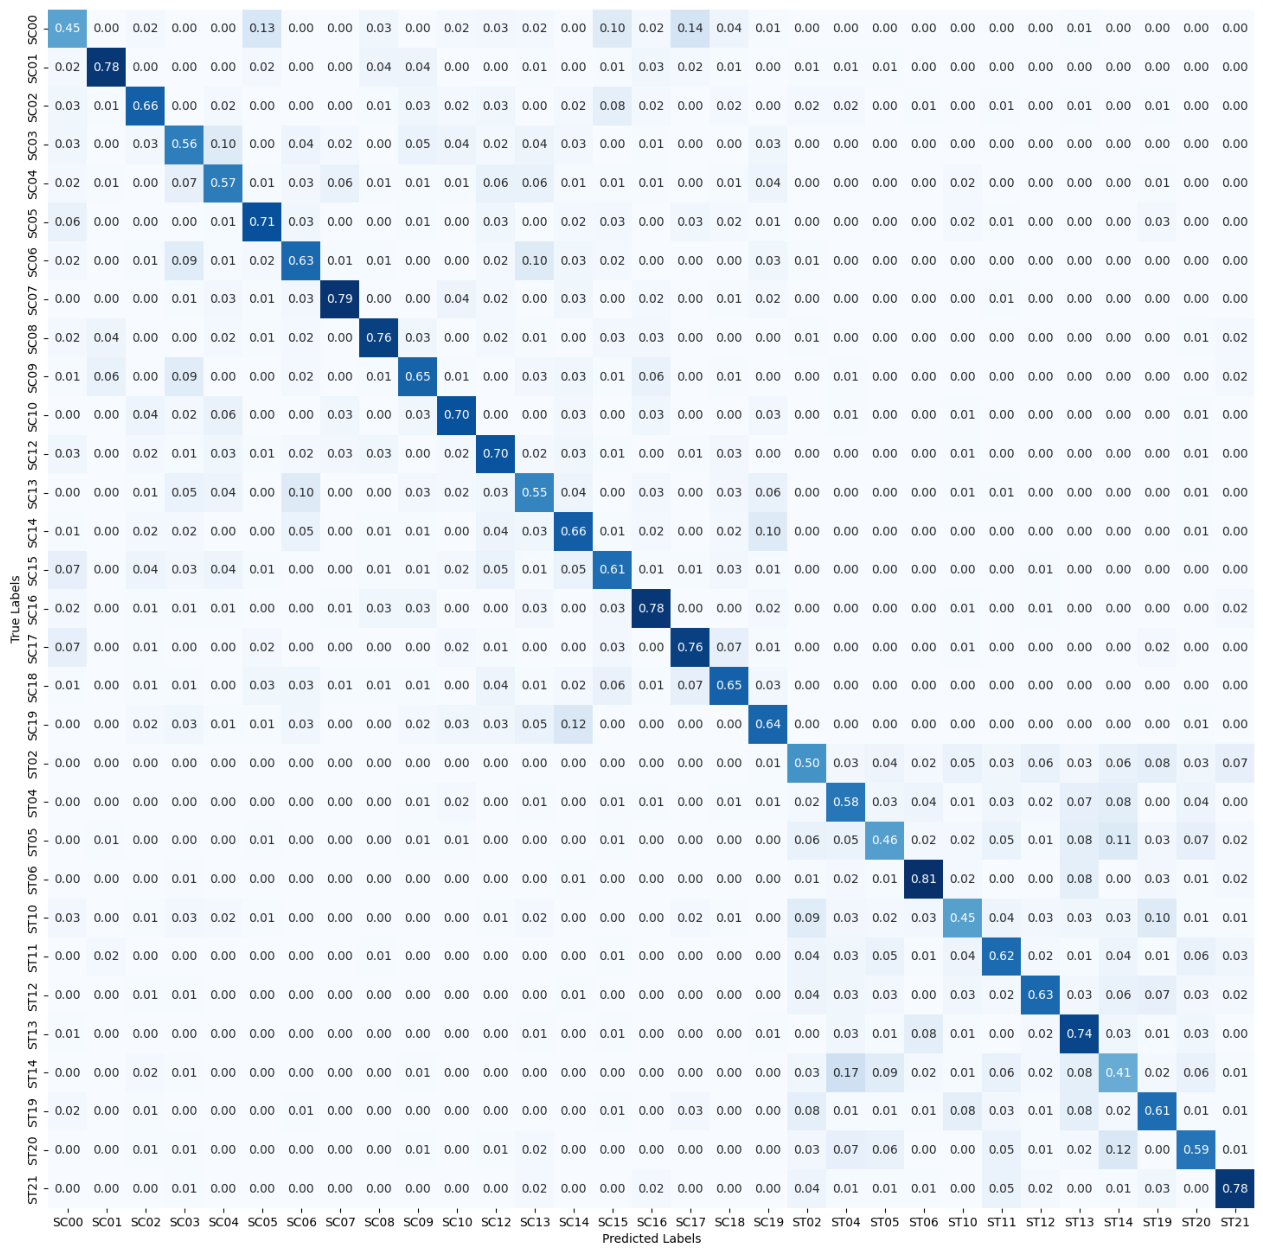
Figure 6.
Cumulative feature importance for sleep stage classification and subject identification for the N-top features.
Figure 6.
Cumulative feature importance for sleep stage classification and subject identification for the N-top features.
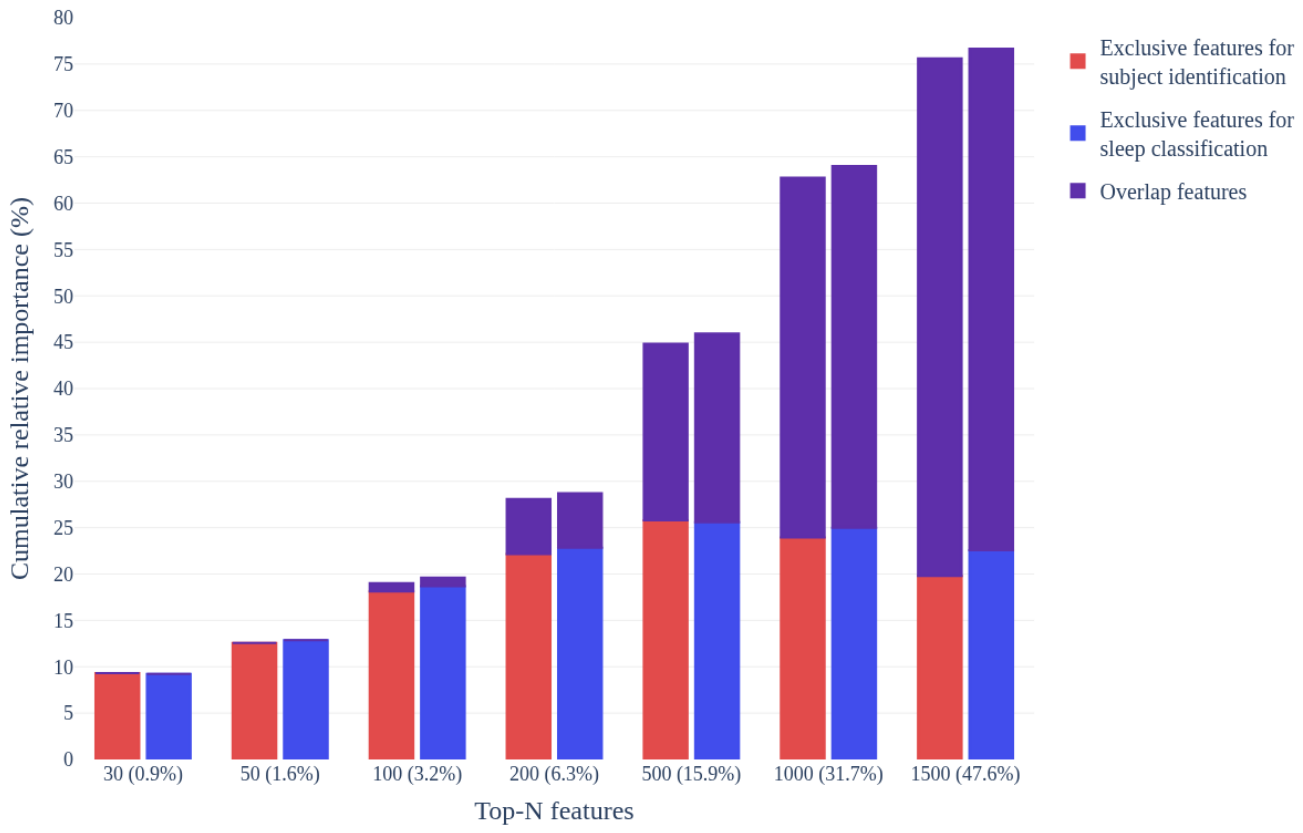
Figure 7.
Distribution of embedding dimension (D), time delay (), and entropic index (q) among the top-50 GWOP features ranked by global mean absolute SHAP value for subject classification. The upper panel shows the number of features for each value of D. The middle panels show the distribution of within each group of D. The lower panels show a heatmap of the joint distribution of q and for each value of D.
Figure 7.
Distribution of embedding dimension (D), time delay (), and entropic index (q) among the top-50 GWOP features ranked by global mean absolute SHAP value for subject classification. The upper panel shows the number of features for each value of D. The middle panels show the distribution of within each group of D. The lower panels show a heatmap of the joint distribution of q and for each value of D.
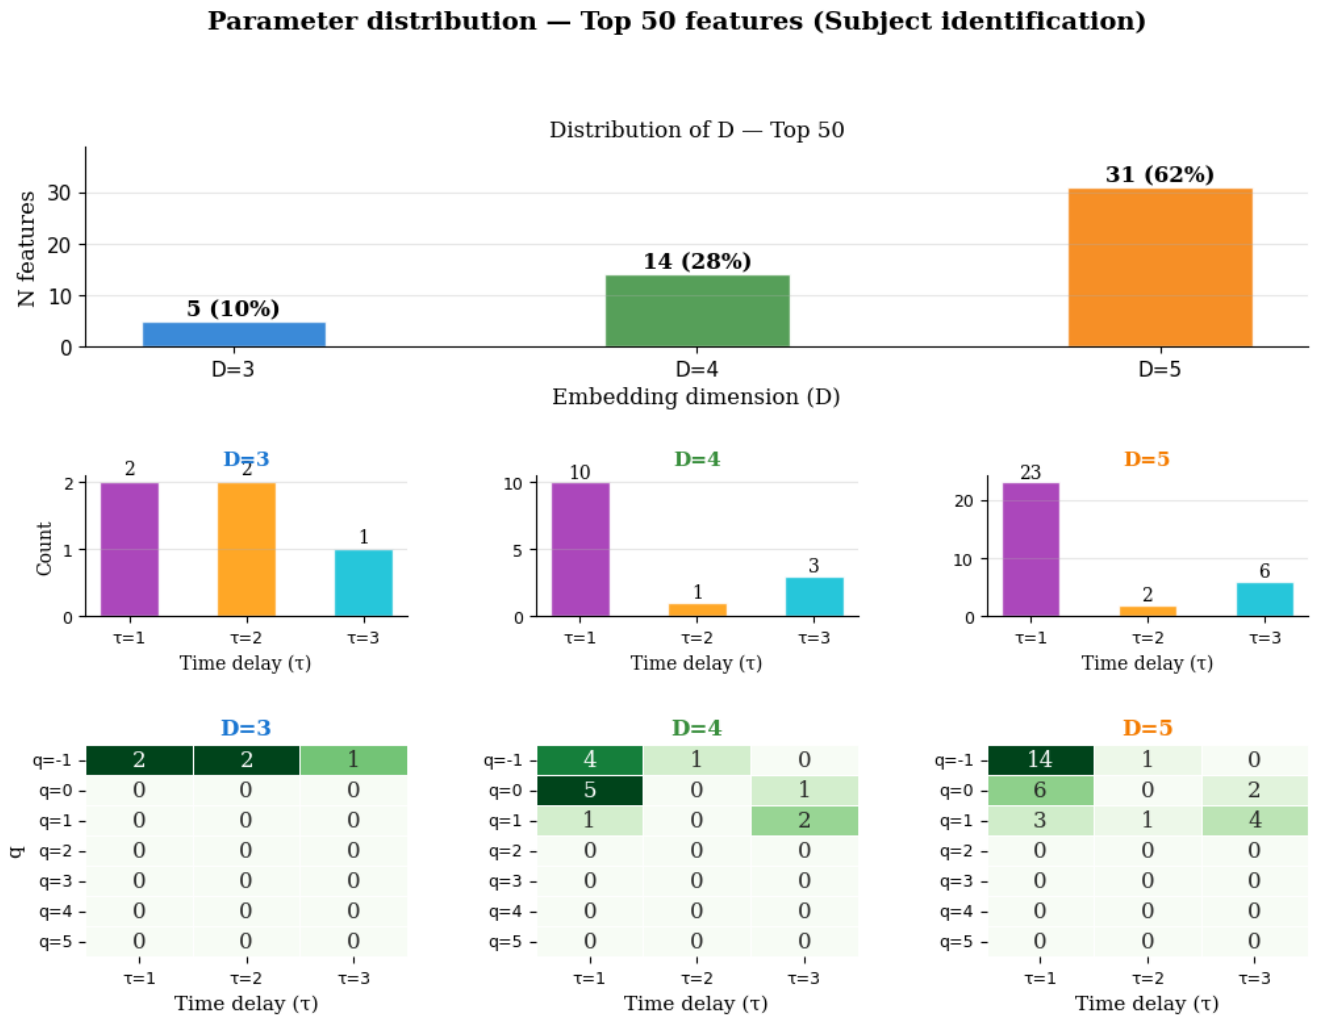

Table 1.
Amount of features in the model.
| D | OPs | q values | Features | |
|---|---|---|---|---|
| 3 | 6 | 1, 2, 3 | 126 | |
| 4 | 24 | 1, 2, 3 | 504 | |
| 5 | 120 | 1, 2, 3 | 2520 | |
| Total | 3150 | |||
Table 2.
Mean classification performance across 24 trials under intra-subject and inter-subject test conditions. denotes the difference (intra minus inter).
Table 2.
Mean classification performance across 24 trials under intra-subject and inter-subject test conditions. denotes the difference (intra minus inter).
| Metric | Intra-subject | Inter-subject | |
|---|---|---|---|
| Accuracy | |||
| Balanced accuracy | |||
| Macro F1 | |||
| Cohen’s |
Table 3.
Distribution of the optimal XGBoost hyperparameters across the 24 trials for sleep-stage classification models. Values are reported as mean ± standard deviation.
Table 3.
Distribution of the optimal XGBoost hyperparameters across the 24 trials for sleep-stage classification models. Values are reported as mean ± standard deviation.
| Parameter | Mean value± Standard deviation |
|---|---|
| Learning rate | |
| Maximum depth | |
| Number of trees | |
| Minimum child weight | |
| Column subsampling | |
| Row subsampling | |
| Gamma | |
| L1 regularization () | |
| L2 regularization () |
Table 4.
Overlap between top-N intra-subject and inter-subject SHAP feature sets. Fingerprint features are those appearing in the intra ranking but not in the inter ranking.
Table 4.
Overlap between top-N intra-subject and inter-subject SHAP feature sets. Fingerprint features are those appearing in the intra ranking but not in the inter ranking.
| Top-N | Overlap | Diff |
|---|---|---|
| 10 | 10 (100%) | 0 |
| 20 | 20 (100%) | 0 |
| 30 | 30 (100%) | 0 |
| 50 | 49 (98%) | 1 |
| 100 | 99 (99%) | 1 |
| 200 | 197 (98%) | 3 |
| 500 | 488 (98%) | 12 |
| 1000 | 979 (98%) | 21 |
| 1500 | 1468 (98%) | 32 |
| 2000 | 1971 (99%) | 29 |
| 2500 | 2476 (99%) | 24 |
| 3000 | 2985 (100%) | 15 |
Table 5.
Between-trial stability of SHAP feature rankings, measured as pairwise Spearman rank correlation across the 24 trials.
Table 5.
Between-trial stability of SHAP feature rankings, measured as pairwise Spearman rank correlation across the 24 trials.
| Condition | Mean | SD |
|---|---|---|
| Intra-subject | 0.437 | 0.044 |
| Inter-subject | 0.432 | 0.044 |
Table 6.
Top-10 GWOP features ranked by global mean absolute SHAP value. Values are identical under intra- and inter-subject conditions.
Table 6.
Top-10 GWOP features ranked by global mean absolute SHAP value. Values are identical under intra- and inter-subject conditions.
| Rank | Feature | SHAPintra | SHAPinter | |||
|---|---|---|---|---|---|---|
| Pattern | D | q | ||||
| 1 | 5 | 3 | 0.0698 | 0.0698 | ||
| 2 | 5 | 2 | 0.0467 | 0.0467 | ||
| 3 | 5 | 1 | 0 | 0.0425 | 0.0425 | |
| 4 | 3 | 2 | 0 | 0.0423 | 0.0423 | |
| 5 | 5 | 2 | 0.0362 | 0.0362 | ||
| 6 | 5 | 3 | 0.0357 | 0.0357 | ||
| 7 | 5 | 3 | 0.0356 | 0.0356 | ||
| 8 | 5 | 3 | 0.0342 | 0.0342 | ||
| 9 | 5 | 1 | 0.0317 | 0.0317 | ||
| 10 | 5 | 1 | 0 | 0.0311 | 0.0311 | |
Table 7.
Performance of the subject-identification classifier using GWOP features.
| Target | Accuracy | Macro-F1 | Cohen’s |
|---|---|---|---|
| Subject | 0.639 | 0.638 | 0.627 |
Table 8.
Optimal XGBoost hyperparameters obtained through random search for subject identification.
| Parameter | Value |
|---|---|
| Learning rate | 0.201 |
| Maximum depth | 4 |
| Number of trees | 128 |
| Minimum child weight | 3 |
| Column subsampling | 0.251 |
| Row subsampling | 0.924 |
| Gamma | 0.162 |
| L1 regularization () | 0.208 |
| L2 regularization () | 2.321 |
Table 9.
Overlap between top-N SHAP feature sets for sleep-stage classification and subject identification. Features appearing in the sleep-stage ranking but not in the subject-identification ranking indicate that the classifier relies on sleep-specific information rather than subject identity.
Table 9.
Overlap between top-N SHAP feature sets for sleep-stage classification and subject identification. Features appearing in the sleep-stage ranking but not in the subject-identification ranking indicate that the classifier relies on sleep-specific information rather than subject identity.
| Top-N | Overlap | Only in subject classification |
|---|---|---|
| 30 | 0 (0%) | 30 (100%) |
| 40 | 0 (0%) | 40 (100%) |
| 50 | 1 (2%) | 49 (98%) |
| 60 | 1 (2%) | 59 (98%) |
| 70 | 3 (4%) | 67 (96%) |
| 80 | 6 (8%) | 74 (92%) |
| 90 | 8 (9%) | 82 (91%) |
| 100 | 13 (13%) | 87 (87%) |
| 200 | 39 (20%) | 161 (80%) |
| 300 | 91 (30%) | 209 (70%) |
| 400 | 138 (35%) | 262 (65%) |
| 500 | 197 (39%) | 303 (61%) |
| 1000 | 553 (55%) | 447 (45%) |
| 1500 | 987 (66%) | 513 (34%) |
| 2000 | 1492 (75%) | 508 (25%) |
| 2500 | 2114 (85%) | 386 (15%) |
| 3150 | 3150 (100%) | 0 (0%) |
Disclaimer/Publisher’s Note: The statements, opinions and data contained in all publications are solely those of the individual author(s) and contributor(s) and not of MDPI and/or the editor(s). MDPI and/or the editor(s) disclaim responsibility for any injury to people or property resulting from any ideas, methods, instructions or products referred to in the content. |
© 2026 by the authors. Licensee MDPI, Basel, Switzerland. This article is an open access article distributed under the terms and conditions of the Creative Commons Attribution (CC BY) license.
Copyright: This open access article is published under a Creative Commons CC BY 4.0 license, which permit the free download, distribution, and reuse, provided that the author and preprint are cited in any reuse.