

Submitted:
27 June 2026
Posted:
30 June 2026
You are already at the latest version
Abstract
Understanding the relationships among plant functional traits and their responses to soil environments is crucial for clarifying plant adaptation strategies. Conducted in the Ebinur Lake region, this study measured key functional traits of desert plants, including carbon (C), nitrogen (N), phosphorus (P) contents, leaf thickness (LT), leaf area (LA), chlorophyll content (Chl), and their ecological stoichiometric ratios (C:N, C:P, N:P). Plant Trait Networks (PTNs) were constructed for herbs, shrubs, and trees under high (HS) and low (LS) soil water-salt environments to analyze the structural differences and regulatory mechanisms of PTNs. The results showed that: (1) There were significant differences in soil properties and plant functional traits between HS and LS environments (p < 0.05), with higher soil water and salt contents in HS. (2) Significant differences in PTNs were observed among different life forms with distinct central traits: Herbs (central traits: leaf thickness, N:P ratio) had high-density PTNs and strong adaptability; Shrubs (central traits: C, P) had high connectivity and stable adaptability; Trees (central traits: N, C:P ratio) had high-modularity PTNs and strong anti-interference ability. (3) Soil factors regulated PTN structure differently: total nitrogen (TN) and total phosphorus (TP) were the key regulatory factors in HS, while soil salt content and water content were the main influencing factors in LS. In conclusion, the PTN structure of desert plants is an important reflection of their adaptation to arid environments, providing a theoretical basis for the protection and management of arid zone vegetation.
Keywords:
plant trait network
; central traits
; soil water-salt environment
; adaptation strategy
; functional traits
1. Introduction
Plant functional traits represent a comprehensive manifestation of an individual’s ability to acquire resources and adapt to specific environments [1,2], and are therefore widely used to evaluate plant adaptability to habitats. Through interactions among multiple traits, plants develop diverse adaptive mechanisms and growth strategies to perform single or multifunctional roles [3]. Consequently, the interactions among different traits have become a major focus in studies of plant adaptation and environmental responses [4,5]. Following long-term environmental adaptation and evolutionary processes, desert plants improve their overall tolerance to multiple stresses such as drought and salinity via synergistic interactions between morphological and chemical traits [6]. Exploring the relationships among multiple traits to uncover plant adaptation strategies to drought has become a research hotspot for assessing the impacts of global change on arid desert ecosystems [7].
Desert plants typically grow in environments with drought, salinization, and nutrient scarcity. The vegetation in these areas is dominated by sparse xerophytic shrubs, with communities primarily composed of small trees, shrubs, and small semishrubs [8]. Plants of various life forms use distinctive trait combinations or drought adaptation techniques to cope with stress in desert conditions [9]. Under various drought stress gradients, Yang et al. examined differences in the trait patterns of the most prevalent small trees and shrubs in the dry desert regions of northwest China. The findings demonstrated that the correlation and integration of traits in small trees were substantially higher than those in shrubs due to the more severe drought stress they experienced [10]. This suggests that plants adapt to changing environments by modifying a variety of features and their interrelationships [11].
Functional trait associations are critical for deciphering plant adaptive responses to environmental changes, as they reflect plant resource allocation strategies and stress tolerance mechanisms [9,12]. Compared with bivariate relationship-based methods, trait networks can accommodate complex multivariate relationships that underlie plant adaptive strategies, making them more powerful for dissecting the intricate interactions among functional traits [13,14]. Plant trait networks (PTNs) are defined as networks composed of nodes (traits) and edges (statistical correlations between traits), with their topological structure characterized by connectivity (edge density), complexity (modularity), and node centrality (degree). These networks enable comprehensive and intuitive representation of trait coordination and trade-offs and have been proven effective for understanding plant environmental adaptations [11]. Wang et al. validated PTN’s utility in arid ecosystems by analyzing fine root traits, showing that PTN topological structure(modularity, edge density) reflect plant drought adaptation strategies—laying our methodological foundation [7]. Li et al. constructed leaf trait networks using leaf traits from nine forest regions in China, spanning from tropical to cold temperate zones. Changes in the pattern of these trait networks indicated that plants with different growth forms employ distinct strategies to cope with local environmental conditions [15]. In recent years, numerous scholars have used plant trait network analysis to explore comprehensive information on the responses of forests and large aquatic plants to changes in aquatic environments [16,17,18]. The results of these studies have made important contributions to understanding the responses of various submerged plant species to resource pulses. Biogeochemical cycles in desert ecosystems are generally slower than those in forest and aquatic ecosystems, leading to soil aridity and low net primary productivity [19]. Gao et al. analyzed the functional trait networks of plants in China’s desert ecosystems and revealed the complex relationships between plant traits and ecosystem processes [20], providing insights into the high sensitivity of arid ecosystems to environmental changes. Although extensive research has documented drought-adaptive strategies of desert plants [19,21,22], how PTN architecture diverges along soil water–salinity gradients remains insufficiently clarified. Soil moisture and salinity constitute dominant abiotic filters shaping desert plant trait covariation [23], and their spatiotemporal variation strongly modulates PTN complexity and connectivity. Furthermore, divergent morphological and physiological attributes across life forms drive pronounced intergroup discrepancies in PTN responsiveness to composite water–salt stress [24]. Accordingly, distinguishing heterogeneous water–salt habitats and elucidating divergent adaptive features of PTNs among different life forms is critical for disentangling species-specific adaptive strategies of desert plants under combined water and salinity stress.
The Ebinur Lake Wetland National Nature Reserve is located in a typical desert region of the Junggar Basin in northern Xinjiang, China, where typical desert plants are distributed. Desert plants are particularly sensitive to environmental changes, with soil moisture and salinity being key environmental factors affecting their survival and distribution [8]. This study integrated soil water and salt environmental factors in the Ebinur Lake region to construct trait networks for herbs, shrubs, and trees, aiming to address the following questions: (1) What are the central traits and key topological structure of PTNs for different life forms under contrasting water-salt environments? (2) How do trait network structure, stability, and plasticity differ among herbs, shrubs, and trees? (3) How do soil water-salt and nutrient factors jointly affect PTN parameters, and further regulate the adaptive trade-offs between network plasticity and stability for plants with different life forms?
2. Results
2.1. Differences in Soil Factors and Plant Functional Traits Between High and Low Soil Water-Salt Environments
Soil water content (SWC), salt content (SSC), organic carbon (SOC) and total nitrogen (TN) were significantly higher under the high soil water-salt environment (p < 0.05), whereas soil total phosphorus (TP) exhibited no obvious difference between the two environments. The soil mass water content and salt content in the high soil water-salt environment were more than twice those in the low soil water-salt environment (Table 1).
As shown in Table 2, the 8 desert plant species exhibited distinct life-form-specific responses to soil water-salt gradients: herbs were dominated by Phragmites australis with high abundance across habitats, while Glycyrrhiza uralensis preferred high water-salt environment; shrubs showed differentiated adaptability, with Apocynum venetum as the dominant species and Halimodendron halodendron restricted to high water-salt environment; trees were represented only by Populus euphratica with low overall abundance, reflecting clear differentiation in water-salt adaptation strategies among life forms.
Except for leaf thickness, chlorophyll, and leaf area, plant traits differed significantly between high and low soil water-salt environments (Table 3): leaf carbon, nitrogen, C:P, and N:P ratios were significantly higher in the high soil water-salt environment (p < 0.05); in contrast, leaf phosphorus and C:N ratio were significantly higher in the low soil water-salt environment (p < 0.05).
2.2. Plants Trait Network Structure of Different Life-Form Under High and Low Soil Water-Salt Environments
Under both high and low soil water-salt environments, the complexity of PTNs increased sequentially in the order of trees, herbs, and shrubs (Fig.1). The central traits of PTNs differed significantly among different plant life forms, all of which were centered on carbon (C), nitrogen (N), phosphorus (P), and their stoichiometric ratios. Specifically, leaf thickness was the unique central trait of herbs in the high soil water-salt environment, whereas the N:P ratio served as the central trait of herbs in the low soil water-salt environment. For shrubs, the central trait was leaf N content in the high soil water-salt environment and the C:P ratio in the low soil water-salt environment. For trees, the central trait was leaf C content in the high soil water-salt environment and leaf P content in the low soil water-salt environment.
Regarding trait connections within PTNs, leaf thickness (LT) and chlorophyll (Chl) were not connected in tree trait networks under both water-salt environments. Additionally, leaf C was connected in all plant trait networks except those of herbs in the low soil water-salt environment, suggesting that leaf C plays a more critical role in maintaining PTN stability for most plants in response to soil water-salt heterogeneity.
Figure 1.
Trait networks of herbs, shrub and tree under high and low soil water and salt environments.
Figure 1.
Trait networks of herbs, shrub and tree under high and low soil water and salt environments.
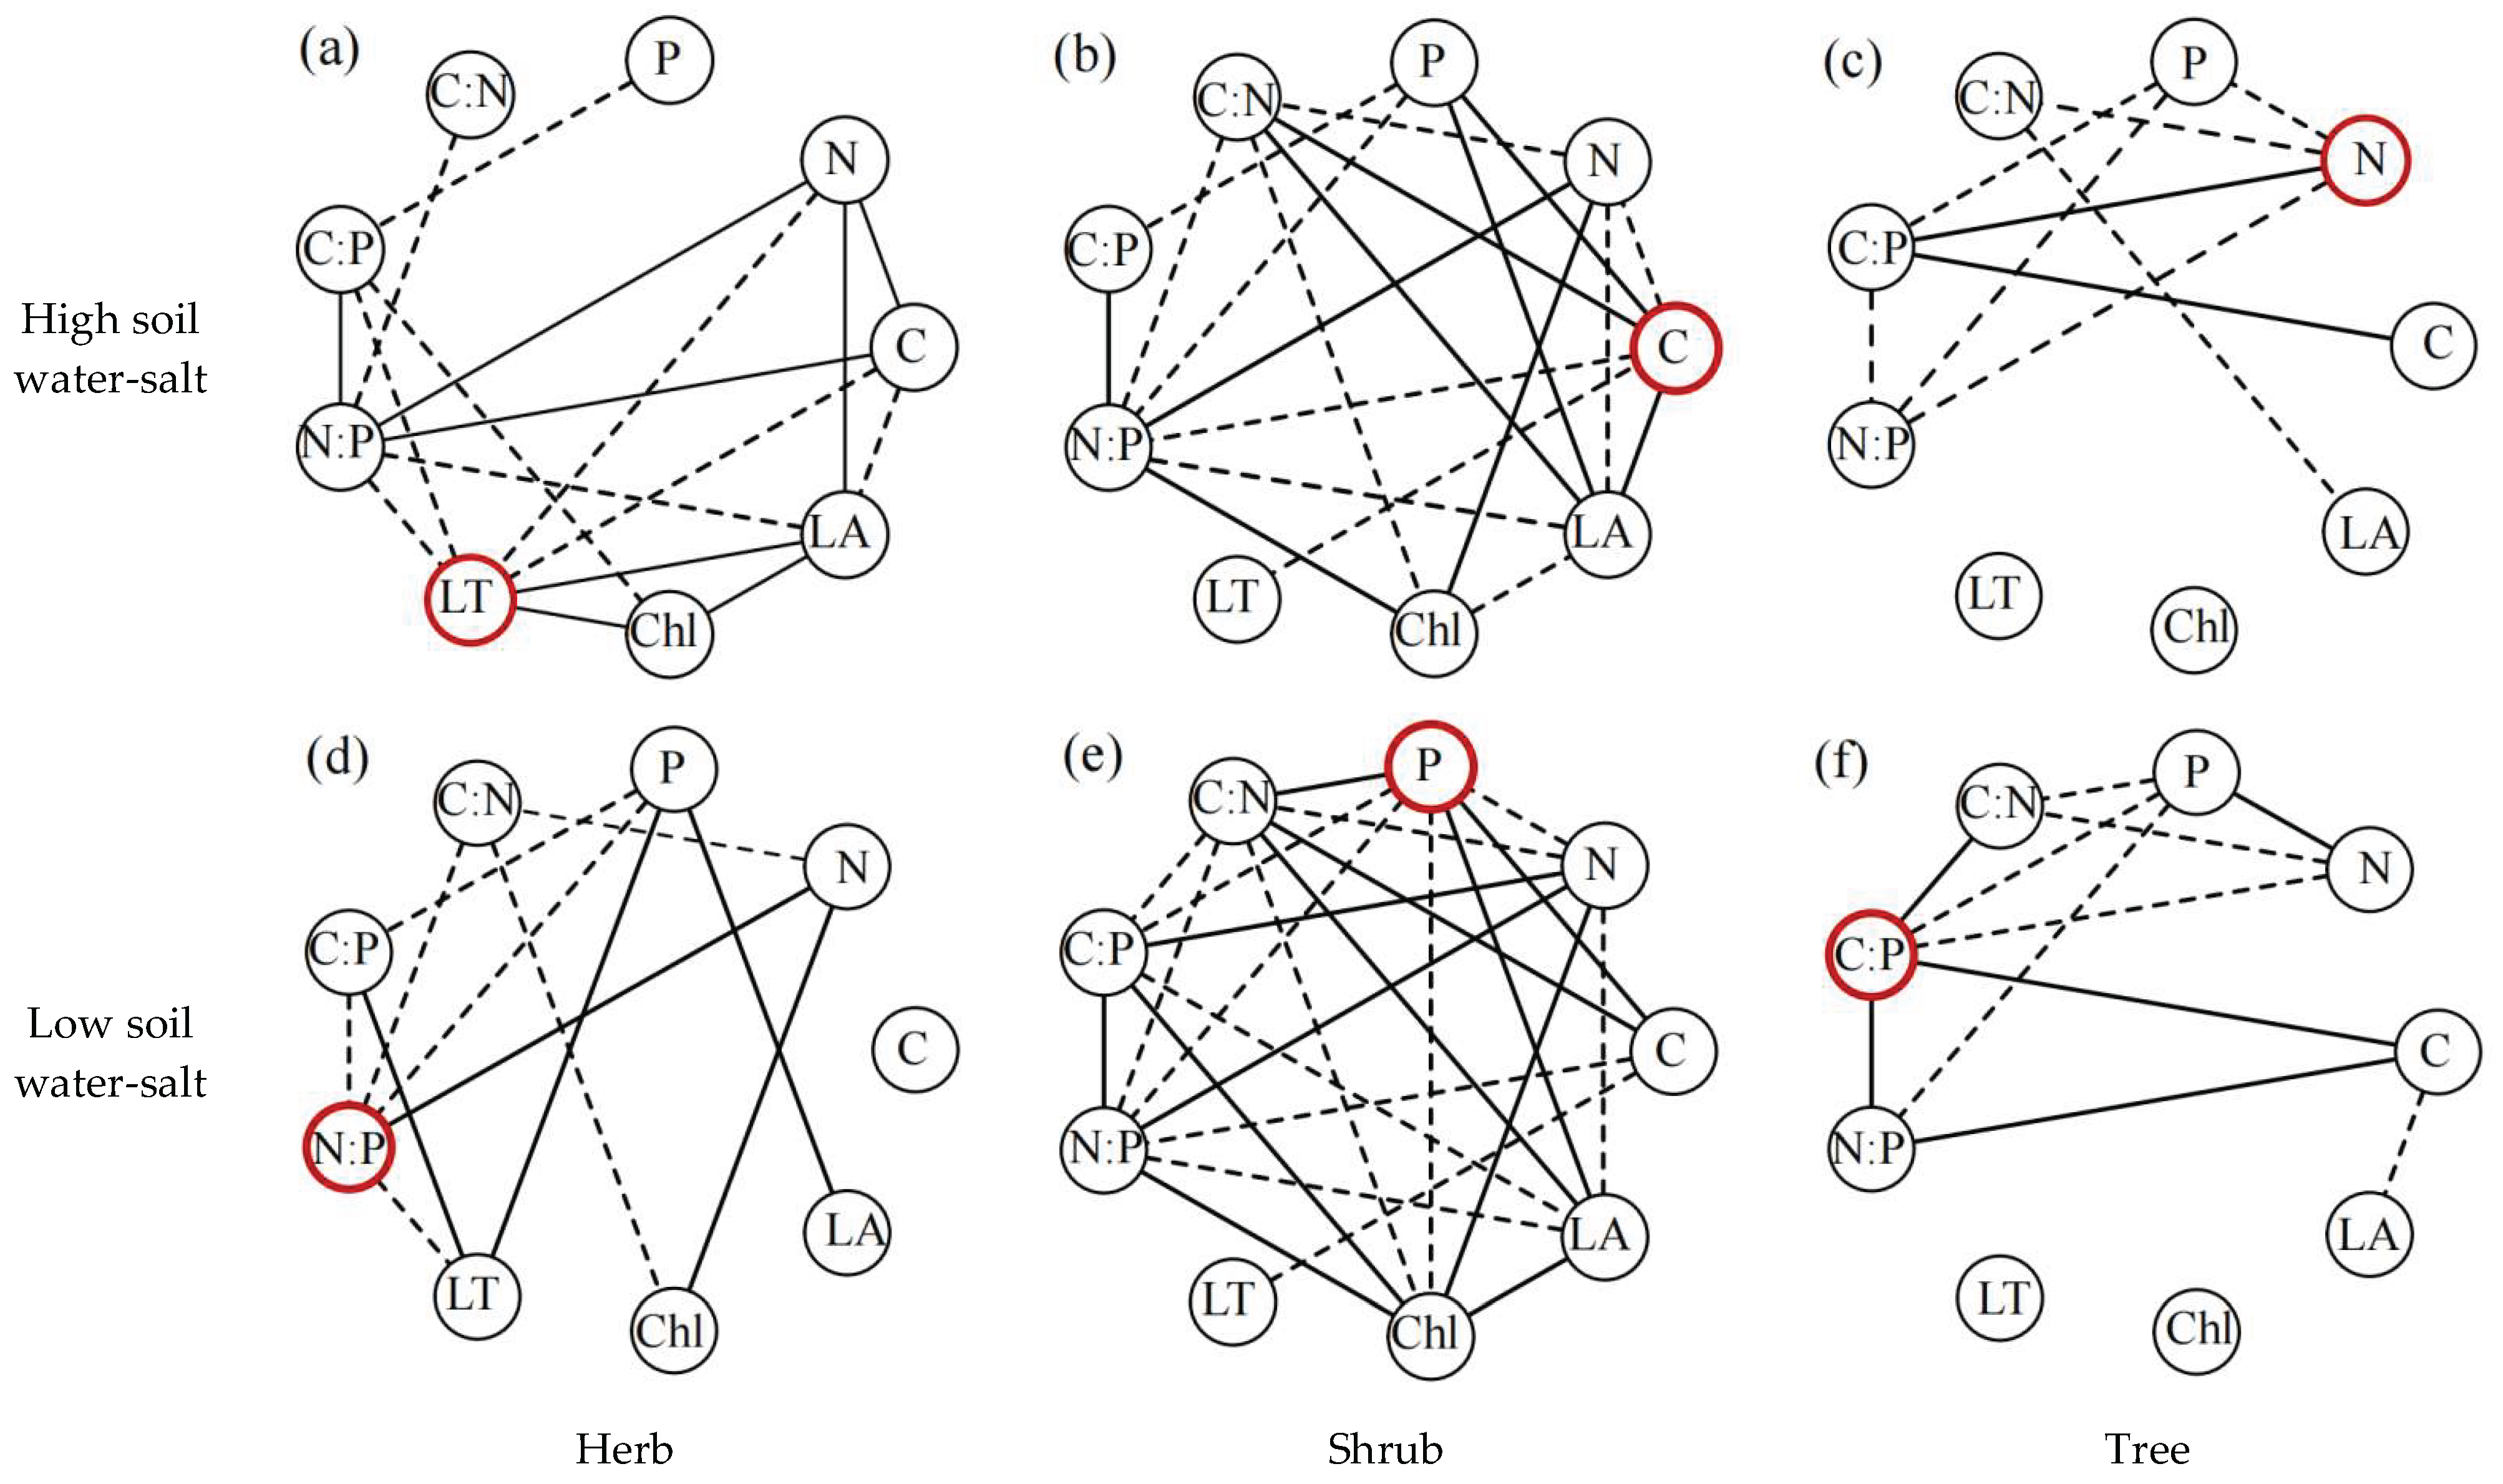
The structural of PTNs varied significantly among life forms and between high and low soil water-salt environments (Table 4). Under high soil water-salt environment, shrubs had relatively high modularity, the highest density and clustering coefficient. Trees showed the highest modularity and the lowest density, while herbs exhibited intermediate values for all three parameters. Under low soil water-salt environment, shrubs still maintained the highest density and clustering coefficient, but modularity decreased. Herbs showed the highest modularity, accompanied by decreased density and no clustering coefficient. Trees maintained relatively high modularity, but their clustering coefficient dropped to the lowest level among all groups (Table 4).
2.3. Effects of Soil Factors on the Structure of Plant Trait Networks (PTNs)
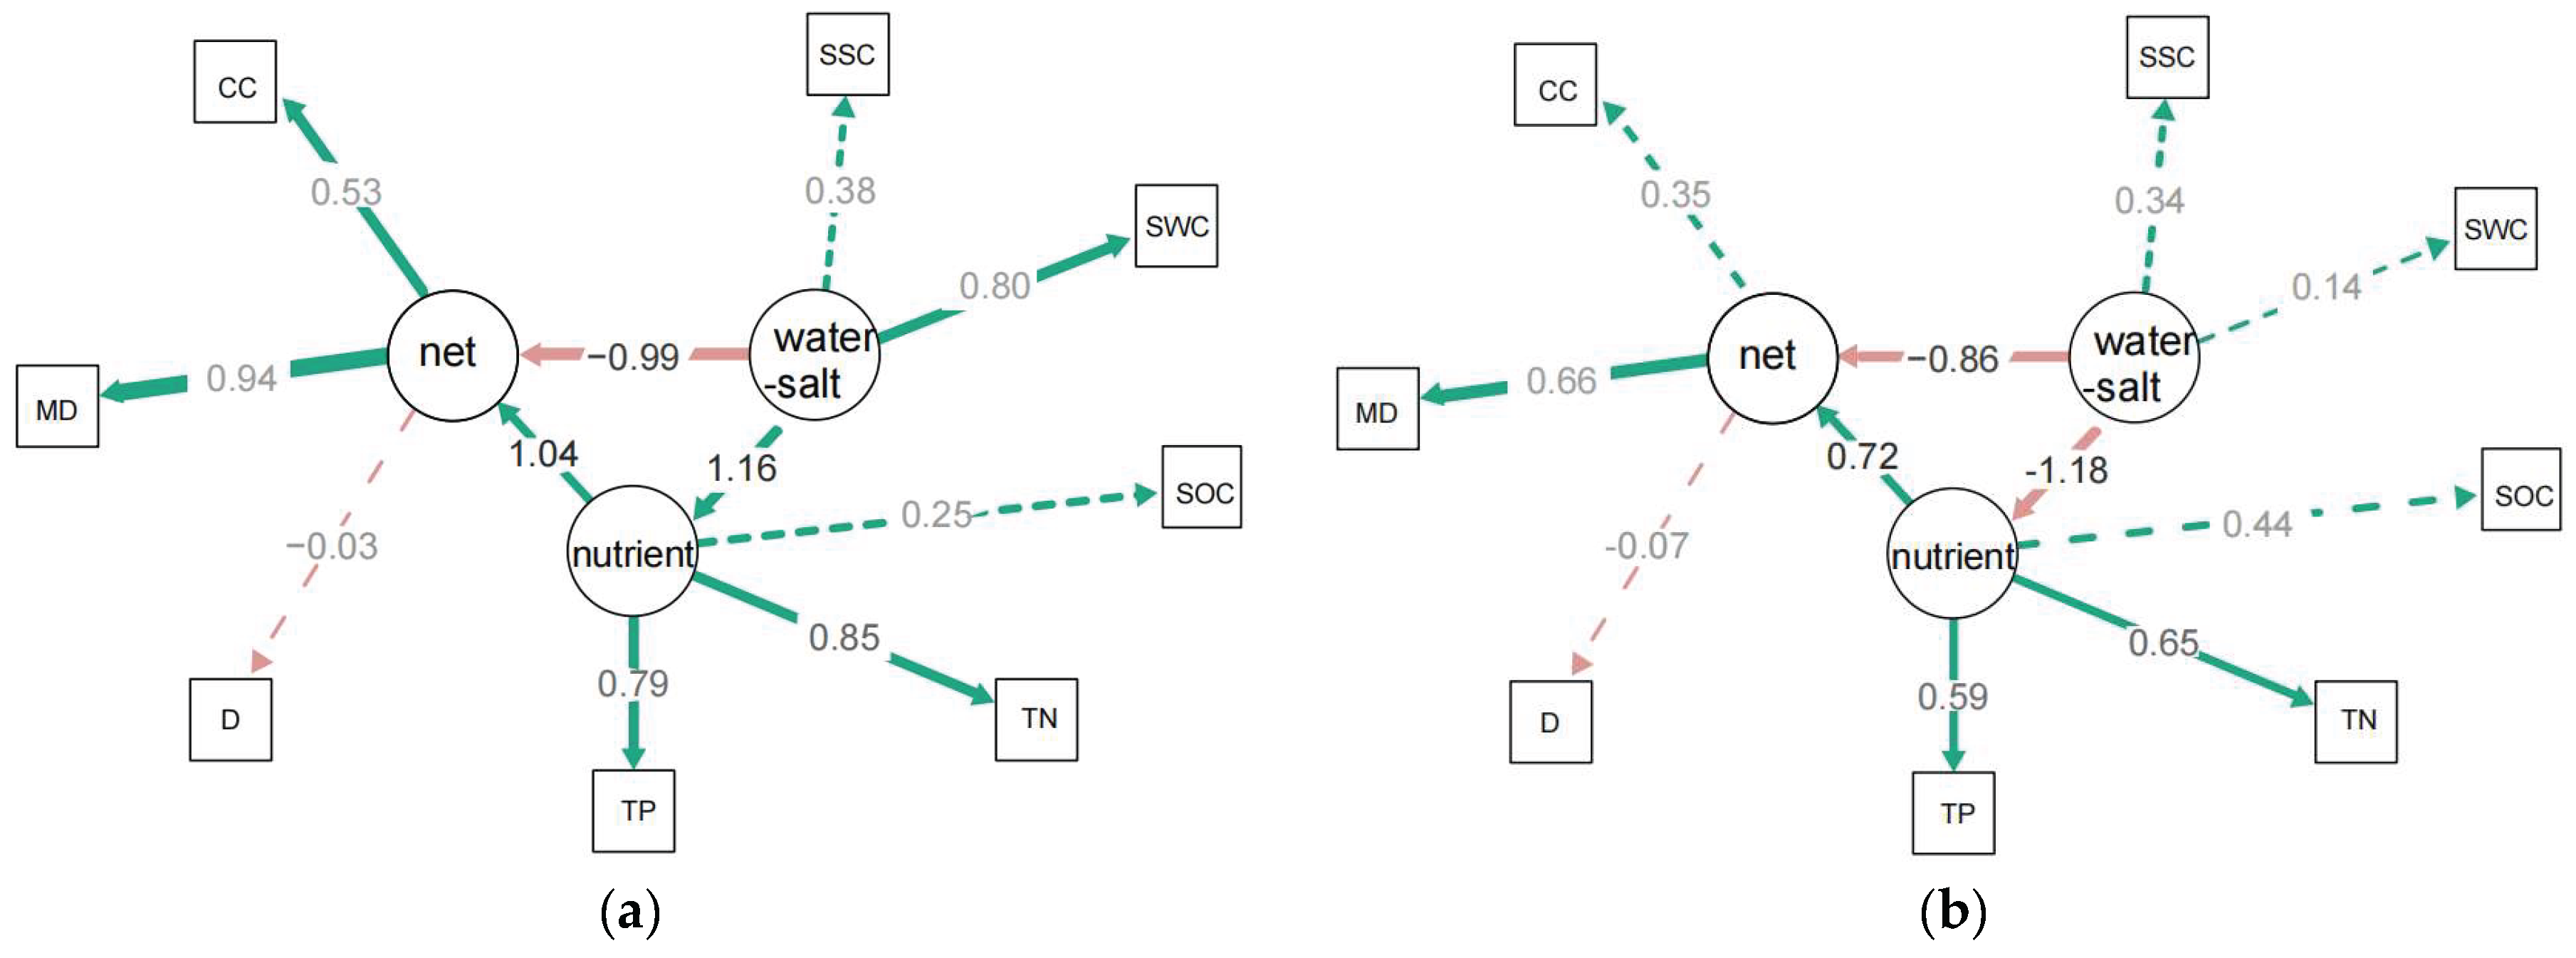
In the high soil water-salt environment: water-salt factors had a strong positive effect on nutrient factors (path coefficient = 1.16), especially on TN and TP, with a significantly stronger effect than on SOC. Nutrient factors positively regulated PTN structure (path coefficient = 1.04) and effectively improved network complexity. Meanwhile, water-salt factors had a direct negative effect on PTNs (path coefficient = -0.99), indicating that water-salt imbalance would reduce PTN stability.
In the low soil water-salt environment: The correlation between SOC and nutrient factors was weak. The positive effect of TN and TP on PTNs was relatively low (path coefficient = 0.72), lower than that in the high water-salt environment. Water-salt factors had a stronger negative effect on PTNs (path coefficient = -0.86), suggesting a more significant constraint on PTN structure. In addition, water-salt factors negatively affected nutrient factors (path coefficient = -1.18), leading to a clear trade-off between water-salt conditions and nutrient supply, which further influenced PTN stability.
Figure 2.
Structural Equation Model (SEM) analysis of soil factors and plant network structure under high (a) and low (b) soil water-salt environments. *Circular nodes are latent variables, and square nodes are manifest variables; Factor composition:Nutrient: Including SOC (Soil Organic Carbon), TN (Total Nitrogen), TP (Total Phosphorus); Water-salt: Including SSC (Soil Salt Content), SWC (Soil Water Content); Network parameters (net): Including MD (Modularity), CC (Clustering Coefficient), D (D). Influence relationship: Solid green lines = positive driving, solid red lines = negative inhibition, dashed lines = weak or insignificant influence; the values on the lines are path coefficients (quantifying the strength of influence).
Figure 2.
Structural Equation Model (SEM) analysis of soil factors and plant network structure under high (a) and low (b) soil water-salt environments. *Circular nodes are latent variables, and square nodes are manifest variables; Factor composition:Nutrient: Including SOC (Soil Organic Carbon), TN (Total Nitrogen), TP (Total Phosphorus); Water-salt: Including SSC (Soil Salt Content), SWC (Soil Water Content); Network parameters (net): Including MD (Modularity), CC (Clustering Coefficient), D (D). Influence relationship: Solid green lines = positive driving, solid red lines = negative inhibition, dashed lines = weak or insignificant influence; the values on the lines are path coefficients (quantifying the strength of influence).
3. Discussion
3.1. Differences in PTN Structure Among Herbs, Shrubs and Trees
Plants of different life forms show significant differences in their ecosystem functions and resource-use efficiency [25]. Herbs exhibited the greatest variation in PTN structure between the two soil water-salt environments: D and CC increased significantly under the high soil water-salt environment, while D decreased significantly under the low soil water-salt environment. This variation is closely related to the adaptive shift of their central traits (LT) under high soil water-salt environment and N:P ratio under low soil water-salt environment), indicating that herbs are highly sensitive to changes in soil water-salt environment [26].
Under high soil water-salt environment, the PTN of herbs showed resource integration characteristics of high D and high CC, with LT as the central trait. Li et al. hypothesized in their study on leaf trait networks that leaf thickness and related traits serve as central traits because they connect multiple physiological processes within leaves and may form the basic framework of leaf trait correlations [15]. Studies have shown that leaf thickness not only affects plant photosynthetic rate but also reflects plant strategies for water acquisition and utilization [27,28]. In contrast, under low soil water-salt environment, the network showed higher MD and the central trait shifted from LT to N:P ratio. This shift reflects the high sensitivity of herbs to environmental changes regulated by soil water-salt and nutrient trade-off. Consistent with Luo et al., desert herbs adapt rapidly to environmental fluctuations by adjusting central traits [29].
In contrast to the highly plastic strategy of herbs, shrubs show stable and strongly synergistic trait networks with clear adaptive advantages in both environments. Under low soil water-salt environment, shrubs maintain high D and CC but low MD. They enhance resource use efficiency via strong trait coordination and reduce environmental stress impacts, thus sustaining network homeostasis. Shan et al. (2025) also observed a similar adaptation pattern in their study on shrubs and herbs in the arid regions of Northwest China, confirming the universality of this trait network integration strategy in woody plants of arid areas. In addition, the central traits of shrub PTNs are centered on N and C:N ratio. The stability of central traits maintains the synergistic associations among traits, and their population abundance shows an adaptive increase trend in low soil water-salt environment, with more complex PTN connections. This may be because plants in resource-poor environments face stronger selection pressure and are more inclined to form close trait associations and trade-offs; higher interdependence among traits enables plants to acquire and mobilize resources more effectively [30].
Trees adopt a conservative adaptation strategy characterized by low coordination, high MD, and strong stability. This strategy is mainly reflected in maintaining low network D and CC, and reducing the impact of environmental disturbances through modular structure [31]. Similar to the adaptation mode of subtropical forest PTNs [32], this conservative strategy helps trees cope with extreme water-salt stress and maintain long-term resource-use efficiency. Similar findings have been reported in studies on subtropical forest succession, where the MD of leaf trait networks increases with succession progress, helping plants adapt to environmental changes through functional diversification [15]. In arid and semi-arid regions, high (MD) of PTNs is an important strategy to cope with resource scarcity and environmental heterogeneity, which is consistent with Wang et al. This differentiation confirms that environmental and life form factors jointly regulate PTN structure, supporting the dual adaptation machine ism of “environmental driving + life form regulation” for plant survival [33]. Meanwhile, the PTN structure undergoes adaptive adjustments in response to environmental stress, showing significant life form differentiation and environmental response characteristics [34].
3.2. Responses of Desert Plant Trait Networks to Soil Environmental Variations
Plant growth and development are closely associated with their habitat, and resource-use strategies are significantly modulated by habitat quality [10]. Soil water-salt heterogeneity is the key driver for structural divergence of desert PTNs. Under high water-salt environment, most network structure of herbs and trees were higher than those under low water-salt environment, whereas D and CC of shrub PTNs were lower. Soil TN and TP served as key driver of network structure. Soil TN and TP represent the most common limiting nutrients for plant growth in terrestrial ecosystems [35,36], and higher TN and TP contents can enhance network connectivity and local clustering [34]. This partly explains the more complex network structure observed under high soil water-salt environment. These results indicate that resource-abundant habitats with sufficient soil water, salt, and nutrients allow plants to develop more complex and tightly coupled trait networks. Strengthening functional trait interactions further improves resource-use efficiency, enabling plants to adapt to the combined stress of soil water and salinity [11].
A shift from high to low soil water-salt environment is accompanied by decreased water, salinity, and nutrient contents, resulting in soil impoverishment. Under low soil water-salt environment, the negative effects of SWC and SSC on TN and TP indicate that this environment inhibits nutrient accumulation, thereby weakening the positive regulatory effect of nutrients on PTN parameters. Drought stress limits nutrient supply through mineralization, while reducing nutrient diffusion and mass flow in the soil; the decrease in soil moisture further impairs plant nutrient uptake [8]. Plants enhance resource retention capacity by simplifying trait associations, ultimately leading to simplified PTN structures characterized by low connectivity and low synergy [37,38]. Meanwhile, water and salt stress increases leaf mesophyll cell density, resulting in thicker and smaller leaves [39], which is consistent with the greater leaf thickness and smaller leaf in low soil water-salt environment area in this study. The transition from “high connectivity and low constraint” under high soil water-salt conditions to “low connectivity and high constraint” under low soil water-salt environment essentially reflects the adaptive survival strategies of plants in response to varying soil water and salt availability [22,34].
4. Materials and Methods
4.1. Overview of the Study Area
The Ebinur Lake Wetland National Nature Reserve is situated in northwestern Jinghe County, Bortala Mongolian Autonomous Prefecture, Xinjiang, China (44°30'-45°09'N, 82°36'-83°50'E). It acts as a hub for water and salt convergence and is located in the lowest depression on the southwest margin of the Junggar Basin. The reserve has a typical temperate continental desert environment, with year-round dry conditions. The average annual temperature is 7.8 °C, while the recorded maximum and lowest temperatures are 41.3°C and −36.4 °C, respectively. The annual precipitation is barely 105.17 mm, compared with an annual evaporation of 2221.3 mm [26]. The Aqikesu River, which flows through the study area and is located on the eastern side of the Ebinur Lake, is one of the lake’s water sources. The Ebinur Lake’s distinct ecological setting supports diverse desert plant, including various herbaceous, shrub, and tree species. Herbaceous plants include Phragmites australis, Suaeda prostrata, Glycyrrhiza uralensis, Salsola collina, Suaeda microphylla, Salsola aperta, Agriophyllum squarrosum etc. Shrubs include Karelinia capsica, Apocynum venetum, Alhagi sparsifolia, Suaeda salsa, Reaumuria songarica, Nitraria tangutorum, Kalidium foliatum, Halimodendron halodendron, Halostachys capsica, Halocnemum strobilaceum, Salsola ruthenica, Calligonum mongolicum, Horaninowia ulicina. Tree species include Populus euphratica, Haloxylon ammodendron, and Tamarix ramosissima etc. In recent years, due to human activities and climate change, environmental stress in the reserve has increased, posing a threat of degradation to the local riparian vegetation [8].
4.2. Research Methods
4.2.1. Field Survey and Plant Trait Measurement
Three transects (each approximately 1 km in length) were established perpendicular to the Aqikesu River, with an interval of 1 km between adjacent transects. A sampling point was set every 0.1 km along each transect, and three 10 m × 10 m quadrats were investigated at each sampling point, with a spacing of approximately 100 m between quadrats. Through this design, a total of 30 sampling points and 90 quadrats (30 × 3) were established across the three transects. To comprehensively characterize the soil moisture, salt, and nutrient status in the quadrats, 0–15 cm soil samples were collected from three random bare-soil spots in each quadrat, thoroughly mixed, and stored in self-sealing bags for laboratory analysis.
The target species we selected were abundant in the study area. Such species are widely distributed within the community, account for a large proportion of total abundance, and constitute essential community components. Three individuals were randomly selected per target species, and their plant height, crown width and basal diameter were measured. From each individual, three healthy, intact mature leaves of comparable size were sampled.
The following procedures were used to measure the collected leaves: The relative chlorophyll (Chl) content was determined using a SPAD-502 chlorophyll meter. Leaf thickness (LT) was measured near the center of the leaf (avoiding the major vein) with a vernier caliper (precision: 0.01 mm), and the average value was taken as the individual leaf thickness. Following labeling, the leaves were flattened with a transparent plastic sheet and photographed with a ruler to determine leaf area (LA). After measuring the above indicators, roughly 20 g of leaves were collected from each of the three individuals of each species, placed in labelled envelopes, and returned to the laboratory for subsequent analysis. The leaf samples were dried in an oven at 75 °C for 48 hours, ground into powder, and sieved to determine carbon (C), nitrogen (N), and phosphorus (P) contents, with the specific laboratory determination methods as follows: leaf organic carbon was measured using the potassium dichromate dilution heat method; leaf total nitrogen was analyzed via the Kjeldahl method (after H2SO4-H2O2 digestion); and leaf total phosphorus was determined via the molybdenum-antimony anti-colorimetric method (after H2SO4-H2O2 digestion) [40].
4.2.2. Soil Sample Analysis
Soil samples were collected from the 0–15 cm layer at three random bare-soil locations within each quadrat, mixed thoroughly, and stored in self-sealing bags for laboratory analysis.
Soil water content (SWC) was determined using the oven-drying method, and soil salt content (SSC) was measured via the conductivity method. Soil organic carbon (SOC) was analyzed using the potassium dichromate dilution heat method, soil total nitrogen (TN) via the Kjeldahl method, and soil total phosphorus (TP) using the HClO4-H2SO4 molybdenum-antimony anti-colorimetric method [40].
4.2.3. Data Analysis
For the measured plant traits, Pearson correlation analysis was first conducted to construct a correlation coefficient matrix A=[ai,j]. Plant traits were treated as nodes, and the correlations between them as edges. Herein, ai,j ϵ [0,1] was generated by assigning a value of 1 to correlations exceeding the significance threshold and 0 to those below it; the defined significance threshold was |r|>0.2 with P < 0.05. The topological structure of these relationships was visualized using R software to construct plant trait networks (PTNs). The “igraph” package in R was used to visualize network topology. Three key topological parameters were calculated to quantify PTN characteristics: (1) Density (D): Represents the degree of aggregation among all node traits in the network; (2) Clustering coefficient (CC): The average value of the clustering coefficients of all traits, measuring the average probability that adjacent traits of a given trait are connected; (3) Modularity (MD): Describes the degree of differentiation among sub-networks (modules) within the PTN.
Structural equation modeling was used to explore the direct and indirect effects of soil environmental factors on PTN topological parameters under high and low soil water-salt environments. The SEM model included water-salt factors as exogenous variables, nutrient factors as intermediate variables, and PTN structures endogenous variables. Path coefficients were estimated to evaluate the strength and direction of effects. The SEM analysis was performed using the “lavaan” package in R software.
5. Conclusions
This study clarifies the distinct PTN structures among herb, shrub, and tree species in a typical desert ecosystem, which elucidates their divergent adaptation strategies to abiotic stress environments. There were significant differences in the central traits of PTNs among different life forms: Herbs (central traits: leaf thickness, N:P ratio) had high-density PTNs and strong adaptability, which could quickly adjust to environmental changes; Shrubs (central traits: C, P) had stable PTN connectivity, providing support for community stability; Trees (central traits: N, C:P ratio) had high-modularity PTNs, with strong anti-interference ability. Different life forms had distinct ecological functions: herbaceous plants promoted rapid resource turnover, shrubs maintained community stability, and trees focused on long-term stress resistance. Soil water-salt and nutrient factors jointly regulated the PTN structure: under high soil water-salt environment, TN and TP were the key factors affecting PTN structure; under low soil water-salt environment, SSC and SWC exerted negative effects on PTN structure, increasing the difficulty of plant adaptation. The PTN structure was jointly regulated by soil moisture, salinity, and nutrient availability. Under high water-salt conditions, TN and TP were the dominant factors influencing PTN structure. In contrast, under low water-salt conditions, soil SSC and SWC exerted negative effects on the PTN structure, thereby increasing the adaptive pressure on plants. In conclusion, the PTN structure reflects desert plants’ adaptation to water-salt stress, providing theoretical support for arid zone vegetation protection.
Author Contributions
Conceptualization, J.Y. and X.Z.; methodology, J.Y. and X.Z.; software, J.Y., and Y.C. Y.C.; validation, J.Y.; investigation, J.Y., Y.C., and M.X.; formal analysis, J.Y.; data curation, J.Y. H.L., and J.H.; writing—original draft preparation, J.Y., and M.X.; writing—review and editing, J.Y. and X.Z.; supervision, X.Z.; funding acquisition, X.Z. All authors have read and agreed to the published version of the manuscript.
Funding
This research was supported by the Natural Science Foundation of Xinjiang Uygur Autonomous Region (2023D01C12) and National Natural Science Foundation of China (32360277).
Data Availability Statement
The original contributions presented in this study are included in the article. Further inquiries can be directed to the corresponding author.
Acknowledgments
The authors sincerely thank the staff of Ebinur Lake Wetland National Nature Reserve for their great support and assistance during field sampling and data acquisition. We appreciate all teachers and colleagues in the research group for their valuable suggestions and technical help during the experiment implementation and manuscript writing. This study was supported by [the Natural Science Foundation of Xinjiang Uygur Autonomous Region (2023D01C12) and National Natural Science Foundation of China (32360277)]. The authors take full responsibility for all the content of this paper.
Conflicts of Interest
The authors declare that they have no conflict of interest.
Abbreviations
The following abbreviations are used in this manuscript:
| MDPI | Multidisciplinary Digital Publishing Institute |
| DOAJ | Directory of open access journals |
| TLA | Three letter acronym |
| LD | Linear dichroism |
References
- Westoby, M.; Falster, D.S.; Moles, A.T.; Vesk, P.A.; Wright, I.J. Plant Ecological Strategies: Some Leading Dimensions of Variation Between Species. Annu. Rev. Ecol. Syst. 2002, 33, 125–159. [Google Scholar] [CrossRef]
- Iqbal, U.; Hameed, M.; Ahmad, F.; Ahmad, M.S.A.; Naz, N.; Ashraf, M.; Kaleem, M. Modulation of structural and functional traits in facultative halophyte Salvadora oleoides Decne. For adaptability under hyper-arid and saline environments. J. Arid Environ. 2023, 213, 104965. [Google Scholar] [CrossRef]
- Hu, D.; Lv, G.H.; Qie, Y.D.; Wang, H.F.; Yang, F.; Jiang, L.M. Response of Morphological Characters and Photosynthetic Characteristics of Haloxylon ammodendron to Water and Salt Stress. 2021, 13, 388. [Google Scholar] [CrossRef]
- Bruelheide, H.; Dengler, J.; Purschke, O.; Lenoir, J.; Jiménez-Alfaro, B.; Hennekens, S.M.; Botta-Dukát, Z.; Chytrý, M.; Field, R.; Jansen, F.; et al. Global trait–environment relationships of plant communities. Nat. Ecol. Evol. 2018, 2, 1906–1917. [Google Scholar] [CrossRef] [PubMed]
- Yin, Q.L.; Wang, L.; Lei, M.L.; Dang, H.; Quan, J.X.; Tian, T.T.; Chai, Y.F.; Yue, M. The relationships between leaf economics and hydraulic traits of woody plants depend on water availability. Sci. Total Environ. 2018, 621, 245–252. [Google Scholar] [CrossRef] [PubMed]
- Diaz, S.; Kattge, J.; Cornelissen, J.H.; Wright, I.J.; Lavorel, S.; Dray, S.; Reu, B.; Kleyer, M.; Wirth, C.; Prentice, I.C.; et al. The global spectrum of plant form and function. Nature 2016, 529, 167–171. [Google Scholar] [CrossRef] [PubMed]
- Wang, H.; Ma, J.; Chen, Y.; Xie, T.; Niu, F.; He, C.; Zhao, Y.; Yang, J.; Shan, L. Fine root trait networks reveal plant adaptation strategies across arid habitats and life forms in northwest China. Ecol. Indic. 2026, 182, 114596. [Google Scholar] [CrossRef]
- Yang, J.F.; Zhang, X.N.; Song, D.H.; Wang, Y.C.; Tian, J.Y. Interspecific Integration of Chemical Traits in Desert Plant Leaves with Variations in Soil Water and Salinity Habitats. 2023, 14, 1963. [Google Scholar] [CrossRef]
- Pivovaroff, A.L.; Pasquini, S.C.; De Guzman, M.E.; Alstad, K.P.; Stemke, J.S.; Santiago, L.S. Multiple strategies for drought survival among woody plant species. Funct. Ecol. 2016, 30, 517–526. [Google Scholar] [CrossRef]
- Yang, X.D.; Anwar, E.; Zhou, J.; He, D.; Gao, Y.C.; Lv, G.H.; Cao, Y.E. Higher association and integration among functional traits in small tree than shrub in resisting drought stress in an arid desert. Environ. Exp. Bot. 2022, 201. [Google Scholar] [CrossRef]
- He, N.P.; Li, Y.; Liu, C.C.; Xu, L.; Li, M.X.; Zhang, J.H.; He, J.S.; Tang, Z.Y.; Han, X.G.; Ye, Q.; et al. Plant Trait Networks: Improved Resolution of the Dimensionality of Adaptation. Trends Ecol. Evol. 2020, 35, 908–918. [Google Scholar] [CrossRef] [PubMed]
- Powell, T.L.; Wheeler, J.K.; de Oliveira, A.A.R.; da Costa, A.C.L.; Saleska, S.R.; Meir, P.; Moorcroft, P.R. Differences in xylem and leaf hydraulic traits explain differences in drought tolerance among mature Amazon rainforest trees. Glob. Change Biol. 2017, 23, 4280–4293. [Google Scholar] [CrossRef] [PubMed]
- Poorter, H.; Lambers, H.; Evans, J.R. Trait correlation networks: a whole-plant perspective on the recently criticized leaf economic spectrum. New Phytol. 2014, 201, 378–382. [Google Scholar] [CrossRef] [PubMed]
- Messier, J.; Lechowicz, M.J.; McGill, B.J.; Violle, C.; Enquist, B.J.; Cornelissen, H. Interspecific integration of trait dimensions at local scales: the plant phenotype as an integrated network. J. Ecol. 2017, 105, 1775–1790. [Google Scholar] [CrossRef]
- Li, Y.; Liu, C.C.; Sack, L.; Xu, L.; Li, M.X.; Zhang, J.H.; He, N.P. Leaf trait network architecture shifts with species-richness and climate across forests at continental scale. Ecol. Lett. 2022, 25, 1442–1457. [Google Scholar] [CrossRef] [PubMed]
- Rao, Q.Y.; Su, H.J.; Ruan, L.W.; Xia, W.L.; Deng, X.W.; Wang, L.T.; Xu, P.K.; Shen, H.; Chen, J.; Xie, P. Phosphorus enrichment affects trait network topologies and the growth of submerged macrophytes. Environ. Pollut. 2022, 292, 118331. [Google Scholar] [CrossRef] [PubMed]
- Wang, L.T.; Rao, Q.Y.; Su, H.J.; Ruan, L.W.; Deng, X.W.; Liu, J.R.; Chen, J.; P, X. Linking the network topology of plant traits with community structure, functioning, and adaptive strategies of submerged macrophytes. Sci. Total Environ. 2022, 850, 158092. [Google Scholar] [CrossRef] [PubMed]
- Yuan, G.X.; Tan, X.Y.; Guo, P.Q.; Xin, K.; Chen, Z.L.; Li, D.B.; Yu, S.Z.; Peng, H.; Li, W.; Fu, H.; et al. Linking trait network to growth performance of submerged macrophytes in response to ammonium pulse. Water Res. 2023, 229, 119403. [Google Scholar] [CrossRef] [PubMed]
- Yang, X.D.; Zhang, X.N.; Lv, G.H.; Ali, A. Linking Populus euphratica Hydraulic Redistribution to Diversity Assembly in the Arid Desert Zone of Xinjiang, China. PLoS ONE 2014, 9. [Google Scholar] [CrossRef] [PubMed]
- Gao, D.X.; Wang, S.; Wei, F.L.; Wu, X.T.; Zhou, S.; Wang, L.X.; Li, Z.D.; Chen, P.; Fu, B.J. The vulnerability of ecosystem structure in the semi-arid area revealed by the functional trait networks. Ecol. Indic. 2022, 139. [Google Scholar] [CrossRef]
- Akram, M.A.; Wang, X.T.; Hu, W.G.; Xiong, J.L.; Zhang, Y.H.; Deng, Y.Z.; Ran, J.Z.; Deng, J.M. Convergent Variations in the Leaf Traits of Desert Plants. Plants 2020, 9. [Google Scholar] [CrossRef] [PubMed]
- Yuan, K.Y.; Xu, H.; Zhang, G.P.; Yan, J.J. Aridity and High Salinity, Rather Than Soil Nutrients, Regulate Nitrogen and Phosphorus Stoichiometry in Desert Plants from the Individual to the Community Level. 2022, 13, 890. [Google Scholar] [CrossRef]
- Zhang, X.; Li, Y.H.; Li, F.D. Spatial distribution characteristics of soil water-salt gradients in the ecological buffer zone of arid zone lakes and their influencing factors. J. Clean. Prod. 2024, 444, 141299. [Google Scholar] [CrossRef]
- Li, S.J.; Zhou, X.Y.; Lu, L.D.; Zhang, Z.X.; White, J.F.; Liu, H.F.; Miao, Y.X.; Yang, L.; Du, B.; Wang, Z.K. Soil properties rather than climate dominate the variation of leaf trait network structure in desert ecosystems: a case study from the Hexi Corridor, Northwestern China. Ecol. Indic. 2026, 183, 114644. [Google Scholar] [CrossRef]
- Janovský, Z.; Herben, T. Reaching similar goals by different means – Differences in life-history strategies of clonal and non-clonal plants. Perspect. Plant Ecol. Evol. Syst. 2020, 44, 125534. [Google Scholar] [CrossRef]
- Tusifujiang, Y.L.K.; Zhang, X.N.; Gong, L. The relative contribution of intraspecific variation and species turnover to the community-level foliar stoichiometric characteristics in different soil moisture and salinity habitats. PLoS ONE 2021, 16, e0246672. [Google Scholar] [CrossRef] [PubMed]
- Longstreth, D.J.; Strain, B.R. Effects of salinity and illumination on photosynthesis and water balance of Spartina alterniflora Loisel. Oecologia 1977, 31, 191–199. [Google Scholar] [CrossRef] [PubMed]
- Mclean, E.H.; Prober, S.M.; Stock, W.D.; Steane, D.A.; Potts, B.M.; Vaillancourt, R.E.; Byrne, M. Plasticity of functional traits varies clinally along a rainfall gradient in Eucalyptus tricarpa. Plant Cell Environ. 2014, 37, 1440–1451. [Google Scholar] [CrossRef] [PubMed]
- Luo, Y.; Peng, Q.W.; Li, K.H.; Gong, Y.M.; Liu, Y.Y.; Han, W.X. Patterns of nitrogen and phosphorus stoichiometry among leaf, stem and root of desert plants and responses to climate and soil factors in Xinjiang, China. CATENA 2021, 199, 105100. [Google Scholar] [CrossRef]
- Flores-Moreno, H.; Fazayeli, F.; Banerjee, A.; Datta, A.; Kattge, J.; Butler, E.E.; Atkin, O.K.; Wythers, K.; Chen, M.; Anand, M.; et al. Robustness of trait connections across environmental gradients and growth forms. Glob. Ecol. Biogeogr. 2019, 28, 1806–1826. [Google Scholar] [CrossRef]
- Terrer, C.; Jackson, R.B.; Prentice, I.C.; Keenan, T.F.; Kaiser, C.; Vicca, S.; Fisher, J.B.; Reich, P.B.; Stocker, B.D.; Hungate, B.A.; et al. Nitrogen and phosphorus constrain the CO2 fertilization of global plant biomass. Nat. Clim. Change 2019, 9, 684–689. [Google Scholar] [CrossRef]
- Li, X.N.; Li, Z.F.; Xu, Z.X.; Lu, Z.Y.; Fan, Z.X.; Chen, Y.J.; Zhang, S.B. Leaf trait networks shift toward high modularity during the succession of a subtropical forest, in southwest China. Ecol. Indic. 2024, 166, 112490. [Google Scholar] [CrossRef]
- Wang, X.T.; Ji, M.F.; Zhang, Y.H.; Zhang, L.; Akram, M.A.; Dong, L.W.; Hu, W.G.; Xiong, J.L.; Sun, Y.; Li, H.; et al. Plant trait networks reveal adaptation strategies in the drylands of China. BMC Plant Biol. 2023, 23, 266. [Google Scholar] [CrossRef] [PubMed]
- Yang, C.; Chen, Y.T.; Sun, W.Y.; Zhang, Q.; Diao, M.M.; Sun, J. Extreme soil salinity reduces N and P metabolism and related microbial network complexity and community immigration rate. Environ. Res. 2025, 264, 120361. [Google Scholar] [CrossRef] [PubMed]
- Du, E.; Terrer, C.; Pellegrini, A.F.A.; Ahlström, A.; van Lissa, C.J.; Zhao, X.; Xia, N.; Wu, X.; Jackson, R.B. Global patterns of terrestrial nitrogen and phosphorus limitation. Nat. Geosci. 2020, 13, 221–226. [Google Scholar] [CrossRef]
- Güsewell, S. N: P ratios in terrestrial plants: variation and functional significance. New Phytol. 2004, 164, 243–266. [Google Scholar] [CrossRef] [PubMed]
- Funk, J.L.; Larson, J.E.; Ames, G.M.; Butterfield, B.J.; Cavender-Bares, J.; Firn, J.; Laughlin, D.C.; Sutton-Grier, A.E.; Williams, L.; Wright, J. Revisiting the Holy Grail: using plant functional traits to understand ecological processes. Biol. Rev. 2017, 92, 1156–1173. [Google Scholar] [CrossRef] [PubMed]
- Luo, Y.H.; Shen, Y.; Elrys, A.S.; Du, L.; Mahmood, M.; Zhang, J.T.; Ren, H.Y.; Zhang, J.B.; Li, N.; Tian, R.; et al. Drought and nitrogen deposition regulate plant nutrient resorption in a typical steppe. Agric. Ecosyst. Environ. 2024, 374, 109160. [Google Scholar] [CrossRef]
- Nawazish; Hameed, M.; Naurin, S. Leaf anatomical adaptations of Cenchrus ciliaris L., from the Salt Range, Pakistan against drought stress. Pak. J. Bot. 2006, 38, 1723–1730. [Google Scholar]
- Dong, M. observation and analysis of terrestrial biocommunities; Standards Press of China, 1997. [Google Scholar]

Table 1.
Soil factors differences between high and low soil water-salt environments.
| Soil water-salt environment | Soil water content | Soil salt content | Soil organic carbon | Total nitrogen | Total phosphorus |
|---|---|---|---|---|---|
| SWC/(%) | SSC/(g/kg) | SOC/(g/kg) | TN/(g/kg) | TP/(g/kg) | |
| High | 7.92±3.12a | 10.14±4.66a | 4.41±2.51a | 1.19±0.66a | 0.58±0.10a |
| Low | 3.83±1.26b | 4.74±1.25b | 3.09±1.79b | 0.67±0.34b | 0.49±0.06a |
*Different letters indicate significant differences of soil indices between different soil environments (p < 0.05).
Table 2.
Information on the eight plant species studied.
| life form | plant species name | Family | genera | Abundance | |
|---|---|---|---|---|---|
| high water-salt | low water-salt |
||||
| Herb | Glycyrrhiza uralensis | Fabaceae | Glycyrrhiza | 296 | 10 |
| Phragmites australis | Poaceae | Phragmites | 2551 | 2247 | |
| Shrub | Nitraria tangutorum | Zygophyllaceae | Nitraria | 60 | 205 |
| Apocynum venetum | Apocynaceae | Apocynum | 1176 | 1211 | |
| Alhagi sparsifolia | Fabaceae | Alhagi | 254 | 636 | |
| Halimodendron halodendron | Fabaceae | Halimodendron | 100 | 0 | |
| Karelinia capsica | Asteraceae | Karelinia | 257 | 246 | |
| Tree | Populus euphratica | Salicaceae | Populus | 53 | 26 |
Table 3.
Plant traits differences between high and low soil water salinity environments .
| plant functional traits | unit | soil water-salt environment | |
|---|---|---|---|
| high | low | ||
| C | g/kg | 465.88±30.22a | 460.12±28.43a |
| N | g/kg | 20.10±7.25a | 17.04±5.94b |
| P | g/kg | 1.26±0.24b | 1.37±0.38a |
| C:N | / | 26.95±9.54b | 31.04±10.62a |
| C:P | / | 389.06±70.58a | 368.75±78.48b |
| N:P | / | 16.79±6.67a | 14.05±6.57b |
| LT | mm | 0.39±0.14b | 0.48±0.18a |
| Chl | mg/g | 49.01±7.74a | 48.95±8.69a |
| LA | cm2 | 7.60±8.27a | 7.25±9.00a |
*Different letters indicate significant differences of plant trait indices between different soil environments (p < 0.05).
Table 4.
Differences in plant trait network structure between high and low soil water-salt environments.
Table 4.
Differences in plant trait network structure between high and low soil water-salt environments.
| Soil water-salt environment | plant species | modularity | density | clustering coefficient |
|---|---|---|---|---|
| High water-salt | Herb | 0.106 | 0.472 | 0.639 |
| Shrub | 0.114 | 0.556 | 0.714 | |
| Tree | 0.167 | 0.25 | 0.632 | |
| Low water-salt | Herb | 0.278 | 0.333 | 0.621 |
| Shrub | 0.019 | 0.694 | 0.884 | |
| Tree | 0.161 | 0.306 | 0.161 |
Disclaimer/Publisher’s Note: The statements, opinions and data contained in all publications are solely those of the individual author(s) and contributor(s) and not of MDPI and/or the editor(s). MDPI and/or the editor(s) disclaim responsibility for any injury to people or property resulting from any ideas, methods, instructions or products referred to in the content. |
© 2026 by the authors. Licensee MDPI, Basel, Switzerland. This article is an open access article distributed under the terms and conditions of the Creative Commons Attribution (CC BY) license (http://creativecommons.org/licenses/by/4.0/).
Copyright: This open access article is published under a Creative Commons CC BY 4.0 license, which permit the free download, distribution, and reuse, provided that the author and preprint are cited in any reuse.


