

Submitted:
29 June 2026
Posted:
30 June 2026
You are already at the latest version
Abstract
The conversion of carbon dioxide (CO2) driven by microwave plasma has garnered extensive attention due to its capability to recycle carbon resources and mitigate the greenhouse effect. However, the existing microwave plasma technologies suffer from cumbersome system setups and relatively low energy efficiency. This work investigates the CO2 conversion using a portable atmospheric microwave plasma source, which requires low plasma-generating power. When the working gas is a mixture of CO2 and Ar, the minimum plasma-generating power required for the proposed portable microwave plasma source is only 50 W. A Fourier transform infrared spectrometer is used to quantify both the CO2 and CO concentrations, and the C2 Swan bands of the plasma are measured to determine the gas temperature. The maximum CO2 conversion rate is approximately 12.7%. Furthermore, the maximum energy efficiency reaches 87.9%, which exceeds that of most of the state-of-the-art atmospheric microwave plasma configurations. Owing to its simplicity of operation, portability, and high energy efficiency, this method is well-suited for distributed CO2 conversion systems.
Keywords:
atmospheric plasma
; coaxial microwave plasma source
; CO2 conversion
; energy efficiency
1. Introduction
As a crucial part of carbon capture, utilization, and storage (CCUS) technology, the conversion of CO2 holds significant importance for the recycling and utilization of carbon resources [1]. This process can convert CO2 into CO which acts as the important raw materials for Fischer-Tropsch synthesis [2]. Besides, developing the CO2 conversion technology is an urgent work to do. According to the monitoring results from National Oceanic & Atmospheric Administration (NOAA), the global daily average concentration of CO2 has risen from around 402 ppm in 2016 to approximately 430 ppm in 2026 [3]. Therefore, the CO2 conversion is beneficial for mitigating greenhouse effect and alleviating global warming.
Under normal temperature and pressure conditions, the chemical properties of CO₂ are highly stable, and an energy input of 750 kJ/mol is required to break the C═O double bond in CO₂. Non-thermal plasma technology is a highly promising approach for CO₂ conversion. Characterized by elevated electron temperatures, which usually range from 1 to 10 eV [4], within the system, it enables the decomposition of CO₂ molecules upon collision with the high-energy electrons, eliminating the requirement for high-temperature, high-pressure conditions or catalysts [5]. At present, a variety of non-thermal plasma configurations have been applied in the research of CO₂ conversion, including the arc plasma [6,7], dielectric barrier discharge (DBD) [8,9], radio-frequency (RF) discharge [10,11], and microwave plasma [12,13]. It is noteworthy that the microwave plasma has garnered growing attention attributed to its distinct advantages including high electron density and temperature, electrode-free configuration, and long operational lifespan.
However, the existing microwave plasma systems are facing the challenge of being unable to achieve high energy efficiency in the conversion of CO2. Most of the reported research results show that the maximum energy efficiency is below 50% [14,15]. To address this problem, many solutions have been proposed, such as reducing the pressure in the microwave plasma reaction system, adjusting the working gas composition and microwave frequency, using alternative clean energy, adopting the quenching technology, and adding a carbon bed in the plasma reaction area, etc. Kiss et al. established the characteristic curves of CO2 plasma, revealing the advantages of reduced pressure in microwave plasma dissociation [16]. Under conditions of using pure CO2 only, with a flow rate of 5 L/h, a pressure of 80 mbar, and a molar energy input of 14.5 MJ/mol, a CO2 conversion rate of 46.4% was achieved through continuous operation in a microwave plasma system without the need for a catalyst. The peak energy efficiency of 10.9% was measured. Their results indicated that reducing pressure could enhance the energy absorbed by the plasma from the electromagnetic field through electron collisions, thereby increasing the CO2 conversion rate. Mansfeld et al. conducted CO2 decomposition experiments using a 24 GHz gyrotron microwave plasma system [17]. Experiments were carried out under atmospheric pressure with both pure CO2 and CO2/Ar mixed gas. When the gas ratio of CO2/Ar was 1:5, the total gas flow rate was 30 L/min, and the global specific energy input (SEI) was 4.7 eV/molecule, the conversion rate reached 31.3% and the energy efficiency was approximately 9.5%. They confirmed by optical spectroscopy that microwave plasmas with electron temperatures in the range of 4000−8000 K and gas temperatures in the range of 2000−3500 K were highly suitable for the effective decomposition of CO2. Mohsenian et al. investigated the CO2 conversion process in solar-enhanced microwave plasma, exploring the effects of electrical power, solar power, flow rate, and gas composition on the CO2 conversion rate and energy efficiency [18]. The experimental results indicated that a solar absorption rate of approximately 21% could be achieved under CO2-Ar operating conditions. Under all studied conditions, the absorbed solar radiation could enhance the CO2 conversion. At 900 W electrical power and 75 W absorbed solar power, the conversion rate increased from approximately 8% to approximately 9%. Using N2 as the auxiliary gas resulted in higher conversion rates and energy efficiency compared to Ar. The highest conversion rate and energy efficiency achieved in the CO2-N2 system were approximately 15.5% and 35%, respectively. The research results suggest that this method has potential application value for treating the CO2-N2 mixture contained in the flue gas of fossil fuel power plants. Chekmarev et al. achieved a threefold increment in CO2 conversion rate and energy efficiency in an atmospheric-pressure discharge plasma supported by microwave radiation from a 24 GHz cyclotron accelerator by cooling the post-discharge region through reverse gas flow [19]. The experiment verified the role of convective heat transfer in the cooling process of the gas mixture in the discharge region. When the N2 quenching gas flow rate was 4.5 L/min, the CO2 conversion rate was 23.8% and the energy efficiency was 19.7%. The experiment also confirmed the possibility of using the cooled gas mixture in the reactor as the quenching gas, which resulted in a CO2 conversion rate of 23.4% and solved the problem of the reaction products being diluted by a third-party gas. Numerical simulations indicated that the increment in conversion rate after the plasma torch structure was destroyed was due to the enhancement of heat exchange with the surrounding gas, and this destruction efficiency was determined by the speed and density of the quenching gas. Kim et al. proposed an enhanced afterglow quenching method by inserting water-cooled rods in the reactor to restrict the recombination of CO and O2, thereby improving the CO2 conversion in an atmospheric microwave plasma system [20]. When the SEI was 7.22 eV/molecule, the CO2 conversion rate increased from 30.1% to 36.1% after using the quenching rods. With an SEI of 1.19 eV/molecule, the energy efficiency reached 28.9%.
Currently, most microwave plasma systems used for CO2 conversion are based on rectangular waveguide configurations. This type of system requires the components such as circulators, water loads, and couplers, resulting in a relatively bulky overall system. Moreover, waveguide-type microwave plasma systems typically necessitate high microwave power to initiate and sustain the plasma discharge, which fundamentally leads to low energy efficiency. In contrast, transmission line-type microwave plasma systems can generate plasma at power levels on the order of hundreds of watts. However, research on utilizing this type of microwave plasma for CO2 conversion is scarce. The coaxial atmospheric-pressure microwave plasma source (CAPMPS) we previously designed exhibits a low power reflection coefficient before plasma excitation and requires only slightly over 100 W to generate plasma [21]. Therefore, in this study, we employed this plasma source for CO2 conversion and investigated its conversion rate and energy efficiency under different process conditions. The results demonstrate that the maximum energy efficiency of this portable plasma source reaches 87.9%, outperforming the vast majority of existing atmospheric-pressure plasma devices, and its conversion rate is 12.7%. Given its low manufacturing and experimental costs, simple operation, and portability, this plasma source holds significant promise for applications in distributed CO₂ conversion scenarios.
2. Materials and Methods
The schematic and photograph of the portable coaxial atmospheric-pressure microwave plasma source (PCAPMPS) we adopted in this work is presented in Figure 1. It is composed of a coaxial transmission line with a short-circuited termination and a coaxial transmission line with an open-circuited termination connected in parallel.
Specifically, for the open-circuited part, the inner and outer conductors of two separate transmission line segments are tapered respectively to achieve impedance matching prior to plasma excitation. The end with a short-circuited termination is equipped with three gas inlets. An N-type connector serves as the coaxial connector. The detail dimensions of this device are l1=32.5 mm, l2=35.5 mm, l3=64 mm, l4=3.5 mm, Φ1=3.2 mm, Φ2=100 mm, Φ3=0.9 mm, Φ4=10 mm. The tuning screw at the end of the open-circuited part is perpendicular to the inner conductor. Its tuning process is shown in Figure 1(c), where the tuning distance between the screw and the inner conductor is from 0 mm to 5 mm.
The experimental setup comprises the microwave system, gas supply unit, and spectral detection system. The schematic of the experimental setup is shown in Figure 2. The solid-state microwave power source, PCAPMPS, and PC constitute the microwave system. This microwave power source (PA2425-250, LingguangTech, Jiaxing, China) has an output frequency range from 2.4 GHz to 2.5 GHz and a maximum output power value of 250 W. It is controlled by a PC. The PCAPMPS is connected to the microwave power source by a coaxial cable. The gas supply unit includes the mass flow controller (MFC, KT-C4Z, Ketan, Zhengzhou, China) and both Ar and CO2 gas bottles. The gas flow rate is regulated by the MFC. The concentrations of Ar and CO2 are 99.99% and 99.999%, respectively. The optical emission spectrum (OES) of the plasma and the infrared absorption spectrum (IAS) of the product gases are measured by the spectrometer (USB2000+, Ocean Optics, Orlando, FL, USA) and the Fourier transform infrared spectrometer (FTIR, Vertex 70, Bruker, Ettlingen, Germany), respectively. The spectral resolution of the spectrometer is 0.1 nm.
When measuring the IAS, the product gases were introduced into a gas cell, both the top and bottom of the gas cell were made of calcium fluoride windows that possessed a transmittance of over 80% within the infrared spectrum range. After several minutes, the IAS curves became stable and were recorded. In this work, distinct characteristic absorption peaks corresponding to CO and CO2 were detected at wavenumbers of approximately 2119 cm−1 and 2349 cm−1, respectively [22]. The calibration procedure for gas concentration consisted of measuring the IAS of multiple standard gases of CO and CO2, whose concentrations were already known. After that, the correlation between the characteristic absorption peak and the gas concentration was derived [23,24]. Each experimental measurement was replicated a minimum of five times to get rid of random errors. The ultimate data utilized were the averages of these measured results.
The OES of the plasma and the open-source software massiveOES are used to diagnose the plasma gas temperature Tgas [25]. The method, detailed in [26], involves fitting the C2 (d3Πg-a3Πu) Swan bands. Under the assumption of Boltzmann distributions for rotational and vibrational populations, we firstly fitted the ∆ν = 0 transition group (475–517 nm) to derive the rotational temperature Trot. This Trot was then fixed to fit the ∆ν = +1 transition group (450–475 nm) and obtain the vibrational temperature Tvib. As established in [27], under atmospheric-pressure high-temperature plasmas (such as our atmospheric microwave plasma), the value of Trot is very close to that of Tgas so that we use Trot to approximates Tgas.
3. Results and Discussion
3.1. Power Reflection Ratio
Before plasma excitation, the power reflection ratio of the PCAPMPS was measured by the built-in power meter of the solid-state microwave power source, and the results are presented in Figure 3. It is clearly evident that as the tuning distance increases from 0 mm to 5 mm, the resonant frequency of this device remains essentially unchanged, while the power reflection ratio varies slightly. When the tuning distance is 3 mm, the power reflection ratio reaches its smallest, approaching 0. The resonant frequency of this PCAPMPS is 2448 MHz, which shows a deviation of 2 MHz from the designed value of 2450 MHz. Regarding the cause of this deviation, given that this device features a strong resonant structure, even a minor deviation in its size can lead to a shift in the resonant frequency point. The actual processing error is approximately ± 0.1 mm, which accounts for this frequency deviation.
3.2. IAS of the Product Gases
After the plasma is ignited, the IAS curves of the product gases are measured by the FTIR. Figure 4 shows one of the curve when the input microwave power is approximately 80 W, with a tuning distance of 3 mm and the gas flow rate of Ar : CO₂ = 3 L/min : 1 L/min. The measurement results reveal that the product gases contain CO along with a substantial quantity of CO2. This indicates that merely a fraction of CO2 has undergone conversion, with a considerable amount remaining unconverted. Additionally, NO and NO2 are present in the product gases. The reason for this is that our experiments are operated under ambient conditions, allowing some air to enter the plasma and subsequently be converted into NOx. According to the absorbance of the characteristic peaks of CO and CO2, the concentrations of these two gases can be determined [22].
3.3. OES and Gas Temperature of the Plasma
The OES of the plasma is measured by the spectrometer. Figure 5 shows the OES curve at 80 W, with Ar : CO₂ = 3 L/min : 1 L/min, and a tuning distance of 3 mm. The spectral range spans from 250 nm to 850 nm, covering the entire visible spectrum. It is worth noting that due to the presence of CO2 in the plasma, the C2 Swan bands are clearly observed in the wavelength range of 450~570 nm. These bands consist of two spectral branches corresponding to the ∆ν = 0 and ∆ν = +1 transition groups. By fitting these two branches using the open-source massiveOES software, the rotational temperature Trot and vibrational temperature Tvib can be obtained separately. Under the plasma conditions in this work, Trot can be approximated as equal to the gas temperature. Therefore, we obtained the plasma gas temperature Tgas under different microwave power values, and the results are shown in Figure 6. As the microwave power increases, the plasma gas temperature rises almost linearly. When the input microwave power increases from 50 W to 200 W, the gas temperature rises from approximately 80 °C to nearly 200 °C. At a tuning distance of 3 mm, the gas temperature at a given power level is slightly higher than that without tuning. This is likely because the power reflection ratio at a tuning distance of 3 mm is lower than that at 0 mm, resulting in more efficient power coupling to the plasma. This trend is illustrated in Figure 3.
Compared to microwave power, the gas flow rate and gas composition have a less pronounced effect on the plasma gas temperature (and thus the variation of gas temperature with gas flow rate and composition is not presented here). As the total gas flow rate or the Ar proportion increases, the gas temperature decreases slightly. This is because a higher flow rate causes heat to be rapidly carried away from the plasma region and dissipated, while the presence of Ar significantly reduces the efficiency of electron energy conversion into thermal energy via molecular vibrational-translational energy relaxation pathways.
3.4. CO2 Conversion Rate
The conversion rate of CO2 in the microwave plasma is defined by
where represents the CO2 concentration of the input gases, while indicates that of the output gases. The gas concentration units are uniformly standardized to parts per million (ppm). Figure 7 below illustrates the conversion rate of CO₂ in our PCAPMPS under varying microwave power levels and gas flow rates, with the tuning distance set to both 0 mm and 3 mm. It is seen that when the gas flow rate is fixed, the conversion rate will increase with the microwave power. This is due to the increment of the specific energy input (SEI) which refers to the average energy dissipated in a single gas molecule. The definition of SEI is given by
where Pm stands for the microwave power. When the Ar flow rate increases from 1 L/min to 3 L/min, the CO2 conversion rate increases slightly. Because the participation of Ar has resulted in the Penning effect, wherein excited Ar atoms facilitate the conversion of CO2 molecules into CO molecules. Compared with the untuned case, the conversion rate at a tuning distance of 3 mm is marginally higher. The maximum conversion rate of 12.7% is achieved at a microwave power level of 200 W with the gas flow rates of Ar : CO₂ = 3 L/min : 1 L/min, and the tuning distance of 3 mm.
3.5. Energy Efficiency
The enthalpy change (ΔHo) of the conversion from CO2 into CO is used to calculate the energy efficiency [28]. The reaction formula of CO2 conversion is given as
Results of the energy efficiency are show in Figure 8. When the microwave power increases from 50 W to 200 W, the energy efficiency will gradually decrease, regardless of the changes in the flow rates of Ar and CO2. As evidenced by the results in Figure 6 and Figure 7, increasing the microwave power enhances CO₂ conversion; however, a larger fraction of the microwave energy is dissipated as heat in the plasma, leading to a monotonic increment in the gas temperature and a decline in overall energy efficiency. When the microwave power is kept constant, the energy efficiency generally increases with the increment in gas flow rate. This is attributed to the fact that an increment in flow rate leads to a decrement in the SEI value. Although the conversion rate also declines at excessively high flow rates, the overall reduction of the conversion rate is smaller than that of the SEI value, thereby resulting in an improvement in energy efficiency. Notably, the highest energy efficiency achieved by this PCAPMPS reached 87.9% at 80 W with the gas flow rates of Ar : CO₂ = 5 L/min : 1 L/min and the tuning distance of 3 mm, surpassing that of most state-of-the-art microwave plasma systems used for CO2 conversion. To facilitate a clear comparison with existing studies, we summarize the results in Table 1. It is evident that our approach demonstrates particularly outstanding advantages in terms of the energy efficiency.
4. Conclusions
This study investigated the conversion rate and energy efficiency of CO2 in a portable coaxial atmospheric-pressure microwave plasma source. Before plasma excitation, the device can be tuned to achieve a low microwave power reflection ratio at its resonate frequency. After plasma excitation, the concentrations of CO2 and CO were measured using FTIR. The experimental results showed that this device achieved an energy efficiency of 87.9% under the process conditions of 80 W microwave power and gas flow rate of Ar : CO₂ = 5 L/min : 1 L/min, which has exceeded that of other state-of-the-art plasma devices reported to date and offering new insights for the design of distributed microwave plasma CO₂ conversion systems. Moreover, the proposed device is readily compatible with either quenching or a downstream carbon-bed reactor to further improve CO₂ conversion efficiency.
Author Contributions
Conceptualization, S.L. and W.X.; methodology, S.L. and W.X.; software, L.S.; validation, G.L. and W.X.; formal analysis, S.L.; investigation, G.L. and S.L.; resources, L.S.; data curation, G.L.; writing—original draft preparation, S.L.; writing—review and editing, W.X.; visualization, G.L.; supervision, S.L.; project administration, L.S.; funding acquisition, W.X. All authors have read and agreed to the published version of the manuscript.
Funding
This research was funded by the Postdoctoral project of the State Key Laboratory of Green and Efficient Development of Phosphorus Resources of Wengfu Group with grant number of YF(2023)018.
Data Availability Statement
The raw data supporting the conclusions of this article will be made available by the authors on request.
Conflicts of Interest
The authors declare no conflicts of interest. The funders had no role in the design of the study; in the collection, analyses, or interpretation of data; in the writing of the manuscript; or in the decision to publish the results.
References
- Zhang, Z.; Wang, T.; Blunt, M.; Anthony, E.; Park, A.; Hughes, R.; Webley, P.; Yang, J. Advances in carbon capture, utilization and storage. Appl. Energ. 2020, 278, 115627. [Google Scholar] [CrossRef]
- Li, N.; Hu, C.; Wang, B.; Liang, Z.; Zhang, Y.; Wang, L.; Li, J.; Hong, J. Preparation of highly dispersed Co/TiO2@xCN catalysts with high activity and stability for Fischer-Tropsch synthesis. Fuel 2025, 396, 135310. [Google Scholar]
- Available online: https://www.gml.noaa.gov/ccgg/trends/ (accessed on 14 April 2026).
- Zhang, J.; Li, X.; Zheng, J.; Du, M.; Wu, X.; Song, J.; Cheng, X.; Li, T.; Yang, W. Non-thermal plasma-assisted ammonia production: A review. Energ. Convers. Manag. 2023, 293, 117482. [Google Scholar]
- Radhakrishnan, H.; Gnangbe, S.; Duereh, A.; Uday, S.; Lusi, A.; Hu, H.; Hu, H.; Wright, M.; Bai, X. Non-equilibrium plasma co-upcycling of waste plastics and CO2 for carbon-negative oleochemicals. Green Chem. 2024, 26, 9156–9175. [Google Scholar]
- Lazarova, S.; Paunska, T.; Vasilev, V.; Yarnev, K.; Iordanova, S.; Kolev, S. Gliding Arc/Glow Discharge for CO2 Conversion: The Role of Discharge Configuration and Gas Channel Thickness. Plasma 2024, 7, 877–890. [Google Scholar] [CrossRef]
- Vasilev, V.; Lazarova, N.; Lazarova, S.; Paunska, T.; Kolev, S. CO2 Conversion at Reduced Pressure in a Novel Stabilized Arc Discharge for In Situ Oxygen Production on Mars. Plasma 2025, 8, 50. [Google Scholar] [CrossRef]
- Masumbuko, R.; Kobayashi, N.; Itaya, Y.; Suami, A. Enhanced methanol selectivity and synthesis in a non-catalytic dielectric barrier discharge (DBD) plasma reactor. Chem. Eng. Sci. 2024, 287, 119698. [Google Scholar]
- Feliz, M.; Polaert, I.; Ledoux, A.; Fernandez, C.; Azzolina-Jury, F. Influence of ionic conductivity and dielectric constant of the catalyst on DBD plasma-assisted CO2 hydrogenation into methanol. J. Phys. D. Appl. Phys. 2021, 54, 334003. [Google Scholar]
- Huang, Q.; Fu, C.; Liang, Z.; Qi, F.; Luo, C.; Feng, B.; Liang, C.; Yang, M.; Mao, X.; Wang, D.; Kleyn, A. CO2 Conversion Synergistically Driven by Radiofrequency Inductively-Coupled Plasma and Lead-Free Halide Perovskite Photocatalyst. J. Phys. Chem. C 2023, 127, 11550–11558. [Google Scholar]
- Spencer, L.; Gallimore, A. Efficiency of CO2 Dissociation in a Radio-Frequency Discharge. Plasma Chem. Plasma P. 2011, 31, 79–89. [Google Scholar]
- Ong, M. Y.; Nomanbhay, S.; Kusumo, F.; Show, P. Application of microwave plasma technology to convert carbon dioxide (CO2) into high value products: A review. J. Clean. Pro. 2022, 336, 130447. [Google Scholar] [CrossRef]
- Van Deursen, C.; Van Poyer, H.; Bongers, W.; Peeters, F.; Smits, F.; van de Sanden, M. Effluent nozzles in reverse-vortex-stabilized microwave CO2 plasmas for improved energy efficiency. J. CO2 Util. 2024, 88, 102952. [Google Scholar]
- Snoeckx, R.; Bogaerts, A. Plasma technology – a novel solution for CO2 conversion? Chem. Soc. Rev. 2017, 46, 5805–5863. [Google Scholar] [CrossRef] [PubMed]
- Zhu, H.; Huang, Y.; Yin, S.; Zhang, W. Microwave plasma setups for CO2 conversion: A mini-review. Green Energ. Resour. 2024, 2, 100061. [Google Scholar] [CrossRef]
- Kiss, B.; Toth, C.; Slezsak, I.; Dobo, Z.; Kaptay, G. Carbon dioxide conversion and characterization of microwave-induced plasma. Front. Chem. Sci. Eng. 2025, 19, 58. [Google Scholar] [CrossRef]
- Mansfeld, D.; Sintsov, S.; Chekmarev, N.; Vodopyanov, A. Conversion of carbon dioxide in microwave plasma torch sustained by gyrotron radiation at frequency of 24 GHz at atmospheric pressure. J. CO2 Util. 2020, 40, 101197. [Google Scholar] [CrossRef]
- Mohsenian, S.; Nagassou, D.; Elahi, R.; Yu, P.; Nallar, M.; Wong, H.-W.; Trelles, J. Carbon dioxide conversion by solar-enhanced microwave plasma: Effect of specific power and argon/nitrogen carrier gases. J. CO2 Util. 2019, 34, 725–732. [Google Scholar]
- Chekmarev, N.; Mansfeld, D.; Vodopyanov, A.; Sintsov, S.; Preobrazhensky, E.; Remez, M. Enhancement of CO2 conversion by counterflow gas quenching of the post-discharge region in microwave plasma sustained by gyrotron radiation. J. CO2 Util. 2024, 82, 102759. [Google Scholar]
- Kim, H.; Song, S.; Tom, C. P.; Xie, F. Carbon dioxide conversion in an atmospheric pressure microwave plasma reactor: Improving efficiencies by enhancing afterglow quenching. J. CO2 Util. 2020, 37, 240–247. [Google Scholar] [CrossRef]
- Wu, H.; Xiao, W.; Wu, S.; Li, X. A Coaxial Atmospheric Microwave Plasma Source With Low-Generating Power. IEEE Trans. Plasma Sci. 2023, 51, 3476–3483. [Google Scholar] [CrossRef]
- Li, X.; Lai, X.; Wang, Y.; Zhang, X.; Zhu, H.; Xiao, W. Carbon dioxide conversion enhanced by local electric field enhancement in atmospheric microwave plasma. J. Phys. D. Appl. Phys. 2026, 59, 095206. [Google Scholar] [CrossRef]
- Horváth, G.; Skaln´y, J.; Mason, N. FTIR study of decomposition of carbon dioxide in dc corona discharges. J. Phys. D. Appl. Phys. 2008, 41, 225207. [Google Scholar] [CrossRef]
- Abdul Jameel, A.; Han, Y.; Brignoli, O.; Telalovic, S.; Elbaz, A.; Im, H.; Roberts, W.; Sarathy, S. Heavy fuel oil pyrolysis and combustion: kinetics and evolved gases investigated by TGA-FTIR. J. Anal. Appl. Pyrolysis. 2017, 127, 183–195. [Google Scholar] [CrossRef]
- Voráč, J.; Engeln, R.; Synek, P.; Pottočňáková, L.; Hnilica, J.; Kudrle, V. Batch processing of overlapping molecular spectra as a tool for spatio-temporal diagnostics of power modulated microwave plasma jet. Plasma Sources Sci. Technol. 2017, 26, 025010. [Google Scholar] [CrossRef]
- Carbone, E.; D’Isa, F.; Hecimovic, A.; Fantz, U. Analysis of the C2 (d3Πg-a3Πu) Swan bands as a thermometric probe in CO2 microwave plasmas. Plasma Sources Sci. Technol. 2020, 29, 055003. [Google Scholar]
- D’Isa, F. A.; Carbone, E. A. D.; Hecimovic, A.; Fantz, U. Performance analysis of a 2.45 GHz microwave plasma torch for CO2 decomposition in gas swirl configuration. Plasma Sources Sci. Technol. 2020, 29, 105009. [Google Scholar] [CrossRef]
- Fridman, A. Plasma Chemistry; Cambridge University Press, 2008. [Google Scholar] [CrossRef]
- Deursen, C.; van Poyer, H.; Bongers, W.; Peeters, F.; Smits, F.; van de Sanden, M. Effluent nozzles in reverse-vortex-stabilized microwave CO2 plasmas for improved energy efficiency. J. CO2 Util. 2024, 88, 102952. [Google Scholar]
- Wu, Y.; Li, S.; Niu, Y.; Yan, H.; Yang, D.; Zhang, J. Experimental investigation of CO2 conversion in Boudouard reaction driven by an atmospheric-pressure microwave plasma torch. J. Phys. D. Appl. Phys. 2023, 56, 065201. [Google Scholar] [CrossRef]
Figure 1.
The PCAPMPS adopted in this work: (a) schematic; (b) photograph; (c) tuning process.
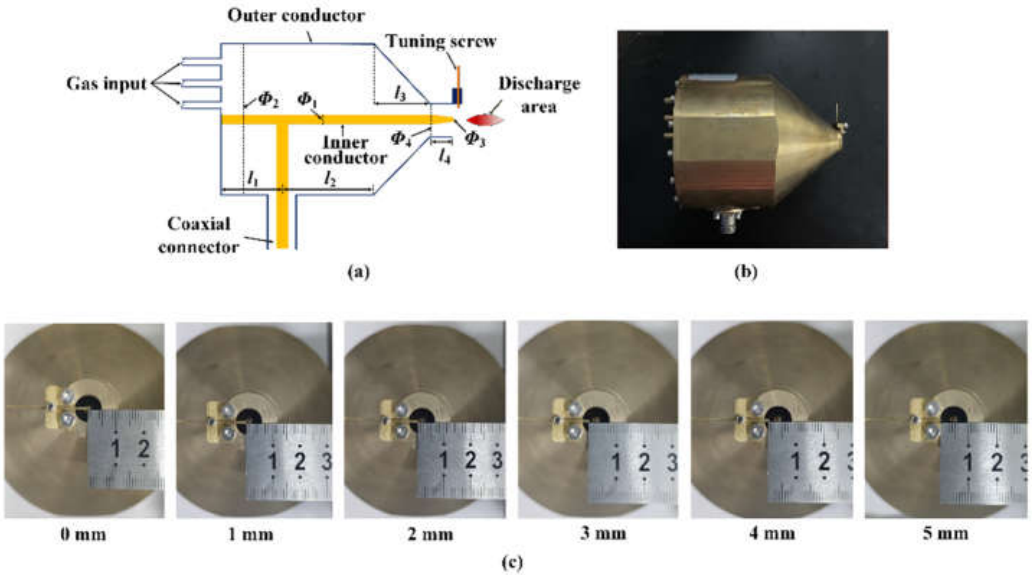
Figure 2.
Schematic of the experimental setup.
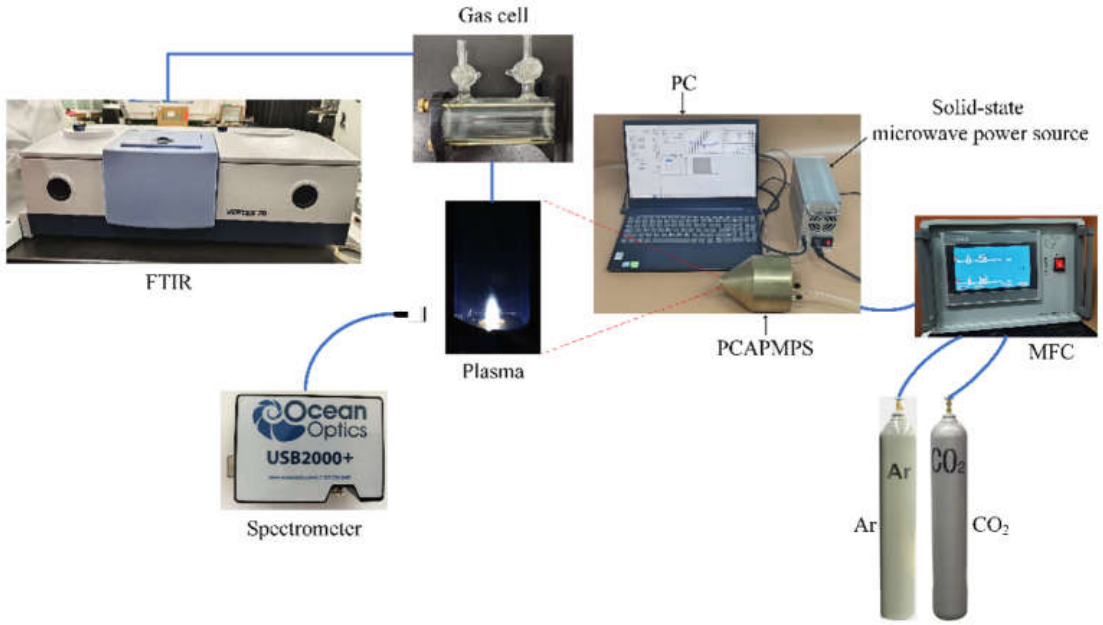
Figure 3.
Power reflection ratios before plasma excitation.
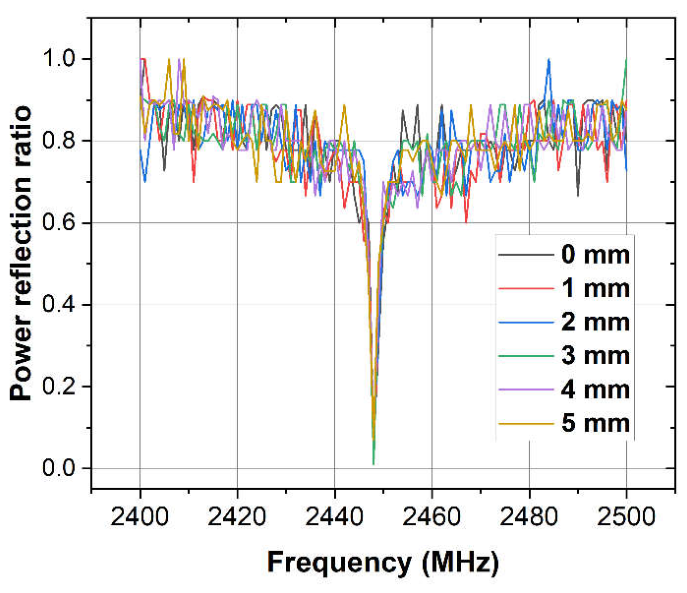
Figure 4.
IAS of the product gas at the microwave power of 80 W, the gas flow rate of Ar : CO₂ = 3 L/min : 1 L/min, and the tuning distance of 3 mm.
Figure 4.
IAS of the product gas at the microwave power of 80 W, the gas flow rate of Ar : CO₂ = 3 L/min : 1 L/min, and the tuning distance of 3 mm.
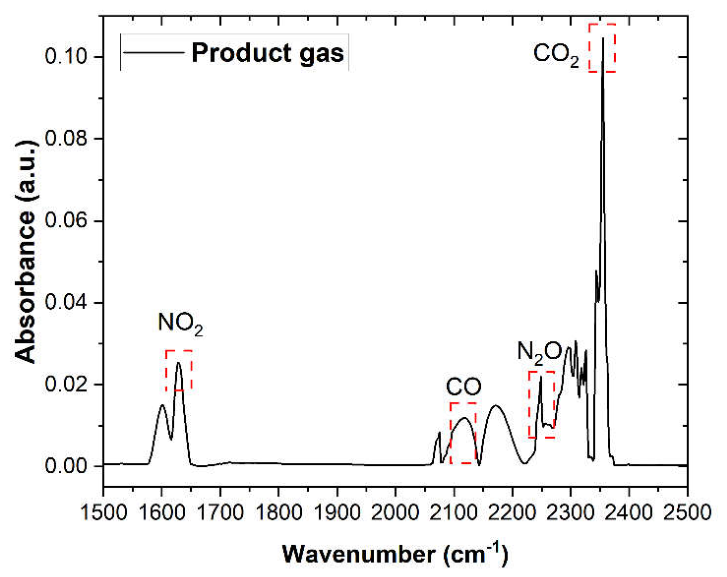
Figure 5.
OES of the product gases at the microwave power of 80 W, the gas flow rate of Ar : CO2 = 3 L/min : 1 L/min, and the tuning distance of 3 mm.
Figure 5.
OES of the product gases at the microwave power of 80 W, the gas flow rate of Ar : CO2 = 3 L/min : 1 L/min, and the tuning distance of 3 mm.
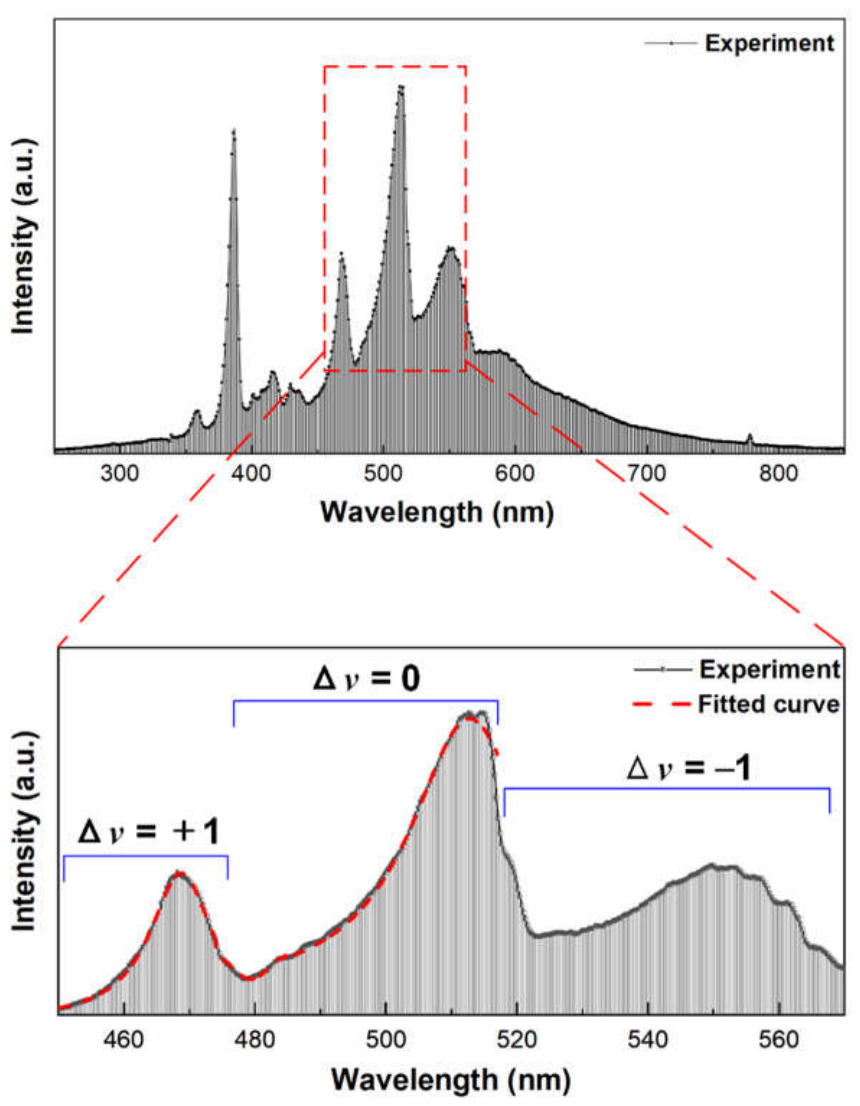
Figure 6.
Gas temperature under two tuning distances derived from the fitting of the plasma OES.
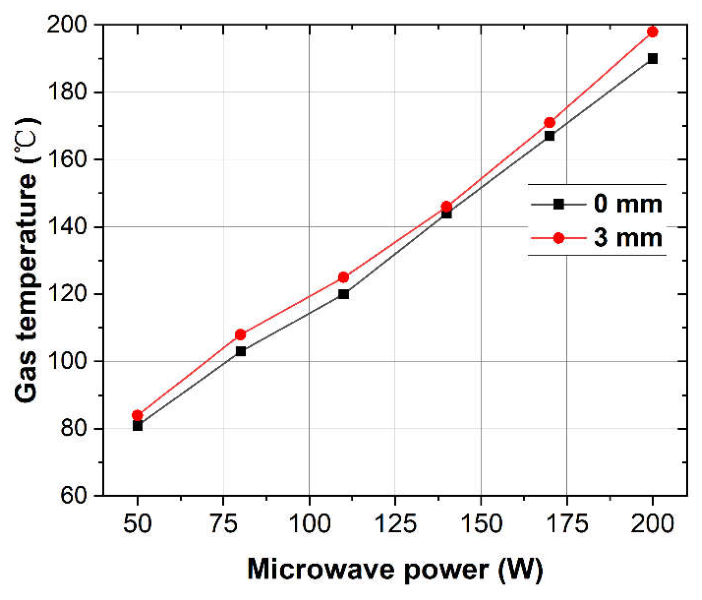
Figure 7.
CO2 conversion rates under different microwave power levels and gas flow rates with tuning distances of (a) 0 mm and (b) 3 mm.
Figure 7.
CO2 conversion rates under different microwave power levels and gas flow rates with tuning distances of (a) 0 mm and (b) 3 mm.
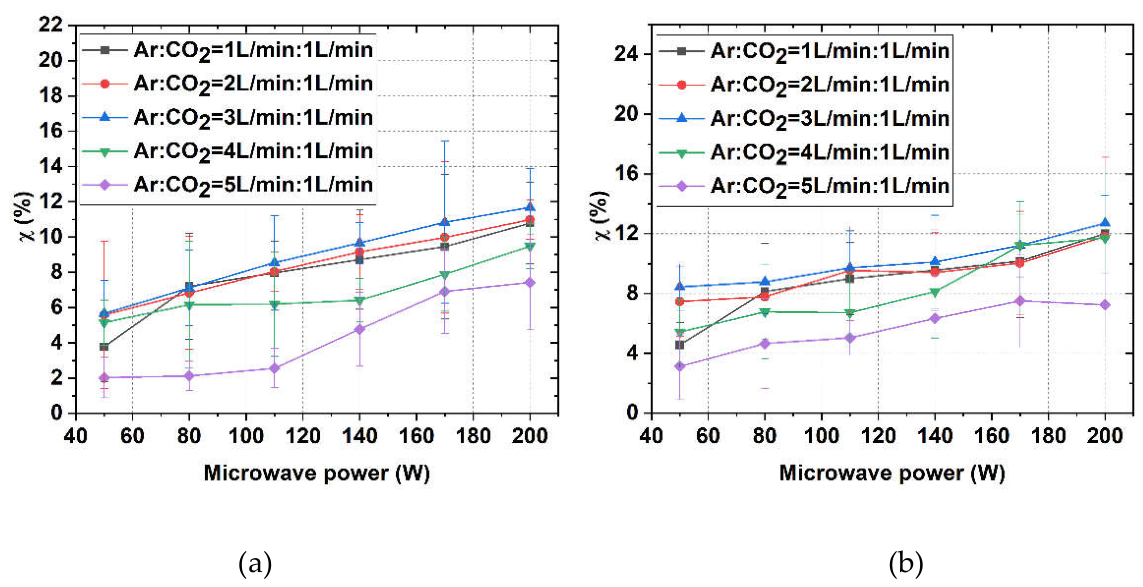
Figure 8.
Energy efficiency under different microwave power levels and gas flow rates with tuning distances of (a) 0 mm and (b) 3 mm.
Figure 8.
Energy efficiency under different microwave power levels and gas flow rates with tuning distances of (a) 0 mm and (b) 3 mm.
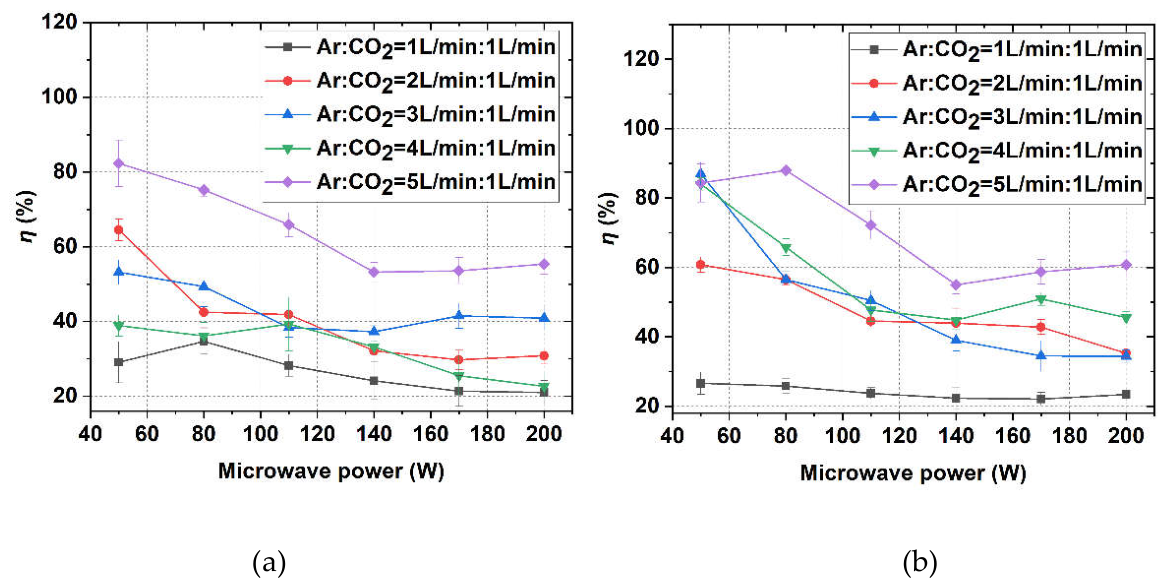

Table 1.
Comparison of different microwave plasma systems used for CO2 conversion.
| Reference | Microwave frequency and Power | Pressure (bar) | CO2 flow rate (L/min) | Working gases | Conversion rate | Energy efficiency |
|---|---|---|---|---|---|---|
| [16] | 2.45 GHz, 900 W | 0.1 | ~0.083 | CO2, H2 | 46.4% | 10.9% |
| [17] | 24 GHz, 5 kW | 1 | 5 | CO2, Ar | 31.3% | 9.5% |
| [19] | 24 GHz, 600 W | 1 | 2.6 | CO2, N2 | 23.8% | 19.7% |
| [20] | 2.45 GHz, 1 kW | 1 | 10 | CO2, Ar | 36.1% | 14.7% |
| [30] | 2.45 GHz, 1.8 kW | 1 | 8 | CO2, Ar with carbon material | 75% | 55% |
| [31] | 2.45 GHz, 1.8 kW | 1 | 14 | CO2 | 56.6% | 17.9% |
| This work | 2.45 GHz, 200 W | 1 | 1 | CO2, Ar | 12.7% | 87.9% |
Disclaimer/Publisher’s Note: The statements, opinions and data contained in all publications are solely those of the individual author(s) and contributor(s) and not of MDPI and/or the editor(s). MDPI and/or the editor(s) disclaim responsibility for any injury to people or property resulting from any ideas, methods, instructions or products referred to in the content. |
© 2026 by the authors. Licensee MDPI, Basel, Switzerland. This article is an open access article distributed under the terms and conditions of the Creative Commons Attribution (CC BY) license.
Copyright: This open access article is published under a Creative Commons CC BY 4.0 license, which permit the free download, distribution, and reuse, provided that the author and preprint are cited in any reuse.


