

Submitted:
28 June 2026
Posted:
29 June 2026
You are already at the latest version
Abstract
Climate-adaptive façade design is essential for reducing residential energy demand while maintaining thermal acceptability across diverse climate conditions. However, many optimization studies remain limited to single climates or present Pareto outputs without translating them into practical design rules. This study develops an explainable simulation-based framework for deriving robust façade design rules for energy-efficient, low-carbon-oriented residential buildings across eight global climate contexts. A standardized five-story residential apartment prototype with a gross floor area of 2240 m² was modeled in DesignBuilder using the EnergyPlus 9.4 simulation engine. The study covered Abu Dhabi, Athens, Berlin, Miami, Phoenix, Riyadh, Singapore, and Stockholm. Four façade variables were assessed: window-to-wall ratio, orientation, external shading depth, and glazing type. NSGA-II optimization was applied with a population size of 40 and 30 generations per city, producing approximately 1200 evaluations per climate context and about 9600 simulations in total. The optimization minimized energy use intensity and ASHRAE 55 discomfort hours. Random Forest models and SHAP analysis were then used to identify dominant performance drivers and support rule extraction. The optimized solutions reduced energy use intensity by 44.63%–60.19% and discomfort hours by 16.71%–49.71% relative to the baseline cases. Random Forest models achieved high predictive accuracy, with R² values of 0.9942 for energy performance and 0.9954 for comfort. Aggregated feature importance showed that climate context was the dominant determinant of performance, accounting for 45.1% of energy-model importance and 69.6% of comfort-model importance. Among façade variables, window-to-wall ratio was the strongest design driver, while orientation contributed only 0.5% in both models. The results show that robust façade design cannot rely on universal prescriptions. Hot-arid climates favored low glazing ratios, high-performance glazing, and external shading, while temperate and cold climates allowed larger glazing areas with efficient glazing and limited shading. The proposed framework converts simulation, optimization, and explainable machine-learning outputs into practical climate-adaptive façade rules for early-stage energy-efficient and low-carbon-oriented residential design.
Keywords:
climate-adaptive façade design
; building energy simulation
; NSGA-II
; random forest
; SHAP
; window-to-wall ratio
; thermal comfort
1. Introduction
Buildings remain central to global climate mitigation because they account for a substantial share of final energy demand and greenhouse-gas emissions. The IPCC Working Group III report identifies the building sector as a major mitigation domain, with emissions arising from direct fuel use, electricity consumption, heat production, and material-related impacts [1]. The IPCC Synthesis Report further emphasizes that near-term climate action must combine emission reduction with adaptation to increasingly diverse climate risks [2]. Within this context, residential buildings are particularly important because their energy demand is strongly shaped by early architectural decisions, especially those related to envelope geometry, glazing, solar exposure, and thermal performance [3,4,5].
The building façade is one of the most decisive interfaces between outdoor climate and indoor performance. Through window-to-wall ratio, glazing specification, external shading, and orientation, the façade regulates solar gains, conductive heat transfer, daylight admission, and indoor thermal conditions. Previous studies have shown that façade and envelope variables can significantly influence energy use intensity, cooling and heating loads, and comfort outcomes, especially in climates with strong solar radiation, high humidity, or seasonal heating demand [3,5,6,7]. Among these variables, window-to-wall ratio has received particular attention because it affects both heat gain and heat loss while also shaping architectural expression and daylight availability [6,8]. Recent multi-climate evidence further confirms that WWR and shading can substantially alter residential energy demand across distinct climate contexts [8]. However, the same glazing ratio does not perform equally across climates. Larger glazed areas may support useful solar gains in cold climates but increase cooling demand and discomfort in hot or humid climates. This risk is especially relevant in hot regions, where inappropriate WWR selection can increase cooling loads and weaken envelope performance [9]. Similar envelope-optimization studies have shown that passive comfort and energy performance require coordinated adjustment of envelope parameters rather than isolated design changes [10].
Dynamic building performance simulation has become a common method for evaluating these climate-dependent interactions before construction. EnergyPlus-based workflows allow researchers to test façade configurations under hourly weather conditions and quantify indicators such as energy use intensity, cooling demand, heating demand, and discomfort hours [3,11,12]. When simulation is coupled with evolutionary optimization, it becomes possible to explore larger design spaces containing continuous and discrete variables. Genetic algorithms, particularly the Non-Dominated Sorting Genetic Algorithm II originally developed by Deb et al. [13], are widely used in building optimization because they can identify non-dominated alternatives when energy, comfort, cost, and carbon objectives interact [4,14,15]. This is valuable for façade design because reducing energy demand does not always produce the best comfort outcome.
Despite these advances, several gaps remain. Many façade optimization studies focus on one city, one climate group, or one building type, which limits the transferability of their recommendations [4]. In addition, optimization results are often presented as Pareto fronts or best-performing alternatives without being translated into clear design rules for architects and engineers. This creates a gap between computational analysis and early-stage decision-making. A Pareto front can identify high-performing solutions, but it does not necessarily explain why those solutions perform well, which variables matter most, or how stable the resulting recommendations are across different climates [11,14].
Recent studies have therefore begun to combine building simulation and optimization with machine learning and explainable artificial intelligence. Random Forest models can capture nonlinear relationships between design variables and performance outputs, while SHAP analysis can clarify the relative and directional influence of each variable [7,11]. This combination is useful because simulation and optimization can generate large datasets, but explainable machine learning can convert those datasets into variable hierarchies and practical design knowledge. However, broader evidence is still needed to test whether AI-derived façade rules remain valid across diverse global climates rather than within a single regional context.
Thermal comfort must also be considered alongside energy reduction. An energy-only optimization may favor solutions that reduce energy use while increasing the number of occupied hours outside acceptable thermal conditions. ASHRAE Standard 55 provides recognized methods for evaluating thermal environments, including time-based approaches such as exceedance hours and discomfort hours [16]. For climate-adaptive façade design, this means that energy and comfort should be evaluated together, particularly in cooling-dominated climates where solar gains, glazing ratio, and shading depth can affect both cooling load and overheating risk [14,16].
The environmental role of artificial intelligence also requires careful framing. Digital tools, machine learning, and AI-supported analysis can help improve energy efficiency and design decision-making, but they are not automatically sustainable. The IPCC notes that digital technologies may support mitigation while also creating risks related to rebound effects, resource demand, and governance challenges. Similarly, previous life-cycle-based assessments of AI have argued that AI applications should be assessed in relation to their own data, hardware, computation, and life-cycle impacts [17].
This study addresses these gaps by developing an explainable simulation-based framework for robust climate-adaptive façade design across eight global climate contexts: Abu Dhabi, Athens, Berlin, Miami, Phoenix, Riyadh, Singapore, and Stockholm. A standardized five-story residential apartment prototype is modeled in DesignBuilder using EnergyPlus 9.4. NSGA-II optimization is applied to evaluate window-to-wall ratio, orientation, external shading depth, and glazing type against two objectives: minimizing energy use intensity and minimizing ASHRAE 55 discomfort hours. Random Forest modeling and SHAP-based explainability are then used to identify dominant design drivers and translate the optimization outputs into climate-adaptive façade rules.
The aim of the study is to determine how façade design strategies vary across global climate contexts and how simulation, evolutionary optimization, and explainable machine learning can support early-stage low-carbon residential design. The study addresses four research questions: How do optimized façade configurations vary across different climate zones? To what extent can climate-adaptive façade strategies reduce energy use intensity and discomfort hours? Which façade variables most strongly influence energy and comfort outcomes? How can optimization and explainable machine learning be translated into practical façade design rules? The contribution is both methodological and applied: the study provides a multi-climate optimization dataset, identifies robust energy–comfort patterns, and converts computational outputs into decision-support guidance for climate-responsive residential façades [18].
2. Materials and Methods
2.1. Research Design
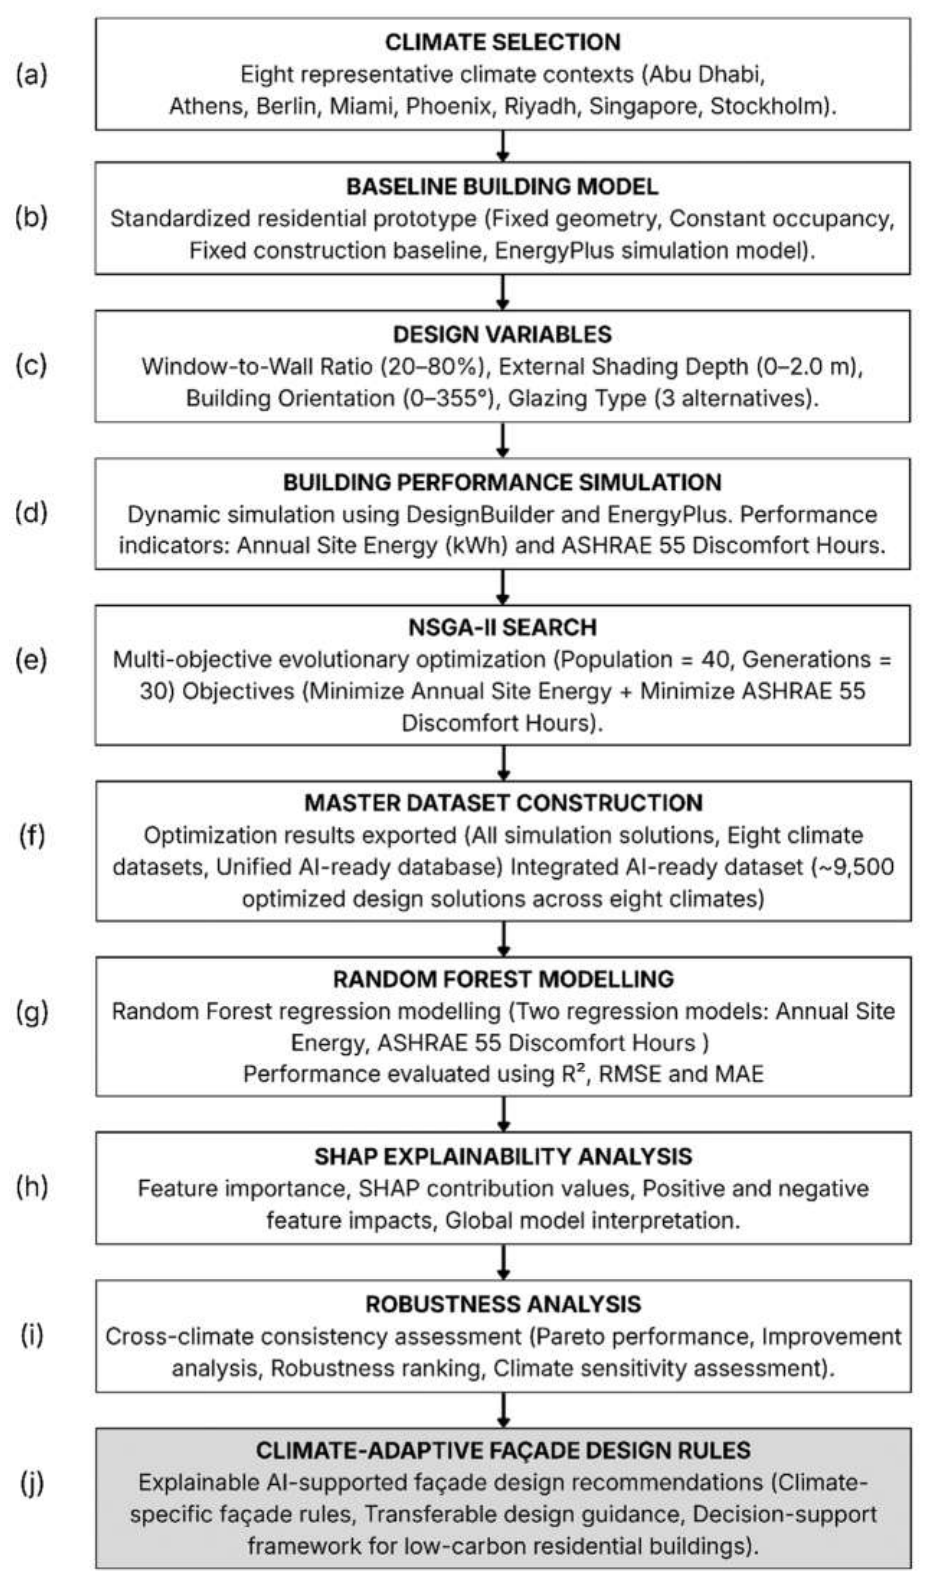
This study used a simulation-based optimization and explainable machine-learning workflow to derive climate-adaptive façade design rules for residential buildings. The workflow included five stages: climate-context selection, baseline building simulation, NSGA-II multi-objective optimization, Random Forest modeling, and SHAP-based interpretation. The aim was not only to identify high-performing façade configurations, but also to determine which design variables most strongly influenced energy and comfort outcomes across different climates. This structure follows recent building-performance research that combines dynamic simulation, evolutionary optimization, and explainable machine learning to support early-stage design decisions [4,11,14,19,20,21].
Figure 1.
Integrated AI-assisted research workflow linking multi-climate selection, DesignBuilder/EnergyPlus simulation, NSGA-II multi-objective optimization, Random Forest predictive modeling, SHAP-based explainability, robustness assessment, and climate-adaptive façade rule extraction for transferable decision support.
Figure 1.
Integrated AI-assisted research workflow linking multi-climate selection, DesignBuilder/EnergyPlus simulation, NSGA-II multi-objective optimization, Random Forest predictive modeling, SHAP-based explainability, robustness assessment, and climate-adaptive façade rule extraction for transferable decision support.
The study used two performance objectives: minimizing energy use intensity (EUI) and minimizing annual ASHRAE 55 discomfort hours. EUI was selected as a normalized measure of building energy performance, allowing comparison across climates using the same prototype geometry. Discomfort hours were included to avoid energy-only optimization and to ensure that thermal acceptability remained part of the design evaluation. ASHRAE Standard 55 was used as the comfort reference because it provides recognized procedures for evaluating indoor thermal environments and time-based comfort performance [16].
2.2. Climate-Context Selection
Eight cities were selected to represent diverse global climate conditions: Abu Dhabi, Athens, Berlin, Miami, Phoenix, Riyadh, Singapore, and Stockholm. The sample includes hot-arid coastal, hot-arid inland, warm-humid coastal, hot-humid equatorial, mixed Mediterranean, temperate, and cold contexts. This range allowed the study to test whether façade rules remain consistent across climates or whether they depend on local solar, thermal, and humidity conditions. Weather files were taken from ASHRAE/IWEC and ASHRAE/TMY3 sources, and each city was classified using ASHRAE climate zones and Köppen climate categories.

Table 1.
Weather files and climate classifications used for the eight-city simulation framework.
| City | Country | Source | WMO | ASHRAE zone | Köppen | Climate role |
| Abu Dhabi | UAE | ASHRAE/IWEC | 412170 | 1B | BWh | Hot-arid coastal Gulf |
| Athens | Greece | ASHRAE/IWEC | 167160 | 3A | Cfa | Mixed warm climate |
| Berlin | Germany | ASHRAE/IWEC | 103810 | 5C | Cfb | Temperate |
| Miami | USA | ASHRAE/TMY3 | 722020 | 1A | Aw | Warm-humid coastal |
| Phoenix | USA | ASHRAE/TMY3 | 722784 | 2B | BWh | Hot-arid inland extreme |
| Riyadh | Saudi Arabia | ASHRAE/IWEC | 404380 | 1B | BWh | Hot-arid inland |
| Singapore | Singapore | ASHRAE/IWEC | 486980 | 1A | Af | Hot-humid equatorial |
| Stockholm | Sweden | ASHRAE/IWEC | 24840 | 6A | Dfb | Cold |
2.3. Prototype Building
A standardized five-story residential apartment prototype was modeled to ensure direct comparison across the eight climates. The building measured 32 m by 14 m, with a total gross floor area of 2240 m² and 20 thermal zones. Internal loads, schedules, HVAC assumptions, setpoints, envelope baseline, and operational conditions were kept constant across all cities. This controlled setup allowed the analysis to isolate the effects of climate context and façade variables rather than confounding the results with changes in geometry, occupancy, or system assumptions.
Table 2.
Standardized residential prototype used in the simulations.
| Parameter | Value |
| Building type | Residential apartment building |
| Floors | 5 |
| Length | 32 m |
| Width | 14 m |
| Gross floor area | 2240 m² |
| Floor-to-floor height | 3.1 m |
| Thermal zones | 20 |
| Occupancy density | 0.0188 people/m² |
| Lighting density | 5 W/m² |
| Infiltration rate | 0.30 ACH |
| Cooling setpoint | 25°C |
| Cooling setback | 28°C |
| Heating setpoint | 21°C |
| Cooling COP | 2.5 |
| Heating COP | 3.0 |
| Baseline glazing | Double clear 6 mm / 13 mm air / 6 mm |
| Baseline WWR | 20% |
| Baseline shading | None |
| Construction template | Medium weight, moderate insulation |
2.4. Baseline Simulation and Optimization Variables
Baseline simulations were conducted in DesignBuilder using the EnergyPlus 9.4 simulation engine, which supports dynamic whole-building energy simulation under hourly weather conditions [12]. The baseline model used 20% WWR, no external shading, double clear glazing, and a medium-weight construction template with moderate insulation. The same model assumptions were applied to all climates. Baseline outputs included EUI, cooling energy, heating energy, and annual discomfort hours, which provided the reference values for measuring optimization improvement.
Four façade-related variables were included in the optimization: WWR, building orientation, external shading depth, and glazing type. WWR and orientation were treated as continuous variables, while shading depth and glazing type were treated as discrete variables. These variables were selected because they represent early-stage façade decisions that directly influence solar gains, heat transfer, and comfort performance.
Table 3.
Optimization variables.
| Category | Variable | Type | Range / Options | Purpose |
| Façade geometry | Window-to-wall ratio | Continuous | 20–80% | Control solar gains, daylight admission, and heat transfer |
| Façade geometry | Building orientation | Continuous | 0–355° | Assess influence of solar exposure on performance |
| Solar protection | External shading depth | Discrete | No shading, 0.5 m, 1.0 m, 1.5 m, 2.0 m | Reduce solar heat gains and improve comfort |
| Glazing system | Glazing type | Discrete | Double clear, Double Low-E, Triple Low-E film | Evaluate influence of glazing performance |
The NSGA-II optimization minimized two objective functions: annual EUI, expressed in kWh/m²·yr, and annual ASHRAE 55 discomfort hours, expressed in h/yr. Both objectives were minimized simultaneously so that the optimization could identify façade configurations that reduce energy demand without ignoring thermal acceptability. No fixed weighting was assigned between the objectives; instead, the optimization generated Pareto sets of non-dominated solutions.
2.5. NSGA-II Optimization
NSGA-II was selected because it is a well-established elitist evolutionary algorithm for multi-objective optimization and is widely used in building performance studies to search nonlinear design spaces without requiring predefined objective weighting [4,13,14]. For each climate context, the algorithm was executed with a population size of 40 over 30 generations, producing approximately 1200 design evaluations per city. Across the eight cities, the full optimization dataset therefore comprised approximately 9600 simulations. The retained performance outputs were EUI and ASHRAE 55 discomfort hours.
2.6. Random Forest Modeling and SHAP Interpretation
After optimization, the simulation dataset was used to train Random Forest models for performance interpretation. The input variables included climate context, WWR, orientation, shading depth, and glazing type. Two target variables were modeled: total site energy consumption and annual discomfort hours. Random Forest was selected because it can capture nonlinear relationships and interactions between mixed variable types without requiring a predefined mathematical form [22].
Model performance was assessed using the coefficient of determination. The energy model achieved an R² value of 0.9942, while the comfort model achieved an R² value of 0.9954. These values indicate that the selected variables reproduced the dominant performance patterns in the simulation dataset with high accuracy. SHAP analysis was then applied to quantify the relative and directional influence of each input variable [23]. The final rule-extraction process combined Pareto-front behavior, percentage performance improvement, Random Forest feature importance, SHAP interpretation, and balanced-solution ranking. Rules were considered robust when they appeared consistently across these forms of evidence.
3. Results
3.1. Baseline Performance
The baseline simulations showed clear differences in energy and comfort performance across the eight climate contexts. Singapore recorded the highest baseline EUI at 122.49 kWh/m²·yr, followed by Abu Dhabi at 115.68 kWh/m²·yr and Miami at 92.94 kWh/m²·yr. These results reflect the high cooling demand associated with hot-humid, warm-humid, and hot-arid climates. Athens recorded the lowest baseline EUI at 58.16 kWh/m²·yr, while Berlin and Stockholm showed higher heating-energy contributions due to their temperate and cold climates. Baseline discomfort hours ranged from 2197 h/yr in Riyadh to 4495 h/yr in Singapore, confirming that climate context strongly shaped both energy and comfort before optimization.
Table 4.
Baseline building performance across climate contexts.
| City | ASHRAE zone | Köppen | EUI (kWh/m²·yr) | Cooling energy (kWh/yr) | Heating energy (kWh/yr) | Discomfort hours (h/yr) |
| Abu Dhabi | 1B | BWh | 115.68 | 158,004 | 0 | 3,222 |
| Athens | 3A | Cfa | 58.16 | 49,570 | 13,033 | 2,694 |
| Berlin | 5C | Cfb | 70.86 | 12,900 | 70,763 | 3,203 |
| Miami | 1A | Aw | 92.94 | 120,286 | 0 | 3,168 |
| Phoenix | 2B | BWh | 80.65 | 98,703 | 0 | 2,545 |
| Riyadh | 1B | BWh | 88.89 | 113,396 | 172 | 2,197 |
| Singapore | 1A | Af | 122.49 | 169,291 | 0 | 4,495 |
| Stockholm | 6A | Dfb | 82.83 | 8,881 | 94,633 | 3,577 |
The baseline results indicate three broad performance groups. Abu Dhabi, Miami, Phoenix, Riyadh, and Singapore were cooling-dominated. Athens showed mixed cooling and heating demand. Berlin and Stockholm were heating-dominated. This distinction is important because the same façade intervention can produce different effects depending on whether the main design problem is cooling reduction, heating conservation, or overheating control.
3.2. Optimization Performance
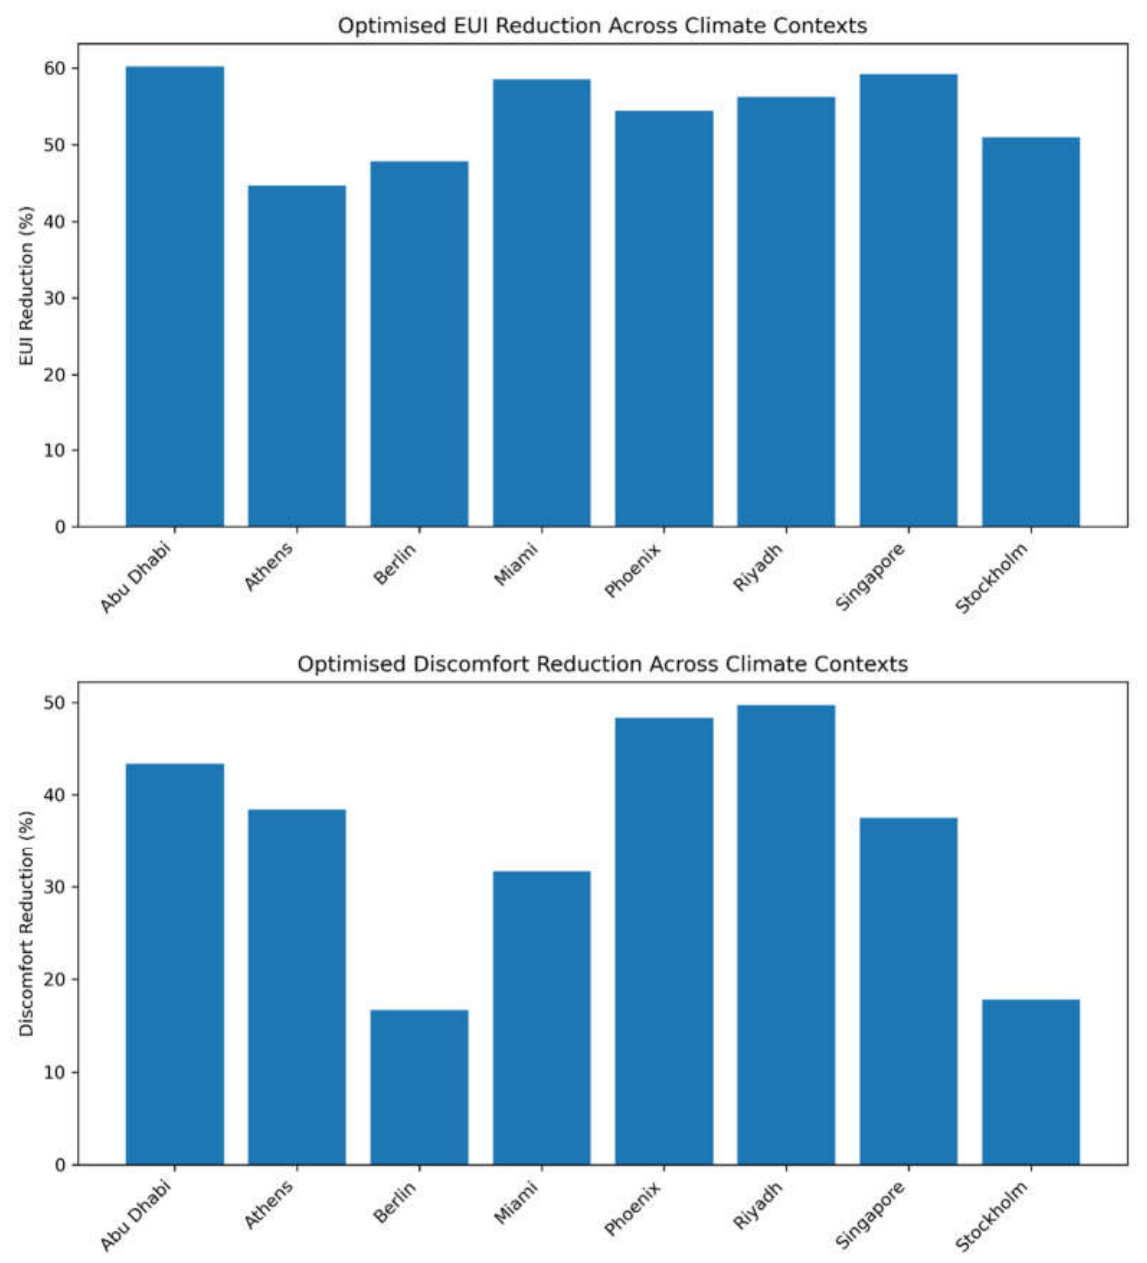
The NSGA-II optimization achieved substantial EUI reductions across all cities. Abu Dhabi recorded the largest EUI reduction, decreasing from 115.68 to 46.06 kWh/m²·yr, equivalent to 60.19%. Singapore followed with 59.26%, while Miami achieved 58.49%. The lowest EUI reduction was observed in Athens, although the reduction remained considerable at 44.63%. Across all climates, EUI reductions ranged from 44.63% to 60.19%, showing that façade optimization produced strong energy-performance improvements within the tested design space.
Table 5.
Pareto results and optimized performance improvements.
| City | Pareto solutions | Baseline EUI | Best EUI | EUI reduction | Baseline discomfort | Best discomfort | Discomfort reduction |
| Abu Dhabi | 21 | 115.68 | 46.06 | 60.19% | 3,222 | 1,825.03 | 43.36% |
| Athens | 38 | 58.16 | 32.20 | 44.63% | 2,694 | 1,659.50 | 38.40% |
| Berlin | 31 | 70.86 | 36.98 | 47.81% | 3,203 | 2,667.69 | 16.71% |
| Miami | 176 | 92.94 | 38.58 | 58.49% | 3,168 | 2,165.56 | 31.64% |
| Phoenix | 17 | 80.65 | 36.79 | 54.38% | 2,545 | 1,314.62 | 48.34% |
| Riyadh | 8 | 88.89 | 38.91 | 56.23% | 2,197 | 1,104.91 | 49.71% |
| Singapore | 168 | 122.49 | 49.91 | 59.26% | 4,495 | 2,808.81 | 37.51% |
| Stockholm | 69 | 82.83 | 40.62 | 50.96% | 3,577 | 2,940.25 | 17.80% |
Comfort improvements were more variable than energy reductions. Riyadh achieved the highest discomfort-hour reduction, decreasing from 2197 to 1104.91 h/yr, equivalent to 49.71%. Phoenix followed with 48.34%, and Abu Dhabi achieved 43.36%. The smallest comfort improvements were observed in Berlin and Stockholm, with reductions of 16.71% and 17.80%, respectively. This suggests that façade optimization produced the strongest comfort benefits in hot-arid climates, where solar control directly reduced overheating-related discomfort.
Figure 2.
Optimized reductions in EUI and discomfort hours across climate contexts.
3.3. Pareto-Front Behavior
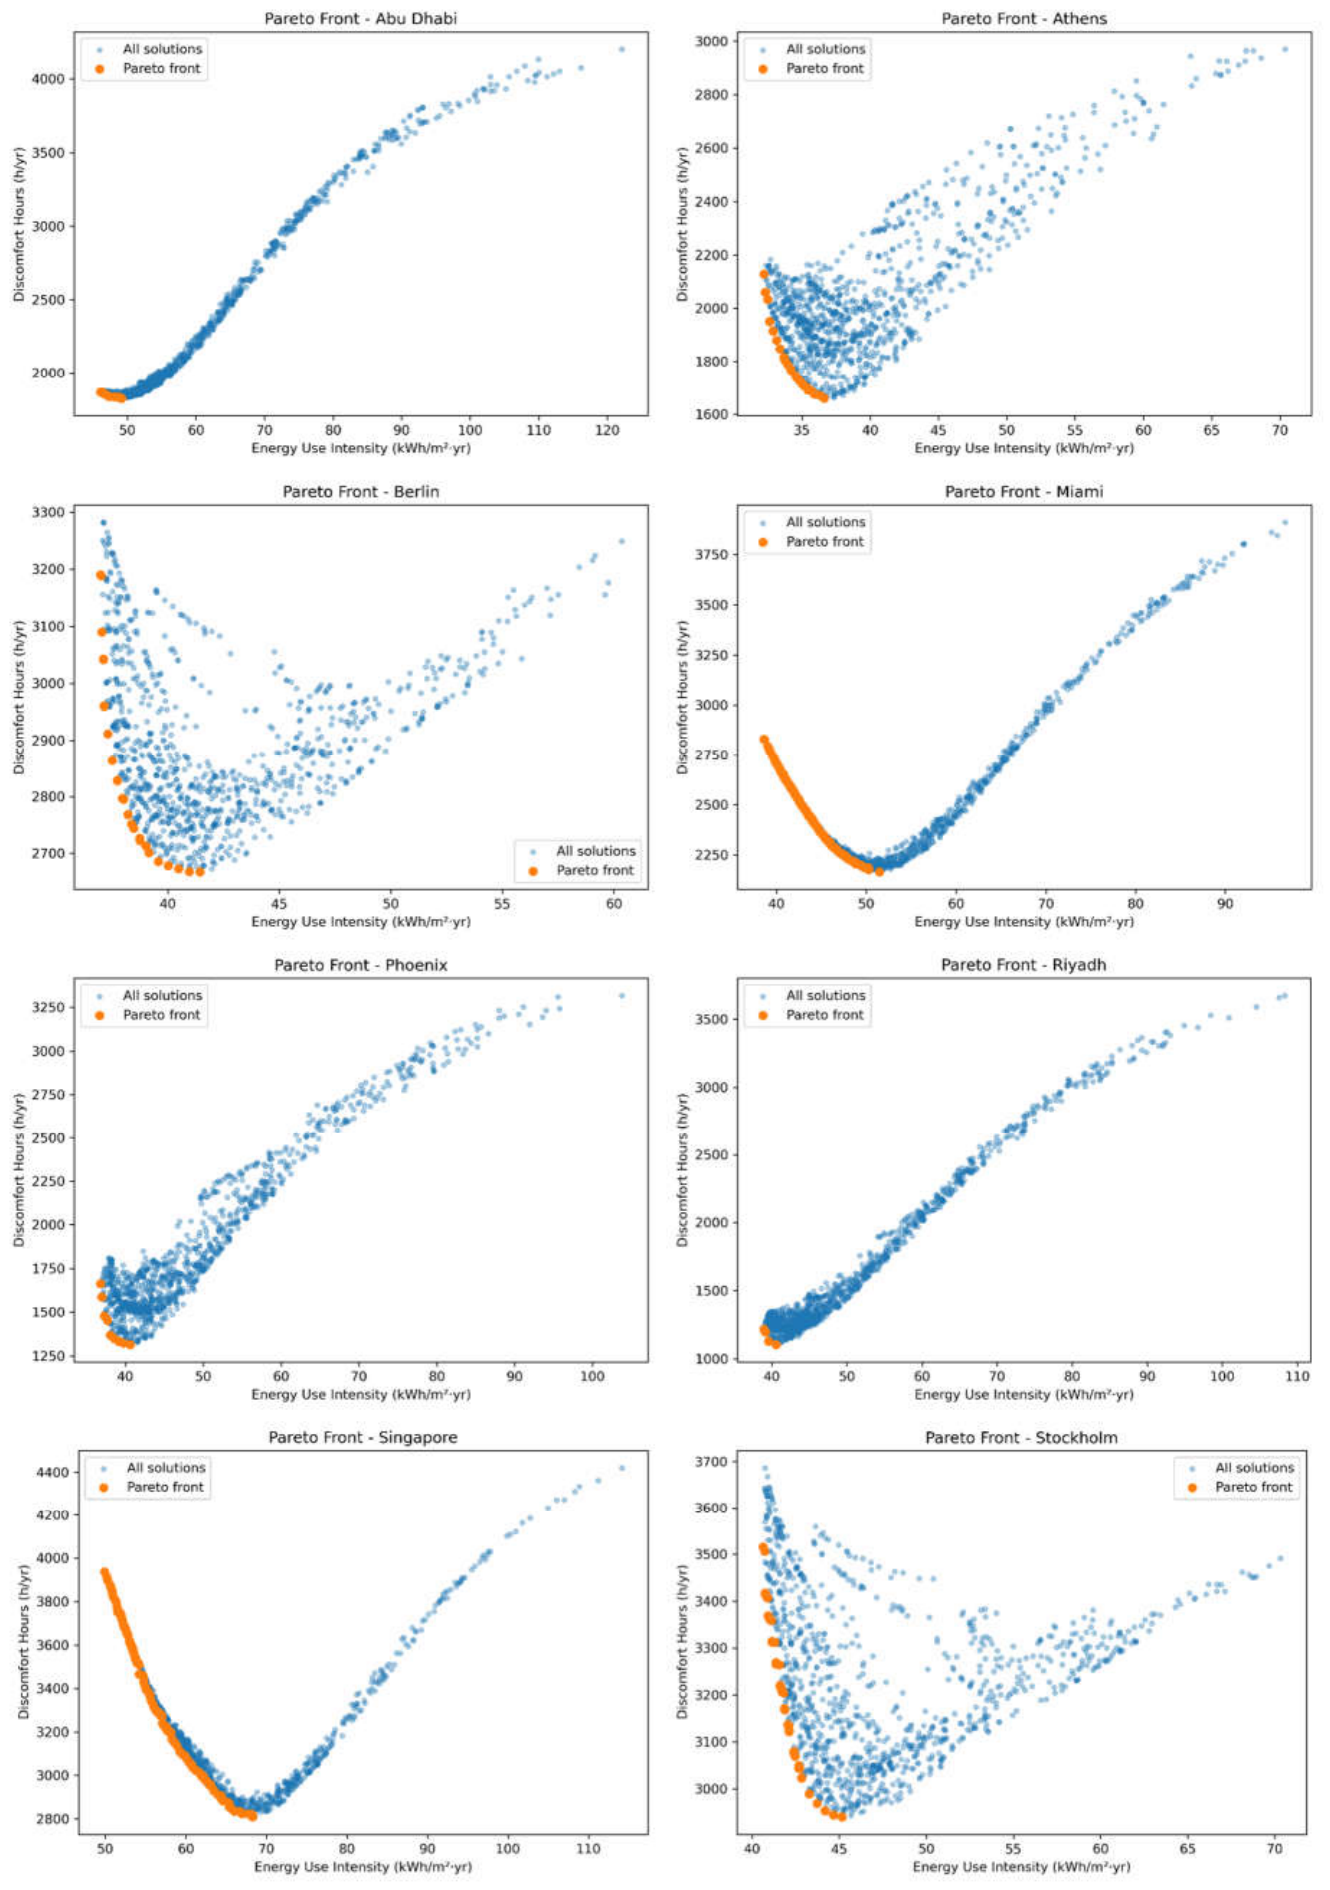
The Pareto fronts showed distinct climate-specific trade-off patterns. In Abu Dhabi, Riyadh, and Phoenix, many non-dominated solutions clustered toward low EUI and low discomfort hours, indicating that the same design direction could improve both objectives. These hot-arid contexts benefited from low WWR, high-performance glazing, and external shading, which reduced solar gains, cooling demand, and overheating discomfort.
Miami and Singapore produced larger Pareto sets, with 176 and 168 non-dominated solutions, respectively. This indicates broader trade-offs between energy and comfort in warm-humid and hot-humid climates. Singapore achieved one of the largest EUI reductions but remained the most comfort-challenging context after optimization, suggesting that façade interventions alone may not fully resolve discomfort under persistent equatorial heat and humidity.
Berlin and Stockholm showed different behavior. Larger glazing areas were more acceptable when paired with efficient glazing and limited or no external shading. In these climates, the optimization did not simply favor minimum WWR because solar access can support heating-season performance. The smaller discomfort reductions in Berlin and Stockholm suggest that façade-only optimization has less comfort-reduction leverage in heating-dominated or seasonally mixed climates.
Figure 3.
Composite Pareto fronts across the eight climate contexts. Composite comparison of Pareto fronts showing all evaluated solutions and non-dominated solutions for Abu Dhabi, Athens, Berlin, Miami, Phoenix, Riyadh, Singapore, and Stockholm. The plots illustrate climate-specific trade-offs between energy use intensity and ASHRAE 55 discomfort hours.
Figure 3.
Composite Pareto fronts across the eight climate contexts. Composite comparison of Pareto fronts showing all evaluated solutions and non-dominated solutions for Abu Dhabi, Athens, Berlin, Miami, Phoenix, Riyadh, Singapore, and Stockholm. The plots illustrate climate-specific trade-offs between energy use intensity and ASHRAE 55 discomfort hours.
3.4. Random Forest and SHAP Results
The Random Forest models reproduced the simulation patterns with high accuracy. The energy model achieved an R² value of 0.9942, while the comfort model achieved an R² value of 0.9954. Aggregated feature importance showed that climate context was the dominant determinant of both energy and comfort outcomes. For the energy model, climate context accounted for 45.1% of total feature importance, followed by WWR at 30.9%, shading at 12.4%, glazing at 11.0%, and orientation at 0.5%. For the comfort model, climate context accounted for 69.6%, followed by WWR at 18.2%, shading at 6.3%, glazing at 5.3%, and orientation at 0.5%.
Table 6.
Random Forest model performance and aggregated feature importance.
| Model | R² | Climate context | WWR | Shading | Glazing | Orientation |
| Energy model | 0.9942 | 45.1% | 30.9% | 12.4% | 11.0% | 0.5% |
| Comfort model | 0.9954 | 69.6% | 18.2% | 6.3% | 5.3% | 0.5% |
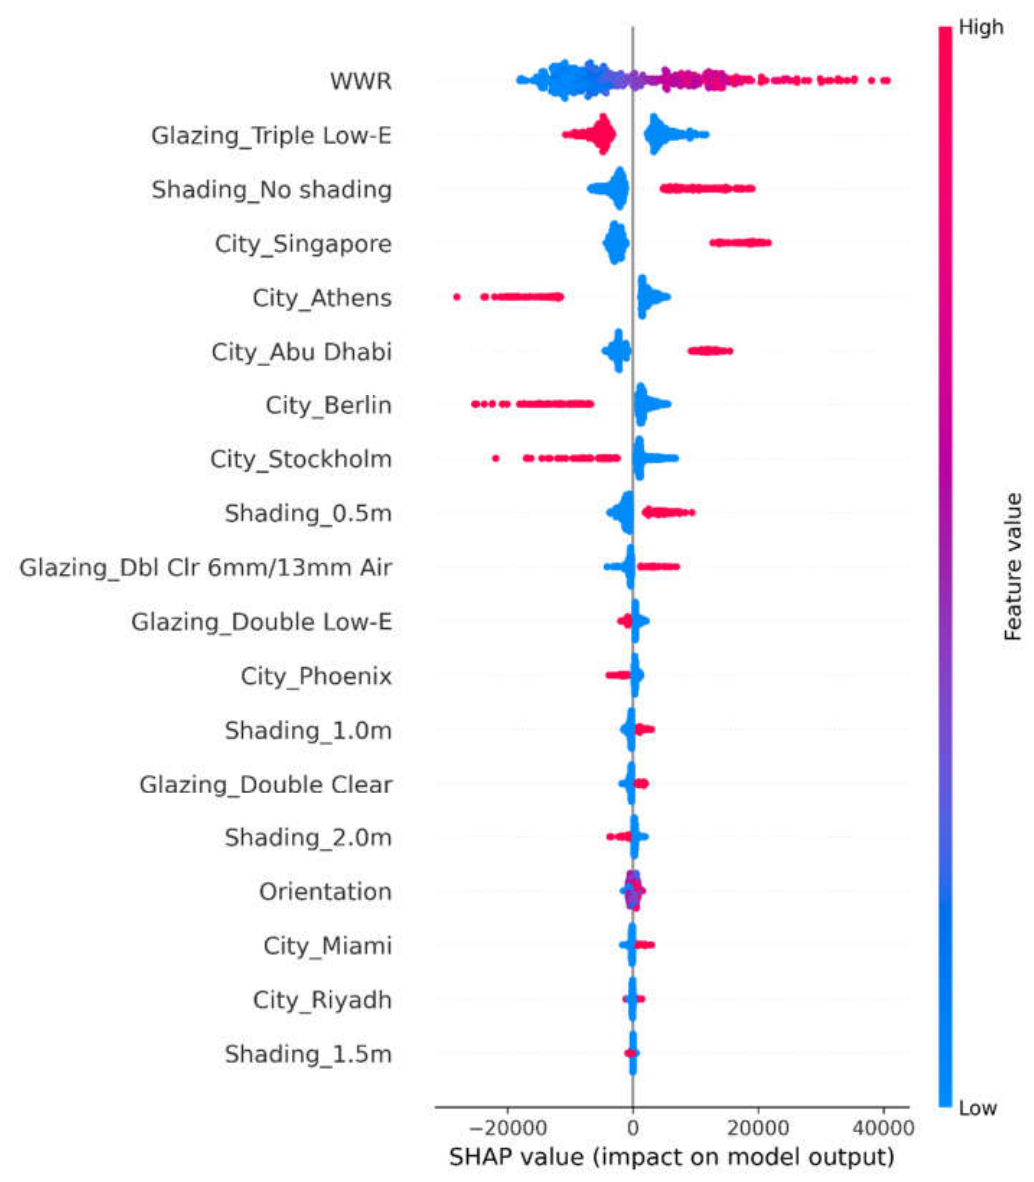
The SHAP interpretation confirmed that WWR was the strongest façade design driver. Higher WWR values generally increased predicted energy demand, especially in cooling-dominated climates, while lower WWR values reduced predicted energy use. Climate variables showed strong SHAP effects, confirming that the same façade configuration can perform differently across cities. Shading and glazing had moderate effects, while orientation showed limited influence compared with façade composition and climate context.
Figure 4.
SHAP summary plot for energy-performance interpretation. SHAP summary plot showing the relative influence and direction of design and climate variables on predicted site energy consumption. WWR produced the strongest design-variable effect, while city variables captured climate-context dependence.
Figure 4.
SHAP summary plot for energy-performance interpretation. SHAP summary plot showing the relative influence and direction of design and climate variables on predicted site energy consumption. WWR produced the strongest design-variable effect, while city variables captured climate-context dependence.
3.5. Balanced configurations and robustness ranking
The balanced-solution ranking identified configurations that performed well across both energy and comfort objectives. Riyadh achieved the highest robustness score at 99.08, followed by Abu Dhabi at 98.97 and Phoenix at 97.74. These three cities are hot-arid contexts, confirming that façade optimization produced particularly strong balanced improvements where solar control directly affected cooling demand and discomfort. Athens, Berlin, and Stockholm formed an intermediate group, while Miami and Singapore had lower robustness scores due to residual comfort challenges despite large energy reductions.
Table 7.
Balanced façade configurations and robustness scores.
| City | WWR (%) | Orientation | Shading | Glazing | Balanced EUI | Balanced discomfort | Robustness score |
| Riyadh | 20 | 180 | 1.0 m | Triple Low-E | 39.54 | 1,129.03 | 99.08 |
| Abu Dhabi | 20 | 20 | 1.5 m | Triple Low-E | 46.67 | 1,853.97 | 98.97 |
| Phoenix | 22 | 0 | 0.5 m | Triple Low-E | 38.60 | 1,348.72 | 97.74 |
| Athens | 26 | 180 | 0.5 m | Double Low-E | 35.01 | 1,713.62 | 94.03 |
| Berlin | 26 | 180 | No shading | Double Low-E | 39.15 | 2,701.59 | 92.36 |
| Stockholm | 30 | 180 | No shading | Double Low-E | 43.71 | 2,969.03 | 92.16 |
| Miami | 28 | 190 | 1.0 m | Double Low-E | 46.16 | 2,294.50 | 89.39 |
| Singapore | 20 | 295 | No shading | Double Low-E | 61.20 | 3,023.72 | 84.40 |
The balanced configurations confirm that no single façade solution was optimal across all climates. Hot-arid cities favored low WWR, Triple Low-E glazing, and external shading. Athens, Berlin, Stockholm, Miami, and Singapore generally favored Double Low-E glazing, but with different WWR and shading requirements. These results support climate-adaptive rule extraction rather than universal façade prescriptions.
4. Discussion
4.1. Climate Context and Façade-Performance Logic
The results confirm that climate context was the strongest determinant of both energy and comfort outcomes. In the Random Forest analysis, city variables accounted for 45.1% of energy-model importance and 69.6% of comfort-model importance. This finding supports the central premise of climate-responsive design: façade performance depends on the external thermal, solar, and humidity conditions against which the envelope operates. This is consistent with evidence that passive design measures do not retain the same relevance across changing or contrasting climate conditions, particularly when heating and cooling demands shift in importance [24]. The same glazing ratio, shading depth, or glazing type can reduce cooling demand in one climate, support useful solar gains in another, or produce limited comfort benefit where humidity and persistent heat dominate annual conditions.
The optimization results also showed that climate context influenced the magnitude of improvement. Hot-arid climates, especially Riyadh, Phoenix, and Abu Dhabi, produced the strongest balanced optimization responses. These cities benefited from low WWR, high-performance glazing, and external shading because these measures directly reduced solar gains, cooling demand, and overheating discomfort. The effect was visible in both energy and comfort outcomes, with Riyadh and Phoenix achieving the highest discomfort-hour reductions. This suggests that façade design has particularly high leverage in hot-arid settings, where direct solar radiation and envelope heat gains are major performance drivers.
By contrast, Berlin and Stockholm showed smaller comfort reductions despite substantial EUI improvements. This does not mean that façade optimization was ineffective in these climates. Rather, it indicates that the relationship between energy, comfort, and façade design is more complex where heating demand and seasonal solar access are important. In colder climates, reducing glazing too aggressively can limit useful winter solar gains, while excessive shading can reduce passive heat contribution. Therefore, the preferred façade strategy shifts from solar exclusion to controlled solar admission combined with efficient glazing.
Because operational carbon is strongly linked to energy demand, EUI reduction is used here as an energy-based proxy for low-carbon design potential; direct carbon-emission calculations were outside the scope of this study.
4.2. Dominant Role of Window-to-Wall Ratio
Among the controllable façade variables, WWR was the strongest predictor of both energy and comfort. It accounted for 30.9% of the energy model and 18.2% of the comfort model, exceeding shading, glazing, and orientation. SHAP interpretation confirmed that higher WWR values generally increased predicted energy demand, especially in cooling-dominated climates. This is technically expected because larger glazed areas increase solar heat gains and can increase conductive heat transfer when glazing performs less efficiently than opaque envelope components.
The city-specific results show that hot climates generally favored low WWR values. Abu Dhabi and Riyadh favored 20% WWR in the balanced configurations, Phoenix favored 22%, and Singapore also favored 20%. Miami allowed a slightly higher balanced WWR of 28% when combined with Double Low-E glazing and 1.0 m shading. These patterns indicate that cooling-dominated climates require strict control of glazed area, although the exact value depends on humidity, solar exposure, shading, and glazing specification.
In temperate and cold climates, WWR should not be interpreted as a simple minimization problem. Berlin and Stockholm accepted larger glazing ranges when efficient glazing was used and external shading was removed. This reflects the dual role of windows in colder climates, where they can contribute useful solar gains while also increasing heat loss. The practical implication is that WWR should be treated as a climate-sensitive design variable rather than a universal low-value prescription.
4.3. Shading, Glazing, and Orientation
Shading and glazing had moderate but meaningful influence. In the energy model, shading accounted for 12.4% of importance and glazing for 11.0%. In the comfort model, shading accounted for 6.3% and glazing for 5.3%. These results show that solar-control strategies matter, but their effects are secondary to climate context and WWR. They also indicate that shading and glazing should be evaluated together because their performance depends on the glazing ratio, solar exposure, and dominant load profile.
Triple Low-E glazing appeared most beneficial in hot-arid cities, including Abu Dhabi, Riyadh, and Phoenix. In these contexts, the combination of low WWR, Triple Low-E glazing, and external shading produced strong energy and comfort results. However, Triple Low-E was not universally preferred. Athens, Berlin, Stockholm, Miami, and Singapore generally favored Double Low-E glazing in the balanced configurations. This suggests that the additional performance benefit of Triple Low-E may be climate-dependent and should not be assumed to be optimal in every context.
External shading also varied by city. Abu Dhabi favored deeper shading, Riyadh and Miami favored moderate shading, Phoenix favored limited shading, and Singapore’s balanced solution selected no shading. This does not mean that shading is irrelevant in Singapore. Rather, within the tested design space, WWR and glazing had stronger effects than horizontal shading depth. In hot-humid equatorial climates, persistent humidity, diffuse radiation, and continuous cooling demand may reduce the relative impact of simple external shading compared with hot-arid climates.
Orientation had the weakest influence, contributing only 0.5% in both models. This result should be interpreted carefully. It does not mean that orientation is irrelevant, but rather that, within this standardized five-story prototype and tested variable range, orientation had less explanatory power than WWR, shading, glazing, and climate context. Whole-building annual outputs aggregate the effects of multiple façades, which can reduce the apparent importance of rotation. For practice, this means that when site or planning constraints limit orientation choice, designers can still achieve substantial performance gains through façade composition.
4.4. Climate-Adaptive Façade Design Rules
The extracted design rules confirm that robust façade design should be climate-adaptive rather than universal. Hot-arid climates required low glazing ratios, high-performance glazing, and moderate to deep shading. Hot-humid and warm-humid climates also benefited from controlled WWR, but the role of shading was less uniform. Mixed Mediterranean conditions allowed moderate WWR with light shading, while temperate and cold climates tolerated larger glazing areas when paired with efficient glazing and little or no external shading.
Table 8.
Climate-adaptive façade design rules derived from optimization and explainable machine learning.
Table 8.
Climate-adaptive façade design rules derived from optimization and explainable machine learning.
| Climate type | Cities | Recommended WWR | Shading strategy | Preferred glazing | Engineering rule |
| Hot-arid coastal | Abu Dhabi | 20–22% | 1.5–2.0 m | Triple Low-E | Minimize glazing and use deep shading. |
| Hot-arid inland | Riyadh, Phoenix | 20–34% | 0.5–1.0 m | Triple Low-E | Keep WWR low and use high-performance glazing. |
| Hot-humid / warm-humid | Singapore, Miami | 20–54% | 0–1.0 m | Double Low-E / Double clear | Control WWR; avoid excessive shading unless required by orientation or glare. |
| Mixed Mediterranean | Athens | 20–52% | 0.5 m | Double Low-E | Moderate WWR is acceptable with light shading. |
| Temperate | Berlin | 22–64% | No shading | Double Low-E | Prioritize glazing quality over shading. |
| Cold continental | Stockholm | 24–76% | No shading | Double Low-E | Allow larger glazing to support solar gains while controlling heat loss. |
These rules should be read as performance tendencies within the tested parameter ranges, not as universal design codes. This caution is important because previous research has shown that passive solar and glazing assumptions may diverge from realized building performance when design, policy, and operational conditions are not aligned [25]. They are most useful during early design stages, when architects and engineers need to narrow façade options before detailed simulation. Final specifications should still consider daylight, glare, views, cost, embodied carbon, constructability, and architectural intent.
4.5. Practical Implications and Limitations
The framework supports a shift from optimization as a computational output to optimization as decision support. Instead of presenting only Pareto alternatives, the workflow identifies which variables matter most, how they behave across climates, and how they can be translated into practical rules. This is valuable for architects, engineers, and energy consultants because early design decisions are often made before detailed technical simulation is available. The results suggest that designers should begin with climate diagnosis, prioritize WWR, refine shading and glazing according to local climate, and avoid over-reliance on orientation when stronger façade-composition variables remain unresolved.
The study has several limitations. First, the results depend on the selected prototype, geometry, internal loads, HVAC assumptions, and weather files. Second, the optimization considered four façade variables only; wall insulation, roof specification, airtightness, natural ventilation, daylight, glare, cost, and embodied carbon were not optimized. Third, ASHRAE 55 discomfort hours were calculated from simulation outputs and were not validated using occupant surveys or post-occupancy data. Fourth, the study used representative weather files rather than future climate scenarios. Future work should test the rules using climate-adjusted weather files, additional residential typologies, calibrated operational data, daylight and glare metrics, life-cycle carbon assessment, broader economic evaluation, and thermal resilience or health-related performance indicators [26].
5. Conclusions
This study developed an explainable simulation-based framework for deriving climate-adaptive façade design rules for low-carbon residential buildings across eight global climate contexts. A standardized five-story residential prototype with a gross floor area of 2240 m² was modeled in DesignBuilder using EnergyPlus 9.4. Approximately 9600 design evaluations were generated through NSGA-II optimization, using energy use intensity and ASHRAE 55 discomfort hours as the two performance objectives. Random Forest modeling and SHAP analysis were then used to identify dominant variables and translate optimization outputs into interpretable design guidance.
The results show that façade optimization can substantially improve both energy and comfort performance. EUI reductions ranged from 44.63% in Athens to 60.19% in Abu Dhabi, while discomfort-hour reductions ranged from 16.71% in Berlin to 49.71% in Riyadh. The strongest balanced improvements occurred in hot-arid climates, where low glazing ratios, high-performance glazing, and external shading directly reduced cooling demand and overheating discomfort.
The explainable machine-learning results confirmed that climate context was the dominant performance driver, accounting for 45.1% of energy-model importance and 69.6% of comfort-model importance. Among façade variables, WWR was the strongest design-controlled parameter, contributing 30.9% to the energy model and 18.2% to the comfort model. Shading and glazing had moderate influence, while orientation contributed only 0.5% in both models. These findings indicate that façade composition had greater performance relevance than rotational adjustment within the tested design space.
The main contribution of the study is the conversion of simulation and optimization outputs into practical, climate-adaptive façade rules. Hot-arid climates favored low WWR, Triple Low-E glazing, and external shading. Temperate and cold climates allowed larger glazing areas when efficient glazing and limited shading were used. Warm-humid and hot-humid climates required controlled WWR, but residual comfort challenges remained more difficult to resolve through façade variables alone.
The findings should be interpreted as conditional design guidance rather than universal design prescriptions. Future research should extend the framework by including daylight, glare, embodied carbon, construction cost, natural ventilation, occupant behavior, future climate weather files, and calibrated operational datasets.
Author Contributions
Conceptualization, Khuloud Ali and Ghayth Tintawi; methodology, Khuloud Ali, Ghayth Tintawi and Mohamad Khaled Bassma; simulation modeling, Khuloud Ali and Ghayth Tintawi; optimization analysis, Ghayth Tintawi; machine-learning analysis, Ghayth Tintawi; validation, Khuloud Ali and Ghayth Tintawi; writing—original draft preparation, Khuloud Ali, Ghayth Tintawi and Mohamad Khaled Bassma; writing—review and editing, Khuloud Ali and Ghayth Tintawi. All authors have read and agreed to the submitted version of the manuscript.
Funding
This research received no external funding.
Data Availability Statement
The simulation and optimization data supporting the findings of this study are available from the corresponding author upon reasonable request.
Acknowledgments
The authors acknowledge the use of DesignBuilder and EnergyPlus for building performance simulation and Python-based tools for data analysis, machine-learning modeling, and visualization.
Conflict of Interest
The authors declare no conflict of interest.
AI Use Disclosure
AI-assisted language tools were used to support grammar refinement, wording improvement, and manuscript structuring. All scientific content, simulation data, analysis, interpretation, and final manuscript decisions were reviewed and verified by the authors.
References
- Intergovernmental Panel On Climate Change (Ipcc). Climate Change 2022 - Mitigation of Climate Change: Working Group III Contribution to the Sixth Assessment Report of the Intergovernmental Panel on Climate Change, 1st ed.; Cambridge University Press, 2023; ISBN 978-1-009-15792-6. [Google Scholar]
- Calvin, K.; Dasgupta, D.; Krinner, G.; Mukherji, A.; Thorne, P.W.; Trisos, C.; Romero, J.; Aldunce, P.; Barrett, K.; Blanco, G.; et al. IPCC, 2023: Climate Change 2023: Synthesis Report. Contribution of Working Groups I, II and III to the Sixth Assessment Report of the Intergovernmental Panel on Climate Change [Core Writing Team, First.; IPCC, Geneva, Switzerland. Lee, H., Romero, J., et al., Eds.; Intergovernmental Panel on Climate Change (IPCC), 2023. [Google Scholar]
- Bokhari, A.; Ali, K. Simulation-Based Evolutionary Optimization of Residential Buildings for Energy and Carbon Reduction Across Warm–Humid and Coastal Hot–Arid Climates. Buildings 2026, 16, 2157. [Google Scholar] [CrossRef]
- Alexakis, K.; Benekis, V.; Kokkinakos, P.; Askounis, D. Genetic Algorithm-Based Multi-Objective Optimisation for Energy-Efficient Building Retrofitting: A Systematic Review. Energy Build. 2025, 328, 115216. [Google Scholar] [CrossRef]
- Ali, K.; Tintawi, G.; Bassma, M.K. AI-Guided Evolutionary Optimization of Passive Solar Design for Residential Heating Across Distinct Climate Zones. Solar 2026, 6, 13. [Google Scholar] [CrossRef]
- Tawfeeq, H.; Qaradaghi, A.M.A. Optimising Window-to-Wall Ratio for Enhanced Energy Efficiency and Building Intelligence in Hot Summer Mediterranean Climates. Sustainability 2024, 16, 7342. [Google Scholar] [CrossRef]
- Bassma, M.K.; Tintawi, G. Envelope Design Trade-Offs for Low-Carbon Residential Buildings in Dubai: A Simulation-Based Multi-Objective Optimization Study. Int. J. Sci. Res. Arch. 2026, 19, 157–170. [Google Scholar] [CrossRef]
- Gigasari, A.R.; Cañada-Soriano, M.; Aparicio-Fernández, C.; Vivancos, J.-L. Impact of Window-to-Wall Ratio (WWR) and Shading on Energy Demand in a Residential Building across Five Distinct Climates. Results Eng. 2025, 28, 107518. [Google Scholar] [CrossRef]
- Alwetaishi, M.; Benjeddou, O. Impact of Window to Wall Ratio on Energy Loads in Hot Regions: A Study of Building Energy Performance. Energies 2021, 14, 1080. [Google Scholar] [CrossRef]
- Resende, J.; Corvacho, H. Optimisation of Nearly Zero Energy Building Envelope for Passive Thermal Comfort in Southern Europe. Buildings 2024, 14, 2757. [Google Scholar] [CrossRef]
- Tintawi, G.; Ali, K.; Bassma, M.K. Tri-Objective Pareto Optimization of Residential Building Envelopes for Energy, Thermal Comfort, and Embodied Carbon in Inland and Coastal Hot-Arid Climates. 2026. [Google Scholar] [CrossRef]
- Crawley, D.B.; Lawrie, L.K.; Winkelmann, F.C.; Buhl, W.F.; Huang, Y.J.; Pedersen, C.O.; Strand, R.K.; Liesen, R.J.; Fisher, D.E.; Witte, M.J.; et al. EnergyPlus: Creating a New-Generation Building Energy Simulation Program. Energy Build. 2001, 33, 319–331. [Google Scholar] [CrossRef]
- Deb, K.; Pratap, A.; Agarwal, S.; Meyarivan, T. A Fast and Elitist Multiobjective Genetic Algorithm: NSGA-II. IEEE Trans. Evol. Comput. 2002, 6, 182–197. [Google Scholar] [CrossRef]
- Guo, F.; Miao, S.; Xu, S.; Luo, M.; Dong, J.; Zhang, H. Multi-Objective Optimization Design for Cold-Region Office Buildings Balancing Outdoor Thermal Comfort and Building Energy Consumption. Energies 2024, 18, 62. [Google Scholar] [CrossRef]
- Evins, R. A Review of Computational Optimisation Methods Applied to Sustainable Building Design. Renew. Sustain. Energy Rev. 2013, 22, 230–245. [Google Scholar] [CrossRef]
- American Society of Heating, Refrigerating and Air-Conditioning Engineers (ASHRAE) ANSI/ASHRAE Standard 55-2023: Thermal Environmental Conditions for Human Occupancy; Atlanta, GA, USA, 2023.
- Ligozat, A.-L.; Lefevre, J.; Bugeau, A.; Combaz, J. Unraveling the Hidden Environmental Impacts of AI Solutions for Environment Life Cycle Assessment of AI Solutions. Sustainability 2022, 14, 5172. [Google Scholar] [CrossRef]
- Ostergård, T.; Jensen, R.L.; Maagaard, S.E. Building Simulations Supporting Decision Making in Early Design – A Review. Renew. Sustain. Energy Rev. 2016, 61, 187–201. [Google Scholar] [CrossRef]
- Nguyen, A.-T.; Reiter, S.; Rigo, P. A Review on Simulation-Based Optimization Methods Applied to Building Performance Analysis. Appl. Energy 2014, 113, 1043–1058. [Google Scholar] [CrossRef]
- Tintawi, G.; Ali, K.; Monteiro, L.; Bassma, M.K.; Rosse Caldas, L. Material Sufficiency, Energy Use, and Life-Cycle Carbon in Hot-Arid Residential Buildings: A Pareto-Informed Multi-Criteria Evaluation of Envelope Design Strategies. 2026. [Google Scholar] [CrossRef]
- Tintawi, G.; Ali, K.; Bassma, M.K. Integrating Multi-Objective Optimization, Random Forest Learning, and SHAP-Based Explainability for Climate-Responsive Residential Envelope Design in Gulf Coastal Cities. 2026. [Google Scholar] [CrossRef]
- Breiman, L. Random Forests. Mach. Learn. 2001, 45, 5–32. [Google Scholar] [CrossRef]
- Lundberg, S.; Lee, S.-I. A Unified Approach to Interpreting Model Predictions 2017. [PubMed]
- Pajek, L.; Potočnik, J.; Košir, M. The Effect of a Warming Climate on the Relevance of Passive Design Measures for Heating and Cooling of European Single-Family Detached Buildings. Energy Build. 2022, 261, 111947. [Google Scholar] [CrossRef]
- Wingrove, K.; Heffernan, E.; Daly, D.; Ambrose, M. Passive-Solar Design: Evidence of the Disconnect between Theory, Policy and Practice in the Glazing Design of Contemporary Australian Homes. Energy Build. 2025, 345, 116104. [Google Scholar] [CrossRef]
- Lu, Y.; Ma, N.; Arsano, A.Y.; Brown, N.; Chung, J.; Dilsiz, A.D.; Dong, B.; Franconi, E.; Han, X.; Jiang, Z.; et al. Towards High-Performance Buildings for Thermal Resilience and Health. Energy Build. 2025, 26 347, 116367. [Google Scholar] [CrossRef]
Disclaimer/Publisher’s Note: The statements, opinions and data contained in all publications are solely those of the individual author(s) and contributor(s) and not of MDPI and/or the editor(s). MDPI and/or the editor(s) disclaim responsibility for any injury to people or property resulting from any ideas, methods, instructions or products referred to in the content. |
© 2026 by the authors. Licensee MDPI, Basel, Switzerland. This article is an open access article distributed under the terms and conditions of the Creative Commons Attribution (CC BY) license (http://creativecommons.org/licenses/by/4.0/).
Copyright: This open access article is published under a Creative Commons CC BY 4.0 license, which permit the free download, distribution, and reuse, provided that the author and preprint are cited in any reuse.


