

Submitted:
25 June 2026
Posted:
29 June 2026
You are already at the latest version
Abstract
Wear-metal monitoring is an important component of lubricant condition monitoring but commonly relies on elemental techniques such as inductively coupled plasma optical emission spectroscopy (ICP-OES), which require dedicated laboratory infrastructure and sample preparation. This study evaluates whether Fourier-transform infrared (FT-IR) spectra of used engine oils can be combined with partial least squares regression (PLS) to provide a rapid screening estimate of iron (Fe) concentration. Used petrol and diesel engine-oil samples were analyzed by FT-IR spectroscopy and ICP-OES. PLS models were developed using processed FT-IR spectra as predictor variables and ICP-OES-derived Fe concentrations as response variables. For petrol used oil samples, the optimized model employing 18 latent variables achieved a root mean squared error of 5.02 ppm and a coefficient of determination of 0.97 between measured and predicted Fe concentrations. Model loadings indicated contributions from spectral features associated with soot, oxidation, nitration, antioxidant depletion, and zinc dialkyldithiophosphate depletion. Combining petrol and diesel samples in a single model reduced predictive performance and increased uncertainty, indicating that their differing degradation pathways cannot be adequately represented by one common latent-variable model. The approach does not directly measure Fe and is not intended to replace elemental analysis. Instead, it provides a rapid, low-cost screening tool for identifying samples with potentially elevated wear-metal concentrations and prioritizing them for confirmatory analysis.
Keywords:
engine oil
; internal combustion engine (ICE)
; wear
; Fourier-transformed infrared spectroscopy (FT-IR)
; partial least squares regression (PLS)
1. Introduction
Lubricants fulfill several key roles in technical systems, such as cooling, transport of additives and degradation products, corrosion protection, just to name a few, but wear reduction is their primary purpose. Wear – the unwanted loss of material from component surfaces – will shorten the service life of said machine elements, and consequently the whole systems as well, resulting in the need for maintenance, part replacement or even remanufacturing the whole system. These activities all require financial resources and contribute to material and energy use, hence, to harmful pollutant emissions.
Lubricants are unique amongst the machine elements – they have a comparatively short service life and are in contact with all the moving parts simultaneously. Thus, their performance is critical. Over the lifetime of an engine oil, additives, such as phenolic and aminic antioxidants, zinc-dialkyldithiophosphate (ZDDP) or boron ester antiwears, or the calcium carbonate base reserve deplete, while degradation products, such as oxidation and nitration species, soot, or organic acids originate and accumulate [1]. These chemical changes negatively impact engine wear – most notably ZDDP depletion [2,3] and soot accumulation [4,5,6] largely increase wear rates.
Fourier-transform infrared spectroscopy (FT-IR) is very commonly used for oil condition monitoring. Standards, such as ASTM E2412 [7] and DIN 51453 [8] describe the determination of oxidation, nitration, antiwear additives and soot in detail, amongst other parameters, and additive-specific in-house methods are also available [1]. FT-IR is especially popular, since other determinations, such as total acid number (TAN) [9] or total base number (TBN) [10] require complex infrastructure and chemicals, meanwhile FT-IR is a quick, non-destructive measurement requiring no sample preparation. This is also the case for mass spectrometry (MS), which is a very potent tool in condition monitoring and describing reaction products on the molecular level [11], but is very demanding on the instrumentalization. Other common oil condition monitoring methods include viscometry [12], fuel dilution [13], water content [14] and rust prevention characteristics [15]. Furthermore, mobile FT-IR spectrometers are also available for measurements in the field [16].
Specifically for wear element determination in in-service lubricants, the two most common methods are inductively coupled plasma optical emission spectroscopy or mass spectrometry (ICP-OES or ICP-MS), and X-ray fluorescence analysis (XRF), both requiring comparatively expensive hardware and laboratory infrastructure. ICP-based methods either dilute the oil samples in organic solvents [17], or require microwave-assisted digestion, usually with nitric acid [18], which are time-intensive and make analysis turnaround times longer. XRF requires no sample preparation, hence, is comparatively faster, but X-ray equipment is usually associated with stronger legal oversight due to radiation safety, which makes these systems more complex in the acquisition. Wear monitoring is possible online for example via radio nucleid technique (RNT) [19] or radio isotope concentration (RIC) methods [20], both involving radiologically activated machine elements. These techniques are highly accurate, but once again the required hardware and preparations are complex and expensive. Complementary wear-monitoring approaches include wear sensors, which can be electrical (inductive, capacitive, resistive) [21,22], optical [21,23], or ultrasonic [21] regarding operating principle. Filter-debris analysis, and microscopy-based wear-debris analysis are also commonly utilized [24]. These methods can provide information on particle size, morphology, or wear mechanisms, but generally require specialized instrumentation, interpretation, or system-specific integration.
The aim of this study is the development of a rapid wear-screening technique based on the in-service oils FT-IR spectra and modern data science – namely partial least squares regression (PLS). PLS is a multivariate modelling technique that relates a predictor matrix (X) to one or more response variables (y) [25,26]. In the case of a single response variable the method is referred to as PLS1, whereas models involving multiple responses are termed PLS2. In the presented study, PLS1 was performed where X contains the processed FT-IR spectra of the individual oil samples and y corresponds to the iron (Fe) content measured via ICP-OES in the engine oil samples. PLS constructs latent variables that maximize the covariance between predictors and response variables, which are subsequently used in a linear regression model.
PLS is conceptually related to principal component analysis (PCA), as both methods produce scores and loadings describing the structure of the predictor space. PCA is already routinely used for the classification of in-service engine oil samples [25,27]. However, PCA identifies directions of maximum variance in X only, whereas PLS incorporates the relationship between predictors and response variables during component extraction. Consequently, the resulting latent variables are optimized for predictive modelling rather than purely for dimensionality reduction. This makes PLS particularly suitable for datasets with large numbers of strongly correlated variables, such as FT-IR spectra, where conventional ordinary least squares regression becomes unstable. Several studies used the combination of FT-IR data with PLS to estimate lubricant parameters. Zho et al. applied PLS on FT-IR attenuated total reflection (ATR) data with various preprocessing methods to model the acid number (AN) in in-service lubricants [28]. Sejkorová et al. used a similar FT-IR ATR / PLS method to model kinematic viscosity [29] and TBN [30]. Macián et al. applied PLS on FT-IR and UV-VIS data of used oils to determine fuel dilution [31]. This shows that the FT-IR PLS approach is very flexible and very potent in lubricant condition monitoring, especially since the infrared spectrum contains a wide variety of information about the chemical composition, contaminations and additives involved. Additionally, machine learning via neural networks can also be applied to multi-parameter oil analysis reports to classify samples and potentially flag critical conditions [32].
To the authors’ knowledge, quantitative prediction of elemental wear indicators from used oil FT-IR spectra has received limited attention compared with the established spectroscopic estimation of lubricant condition parameters such as oxidation, acid number, base number, viscosity, soot, or fuel dilution. Unlike these molecular or bulk physicochemical properties, iron is not directly measured by mid-infrared spectroscopy. Any predictive relationship must therefore arise from the multivariate co-evolution of wear with lubricant degradation, additive depletion, contamination, and vehicle operating history. This also defines an important limitation of the approach: model performance depends on the representativeness of the calibration dataset and may be influenced by the oil formulation, engine type, service interval, and operating conditions represented therein. The aim of this study was therefore to develop and evaluate a rapid screening approach for estimating Fe concentrations in used engine oils from FT-IR spectra using partial least squares regression. The proposed method is not intended to replace ICP-OES as a reference technique for elemental analysis. Instead, it is intended to provide a rapid and cost-efficient preliminary assessment that can classify samples according to their expected wear level and identify samples requiring confirmatory elemental or wear-debris analysis. Fe was selected as the target wear element because it is commonly associated with the wear of ferrous engine components, including cylinder liners, piston rings, valve-train components, bearings, gears, and other steel-containing parts. In used engine oils, increasing Fe concentrations can therefore serve as a broad indicator of metallic component wear. Although elemental analysis alone cannot identify the precise wear source or mechanism, Fe is a highly relevant screening parameter because it is typically among the most abundant wear metals observed in in-service engine oils.
2. Materials and Methods
2.1. Vehicle Field Test Under Real Driving Conditions
Field testing was conducted in prior studies [1,18,33,34] under normal on-road operation of passenger vehicles to obtain lubricant samples representative of real-world service conditions. Oil samples were collected via the dipstick tube after approximately 5 minutes of engine idling to ensure adequate mixing and sample homogeneity.
In total, 64 spark ignition (SI or petrol) used oil samples originating from 4 fresh oils and 12 vehicles as well as 12 compression ignition (CI or diesel) used oil samples from 2 fresh oils and 4 vehicles were collected. Vehicle–lubricant combinations are denoted P1–P12 for petrol and D1–D4 for diesel. The dataset includes multiple lubricant manufacturers, engine power classes, and service intervals, providing a representative overview of typical European passenger vehicle operating conditions.
An overview of the vehicles and lubricants investigated is provided in Table 1.
As visible, diesel vehicles are underrepresented compared to their petrol counterparts in the dataset. This is due to the shifting EU passenger vehicle market (see Figure 1), where diesel drivetrains have been losing popularity for multiple years, reaching an all-time-low market share of 8.4% in 2025 according to the European Automobile Manufacturers’ Association (ACEA) [35,36,37]. Comparatively, pure petrol drivetrains remained relatively popular (26.6% in 2025), and the current dominating technology became hybrid electric (HEV – 34.5%), which mostly contains a petrol ICE. It is also noteworthy that battery electric (BEV) and plug-in hybrid (PHEV) vehicles only slowly gain further popularity in the EU market since 2023 and seem to stabilize as less common drivetrain configurations. Accordingly, research is focused more on petrol engines due to both their better availability for studies as well as their higher market relevance.
2.2. Lubricant Analysis
FT-IR measurements were carried out using a Tensor II spectrometer (Bruker, Ettlingen, Germany). Spectral evaluation was performed using OPUS software (version 8.7.31, Bruker). Spectra were recorded over a wavenumber range of 500–4000 cm⁻¹ with a spectral resolution of approximately 1.5 cm⁻¹. A dual-channel sample holder was employed, and for each measurement 32 background scans and 32 sample scans were collected. Samples were analyzed using a ZnSe transmission cell with an optical path length of 100 µm.
Elemental analysis was performed using inductively coupled plasma optical emission spectroscopy (ICP–OES) (5800 VDV ICP-OES Spectrometer, Agilent Technologies, Santa Carla, California, USA) following microwave-assisted digestion of the oil samples. Approximately 0.1 g of oil was digested with nitric acid and hydrogen peroxide in closed microwave vessels, followed by dilution to a defined volume with ultrapure water.
Quantitative analysis was carried out using external calibration with multi-element standards prepared from commercially available 1000 ppm single-element stock solutions (Carl Roth GmbH, Karlsruhe, Germany). The analyzed element set included Al, B, Ba, Ca, Co, Cr, Cu, Fe, K, Li, Mg, Mn, Mo, Na, Ni, P, Pb, S, Sb, Si, Sn, Ti, V, W, and Zn. Calibration solutions were prepared in matrices corresponding to the analytical conditions.
ICP-OES measurements were performed using argon plasma in both axial and radial observation modes in order to cover a wide concentration range. Multiple emission lines were monitored for each analyte element to minimize spectral interferences. Each sample was measured in triplicate, and the final concentration was calculated from the mean signal intensity of valid emission lines.
Quality control was ensured using independent multi-element standards measured at the beginning and end of each analytical sequence. Only emission lines showing deviations within ±10% of the reference concentration were accepted for evaluation.
2.3. FT-IR Interpretation and Data Preprocessing
FT-IR spectroscopy provides access to a wide range of wear-relevant physicochemical information, including indicators such as ZDDP depletion and soot content. In addition to these established parameters, the spectra contain further information that is not directly evaluated by conventional methods but can be captured through multivariate techniques such as PLS via latent variables.
A model based on FT-IR data therefore offers significant advantages for condition monitoring in terms of both time and cost, as elemental analysis methods such as ICP–OES are comparatively complex and resource-intensive. Moreover, FT-IR measurements can be readily implemented in online monitoring systems, further increasing their practical applicability.
For PLS modelling, the FT-IR absorption spectra were used directly as predictor variables. No baseline correction was applied, as this would remove information related to soot content. In used engine oils, soot is commonly evaluated through the baseline shift in the spectral region around 2000 cm⁻¹ [38].
Additionally, spectral regions dominated by hydrocarbon absorption (2755–3100 cm⁻¹ and 1363–1496 cm⁻¹) were excluded from the analysis. These regions do not provide relevant information for the investigated degradation processes and mainly contribute noise due to the strong overall absorption of the hydrocarbon matrix. In total, 1573 individual data points were used per FT-IR spectra.
Several spectral regions are considered during the model interpretation which correspond to various lubricant degradation mechanisms. Detailed information is available in Table 2.
Finally, the processed spectra were exported from OPUS and converted into numerical format for subsequent multivariate analysis.
2.4. Partial Least Squares Regression
Initial investigations on modelling engine wear based on FT-IR spectral data were previously reported in [18] focusing on a petrol-only dataset. The present work extends this approach to mixed petrol and diesel samples. PLS models were implemented in Python® using the scikit-learn library (version 1.7) [39]. The dataset was divided into training (80%) and test (20%) subsets using a stratified sampling approach based on the response variable (Fe content) to ensure representation across the full measured concentration range. A fixed random seed was used to ensure reproducibility. Hyperparameter tuning was performed using five-fold cross-validation on the training dataset.
The optimal number of latent variables was determined by minimizing the cross-validated root mean squared error (RMSE). Following hyperparameter optimization, the final model was trained on the full training set and evaluated using the independent test dataset. Model stability was assessed using bootstrap resampling of the training data (1000 iterations). Predictions for the test samples were aggregated to obtain the median prediction and corresponding confidence bounds.
Confidence intervals (in this case 90%) describe the uncertainty associated with the model estimate itself, representing the range in which the expected mean prediction would fall if the modelling procedure were repeated. Figure 2 illustrates the PLS workflow.
3. Results and Discussion
Figure 3 shows the Fe content of the engine oil samples as a function of the mileage. It is well visible, that Fe increases over the mileage of the oil samples, as engine wear propagates. However, no clear trend is observable between Fe and milage, since engine wear is influenced by several parameters, so a simple linear regression is not suitable for prediction. As petrol and diesel populations are shown separately, it is also visible that diesel engines tend to produce higher Fe content compared to petrol engines. This is usually associated to the higher soot loading in diesel engines [4,18].
3.1. Petrol Used Oil Samples – Petrol Model
Initially, PLS was attempted on the petrol oil samples only, as data availability is better for this population (64 observations).
Figure 4 summarizes the key parameters of the petrol model. Part (a) presents the results of the hyperparameter tuning, showing the RMSE as a function of the number of components. The optimal model complexity was determined by minimizing the RMSE, thereby balancing underfitting and overfitting. In the present case, 18 components were selected, resulting in an RMSE of 5.02 ppm, corresponding to approximately 10% of the iron concentration range investigated.
Panel (b) shows the explained variance ratios for both X and y. It should be noted that PLS maximizes the covariance between predictor and response variables rather than the variance in X alone. The first two components account for the majority of the explained variance in both X (94.4%) and y (82.4%) and were therefore considered sufficient for interpretation of the model loadings (see Figure 6). However, it is also noted that component 5 shows a slightly elevated explained variance ratio. This phenomenon is discussed in detail at Figure 10.
Figure 5 illustrates the predictive performance of the PLS model by comparing measured Fe concentrations (ICP–OES) with the median predictions obtained from 1000 bootstrap iterations. Error bars represent 90% confidence intervals derived from the bootstrap distributions. As each iteration involves a new randomized train–test split, individual samples may be included in either the training or test set across different runs. Accordingly, the reported confidence intervals reflect model stability under resampling rather than analytical measurement uncertainty.
Overall, the model exhibits strong predictive performance within the investigated concentration range. Linear regression between measured and predicted values yields a slope of 0.97, indicating minimal systematic bias, and a coefficient of determination (R²) of 0.97, confirming low residual error. The mean prediction error is approximately 5.0 ppm, while deviations exceeding 10 ppm occur in only 2 out of 28 evaluations. These results demonstrate that iron content—and thus a key indicator of tribological performance—can be reliably estimated from FT-IR spectra.
Figure 6 presents the X-loadings of components 1 and 2. As the response variable (Fe concentration) is univariate, the corresponding y-loadings provide limited additional insight and are therefore not shown. Instead, the X-loadings are used to identify the spectral features contributing to the model. For reference, characteristic FT-IR evaluation regions are indicated, including water, soot, diesel and gasoline, as well as oxidation, nitration, phenolic and aminic antioxidants, and ZDDP-related signals. Spectral gaps correspond to excluded hydrocarbon absorption regions (see Table 2 for evaluation details).
Component 1 exhibits broadly uniform and elevated contributions across the entire wavenumber range, which is characteristic of soot-related baseline absorption. This characteristic “baseline shift” emerges from the soot particles, as they are absorbing across the whole wavenumber-range. The reason for the standard evaluation at 2000 cm-1 [7] is simply the absence of other dominant spectral features in this region.
In contrast, component 2 highlights distinct spectral regions associated with lubricant degradation processes. The large contributions of degradation product accumulation, most notably oxidation and nitration, are well visible. Additionally, additive depletion, namely phenolic and aminic antioxidants as well as ZDDP antiwear also contribute strongly to the model. In general, component 2 depicts the typical chemical changes associated with thermo-oxidative oil degradation.
These results indicate that the PLS model captures the key physicochemical information governing oil degradation. A key advantage of this approach is that the overall lubricant condition can be represented by a single predicted variable, thereby avoiding the need for separate evaluation of multiple individual degradation parameters, hence, greatly reducing the time and effort of the interpretation.
3.2. All Used Oil Samples – Mixed Model
Subsequently, PLS was also attempted on the whole oil sample dataset. Here the 64 petrol and 12 diesel observations were handled together resulting in a mixed model.
The parameters of the mixed model are shown in Figure 7 (a) and (b), respectively. The hyperparameter tuning (a) indicated a minimal RMSE of 4.59 ppm at 15 components. The explained variance ratio of the corresponding model is shown in Figure 7 (b), where the first 2 components explain 95.2% of the X and 69.4% of the y variance. Compared to the petrol model, the number of components and explained X variance ratios are similar, but the explained y variance ratio decreased considerably from 82.4% once the diesel used oil samples are also included. This indicates that the mixed model was less able to capture the underlying tribochemical processes. Additionally, the explained y variance ratio contribution of component 5 is high at 23.7% indicating that this latent variable carries an elevated weight when diesel used oils are also included in the data.
Figure 8 evaluates the predictive performance of the mixed PLS model, with petrol and diesel samples in the test set highlighted separately. Overall, the mixed model performs worse than the petrol-only model. A linear regression based on the petrol samples alone already shows increased systematic bias (slope = 0.91) and reduced goodness of fit (R² = 0.91), indicating a deterioration in predictive accuracy.
The diesel samples deviate markedly from the regression line, particularly at higher Fe concentrations. In addition, substantially broader confidence intervals are observed (up to 25 ppm and 48 ppm), reflecting increased prediction uncertainty.
These results indicate reduced model stability and suggest that the PLS model is unable to consistently capture degradation patterns when both fuel types are combined. This behavior is partly attributable to the smaller number of diesel observations; however, it is primarily driven by fundamental differences in degradation mechanisms. Petrol engine oils are typically dominated by oxidative degradation, nitration, and additive depletion under relatively lower air–fuel ratios [27,33,34]. In contrast, diesel engines exhibit limited fuel evaporation due to the higher boiling range of diesel fuel, leading to poorer mixture homogeneity and increased soot formation [34]. Previous field studies attributed higher importance to soot-based diesel-typical wear compared to oxidation-based petrol-typical processes [4,34], where it was also shown that wear returns to levels comparable to fresh oils once soot is removed by ultracentrifugation [4]. These fundamental differences in tribochemical pathways explain the reduced performance of the mixed model and highlight that a single global PLS model is insufficient to describe both petrol and diesel oil degradation within a unified latent variable framework.
Figure 9 displays the X-loadings of component 1 and 2 for the mixed model, where similar considerations to the petrol model can be made. Component 1 is mostly capturing soot (baseline shift), component 2 contains the typical oxidative degradation indicators such as oxidation, nitration and additive depletion markers (antioxidant and antiwear additives). In this regard, the mixed model is similar to the petrol version.
Figure 10 additionally shows the X-loadings of component 5 due to its relatively high explained y variance ratio. Here, strong contributions of the gasoline and diesel fuel related regions are visible, indicating that this component could be sensitive to fuel dilution, hence the elevated weighting once both petrol and diesel engine oils are considered. The need for higher-order components to adequately cover the y-variance reflects additional variance introduced by diesel samples, which contributes to reduced model interpretability and stability. Hence, the mixed model displayed overall inferior predictive performance compared to the petrol model, indicating that different tribochemical processes are hard to assess by a single PLS model. An accurate diesel model could very likely be constructed if a suitable dataset were available.
4. Conclusions and Outlook
PLS regression was applied to FT-IR spectra of 64 petrol and 12 diesel used oil samples to model Fe content as a wear indicator determined by ICP-OES. The petrol-only model demonstrated good predictive performance with an RMSE of 5.02 ppm and an R2 value of 0.97. Analysis of the X-loadings indicated that soot-related spectral features, oxidative degradation, and additive depletion are the dominant contributors associated with wear prediction. This highlights that cost-efficient analytical techniques such as FT-IR can be effectively combined with accessible data-driven methods such as PLS to enable rapid assessment of wear behaviour in internal combustion engines.
When both petrol and diesel samples were included, predictive performance decreased considerably. In particular, predictions for diesel samples became unreliable, with confidence intervals reaching up to approximately 50 ppm. This indicates a fundamental limitation of the approach: while similar spectral features are present, the relationship between these features and wear differs between petrol and diesel systems. As a result, a single mixed model cannot adequately capture the underlying tribochemical processes.
These findings suggest that tribological modelling using spectroscopic data must remain fuel-specific. With the anticipated introduction of alternative, carbon-neutral fuels such as hydrogen, ammonia, and methanol, this distinction is expected to become even more critical. Data-driven approaches can significantly enhance condition monitoring, but they cannot replace a mechanistic understanding of the underlying chemistry and wear processes, which must be evaluated individually for each fuel type.
Author Contributions
Conceptualization, A.A., C.B. and G.V.; methodology, A.A. and G.V.; software, A.A.; validation, G.V; formal analysis, A.A.; investigation, A.A.; resources, C.B. and M.F.; data curation, A.A.; writing—original draft preparation, A.A. and G.V.; writing—review and editing, C.B. and M.F.; visualization, A.A.; supervision, C.B. and M.F.; project administration, C.B. and M.F.; funding acquisition, M.F. All authors have read and agreed to the published version of the manuscript.
Funding
The presented results were realized as part of the COMET Centre InTribology (FFG no. 906860), a project of the “Excellence Centre for Tribology” (AC2T research GmbH). InTribology is funded within the COMET – Competence Centres for Excellent Technologies Programme by the federal ministries BMIMI and BMWET as well as the federal states of Niederösterreich and Vorarlberg based on financial support from the project partners involved. COMET is managed by The Austrian Research Promotion Agency (FFG).
Data Availability Statement
The original contributions presented in this study are included in the article. Further inquiries can be directed to the corresponding author.
Acknowledgments
During the preparation of this manuscript, the authors used ChatGPT (OpenAI) for the purposes of English language editing and literature research support. The authors have reviewed and edited the output and take full responsibility for the content of this publication.
Conflicts of Interest
All authors are employed by AC2T research GmbH.
Abbreviations
The following abbreviations are used in this manuscript:
| AN | Acid number |
| AO | Antioxidant |
| ASTM | ASTM International |
| ATR | Attenuated total reflectance |
| BEV | Battery-electric vehicle |
| CI | Compression ignition |
| DIN | Deutsches Institut für Normung |
| Fe | Iron |
| FT-IR | Fourier-transform infrared spectroscopy |
| HEV | Hybrid electric vehicle |
| ICE | Internal combustion engine |
| ICP-MS | Inductively coupled plasma mass spectrometry |
| ICP-OES | Inductively coupled plasma optical emission spectroscopy |
| MS | Mass spectrometry |
| MSE | Mean squared error |
| PCA | Principal component analysis |
| PHEV | Plug-in hybrid electric vehicle |
| PLS or PLSR | Partial least squares |
| RIC | Radio isotope concentration |
| RMSE | Root mean squared error |
| SAE | Society of Automotive Engineers |
| SI | Spark ignition |
| TAN | Total acid number |
| TBN | Total base number |
| UV-Vis | Ultraviolet-visible spectroscopy |
| XRF | X-ray fluorescence |
| ZnSe | Zinc selenide |
| ZDDP | Zinc dialkyldithiophosphate |
References
- Dörr, N.; Agocs, A.; Besser, C.; Ristić, A.; Frauscher, M. Engine Oils in the Field: A Comprehensive Chemical Assessment of Engine Oil Degradation in a Passenger Car. Tribol. Lett. 2019, 67. [Google Scholar] [CrossRef]
- Agocs, A.; Besser, C.; Brenner, J.; Budnyk, S.; Frauscher, M.; Dörr, N. Engine Oils in the Field: A Comprehensive Tribological Assessment of Engine Oil Degradation in a Passenger Car. Tribol. Lett. 2022, 70. [Google Scholar] [CrossRef]
- Fuller, M.L.S.; Kasrai, M.; Bancroft, G.M.; Fyfe, K.; Tan, K.H. Solution Decomposition of Zinc Dialkyl Dithiophosphate and Its Effect on Antiwear and Thermal Film Formation Studied by X-Ray Absorption Spectroscopy. Tribol. Int. 1998, 31, 627–644. [Google Scholar] [CrossRef]
- Agocs, A.; Frauscher, M.; Ristic, A.; Dörr, N. Impact of Soot on Internal Combustion Engine Lubrication—Oil Condition Monitoring, Tribological Properties, and Surface Chemistry. Lubricants 2024, 12. [Google Scholar] [CrossRef]
- Kontou, A.; Southby, M.; Morgan, N.; Spikes, H.A. Influence of Dispersant and ZDDP on Soot Wear. Tribol. Lett. 2018, 66. [Google Scholar] [CrossRef]
- Green, D.A.; Lewis, R. The Effects of Soot-Contaminated Engine Oil on Wear and Friction: A Review. Proceedings of the Institution of Mechanical Engineers, Part D: Journal of Automobile Engineering 2008, 222, 1669–1689. [Google Scholar] [CrossRef]
- ASTM; International ASTM E2412 - Standard Practice for Condition Monitoring of Used Lubricants by Trend Analysis Using Fourier Transform Infrared (FT-IR) Spectrometry. 2004.
- Testing of Lubricants – Determination of Oxidation and Nitration of Used Motor Oils – Infrared Spectrometric Method 2004. DIN; (Deutsches Institut für Normung) DIN 51453.
- ASTM; International ASTM D664: Standard Test Method for Acid Number of Petroleum Products by Potentiometric Titration. 2024.
- International Organization for Standardization. ISO 3771; Petroleum Products - Determination of Base Number - Perchloric Acid Potentiometric Titration Method 2011.
- Agocs, A.; Nagy, A.L.; Ristic, A.; Tabakov, Z.M.; Raffai, P.; Besser, C.; Frauscher, M. Oil Degradation Patterns in Diesel and Petrol Engines Observed in the Field—An Approach Applying Mass Spectrometry. Lubricants 2023, 11. [Google Scholar] [CrossRef]
- ASTM; International ASTM D7042 - Standard Test Method for Dynamic Viscosity and Density of Liquids by Stabinger Viscometer (and the Calculation of Kinematic Viscosity). 2021.
- Hakeem, M.; Anderson, J.; Surnilla, G.; Yamada, S.S. Characterization and Speciation of Fuel Oil Dilution in Gasoline Direct Injection (DI) Engines. In Proceedings of the; American Society of Mechanical Engineers, 8 November 2015; Volume 1. [Google Scholar]
- DIN (Deutsches Institut für Normung) DIN 51777-2 - Testing of Mineral Oil Hydrocarbons and Solvents; Determination of Water Content According to Karl Fischer; Indirect Method. 1974.
- DIN (Deutsches Institut für Normung). DIN ISO 7120; Petroleum Products and Lubricants - Petroleum Oils and Other Fluids - Determination of Rust-Preventing Characteristics in the Presence of Water 2000.
- Eralytics Eraspec Oil - The Professional FTIR for Lube Oil Analysis. Available online: https://eralytics.com/products/eraspec-oil/ (accessed on 20 June 2026).
- Standard Test Method for Multielement Determination of Used and Unused Lubricating Oils and Base Oils by Inductively Coupled Plasma Atomic Emission Spectrometry (ICP-AES). ASTM; International ASTM D5185.
- Agocs, A. Lubricant Degradation in Internal Combustion Engines and Correlation with Artificial Ageing. Master Thesis, Vienna University of Technology, Vienna, 2026. [Google Scholar]
- Scherge, M.; Pöhlmann, K.; Gervé, A. Wear Measurement Using Radionuclide-Technique (RNT). Wear 2003, 254, 801–817. [Google Scholar] [CrossRef]
- Frauscher, M.; Agocs, A.; Wopelka, T.; Ristic, A.; Ronai, B.; Holub, F.; Payer, W. Improving Sustainability by Enhanced Engine Component Lifetime through Friction Modifier Additives in Fuels. Fuel 2024, 358. [Google Scholar] [CrossRef]
- Han, W.; Mu, X.; Liu, Y.; Wang, X.; Li, W.; Bai, C.; Zhang, H. A Critical Review of On-Line Oil Wear Debris Particle Detection Sensors. J. Mar. Sci. Eng. 2023, 11, 2363. [Google Scholar] [CrossRef]
- Chambers, K.W.; Arneson, M.C.; Waggoner, C.A. An On-Line Ferromagnetic Wear Debris Sensor for Machinery Condition Monitoring and Failure Detection. Wear 1988, 128, 325–337. [Google Scholar] [CrossRef]
- Sun, J.; Wang, L.; Li, J.; Li, F.; Fang, Y. An On-Line Imaging Sensor Based on Magnetic Deposition and Flowing Dispersion for Wear Debris Feature Monitoring. Mech. Syst. Signal Process. 2024, 212, 111321. [Google Scholar] [CrossRef]
- Li, J.; Liang, X.; Dai, P.; Zhang, Z.; Wu, D.; Yan, J. Wear Particle Properties of the High-Pressure Common Rail Fuel System in Diesel Engines. Powder Technol. 2026, 475, 122322. [Google Scholar] [CrossRef]
- Ronai, B. Evaluation of Chemical and tribometrical Data of Engine Oils by selected Multivariate Statistics. Master Thesis, Vienna University of Technology, Vienna, 2021. [Google Scholar]
- Varmuza, K.; Filzmoser, P. Introduction to Multivariate Statistical Analysis in Chemometrics; CRC Press, 2016; ISBN 9780429145049. [Google Scholar]
- Nagy, A.L.; Agocs, A.; Ronai, B.; Raffai, P.; Rohde-Brandenburger, J.; Besser, C.; Dörr, N. Rapid Fleet Condition Analysis through Correlating Basic Vehicle Tracking Data with Engine Oil Ft-Ir Spectra. Lubricants 2021, 9. [Google Scholar] [CrossRef]
- Zhou, F.; Shen, J.; Li, X.; Yang, K.; Wang, L. An Optimal Preprocessing Method for Predicting the Acid Number of Lubricating Oil Based on PLSR and Infrared Spectroscopy. Lubricants 2025, 13, 355. [Google Scholar] [CrossRef]
- Sejkorová, M.; Kučera, M.; Hurtová, I.; Voltr, O. Application of FTIR-ATR Spectrometry in Conjunction with Multivariate Regression Methods for Viscosity Prediction of Worn-Out Motor Oils. Appl. Sci. 2021, 11, 3842. [Google Scholar] [CrossRef]
- Sejkorová, M.; Šarkan, B.; Veselík, P.; Hurtová, I. FTIR Spectrometry with PLS Regression for Rapid TBN Determination of Worn Mineral Engine Oils. Energies . 2020, 13, 6438. [Google Scholar] [CrossRef]
- Macián, V.; Tormos, B.; García-Barberá, A.; Balaguer, A. Application Assessment of UV–Vis and NIR Spectroscopy for the Quantification of Fuel Dilution Problems on Used Engine Oils. Fuel 2023, 333, 126350. [Google Scholar] [CrossRef]
- Rahimi, M.; Pourramezan, M.-R.; Rohani, A. Modeling and Classifying the In-Operando Effects of Wear and Metal Contaminations of Lubricating Oil on Diesel Engine: A Machine Learning Approach. Expert Syst. Appl. 2022, 203, 117494. [Google Scholar] [CrossRef]
- Agocs, A.; Budnyk, S.; Frauscher, M.; Ronai, B.; Besser, C.; Dörr, N. Comparing Oil Condition in Diesel and Gasoline Engines. Ind. Lubr. Tribol. 2020, 72, 1033–1039. [Google Scholar] [CrossRef]
- Agocs, A.; Nagy, A.L.; Tabakov, Z.; Perger, J.; Rohde-Brandenburger, J.; Schandl, M.; Besser, C.; Dörr, N. Comprehensive Assessment of Oil Degradation Patterns in Petrol and Diesel Engines Observed in a Field Test with Passenger Cars – Conventional Oil Analysis and Fuel Dilution. Tribol. Int. 2021, 161. [Google Scholar] [CrossRef]
- The European Automobile Manufacturers’ Association (ACEA) New EU Car Sales by Power Source. Available online: https://www.acea.auto/figure/fuel-types-of-new-passenger-cars-in-eu/ (accessed on 26 September 2025).
- The European Automobile Manufacturers’ Association (ACEA) New Car Registrations: +0.8% in 2024; Battery-Electric 13.6% Market Share. Available online: https://www.acea.auto/pc-registrations/new-car-registrations-0-8-in-2024-battery-electric-13-6-market-share/ (accessed on 26 September 2025).
- The European Automobile Manufacturers’ Association (ACEA) New Car Registrations: -0.7% in July 2025 Year-to-Date; Battery-Electric 15.6% Market Share. Available online: https://www.acea.auto/pc-registrations/new-car-registrations-0-7-in-july-2025-year-to-date-battery-electric-15-6-market-share/ (accessed on 26 September 2025).
- Standard Practice For Condition Monitoring Of Used Lubricants By Trend Analysis Using Fourier Transform Infrared (FT-IR) Spectrometry 2018. ASTM; International ASTM E 2412.
- Pedregosa FABIANPEDREGOSA, F.; Michel, V.; Grisel OLIVIERGRISEL, O.; Blondel, M.; Prettenhofer, P.; Weiss, R.; Vanderplas, J.; Cournapeau, D.; Pedregosa, F.; Varoquaux, G.; et al. Scikit-Learn: Machine Learning in Python Gaël Varoquaux Bertrand Thirion Vincent Dubourg Alexandre Passos PEDREGOSA, VAROQUAUX, GRAMFORT ET AL. In Matthieu Perrot; 2011; Vol. 12. [Google Scholar]
Figure 1.
Market share of various drivetrain technologies in the EU amongst new vehicle registrations 2019 – 2025, according to the ACEA [35,36,37].
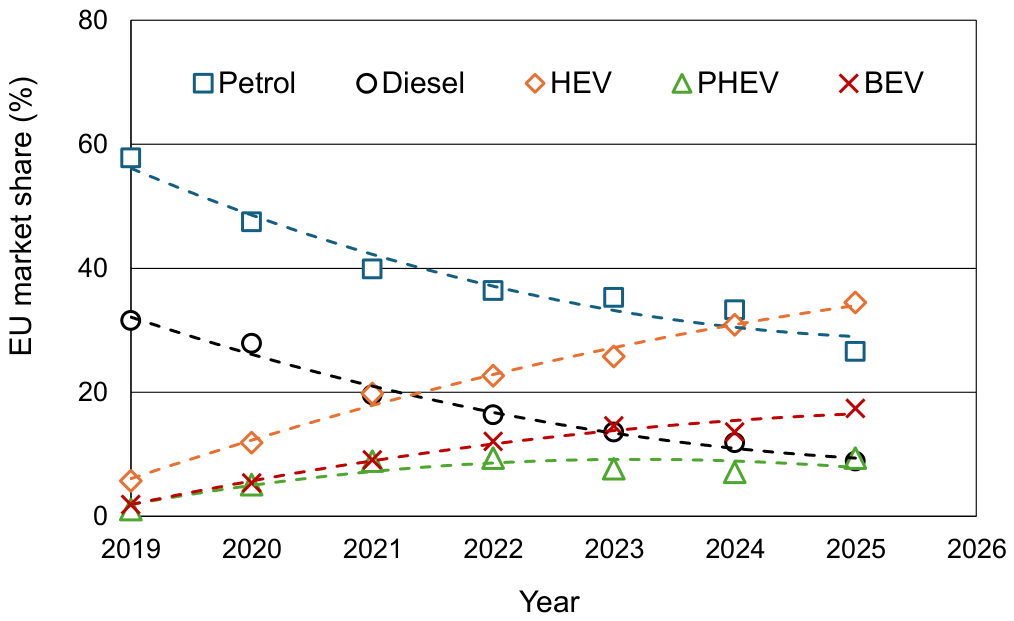
Figure 2.
Illustration of the PLS workflow.
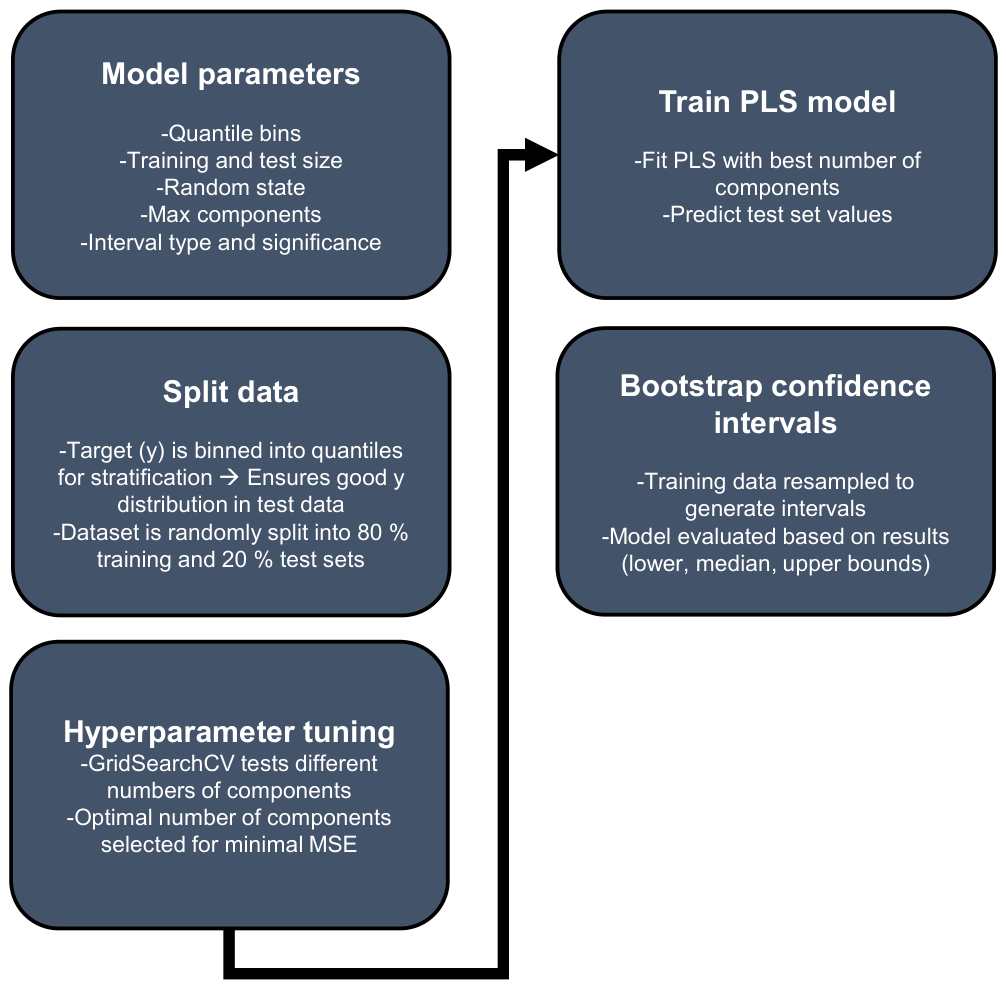
Figure 3.
Iron content of the used engine oils determined by ICP-OES. Petrol and diesel populations are shown separately.
Figure 3.
Iron content of the used engine oils determined by ICP-OES. Petrol and diesel populations are shown separately.
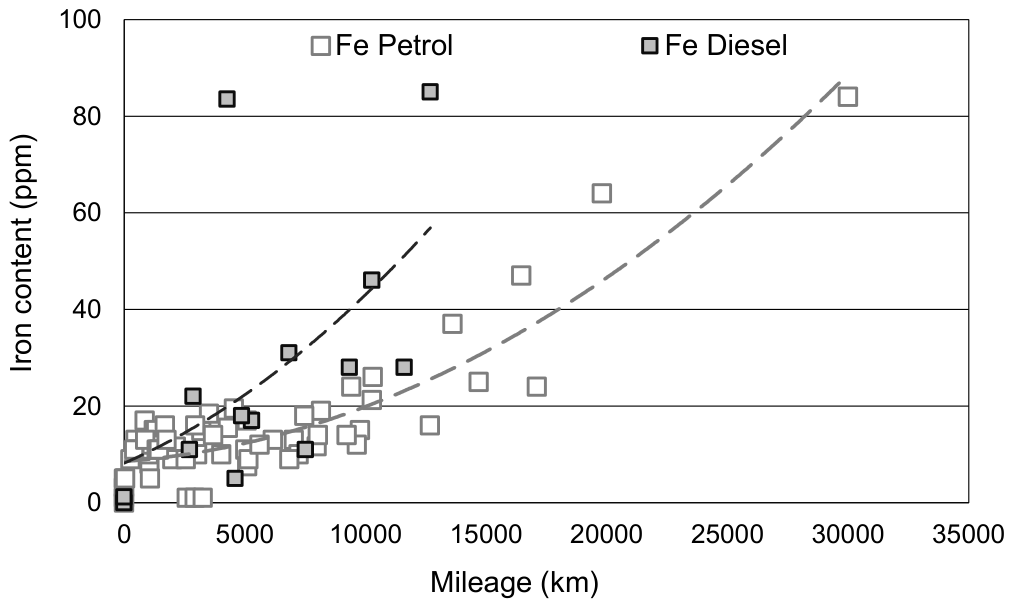
Figure 4.
(a): Hyperparameter tuning of the petrol model – RMSE as a function of number of components, (b): Explained X and y variance ratios by the components of the final petrol model.
Figure 4.
(a): Hyperparameter tuning of the petrol model – RMSE as a function of number of components, (b): Explained X and y variance ratios by the components of the final petrol model.
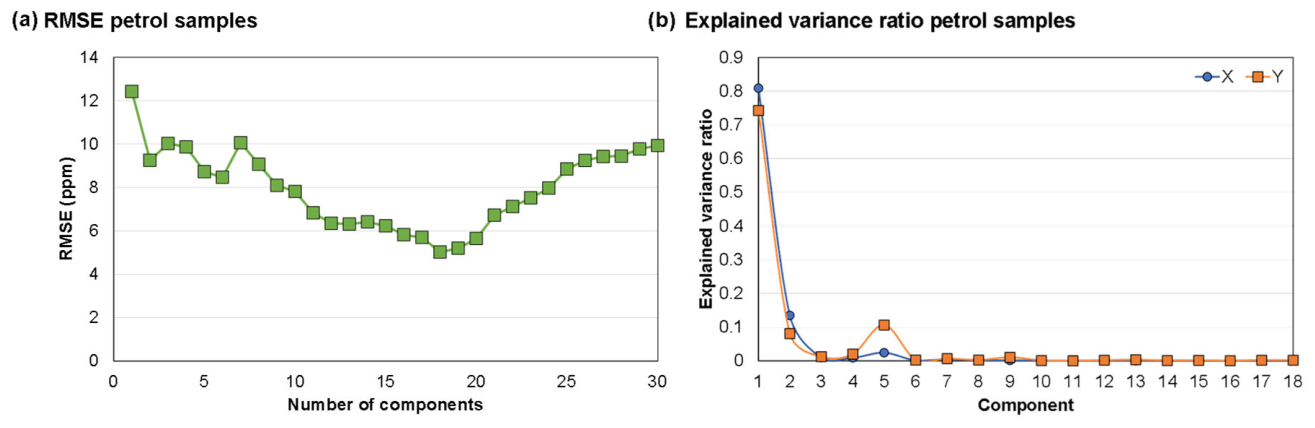
Figure 5.
Actual vs. median predicted Fe values of the petrol model. Error bars indicate 90% confidence intervals based on 1000 bootstrap iterations.
Figure 5.
Actual vs. median predicted Fe values of the petrol model. Error bars indicate 90% confidence intervals based on 1000 bootstrap iterations.
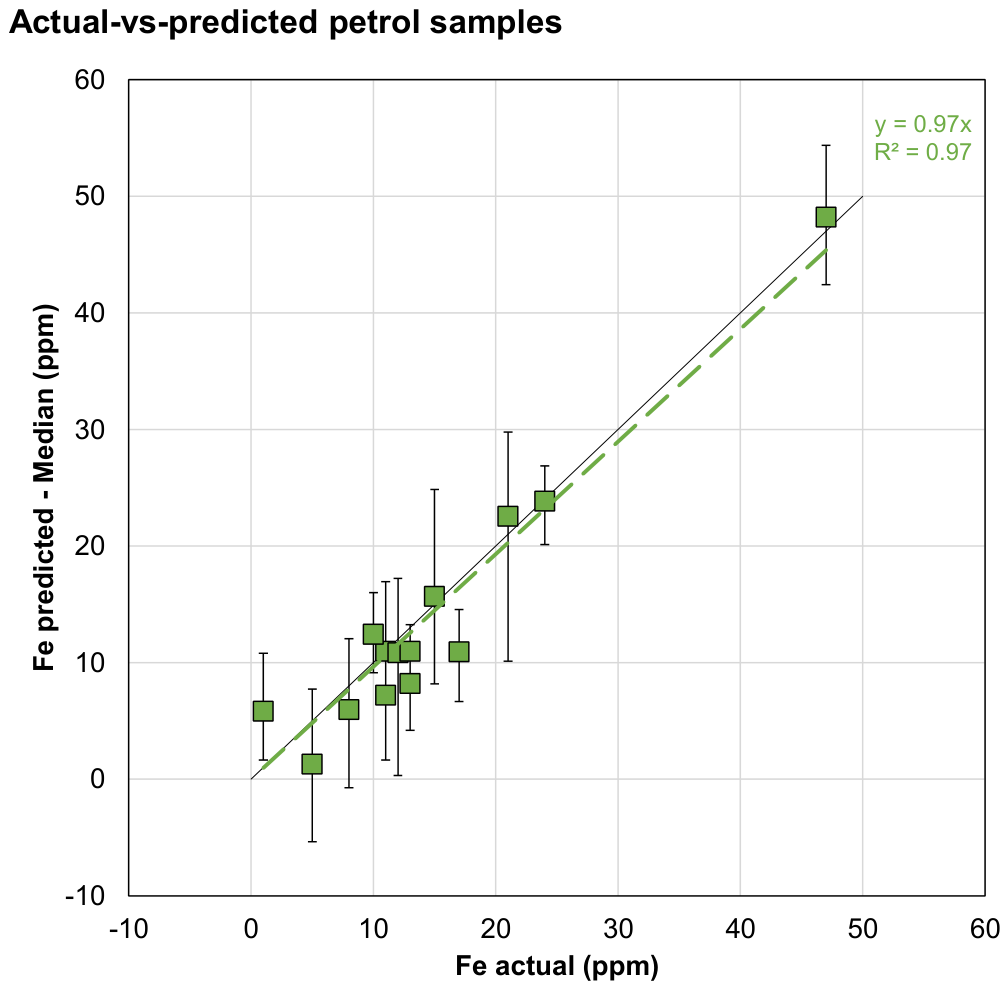
Figure 6.
X loadings of the petrol model (The x-axis is displayed on a base 2 logarithmic scale). Relevant spectral regions highlighted based on Table 2.
Figure 6.
X loadings of the petrol model (The x-axis is displayed on a base 2 logarithmic scale). Relevant spectral regions highlighted based on Table 2.
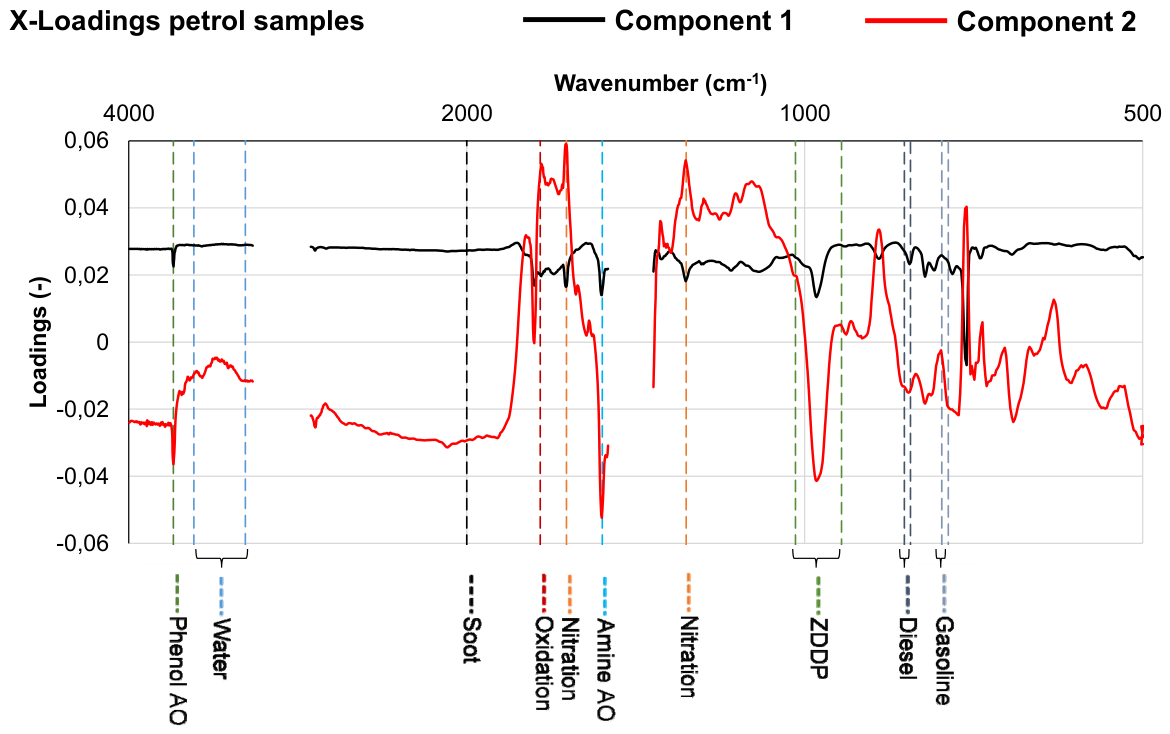
Figure 7.
(a): Hyperparameter tuning of the mixed model – RMSE as a function of number of components, (b): Explained X and y variance ratios by the components of the final mixed model.
Figure 7.
(a): Hyperparameter tuning of the mixed model – RMSE as a function of number of components, (b): Explained X and y variance ratios by the components of the final mixed model.
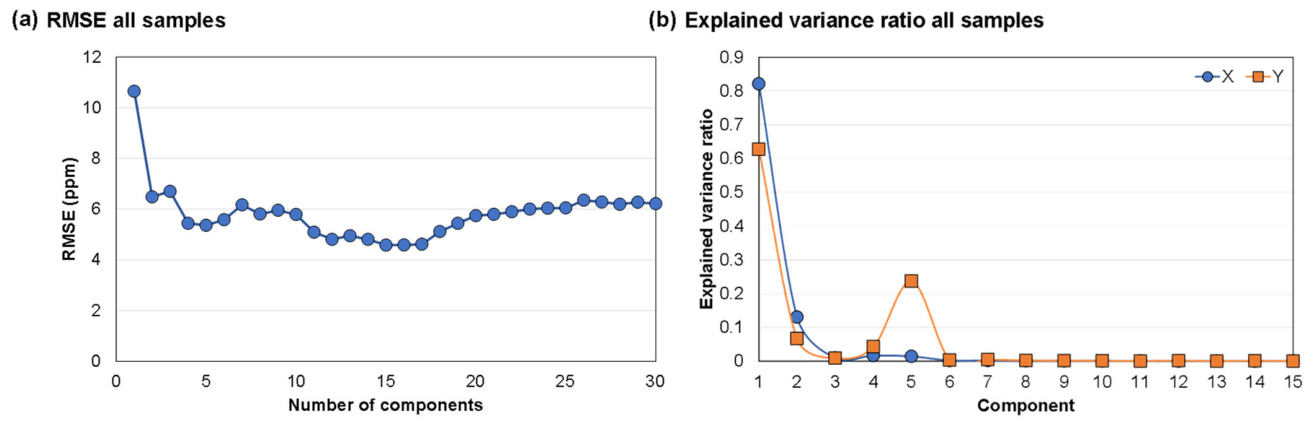
Figure 8.
Actual vs. median predicted Fe values of the mixed model. Error bars indicate 90% confidence intervals based on 1000 bootstrap iterations.
Figure 8.
Actual vs. median predicted Fe values of the mixed model. Error bars indicate 90% confidence intervals based on 1000 bootstrap iterations.
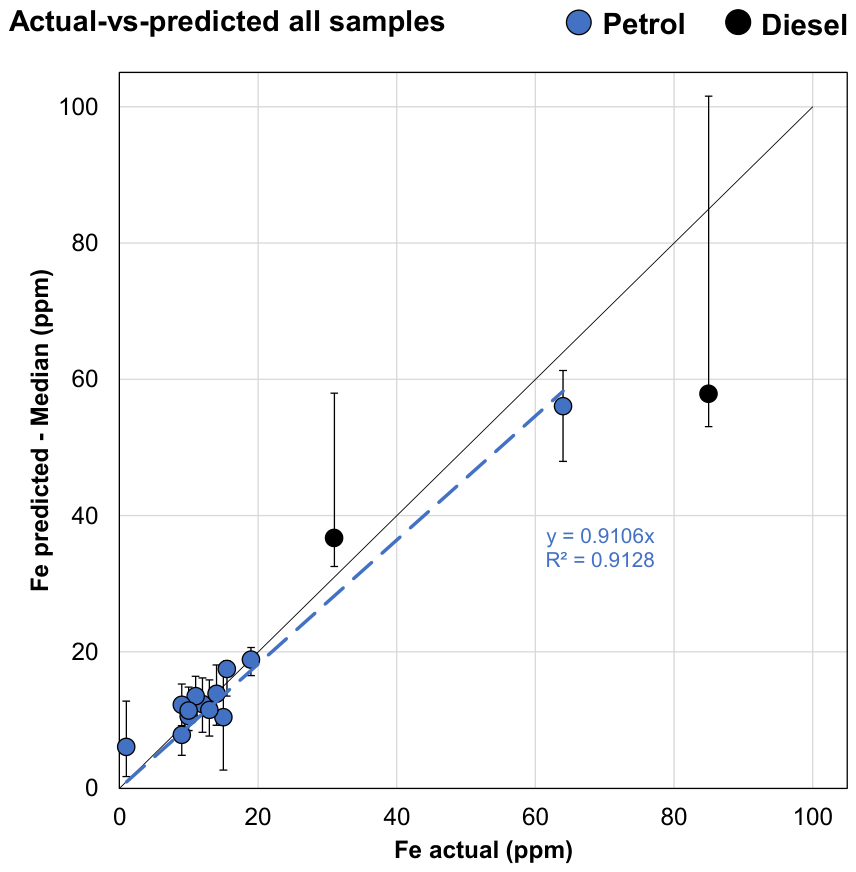
Figure 9.
X loadings of the mixed model (The x-axis is displayed on a base 2 logarithmic scale). Relevant spectral regions highlighted based on Table 2.
Figure 9.
X loadings of the mixed model (The x-axis is displayed on a base 2 logarithmic scale). Relevant spectral regions highlighted based on Table 2.
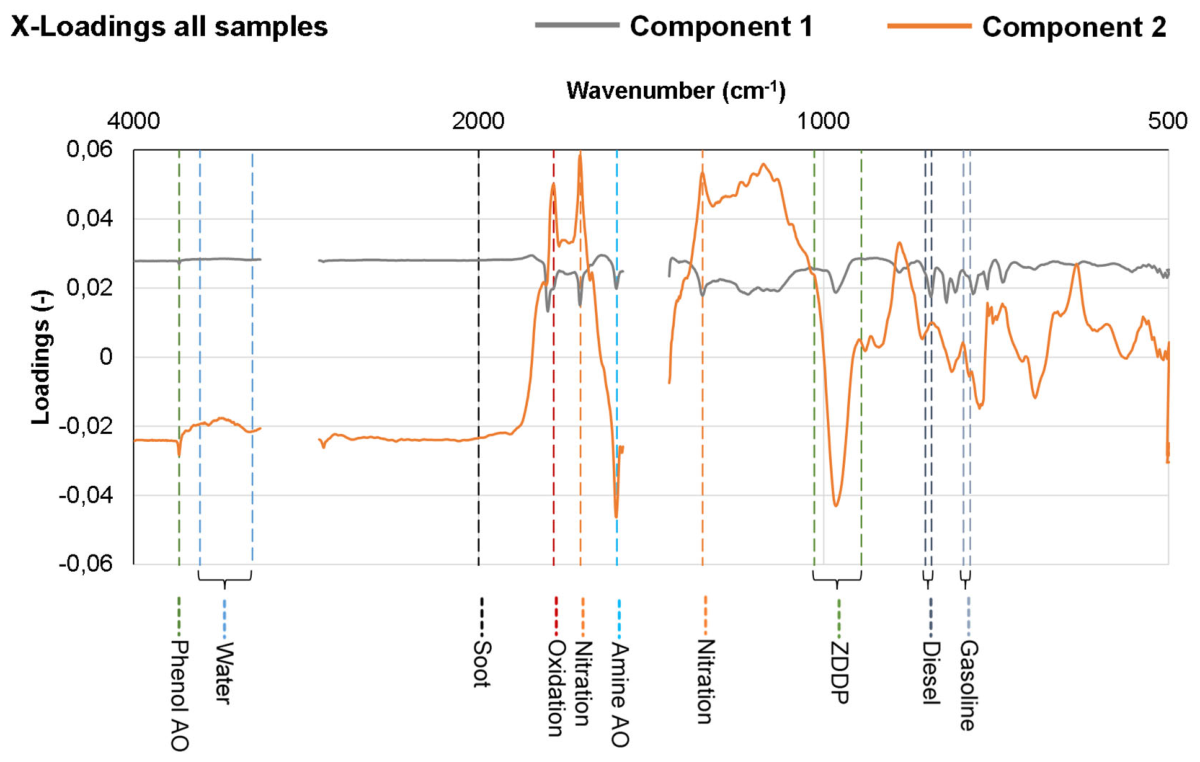
Figure 10.
Further X loadings of the mixed model (The x-axis is displayed on a base 2 logarithmic scale). Relevant spectral regions highlighted based on Table 2.
Figure 10.
Further X loadings of the mixed model (The x-axis is displayed on a base 2 logarithmic scale). Relevant spectral regions highlighted based on Table 2.
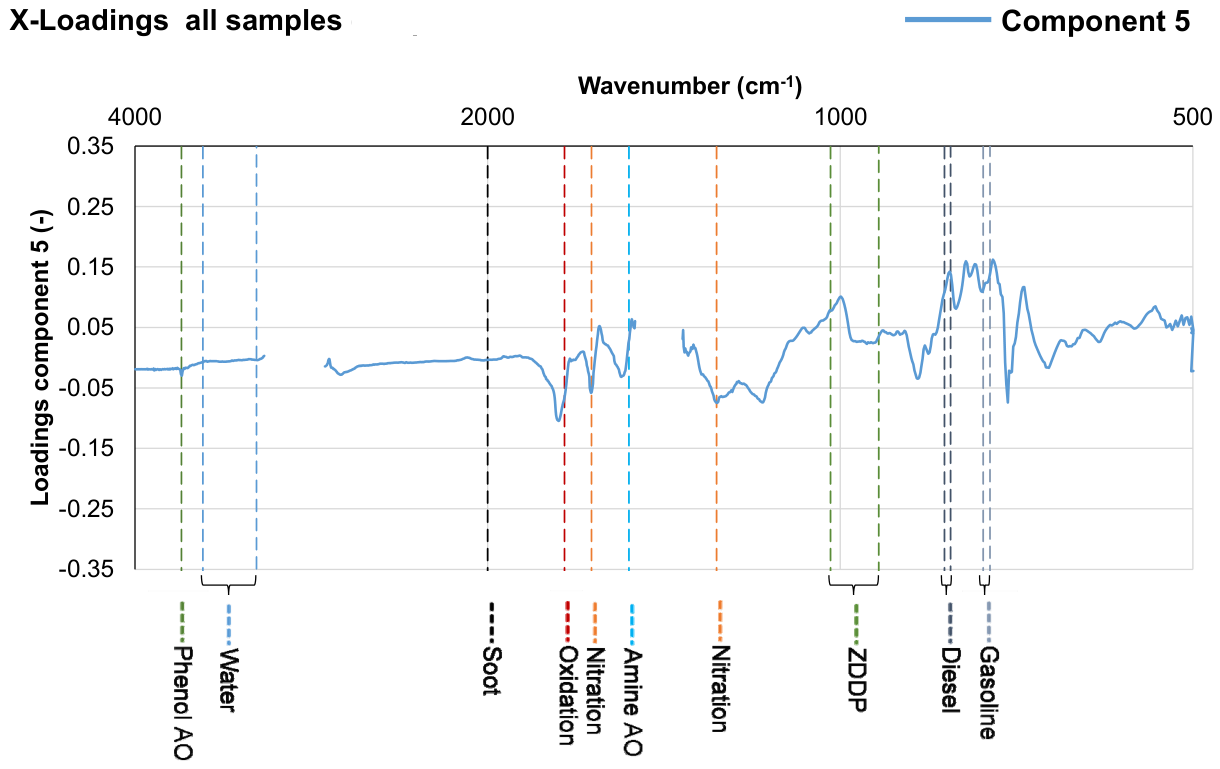

Table 1.
Parameters of utilized vehicles and engine oils for field testing under real driving conditions.
Table 1.
Parameters of utilized vehicles and engine oils for field testing under real driving conditions.
| Designation | Engine power (kW) | SAE viscosity class | Engine type | Total oil mileage (km) |
| D1 | 130 | 0W-30 | diesel | 12692 |
| D2 | 140 | 0W-30 | diesel | 7519 |
| D3 | 140 | 0W-30 | diesel | 9343 |
| D4 | 84.5 | 5W-30 | diesel | 4296 |
| P1 | 51 | 5W-40 | petrol | 4556 |
| P2 | 95 | 5W-30 | petrol | 30000 |
| P3 | 221 | 0W-30 | petrol | 8036 |
| P4 | 185 | 0W-30 | petrol | 14694 |
| P5 | 185 | 0W-30 | petrol | 17107 |
| P6 | 185 | 0W-30 | petrol | 6852 |
| P7 | 221 | 0W-30 | petrol | 5094 |
| P8 | 221 | 0W-30 | petrol | 2552 |
| P9 | 155 | 0W-30 | petrol | 1689 |
| P10 | 155 | 0W-30 | petrol | 1149 |
| P11 | 155 | 0W-30 | petrol | 1760 |
| P12 | 88 | 5W-30 | petrol | 19800 |
Table 2.
Lubricant specific FT-IR evaluation ranges.
| Chemical species | Evaluation details | Source |
| Phenol AOs (depletion) | Peak height at 3650 cm-1 over global baseline | In-house method [1] |
| Amine AOs (depletion) | Peak height at 1515 cm-1 over local baseline | In-house method [1] |
| ZDDP antiwear (depletion) | Highest peak between 927-1019 cm-1 over local baseline |
In-house method [1] |
| Oxidation products (accumulation) | Peak height at 1710 cm-1 over global baseline | In-house method [1] |
| Nitration products (accumulation) | Peak height at 1630 cm-1 over local baseline | DIN 51453 [8] |
| Soot (accumulation) | Baseline shift at 2000 cm-1 | ASTM E2412 [38] |
| Water (accumulation) | Area 3150-3500 cm-1 | ASTM E2412 [38] |
| Diesel contamination (accumulation) | Area 805-815 cm-1 | ASTM E2412 [38] |
| Petrol contamination (accumulation) | Area 745-755 cm-1 | ASTM E2412 [38] |
Disclaimer/Publisher’s Note: The statements, opinions and data contained in all publications are solely those of the individual author(s) and contributor(s) and not of MDPI and/or the editor(s). MDPI and/or the editor(s) disclaim responsibility for any injury to people or property resulting from any ideas, methods, instructions or products referred to in the content. |
© 2026 by the authors. Licensee MDPI, Basel, Switzerland. This article is an open access article distributed under the terms and conditions of the Creative Commons Attribution (CC BY) license (http://creativecommons.org/licenses/by/4.0/).
Copyright: This open access article is published under a Creative Commons CC BY 4.0 license, which permit the free download, distribution, and reuse, provided that the author and preprint are cited in any reuse.


