

Submitted:
25 June 2026
Posted:
26 June 2026
You are already at the latest version
Abstract
Salinity is a major constraint to crop productivity. Beneficial plant–fungus interactions represent a promising strategy to enhance stress resilience. Here, we investigated fungal endophytes isolated from Oryza sativa cultivated in saline-prone marshlands of the Guadalquivir River, Spain. From a collection of 38 isolates, five salt-tolerant strains exhibiting plant growth-promoting activity were identified, including a previously uncharacterized Reticulascus sp. strain S5. Co-cultivation assays with Arabidopsis thaliana demonstrated that S5 increased root and shoot biomass under salt stress. To elucidate the underlying mechanisms, a comprehensive RNA-seq analysis of roots and shoots under control and saline conditions was performed. Fungal colonization induced pronounced transcriptomic changes, particularly in shoots, including the rewiring of auxin- and abscisic acid-related pathways and the induction of genes associated with cell wall remodelling. Concurrently, defence-related processes, including glucosinolate biosynthesis and ethylene signalling, were broadly repressed, suggesting attenuated stress perception in colonized plants. In roots, S5 infection suppressed genes involved in root hair development and cell wall organization, indicating a fungus-driven reconfiguration of root development. Comparative analysis with the growth-promoting Fusarium sp. K-23 revealed distinct root-associated mechanisms but convergence on a shared regulatory module in shoots involving ABA-responsive transcription factors and osmotic stress regulators. Collectively, our findings demonstrate that Reticulascus sp. S5 enhances plant salt stress tolerance through coordinated transcriptional reprogramming of growth, hormone signalling, and stress responses, highlighting the potential of habitat-adapted endophytes for sustainable crop improvement.
Keywords:
co-evolution
; symbiosis
; growth promotion
; plant-fungus interaction
; plant performance
; salt stress resilience
; holobiont
1. Introduction
Soil salinization constitutes a significant environmental challenge that restricts agricultural productivity on a global scale. Current estimates indicate that salinity affects over 20% of irrigated land, a proportion anticipated to rise due to climate change, sea-level rise, and unsustainable irrigation practices [1,2]. Salinity stress imposes osmotic and ionic pressures on plants, resulting in decreased water uptake, ion toxicity, and disruption of cellular homeostasis. These effects compromise essential physiological functions, such as photosynthesis, nutrient acquisition, and growth, ultimately leading to reduced biomass accumulation and yield [3]. At the cellular level, excessive sodium (Na⁺) and chloride (Cl⁻) ions disrupt enzymatic activities and compromise membrane integrity, while osmotic stress induces stomatal closure, thereby limiting carbon assimilation [4]. Furthermore, salinity triggers the overproduction of reactive oxygen species (ROS), which cause oxidative damage unless effectively neutralized by antioxidant systems [5]. Although plants have evolved complex adaptive mechanisms to deal with salinity stress, the triggered responses are often inadequate or insufficient to cope with prolonged or severe stress conditions [6,7]. Therefore, enhancing plant resilience to salinity remains a critical goal for sustainable agriculture.
In recent years, there has been a growing focus on the role of plant-associated microorganisms in mitigating abiotic stress. Fungal endophytes, which are fungi that colonize plant tissues without inducing disease, have been identified as significant contributors to plant fitness under challenging environmental conditions [8]. These beneficial plant–fungus interactions can enhance nutrient acquisition, improve water use efficiency, and modulate plant stress responses, thereby facilitating growth and survival under stress [9]. Moreover, the fungal root-colonizing endosymbiont Serendipita indica has recently been reported to mitigate salt stress by evacuating salt from the root [10,11]. The concept of habitat-adapted symbiosis has gained prominence, suggesting that plants in extreme environments host microbial partners that impart stress tolerance traits [12]. Studies have shown that fungal endophytes isolated from plants inhabiting saline, arid, or otherwise challenging habitats can transfer stress tolerance to non-native host plants, suggesting a conserved and transferable mechanism of action [13]. These findings highlight the importance of the plant holobiont, which describes the integrated system of plant and associated microbiota, in shaping plant performance under environmental stress [14].
The advantageous effects of fungal endophytes are frequently facilitated through significant reprogramming of plant physiological and molecular processes, particularly those associated with hormone metabolism and signalling. Plant hormones, such as auxins, abscisic acid (ABA), ethylene, and jasmonates, are pivotal in regulating growth, development, and stress responses [15]. Fungal symbionts can affect these hormonal pathways by either producing phytohormones themselves or modulating the host's biosynthesis and signalling networks [16]. For example, increased auxin production has been correlated with enhanced root architecture and biomass accumulation, while ABA-related pathways are essential for mediating responses to osmotic stress and water deficit [17]. In contrast, beneficial symbioses are often linked to the suppression of defence-related hormone pathways, such as those involving ethylene and jasmonic acid, indicating a trade-off between growth and defence that promotes symbiotic compatibility [18]. This hormone-mediated reprogramming enables plants to optimize resource allocation and adapt more effectively to environmental challenges.
In parallel with hormonal regulation, plant responses to salinity stress are governed by intricate gene regulatory networks that involve transcription factors, signalling kinases, and downstream effectors. Key regulatory components include the salt overly sensitive (SOS) pathway, which maintains ion homeostasis through the extrusion of Na⁺, and tonoplast Na⁺/H⁺ exchangers that sequester toxic ions into vacuoles [6]. Furthermore, transcription factor families such as bZIP, NAC, DREB, MYB, and bHLH are crucial in orchestrating stress-responsive gene expression [19]. ABA-dependent signalling pathways are particularly significant, as they integrate environmental cues with transcriptional responses to regulate stomatal closure, osmolyte accumulation, and stress-responsive gene expression [20]. Emerging evidence indicates that beneficial fungi can modulate these regulatory networks by either activating stress-responsive pathways or attenuating stress perception, thereby enhancing plant tolerance [21]. Recent studies have identified core regulatory modules involving ABA-responsive transcription factors and osmotic stress-related genes that are commonly induced in fungus-associated plants under salinity or osmotic stress [22,23]. These shared molecular signatures suggest that distinct symbiotic partners may converge on similar regulatory frameworks to achieve enhanced stress resilience.
Despite significant advancements, the mechanisms by which fungi enhance salinity tolerance remain inadequately understood, particularly in terms of the integration of hormonal signalling and transcriptional regulation. Furthermore, while numerous studies have focused on well-characterized fungal genera, the functional potential of less-studied taxa remains largely unexplored. In this context, identifying and characterizing novel endophytic fungi from stress-adapted environments presents valuable opportunities to uncover new mechanisms of plant stress tolerance.
In the present study, we isolated and characterized root-associated fungal endophytes from Oryza sativa cv. Puntal cultivated in the marshes of the Guadalquivir River in southern Spain. We identified a previously uncharacterized strain, Reticulascus sp. S5, which significantly enhances plant growth and salinity tolerance. Utilizing Arabidopsis thaliana as a model system, we combined phenotypic analyses with comprehensive transcriptomic profiling to elucidate the molecular basis of this beneficial interaction. Additionally, we compared the responses induced by Reticulascus sp. S5 with those elicited by a previously described growth-promoting Fusarium strain to explore potential convergence and divergence in symbiotic mechanisms. Our findings provide new insights into how habitat-adapted fungal endosymbionts modulate plant hormone pathways and stress regulatory networks to enhance plant performance under salinity stress, thereby contributing to a deeper understanding of plant–microbe interactions and their potential applications in sustainable agriculture.
2. Results
2.1. Fungi Collection
Initially, root endophytes from Oryza sativa cv. Puntal, harvested in the marshes of the Guadalquivir River, were isolated. Following multiple transfers to fresh PDA plates, a collection of 38 isolates was established. These isolates were subsequently cultivated axenically on PDA medium with progressively increasing concentrations of NaCl in the range between 200 mM and 1 M. Among the isolates tested, more than 10 demonstrated significant tolerance to NaCl and were therefore retained in the collection. To evaluate the plant growth-promoting effects of these isolates under salt stress conditions, they were co-cultivated with Arabidopsis thaliana plants in vitro under control conditions and two distinct salt stress conditions (50 mM and 75 mM NaCl). Among the isolates tested, five demonstrated a significant plant growth-promoting effect. Motivated by the beneficial effects on plant growth and stress tolerance observed under salt stress conditions, genomic DNA was extracted, and their ITS regions were amplified using PCR. The resulting DNA fragments underwent Sanger sequencing. The sequences obtained were subsequently compared with the 3.8 million publicly available ITS sequences in the UNITE Fungal ITS Database [24] and the approximately 20,000 entries in the fungal ITS RNA RefSeq Targeted Loci (RTL) project database available at NCBI. A phylogenetic analysis was then conducted, revealing that from the five isolates one belongs to the phylum Basidiomycota (Schyzophyllum) and four to the phylum Ascomycota (Cladosporium, Aureobasidium, Reticulascus). In summary, our collection comprised one Cladosporium sp., two Aureobasidium spp., one Schizophyllum sp., and one Reticulascus sp. strain (Figure 1).
The isolate, which is classified within the order Glomerellales [25], has garnered our specific interest. Numerous members of this order, such as various Colletotrichium strains including Colletotrichium acutatum and Colletotrichium graminicola, are well-documented plant pathogens known to cause substantial economic losses in agriculture [26,27]. Conversely, Colletotrichium tofieldiae has been identified as a highly effective fungal endophyte that considerably promotes growth of its host plants [28]. The Reticulascaceae family, however, remains relatively understudied [29]. Members of this family are characterized by a saprophytic lifestyle, inhabiting dead wood and bark in both terrestrial and freshwater environments. Our isolate, Reticulascus sp. strain S5, belongs to the genus Reticulascus, which represents the sexual phase (teleomorph) of the fungus whose asexual phase (anamorph) is classified within Cylindrotrichum, which also appears in the phylogenetic tree presented in Figure 1. The strain most closely related to our S5 isolate is Reticulascus parahennebertii. This strain has been recently identified as a saprophyte of the dead culm of Juncus inflexus [30].
To date, no Reticulascus strain has been identified as a plant growth-promoting root-colonizing fungal endophyte capable of enhancing salinity stress tolerance in plants. Consequently, Reticulascus sp. strain S5 was selected from our collection for further investigation.
2.2. Plant Growth Promoting Effect of Reticulascus sp. Strain S5
To examine the impact of S5 on its host plant, wild-type A. thaliana plants were co-cultivated with the fungus and compared to mock-infected control plants, both in the presence and absence of salt in the growth medium. As depicted in Figure 2, fungal infection led to a significant increase in plant biomass of root and shoot tissues under salt stress conditions. Conversely, in the absence of salt stress, the fungus-infection did not result in any significant difference in biomass production, although the root system, particularly the length of the lateral roots, appeared to be enhanced.
A closer inspection of the root system architecture under salt stress provided evidence for 15.7% longer primary roots (p = 0.001) compared to mock-infected control plants. In contrast, lateral root density appeared to be reduced by 18.5% (p = 0.028) when compared to salt-treated control plants. The obtained results suggest a fungus-mediated reprogramming of the plant growth program under salt stress conditions, resulting in increased overall biomass and an altered root system architecture.
2.3. Global Transcriptomic Reprogramming of Arabidopsis Plants by Reticulascus sp. Strain S5
To obtain a comprehensive understanding of the transcriptomic responses to fungal exposure under both control and salt stress conditions, a full factorial mRNA sequencing (RNA-seq) experiment was conducted. This experiment encompassed four distinct conditions: Control (mock-infected, no salt stress), NaCl (mock-infected, salt stress), S5 (fungus-infected, no salt stress), and NaCl+S5 (fungus-infected, salt stress). For each condition, three independent biological replicates were analysed. Root and shoot tissues were examined separately (Supplementary Table S1). Principal Component Analysis (PCA) demonstrated a clear differentiation among the tested groups for both root and shoot samples. The first two principal components (PCs) accounted for 67.9% and 55.6% of the variance in the root and shoot samples, respectively. Notably, in both tissues, PC1 was closely associated with salinity stress, whereas PC2 appeared to be linked to the infection condition (Figure 3A). The individual replicates demonstrated effective clustering within each experimental condition and tissue type, thereby distinguishing the various sample groups into distinct transcriptional profiles. This observation indicated a high level of experimental reproducibility. Analysis of the general expression profiles across various conditions revealed an unexpectedly stronger response to the fungus (S5 versus Ctrl) in shoots compared to roots (Figure 3B). In contrast, the responses to salt (NaCl versus Ctrl) aligned with previously published data and did not present any unexpected findings [10,22]. Interestingly, the number of differentially expressed genes (DEGs) in response to S5 infection was consistently lower under salt conditions (NaCl+S5 versus NaCl) compared to S5-infected plants grown without salt (S5 versus Ctrl). A detailed analysis contrasting the DEGs in the two groups revealed minimal overlap, with no more than 13 and 241 genes in roots and shoots, respectively (Supplementary Figure S1). However, the 241 DEGs in the intersection between S5 versus Ctrl and NaCl+S5 versus NaCl in shoots showed enrichment in Kyoto Encyclopaedia of Genes and Genomes (KEGG) pathways related to glucosinolate biosynthesis (Path:ath00966) and 2-oxocarboxylic acid metabolism (Path:ath01210), suggesting alterations of biotic stress responses. Furthermore, a subsequent gene ontology (GO) enrichment analysis highlighted terms related to response to abiotic stimulus (GO: 0009628), response to stress (GO: 0006950), and glucosinolate biosynthetic processes (GO: 0019761), which also points towards an alteration of biotic stress responses.
To gain a comprehensive understanding of the relationships among the DEGs, Venn diagram analyses were performed to assess both induced and repressed genes in root and shoot samples separately (Figure 3C). This analysis specifically targeted distinct gene groups responding to fungal infection in the absence (S5 versus Ctrl) and presence of salt stress (NaCl+S5 versus Ctrl), as well as DEGs located at the intersections of these two groups. The identified gene groups were subsequently subjected to KEGG pathway and GO term enrichment analysis. The full GO term and KEGG pathway enrichment analysis is included in Supplementary Table S2. Although the 21 and 408 genes induced in the roots under the test conditions, along with the 24 genes at the intersections, did not exhibit significant enrichment in KEGG pathways or GO terms, the analysis of the repressed DEGs revealed several notable biological processes influenced by the fungus. As illustrated in Figure 4A, the GO analysis of the 230 repressed DEGs in S5-infected plants without salt stress (S5 versus Ctrl) highlighted the repression of genes categorized under GO term classifications related to cell wall organization (GO:0022622), root development (GO:0048364), and root hair initiation and development, including terms such as trichoblast differentiation (GO:0010054), trichoblast maturation (GO:0048764), and root hair cell differentiation (GO:0048765). Notably, it revealed the repression of the root hair initiation and development master regulator genes RHD6 and RSL4. Conversely, the 85 genes at the intersection between S5 versus Ctrl and NaCl+S5 versus Ctrl exhibited enrichment in cell wall organization-related terms (GO:0071555), including a pronounced repression of cellulose biosynthesis-related genes (GO:0030244), such as CSLB2, CSLB3, CSLB5, and CSLB6. Meanwhile, the 479 repressed genes in the NaCl+S5 versus Ctrl comparison highlighted an enrichment of defence and stress-related terms, such as glucosinolate biosynthetic processes (GO:0019761) and cellular response to abiotic stimulus (GO:0071214).
This suggests that the fungus appears to reduce root hair growth under control conditions, while secondary cell wall biosynthesis and plant stress responses seem to be diminished by the fungus under salinity conditions. The analysis of gene groups induced in the shoots (Figure 4B) revealed significant insights into the impact of the fungus on shoot development. Among the 257 genes that were up-regulated under control conditions when comparing S5-infected plants with mock-infected plants, there was a notable enrichment of auxin-related GO terms. These included classifications such as regulation of hormone levels (GO:0010817), auxin-activated signaling pathway (GO:0009734), and response to auxin (GO:0009733). Prominent genes within this group comprised auxin biosynthesis genes YUC2, YUC5, and YUC8, alongside several Aux/IAA genes and small auxin upregulated RNA genes, including IAA1, IAA2, IAA5, IAA6, IAA19, IAA32, SAUR19, SAUR22, SAUR23, SAUR26, and SAUR28. The findings strongly suggest an increase in auxin content within the shoots of fungus-infected plants. Visual inspection indicated that the leaf sizes of infected plants under control conditions were slightly larger. However, measurements of both fresh and dry weight did not reveal significant differences. In the analysis of GO terms enriched at the intersection of the control versus salt stress comparison, additional genes associated with hormone response terms were identified. These included response to auxin (GO:0009733), response to hormone (GO:0009725), and cellular response to hormone stimulus (GO:0032870). These categories contained further auxin-related genes such as YUC9, the GRETCHEN HAGEN 3 (GH3) acyl acid amido synthetase genes WES1|GH3.5 and DFL1|GH3.6, which are involved in auxin conjugation, as well as the auxin exporter gene PIN3. Notably, the analysis also revealed the induction of genes associated with other stress-related hormonal responses, including those involved in ABA biosynthesis, signaling, and response, such as NCED3, AFP1, AFP3, HAI1, LTI65|RD29B, and EEL|bZIP12, which are linked to general abiotic stress and water deprivation stress responses. Additionally, several jasmonic acid-linked genes, including JAZ3, JAZ7, BT2, and BT4, were identified. The analysis of the 415 genes uniquely induced in the NaCl+S5 versus Ctrl comparison revealed a significant enrichment of GO terms related to cell wall biogenesis and organization. Notably, these terms include the classifications cell wall organization or biogenesis (GO:0071554) and cell wall macromolecule metabolic process (GO:0044036). A substantial number of XYLOGLUCAN ENDO-TRANSGLYCOSYLASE/HYDROLASE (XTH) genes, such as XTH11, XTH15, XTH16, and XTH18, were identified. These genes play a crucial role in loosening the rigid cellulose-xyloglucan network, thereby facilitating the remodeling of the primary cell wall through their enzymatic activity in hemicellulose and xyloglucan metabolic processes.
Similar to the case of repressed genes in the roots, the analysis of identified repressed genes in the shoots strongly indicates a reduction in plant defence and stress responses (Figure 4C). The 266 genes repressed in the S5 versus Ctrl comparison demonstrate the downregulation of defence compound production, such as glucosinolates, as evidenced by the significant enrichment of genes in the GO terms glucosinolate biosynthetic process (GO:0019761) and phenylpropanoid biosynthetic process (GO:0009699). A similar pattern, with a more pronounced abiotic stress component induced by additional salt stress, is observed in the 257 genes within the overlapping segments. The GO classification of the 415 genes exclusively repressed in the NaCl+S5 versus Ctrl condition further substantiates the systematic repression of plant defence responses. Notably, genes such as SUR1, SUR2|CYP83B1, and WRKY70, encompassed in the GO term indole-containing compound biosynthetic process (GO:0042435), are significantly underrepresented. Conversely, this group also shows underrepresentation of ethylene-related biological processes, including cellular response to ethylene stimulus (GO:0071369), response to ethylene (GO:0009723), and ethylene-activated signalling pathway (GO:0009873). Ethylene is recognized as a central hub in environmental and metabolic stress responses, coordinating defence mechanisms and dynamically balancing plant growth to facilitate adaptation to adverse environmental conditions [31]. Hence, it must be concluded that these adaptation processes are not triggered at the same level in fungus infected plants, possibly because of a lower experienced abiotic stress level.
2.4. Comparison of the Transcriptional Responses of Arabidopsis to the Infection with Reticulascus sp. Strain S5 or Fusarium sp. Strain K-23
In a prior study [22], we characterized a Fusarium strain isolated from the Himalayas near Kargil in the Jammu and Kashmïr region. Analogous to the Reticulascus sp. S5 strain discussed in this study, the K-23 strain improved the salt stress tolerance of its host plants and augmented their biomass production, especially in the shoots, under saline conditions. However, unlike S5, which suppressed genes related to root hair initiation and development, K-23 was observed to promote root hair growth even under salt stress. This sustained root hair growth was demonstrated to be crucial for the plant growth-promoting effect observed under salinity stress. This seemingly contradictory mechanism led us to compare the molecular modules influenced by the two strains in their host plants to better understand how habitat-driven co-evolution can result in similar phenotypes, albeit potentially through different molecular pathways. As illustrated in Figure 5, the comparison of differentially expressed genes (DEGs) in S5 versus control and K-23 versus control (GEO dataset GSE260960) revealed that 35.2% of the 361 DEGs in S5-infected plants were shared with genes responsive to K-23 infection. However, the 120 genes that represent the majority of the shared DEGs were found in the intersection of the genes repressed by S5 but induced by K-23. A detailed examination (Figure 5B) revealed that these genes were associated with root developmental processes and root hair growth-related GO terms.
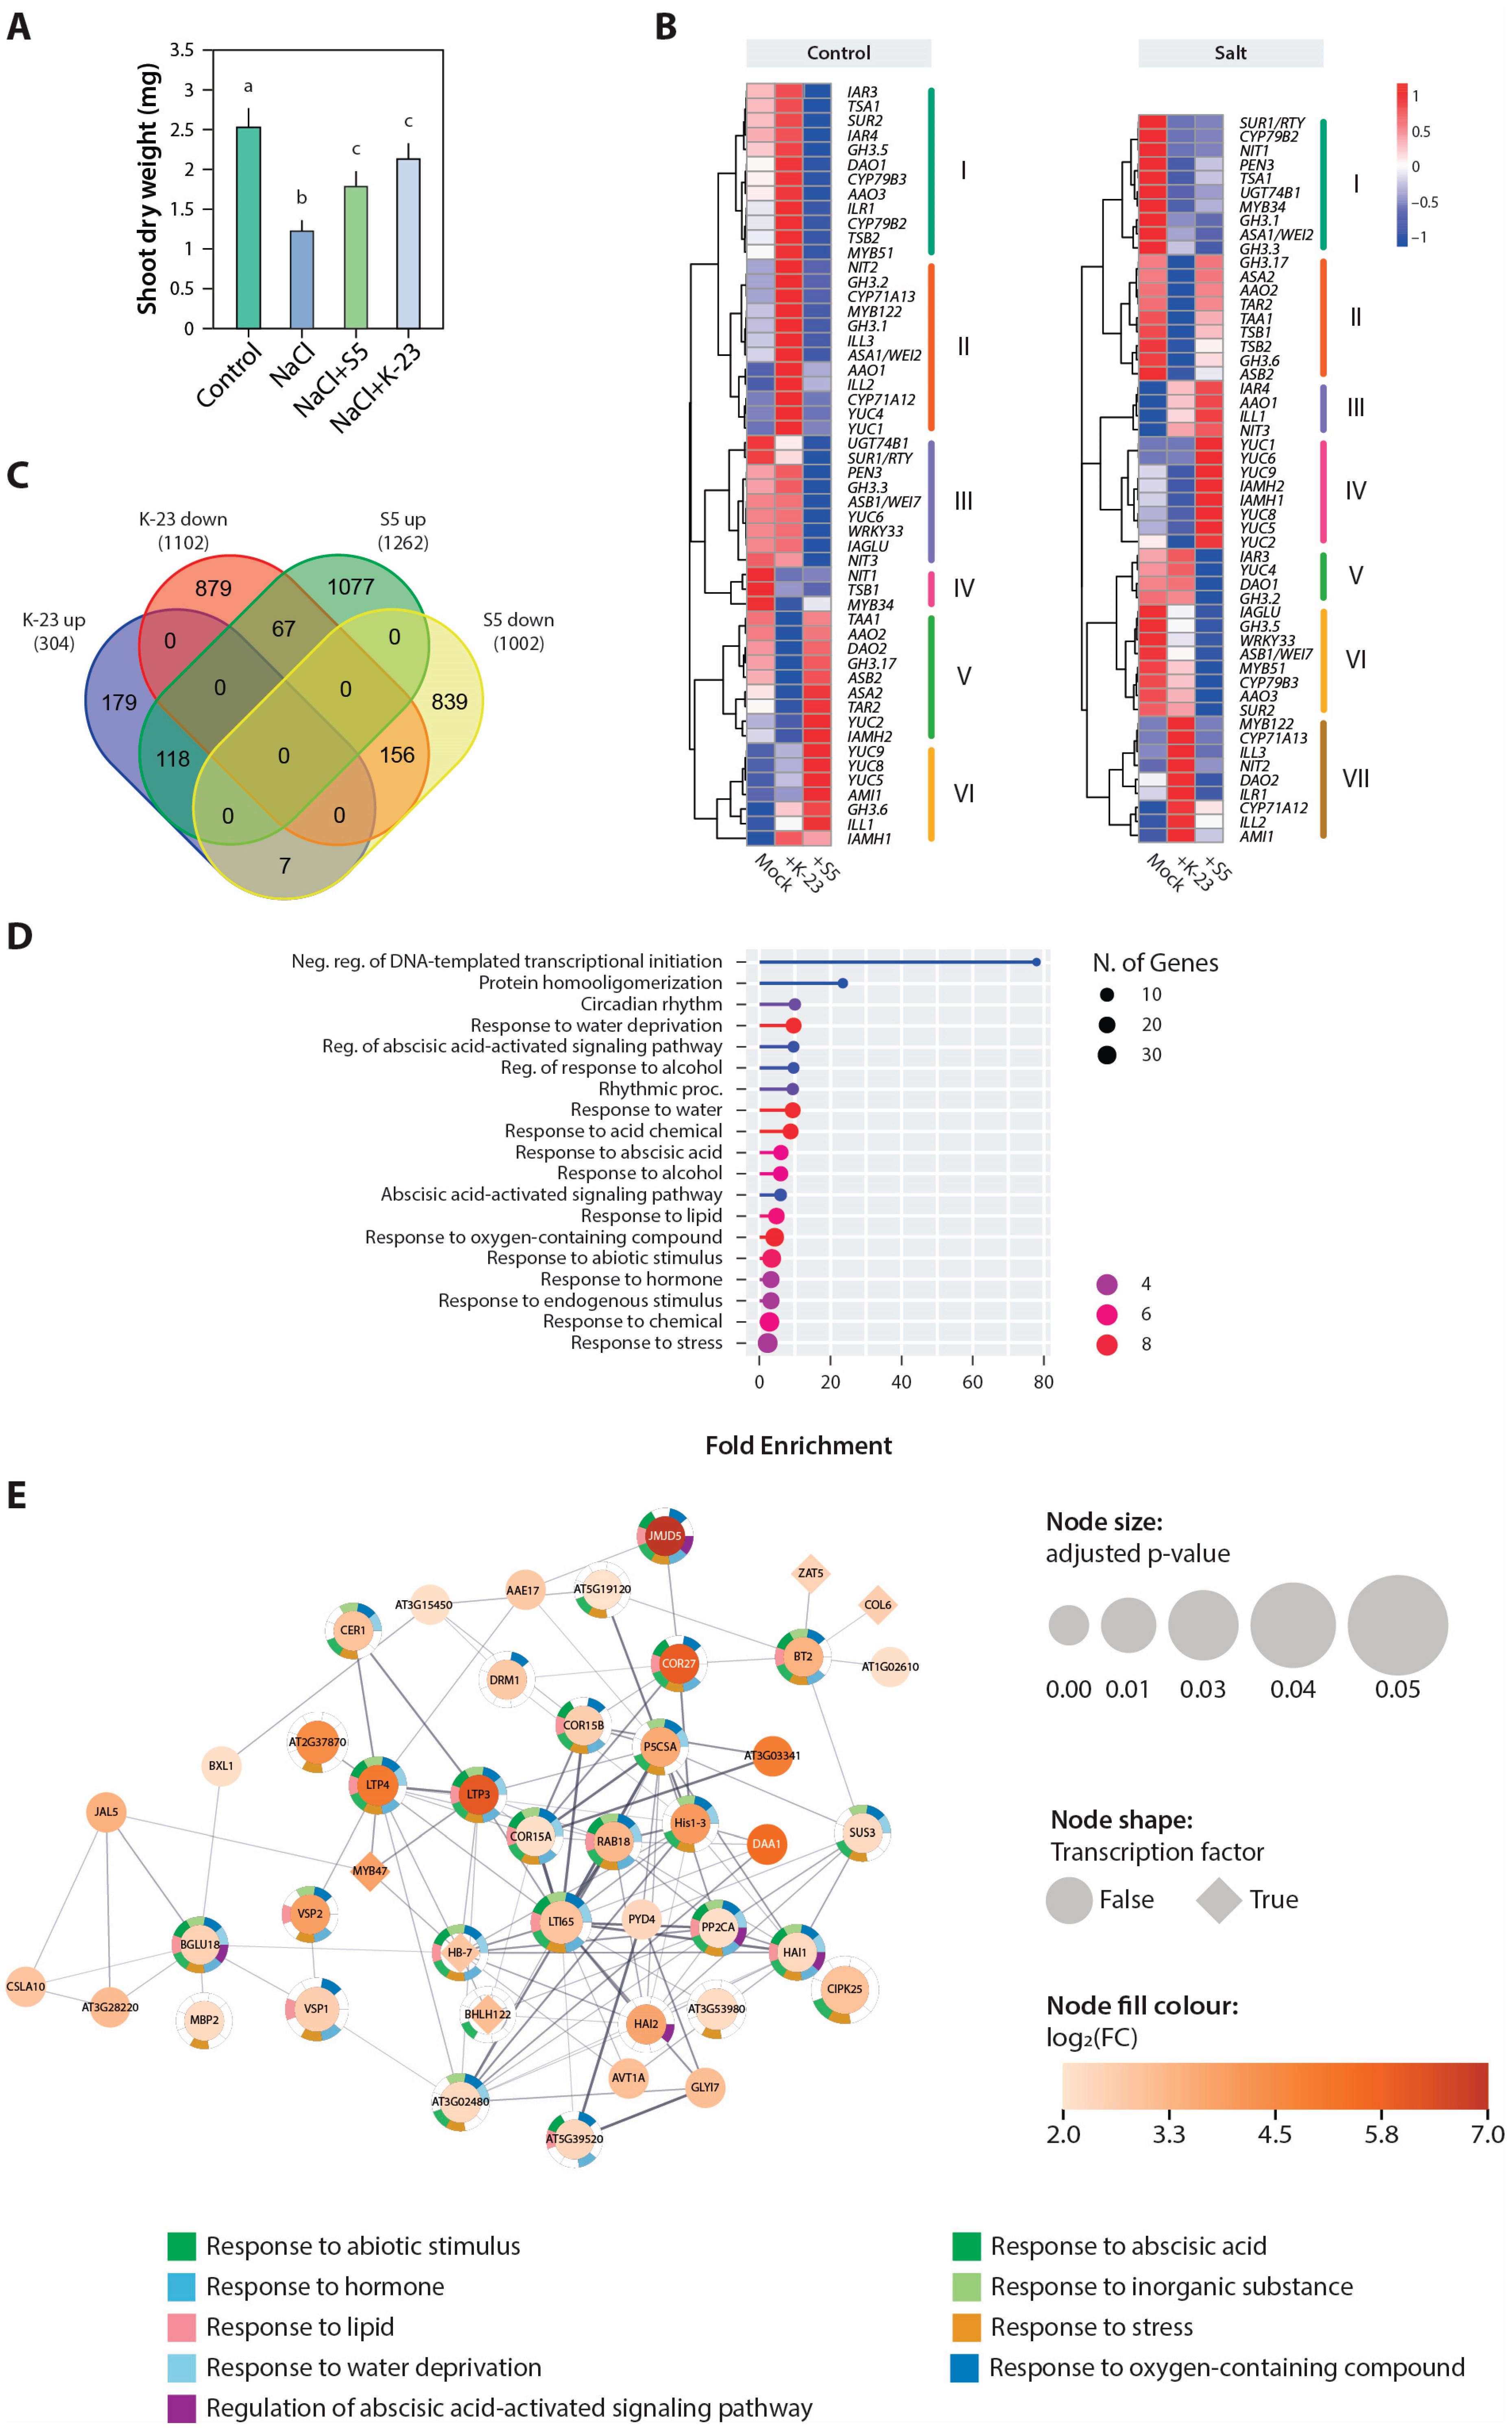
The subsequent microscopic examination of root hairs on primary roots of both control Col-0 plants and those infected with S5 and K-23, as depicted in Figure 5C, confirmed the transcriptomics data at the phenotypic level. While the infection by the two studied fungal strains resulted in distinct phenotypes concerning root hair growth, the phenotypic impact on shoots was observed to be similar. Infection of Arabidopsis plants with both strains led to a significant increase in biomass formation compared to mock-infected plants under identical conditions (Figure 6A). Considering the significant enrichment of auxin-related processes in S5-infected shoots, the similar biomass production under stress motivated us to compare perform a hierarchical clustering of genes associated with the metabolism of auxin and auxin-derived plant defense compounds, including glucosinolates and camalexin. As depicted in Figure 6B, transcript abundance has been clustered for control and salt stress condition. Under both control and salt stress conditions, marked differences were observed between infections with the two strains and the mock-infected plants. Notably, K-23-infected plants exhibited greater similarity to the mock-infected control plants. Under control conditions, the transcript abundance of auxin biosynthesis-related genes in cluster VI appeared higher in fungus-infected samples compared to the mock control. Additionally, in cluster IV, the abundance of genes such as MYB34 was reduced by both fungal infections. Under salt stress conditions, more correlations were identified between the fungus-infected samples and the mock control. In cluster I and VI, groups of less abundant genes, primarily associated with defense compound-related biosynthetic processes, were identified in the K-23- and S5-infected samples. Conversely, in cluster IV, an increased abundance of auxin-conjugate hydrolyzation-related genes was observed.
In order to gain more insight into gene correlations a weighted gene co-expression network analysis (WGCNA) was conducted to examine gene expression patterns under the compared infection conditions, including datasets for shoot samples of mock-infected and fungus-infected plants grown under salinity stress. The WGCNA identified 8 trait modules, each denoted by a distinct colour (Supplementary Figure S2). Correlations between module eigengenes and growth conditions were considered statistically significant if the p-value was < 0.05. We anticipated to identify a module with significant correlations for both tested fungi under the given test conditions. However, we only found negative correlations for mock-infected plants (r = 0.93, p = 0.0003) and S5-infected plants (r = –0.75, p = 0.02) in the turquoise module and for mock-infected plants (r = 0.81, p = 0.008) and K-23-infected plants (r = –0.91, p = 0.0008) in the brown module. Apart from that, we only identified correlations for module eigengenes for K-23-infected plants (r = –0.93, p = 0.0003) in the green module and for S5-infected plants (r = 0.99, p = 0.0000007) in the blue module. A subsequent gene enrichment analysis did not provide any noteworthy novel insight.
In light of this unexpected outcome, we decided to employ an alternative methodology by comparing the DEGs identified in the shoot samples under the NaCl+S5 versus control and NaCl+K-23 versus control conditions. As illustrated in Figure 6C, overlapping groups of induced and repressed genes were identified in the fungus-infec-
ted samples. The analysis of the 156 commonly repressed genes revealed an enrichment of GO terms associated with responses to light stimulus and radiation (Supplementary Table S3). Furthermore, the classification of the 118 commonly induced genes across the two compared datasets indicated an enrichment in GO terms predominantly related to ABA-dependent processes, including responses to water, water deprivation, and abscisic acid. This finding led us to conclude that the fungus infections triggered a reprogramming of the abiotic stress response, suggesting a more robust stress response. To gain a more comprehensive understanding of the putative regulatory network orchestrating this reprogramming, we conducted a functional network analysis using 118 genes as the query input. As illustrated in Figure 6E, the analysis identified a core regulatory framework consisting of three interconnected transcription factors: MYB47, HB-7, and bHLH122. These factors are closely associated with several osmotic stress regulatory elements, including P5CSA, which encodes Δ¹-pyrroline-5-carboxylate synthase A, a rate-limiting enzyme in proline biosynthesis. Additionally, HAI1, HAI2, and PP2CA encode protein phosphatases that serve as negative regulators of Snf1-related protein kinase1 (SnRK1) signalling. Concurrently, HB-7 is functionally linked to BGLU18, a gene encoding β-d-glucopyranosyl abscisate β-glucosidase, which catalyses the hydrolysis of ABA glucose esters.
3. Discussion
Salt stress significantly limits plant growth and agricultural productivity by inducing osmotic and ionic stresses that disrupt cellular homeostasis, inhibit photosynthesis, and decrease biomass accumulation and yield [1,3]. In the context of current climate change, which is associated with rising sea levels, rice production in Spain is also impacted. Spain is the second largest rice-producing country in Europe. The marshes of the Guadalquivir River, known as the 'Marismas del Guadalquivir', cover approximately 40,000 hectares and represent the most significant rice-producing region in Spain, accounting for approximately 39% of the country's rice cultivation [32]. The region is increasingly affected by tidal influences, resulting in the intrusion of seawater into the marshes and its subsequent mixing with freshwater. This phenomenon adversely affects rice grain production, which is typically sensitive to salinity [33]. However, approximately 75% of the rice cultivated in the marshes belongs to the Oryza sativa cultivar (cv.) Puntal. This cultivar is of Australian origin (known as ‘Doongara’ in Australia) and belongs to the Indica (long grain) subgroup and demonstrates considerable adaptability to fluctuating salinity levels. Recent publications have indicated that beneficial plant-colonizing fungi can enhance their host plants' adaptation to adverse environmental conditions, including salinity [34]. Consequently, we hypothesized that Puntal rice plants might harbour a mycobiome that aids in tolerating elevated salt stress levels. While there has been a report on bacteria isolated from rice plants in this area [35], there remained a knowledge gap regarding the mycobiome of these plants. To address this gap, fungal endophytes were isolated from the roots of Puntal plants collected from paddy fields on two farms near the village of La Puebla del Río, located south of Seville. As expected, a substantial number of fungal endophytes were isolated from the roots. Among these, five strains were selected for further study (Figure 1) due to their demonstrated strong salt tolerance in in vitro analyses. Notably, these strains also conferred significant salt tolerance to the non-host plant Arabidopsis thaliana, indicating a highly conserved mode of action rather than a highly specialized symbiosis between strongly adapted partner organisms.
This study initially concentrated on the fungal strain Reticulascus sp. strain S5, as this root-colonizing fungal endophyte exhibited a notable growth-promoting effect on roots and shoots under conditions of salt stress (Figure 2). At the molecular level, salinity triggers rapid osmotic stress signals, leading to stomatal closure and a decrease in carbon assimilation. Subsequently, there is an accumulation of toxic Na⁺ and Cl⁻ ions, which disrupt essential biochemical processes. Plants have evolved intricate tolerance mechanisms mediated by coordinated signalling networks, such as the salt overly sensitive (SOS) pathway [6]. In this pathway, the Ca²⁺ sensor SOS3 and kinase SOS2 activate the plasma membrane Na⁺/H⁺ antiporter SOS1, which maintains ion homeostasis by extruding Na⁺ from cells. Additionally, the compartmentalization of Na⁺ into vacuoles via tonoplast Na⁺/H⁺ exchangers (NHX proteins) alleviates cytosolic toxicity [7]. Osmotic adjustment is achieved through the synthesis of compatible solutes, such as proline, glycine betaine, and soluble sugars, which stabilize proteins and membranes while maintaining turgor pressure. Salt stress also triggers the production of reactive oxygen species (ROS); plants mitigate oxidative damage through the activation of antioxidant defence systems, including superoxide dismutase, catalase, and ascorbate peroxidase. Hormonal regulation, particularly through ABA, plays a critical role in modulating stress-responsive gene expression, ion transport, and stomatal conductance. Furthermore, transcription factors such as DREB, NAC, and bZIP are involved in regulating downstream stress-responsive genes that enhance tolerance [4]. However, despite these adaptive mechanisms, prolonged or severe salinity can overwhelm plant defence systems, leading to impaired development and reduced crop yield. As a result, soil salinization represents a significant global threat to sustainable agriculture, particularly in irrigated and arid regions where salt accumulation is prevalent.
To explore the molecular mechanisms by which Reticulascus sp. strain S5 promotes plant growth under salinity stress, we employed a comprehensive transcriptomic analysis using RNA-seq. Notably, our research demonstrated that the fungal infection does not significantly influence the transcriptomic expression of the SOS pathway components or the other seven NHX Na⁺/H⁺ antiporter genes. The comprehensive analysis of RNA-seq data revealed evidence for several distinct groups of biological processes that were either overrepresented or underrepresented in response to fungal infection, with and without the presence of salt in the growth medium (Figure 3 and Figure 4). In shoot tissues, we observed the reprogramming of plant hormone-related processes, particularly those involving auxin and ABA metabolism, signalling, and response-related gene groups, which aligns with the observed increase in biomass production. It appears that cell wall loosening, facilitated by the induction of various XTH genes, is part of the response potentially involved in cell expansion. Furthermore, we identified a systematic repression of plant defence and senescence-related biological processes, evidenced by the repression of glucosinolate and phenylpropanoid biosynthesis pathways and ethylene signalling, respectively [20,21,22]. These observations, coupled with increased growth under stress conditions, suggest that shoots of fungus-infected plants experience reduced abiotic stress, thereby facilitating enhanced growth. Concurrently, plants co-cultivated with S5 exhibited diminished defence mechanisms, likely promoting symbiosis with the fungus.
In roots, fungal infection intriguingly led to the suppression of genes associated with root hair growth. Under additional salt stress, we observed a notable underrepresentation of gene groups related to cell wall organization, cellulose biosynthesis, plant defence, and abiotic stress. These gene expression profiles, particularly the diminished expression of abiotic stress response-associated genes, implied that the fungus may either shield the host plant from salt stress or that the fungal infection itself induced differential gene expression. The root hair phenotype was of particular interest, as we recently documented another fungus, Fusarium sp. strain K-23, from the Himalayas that also enhanced salt tolerance, contingent upon the induction of root hair growth under both control and salt stress conditions [9]. This observation led us to compare the molecular responses elicited by these distinct fungal symbionts to elucidate how the evolution of habitat-adapted symbiosis might influence plant responses and whether similar responses are adopted to achieve comparable phenotypic outcomes in distinct biological settings [12,13]. The comparison of the root RNA-seq data of Arabidopsis plants infected with the two fungi largely confirmed the expectations, as a considerable group of root hair development-related genes appeared to be induced in K-23-infected plants, while being repressed in S5-infected plants. The distinct root hair phenotypes could also be corroborated experimentally (Figure 5).
These findings suggest that enhanced salinity tolerance is not necessarily associated with a unique developmental response in the root system. While Fusarium sp. K-23 promotes root hair formation, Reticulascus sp. S5 represses root hair-associated developmental pathways, yet both symbionts ultimately improve plant performance under saline conditions. This observation indicates that distinct fungal partners may employ alternative root-level strategies to achieve similar adaptive outcomes in the host plant.
Thus, the investigation into whether the transcriptional responses in the shoot samples exhibited greater comparability was of particular interest to us, given that a similar plant growth-promoting phenotype was observed in the aerial parts of plants infected with fungi under stress conditions (Figure 6). Although the auxin-related gene responses under the test conditions were not identical, certain similarities were identified, leading to the conclusion that both fungi stimulate plant growth by promoting auxin biosynthesis in the shoots. Furthermore, the comparative analysis of the identified DEGs in K-23 and S5-infected plants under salt stress revealed small groups of overlapping genes that appear to contribute to increased stress tolerance and, consequently, enhanced growth in the infected plants. A functional network analysis of the 118 shared genes induced by both fungi identified a core gene regulatory network centred around at least two transcription factor genes, bHLH122 and HB-7. Notably, bHLH122 has been implicated in the regulation of drought and osmotic stress resistance in Arabidopsis and also contributes to the control of cellular ABA levels [22]. The homeodomain-leucine zipper (HD-Zip) class I transcription factor HB-7 is known to be involved in the regulation of water deficit responses [22,23,24]. Together these transcription factors subsequently orchestrate the expression of several genes, including HAI1, HAI2, PP2CA, and P5CSA, which are crucial for fine-tuning ABA responses and controlling osmotic adjustment through the synthesis of osmoprotectant solutes, such as proline [25,26,27,28]. Overall, this suggests that the two fungi activate the same intrinsic response module in Arabidopsis plants under salt stress. The apparent convergence of two phylogenetically and ecologically distinct fungal symbionts on a common ABA-associated regulatory network is particularly interesting. Despite inducing markedly different transcriptional and developmental responses in roots, both fungi activate a shared set of stress-responsive genes in shoots. These results support the existence of conserved host regulatory modules that can be recruited by different beneficial microorganisms to enhance adaptation to saline environments. Interestingly, a similar observation was recently made when comparing the effect of three distinct fungal endophytes on the drought tolerance response of tomato plants [29].
Future research will face the challenge of further characterizing the role of the identified regulatory network in beneficial plant-fungus interactions. Additionally, elucidating the mechanisms of root-to-shoot communication within the investigated symbiotic relationships will be an exciting endeavour. Finally, understanding these mechanisms may facilitate the development of microbiome-based strategies to improve crop performance under increasing soil salinization.
4. Materials and Methods
4.1. Plant Material and Growth Conditions
In this work, we used Arabidopsis thaliana L var. Col-0 (N1092) obtained from the Nottingham Arabidopsis Stock Center (NASC). Following surface sterilization of seeds using 2% (w/v) sodium hypochlorite and 70% (v/v) ethanol, the seeds underwent stratification for 2 days at 4°C. Next, the seeds were transferred to plates and cultivated sterilely on solidified 0.5 × MS medium supplemented with 1% (w/v) sucrose [36]. The plants were maintained in growth chambers under rigorously controlled environmental conditions, including a photoperiod of 16 h of light and 8 h of darkness, a constant temperature of 22°C, and photosynthetically active radiation of 100-105 μmol photons m−2 s−1.
4.2. Collection of Fungal Endophytes and Fungal Growth Conditions
The root material of the Oryza sativa L. cultivar Puntal was obtained from paddy fields situated in the marshlands on the left bank of the Guadalquivir River. These fields are part of the Sartenejales (37° 10’ N, 6° 04’ W) and Casudis (37° 08’ N, 6° 05’ W) farms. The Sartenejales farm encompasses an area of 850 hectares, while the Casudis farm covers 2,400 hectares. Both estates belong to the municipality of La Puebla del Río and are located at an elevation of merely 3 meters above sea level, positioned to the south of Sevilla, Spain. The estuary of the Guadalquivir, in which the fields are situated, is influenced by tidal activity, resulting in the upstream penetration of seawater, which mixes with freshwater to create a transition zone characterized by variable salinity. Furthermore, irrigation water is frequently reused across numerous plots, contributing to increased water salinity [37]. During years of moderate irrigation, often due to water restrictions, the average salt concentration in irrigation water typically measures around 2.86 dS m−1. However, in years marked by severe restrictions, like in recent years, salinity levels can escalate to 4.0 dS m−1 or higher, leading to significant reductions in grain yield [38]. Puntal is the predominant rice variety cultivated in this region, classified as an Indica-type variety, and is grown in 60% of Andalusia. Although this cultivar is characterized as having medium sensitivity to salinity, it demonstrates a remarkable adaptability to the saline conditions prevalent in the Guadalquivir marshes. However, the potential role of endophytic microorganisms in facilitating this salt adaptation remains unclear.
To isolate endophytic fungi from the rice roots, segments of the root material were washed twice with distilled water and subsequently subjected to surface sterilization using 70% (v/v) ethanol for 2 minutes, followed by incubation in 2.5% (w/v) NaOCl and 0.1% (v/v) Triton-X100 for 5 minutes. The roots were then rinsed four times with sterile water. Next, the root fragments were directly plated on both Water Agar and 0.1 × Potato Dextrose Agar (PDA) containing 100 μg ml–1 ampicillin, 10 μg ml–1 tetracycline, and 150 μg ml–1 chloramphenicol, following previously established protocols [39,40,41]. To obtain pure isolates of endophytic fungi, they were transferred four times to fresh PDA plates supplemented with 150 μg ml–1 chloramphenicol.
In addition to the fungal strains isolated in this study, the previous described fungus Fusarium sp. strain K-23 was used [22]. The fungi were grown in darkness at a constant temperature of 28 °C on solidified PDA medium. Each week, the fungal cultures were refreshed.
4.3. Phylogenetic Classification of the Isolates
To achieve phylogenetic classification the obtained fungal isolates, genomic DNA (gDNA) was extracted from fungal mycelia applying the cetyltrimethylammonium bromide protocol [42]. The gDNA was subsequently used as matrix to amplify the internal transcribed spacer (ITS) regions of the fungi by polymerase chain reaction (PCR) employing the primers ITS1 forward and ITS4 reverse [43]. The obtained DNA fragments were purified using the NucleoSpin Gel and PCR Clean-up Kit (Macherey-Nagel, Düren, Germany) according to the manufacturers protocol and subsequently Sanger sequenced by the StabVida Genetics Service (Caparica, Portugal) with their ITS1 and ITS4 primers. The taxonomic classification of the obtained amplicon sequences was performed using the UNITE Fungal ITS Database v10.0 [24], displaying classifications at all taxonomic levels. This database encompasses identified fungal sequences with assignments to Species Hypothesis (SH) groups, which are defined based on variable sequence similarity thresholds [44]. Taxonomic assignments were subsequently verified and refined using the ITS region database of the National Center for Biotechnology Information (NCBI) (https://blast.ncbi.nlm.nih.gov/, accessed on 15 April 2026). Identity was assigned based on maximum homology and percent similarity, adhering to previously established criteria [45]. A phylogenetic tree was constructed using the neighbor-joining method [46] using the MEGA X v12.1 program [47]. The evolutionary distances were calculated with the maximum composite likelihood method [48]. The analysis incorporated 75 ITS sequences, comprising 5 sequences obtained in this study and 70 sequences sourced from the GenBank database (PRJNA177353). All positions containing gaps and missing data were eliminated. Evolutionary analyses were performed with 10000 bootstrap replications.
4.4. Plant–Fungus Interaction and Plant Growth Promotion Assays
To investigate the potential plant growth-promoting effects of the selected fungal isolates on Arabidopsis seedlings under both control and salt stress conditions, surface-sterilized seeds were plated and stratified as previously described. The plates were transferred to a growth chamber, where the seedlings were cultivated vertically for a period of 4 days. Subsequently, 5 seedlings were transferred to fresh square Petri dishes containing solidified Plant Nutrition Medium (PNM) [49], which either lacked NaCl (control) or contained either 50 mM or 75 mM NaCl (salt). The roots of each seedling were inoculated with 15 μl of a solution containing 1 × 10⁵ spores ml–1. Alternatively, each seedling was associated with a 5 mm medium plug extracted from either sterile PDA plates (mock) or from PDA plates harbouring 1-week-old fungal mycelia (co-cultivation). The PNM plates were subsequently transferred to a growth chamber and maintained at 22–24°C, with a 16/8 h photoperiod and a light intensity of 100 μmol photons m–2 s–1 for an additional 10 days. Finally, the plants were photographed for further phenotypic analysis before being dissected into root and shoot tissue to determine the fresh and dry weight of the plants.
4.5. RNA Isolation and Transcriptomics Analysis
For each growth condition, 100 mg of root tissue of 14 days-old mock- and fungus-infected seedlings (10 dpi) that were grown in the absence and presence of 75 mM NaCl2, respectively, was harvested for total RNA extraction following the protocol of Oñate-Sánchez and Vicente-Carbajosa [50]. The total RNA was quantified utilising a Nanodrop ND-1000 UV/Vis spectrophotometer (Thermo Fisher Scientific, Waltham, MA, USA). RNA integrity was further assessed employing a Bioanalyzer 2100 (Agilent Technologies, Santa Clara, CA, USA) by the BMKGENE Genomics Service (Münster, Germany). The subsequent steps, including mRNA purification, library construction, and sequencing with 150-nucleotide paired-end reads on the NovaSeq™ 6000 (Illumina, San Diego, CA, USA) platform, were executed by BMKGENE Genomics Service. They also conducted preliminary data analysis using their RNA-sequencing (RNA-seq) pipeline, which encompassed data filtering, quality control, and sequence alignment via HISAT2 v2.0.5 [51]. Transcript quantification was performed against the A. thaliana reference annotation (TAIR10, Ensembl release 45) using StringTie v3.0.0 [52]. For further RNA-Seq data analysis, the R-Shiny applications DIANE v1.0.6 [53] and iDEP v2.4.3 [54] were utilised. Differentially expressed genes (DEGs) were identified using the DESeq2 v1.20.0 algorithm [55], with a false discovery rate (FDR) threshold set to < 0.05 and a log2(fold change) cut-off value of ≥ |1| (Supplementary Table S1). Venn diagrams were created using the Venn (http://bioinformatics.psb.ugent.be/webtools/Venn/) online tools to depict the overlaps and distinctions among DEGs across different datasets. Gene ontology (GO) analyses were conducted using the ShinyGO (v0.85.1) [56] online tool. Heatmaps were generated with the ClustVis tool [57]. Each tissue, treatment, and condition was analysed in triplicate biological samples.
4.6. Weighted Gene Co-Expression Network Analysis
A weighted gene co-expression network analysis (WGCNA) was performed utilizing the WGCNA package in R [58]. Gene counts were normalized employing the Deseq2::vst method. Features with consistently low normalized counts (norm. count < 20 in more than 90% of the samples) were excluded. The secondary filtration method was based on mean expression, with the number of retained genes set at 5000. A signed hybrid network (power β = 14) was generated. A minimum module size of 30 and a module cut-tree height of 0.25 were selected. Eigengene-based connectivity (kME) and the corresponding p-value were calculated for the 5000 genes clustered in 8 modules.
4.7. Microscopic Inspection of Root Hairs
For the inspection of root hairs in the different mock and fungus-treated Arabidopsis plants, the root hair phenotypes of at least 10 individual plants seven days post infection were monitored. Images were captured using a Leica MZ10F stereo microscope equipped with a DFC 400C CCD camera.
4.8. Statistical Analysis
For the statistical assessment of data and the generation of plots, JASP v.0.96 (https://jasp-stats.org/) was utilised. A two-way ANOVA followed by Tukey's post hoc test or Student's t-test was conducted to perform statistical analysis of the data. Sample sizes (n) for each experiment are provided in the respective figure legends. Results were considered statistically significant when the p-value was less than or equal to a value of 0.05.
Supplementary Materials
The following supporting information can be downloaded at the website of this paper posted on Preprints.org. Figure S1: Comparison of DEGs only affected by Reticulascus sp. strain S5 infection in presence and absence of 75 mM NaCl for root and shoot tissues; Figure S2: Weighted gene co-expression network analysis (WGCNA) of the top 5,000 differentially expressed genes in mock and K-23 as well as S5-infected plants. Table S1: Table S2: GO term and KEGG pathway enrichment analyses of Reticulascus sp. S5 and salt stress triggered effects; Table S3: GO term and KEGG pathway enrichment analyses of Reticulascus sp. S5 and Fusarium sp. K-23 induced effects in shoots of Arabidopsis plants grown under salt stress.
Author Contributions
S.P. and B.B. designed the experiments. S.M.-F., A.G.O.-V., E.R.-D., L.M.-Q., P.R., J.V.-C., R.H., B.B. and S.P. performed the research and analysed the data. S.P. and B.B. were responsible for the acquisition of the required funding to perform the experiments. S.P. wrote and edited the manuscript. All authors have read and agreed to the published version of the manuscript.
Funding
The authors express their gratitude to the Spanish Ministry of Science, Innovation and Universities (MICIU) and the Spanish Research Agency (AEI/10.13039/501100011033) for their financial support of this research through grants PID2020-119441RB-I00 and PID2023-151327OB-I00.
Institutional Review Board Statement
Not applicable.
Informed Consent Statement
Not applicable.
Data Availability Statement
All data supporting the findings of this study are available within the paper and its supplementary data in the appendices. The full RNA-seq dataset for mock and Fusarium sp. strain K-23 infected plants in presence and absence of salt is available at the GEO functional genomics data repository, dataset GSE260960.
Acknowledgments
The authors want to thank Carmen Guerrero-Galán and Lorena Blázquez Conchillo for their excellent technical support in the isolation of the fungal strains. Moreover, the authors want to express their gratitude to all members of the CBGP laboratories 132 and 134 for their thoughtful feedback and highly valuable comments, as well as their constant willingness to help.
Conflicts of Interest
The authors declare no conflicts of interest.
References
- Munns, R.; Tester, M. Mechanisms of Salinity Tolerance. Ann. Rev. Plant Biol. 2008, 59, 651–681. [Google Scholar] [CrossRef] [PubMed]
- FAO. Global status of salt-affected soils - Main report; Rome, 2024. [Google Scholar] [CrossRef]
- Zhu, J.-K. Plant salt tolerance. Trends Plant Sci. 2001, 6, 66–71. [Google Scholar] [CrossRef] [PubMed]
- Hasegawa, P. M.; Bressan, R. A.; Zhu, J.-K.; Bohnert, H. J. Plant Cellular and Molecular Responses to High Salinity. Ann. Rev. Plant Biol. 2000, 51, 463–499. [Google Scholar] [CrossRef] [PubMed]
- Apel, K.; Hirt, H. Reactive Oxygen Species: Metabolism, Oxidative Stress, and Signal Transduction. Ann. Rev. Plant Biol. 2004, 55, 373–399. [Google Scholar] [CrossRef] [PubMed]
- Ali, A.; Petrov, V.; Yun, D. J.; Gechev, T. Revisiting plant salt tolerance: novel components of the SOS pathway. Trends Plant Sci. 2023, 28, 1060–1069. [Google Scholar] [CrossRef] [PubMed]
- Apse, M. P.; Blumwald, E. Engineering salt tolerance in plants. Curr. Opin. Biotechnol. 2002, 13, 146–150. [Google Scholar] [CrossRef] [PubMed]
- Rodriguez, R. J.; White, J. F., Jr.; Arnold, A. E.; Redman, R. S. Fungal endophytes: diversity and functional roles. New Phytol. 2009, 182, 314–330. [Google Scholar] [CrossRef] [PubMed]
- Hardoim, P. R.; van Overbeek, L. S.; Elsas, J. D. Properties of bacterial endophytes and their proposed role in plant growth. Trends Microbiol. 2008, 16, 463–471. [Google Scholar] [CrossRef] [PubMed]
- Haro, R.; Lanza, M.; Aguilella, M.; Sanz-Garcia, E.; Benito, B. The transportome of the endophyte Serendipita indica in free life and symbiosis with Arabidopsis and its expression in moderate salinity. Front Microbiol. 2023, 14, 1191255. [Google Scholar] [CrossRef] [PubMed]
- Lanza, M.; Haro, R.; Conchillo, L. B.; Benito, B. The endophyte Serendipita indica reduces the sodium content of Arabidopsis plants exposed to salt stress: fungal ENA ATPases are expressed and regulated at high pH and during plant co-cultivation in salinity. Environ. Microbiol. 2019, 21, 3364–3378. [Google Scholar] [CrossRef] [PubMed]
- Rodriguez, R. J.; Henson, J.; Van Volkenburgh, E.; Hoy, M.; Wright, L.; Beckwith, F.; Kim, Y. O.; Redman, R. S. Stress tolerance in plants via habitat-adapted symbiosis. ISME J. 2008, 2, 404–416. [Google Scholar] [CrossRef] [PubMed]
- Redman, R. S.; Kim, Y. O.; Woodward, C. J.; Greer, C.; Espino, L.; Doty, S. L.; Rodriguez, R. J. Increased fitness of rice plants to abiotic stress via habitat adapted symbiosis: a strategy for mitigating impacts of climate change. PLoS ONE 2011, 6, e14823. [Google Scholar] [CrossRef] [PubMed]
- Vandenkoornhuyse, P.; Quaiser, A.; Duhamel, M.; Le Van, A.; Dufresne, A. The importance of the microbiome of the plant holobiont. New Phytol. 2015, 206, 1196–1206. [Google Scholar] [CrossRef] [PubMed]
- Santner, A.; Calderon-Villalobos, L. I. A.; Estelle, M. Plant hormones are versatile chemical regulators of plant growth. Nat. Chem. Biol. 2009, 5, 301–307. [Google Scholar] [CrossRef] [PubMed]
- Ludwig-Müller, J. Plants and endophytes: equal partners in secondary metabolite production? Biotechnol. Lett. 2015, 37, 1325–1334. [Google Scholar] [CrossRef] [PubMed]
- Cutler, S. R.; Rodriguez, P. L.; Finkelstein, R. R.; Abrams, S. R. Abscisic Acid: Emergence of a Core Signaling Network. Ann. Rev. Plant Biol. 2010, 61, 651–679. [Google Scholar] [CrossRef] [PubMed]
- Pieterse, C. M. J.; Van der Does, D.; Zamioudis, C.; Leon-Reyes, A.; Van Wees, S. C. M. Hormonal Modulation of Plant Immunity. Ann. Rev. Cell Dev. Biol. 2012, 28, 489–521. [Google Scholar] [CrossRef] [PubMed]
- Nakashima, K.; Ito, Y.; Yamaguchi-Shinozaki, K. Transcriptional Regulatory Networks in Response to Abiotic Stresses in Arabidopsis and Grasses. Plant Physiol. 2009, 149, 88–95. [Google Scholar] [CrossRef] [PubMed]
- Yoshida, T.; Mogami, J.; Yamaguchi-Shinozaki, K. ABA-dependent and ABA-independent signaling in response to osmotic stress in plants. Curr. Opin. Plant Biol. 2014, 21, 133–139. [Google Scholar] [CrossRef] [PubMed]
- Khan, A. L.; Hussain, J.; Al-Harrasi, A.; Al-Rawahi, A.; Lee, I.-J. Endophytic fungi: resource for gibberellins and crop abiotic stress resistance. Crit. Rev. Biotechnol. 2015, 35, 62–74. [Google Scholar] [CrossRef] [PubMed]
- Onejeme, F. C.; González Ortega-Villaizán, A.; Rodríguez-Dobreva, E.; Topel Prieto, B.; Patel, M. K.; Guendouzi, S.; Reddy, P. Y. N.; Lopez, L. E.; Estevez, J. M.; Nataraja, K. N.; Shaanker, R. U.; Benito, B.; Vicente-Carbajosa, J.; Oelmüller, R.; Pollmann, S. Fusarium sp. Strain K-23 Alleviates Salt Stress in Arabidopsis thaliana Through its Root Hair Growth-Promoting Effect. J. Plant Growth Regul. 2025, 44, 7089–7105. [Google Scholar] [CrossRef]
- González Ortega-Villaizán, A.; King, E.; Patel, M. K.; Rodríguez-Dobreva, E.; González-Teuber, M.; Ramos, P.; Vicente-Carbajosa, J.; Benito, B.; Pollmann, S. Identification of a drought stress response module in tomato plants commonly induced by fungal endophytes that confer increased drought tolerance. Plant Mol. Biol. 2025, 115, 7. [Google Scholar] [CrossRef] [PubMed]
- Abarenkov, K.; Nilsson, R. H.; Larsson, K. H.; Taylor, A. F. S.; May, T. W.; Froslev, T. G.; Pawlowska, J.; Lindahl, B.; Poldmaa, K.; Truong, C.; Vu, D.; Hosoya, T.; Niskanen, T.; Piirmann, T.; Ivanov, F.; Zirk, A.; Peterson, M.; Cheeke, T. E.; Ishigami, Y.; Jansson, A. T.; Jeppesen, T. S.; Kristiansson, E.; Mikryukov, V.; Miller, J. T.; Oono, R.; Ossandon, F. J.; Pauperio, J.; Saar, I.; Schigel, D.; Suija, A.; Tedersoo, L.; Koljalg, U. The UNITE database for molecular identification and taxonomic communication of fungi and other eukaryotes: sequences, taxa and classifications reconsidered. Nucleic Acids Res. 2024, 52, D791–D797. [Google Scholar] [CrossRef] [PubMed]
- Réblová, M.; Gams, W.; Seifert, K. A. Monilochaetes and allied genera of the Glomerellales, and a reconsideration of families in the Microascales. Stud. Mycol. 2011, 68, 163–191. [Google Scholar] [CrossRef] [PubMed]
- Dowling, M.; Peres, N.; Villani, S.; Schnabel, G. Managing Colletotrichum on Fruit Crops: A "Complex" Challenge. Plant Dis. 2020, 104, 2301–2316. [Google Scholar] [CrossRef] [PubMed]
- Sukno, S. A.; García, V. M.; Shaw, B. D.; Thon, M. R. Root infection and systemic colonization of maize by Colletotrichum graminicola. Appl. Environ. Microbiol. 2008, 74, 823–832. [Google Scholar] [CrossRef] [PubMed]
- Hiruma, K.; Gerlach, N.; Sacristán, S.; Nakano, R. T.; Hacquard, S.; Kracher, B.; Neumann, U.; Ramírez, D.; Bucher, M.; O'Connell, R. J.; Schulze-Lefert, P. Root Endophyte Colletotrichum tofieldiae Confers Plant Fitness Benefits that Are Phosphate Status Dependent. Cell 2016, 165, 464–474. [Google Scholar] [CrossRef] [PubMed]
- Hyde, K. D. Refined families of Sordariomycetes. Mycosphere 2020, 11, 305–1059. [Google Scholar] [CrossRef]
- Crous, P. W.; Begoude, B. A. D.; Boers, J.; Braun, U.; Declercq, B.; Dijksterhuis, J.; Elliott, T. F.; Garay-Rodriguez, G. A.; Jurjević, Ž.; Kruse, J.; Linde, C. C.; Loyd, A.; Mound, L.; Osieck, E. R.; Rivera-Vargas, L. I.; Quimbita, A. M.; Rodas, C. A.; Roux, J.; Schumacher, R. K.; Starink-Willemse, M.; Thangavel, R.; Trappe, J. M.; van Iperen, A. L.; Van Steenwinkel, C.; Wells, A.; Wingfield, M. J.; Yilmaz, N.; Groenewald, J. Z. New and Interesting Fungi. Fungal Syst. Evol. 2022, 10, 19–90. [Google Scholar] [CrossRef] [PubMed]
- Chen, H.; Bullock, D. A., Jr.; Alonso, J. M.; Stepanova, A. N. To Fight or to Grow: The Balancing Role of Ethylene in Plant Abiotic Stress Responses. Plants 2021, 11. [Google Scholar] [CrossRef] [PubMed]
- Gómez de Barreda, D.; Pardo, G.; Osca, J. M.; Catala-Forner, M.; Consola, S.; Garnica, I.; López-Martínez, N.; Palmerín, J. A.; Osuna, M. D. An Overview of Rice Cultivation in Spain and the Management of Herbicide-Resistant Weeds. Agronomy 2021, 11. [Google Scholar] [CrossRef]
- Grattan, S. R.; Zeng, L.; Shannon, M. C.; Roberts, S. R. Rice Is More Sensitive to Salinity than Previously Thought. Calif. Agric. 2002, 56, 189–198. [Google Scholar] [CrossRef]
- Pérez-Alonso, M. M.; Guerrero-Galán, C.; Scholz, S. S.; Kiba, T.; Sakakibara, H.; Ludwig-Müller, J.; Krapp, A.; Oelmüller, R.; Vicente-Carbajosa, J.; Pollmann, S. Harnessing symbiotic plant-fungus interactions to unleash hidden forces from extreme plant ecosystems. J. Exp. Bot. 2020, 71, 3865–3877. [Google Scholar] [CrossRef] [PubMed]
- del Castillo, I.; Ojeda, J.; Megías, E.; Manyani, H.; López-Baena, F. J.; Pérez-Montaño, F.; Bellogín, R. A.; Espuny, M. R.; Cubo, M. T.; Javier Ollero, F.; Megías, M. Isolation of endophytic, epiphytic and rhizosphere plant growth-promoting bacteria from cultivated rice paddy soils of the Guadalquivir river marshes. Glob. Adv. Res. J. Agric. Sci. 2015, 4, 127–136. [Google Scholar]
- Murashige, T.; Skoog, F. A revised medium for rapid growth and bio assays with tobacco tissue cultures. Physiol. Plan. 1962, 15, 473–497. [Google Scholar] [CrossRef]
- Moreno, F.; Cabrera, F.; Fernández-Boy, E.; Girón, I. F.; Fernández, J. E.; Bellido, B. Irrigation with saline water in the reclaimed marsh soils of south-west Spain: impact on soil properties and cotton and sugar beet crops. Agric. Water Manag. 2001, 48, 133–150. [Google Scholar] [CrossRef]
- Aguilar, M.; Fernández-Ramírez, J. L.; Aguilar-Blanes, M.; Ortiz-Romero, C. Rice sensitivity to saline irrigation in Southern Spain. Agric. Water Manag. 2017, 188, 21–28. [Google Scholar] [CrossRef]
- Dolan, C. T. Optimal Combination and Concentration of Antibiotics in Media for Isolation of Pathogenic Fungi and Nocardia asteroides. Appl. Microbiol. 1971, 21, 195–197. [Google Scholar] [CrossRef] [PubMed]
- Hallmann, J.; Berg, G.; Schulz, B. Isolation Procedures for Endophytic Microorganisms. In Microbial Root Endophytes; Schulz, B. J. E., Boyle, C. J. C., Sieber, T. N., Eds.; Springer Berlin Heidelberg: Berlin, Heidelberg, 2006; pp. 299–319. [Google Scholar]
- Atlas, R. M. Handbook of Microbiological Media, 4th ed ed.; CRC Press: Boca Raton, 2010. [Google Scholar]
- Doyle, J. J.; Doyle, J. L. A rapid DNA isolation procedure for small quantities of fresh leaf tissue. Phytochem. Bull. 1987, 19, 11–15. [Google Scholar]
- Gardes, M.; Bruns, T. D. ITS primers with enhanced specificity for basidiomycetes - application to the identification of mycorrhizae and rusts. Mol. Ecol. 1993, 2, 113–118. [Google Scholar] [CrossRef] [PubMed]
- Kõljalg, U.; Nilsson, H. R.; Schigel, D.; Tedersoo, L.; Larsson, K.-H.; May, T. W.; Taylor, A. F. S.; Jeppesen, T. S.; Frøslev, T. G.; Lindahl, B. D.; Põldmaa, K.; Saar, I.; Suija, A.; Savchenko, A.; Yatsiuk, I.; Adojaan, K.; Ivanov, F.; Piirmann, T.; Pöhönen, R.; Zirk, A.; Abarenkov, K. The Taxon Hypothesis Paradigm—On the Unambiguous Detection and Communication of Taxa. Microorganisms 2020, 8, 1910. [Google Scholar] [CrossRef] [PubMed]
- Higgins, K. L.; Arnold, A. E.; Miadlikowska, J.; Sarvate, S. D.; Lutzoni, F. Phylogenetic relationships, host affinity, and geographic structure of boreal and arctic endophytes from three major plant lineages. Mol. Phylogenet. Evol. 2007, 42, 543–555. [Google Scholar] [CrossRef] [PubMed]
- Saitou, N.; Nei, M. The neighbor-joining method: a new method for reconstructing phylogenetic trees. Mol. Biol. Evol. 1987, 4, 406–425. [Google Scholar] [CrossRef] [PubMed]
- Stecher, G.; Suleski, M.; Tao, Q.; Tamura, K.; Kumar, S. MEGA 12.1: Cross-Platform Release for macOS and Linux Operating Systems. J. Mol. Evol. 2025. [Google Scholar] [CrossRef] [PubMed]
- Tamura, K.; Nei, M.; Kumar, S. Prospects for inferring very large phylogenies by using the neighbor-joining method. Proc. Natl. Acad. Sci. USA 2004, 101, 11030–11035. [Google Scholar] [CrossRef] [PubMed]
- Johnson, J. M.; Sherameti, I.; Nongbri, P. L.; Oelmüller, R. Standardized Conditions to Study Beneficial and Nonbeneficial Traits in the Piriformospora indica/Arabidopsis thaliana Interaction. In Piriformospora indica: Sebacinales and Their Biotechnological Applications; Varma, A., Kost, G., Oelmüller, R., Eds.; Springer Berlin Heidelberg: Berlin, Heidelberg, 2013; pp. 325–343. [Google Scholar]
- Oñate-Sánchez, L.; Vicente-Carbajosa, J. DNA-free RNA isolation protocols for Arabidopsis thaliana, including seeds and siliques. BMC Res. Notes 2008, 1, 93. [Google Scholar] [CrossRef] [PubMed]
- Kim, D.; Paggi, J. M.; Park, C.; Bennett, C.; Salzberg, S. L. Graph-based genome alignment and genotyping with HISAT2 and HISAT-genotype. Nat. Biotechnol. 2019, 37, 907–915. [Google Scholar] [CrossRef] [PubMed]
- Pertea, M.; Kim, D.; Pertea, G. M.; Leek, J. T.; Salzberg, S. L. Transcript-level expression analysis of RNA-seq experiments with HISAT, StringTie and Ballgown. Nat. Protoc. 2016, 11, 1650–1667. [Google Scholar] [CrossRef] [PubMed]
- Cassan, O.; Lèbre, S.; Martin, A. Inferring and analyzing gene regulatory networks from multi-factorial expression data: a complete and interactive suite. BMC Genom. 2021, 22, 387. [Google Scholar] [CrossRef] [PubMed]
- Ge, S. X.; Son, E. W.; Yao, R. iDEP: an integrated web application for differential expression and pathway analysis of RNA-Seq data. BMC Bioinform. 2018, 19, 534. [Google Scholar] [CrossRef] [PubMed]
- Love, M. I.; Huber, W.; Anders, S. Moderated estimation of fold change and dispersion for RNA-seq data with DESeq2. Genome Biol. 2014, 15, 550. [Google Scholar] [CrossRef] [PubMed]
- Ge, S. X.; Jung, D.; Yao, R. ShinyGO: a graphical gene-set enrichment tool for animals and plants. Bioinformatics 2020, 36, 2628–2629. [Google Scholar] [CrossRef] [PubMed]
- Metsalu, T.; Vilo, J. ClustVis: a web tool for visualizing clustering of multivariate data using Principal Component Analysis and heatmap. Nucleic Acids Res. 2015, 43, W566–70. [Google Scholar] [CrossRef] [PubMed]
- Langfelder, P.; Horvath, S. WGCNA: an R package for weighted correlation network analysis. BMC Bioinform. 2008, 9, 559. [Google Scholar] [CrossRef] [PubMed]
Figure 1.
Evolutionary relationship of 75 fungal taxa. The evolutionary relationship of the studied taxa was inferred using the Neighbor-joining method. The percentage of replicate trees in which the associated fungal taxa clustered together in the bootstrap test (10,000 replicates) are shown next to the branches. The phylogenetic tree includes 70 taxa obtained from the NCBI database and the 5 investigated isolates given in bold letters.
Figure 1.
Evolutionary relationship of 75 fungal taxa. The evolutionary relationship of the studied taxa was inferred using the Neighbor-joining method. The percentage of replicate trees in which the associated fungal taxa clustered together in the bootstrap test (10,000 replicates) are shown next to the branches. The phylogenetic tree includes 70 taxa obtained from the NCBI database and the 5 investigated isolates given in bold letters.
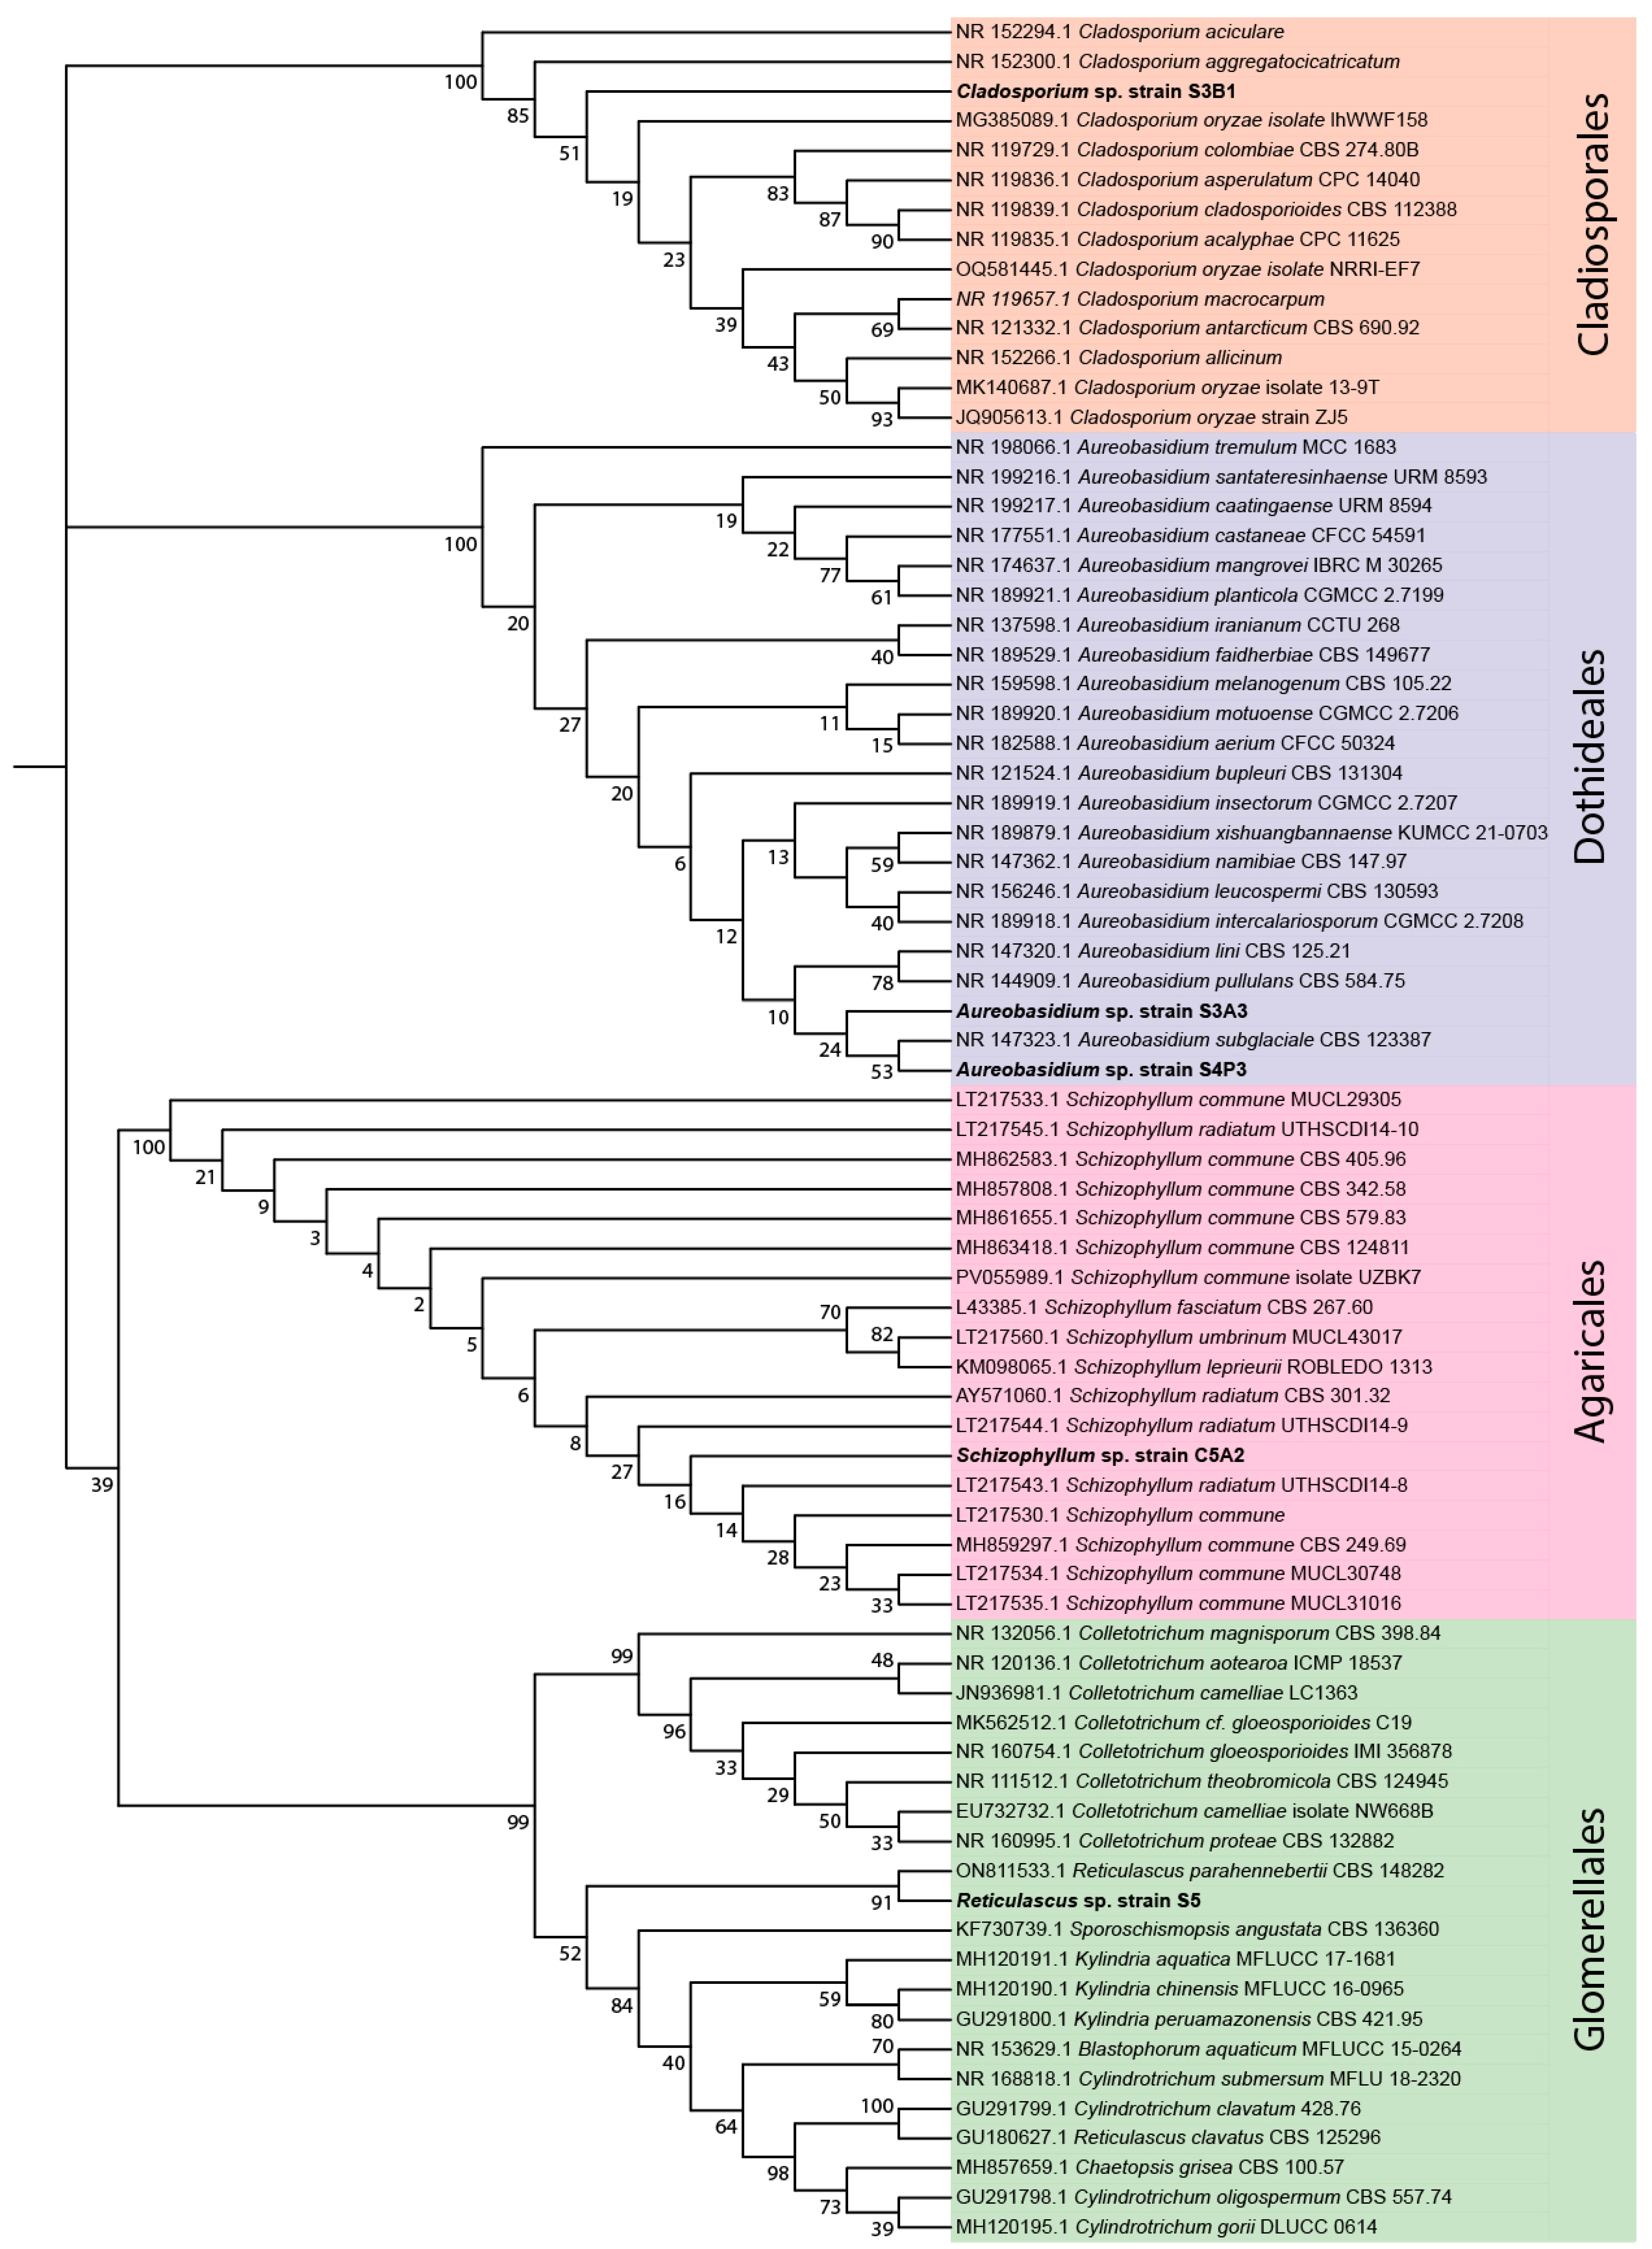
Figure 2.
Phenotypic analysis of the growth-promoting effect of Reticulascus sp. strain S5 on Arabidopsis thaliana seedlings in the presence and absence of salt stress. (A) Phenotype of Arabidopsis seedlings that were either mock-infected or inoculated with 20 μl of a solution containing 1 × 10⁵ Reticulascus sp. S5 spores ml−1 at 10 dpi. (B) Fresh and dry weight analysis for shoots and roots of mock (Control) and S5-infected (S5) plants, as well as mock (NaCl) and S5-infected (NaCl+S5) plants, respectively, on plates containing 75 mM NaCl. The box plots show the median, quartiles, and extremes of the compared datasets (n = 25). Asterisks indicate significant differences between the compared conditions. Student’s t-test: **p ≤ 0.01, ***p ≤ 0.001.
Figure 2.
Phenotypic analysis of the growth-promoting effect of Reticulascus sp. strain S5 on Arabidopsis thaliana seedlings in the presence and absence of salt stress. (A) Phenotype of Arabidopsis seedlings that were either mock-infected or inoculated with 20 μl of a solution containing 1 × 10⁵ Reticulascus sp. S5 spores ml−1 at 10 dpi. (B) Fresh and dry weight analysis for shoots and roots of mock (Control) and S5-infected (S5) plants, as well as mock (NaCl) and S5-infected (NaCl+S5) plants, respectively, on plates containing 75 mM NaCl. The box plots show the median, quartiles, and extremes of the compared datasets (n = 25). Asterisks indicate significant differences between the compared conditions. Student’s t-test: **p ≤ 0.01, ***p ≤ 0.001.
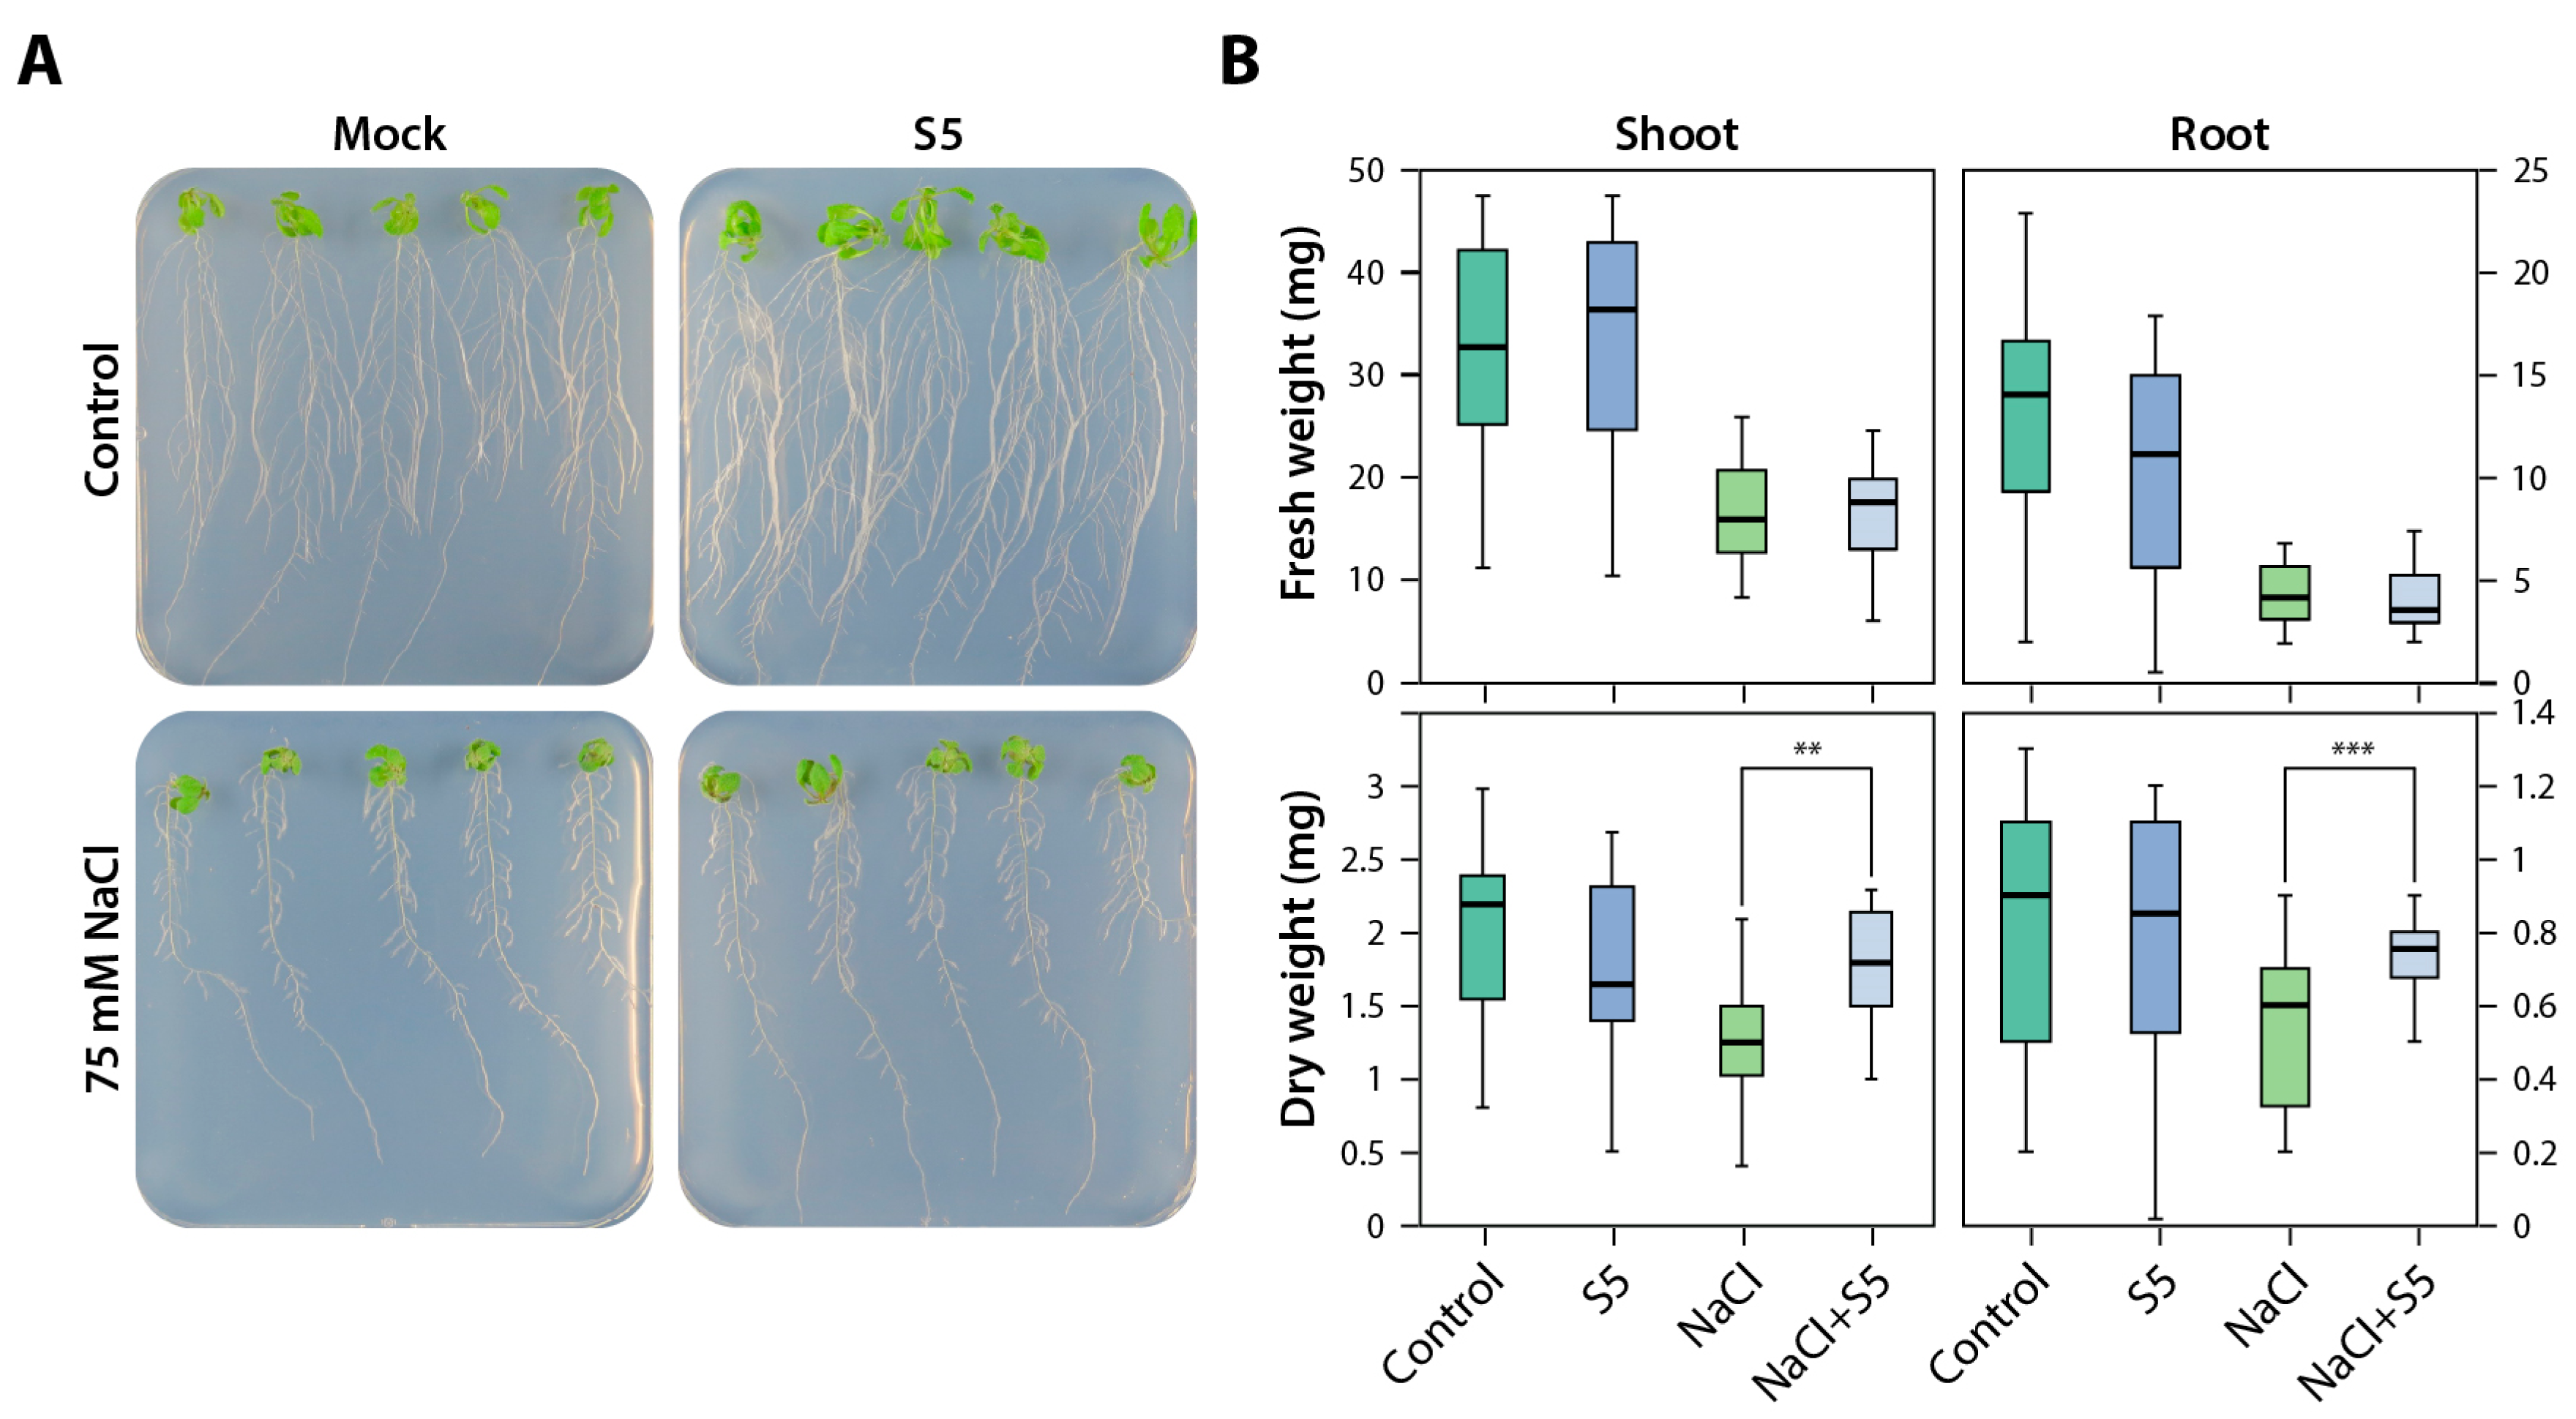
Figure 3.
Transcriptional response of Arabidopsis seedlings to Reticulascus sp. strain S5 infection and salinity stress. (A) Principal component analysis (PCA) of transcriptome-wide normalised gene expression counts in roots and shoots assessing the difference in mock (Control) and S5 (S5) infected wild-type Col-0 seedlings in the presence and absence of 75 mM NaCl in the medium (NaCl and NaCl+S5). Each different shape represents a sample; colours and symbols refer to infection status and stress condition. The x-axis denotes the PC1; y-axis denotes values for PC2. (B) Separate DEGs statistics for mock and S5-infected Col-0 root and shoot tissues in the presence or absence of 75 mM NaCl at 10 dpi. (C) Venn diagram analysis for shoot and root samples showing the number of DEGs shared between mock-infected control plants (Ctrl) and similarly grown plants under salinity stress (NaCl). A second batch of Arabidopsis seedlings was inoculated with the fungus under control conditions (S5) versus S5-inoculated plants grown under salinity stress conditions (NaCl+S5) at 10 dpi. Induced (up-regulated) and repressed (down-regulated) DEGs were separately evaluated.
Figure 3.
Transcriptional response of Arabidopsis seedlings to Reticulascus sp. strain S5 infection and salinity stress. (A) Principal component analysis (PCA) of transcriptome-wide normalised gene expression counts in roots and shoots assessing the difference in mock (Control) and S5 (S5) infected wild-type Col-0 seedlings in the presence and absence of 75 mM NaCl in the medium (NaCl and NaCl+S5). Each different shape represents a sample; colours and symbols refer to infection status and stress condition. The x-axis denotes the PC1; y-axis denotes values for PC2. (B) Separate DEGs statistics for mock and S5-infected Col-0 root and shoot tissues in the presence or absence of 75 mM NaCl at 10 dpi. (C) Venn diagram analysis for shoot and root samples showing the number of DEGs shared between mock-infected control plants (Ctrl) and similarly grown plants under salinity stress (NaCl). A second batch of Arabidopsis seedlings was inoculated with the fungus under control conditions (S5) versus S5-inoculated plants grown under salinity stress conditions (NaCl+S5) at 10 dpi. Induced (up-regulated) and repressed (down-regulated) DEGs were separately evaluated.
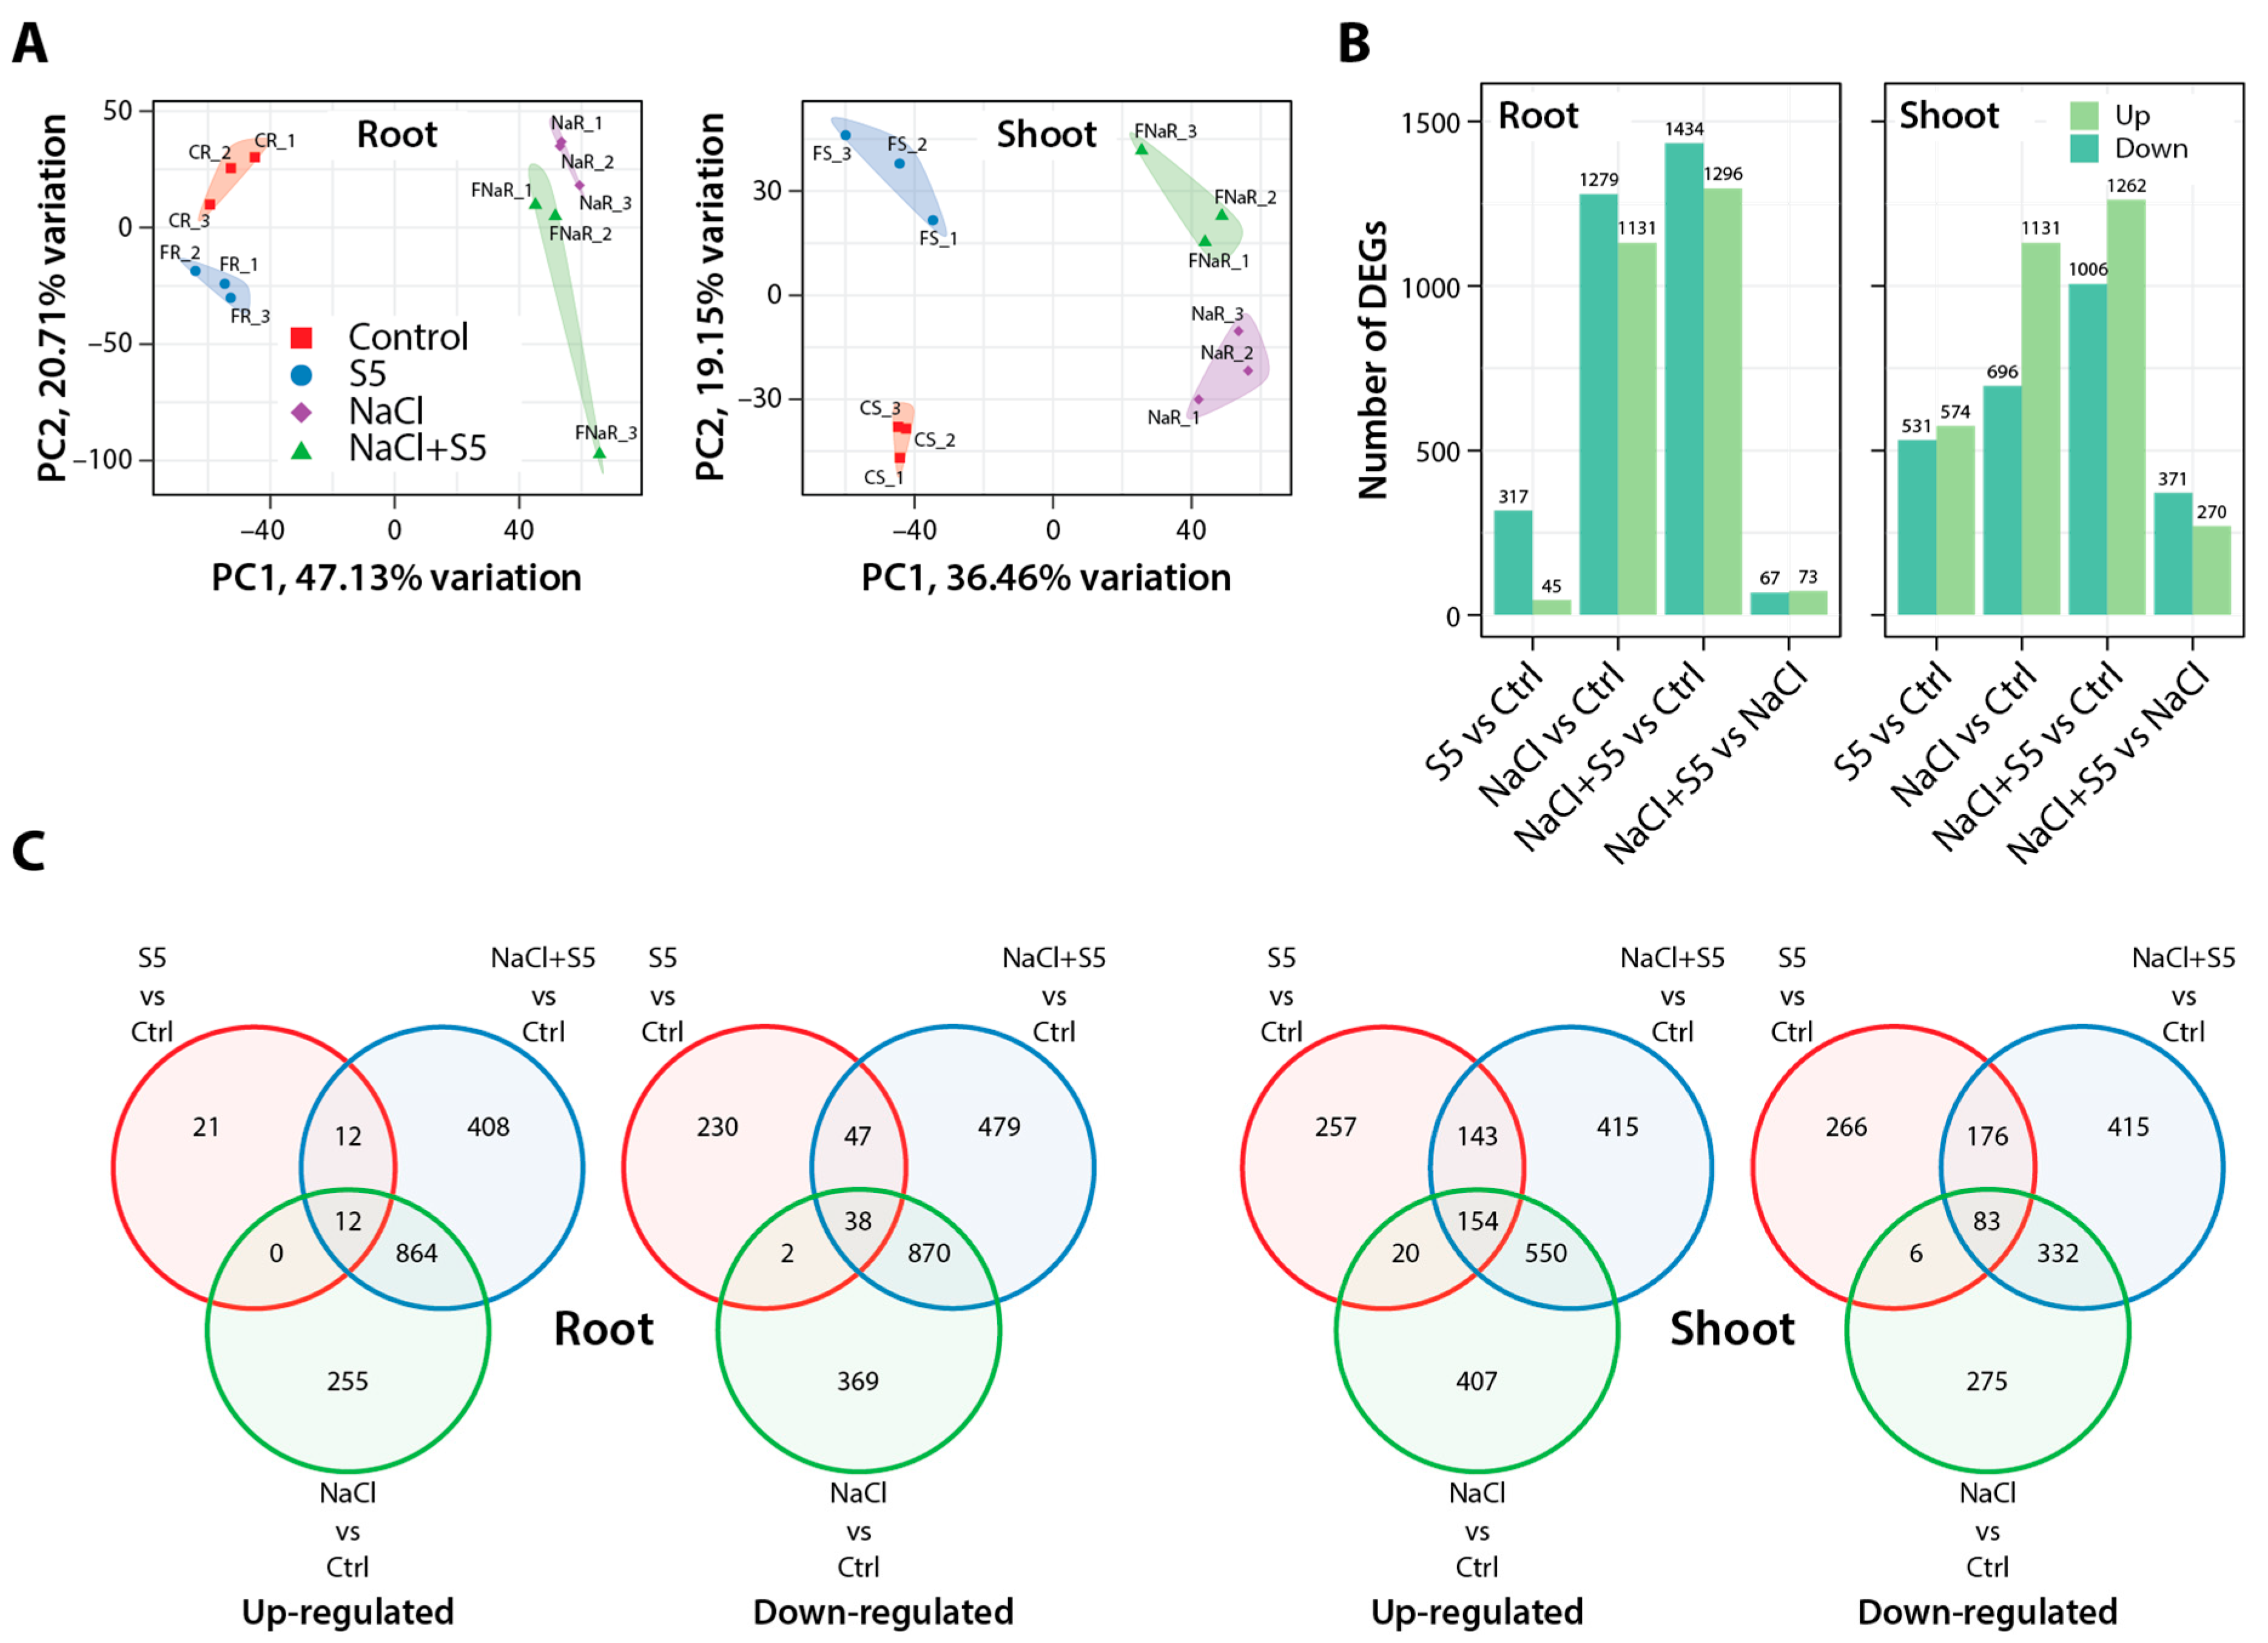
Figure 4.
Gene enrichment analysis of Arabidopsis roots and shoots responding to an infection with Reticulascus sp. strain S5 and salinity stress. (A) GO enrichment analysis of the 230 repressed DEGs in the S5 versus Ctrl comparison (left), the 479 genes exclusively repressed in the NaCl+S5 versus Ctrl comparison (right), and the 85 genes in the intersections of the two previous groups in root samples. GO enrichment analysis of the induced (B) and repressed genes (C) in the corresponding groups (S5 versus Ctrl, intersections between S5 versus Ctrl and NaCl+ S5 versus Ctrl, NaCl+S5 versus Ctrl, from left to right) in shoot samples. Each circle in the figure represents a distinct GO term. The circle size indicates the number of genes enriched in the corresponding GO term. The significance of the observed gene enrichment is represented by a colour gradient referring to the -log10(FDR) value.
Figure 4.
Gene enrichment analysis of Arabidopsis roots and shoots responding to an infection with Reticulascus sp. strain S5 and salinity stress. (A) GO enrichment analysis of the 230 repressed DEGs in the S5 versus Ctrl comparison (left), the 479 genes exclusively repressed in the NaCl+S5 versus Ctrl comparison (right), and the 85 genes in the intersections of the two previous groups in root samples. GO enrichment analysis of the induced (B) and repressed genes (C) in the corresponding groups (S5 versus Ctrl, intersections between S5 versus Ctrl and NaCl+ S5 versus Ctrl, NaCl+S5 versus Ctrl, from left to right) in shoot samples. Each circle in the figure represents a distinct GO term. The circle size indicates the number of genes enriched in the corresponding GO term. The significance of the observed gene enrichment is represented by a colour gradient referring to the -log10(FDR) value.
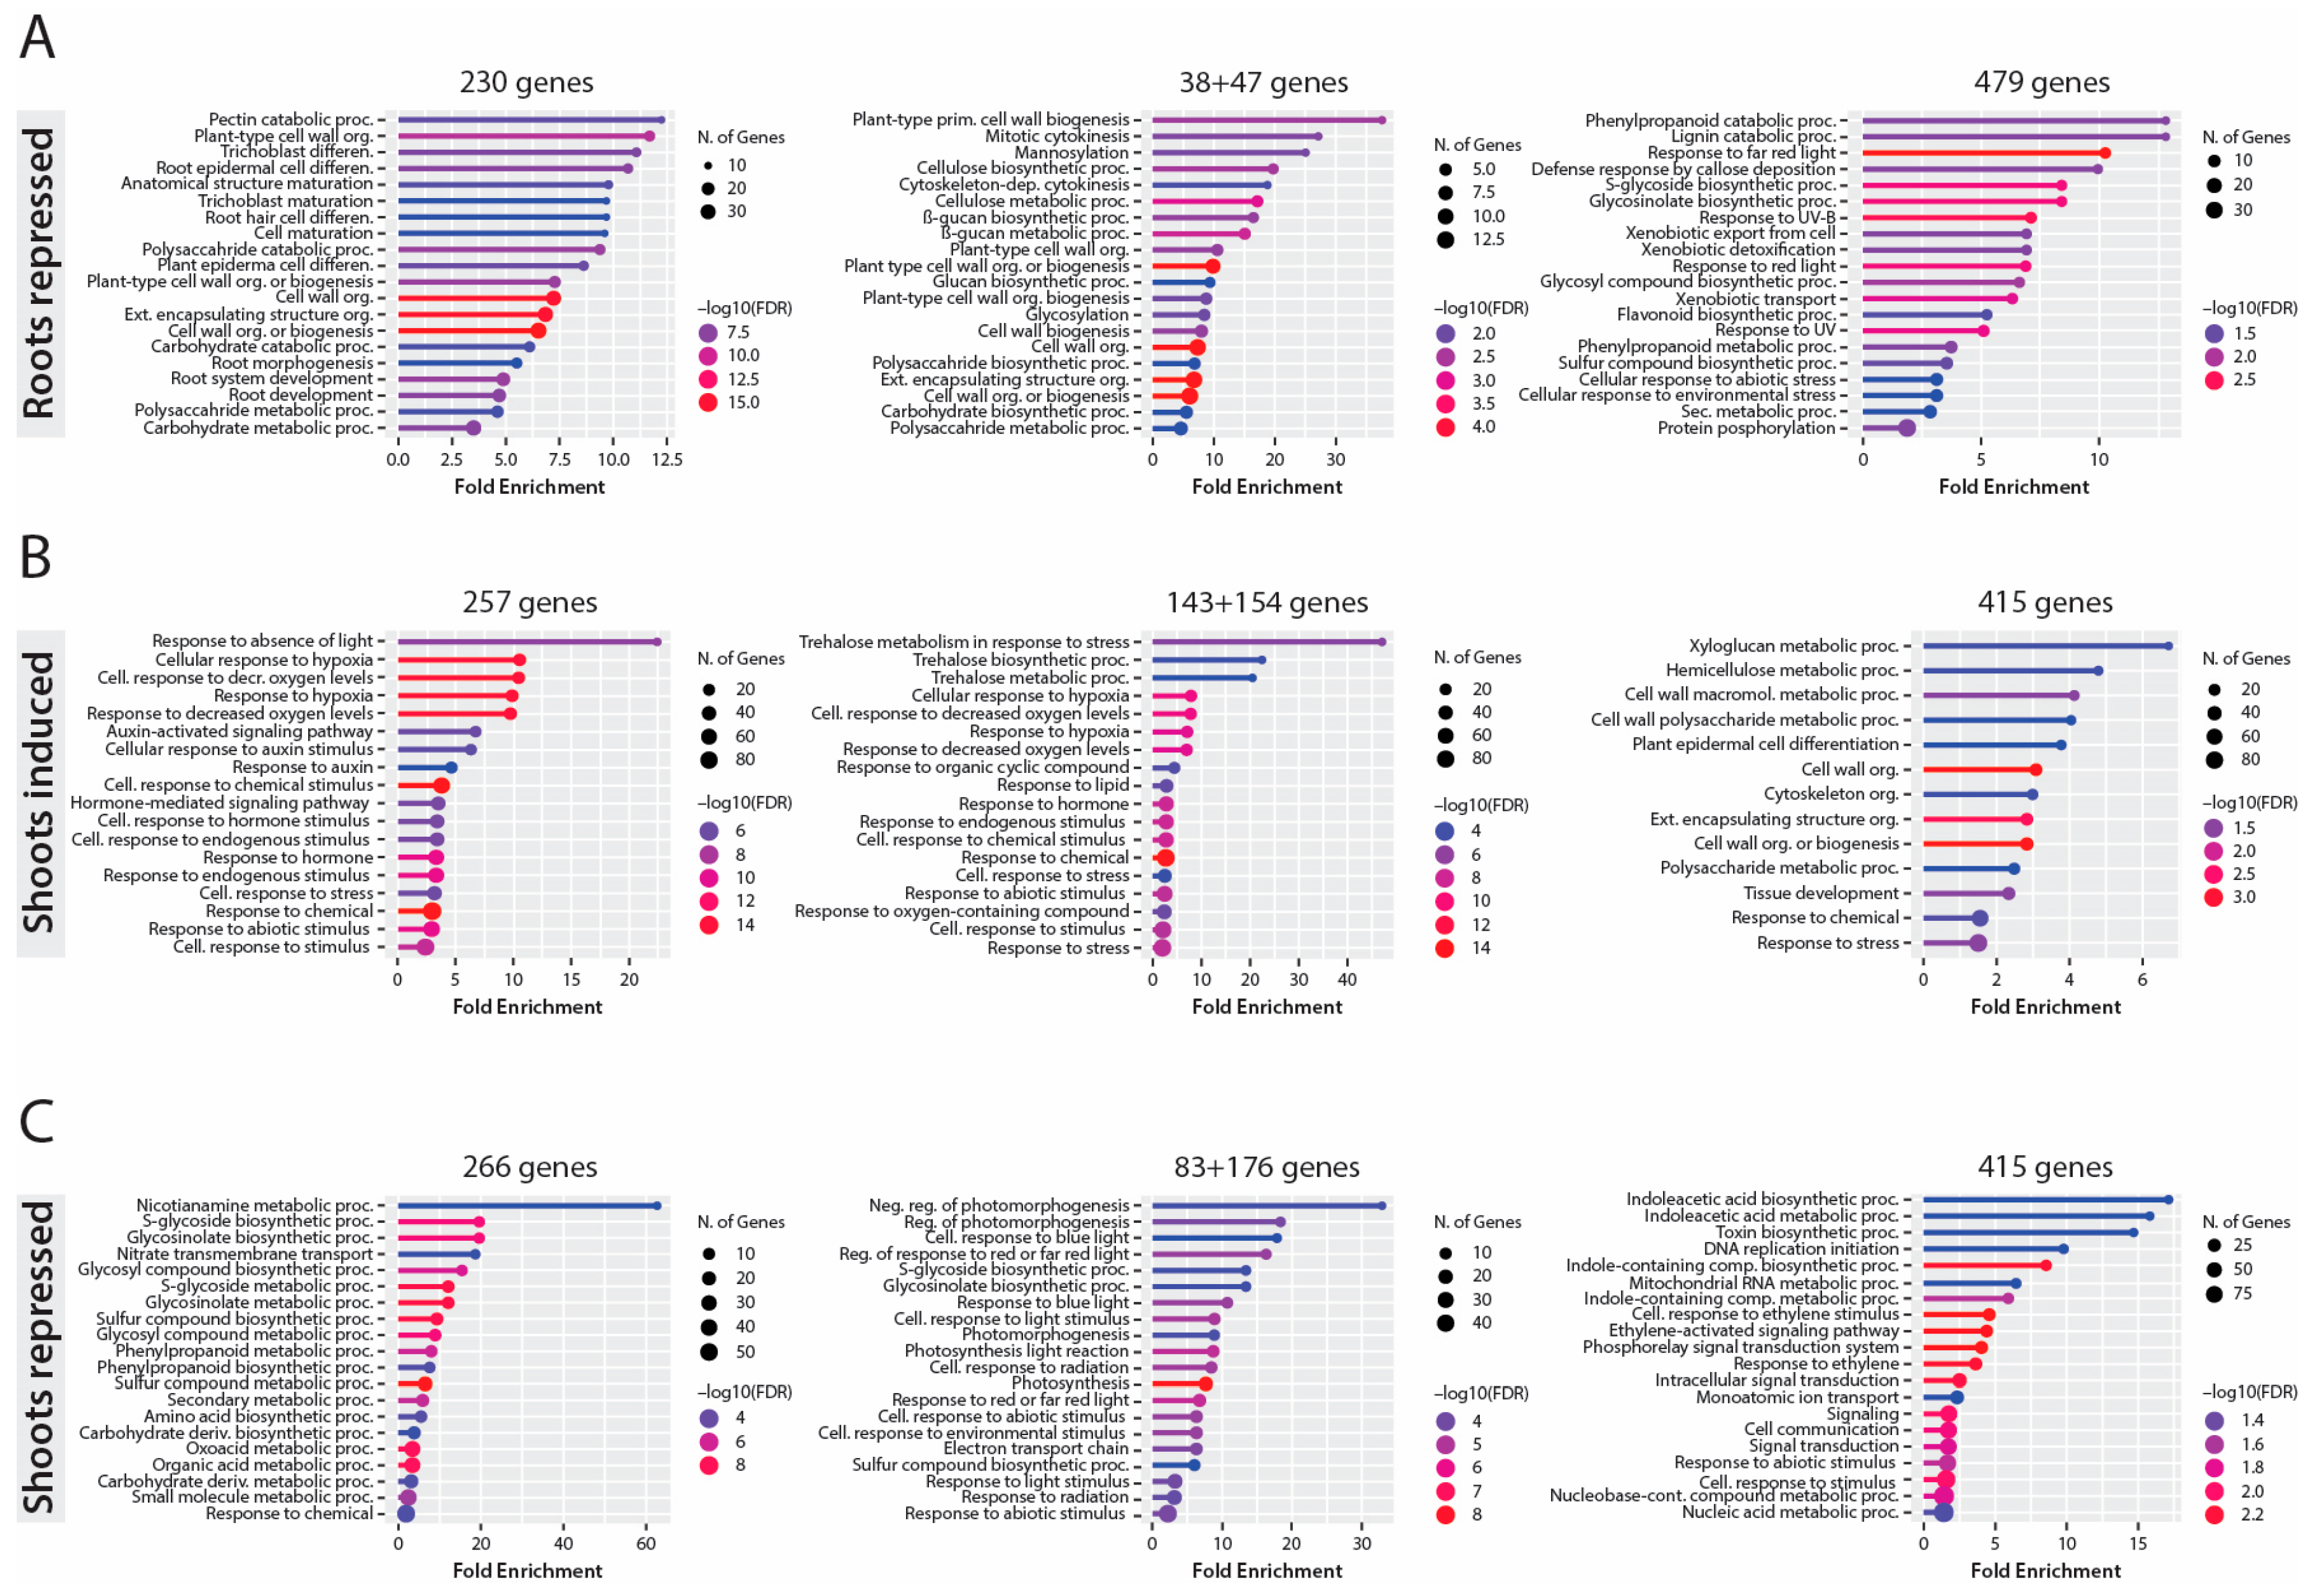
Figure 5.
Comparative analysis of the transcriptomic effects of infections by Reticulascus sp. strain S5 and Fusarium sp. strain K-23 on Arabidopsis roots. (A) Venn diagram showing the numbers of DEGs induced (up) and repressed (down) in S5- and K-23 infected Arabidopsis roots, respectively, under control conditions. (B) GO enrichment analysis of the 120 DEGs in the intersection of repressed genes in S5-infected plant roots and induced genes in K-23-infected plant roots. Each circle in the figure represents a distinct GO term. The circle size indicates the number of genes enriched in the corresponding GO term. The significance of the observed gene enrichment is represented by a colour gradient referring to the -log10(FDR) value. (C) Representative images of root hairs from Arabidopsis control seedlings (Col-0) grown for 7 days on 0.5 × MS and another 7 days on PNM minimal medium, and similarly grown seedings infected.
Figure 5.
Comparative analysis of the transcriptomic effects of infections by Reticulascus sp. strain S5 and Fusarium sp. strain K-23 on Arabidopsis roots. (A) Venn diagram showing the numbers of DEGs induced (up) and repressed (down) in S5- and K-23 infected Arabidopsis roots, respectively, under control conditions. (B) GO enrichment analysis of the 120 DEGs in the intersection of repressed genes in S5-infected plant roots and induced genes in K-23-infected plant roots. Each circle in the figure represents a distinct GO term. The circle size indicates the number of genes enriched in the corresponding GO term. The significance of the observed gene enrichment is represented by a colour gradient referring to the -log10(FDR) value. (C) Representative images of root hairs from Arabidopsis control seedlings (Col-0) grown for 7 days on 0.5 × MS and another 7 days on PNM minimal medium, and similarly grown seedings infected.
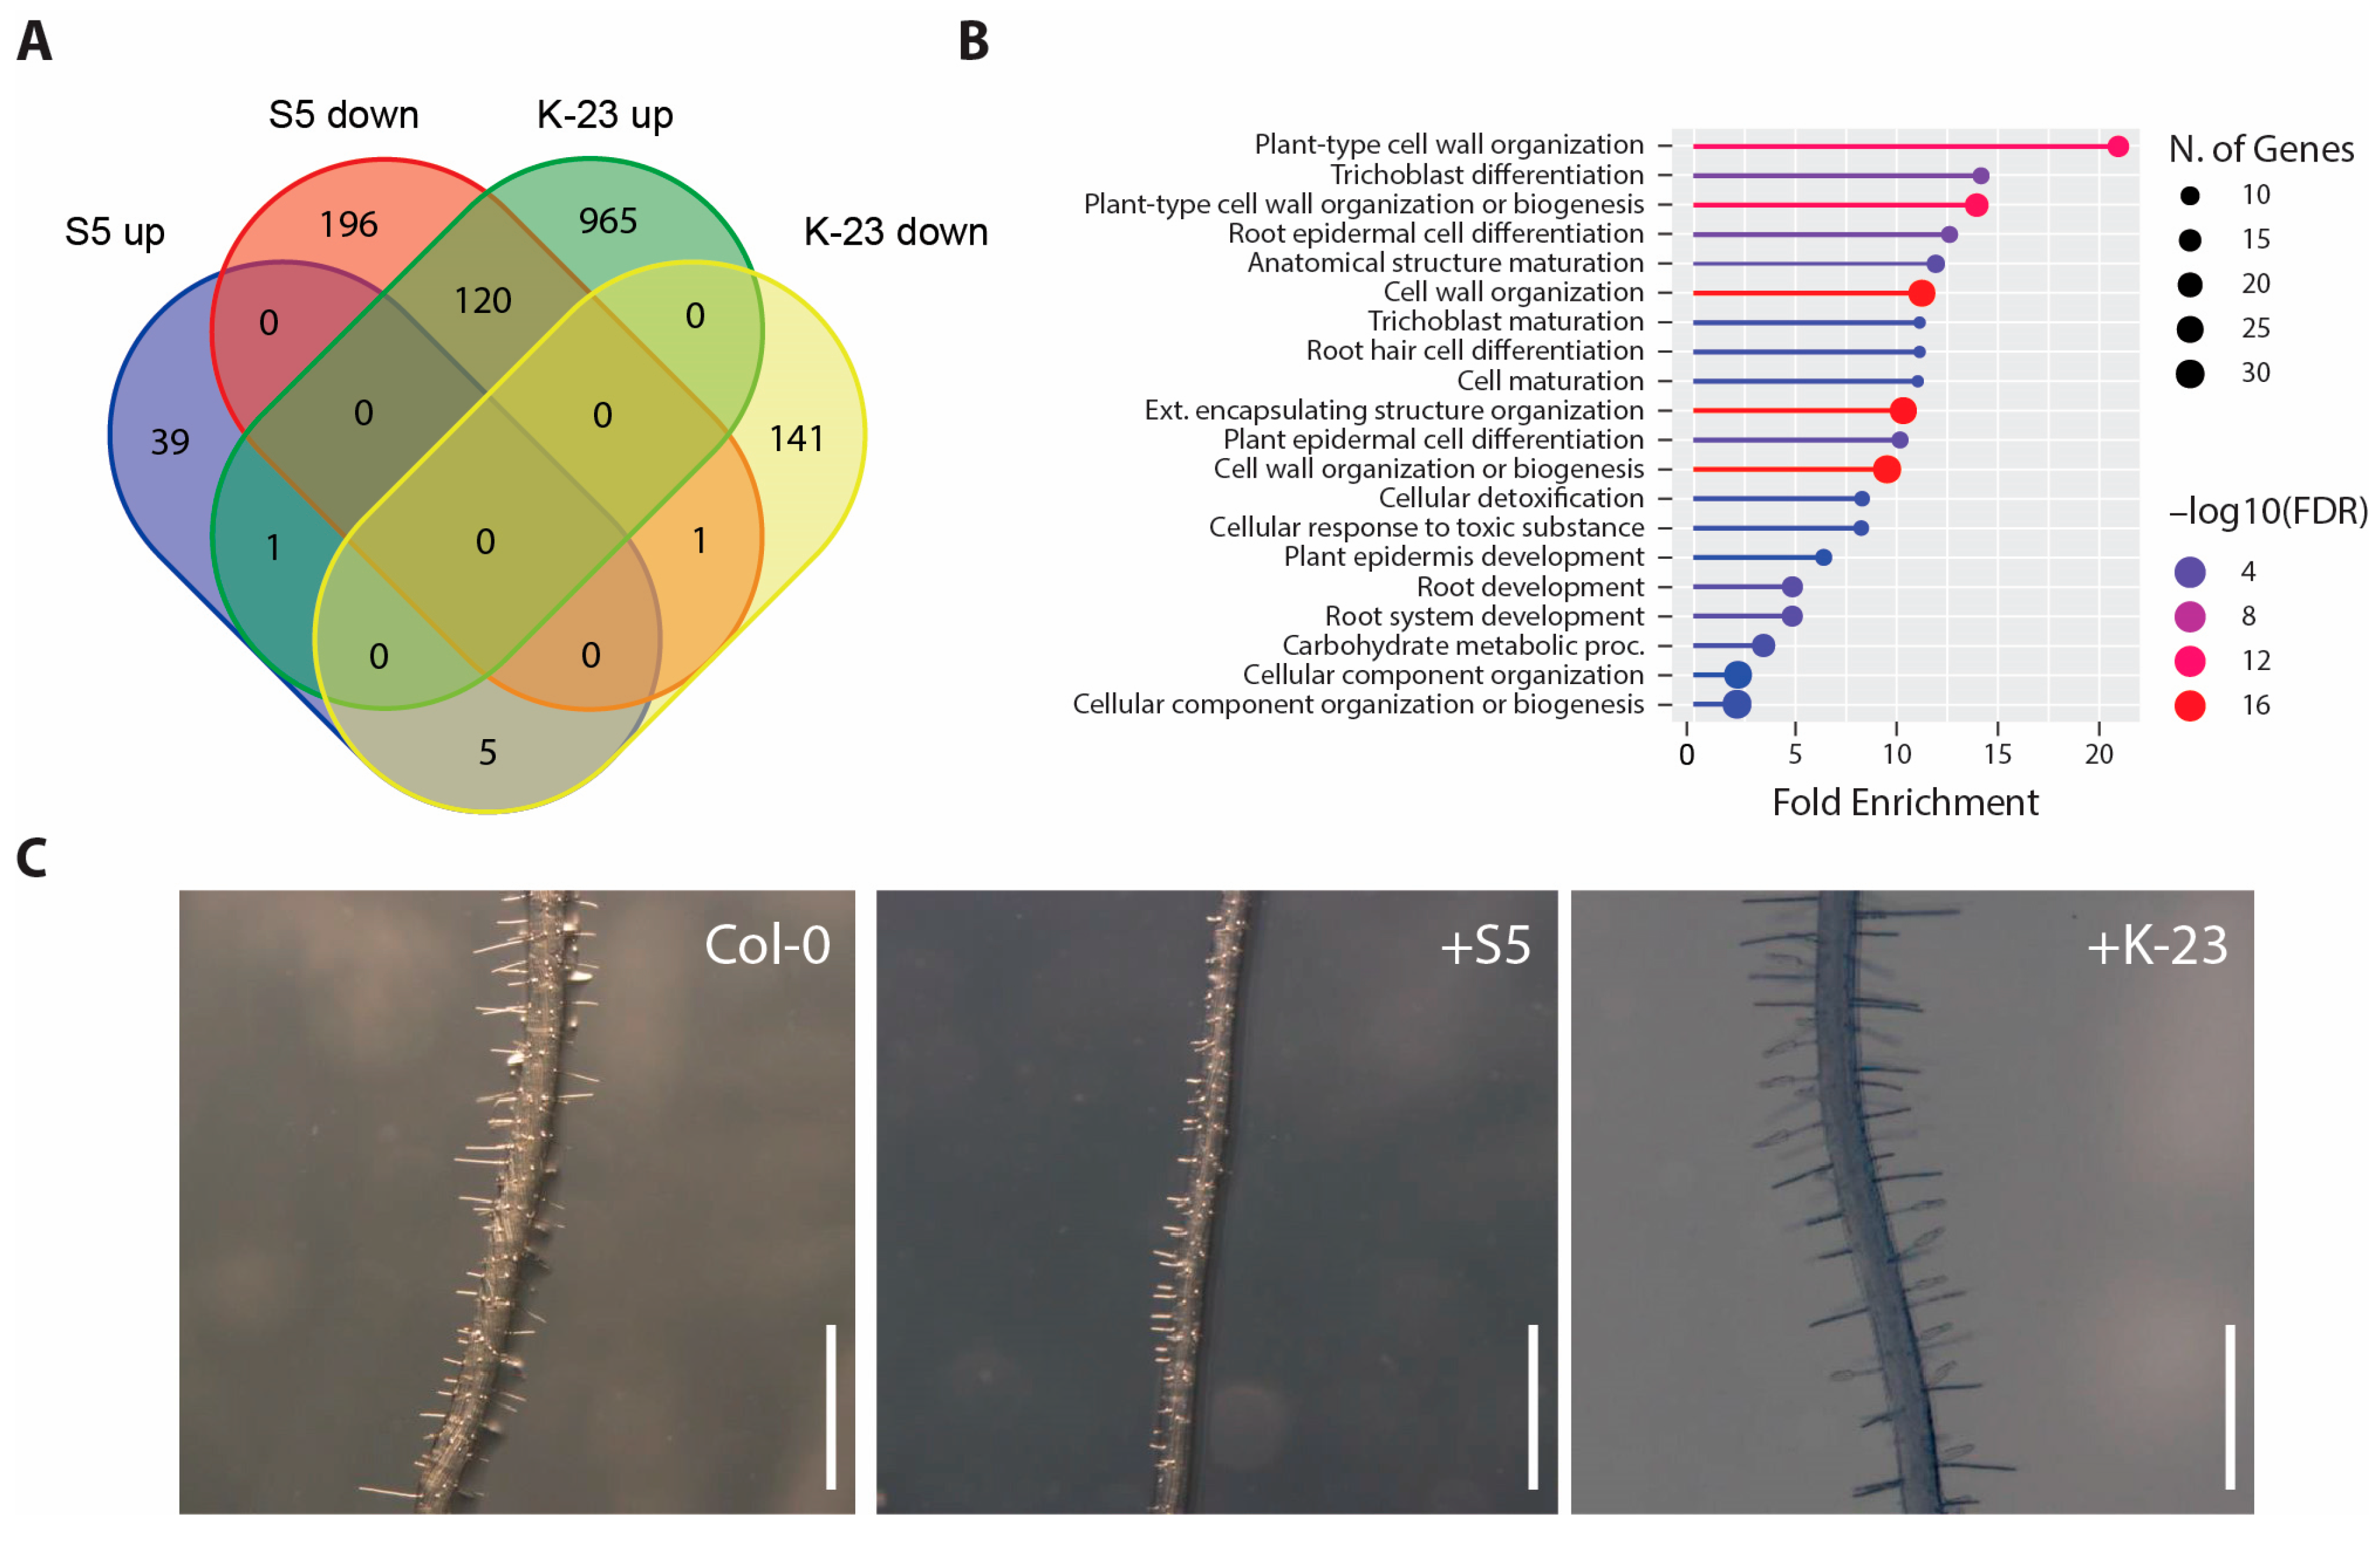
Figure 6.
Phenotypic and transcriptomics analysis of the growth-promoting effects of Fusarium sp. K-23 and Reticulascus sp. S5-infections on Arabidopsis shoots under control and salt stress conditions. (A) Shoot dry weights of Arabidopsis plants grown under distinct conditions. The bar plots show means ± their standard error of means (n = 20). Two-way ANOVA with a post hoc Tukey–Kramer test was used. Different letters indicate significant differences between means (p ≤ 0.05). (B) Hierarchical clustering heatmap of normalized read counts of 55 genes related with auxin-involving biological processes in mock-infected control plants (Mock), K-23-infected plants (+K-23) and S5-infected plants (+S5) in the absence (Control) and presence of 75 mM NaCl (Salt). (C) Venn diagram analysis for shoot samples showing the number of DEGs shared between K-23-infected and S5-infected plants grown under salt stress conditions at 10 days post infection. Induced (up-regulated) and repressed (down-regulated) DEGs were separately evaluated. (D) GO enrichment analysis of the 118 induced DEGs in the K-23 versus S5 comparison in shoots of Arabidopsis plants grown under salt stress. Each circle in the figure represents a distinct GO term. The circle size indicates the number of genes enriched in the corresponding GO term. The significance of the observed gene enrichment is represented by a colour gradient referring to the -log10(FDR) value. (E) Functional network analysis of the identified 118 DEGs shared between in shoots of K-23 and S5-infected plants grown under salinity stress conditions. The colour of the ring portions around the spheres indicated the GO terms to which the different genes are associated.
Figure 6.
Phenotypic and transcriptomics analysis of the growth-promoting effects of Fusarium sp. K-23 and Reticulascus sp. S5-infections on Arabidopsis shoots under control and salt stress conditions. (A) Shoot dry weights of Arabidopsis plants grown under distinct conditions. The bar plots show means ± their standard error of means (n = 20). Two-way ANOVA with a post hoc Tukey–Kramer test was used. Different letters indicate significant differences between means (p ≤ 0.05). (B) Hierarchical clustering heatmap of normalized read counts of 55 genes related with auxin-involving biological processes in mock-infected control plants (Mock), K-23-infected plants (+K-23) and S5-infected plants (+S5) in the absence (Control) and presence of 75 mM NaCl (Salt). (C) Venn diagram analysis for shoot samples showing the number of DEGs shared between K-23-infected and S5-infected plants grown under salt stress conditions at 10 days post infection. Induced (up-regulated) and repressed (down-regulated) DEGs were separately evaluated. (D) GO enrichment analysis of the 118 induced DEGs in the K-23 versus S5 comparison in shoots of Arabidopsis plants grown under salt stress. Each circle in the figure represents a distinct GO term. The circle size indicates the number of genes enriched in the corresponding GO term. The significance of the observed gene enrichment is represented by a colour gradient referring to the -log10(FDR) value. (E) Functional network analysis of the identified 118 DEGs shared between in shoots of K-23 and S5-infected plants grown under salinity stress conditions. The colour of the ring portions around the spheres indicated the GO terms to which the different genes are associated.
Disclaimer/Publisher’s Note: The statements, opinions and data contained in all publications are solely those of the individual author(s) and contributor(s) and not of MDPI and/or the editor(s). MDPI and/or the editor(s) disclaim responsibility for any injury to people or property resulting from any ideas, methods, instructions or products referred to in the content. |
© 2026 by the authors. Licensee MDPI, Basel, Switzerland. This article is an open access article distributed under the terms and conditions of the Creative Commons Attribution (CC BY) license (http://creativecommons.org/licenses/by/4.0/).
Copyright: This open access article is published under a Creative Commons CC BY 4.0 license, which permit the free download, distribution, and reuse, provided that the author and preprint are cited in any reuse.


