

Submitted:
24 June 2026
Posted:
25 June 2026
You are already at the latest version
Abstract
Quality risks in digitalized equipment manufacturing processes are increasingly characterized by multi-source coupling, chain-like transmission, and latent evolution, making it difficult for single-method approaches alone to fully reveal their transmission mechanisms and key driving factors. This study proposes a mixed-methods framework integrating grounded theory, covariance-based structural equation modeling (CB-SEM), and XGBoost-SHAP. First, grounded theory was applied to in-depth interview data to develop a five-dimensional quality risk framework covering process design and transformation, data flow and collaboration, production execution and process control, quality inspection and data traceability, and personnel capability matching. Second, based on 420 valid questionnaire responses, CB-SEM was used to validate the chain transmission path of risks along “process design–data collaboration–production execution–inspection and traceability” and to reveal the pervasive effect of personnel capability matching risk, with indirect effects accounting for 43.5%. Finally, the XGBoost-SHAP framework was introduced to capture nonlinear and item-level effects, identifying key risk drivers such as the absence of pre-job certification, underlying control failures, and distorted simulation boundary conditions. By integrating qualitative construction, linear validation, and nonlinear attribution, this study provides cross-method evidence for identifying the driving factors and transmission mechanisms of quality risks in equipment digital manufacturing processes. The findings deepen the understanding of how quality risks are formed and transmitted across equipment digital manufacturing processes and provide decision support for agile and targeted digital quality control in equipment manufacturing enterprises.
Keywords:
digitalized equipment manufacturing
; quality risks
; grounded theory
; structural equation modeling
; XGBoost-SHAP
; mixed methods
1. Introduction
With the rapid advancement of Industry 4.0 and intelligent manufacturing, the manufacturing paradigm of complex equipment in sectors such as aerospace, rail transportation, and defense systems is accelerating its transition toward digitalization, networking, and intelligence [1,2,3]. Digitalized equipment manufacturing, supported by key technologies such as Model-Based Definition (MBD), Manufacturing Execution Systems (MES), and the Industrial Internet of Things (IIoT), enables lifecycle data integration across product design, process planning, production execution, and quality inspection through the Digital Thread [4,5,6]. While this paradigm improves system flexibility and machining precision, it also profoundly reshapes the sources, transmission paths, and evolutionary patterns of quality risks. Quality risks are thus shifting from physical-entity deviations toward systemic and latent risks driven by data discontinuities, algorithmic distortion, cross-domain collaboration failures, and human–machine interaction deviations [7,8]. Complex equipment is typically characterized by deep structural hierarchies, strong functional coupling, and lengthy manufacturing processes. As a result, even minor deviations in any link of the digital chain may cascade and amplify along the Digital Thread, eventually leading to batch quality incidents or even systemic failures [9,10]. Therefore, systematically identifying the driving factors of quality risks in digitalized equipment manufacturing processes, revealing the transmission and coupling relationships among risk elements, and pinpointing the key factors affecting quality performance loss have become critical scientific issues for high-end equipment manufacturers seeking to achieve precise process quality control and improve product reliability.
Extensive studies have been conducted on manufacturing quality risk identification and evaluation. Traditional quality management research has mainly relied on methods such as statistical process control, Six Sigma, total quality management, quality function deployment, and process capability analysis to systematically examine quality fluctuations, defect formation mechanisms, and process stability [11,12,13]. Methods such as failure mode and effects analysis, analytic hierarchy process, fuzzy comprehensive evaluation, grey relational analysis, fault tree analysis, Bayesian networks, and evidential reasoning have also been widely applied to risk identification, failure prioritization, and key factor evaluation [14,15,16,17,18,19]. These methods provide effective tools for risk scenarios with clear structures and sufficient expert knowledge. However, in digitalized manufacturing contexts characterized by high cross-system coupling and multi-source heterogeneous data, their ability to characterize complex interactions among risk elements and dynamic cross-stage risk transmission remains limited. In recent years, with the development of industrial big data and artificial intelligence, data-driven quality prediction and anomaly detection have become important research topics. Techniques such as random forests, support vector machines, gradient boosting trees, deep neural networks, and digital twins have been widely applied to equipment condition monitoring, defect identification, and quality prediction [20,21,22,23,24]. Nevertheless, such studies often focus primarily on predictive performance, while paying insufficient attention to the theoretical interpretation, causal mechanisms, and managerial implications of risk factors. For multidimensional and multi-stage coupled quality risks in digitalized equipment manufacturing, relying solely on “black-box” predictive models makes it difficult to fully reveal the endogenous driving mechanisms.
From the perspective of quality risk identification across the full process of digitalized manufacturing, three major research gaps remain. First, at the level of dimensional construction, a unified and systematic theoretical framework for quality risks in digitalized manufacturing has not yet been established. Most existing studies focus on risk assessment, quality prediction, or control strategy optimization, while insufficient attention has been paid to the front-end identification, category refinement, and systematic construction of risk-driving factors. As a result, they are unable to comprehensively capture emerging risk elements in digitalized manufacturing environments. Second, at the level of transmission mechanisms, the transmission paths and evolutionary mechanisms of quality risks in digitalized manufacturing remain insufficiently understood. Existing studies usually treat risk factors as static and isolated variables, overlooking the chain-like transmission, cross-domain amplification, and system-wide penetration characteristics in digitalized manufacturing, such as “upstream design defects → downstream data deviations → on-site execution errors → inspection and traceability failures.” Consequently, they struggle to explain the dynamic evolution of risks in real manufacturing scenarios. Third, at the methodological level, single-method approaches have inherent explanatory limitations. Covariance-based structural equation modeling (CB-SEM) can effectively test theory-driven linear relationships and hypotheses, but it is limited in capturing nonlinear interactions among micro-level elements [25]. Machine learning models have strong predictive capabilities, but they often suffer from limited interpretability and lack sufficient mechanism-based support [26,27]. At present, mixed-methods frameworks that integrate qualitative exploration, mechanism validation, and nonlinear key factor mining remain relatively scarce in the field of quality risk identification in digitalized manufacturing.
To address these research gaps, this study focuses on three key issues: the identification of risk dimensions, the elucidation of transmission mechanisms, and the mining of key driving factors in quality risks within digitalized equipment manufacturing processes. Accordingly, a mixed-methods framework integrating grounded theory, covariance-based structural equation modeling (CB-SEM), and XGBoost-SHAP is developed. Specifically, first, based on in-depth interview data, grounded theory and three-stage coding are employed to extract a quality risk dimensional system tailored to digitalized manufacturing contexts. Second, a theoretical model is constructed based on the qualitative findings, and questionnaire data and CB-SEM are used to test the chain-like transmission paths among risk dimensions and their linear effects on quality performance loss. Finally, XGBoost-SHAP is introduced to address the limitations of linear models, identify core risk-driving factors at the micro-item level, and reveal their nonlinear effects.
The main contributions of this study are threefold. First, in terms of theoretical construction, this study develops a five-dimensional quality risk system for digitalized equipment manufacturing processes based on first-hand empirical data, covering process design and transformation, data flow and collaboration, production execution and process control, quality inspection and data traceability, and personnel capability matching. This extends the theoretical boundary of quality risk management research in digitalized manufacturing contexts. Second, regarding transmission mechanisms, this study empirically validates the chain-like transmission path of quality risks along “process design–data collaboration–production execution–inspection and traceability” and reveals the system-wide penetration and amplification effects of personnel capability matching risks throughout the entire process. Third, in terms of methodological innovation, this study proposes a mixed-methods paradigm of “qualitative identification–mechanism validation–key factor mining.” By combining the macro-level path interpretation capability of CB-SEM with the micro-level feature attribution capability of XGBoost-SHAP, the proposed framework achieves cross-method triangulation and hierarchical complementarity in explanatory granularity, thereby providing a transferable methodological reference for risk identification research in complex manufacturing systems.
The remainder of this paper is organized as follows. Section 2 introduces the data sources and core methods. Section 3 presents the grounded theory coding results and research hypotheses. Section 4 reports the empirical analysis results. Section 5 discusses the main findings, theoretical contributions, and managerial implications. Section 6 concludes the paper.
2. Methodology
To systematically identify the driving factors of quality risks in digitalized equipment manufacturing processes, this study adopts a mixed-methods research design of “qualitative exploration–quantitative validation–key factor mining” by integrating grounded theory, CB-SEM, and the XGBoost-SHAP explainable machine learning approach. First, quality risk dimensions in digitalized equipment manufacturing are extracted based on semi-structured interviews and grounded theory coding. Next, measurement and structural models are developed using questionnaire data, and CB-SEM is employed to examine the influence paths of risk dimensions on overall quality performance loss. Finally, XGBoost-SHAP is used to identify key risk factors at the item level and evaluate their nonlinear predictive contributions. The overall technical route of this study is shown in Figure 1.
The three methods play complementary roles in this study. Grounded theory is used to inductively derive quality risk dimensions from practical contexts, thereby addressing the source and construction of the variable system. CB-SEM is used to test the theoretical path relationships among latent variables, thereby examining whether and how different risk dimensions significantly affect overall quality performance loss. XGBoost-SHAP is used to identify key risk factors and their predictive contributions at the item level, thus capturing the nonlinear and interaction effects that are difficult to reveal using traditional linear path models.
2.1. Data Sources and Research Subjects
The data used in this study consist of two parts: qualitative interview data and quantitative questionnaire data. The qualitative data were mainly used to extract risk dimensions and construct the theoretical model, whereas the quantitative data were used for measurement model assessment, structural path validation, and machine learning-based analysis.
2.1.1. Qualitative Research Data
To ensure the authenticity and contextual relevance of the extracted quality risk dimensions, this study adopted a combination of purposive sampling and theoretical sampling. Typical digitalized equipment manufacturing enterprises in sectors such as aerospace, defense and military equipment, and high-end equipment manufacturing were selected as research subjects. The interviewees included frontline technical and managerial personnel from different functional positions, including process design, production execution, quality inspection, equipment operation and maintenance, and data management. All interviewees had more than three years of practical experience in digitalized manufacturing.
First-hand qualitative data were collected through semi-structured in-depth interviews. The interview protocol was designed based on the core stages of digitalized equipment manufacturing and focused on key issues such as quality problems, risk scenarios, data deviations, and human-related influences in digitalized manufacturing. The critical incident technique was used to guide interviewees in describing typical quality risk events that they had personally experienced.
A total of 24 semi-structured in-depth interviews were conducted, with each interview lasting approximately 30–60 min. After confidential information was removed, the interviews were transcribed into approximately 150,000 Chinese characters of valid textual data. Among them, 20 interview transcripts were used for open coding, axial coding, and selective coding, while the remaining four interview transcripts, which were not involved in model construction, were used for theoretical saturation testing.
2.1.2. Quantitative Research Data
To ensure that the qualitative categories could be transformed into observable variables for quantitative analysis, this study developed quantitative measurement items and designed a questionnaire based on the grounded theory coding results. The questionnaire consisted of 24 measurement items for quality risks, three measurement items for overall quality performance loss, and four items related to respondents’ basic information.
All scale items were measured using a five-point Likert scale, where 1 indicates “strongly disagree,” and 5 indicates “strongly agree.” A higher score indicates a higher perceived level of the corresponding risk or performance loss. The detailed scale development process, latent variable settings, and correspondence between latent variables and observed variables are further described in Section 3.2 in conjunction with the grounded theory coding results.
To facilitate consistent notation in the subsequent CB-SEM and XGBoost regression models, this study adopted a unified coding system for latent variables and their observed items. The specific coding rules are presented in Table 1.
The questionnaire was distributed in a targeted manner to enterprises engaged in digitalized equipment manufacturing using a combination of online and offline approaches. A total of 536 questionnaires were collected. After excluding invalid questionnaires with abnormal response patterns, excessively short completion times, and missing key information, 420 valid samples were obtained, yielding an effective response rate of 78.36%. The valid sample size meets the basic requirements for subsequent structural equation model estimation and machine learning modeling. The distribution of the basic sample information is shown in Table 2.
Given that the questionnaire data in this study were mainly derived from subjective evaluations by the same respondents, common method bias may be present. To reduce its potential influence on the research conclusions, procedural controls were implemented during the questionnaire design stage, including anonymous responses, randomized item ordering, and neutral wording. In the data analysis stage, Harman’s single-factor test was used to statistically assess common method bias. If the variance explained by the first common factor in the unrotated exploratory factor analysis is below 40%, common method bias is considered unlikely to seriously affect the research conclusions.
2.2. Core Methods and Mathematical Models
2.2.1. Grounded Theory
Grounded theory is a qualitative research method that develops theory inductively from empirical data through systematic coding procedures [28]. Its core idea is to derive concepts, categories, and theoretical frameworks from primary empirical materials, such as original interview transcripts, field observation records, and practical experience, through a systematic and standardized stepwise coding process. In this study, NVivo 12 was used to conduct three-level coding of the interview transcripts.
First, in the open coding stage, the interview transcripts were analyzed line by line to extract initial concepts related to quality risks in digitalized equipment manufacturing, while retaining the original expressions of the interviewees as much as possible. Second, in the axial coding stage, the initial concepts were integrated into a set of main categories and subcategories according to the logical relationships among risk sources, affected process stages, manifestation forms, and consequences. Finally, in the selective coding stage, the relationships among the main categories were integrated around the core category, thereby forming the dimensional structure and theoretical explanatory framework of quality risks in digitalized equipment manufacturing. To examine the stability of the coding results, four interview transcripts that were not involved in model construction were reserved for theoretical saturation testing.
2.2.2. Covariance-Based Structural Equation Modeling
Structural equation modeling can simultaneously handle the measurement relationships between latent variables and their observed indicators, as well as the structural relationships among latent variables, making it suitable for testing the influence paths of multidimensional quality risk factors on overall quality performance loss [29]. In this study, covariance-based structural equation modeling was adopted, and AMOS 29.0 was used for model estimation and hypothesis testing. The CB-SEM analysis included two components: measurement model assessment and structural model assessment. The measurement model was used to examine whether the observed items effectively reflected their corresponding latent variables, whereas the structural model was used to test the path relationships among latent variables and the proposed research hypotheses.
Before conducting confirmatory factor analysis, the Kaiser–Meyer–Olkin test and Bartlett’s test of sphericity were used to determine whether the sample data were suitable for factor analysis. Exploratory factor analysis was then performed to preliminarily examine the dimensional structure of the scale and item-to-factor allocation. Subsequently, confirmatory factor analysis was conducted to further evaluate the reliability, convergent validity, and discriminant validity of the measurement model. The measurement model was primarily assessed using standardized factor loadings, Cronbach’s α coefficients, composite reliability, and average variance extracted.
In general, standardized factor loadings, Cronbach’s α coefficients, and composite reliability values should be greater than 0.700, while the average variance extracted should exceed 0.500. If the square root of the AVE for each latent variable is greater than its correlation coefficients with other latent variables, the scale is considered to have good discriminant validity [30].
The basic form of the measurement model is expressed as follows:
wheredenotes the vector of exogenous observed variables; denotes the vector of endogenous observed variables; denotes the exogenous latent variables; denotes the endogenous latent variables; and denote the factor loading matrices of the observed variables on their corresponding latent variables; and and denote the measurement error terms.
The structural model is used to characterize the path relationships among latent variables. Its basic form is given by:
where is the path coefficient matrix among endogenous latent variables; is the path coefficient matrix from exogenous latent variables to endogenous latent variables; and denotes the structural residual term.
In this study, model parameters were estimated using the maximum likelihood (ML) method. Maximum likelihood estimation obtains optimal parameter estimates by minimizing the discrepancy between the sample covariance structure and the model-implied covariance structure. The ML fit function can be written as:
wheredenotes the sample covariance matrix;denotes the model-implied covariance matrix;denotes the number of observed variables;denotes the matrix trace; anddenotes the inverse matrix of the model-implied covariance matrix.
The goodness of fit of the structural model was evaluated using multiple categories of fit indices, including absolute fit indices, incremental fit indices, and parsimonious fit indices. Following commonly used criteria, the model fit was considered acceptable when , RMSEA and RMR were less than 0.08, and GFI, AGFI, CFI, TLI, and IFI were greater than 0.90 [31]. The path hypotheses were mainly evaluated based on standardized path coefficients, critical ratios, and significance levels. A path relationship was considered statistically significant when the absolute value of the critical ratio, C.R., was greater than 1.96 and .
Considering that the questionnaire data were measured using Likert scales and may therefore exhibit a certain degree of non-normality, this study used the bias-corrected Bootstrap method to test the indirect effects in the structural model. Compared with the traditional Sobel test, the Bootstrap method does not require the indirect effect to follow a normal distribution and is therefore more suitable for assessing the significance of mediation effects in complex path models [32]. In this study, the number of Bootstrap resamples was set to 5,000, and the significance of indirect effects was determined based on whether the bias-corrected 95% confidence interval contained zero.
To further compare the cumulative effects of different risk variables on overall quality performance loss, direct effects, indirect effects, and total effects were calculated based on the standardized effect matrix output by AMOS. Specifically, the direct effect reflects the immediate influence of a risk variable on the outcome variable; the indirect effect reflects the influence transmitted through other risk variables; and the total effect is the sum of the direct and indirect effects.
2.2.3. XGBoost Regression Model
The structural equation model can test theoretical paths among latent variables; however, it mainly focuses on linear relationships and prespecified model structures. Quality risks in digitalized equipment manufacturing are characterized by multi-factor coupling and nonlinear superposition. Therefore, relying solely on a linear path model may be insufficient to fully reveal the differences in key risks. To address this limitation, this study further employed the XGBoost regression model to characterize the nonlinear predictive relationships between quality risk items and overall quality performance loss.
The 24 quality risk items from A1 to E4 were used as input features to construct the input matrix:
wheredenotes the input feature vector of the -th sample, and denotes the score of the -th sample on the -th risk item.
Because XGBoost is a supervised learning model, it requires an observable continuous output variable. Following the common practice of using composite scores to represent the construct level of a latent variable, the average score of the three observed items of overall quality performance loss, namely Y1, Y2, and Y3, was used as the continuous output variable:
XGBoost is an ensemble learning model based on the gradient boosting framework [33]. Its basic idea is to improve predictive performance by sequentially adding multiple regression trees. The model output is expressed as:
where denotes the predicted value of overall quality performance loss for the -th sample, denotes the number of regression trees, denotes the -th regression tree, and denotes the function space of all possible regression trees. To control model complexity and reduce the risk of overfitting, XGBoost introduces a regularization term into the objective function:
where
The loss function denotes the discrepancy between the observed and predicted values; controls the penalty on the number of leaf nodes; is the L2 regularization coefficient; is the L1 regularization coefficient; denotes the number of leaf nodes; and represents the weight of the -th leaf node.
The samples were randomly split into a training set and a test set, with 80% of the samples used for model training and hyperparameter optimization and the remaining 20% used to evaluate the model’s generalization performance. The random seed was set to 42 to ensure reproducibility. If missing values were present in the data, they were imputed using the median imputation method. To avoid data leakage, the test set was not involved in model training, missing-value imputation parameter estimation, cross-validation, or hyperparameter search.
Considering that the predictive performance of the XGBoost model is strongly affected by hyperparameters such as the number of trees, maximum depth, and learning rate, this study defined the search ranges for each hyperparameter based on empirical rules (see Table 3). To balance computational efficiency and global search capability, hyperparameter tuning was conducted using a random search strategy combined with five-fold cross-validation. Specifically, five-fold cross-validation was implemented on the training set, and 50 combinations of hyperparameters were randomly sampled from the predefined search space. Each combination was evaluated using the cross-validated root mean squared error (RMSE), and the parameter set with the lowest RMSE was selected. The final model was then refitted using the selected parameter combination on the full training set. Model performance was subsequently evaluated on both the training set and the independent test set using the coefficient of determination (), RMSE, and mean absolute error (MAE), as defined below:
where is the observed value of overall quality performance loss for the -th sample, is the corresponding predicted value, is the mean of the observed values, and is the total number of samples included in the evaluation. A value of closer to 1 indicates stronger explanatory power for the variation in overall quality performance loss, whereas lower RMSE and MAE values indicate smaller prediction errors.
2.2.4. SHAP-Based Explainability Analysis Framework
XGBoost has strong nonlinear fitting capability; however, its ensemble tree structure makes the internal decision-making process of the model difficult to interpret directly. To improve model transparency, this study introduced the SHAP method to conduct explainability analysis of the XGBoost prediction results. SHAP is based on the concept of Shapley values in cooperative game theory, in which each input feature is regarded as a “participant” in model prediction. By calculating the marginal contribution of a given feature to the model output under different feature combinations, SHAP quantifies the importance of that feature to the prediction results [34]. Compared with traditional feature-importance measures, SHAP not only provides a global importance ranking but also explains the positive or negative contribution of each feature to the predicted value for individual samples.
For a given sample , let denote the set of input features. The local SHAP value of feature can be expressed as:
where denotes the complete set of input features; denotes the total number of features; denotes an arbitrary subset of features that does not include feature ; denotes the number of features contained in subset ; denotes the predicted output for sample when only the feature subset is considered; denotes the marginal contribution of feature to the prediction result of sample after it is added to the model; and denotes the local SHAP value of feature for sample.
SHAP decomposes the prediction result of a complex model into the sum of a baseline value and the contribution values of all features:
where denotes the baseline value of the model output, that is, the expected value of the sample predictions; denotes the contribution of feature to the prediction result for sample . When , the feature increases the predicted overall quality performance loss above the baseline value; when , the feature decreases the predicted value below the baseline value.
Based on the above SHAP values, this study interpreted the XGBoost results at three levels. First, at the item level, the key risk items that contributed more strongly to the prediction of overall quality performance loss were identified using the mean absolute SHAP values. Second, at the directional level, SHAP summary plots and the color distribution of feature values were used to examine the relationship between variations in the values of different risk items and the positive or negative direction of SHAP values, thereby determining whether higher risk scores tended to increase the predicted value of overall quality performance loss. Third, at the dimension level, the global SHAP importance values at the item level were aggregated by latent risk dimension to compare the overall contributions of different risk dimensions in the nonlinear prediction model. These results were further compared with the CB-SEM path coefficients to reveal the consistency and differences between linear path effects and nonlinear predictive contributions.
At the global level, the importance of each risk item was measured using the mean absolute SHAP value:
where denotes the global SHAP importance of feature , denotes the number of samples used for SHAP interpretation, and denotes the local SHAP value of feature for the -th sample. A larger indicates a stronger average contribution of this feature to the XGBoost prediction of overall quality performance loss. Because is calculated based on , it reflects contribution magnitude rather than effect direction.
Let denote the set of items corresponding to the -th risk dimension. The total SHAP contribution of this dimension is calculated as:
The contribution share of this dimension is calculated as:
Considering that different risk dimensions contain different numbers of items, the average contribution at the dimension level is further calculated as:
where denotes the number of items included in the -th risk dimension, and denotes the total number of risk dimensions. reflects the overall predictive contribution of a given risk dimension, is used to compare the relative proportion of each risk dimension in the total predictive contribution of the model, and is used to compare the average contribution intensity of individual items after controlling for differences in the number of items across dimensions.
It should be noted that XGBoost and SHAP analyses reflect the explanatory contributions of risk items to model predictions rather than causal effects in a strict sense. Therefore, this study does not interpret SHAP importance as the strength of causal paths among variables. Instead, it is used as a methodological complement to CB-SEM-based linear path testing to identify key predictive factors at the item level, potential nonlinear influence patterns, and the relative contributions of different risk dimensions to model prediction. The CB-SEM results were mainly used to validate the theoretical hypotheses and latent-variable path relationships, whereas the XGBoost-SHAP results were primarily used to reveal the predictive contributions of key risk factors and their managerial priorities.
3. Grounded Theory Coding Results and Research Hypotheses
3.1. Grounded Theory Coding Results
3.1.1. Open Coding
With the assistance of NVivo 12 qualitative data analysis software, the original textual materials were decomposed line by line to extract initial concepts with independent meanings. Concepts with similar semantics and consistent orientations were then merged, screened, and summarized to form initial categories. After sentence-by-sentence analysis of the 20 interview transcripts, 106 valid initial concepts were extracted and further clustered into 24 initial categories. Owing to space limitations, Table 4 presents selected examples of the open coding process.
3.1.2. Axial Coding
Axial coding aims to establish relationships among different levels of categories and further synthesize the initial categories into more abstract subcategories and main categories. Through continuous comparison, semantic clustering, and logical integration of fragmented initial categories, those with similar meanings and originating from related business scenarios were grouped into 12 subcategories. These subcategories were then further aggregated, according to the full process of digitalized equipment manufacturing, into five main categories representing quality risks in digitalized equipment manufacturing processes: process design and transformation risk, data circulation and collaboration risk, production execution and process control risk, quality inspection and data traceability risk, and personnel capability matching risk. Selected results of the axial coding process are presented in Table 5.
3.1.3. Selective Coding
Through in-depth abstraction and logical relationship analysis of the five main categories and twelve subcategories, the core category was identified as “the generation and transmission mechanism of quality risks in digitalized equipment manufacturing processes.” A theoretical storyline was constructed around this core category: in digitalized equipment manufacturing processes, process design and transformation risk constitutes the source input of quality risks. Semantic deviations in MBD models, missing process parameters, or distorted simulation boundaries may propagate into downstream stages along the Digital Thread. Data flow and collaboration risk serves as a cross-domain transmission carrier, amplifying upstream risks through system interface barriers, delayed version synchronization, and insufficient data consistency. Production execution and process control risk materializes these risks on the manufacturing shop floor, transforming early-stage risks into machining deviations and quality fluctuations. Quality inspection and data traceability risk directly determines the capability for defect interception and closed-loop correction; its failure allows latent quality hazards to escape into the finished product stage. Personnel capability matching risk, as an environmental variable permeating the entire process, exerts a global amplification effect on the four aforementioned risk dimensions through cognitive biases, non-standardized operations, and insufficient proficiency in system use.
Based on the above categorical logic and theoretical storyline, a model of the generation and transmission mechanism of quality risks in digitalized equipment manufacturing processes was constructed, as shown in Figure 2. Vertically, the model presents a hierarchical structure comprising the core category, main categories, and subcategories, thereby forming a complete quality risk indicator system. Horizontally, logical arrows are used to depict the transmission paths and coupling relationships among different risk dimensions, visually characterizing the generation process and internal evolution mechanism of quality risks.
3.1.4. Saturation Test
To ensure the completeness of the theoretical model, this study conducted an independent theoretical saturation test using four reserved in-depth interview transcripts that had not been involved in the previous coding process, following standard procedures [35]. The results showed that no new initial concepts emerged from the reserved samples, and that the connotative boundaries of each category and the logic of risk transmission were fully encompassed by the existing framework.
On this basis, ten recent real-world cases of typical digital quality failures that occurred in the frontline workshop of an aviation equipment manufacturing enterprise were further introduced for secondary mapping validation. Examples include “assembly interference caused by the absence of a complete tool-magazine simulation model” and “milling deformation exceeding tolerance due to unreleased cutting stress.” The comparison results indicated that the main risk drivers of these actual quality defect events could be well explained and covered by the proposed theoretical framework. Accordingly, the theoretical model of quality risks in digitalized equipment manufacturing processes was judged to have reached theoretical saturation.
3.2. Measurement Scale Development
Based on the grounded theory coding results, this study transformed the five main categories extracted through axial coding into latent variables in the quality risk measurement model, namely process design and transformation risk, data flow and collaboration risk, production execution and process control risk, quality inspection and data traceability risk, and personnel capability matching risk. Meanwhile, overall quality performance loss was specified as the outcome variable to characterize the comprehensive performance losses caused by quality risks in digitalized equipment manufacturing processes.
With respect to the specification of observed variables, the measurement items were developed according to the core connotations of the subcategories and initial categories under each main category, thereby ensuring consistency between the measurement indicators and the qualitative coding results. After the initial items were developed, experts in equipment manufacturing, quality management, and digital manufacturing were invited to evaluate the content representativeness, dimensional appropriateness, and semantic clarity of the items. Based on their feedback, the wording of several items was revised. Finally, 24 quality risk measurement items and three overall quality performance loss measurement items were formed. The correspondence between the latent variables and their observed variables is presented in Table 6, and the complete wording of the measurement items is provided in Appendix A.
3.3. Research Hypotheses
Based on the grounded-theory coding results, quality risks in digitalized equipment manufacturing processes can be divided into five dimensions: process design and transformation risk, data flow and collaboration risk, production execution and process control risk, quality inspection and data traceability risk, and personnel capability matching risk. Model semantic deviations, missing parameters, or simulation distortions in the process design stage may become risk inputs for subsequent stages. Barriers to data flow and collaboration may further amplify risk transmission across systems and processes. Deficiencies in production execution and process control may transform latent risks into actual quality deviations. Insufficient quality inspection and data traceability capabilities may weaken defect identification, problem localization, and closed-loop corrective effects. Inadequate personnel capability matching may permeate the entire digitalized manufacturing process and exert a system-wide impact.
Therefore, this study takes the five quality risk dimensions as antecedent variables and overall quality performance loss as the outcome variable, constructs a theoretical path model of quality risks in digitalized equipment manufacturing processes, and proposes the following research hypotheses.
3.3.1. Hypotheses on the Direct Effects of Risk Dimensions on Overall Quality Performance Loss
From the perspectives of total quality management, Quality 4.0, and the reliability of complex manufacturing systems [36], local quality failures in digitalized manufacturing systems, if not identified, isolated, and corrected in a timely manner, tend to spread to the system level through the process chain, data chain, and execution chain, ultimately resulting in quality performance loss. Accordingly, the following hypotheses are proposed:
H1: Process design and transformation risk has a significant positive effect on overall quality performance loss in digitalized equipment manufacturing processes.
H2: Data flow and collaboration risk has a significant positive effect on overall quality performance loss in digitalized equipment manufacturing processes.
H3: Production execution and process control risk has a significant positive effect on overall quality performance loss in digitalized equipment manufacturing processes.
H4: Quality inspection and data traceability risk has a significant positive effect on overall quality performance loss in digitalized equipment manufacturing processes.
H5: Personnel capability matching risk has a significant positive effect on overall quality performance loss in digitalized equipment manufacturing processes.
3.3.2. Hypotheses on Chain Transmission Relationships Among Risk Dimensions
Based on information processing theory and the Digital Thread concept [37,38], the essence of digitalized manufacturing lies in the data-flow-driven physical-flow process. Data deviations or information asymmetry generated in upstream stages may be transmitted downstream along the Digital Thread, resulting in cross-domain cascading failure effects. Inherent defects in process design may increase the complexity and distortion rate of data flow. Data collaboration barriers among heterogeneous systems may directly lead to deviations in production execution instructions on the shop floor. Instability in the production process may further increase the identification and closed-loop pressure in quality inspection and traceability. Accordingly, the following hypotheses are proposed:
H6: Process design and transformation risk has a significant positive effect on data flow and collaboration risk.
H7: Data flow and collaboration risk has a significant positive effect on production execution and process control risk.
H8: Production execution and process control risk has a significant positive effect on quality inspection and data traceability risk.
3.3.3. Hypotheses on the Domain-Wide Penetrating Effects of Personnel Capability Matching Risk
According to socio-technical systems theory [39], digitalized equipment manufacturing systems are not composed solely of digital equipment, software platforms, and data links; rather, they are formed through the coupling of technical subsystems and personnel subsystems. The risk of inadequate personnel capability matching is manifested not only as individual operational errors but may also affect multiple stages, including process transformation, data collaboration, shop-floor execution, and quality traceability, through deviations in intent understanding, improper system operation, non-standardized data processing, and insufficient abnormality-handling capability. This risk therefore permeates the entire digitalized manufacturing process. Accordingly, the following hypotheses are proposed:
H9: Personnel capability matching risk has a significant positive effect on process design and transformation risk.
H10: Personnel capability matching risk has a significant positive effect on data flow and collaboration risk.
H11: Personnel capability matching risk has a significant positive effect on production execution and process control risk.
H12: Personnel capability matching risk has a significant positive effect on quality inspection and data traceability risk.
Based on the above hypotheses, a CB-SEM-based hypothesized path model of quality risks in digitalized equipment manufacturing processes is constructed, as shown in Figure 3.
4. Empirical Results and Analysis
Based on the theoretical model and research hypotheses developed above, this study empirically examined 420 valid questionnaire responses using SPSS 27.0, AMOS 29.0, and Python. The analytical procedure comprised data quality assessment, measurement model evaluation, CB-SEM structural model testing, and XGBoost-SHAP-based nonlinear explainability analysis, with the aim of validating the transmission paths and key influencing factors of quality risks in digitalized equipment manufacturing processes.
4.1. Data Quality and Common Method Bias Tests
A normality assessment was performed on the sample data. The results showed that the mean values of all items ranged from 3.019 to 4.010, and the standard deviations ranged from 1.210 to 1.443, indicating that the sample responses exhibited a certain degree of dispersion and no obvious extreme concentration. The skewness statistics of all items ranged from −1.057 to −0.014, while the kurtosis statistics ranged from −1.367 to 0.058. The absolute skewness values of all items were less than 2, and the absolute kurtosis values were less than 7, satisfying the basic distributional requirements for CB-SEM analysis under maximum likelihood estimation.
Harman’s single-factor test was used to diagnose common method bias [40]. An unrotated exploratory factor analysis was conducted on all 27 measurement items. The results showed that the first common factor explained 28.91% of the total variance, which was below the empirical threshold of 40%, indicating that common method bias was unlikely to exert a serious influence on the research conclusions.
4.2. Measurement Model Evaluation
4.2.1. Exploratory Factor Analysis
Exploratory factor analysis was conducted on the 27 measurement items using principal component extraction and varimax rotation. The KMO value was 0.903, and Bartlett’s test of sphericity yielded an approximate chi-square value of 8247.358 with and p<0.001, indicating that the sample data were suitable for factor analysis. According to the criterion of eigenvalues greater than 1, six common factors were extracted, which was consistent with the six-latent-variable structure specified in the theoretical model. The rotated factor loading results are presented in Table 7. The loading of each item on its theoretically corresponding factor was greater than 0.700, and no obvious high cross-loadings across factors were observed, indicating that the scale had good construct validity.
4.2.2. Reliability and Convergent Validity
Cronbach’s coefficient was used to assess the internal consistency of the scale, while standardized factor loadings, composite reliability (CR), and average variance extracted (AVE) were used to evaluate convergent validity. The results are presented in Table 8. In terms of reliability, the Cronbach’s coefficients of the six latent variables ranged from 0.880 to 0.945, and the overall Cronbach’s coefficient of the scale was 0.903, all exceeding the recommended threshold of 0.700. This indicates that the scale has good internal consistency. In terms of convergent validity, the standardized factor loadings of all measurement items were greater than 0.700 and statistically significant. The CR values of the six latent variables ranged from 0.882 to 0.945, and the AVE values ranged from 0.657 to 0.742, exceeding the recommended thresholds of 0.700 and 0.500, respectively. These results indicate satisfactory convergent validity.
4.2.3. Discriminant Validity
Discriminant validity was assessed using the Fornell–Larcker criterion [41], and the results are presented in Table 9. The square roots of the AVE values for all latent variables ranged from 0.811 to 0.861, and each was greater than the correlation coefficients between the corresponding latent variable and the other latent variables. This indicates that the latent variables exhibited satisfactory discriminant validity.
4.3. Structural Model and Hypothesis Testing
4.3.1. Overall Model Fit
The structural equation model was estimated using the maximum likelihood method. The overall model fit results are presented in Table 10. All fit indices met the recommended thresholds, indicating that the structural model fitted the sample data well.
4.3.2. Direct Effect Testing
The results of the structural path testing are presented in Table 11 and Figure 4. The results show that all 12 hypothesized paths reached statistical significance, and thus H1–H12 were all supported. The five types of quality risks all exerted significant positive effects on overall quality performance loss. Among them, Personnel risk (E) had the largest standardized path coefficient (, ), followed by Process design risk (A) (, ), Inspection risk (D) (, ), Collaboration risk (B) (, ), and Execution risk (C) (, ).
The transmission paths among risk dimensions were also significant. Process design risk (A) had a significant positive effect on Collaboration risk (B) (, ); Collaboration risk (B) had a significant positive effect on Execution risk (C) (, ); and Execution risk (C) had a significant positive effect on Inspection risk (D) (, ). In addition, Personnel risk (E) had significant positive effects on Process design risk (A), Collaboration risk (B), Execution risk (C), and Inspection risk (D), indicating that insufficient personnel capability matching not only directly increases overall quality performance loss but also amplifies quality risks through multiple process stages.
4.3.3. Mediation Effect Testing
A Bootstrap bias-corrected method with 5,000 resamples was used to test the indirect effects along the risk transmission paths [32], and the results are presented in Table 12. The 95% confidence intervals of all six core indirect paths did not include zero, and all p values were less than 0.001, indicating that the mediation effects were significant.
Specifically, the total indirect effect of Personnel risk (E) on Overall loss (Y) was 0.207, with a Bootstrap 95% confidence interval of [0.162, 0.307] and . This indicates that Personnel risk not only exerts a direct effect but also generates indirect transmission through process stages such as process design, data collaboration, production execution, and quality inspection.
The total indirect effects of Process design risk (A), Collaboration risk (B), and Execution risk (C) on Overall loss (Y) were 0.048, 0.045, and 0.053, respectively, and their confidence intervals did not include zero, indicating that quality risks exhibit evident chain-like transmission characteristics. In addition, the indirect effect of Personnel risk (E) on Inspection risk (D) was 0.081, while the indirect effect of Process design risk (A) on Inspection risk (D) was 0.013, further suggesting that front-end risks can affect downstream inspection and traceability capabilities through process transmission.
4.3.4. Total Effect Decomposition
To compare the cumulative impacts of different quality risk dimensions on overall quality performance loss, the direct, indirect, and total effects were decomposed based on the standardized effect matrix output by AMOS. The results are presented in Table 13. The total effects of all five risk dimensions on overall quality performance loss were significantly positive, which is consistent with the theoretical expectations of H1–H5. In descending order, the total effects were Personnel risk , Process design risk , Collaboration risk , Execution risk , and Inspection risk .
From the perspective of effect structure, the indirect effect of Personnel risk accounted for 43.5%, which was substantially higher than those of the other four risk dimensions. This indicates that Personnel risk not only directly affects quality performance but also generates a significant cumulative transmission effect through intermediate stages such as process design, collaboration, and execution. By contrast, the remaining four risk dimensions were dominated by direct effects, with relatively limited indirect effects.
4.4. XGBoost Regression Results and SHAP Analysis
4.4.1. Predictive Performance of the XGBoost Model
Based on the hyperparameter search space specified in Table 3, the XGBoost model achieved an of 0.6931 on the training set and 0.3611 on the test set. The optimal RMSE obtained from five-fold cross-validation was 0.9635. The detailed results are presented in Table 14. Considering that the target variable was measured as the mean value of a five-point Likert scale, the test-set RMSE of approximately 1.02 indicates that the prediction error remained within an acceptable range. The gap between the training-set and test-set values can be attributed to the discreteness of cross-sectional Likert-scale data and individual heterogeneity, which is a common phenomenon in machine-learning modeling based on survey data [42].
It should be particularly noted that this study positions XGBoost as a methodological complement to CB-SEM path testing. Its primary purpose is not to pursue optimal predictive accuracy, but to use SHAP to reveal the nonlinear contribution structure of questionnaire items and the complex interaction effects among variables. Under the premise that the model maintains reasonable predictive capability, the internal attribution results provide valuable references for identifying key risk items and supporting managerial decision-making.
4.4.2. SHAP Global Feature Importance Analysis
Based on the trained XGBoost model, the TreeSHAP algorithm was used to calculate the contribution of the 24 observed variables to the model predictions. The global feature importance of each item was measured by the mean absolute SHAP value. The SHAP global feature importance ranking is shown in Figure 5, and the top 10 quality risk items are listed in Table 15.
The results show that Lack of pre-job certification (E2) and Non-compliant step-skipping operation (E4) under Personnel risk ranked first and second, respectively, indicating that personnel qualification control and compliance with operational procedures are key items affecting the prediction of overall quality performance loss. Underlying control failure (C2) under Execution risk ranked third, suggesting that abnormalities in the equipment control layer make a relatively strong explanatory contribution to quality loss. Distortion of simulation boundary conditions (A5) under Process design risk ranked fourth, reflecting that inconsistencies between simulation models and actual manufacturing boundary conditions in digitalized manufacturing scenarios may substantially weaken quality stability.
In addition, System data incompatibility (B1) and Data format barriers (B4) under Collaboration risk also entered the top 10, indicating that cross-system data connectivity and data standardization are important factors affecting quality performance. Loss of data access control (D5) also showed a relatively high SHAP contribution, suggesting that data governance and permission control play important roles in the quality traceability system.
4.4.3. Directional Interpretation Based on SHAP
To further identify the direction of influence of key risk items on model predictions, a SHAP beeswarm plot was generated, as shown in Figure 6. In the plot, each point represents one sample, the horizontal axis denotes the SHAP value, and the color indicates the value level of the corresponding item. A SHAP value greater than 0 indicates that the item increases the predicted overall quality performance loss, whereas a SHAP value less than 0 indicates that the item reduces the predicted overall quality performance loss.
The results show that key items such as Lack of pre-job certification (E2), Non-compliant step-skipping operation (E4), Underlying control failure (C2), Distortion of simulation boundary conditions (A5), and System data incompatibility (B1) were more frequently distributed in the positive SHAP value region when their values were high, indicating that higher levels of these risks generally increase the predicted overall quality performance loss. Conversely, when these items had lower values, the corresponding sample points were more frequently distributed in the negative SHAP value region, suggesting that effective risk control helps reduce the predicted level of quality loss.
Specifically, high-value samples of E2 and E4 were clearly concentrated in the positive SHAP region, indicating that insufficient personnel qualifications and non-compliant operations substantially increase the predicted quality loss. High-value samples of C2 also showed a strong positive contribution, suggesting that failures in the underlying control layer may intensify quality risks through equipment execution deviations, abnormal process parameters, and unstable control responses. The directional results for A5 and Detachment of verification conditions (A6) indicate that distorted simulation boundaries and mismatches between verification and actual operating conditions weaken the effectiveness of digital design verification, thereby increasing the risk of subsequent quality fluctuations. The results for B1 and Data format barriers (B4) further suggest that System data incompatibility and data format barries impede cross-stage collaboration and the closed-loop flow of quality information.
Meanwhile, the SHAP value distributions of some items exhibited non-monotonic characteristics, indicating that the effects of quality risks on performance loss are not simply linear, but may be jointly influenced by combinations of risk factors, firm-specific contextual differences, and threshold effects. This finding suggests that XGBoost-SHAP can provide a more fine-grained nonlinear interpretation beyond the linear path testing of CB-SEM.
4.4.4. Risk-Dimension-Level SHAP Aggregation Analysis
To align the SHAP results with the latent-variable-level path results obtained from CB-SEM, the SHAP values of the 24 observed variables were aggregated according to the five quality risk dimensions. The total contribution percentage and the mean absolute SHAP contribution were then calculated for each dimension. The results are shown in Figure 7.
In terms of the total contribution percentage, personnel capability matching risk and process design and transformation risk made the largest contributions, indicating that these two dimensions constitute the main explanatory sources for predicting overall quality performance loss. In terms of the mean absolute SHAP contribution, personnel capability matching risk still ranked first, suggesting that its internal items have stronger average marginal explanatory power. Although process design and transformation risk showed a relatively high total contribution percentage, its average contribution was lower than those of data flow and collaboration risk and production execution and process control risk, indicating that its predictive contribution is more attributable to the cumulative effects of multiple items rather than the dominant effect of a single item.
4.4.5. Comparison and Complementarity Between CB-SEM and SHAP Results
CB-SEM and XGBoost-SHAP reveal the effects of quality risks on overall quality performance loss from different analytical levels. The CB-SEM results indicate that personnel capability matching risk and process design and transformation risk exert relatively strong direct effects on overall loss. The SHAP results further show that several observed items, including Lack of pre-job certification (E2), Non-compliant step-skipping operation (E4), Distortion of simulation boundary conditions (A5), Detachment of verification conditions (A6), and Detachment of physical properties (A3), make relatively high predictive contributions.
The CB-SEM results also verify the significant roles of data flow and collaboration risk, production execution and process control risk, and quality inspection and data traceability risk in the risk transmission chain. The SHAP results further identify several key observed items, including System data incompatibility (B1), Data format barriers (B4), Underlying control failure (C2), Lack of condition monitoring (C3), and Loss of data access control (D5).
Overall, CB-SEM validates the theoretical paths at the latent-variable level, whereas XGBoost-SHAP reveals nonlinear predictive contributions at the item level. The two sets of results are consistent in terms of the major risk dimensions and complementary in terms of explanatory granularity. It should be noted that SHAP values reflect the explanatory contributions of variables to model predictions and are not equivalent to strict causal effects. Therefore, in this study, SHAP results are used as supplementary evidence to the CB-SEM path testing.
5. Discussion
5.1. Main Findings
Through cross-validation using a mixed-methods approach, this study systematically deconstructs the evolutionary patterns of quality risks in digitalized equipment manufacturing processes. Three main findings are obtained.
First, quality risks in digitalized equipment manufacturing exhibit a structural characteristic of five-dimensional synergistic driving. The qualitative analysis constructed, in a bottom-up manner, a five-dimensional risk structure comprising Process design risk, Collaboration risk, Execution risk, Inspection risk, and Personnel risk, and the CB-SEM results statistically confirmed the explanatory validity of this structure. Compared with simply adopting FMEA checklists from traditional discrete manufacturing or broadly applying generic Industry 4.0 risk frameworks [43], this study demonstrates that, in digitalized equipment manufacturing scenarios, risks are no longer confined to the failure of a single physical entity. Instead, they are deeply embedded in a complex system involving the interaction among physical entities, the Digital Thread, and human factors. If potential hazards in any subsystem are not intercepted in a timely manner, they may accumulate along the Digital Thread and eventually evolve into system-level quality performance losses.
Second, quality risks follow a dual-layer evolutionary mechanism characterized by Digital Thread-based chain transmission and full-domain penetration of Personnel risk. The mediation and total effect analyses based on CB-SEM reveal two pathways of risk evolution. On the one hand, the empirical results support the theoretical expectation that upstream deviations are cascaded and amplified downstream along the Digital Thread. Specifically, source risks at the process design stage are transmitted through data collaboration and production execution, ultimately forming a significant chain transmission effect toward the inspection stage. On the other hand, this study finds that Personnel risk has evolved from a “localized operational error” in traditional manufacturing into a “root hub variable” running through the entire digitalized manufacturing process. Personnel risk not only directly leads to quality losses but also exerts significant full-domain penetration and amplification effects on the other four categories of technical and process risks. This finding is highly consistent with the core proposition of socio-technical systems theory, which emphasizes the deep coupling between technical and social subsystems [39].
Third, the driving factors of quality risks exhibit characteristics of dominance by a few key factors and nonlinear threshold effects. CB-SEM and XGBoost-SHAP show a high degree of cross-method consistency in the importance ranking of risk dimensions, namely Personnel risk > Process design risk > Collaboration risk > Execution risk > Inspection risk, thereby confirming the robustness of the proposed risk structure. More importantly, SHAP analysis overcomes the limitations of linear assumptions and identifies several key drivers at the fine-grained item level, including Lack of pre-job certification (E2), Non-compliant step-skipping operation (E4), Underlying control failure (C2), and Distortion of simulation boundary conditions (A5). These factors contribute the main explanatory power of the model predictions, and their SHAP value distributions exhibit evident non-strictly monotonic patterns. This indicates that the impact of quality risks on performance loss involves complex threshold effects and factor-combination effects.
5.2. Theoretical Contributions
First, this study extends the dimensional construction of quality risks in the context of complex digitalized equipment manufacturing. Existing studies on quality risk have mainly focused on traditional manufacturing or generalized intelligent manufacturing contexts [44], with insufficient attention to equipment manufacturing scenarios characterized by high complexity, high discreteness, and high digitalization. Based on first-hand qualitative data, this study extracts and validates a contextualized and measurable five-dimensional risk indicator system. This effectively addresses the limitations of existing literature, in which risk dimensions are often insufficiently adapted to specific contexts and Personnel risk is frequently marginalized.
Second, this study reveals the dynamic coupling and cascading transmission mechanisms of multidimensional quality risks. Existing studies have mostly examined the static effects of single risk factors [45], lacking an in-depth investigation of cross-domain risk transmission in digitalized contexts. This study quantitatively demonstrates a dual-layer transmission pattern characterized by “personnel-rooted driving and upstream chain amplification.” It empirically opens the black box of quality risk evolution along the Digital Thread and provides a new explanatory framework for research on quality reliability in complex digitalized manufacturing systems.
Third, this study constructs a mixed-methods paradigm of “qualitative construction–parametric testing–nonparametric attribution” [46]. Specifically, this study innovatively integrates grounded theory, CB-SEM, and XGBoost-SHAP. Grounded theory addresses the contextual authenticity of “where variables come from”; CB-SEM verifies the hypothesized structural paths among macro-level dimensions; and XGBoost-SHAP compensates for the limitations of traditional statistical models in nonlinear pattern capture and micro-level feature attribution. This methodological triangulation and hierarchical complementarity in explanatory granularity provide a reference paradigm for complex-system research in engineering management and quality control.
5.3. Managerial Implications
First, human–machine collaborative capability should be established as the strategic starting point for quality risk prevention and control. Given the dominant role of Personnel risk in both total effects and SHAP contributions, enterprises must abandon the technology-over-people and equipment-centric bias when advancing digital transformation. Management should incorporate mandatory pre-job certification for digital tools, fatigue management in human–machine collaboration, and strict enforcement of operational standards into core assessment criteria, thereby cutting off the penetration path through which Personnel risk spreads into technical systems at its source.
Second, enterprises should build a full-chain, hierarchical risk interception system along the Digital Thread. In view of the chain-like transmission characteristics of quality risks, enterprises should move beyond siloed thinking centered on department-level point optimization. At the front end, namely process design and collaboration, emphasis should be placed on strengthening the alignment verification between MBD models and actual operating conditions and on breaking down cross-system data barriers. At the middle and back ends, namely production execution and inspection, data permission governance and algorithm reliability assessment should be strictly implemented to prevent source-stage deviations from being infinitely amplified at terminal stages, thereby enabling the early detection and early isolation of quality risks.
Third, agile resource allocation and precise early warning based on SHAP thresholds should be implemented. Enterprises can draw on the key risk items identified above, namely E2, E4, C2, and A5, to implement Pareto-oriented precise control and allocate limited quality management resources to risk points with high marginal contributions. Meanwhile, by leveraging the nonlinear patterns revealed by SHAP, enterprises can set dynamic early-warning thresholds in MES/QMS systems. Once key indicators approach critical thresholds, the system can automatically trigger cross-departmental coordinated intervention, thereby substantially improving the agility and input–output efficiency of quality risk response.
6. Conclusions and Future Research
6.1. Conclusions
Focusing on the complex quality risk issues in digitalized equipment manufacturing processes, this study innovatively applied a mixed-methods framework integrating grounded theory, CB-SEM, and XGBoost–SHAP to systematically examine the formation logic and transmission mechanisms of quality risks. The main conclusions are as follows.
First, this study constructed a five-dimensional quality risk structure tailored for digitalized equipment manufacturing, comprising Process design risk, Collaboration risk, Execution risk, Inspection risk, and Personnel risk. This structure effectively captures the complex characteristics arising from interactions among physical entities, the Digital Thread, and human factors.
Second, this study revealed a dual-layer mechanism underlying the evolution of quality risks. Technical and process-related risks exhibit significant cascade amplification and chain transmission effects along the Digital Thread, whereas Personnel risk functions as a root hub, exerting pervasive and amplifying effects across the entire risk system.
Third, this study identified the nonlinear threshold effects of key risk drivers. Quality performance loss is dominated by a small number of critical factors, such as Lack of pre-job certification (E2) and Distortion of simulation boundary conditions (A5). Once these factors exceed certain thresholds, they may exert nonlinear and destructive impacts on system quality.
6.2. Limitations and Future Research
Although this study provides a rigorous theoretical and methodological investigation, several limitations remain and warrant further exploration.
First, there are limitations in capturing the dynamic evolution of risks using cross-sectional data. The quantitative analysis in this study mainly relies on cross-sectional data. Although the proposed theoretical paths were validated, such data cannot fully characterize the dynamic evolution of risks across the lifecycle of digital transformation. Future research could introduce longitudinal panel data or cross-lagged models to track the intertemporal evolution of risk structures.
Second, the sample has certain industrial and regional boundaries. The sample in this study focuses on typical high-end equipment manufacturing enterprises in China, including aerospace and ordnance manufacturing firms. Given the differences in digital infrastructures across manufacturing sectors, future studies could conduct cross-industry and cross-cultural investigations to examine the generalizability of the proposed risk transmission model.
Third, there remains a gap between machine-learning-based interpretability and causal inference. By introducing SHAP, this study successfully achieved nonlinear predictive attribution; however, SHAP essentially reflects marginal explanatory contributions rather than strict statistical causality. Future research could integrate causal machine learning or digital twin technologies to conduct counterfactual inference on risk interventions in virtual simulation environments, thereby further enhancing intelligent decision-making in quality risk management.
Author Contributions
Conceptualization, J.S. and H.X.; methodology, J.S. and H.X.; formal analysis, J.S.; investigation, J.S. and T.Z.; data curation, J.S. and T.Z.; writing—original draft preparation, J.S.; writing—review and editing, H.X. and T.Z.; supervision, H.X. All authors have read and agreed to the published version of the manuscript.
Funding
This research received no external funding.
Institutional Review Board Statement
Not applicable.
Informed Consent Statement
Not applicable.
Data Availability Statement
The numerical simulation data used to support the findings of this study are included within the article.
Acknowledgments
The authors are thankful to the anonymous reviewers for their instructive reviewing of the man-uscript.
Conflicts of Interest
The authors declare no conflicts of interest.
Appendix A
The questionnaire was originally developed in Chinese. The English version of the measurement items is provided for publication and reference purposes, and the semantic consistency between the Chinese and English versions was carefully verified by the authors.
All measurement items were assessed using a five-point Likert scale. Respondents were asked to evaluate the extent to which each statement reflected the actual situation in digitalized equipment manufacturing processes. The scale ranged from 1 to 5, where 1 = strongly disagree, 2 = disagree, 3 = neutral, 4 = agree, and 5 = strongly agree.

Table A1.
Measurement items used in the questionnaire.
| Latent variable (code) | Observed variable (code) | Measurement item |
| Process design risk (A) | Loss of model semantics (A1) | During the conversion of enterprise MBD-based 3D models across different software platforms, geometric features or PMI annotations are often lost. |
| Design intent interpretation deviation (A2) | Process engineers may misinterpret the functional intent of design drawings, resulting in process plans that deviate from design requirements. | |
| Detachment of physical properties (A3) | Digital process planning may place excessive emphasis on toolpath generation while neglecting the influence of machining parameters on the residual stress of parts. | |
| Missing key parameters (A4) | Control limits for key process parameters, such as heat-treatment temperature and holding time, are not clearly specified in digital process documents. | |
| Distortion of simulation boundary conditions (A5) | The boundary conditions of virtual machining simulation, such as machine-tool stiffness, differ substantially from the actual operating conditions on the shop floor. | |
| Detachment of verification conditions (A6) | The boundary settings for simulation verification do not cover extreme operating conditions, leading to unanticipated interference, collision, or out-of-tolerance problems in actual production. | |
| Collaboration risk (B) | System data incompatibility (B1) | Engineering changes in the PLM system cannot be synchronized with the MES system in real time, resulting in data inconsistencies on the shop floor. |
| Version synchronization delay (B2) | After design drawings are updated, inadequate version control of shop-floor CNC programs may cause the programs in use to remain inconsistent with updated engineering requirements. | |
| Distortion of outsourced models (B3) | The 3D models provided by external suppliers are not standardized or compliant with relevant specifications, leading to misinterpretation in process design and inconsistencies with actual machining requirements. | |
| Data format barriers (B4) | The data formats used by external suppliers are incompatible with the enterprise’s internal systems, requiring manual conversion, which may reduce collaboration efficiency and introduce manual errors. | |
| Execution risk (C) | Equipment accuracy degradation (C1) | After long-term operation of CNC equipment, wear of core components may lead to latent degradation in machining accuracy. |
| Underlying control failure (C2) | Transient failures may occur in the machine-tool servo system, while the CNC system neither issues alarms nor performs automatic compensation. | |
| Failure of condition monitoring (C3) | Key machining process parameters during production, such as spindle load and cutting temperature fluctuations, lack effective real-time monitoring and anomaly-warning mechanisms. | |
| Lagged control response (C4) | CNC machining parameters cannot be adaptively adjusted in response to deviations in the workpiece state. | |
| Inspection risk (D) | Inspection accuracy drift (D1) | Due to long-term high-frequency use or insufficient calibration, coordinate measuring machines may experience drift in measurement accuracy. |
| Algorithmic fitting misjudgment (D2) | The recognition algorithms of visual inspection systems may generate false or missed detections for small defects or edge features on complex surfaces. | |
| Discontinuity in data collection (D3) | Incomplete collection of human, machine, material, method, and environment data on the shop floor may lead to discontinuities in digital quality records. | |
| Failure of root-cause traceability (D4) | When quality defects occur, it is difficult to identify the specific process responsible for the defect through the digital traceability chain. | |
| Loss of data access control (D5) | Insufficient access control over shop-floor terminal devices may create the risk of unauthorized export of key process data. | |
| Unauthorized modification of records (D6) | Quality inspection records can be modified in the system without proper authorization, undermining the authenticity of quality data. | |
| Personnel risk (E) | Unfamiliarity with software operation (E1) | Some employees are not proficient in operating digital process-planning software, such as UG/NX. |
| Lack of pre-job certification (E2) | Some employees have not obtained the required qualification certification for operating digital equipment before taking their posts. | |
| Fatigue-induced negligence errors (E3) | In digital production, operators may fail to identify and respond to equipment abnormalities in a timely manner, or may make recording errors due to fatigue and negligence. | |
| Non-compliant step-skipping operation (E4) | To improve efficiency, some employees violate operating rules by bypassing the error-proofing verification steps embedded in the system. | |
| Overall loss (Y) | Internal quality loss (Y1) | Overall, the effectiveness of internal quality control on the shop floor is below expectations, and internal quality losses, such as rework, repair, and nonconforming product disposition, still occur relatively frequently. |
| External quality feedback (Y2) | After products are transferred to subsequent processes or finally delivered, external feedback on assembly coordination failures or quality problems related to manufacturing process deviations may still occur. | |
| Batch quality fluctuation (Y3) | The robustness of the digitalized manufacturing process is insufficient, and key quality characteristics show substantial fluctuations across production batches. |
References
- Singh, A.; Madaan, G.; Hr, S.; Kumar, A. Smart Manufacturing Systems: A Futuristics Roadmap towards Application of Industry 4.0 Technologies. Int. J. Comput. Integr. Manuf. 2023, 36, 411–428. [Google Scholar] [CrossRef]
- Ribeiro Da Silva, E.H.D.; Shinohara, A.C.; De Lima, E.P.; Angelis, J.; Machado, C.G. Reviewing Digital Manufacturing Concept in the Industry 4.0 Paradigm. Procedia CIRP 2019, 81, 240–245. [Google Scholar] [CrossRef]
- Cataldo, S.D.; Lee, S.; Macii, E.; Vogel-Heuser, B. Leading Information and Communication Technologies for Smart Manufacturing: Facing the New Challenges and Opportunities of the 4th Industrial Revolution. Proc. IEEE 2021, 109, 320–325. [Google Scholar] [CrossRef]
- Pacini, A.; Lupi, F.; Lanzetta, M. Semantically Enriched CAD Models for Digital Manufacturing: A Systematic Review of Model-Based Definition. J. Intell. Manuf. 2026. [Google Scholar] [CrossRef]
- Hu, Y.; Jia, Q.; Yao, Y.; Lee, Y.; Lee, M.; Wang, C.; Zhou, X.; Xie, R.; Yu, F.R. Industrial Internet of Things Intelligence Empowering Smart Manufacturing: A Literature Review. IEEE Internet Things J. 2024, 11, 19143–19167. [Google Scholar] [CrossRef]
- Abdel-Aty, T.A.; Negri, E. Conceptualizing the Digital Thread for Smart Manufacturing: A Systematic Literature Review. J. Intell. Manuf. 2024, 35, 3629–3653. [Google Scholar] [CrossRef]
- Ramprasath, P.; Bonthu, M.G. Data Integrity Failures in Pharmaceutical Digital Twins and Continuous Manufacturing: An Alcoa + + Framework Integrating Human Factors and Simulation Vulnerabilities. J. Pharm. Innov. 2026, 21, 553. [Google Scholar] [CrossRef]
- Mabkhot, M.M.; Kalawsky, R.S.; Liaqat, A. Introducing the Manufacturing Digital Passport (MDP): A New Concept for Realising Digital Thread Data Sharing in Aerospace and Complex Manufacturing. Systems 2025, 13, 700. [Google Scholar] [CrossRef]
- Eskue, N.; Macali, A. Ensuring Data Accuracy, Completeness, and Interpretation in Advanced Manufacturing. Appl. Sci. 2026, 16, 2409. [Google Scholar] [CrossRef]
- Huang, S.; Simani, S.; Lu, N.; Jiang, B. Virtual Node-Based Risk Assessment for Hidden and Cascading Failures in Production Lines. IEEE Trans. Reliab. 2025, 74, 5531–5543. [Google Scholar] [CrossRef]
- Silesian University of Technology; Organization and Management Department; Economics and Informatics Institute; Wolniak; R.; Grebski, W. Penn State Hazletonne, Pennsylvania State University The Usage of Statistical Process Control (SPC) in Industry 4.0 Conditions. Sci. Pap. Silesian Univ. Technol. Organ. Manag. Ser. 2023, 2023, 259–268. [Google Scholar] [CrossRef]
- Pongboonchai-Empl, T.; Antony, J.; Garza-Reyes, J.A.; Komkowski, T.; Tortorella, G.L. Integration of Industry 4.0 Technologies into Lean Six Sigma DMAIC: A Systematic Review. Prod. Plan. Control 2024, 35, 1403–1428. [Google Scholar] [CrossRef]
- Aichouni, A.B.E.; Silva, C.; Ferreira, L.M.D.F. A Systematic Literature Review of the Integration of Total Quality Management and Industry 4.0: Enhancing Sustainability Performance through Dynamic Capabilities. Sustainability 2024, 16, 9108. [Google Scholar] [CrossRef]
- Wu, Z.; Liu, W.; Nie, W. Literature Review and Prospect of the Development and Application of FMEA in Manufacturing Industry. Int. J. Adv. Manuf. Technol. 2021, 112, 1409–1436. [Google Scholar] [CrossRef]
- Sarkar, A.; Goswami, S.S. A Systematic Review of MCDM Techniques for Decision-Making in Smart Manufacturing Systems under Industry 4.0. Manag. Sci. Adv. 2026, 3, 290–306. [Google Scholar] [CrossRef]
- Tian, H.; Sun, Y.; Chen, C.; Zhang, Z.; Liu, T.; Zhang, T.; He, J.; Yu, L. A Novel FMECA Method for CNC Machine Tools Based on D-GRA and Data Envelopment Analysis. Sci. Rep. 2024, 14, 26596. [Google Scholar] [CrossRef] [PubMed]
- Renosori, P.; Oemar, H.; Fauziah, S. Combination of FTA and FMEA Methods to Improve Efficiency in the Manufacturing Company. Acta Logist. 2023, 10, 487–495. [Google Scholar] [CrossRef]
- Wang, K.; Liu, C.; Lu, Y. Ensemble Bayesian Network for Root Cause Analysis of Product Defects via Learning from Historical Production Data. J. Manuf. Syst. 2024, 75, 102–115. [Google Scholar] [CrossRef]
- Liu, Y.; Li, H. A High Reliability Based Evidential Reasoning Approach. PLoS ONE 2025, 20, e0317438. [Google Scholar] [CrossRef] [PubMed]
- Su, C.-J.; Chen, I.-F.; Tsai, T.-R.; Wang, T.-H.; Lio, Y. Support Vector Machines and Model Selection for Control Chart Pattern Recognition. Mathematics 2025, 13, 592. [Google Scholar] [CrossRef]
- Zheng, H.; Gao, X.; Yang, M.; Yang, X.; Li, Y.; Ding, Y. Complex Product Quality Prediction Method Based on an Improved Light Gradient Boosting Machine. Appl. Intell. 2025, 55, 248. [Google Scholar] [CrossRef]
- Su, X.; Liu, Y.; Li, J. Quality Prediction Using Multiscale Convolutional VAEs for Thin Plate Parts. Sci. Rep. 2026, 16, 5499. [Google Scholar] [CrossRef] [PubMed]
- Ko, J.H.; Yin, C. A Review of Artificial Intelligence Application for Machining Surface Quality Prediction: From Key Factors to Model Development. J. Intell. Manuf. 2026, 37, 775–798. [Google Scholar] [CrossRef]
- Ebni, M.; Hosseini Bamakan, S.M.; Qu, Q. Digital Twin Based Smart Manufacturing; from Design to Simulation and Optimization Schema. Procedia Comput. Sci. 2023, 221, 1216–1225. [Google Scholar] [CrossRef]
- Sarstedt, M.; Adler, S.J.; Ringle, C.M.; Cho, G.; Diamantopoulos, A.; Hwang, H.; Liengaard, B.D. Same Model, Same Data, but Different Outcomes: Evaluating the Impact of Method Choices in Structural Equation Modeling. J. Prod. Innov. Manag. 2024, 41, 1100–1117. [Google Scholar] [CrossRef]
- Muaz, M.; Sajid, S.; Schulze, T.; Liu, C.; Klasen, N.; Drescher, B. Explainable AI for Correct Root Cause Analysis of Product Quality in Injection Moulding. J. Manuf. Process. 2025, 145, 371–380. [Google Scholar] [CrossRef]
- Marín Díaz, G. Comparative Analysis of Explainable AI Methods for Manufacturing Defect Prediction: A Mathematical Perspective. Mathematics 2025, 13, 2436. [Google Scholar] [CrossRef]
- Eslamifar, A.; Mehrmanesh, H.; Mehrani, A. Model of Quality and Safety Management Based on the Industry 4.0 Approach. J. Resour. Manag. Decis. Eng. 2025, 4, 1–8. [Google Scholar] [CrossRef]
- Dash, G.; Paul, J. CB-SEM vs PLS-SEM Methods for Research in Social Sciences and Technology Forecasting. Technol. Forecast. Soc. Change 2021, 173, 121092. [Google Scholar] [CrossRef]
- Cheung, G.W.; Cooper-Thomas, H.D.; Lau, R.S.; Wang, L.C. Reporting Reliability, Convergent and Discriminant Validity with Structural Equation Modeling: A Review and Best-Practice Recommendations. Asia Pac. J. Manag. 2024, 41, 745–783. [Google Scholar] [CrossRef]
- Gaskin, J.E.; Lowry, P.B.; Rosengren, W.; Fife, P.T. Essential Validation Criteria for Rigorous Covariance-based Structural Equation Modelling. Inf. Syst. J. 2025, 35, 1630–1661. [Google Scholar] [CrossRef]
- Igartua, J.-J.; Hayes, A.F. Mediation, Moderation, and Conditional Process Analysis: Concepts, Computations, and Some Common Confusions. Span. J. Psychol. 2021, 24, e49. [Google Scholar] [CrossRef] [PubMed]
- Chen, T.; Guestrin, C. XGBoost: A Scalable Tree Boosting System. In Proceedings of the Proceedings of the 22nd ACM SIGKDD International Conference on Knowledge Discovery and Data Mining, August 13 2016; ACM: San Francisco California USA; pp. 785–794. [Google Scholar]
- Lundberg, S.M.; Erion, G.; Chen, H.; DeGrave, A.; Prutkin, J.M.; Nair, B.; Katz, R.; Himmelfarb, J.; Bansal, N.; Lee, S.-I. From Local Explanations to Global Understanding with Explainable AI for Trees. Nat. Mach. Intell. 2020, 2, 56–67. [Google Scholar] [CrossRef] [PubMed]
- Hennink, M.; Kaiser, B.N. Sample Sizes for Saturation in Qualitative Research: A Systematic Review of Empirical Tests. Soc. Sci. Med. 2022, 292, 114523. [Google Scholar] [CrossRef] [PubMed]
- Chiarini, A. Industry 4.0, Quality Management and TQM World. A Systematic Literature Review and a Proposed Agenda for Further Research. TQM J. 2020, 32, 603–616. [Google Scholar] [CrossRef]
- Gangwani, K.K.; Bhatia, M.S. Enhancing Quality Performance through Blockchain Technology: An Organization Information Processing Theory Perspective. J. Enterp. Inf. Manag. 2025, 38, 1536–1557. [Google Scholar] [CrossRef]
- Roth, M.; Rezaei Aderiani, A.; Morse, E.; Wärmefjord, K.; Söderberg, R. Closing Gaps in the Digital Thread with the Quality Information Framework (QIF) Standard for a Seamless Geometry Assurance Process. Comput.-Aided Des. 2025, 182, 103860. [Google Scholar] [CrossRef]
- Münch, C.; Marx, E.; Benz, L.; Hartmann, E.; Matzner, M. Capabilities of Digital Servitization: Evidence from the Socio-Technical Systems Theory. Technol. Forecast. Soc. Change 2022, 176, 121361. [Google Scholar] [CrossRef]
- Tehseen, S.; Ramayah, T.; Sajilan, S. Testing and Controlling for Common Method Variance: A Review of Available Methods. J. Manag. Sci. 2017, 4, 142–168. [Google Scholar] [CrossRef]
- Afthanorhan, A.; Ghazali, P.L.; Rashid, N. Discriminant Validity: A Comparison of CBSEM and Consistent PLS Using Fornell & Larcker and HTMT Approaches. J. Phys. Conf. Ser. 2021, 1874, 012085. [Google Scholar] [CrossRef]
- Tempelaar, D.; Rienties, B.; Nguyen, Q. Subjective Data, Objective Data and the Role of Bias in Predictive Modelling: Lessons from a Dispositional Learning Analytics Application. PLoS ONE 2020, 15, e0233977. [Google Scholar] [CrossRef] [PubMed]
- Pasi, B.N.; Mahajan, S.K.; Rane, S.B. Strategies for Risk Management in Adopting Industry 4.0 Concept in Manufacturing Industries. J. Sci. Technol. Policy Manag. 2023, 14, 563–591. [Google Scholar] [CrossRef]
- Huang, J.; You, J.-X.; Liu, H.-C.; Song, M.-S. Failure Mode and Effect Analysis Improvement: A Systematic Literature Review and Future Research Agenda. Reliab. Eng. Syst. Saf. 2020, 199, 106885. [Google Scholar] [CrossRef]
- Barraza De La Paz, J.V.; Rodríguez-Picón, L.A.; Morales-Rocha, V.; Torres-Argüelles, S.V. A Systematic Review of Risk Management Methodologies for Complex Organizations in Industry 4.0 and 5.0. Systems 2023, 11, 218. [Google Scholar] [CrossRef]
- Tunca, B. Hybrid Use of Structural Equation Modeling and Machine Learning: Literature Review and Future Potential. 2025. [Google Scholar] [CrossRef]
Figure 1.
Technical route for identifying quality risk drivers in digitalized equipment manufacturing processes.
Figure 1.
Technical route for identifying quality risk drivers in digitalized equipment manufacturing processes.
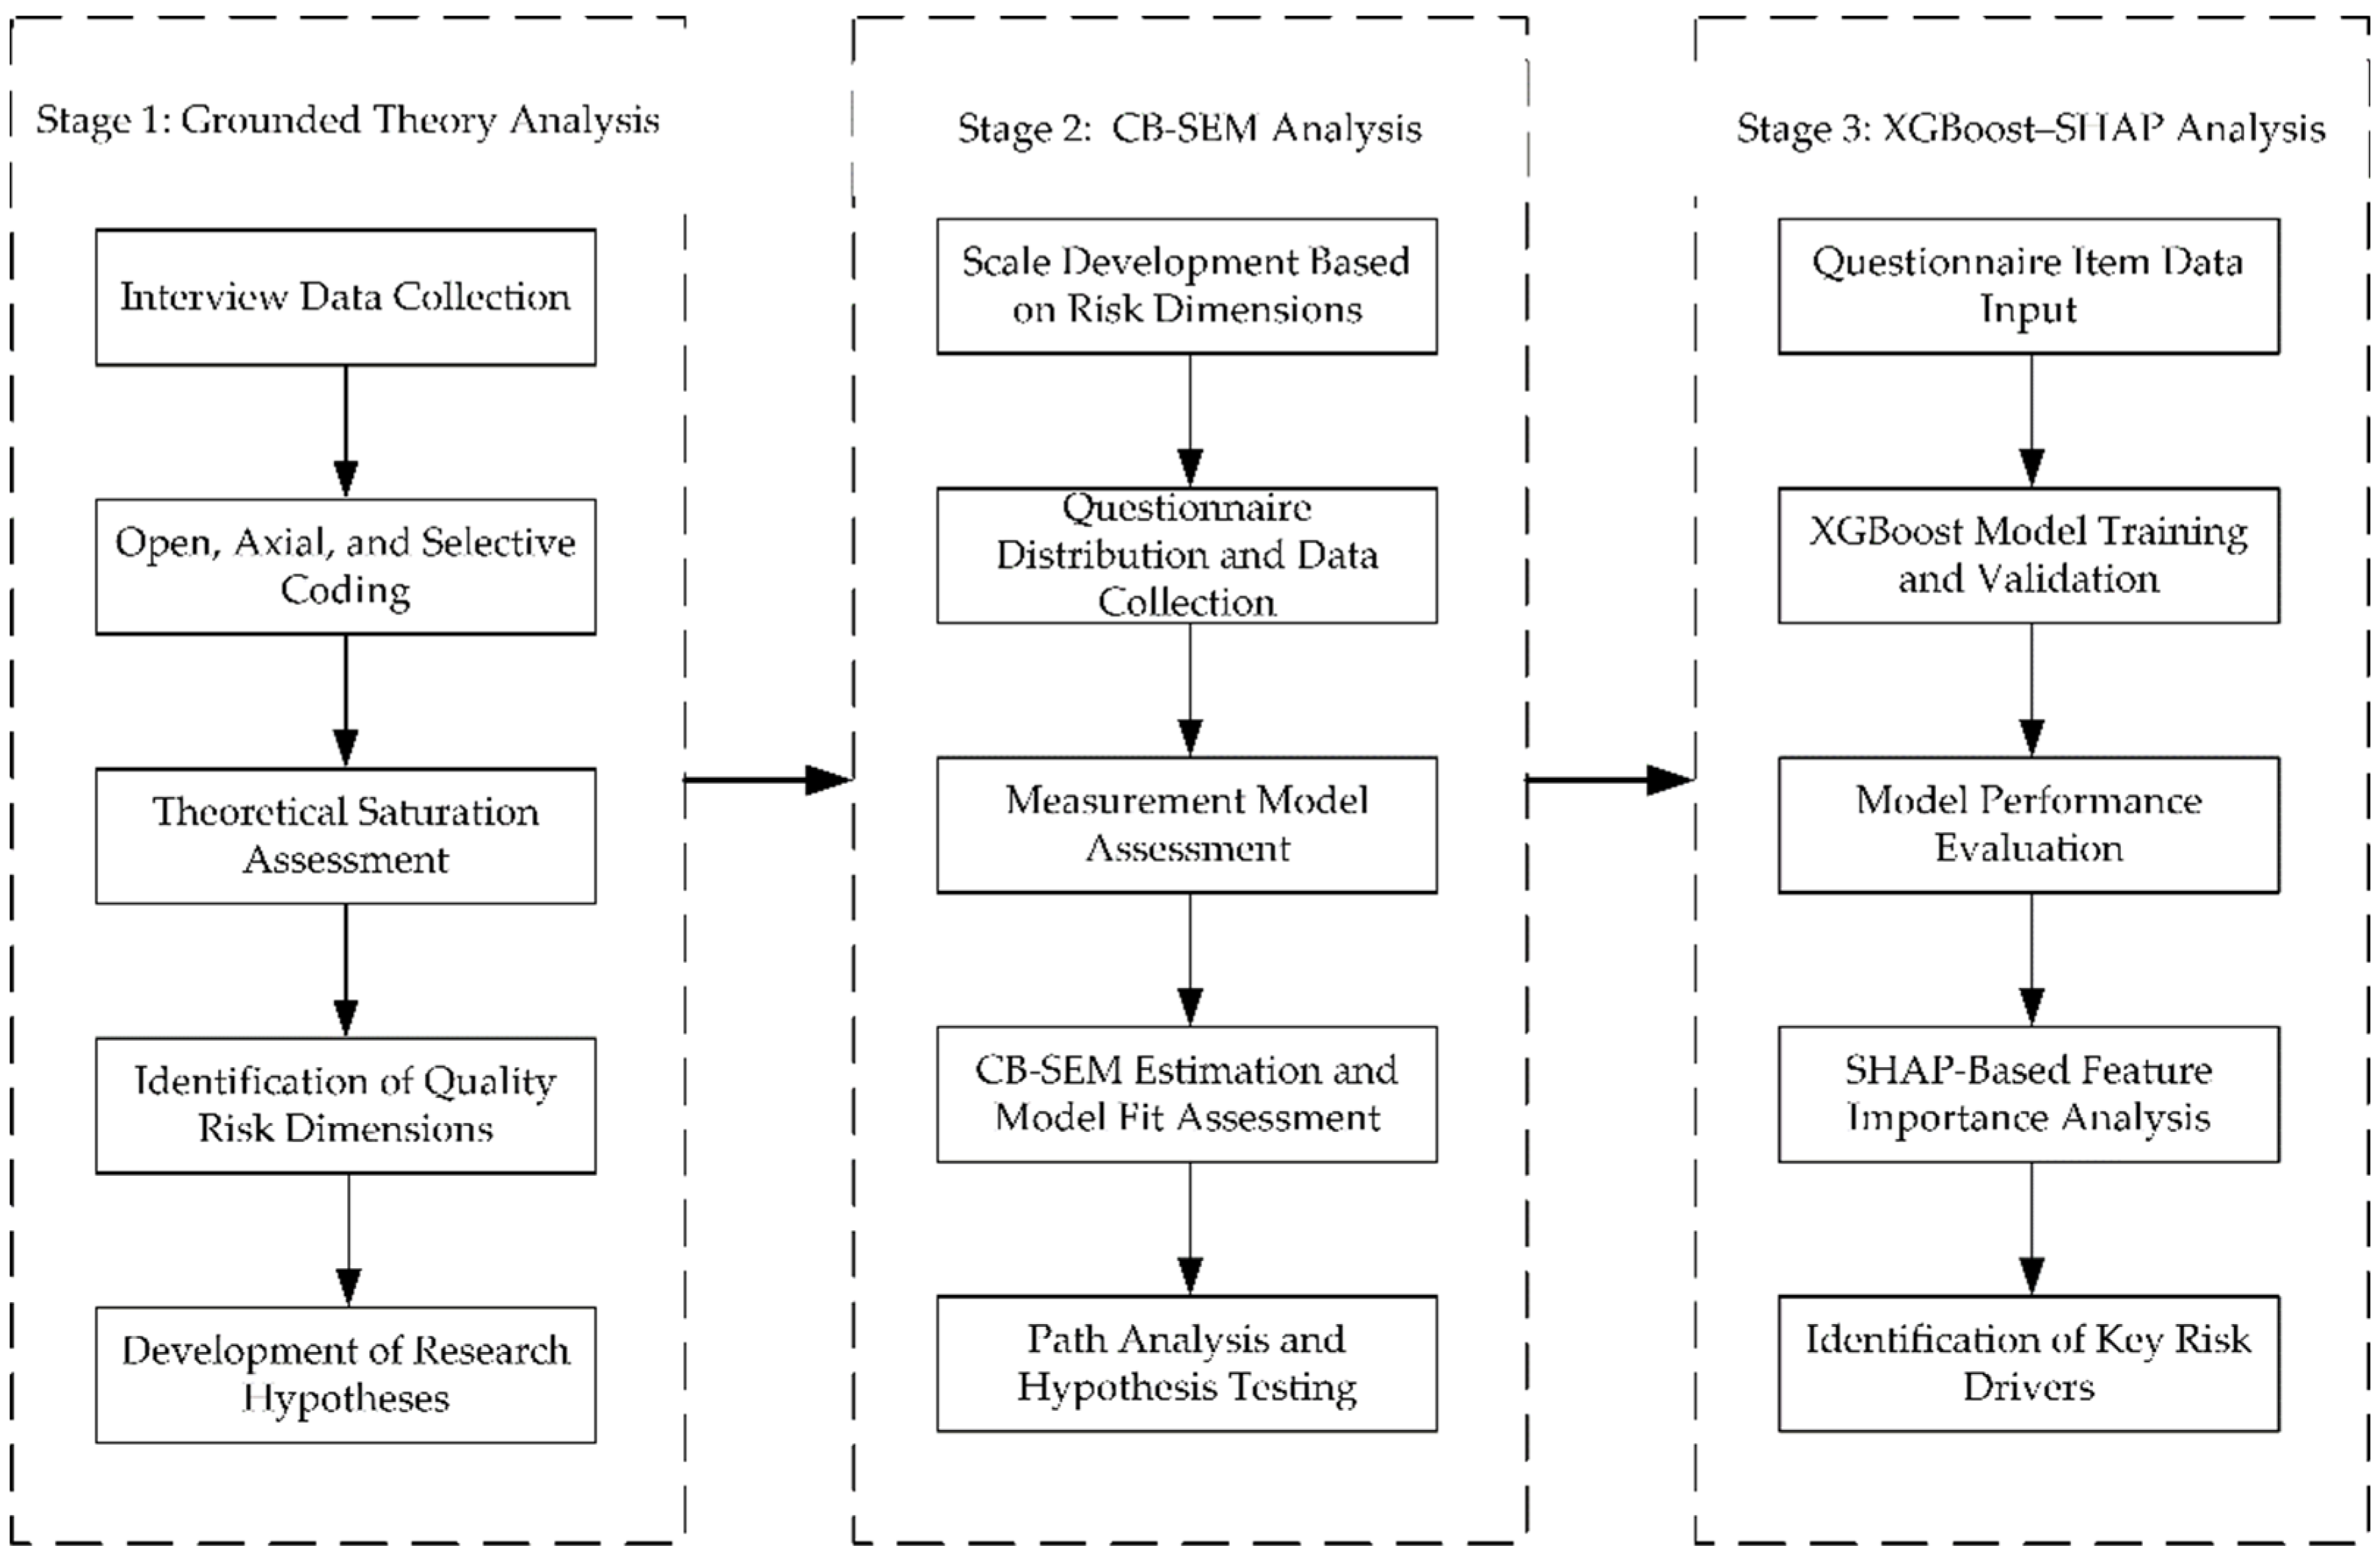
Figure 2.
Generation and transmission mechanism of quality risks in digitalized equipment manufacturing processes.
Figure 2.
Generation and transmission mechanism of quality risks in digitalized equipment manufacturing processes.
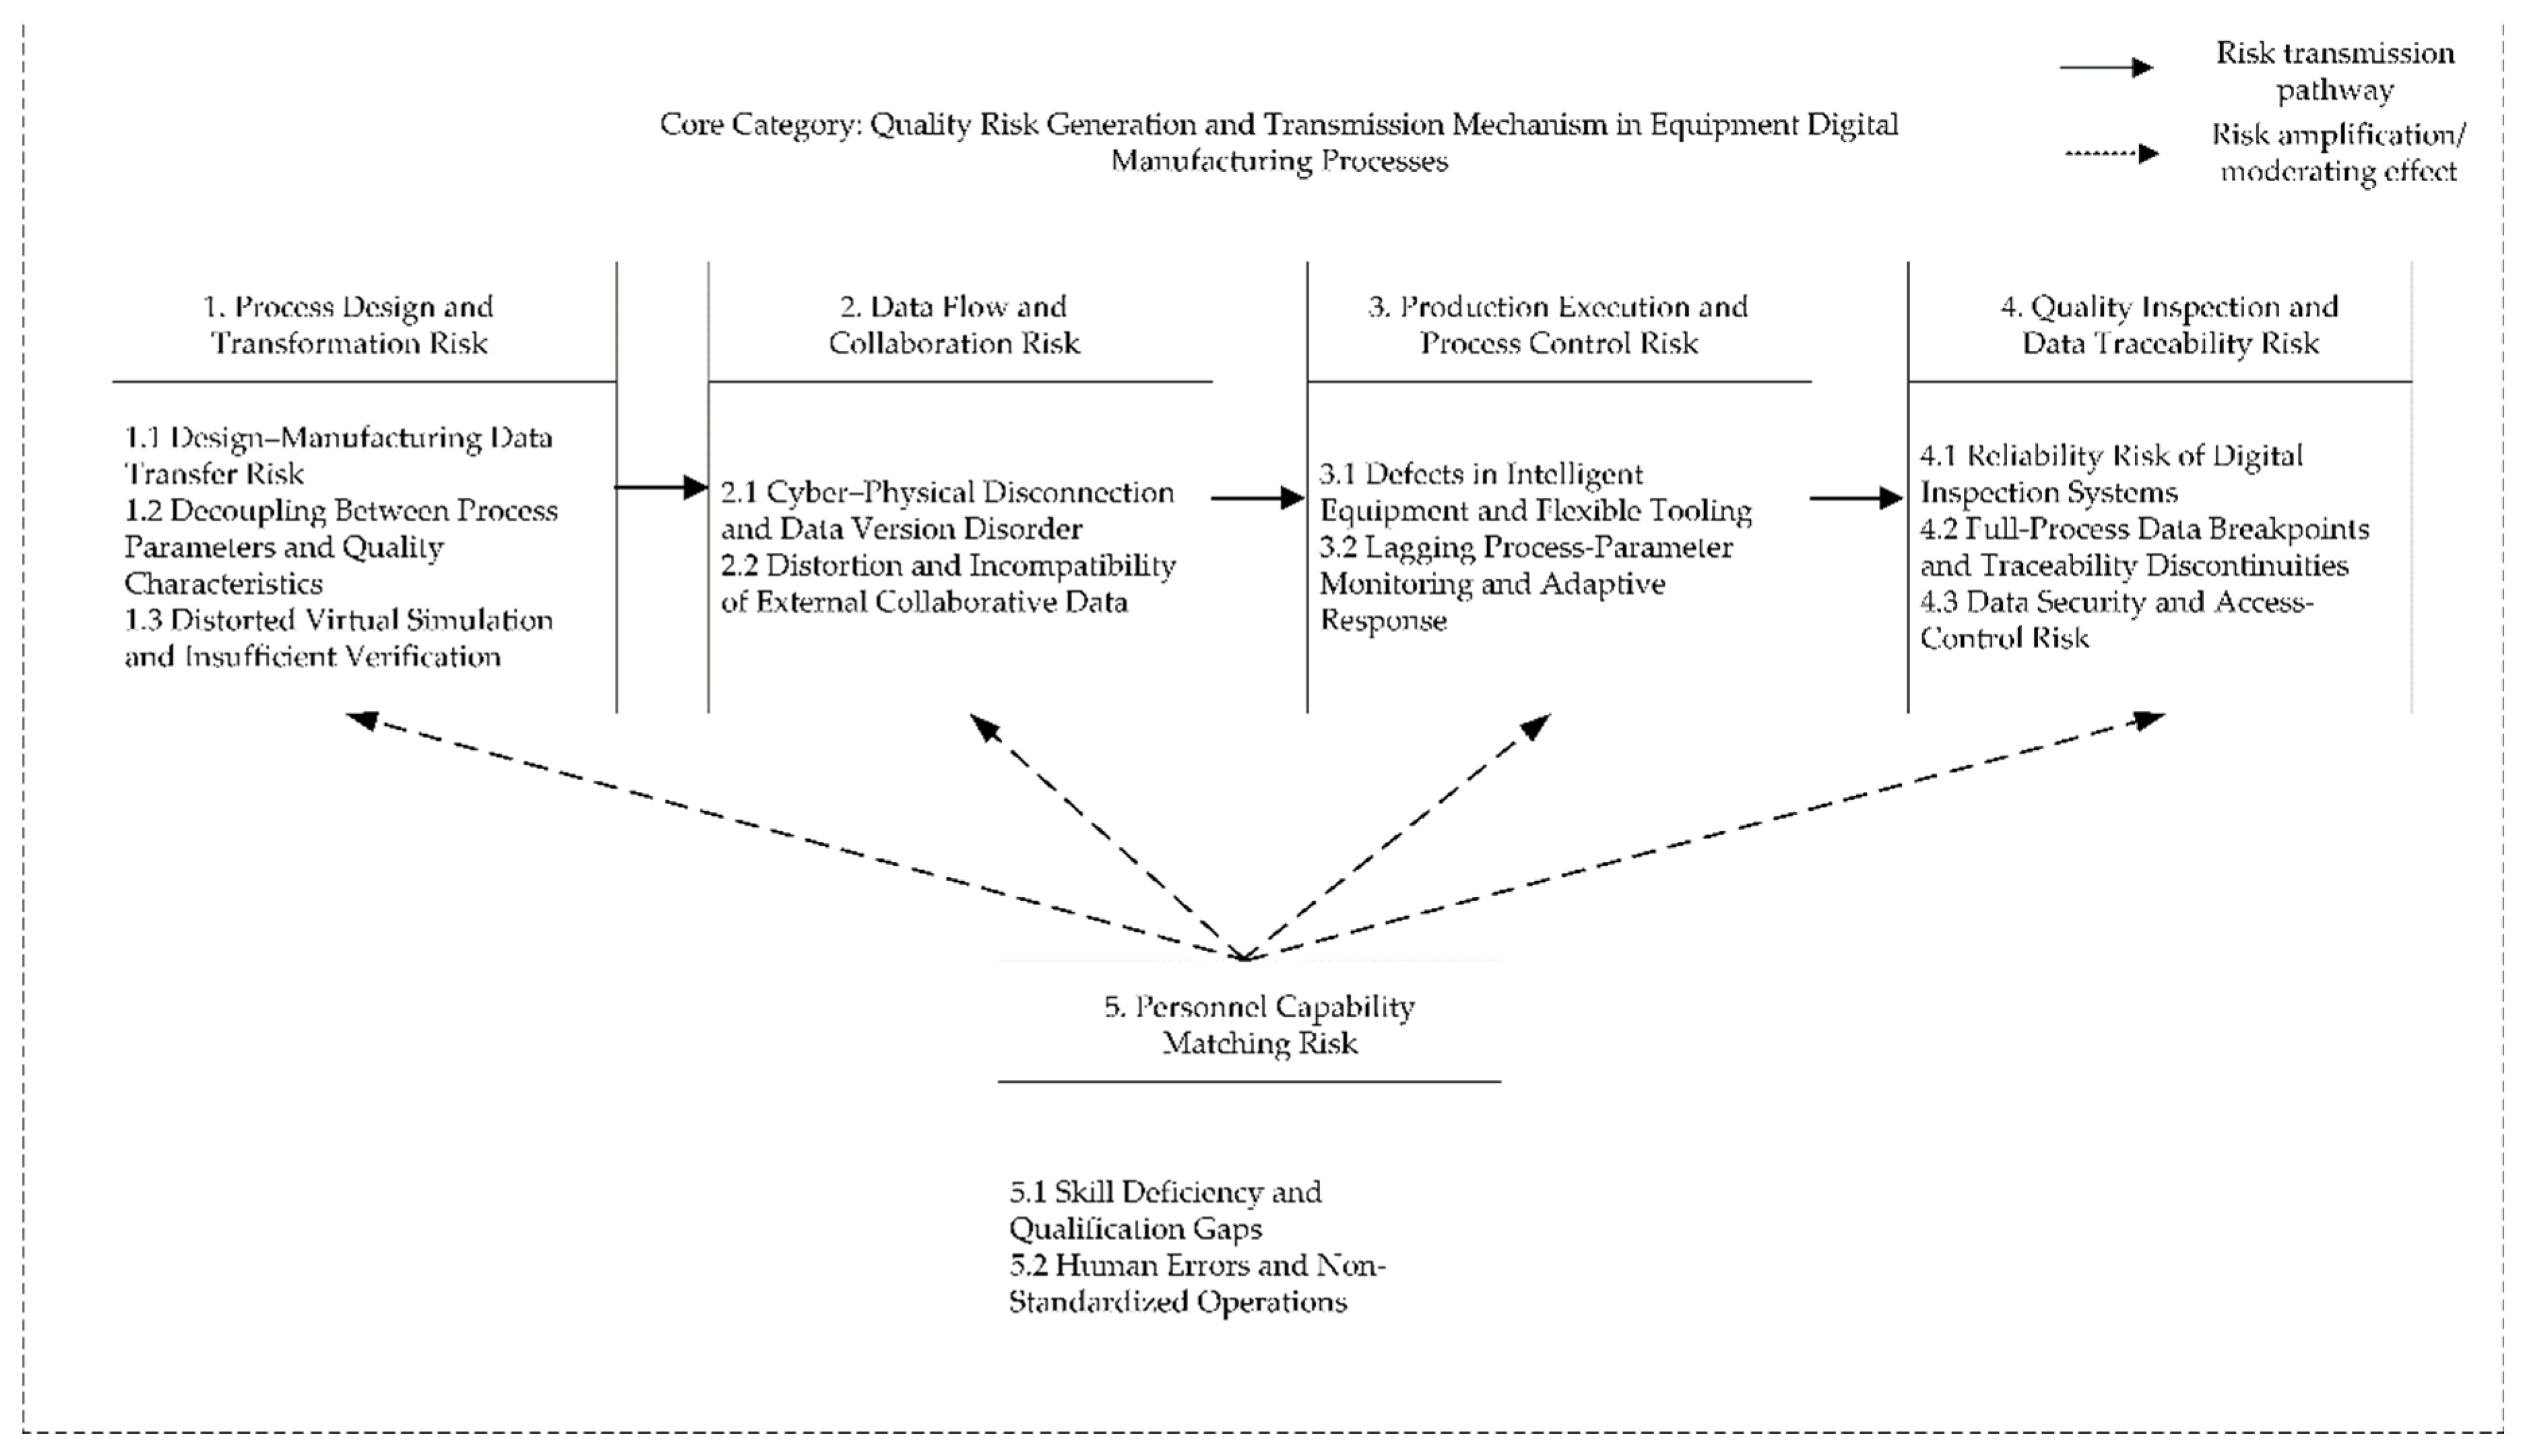
Figure 3.
CB-SEM-based hypothesized path model of quality risks in digitalized equipment manufacturing processes.
Figure 3.
CB-SEM-based hypothesized path model of quality risks in digitalized equipment manufacturing processes.
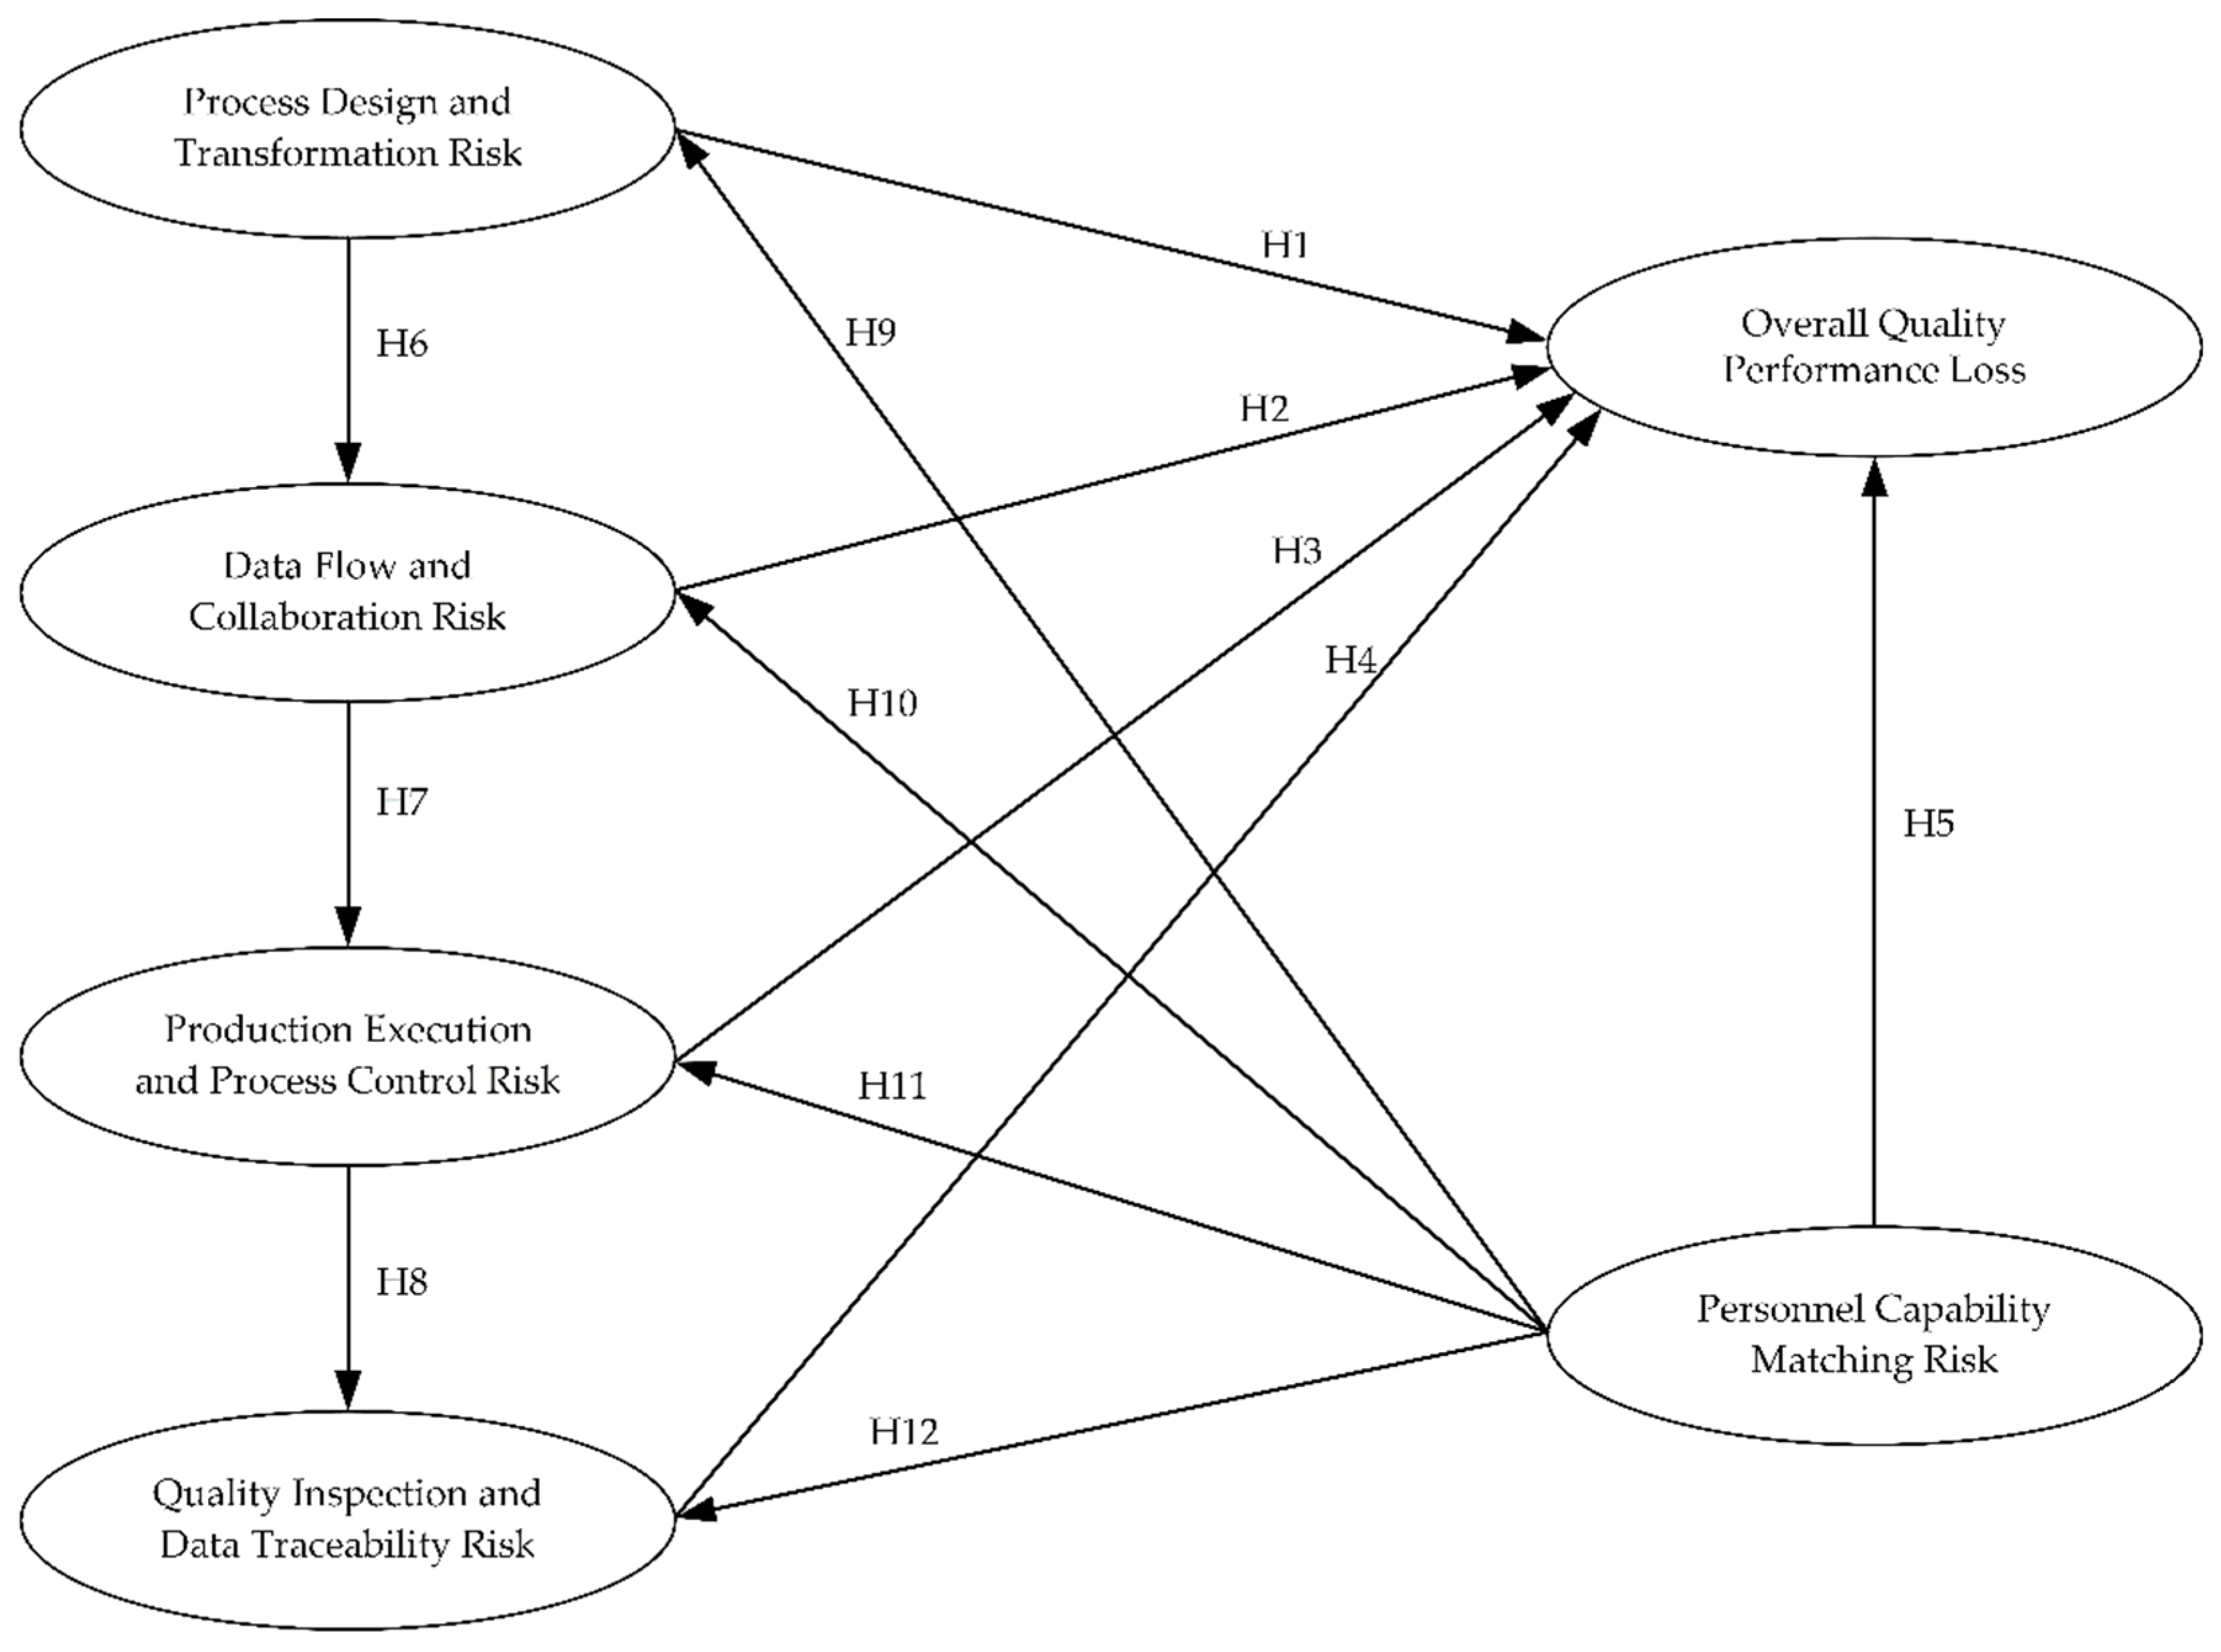
Figure 4.
Path diagram of the CB-SEM model with standardized coefficients. Note: Standardized path coefficients are reported; ** indicates , and *** indicates .
Figure 4.
Path diagram of the CB-SEM model with standardized coefficients. Note: Standardized path coefficients are reported; ** indicates , and *** indicates .
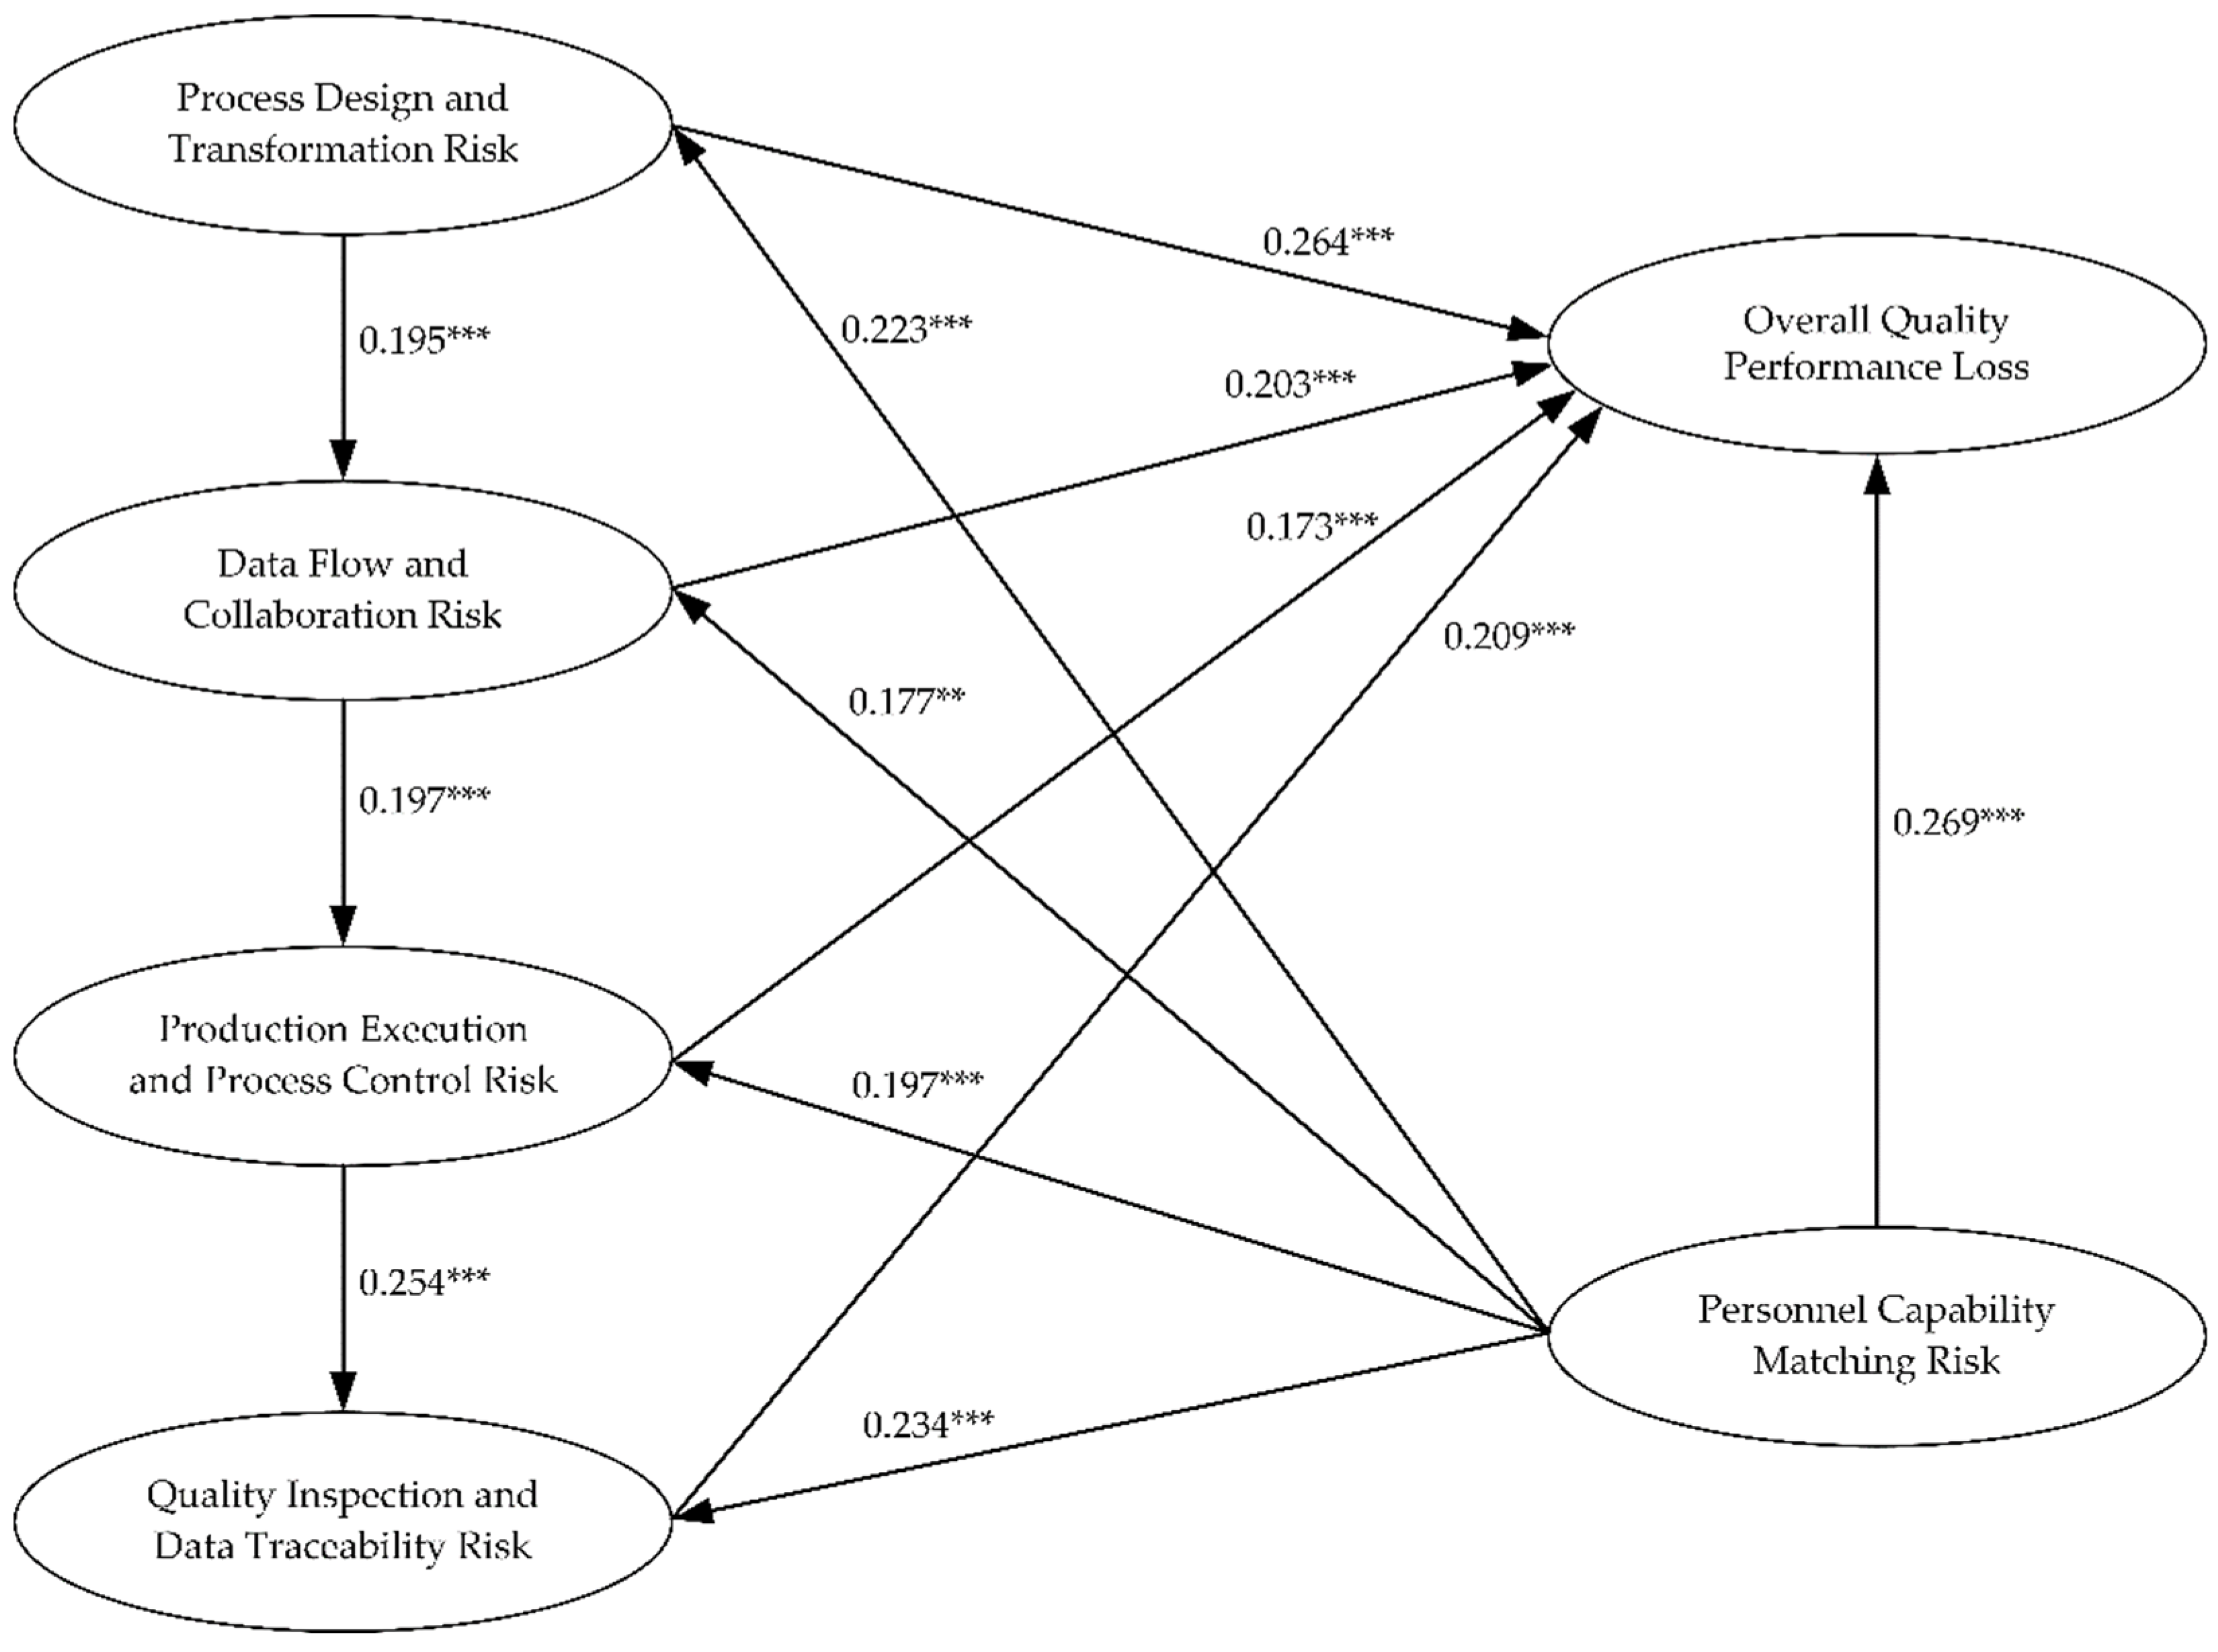
Figure 5.
SHAP global feature importance ranking.
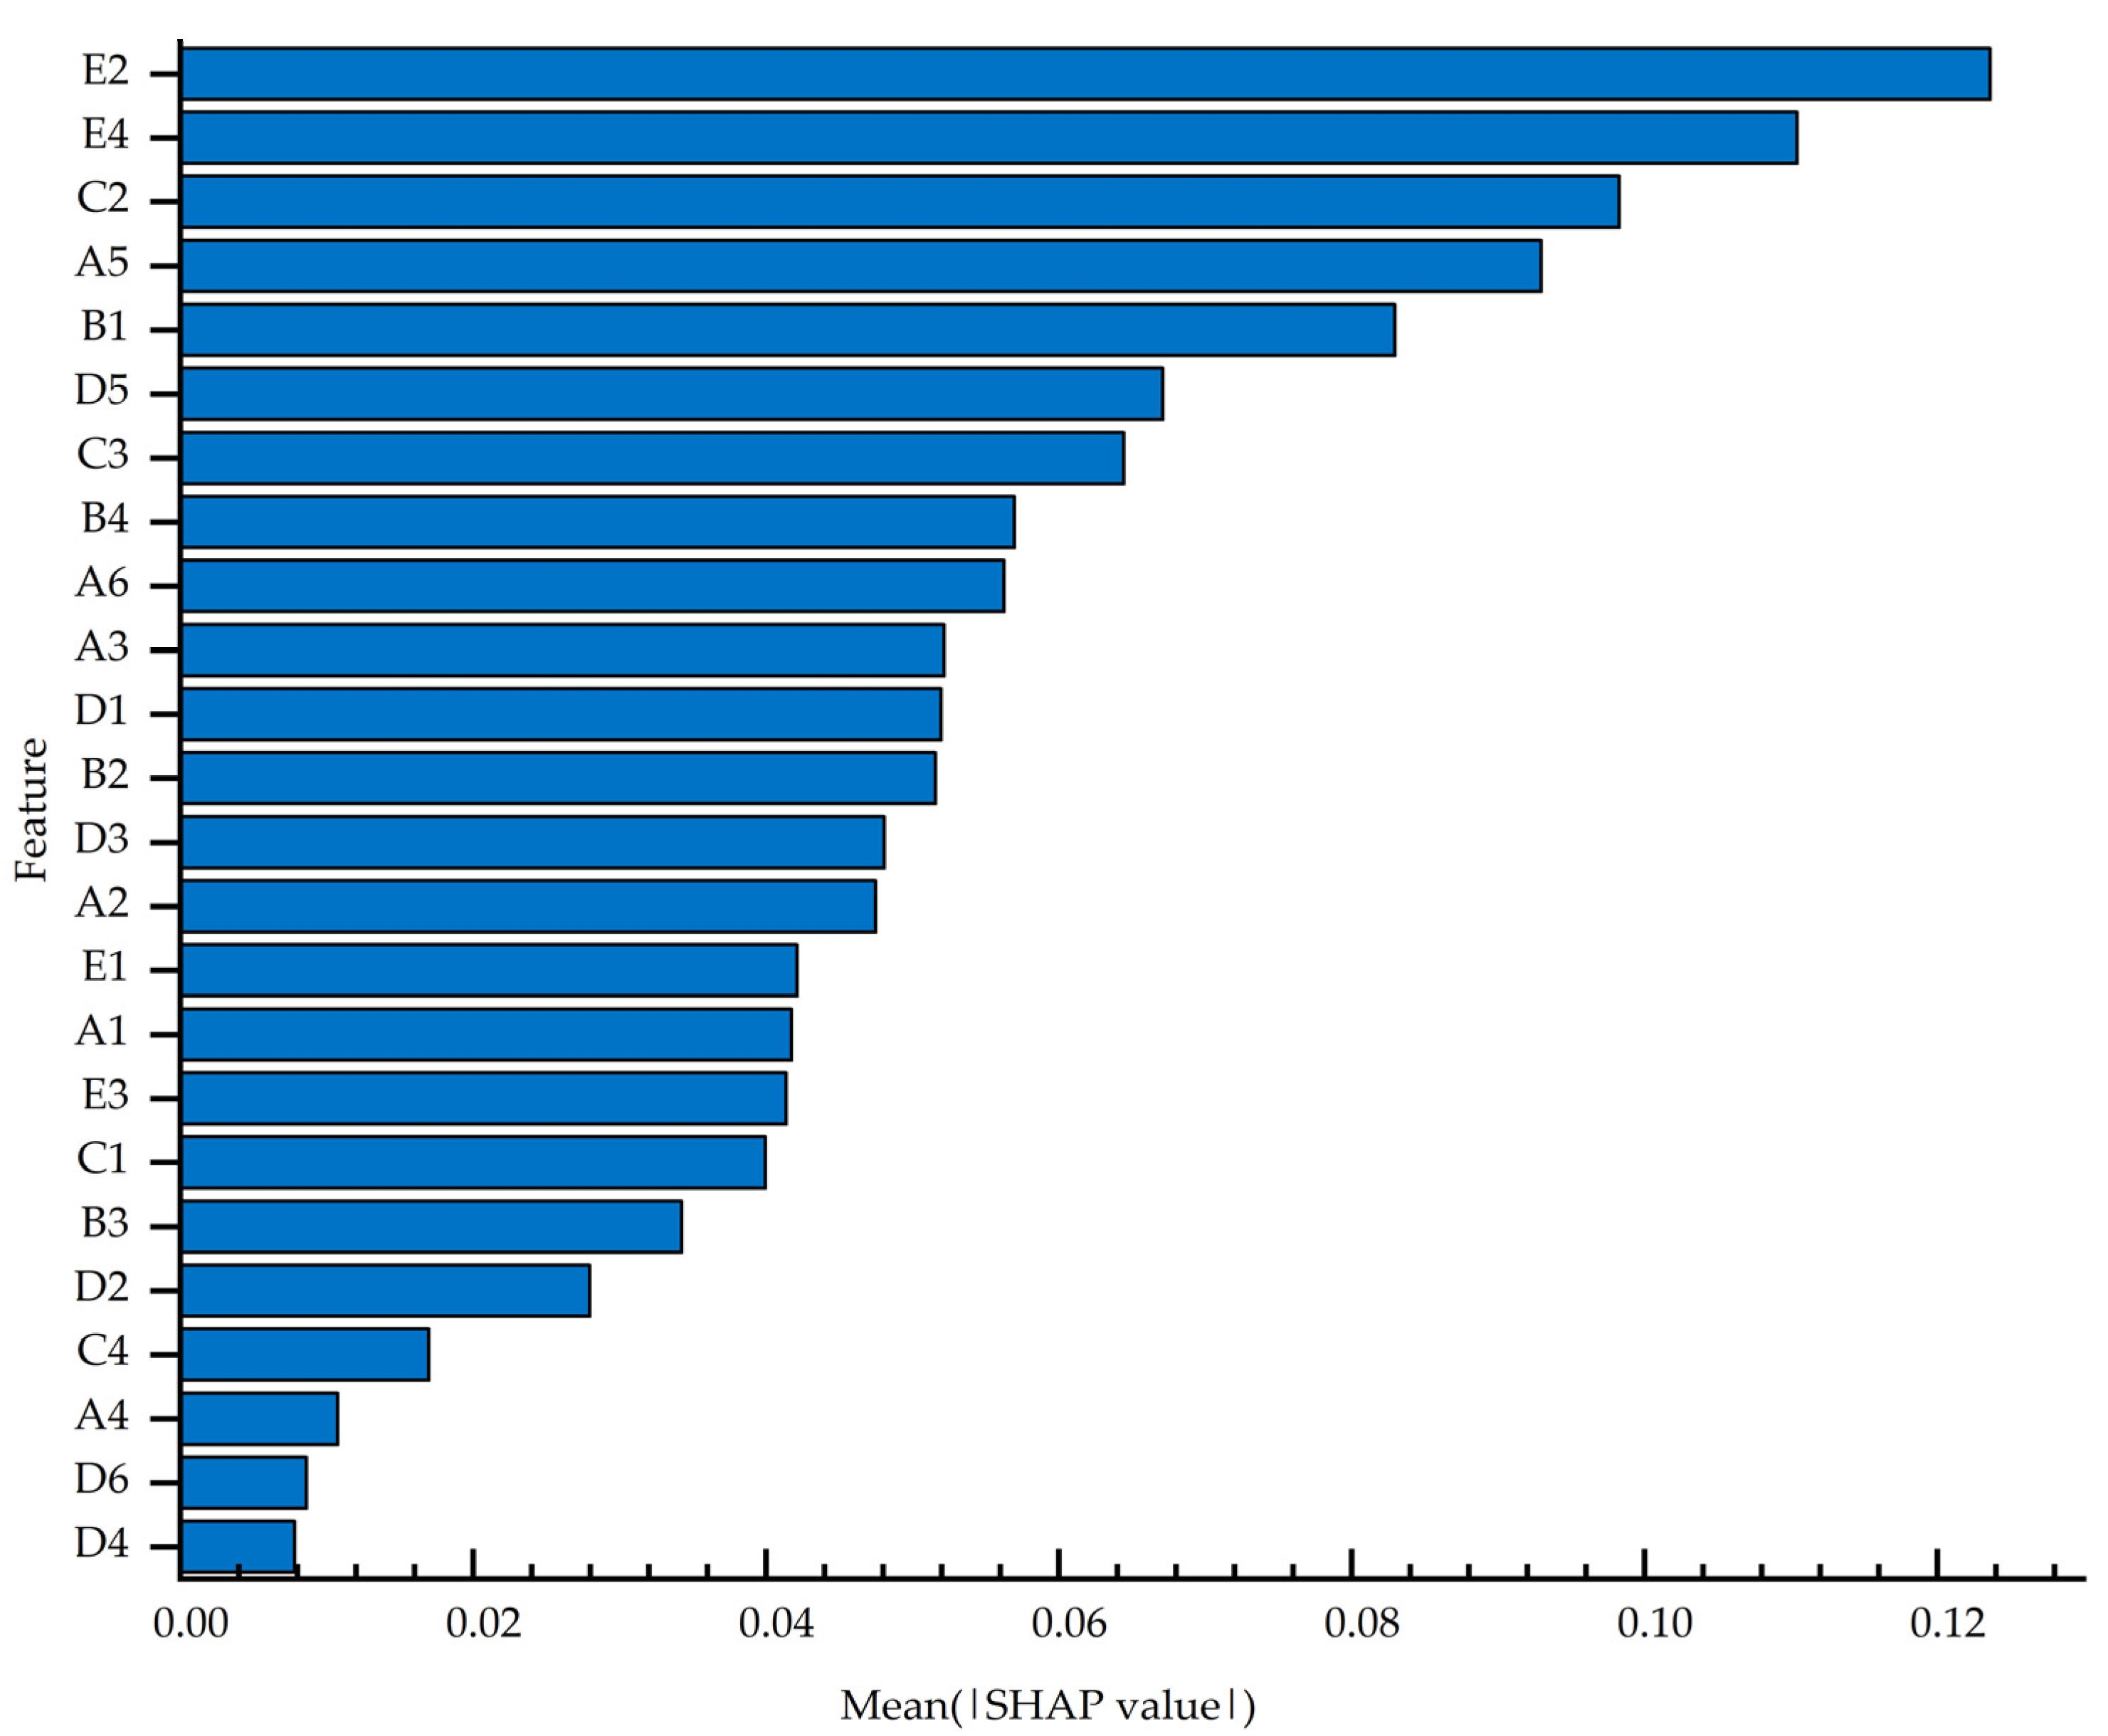
Figure 6.
SHAP beeswarm plot.
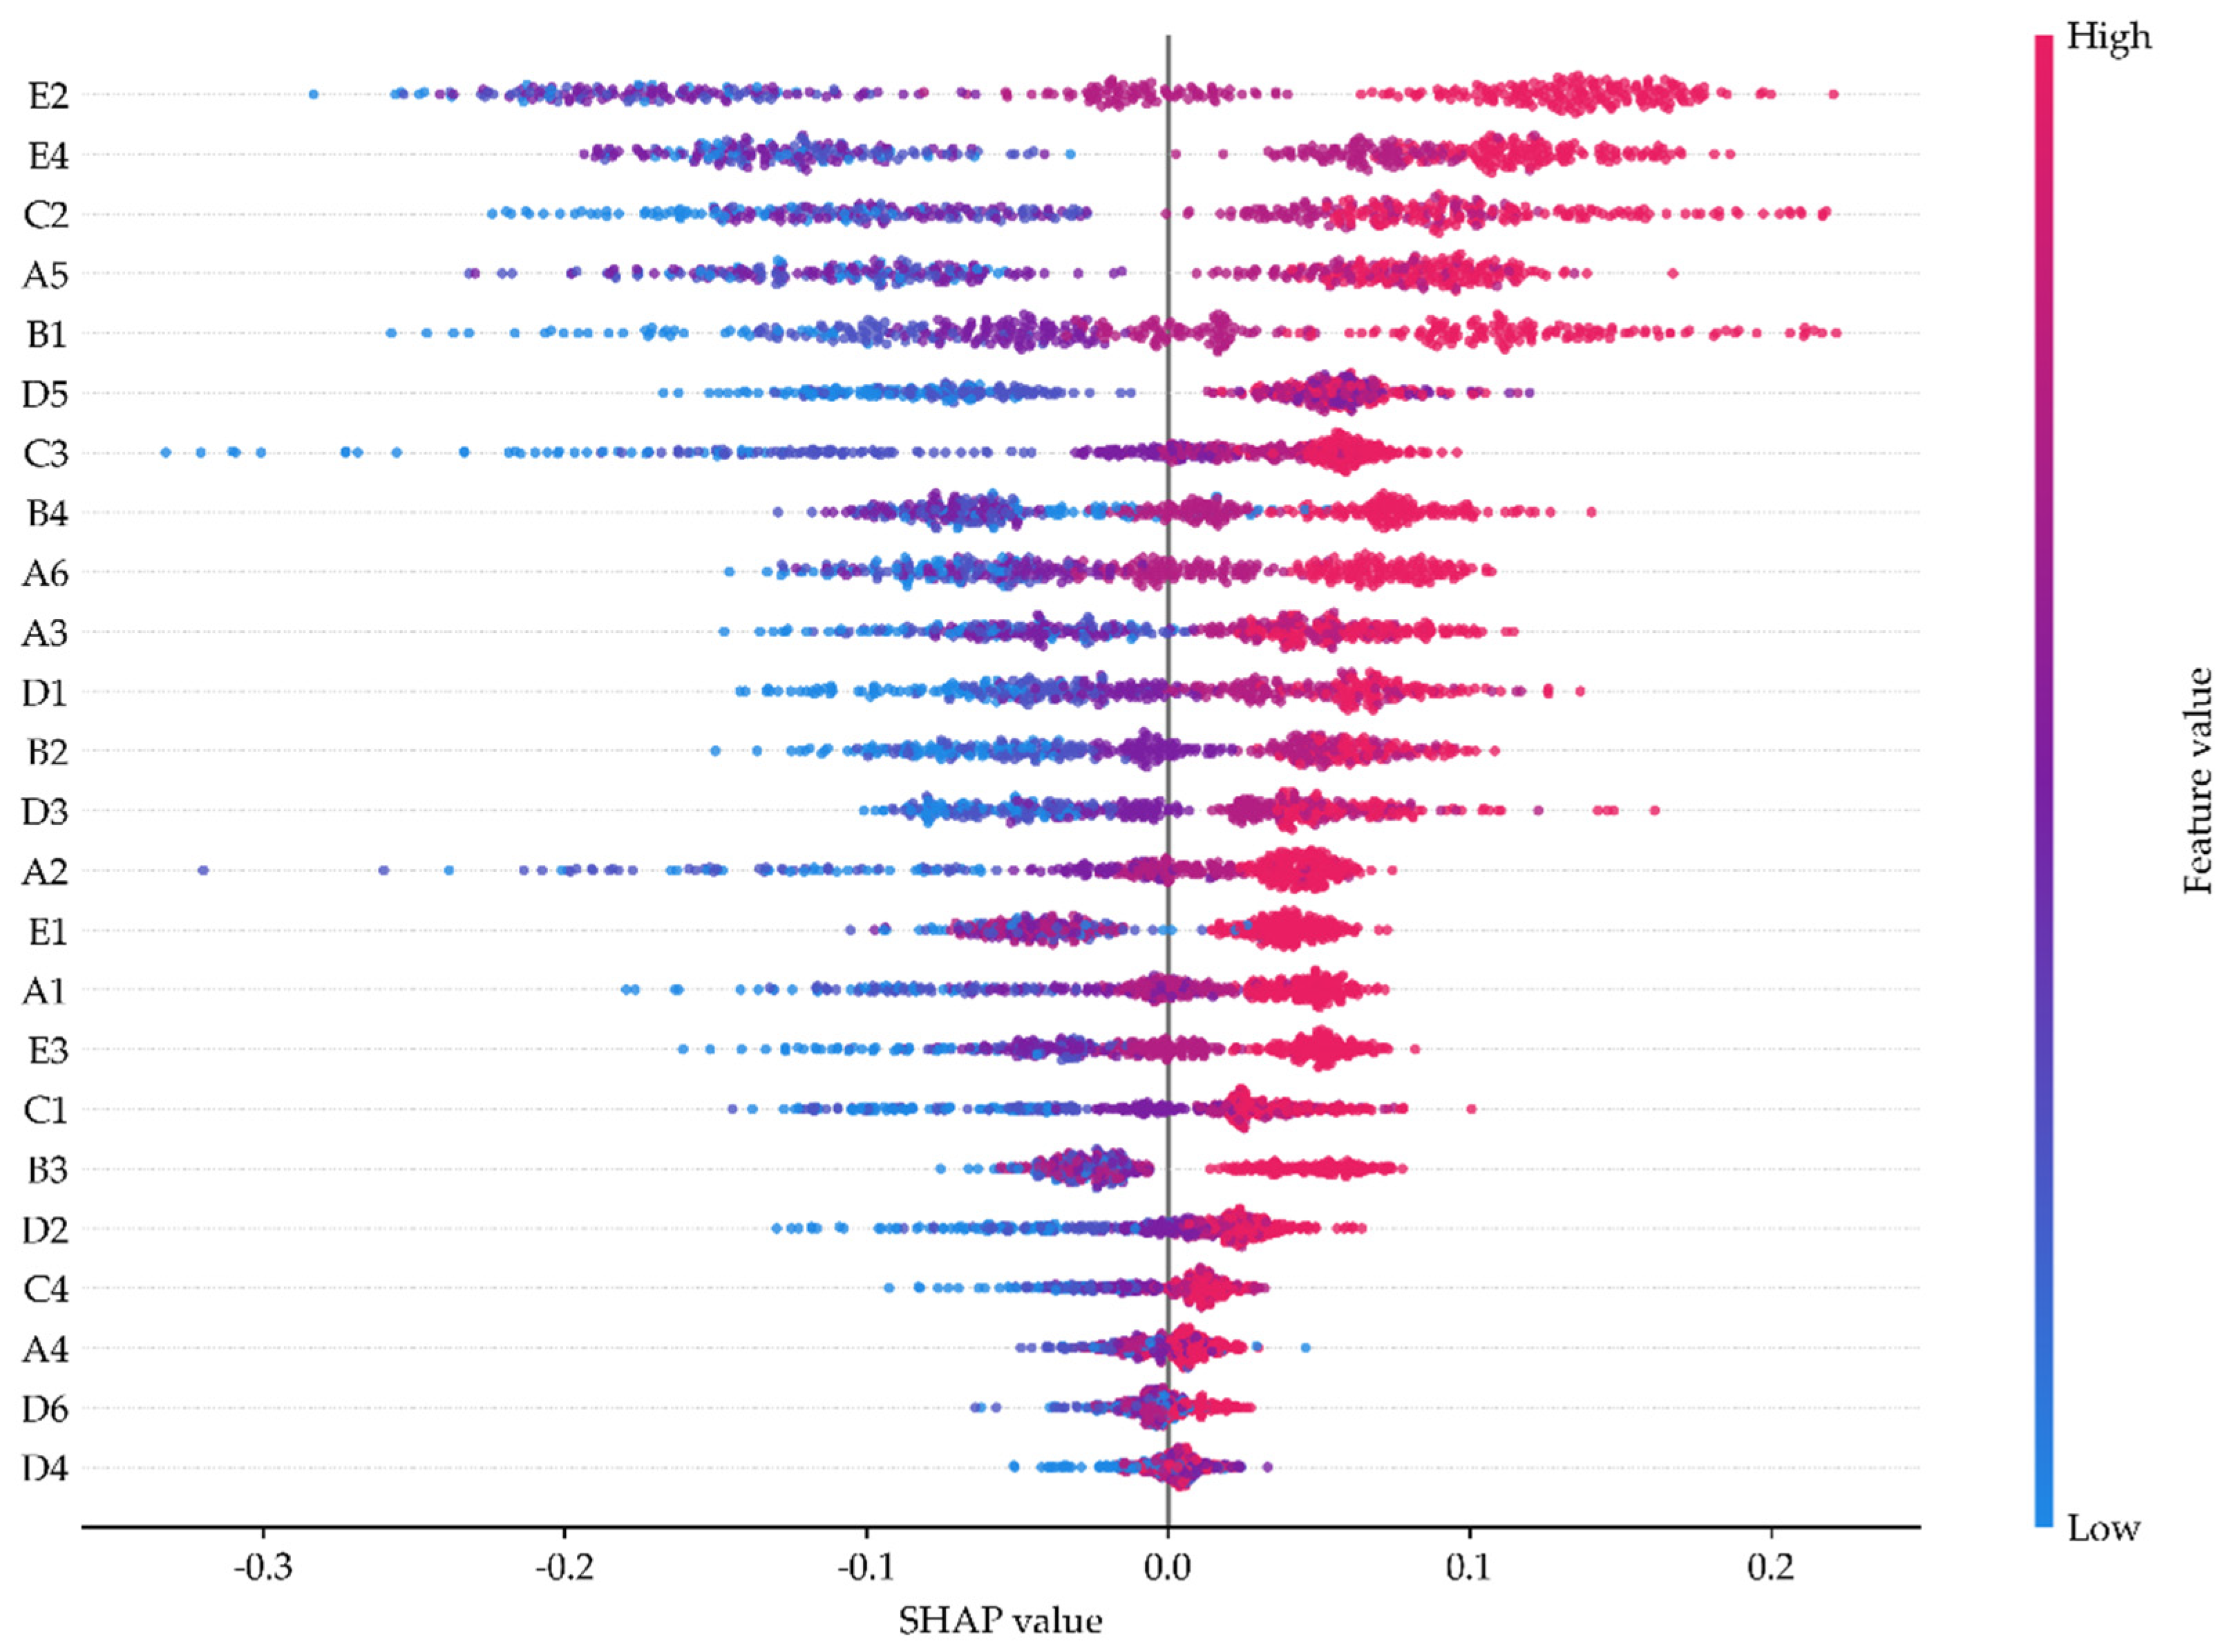
Figure 7.
SHAP aggregation results at the risk-dimension level: (a) total SHAP contribution percentages of different risk dimensions; (b) mean SHAP contributions of different risk dimensions.
Figure 7.
SHAP aggregation results at the risk-dimension level: (a) total SHAP contribution percentages of different risk dimensions; (b) mean SHAP contributions of different risk dimensions.
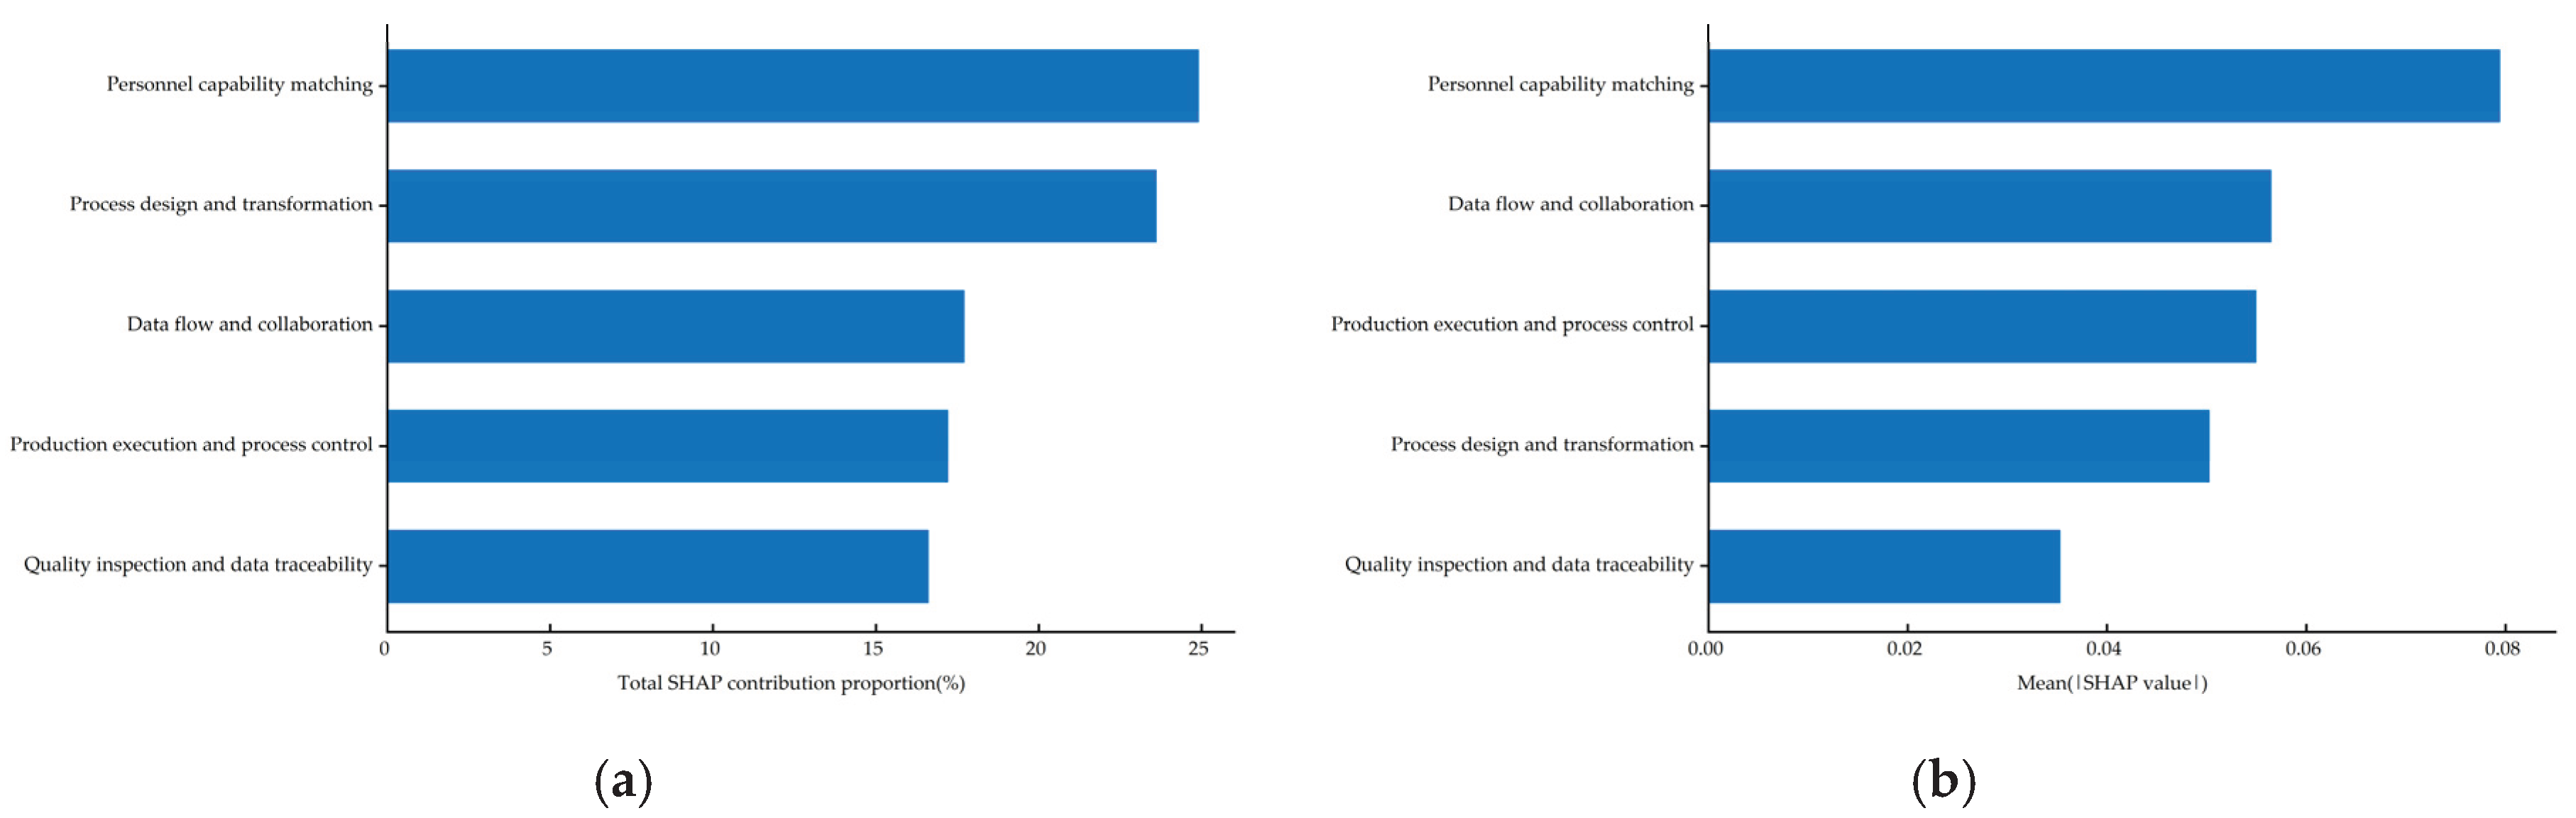
Table 1.
Coding rules for research variables.
| Variable type | Variable name | Variable symbol | Item code | Number of items |
| Quality risk variables | Process design and transformation risk | A | A1–A6 | 6 |
| Data flow and collaboration risk | B | B1–B4 | 4 | |
| Production execution and process control risk | C | C1–C4 | 4 | |
| Quality inspection and data traceability risk | D | D1–D6 | 6 | |
| Personnel capability matching risk | E | E1–E4 | 4 | |
| Quality performance loss variable | Overall quality performance loss | Y | Y1–Y3 | 3 |
Note: A1–A6, B1–B4, C1–C4, D1–D6, and E1–E4 denote the 24 observed variables of quality risks. These variables are used to measure their corresponding latent variables in the structural equation model and serve as input features in the XGBoost model. Y1–Y3 denote the observed variables of overall quality performance loss and are used to construct the continuous output variable in the XGBoost model.
Table 2.
Distribution of basic sample information.
| Statistical variable | Category | Frequency | Percentage (%) |
| Manufacturing sector | Aerospace | 157 | 37.38 |
| Defense and military equipment | 126 | 30.00 | |
| High-end machine tools/precision equipment | 93 | 22.14 | |
| Other equipment manufacturing | 44 | 10.48 | |
| Respondent position type | Process design and planning personnel | 91 | 21.67 |
| Production/workshop management personnel | 60 | 14.29 | |
| On-site operation and execution personnel | 134 | 31.90 | |
| Quality inspection and control personnel | 99 | 23.57 | |
| Digital system operation and maintenance/data management personnel | 36 | 8.57 | |
| Relevant work experience | 3 years or less | 68 | 16.19 |
| 4–6 years | 169 | 40.24 | |
| 7–10 years | 125 | 29.76 | |
| More than 10 years | 58 | 13.81 | |
| Main routine participation links | MBD modeling and process design | 201 | 47.86 |
| Cross-departmental data collaborative circulation | 229 | 54.52 | |
| Production-site execution and process control | 279 | 66.43 | |
| Digital quality inspection and data traceability | 267 | 63.57 | |
| Full-process quality system management | 150 | 35.71 |
Note: The item “Main routine participation links” is a multiple-response item; therefore, the sum of percentages exceeds 100%.
Table 3.
Hyperparameter search space for the XGBoost model.
| Hyperparameter | Code name | Search range | Description |
| Number of decision trees | n_estimators | 100, 200, 300, 500, 800 | Number of regression trees in the XGBoost ensemble model |
| Maximum tree depth | max_depth | 2, 3, 4, 5, 6 | Maximum depth of a single tree, used to control model complexity |
| Learning rate | learning_rate | 0.01, 0.03, 0.05, 0.08, 0.10 | Contribution weight of each tree to the final prediction |
| Subsample ratio | subsample | 0.6, 0.7, 0.8, 0.9, 1.0 | Proportion of samples randomly selected for training each tree |
| Feature subsample ratio | colsample_bytree | 0.6, 0.7, 0.8, 0.9, 1.0 | Proportion of features randomly selected for training each tree |
| Minimum child weight | min_child_weight | 1, 2, 3, 5, 7 | Minimum sum of instance weights required for a child node to be further split |
| Minimum loss reduction for splitting | gamma | 0, 0.01, 0.05, 0.1, 0.2 | Minimum loss reduction required to make a further split on a leaf node |
| L1 regularization coefficient | reg_alpha | 0, 0.001, 0.01, 0.05, 0.1 | Controls model sparsity and reduces overfitting |
| L2 regularization coefficient | reg_lambda | 0.5, 1, 2, 5, 10 | Controls model complexity and enhances generalization ability |
Table 4.
Examples of open coding.
| Original interview excerpt | Initial concept | Initial category |
| “The MBD model transferred from the design stage sometimes shows missing geometric features when imported into our process software, or the three-dimensional PMI annotations, such as tolerances and roughness, are lost or unclear.” | Missing geometric features in the model; loss of three-dimensional PMI annotations | Loss of model semantics |
| “The dimensions measured using the three-coordinate measuring machine were clearly qualified, but because the process parameters were not properly set, the residual stress inside the part was not released. The part soon experienced fatigue fracture after installation.” | Focusing only on geometric dimensional conformity; neglecting physical performance indicators; residual internal stress | Detachment of physical properties |
| “The cutting simulation in the software uses the standard machine tool and tool library, which differs greatly from the aging condition and clamping method of the actual workshop equipment. The simulation appears fine, but tool interference and collision can easily occur during machining.” | Idealized simulation boundary conditions; neglect of actual equipment conditions; gap between virtual and real operating conditions | Distortion of simulation boundary conditions |
| “The data interfaces between upstream and downstream systems were not fully connected. The MES program issuing process was delayed, and the workers did not notice it, so they called a discarded NC program from the previous local version.” | Heterogeneous system interfaces not fully connected; delay in data issuing; incorrect invocation of an outdated program | Version synchronization delay |
| “After several years of use, the guideway accuracy of the high-end five-axis machine tool deteriorated. However, the control system did not issue an alarm, and the machining trajectory deviated slightly by several hundredths of a millimeter, which could not be detected by the naked eye.” | Hidden degradation of equipment accuracy; no early warning from the underlying control system; slight deviation of the machining trajectory | Equipment accuracy degradation |
| “Key parameters such as heat-treatment furnace temperature and spindle load sometimes fluctuate greatly. When the system monitoring is disconnected or data acquisition is delayed, hidden defects such as burns and microcracks are likely to occur.” | Instantaneous fluctuation of key parameters; blind spots in data acquisition; no early warning from the monitoring system | Failure of condition monitoring |
| “If the three-coordinate measuring machine and online visual inspection equipment are not calibrated for a long time, accuracy drift may occur. Sometimes the algorithm fitting has errors, leading to missed detection or misclassification, where nonconforming products are judged as qualified.” | Fitting errors in vision algorithms; uncalibrated inspection equipment; release of nonconforming products | Algorithmic fitting misjudgment |
| “On-site data on processes, equipment, and personnel are incompletely collected, and QR-code binding is not standardized. When quality problems are found later, it is sometimes impossible to determine which machine tool or which operator was responsible.” | Incomplete collection of production elements; non-standardized identification-code binding; inability to trace root causes backward | Failure of root-cause traceability |
Table 5.
Selected results of axial coding.
| Main category | Subcategory | Included initial categories | Category connotation |
| Process design and transformation risk | Design–manufacturing data transfer risk | Loss of model semantics; design intent interpretation deviation | When the MBD model is parsed across heterogeneous software platforms, geometric features and PMI data may be lost. In addition, process engineers may have cognitive deviations in interpreting design intent, resulting in defective input at the source of manufacturing. |
| Data flow and collaboration risk | Virtual–physical disconnection and data version disorder | System data incompatibility; Version synchronization delay | Due to data-interface barriers among the PLM system, MES, and shop-floor equipment, engineering changes may not be issued in real time, causing operators to mistakenly invoke outdated three-dimensional models or NC programs. |
| Production execution and process control risk | Intelligent manufacturing equipment and flexible tooling defects | Equipment accuracy degradation; underlying control failure | High-end CNC equipment may undergo latent accuracy degradation, such as guideway wear and thermal drift, due to long-term high-load operation. Alternatively, transient failures may occur in the underlying servo-control logic, while the CNC system fails to trigger alarms or compensation mechanisms, resulting in microscopic deviations in the machining trajectory. |
| Quality inspection and data traceability risk | Digital inspection system reliability risk | Inspection accuracy drift; Algorithmic fitting misjudgment | Automated inspection equipment, such as online visual inspection systems and coordinate measuring machines, may experience accuracy drift due to long-term high-frequency use or lack of regular calibration. In addition, image-recognition algorithms may have fitting limitations, leading to missed detection or misjudgment of marginal quality defects. |
Table 6.
Correspondence between latent and observed variables.
| Latent variable | Abbreviation (code) | Observed variable (code) |
| Process design and transformation risk | Process design risk (A) | Loss of model semantics (A1) |
| Design intent interpretation deviation (A2) | ||
| Detachment of physical properties (A3) | ||
| Missing key parameters (A4) | ||
| Distortion of simulation boundary conditions (A5) | ||
| Detachment of verification conditions (A6) | ||
| Data flow and collaboration risk | Collaboration risk (B) | System data incompatibility (B1) |
| Version synchronization delay (B2) | ||
| Distortion of outsourced models (B3) | ||
| Data format barriers (B4) | ||
| Production execution and process control risk | Execution risk (C) | Equipment accuracy degradation (C1) |
| Underlying control failure (C2) | ||
| Failure of condition monitoring (C3) | ||
| Lagged control response (C4) | ||
| Quality inspection and data traceability risk | Inspection risk (D) | Inspection accuracy drift (D1) |
| Algorithmic fitting misjudgment (D2) | ||
| Discontinuity in data collection (D3) | ||
| Failure of root-cause traceability (D4) | ||
| Loss of data access control (D5) | ||
| Unauthorized modification of records (D6) | ||
| Personnel capability matching risk | Personnel risk (E) | Unfamiliarity with software operation (E1) |
| Lack of pre-job certification (E2) | ||
| Fatigue-induced negligence errors (E3) | ||
| Non-compliant step-skipping operation (E4) | ||
| Overall quality performance loss | Overall loss (Y) | Internal quality loss (Y1) |
| External quality feedback (Y2) | ||
| Batch quality fluctuation (Y3) |
Note: To maintain concise expression, subsequent tables uniformly use the form “abbreviation (code)” to denote latent variables.
Table 7.
Results of exploratory factor analysis.
| Latent variable | Items | Factor loading range | Cross-loading status |
| Process design risk (A) | A1–A6 | 0.792–0.883 | No obvious cross-loading |
| Collaboration risk (B) | B1–B4 | 0.787–0.872 | No obvious cross-loading |
| Execution risk (C) | C1–C4 | 0.835–0.891 | No obvious cross-loading |
| Inspection risk (D) | D1–D6 | 0.837–0.886 | No obvious cross-loading |
| Personnel risk (E) | E1–E4 | 0.818–0.897 | No obvious cross-loading |
| Overall loss (Y) | Y1–Y3 | 0.783–0.801 | No obvious cross-loading |
Table 8.
Results of reliability and convergent validity tests.
| Latent variable | Items | Standardized factor loading | Cronbach’s α | CR | AVE |
| Process design risk (A) | A1–A6 | 0.744–0.876 | 0.918 | 0.92 | 0.657 |
| Collaboration risk (B) | B1–B4 | 0.729–0.863 | 0.885 | 0.888 | 0.665 |
| Execution risk (C) | C1–C4 | 0.790–0.902 | 0.915 | 0.916 | 0.733 |
| Inspection risk (D) | D1–D6 | 0.828–0.900 | 0.945 | 0.945 | 0.742 |
| Personnel risk (E) | E1–E4 | 0.786–0.880 | 0.898 | 0.901 | 0.694 |
| Overall loss (Y) | Y1–Y3 | 0.810–0.888 | 0.88 | 0.882 | 0.713 |
| Overall scale | — | — | 0.903 | — | — |
Table 9.
Results of discriminant validity test.
| Variable | Process design risk (A) | Collaboration risk (B) | Execution risk (C) | Inspection risk (D) | Personnel risk (E) | Overall loss (Y) |
| Process design risk (A) | 0.811 | |||||
| Collaboration risk (B) | 0.233 | 0.815 | ||||
| Execution risk (C) | 0.12 | 0.239 | 0.856 | |||
| Inspection risk (D) | 0.127 | 0.128 | 0.31 | 0.861 | ||
| Personnel risk (E) | 0.221 | 0.22 | 0.24 | 0.294 | 0.833 | |
| Overall loss (Y) | 0.416 | 0.39 | 0.38 | 0.399 | 0.473 | 0.844 |
Note: Diagonal elements represent the square roots of AVE, whereas off-diagonal elements represent the correlations between latent variables.
Table 10.
Fit indices of the structural model.
| Fit index | RMSEA | RMR | GFI | AGFI | CFI | TLI | IFI | |
| Recommended threshold | < 3 | < 0.08 | < 0.08 | > 0.90 | > 0.90 | > 0.90 | > 0.90 | > 0.90 |
| Model value | 1.204 | 0.022 | 0.058 | 0.939 | 0.926 | 0.992 | 0.991 | 0.992 |
Table 11.
Hypothesized path testing results.
| Hypothesis | Path relationship | Standardized path coefficient | S.E. | C.R. | P value | Conclusion |
| H1 | Process design risk (A) → Overall loss (Y) | 0.264 | 0.049 | 5.764 | *** | Supported |
| H2 | Collaboration risk (B) →Overall loss (Y) |
0.203 | 0.055 | 4.279 | *** | Supported |
| H3 | Execution risk (C) → Overall loss (Y) |
0.173 | 0.046 | 3.694 | *** | Supported |
| H4 | Inspection risk (D) → Overall loss (Y) |
0.209 | 0.046 | 4.512 | *** | Supported |
| H5 | Personnel risk (E) →Overall loss (Y) |
0.269 | 0.053 | 5.592 | *** | Supported |
| H6 | Process design risk (A) → Collaboration risk (B) | 0.195 | 0.051 | 3.575 | *** | Supported |
| H7 | Collaboration risk (B) → Execution risk (C) |
0.197 | 0.063 | 3.648 | *** | Supported |
| H8 | Execution risk (C) → Inspection risk (D) |
0.254 | 0.051 | 4.94 | *** | Supported |
| H9 | Personnel risk (E) → Process design risk (A) |
0.223 | 0.054 | 4.201 | *** | Supported |
| H10 | Personnel risk (E) → Collaboration risk (B) |
0.177 | 0.052 | 3.241 | ** | Supported |
| H11 | Personnel risk (E) → Execution risk (C) |
0.197 | 0.059 | 3.696 | *** | Supported |
| H12 | Personnel risk (E) →Inspection risk (D) |
0.234 | 0.057 | 4.519 | *** | Supported |
Table 12.
Mediation effect testing results based on the Bootstrap method.
| No. | Indirect effect transmission path | Total indirect effect | Bootstrap 95% confidence interval | Pvalue | Conclusion |
| 1 | Personnel risk (E) → Overall loss (Y) |
0.207 | [0.162, 0.307] | < 0.001 | Significant |
| 2 | Process design risk (A) → Overall loss (Y) | 0.048 | [0.023, 0.094] | < 0.001 | Significant |
| 3 | Collaboration risk (B) → Overall loss (Y) | 0.045 | [0.022, 0.096] | < 0.001 | Significant |
| 4 | Execution risk (C) → Overall loss (Y) |
0.053 | [0.025, 0.093] | < 0.001 | Significant |
| 5 | Personnel risk (E) → Inspection risk (D) |
0.081 | [0.036, 0.113] | < 0.001 | Significant |
| 6 | Process design risk (A) → Inspection risk (D) | 0.013 | [0.004, 0.024] | < 0.001 | Significant |
Table 13.
Decomposition of standardized effects of risk dimensions on overall quality performance loss.
Table 13.
Decomposition of standardized effects of risk dimensions on overall quality performance loss.
| Independent variable |
Direct effect |
Indirect effect |
Total effect | Proportion of indirect effect (%) |
| Personnel risk (E) | 0.269 | 0.207 | 0.476 | 43.5 |
| Process design risk (A) | 0.264 | 0.048 | 0.312 | 15.4 |
| Collaboration risk (B) | 0.203 | 0.045 | 0.247 | 18.2 |
| Execution risk (C) | 0.173 | 0.053 | 0.226 | 23.5 |
| Inspection risk (D) | 0.209 | — | 0.209 | — |
Table 14.
Predictive performance indicators of the XGBoost model.
| Dataset | R2 | RMSE | MAE |
| Training set | 0.6931 | 0.6513 | 0.5356 |
| Test set | 0.3611 | 1.0244 | 0.8593 |
| Five-fold cross-validation |
— | 0.9635 | — |
Table 15.
SHAP contributions of the top 10 quality risk items.
| Rank | Item code | Risk connotation | Dimension | Mean |SHAP| |
| 1 | E2 | Lack of pre-job certification | Personnel risk | 0.124 |
| 2 | E4 | Non-compliant step-skipping operation | Personnel risk | 0.110 |
| 3 | C2 | Underlying control failure | Execution risk | 0.098 |
| 4 | A5 | Distortion of simulation boundary conditions | Process design risk | 0.093 |
| 5 | B1 | System data incompatibility | Collaboration risk | 0.083 |
| 6 | D5 | Loss of data access control | Inspection risk | 0.067 |
| 7 | C3 | Failure of condition monitoring | Execution risk | 0.064 |
| 8 | B4 | Data format barriers | Collaboration risk | 0.057 |
| 9 | A6 | Detachment of verification conditions | Process design risk | 0.056 |
| 10 | A3 | Detachment of physical properties | Process design risk | 0.052 |
Disclaimer/Publisher’s Note: The statements, opinions and data contained in all publications are solely those of the individual author(s) and contributor(s) and not of MDPI and/or the editor(s). MDPI and/or the editor(s) disclaim responsibility for any injury to people or property resulting from any ideas, methods, instructions or products referred to in the content. |
© 2026 by the authors. Licensee MDPI, Basel, Switzerland. This article is an open access article distributed under the terms and conditions of the Creative Commons Attribution (CC BY) license (http://creativecommons.org/licenses/by/4.0/).
Copyright: This open access article is published under a Creative Commons CC BY 4.0 license, which permit the free download, distribution, and reuse, provided that the author and preprint are cited in any reuse.


