Submitted:
24 June 2026
Posted:
25 June 2026
You are already at the latest version
Abstract
Following the 2021 Montiferru wildfire, one of the largest wildfire events in modern Italian history, assessing the suitability of olive-growing environments for high-quality extra virgin olive oil (EVOO) production is crucial for supporting sustainable agricultural restoration. This study models the spatial distribution and temporal stability of total polyphenol concentration in EVOO (cv. Bosana) across a complex Mediterranean landscape. Olive samples from georeferenced sites were collected during the 2022 and 2023 harvest seasons and processed using a standardized protocol. Spatial modeling was performed via Empirical Bayesian Kriging Regression Prediction (EBKRP), integrating seven bioclimatic and topographic covariates. Cross-validation demonstrated high predictive accuracy with negligible bias for both years. While single-predictor correlations were weak, multi-variable analysis highlighted a strong interaction between topography and water balance driving phenolic accumulation. The mean prediction map identified regional hotspots exceeding 700 mg kg⁻¹ of polyphenols content in the obtained olive oils. Spatial overlay analysis successfully delineated “Stable High-Phenolic Core Areas” (>500 mg kg⁻¹ with interannual variation <100 mg kg⁻¹), filtering out high-altitude marginal zones. This geostatistical approach provides a valuable territorial decision-making tool to support post-fire agricultural reconversion and the valorization of high-quality monovarietal EVOO terroirs.
Keywords:
olive oil polyphenols
; empirical Bayesian kriging regression prediction
; GIS-based spatial modelling
; olive-growing terroir
; post-fire agricultural landscapes
1. Introduction
Extra virgin olive oil (EVOO) is one of the most relevant products of Mediterranean agriculture and a fundamental component of the Mediterranean diet. In addition to its nutritional value, EVOO is recognized as an important source of bioactive compounds that contribute to both technological quality (shelf life) and human health. Among these compounds, phenolic substances play a central role because they are responsible for antioxidant activity, oxidative stability, bitterness, pungency and several health-promoting properties associated with olive oil consumption [1,2,3,4]. Phenolic compounds are one of the fundamental quality traits of virgin olive oil. Their concentration influences shelf-life by protecting the lipid fraction from oxidative degradation by photo-oxidation and auto-oxidation and contributes significantly to quality attributes, particularly through bitterness and pungency, which are recognized as positive sensory descriptors of high-quality oils. Furthermore, extensive biomedical research has demonstrated their antioxidant, anti-inflammatory, anti-atherogenic and cardioprotective properties, leading the European Food Safety Authority [5] to approve a specific health claim relating olive oil polyphenols to the protection of blood lipids from oxidative stress. The accumulation of phenolic compounds in olive fruits and oils is regulated by a complex interaction among genetic, physiological, agronomic and environmental factors. Among these, genotype plays a major role, and significant differences in phenolic content have been reported among cultivars grown under similar environmental conditions [6,7,8]. Because of their strong influence on nutritional, technological and sensory quality, phenolic compounds are increasingly considered important traits in olive breeding and varietal selection programs aimed at improving olive oil quality [6,9]. However, cultivar alone cannot explain the large variability commonly observed in olive oil phenolic composition. Numerous studies have demonstrated that environmental conditions substantially affect both the biosynthesis and accumulation of phenolic compounds in olive fruits [10,11,12,13]. In Mediterranean environments, water availability is considered one of the most influential drivers of phenolic variability. Several irrigation experiments have shown that moderate water deficit frequently promotes phenolic accumulation, whereas increased water availability and full irrigation often lead to lower concentrations of phenolic compounds in virgin olive oil [14]. The physiological mechanisms underlying this response are associated with the activation of plant stress pathways and secondary metabolism under moderate drought conditions. Water stress can stimulate the synthesis of phenolic compounds as part of the plant defense response, while excessive water availability may reduce phenolic concentration through both metabolic and dilution effects. Consequently, indicators describing seasonal and pre-harvest water balance are expected to play a major role in determining the spatial variability of olive oil phenolic concentration. Temperature is another major environmental determinant of olive oil quality. Several studies have reported significant relationships between thermal conditions during fruit development and phenolic accumulation [11,15,16]. High temperatures may alter fruit growth, oil biosynthesis and ripening dynamics, ultimately affecting phenolic metabolism. In Mediterranean olive-growing areas, where drought and heat stress frequently occur simultaneously, the interaction between water availability and temperature becomes particularly important for determining final oil quality [16]. Solar radiation also influences olive fruit metabolism through its effects on photosynthesis, carbon assimilation and secondary metabolite production. Variations in radiation load can modify fruit exposure, ripening dynamics and biochemical composition, contributing to spatial differences in olive oil quality across heterogeneous landscapes [10,17]. Topography further contributes to this variability by regulating local microclimatic conditions. Elevation affects thermal regimes and phenological development, whereas slope influences drainage patterns, soil depth and water redistribution processes. Terrain-derived indices such as the Topographic Wetness Index (TWI) have been successfully used to represent potential soil moisture accumulation and hydrological behaviour, providing valuable information on local environmental conditions that influence crop performance and quality attributes [18]. The combined influence of climate, topography, soil and management practices is commonly described through the concept of “terroir”. Although originally developed in viticulture, the terroir concept has increasingly been applied to olive-growing systems, where growing environment strongly influences the chemical and sensory properties of olive oil [11,15]. Understanding the spatial distribution of olive oil phenolic potential is therefore essential for identifying high-value production areas and supporting territorial characterization strategies. The present study extends beyond olive oil quality assessment and is closely connected to the ecological and socio-economic consequences of the 2021 “Montiferru” wildfire. The Montiferru–Planargia district represents one of the most important traditional olive-growing areas of Sardinia, characterized by extensive cultivation of the cv. Bosana and the presence of historical and centuries-old olive groves. Between 24 and 29 July 2021, the region was affected by one of the most severe wildfire events recorded in Italy in recent decades. The fire burned approximately 13,000 ha and was classified as an Extreme Wildfire Event (EWE) because of its rapid spread, high intensity and difficulty of suppression [19]. The wildfire affected ten municipalities and caused severe environmental, economic and social impacts, damaging forests, pastures, agricultural land and olive-growing systems that constitute an important component of the local cultural landscape [20]. Recent studies have highlighted the exceptional severity of the event and its long-term ecological consequences, including vegetation recovery dynamics, delayed post-fire mortality, sediment redistribution processes and landscape resilience [21,22]. The burned area included extensive sectors traditionally devoted to olive cultivation, emphasizing the need for scientific tools capable of supporting restoration strategies and future agricultural planning. Within this context, the identification of environmentally suitable areas characterized by high potential for olive oil quality assumes strategic importance. Spatial modelling of olive oil polyphenol concentration can therefore contribute not only to understanding the environmental controls of phenolic accumulation but also to supporting post-fire territorial recovery through the identification of areas with favourable bioclimatic conditions for high-quality olive production. The rapid development of Geographic Information Systems (GIS), remote sensing and spatial modelling techniques has created new opportunities for investigating the environmental determinants of crop quality. Spatially explicit approaches enable the integration of georeferenced analytical measurements with environmental raster datasets, allowing the characterization of continuous quality gradients across agricultural landscapes [18,23]. Among the available geostatistical approaches, Empirical Bayesian Kriging Regression Prediction (EBKRP) is particularly suitable for modelling complex environmental variables because it combines regression on explanatory covariates with Bayesian estimation of residual spatial dependence. Unlike conventional kriging methods, EBKRP explicitly incorporates uncertainty associated with semivariogram estimation through repeated simulations, thereby improving uncertainty quantification and predictive performance [24]. The objective of the present study was to investigate the spatial distribution of total polyphenol concentration in olive oil through the integration of analytical measurements and environmental predictors describing water balance, thermal regime, solar radiation and terrain morphology. Specifically, EBKRP was applied to two consecutive growing seasons (2022 and 2023) in order to evaluate the spatial drivers of phenolic variability and provide the basis for identifying stable areas of high phenolic potential associated with olive-growing terroir. To the best of our knowledge, no previous studies have integrated standardized olive oil production protocols and EBKRP to investigate the spatial distribution of olive oil polyphenols across heterogeneous olive-growing landscapes. Within this framework, the present study was initiated to identify the environmental factors associated with olive oil quality and to support the restoration and sustainable development of local olive-growing systems.
2. Materials and Methods
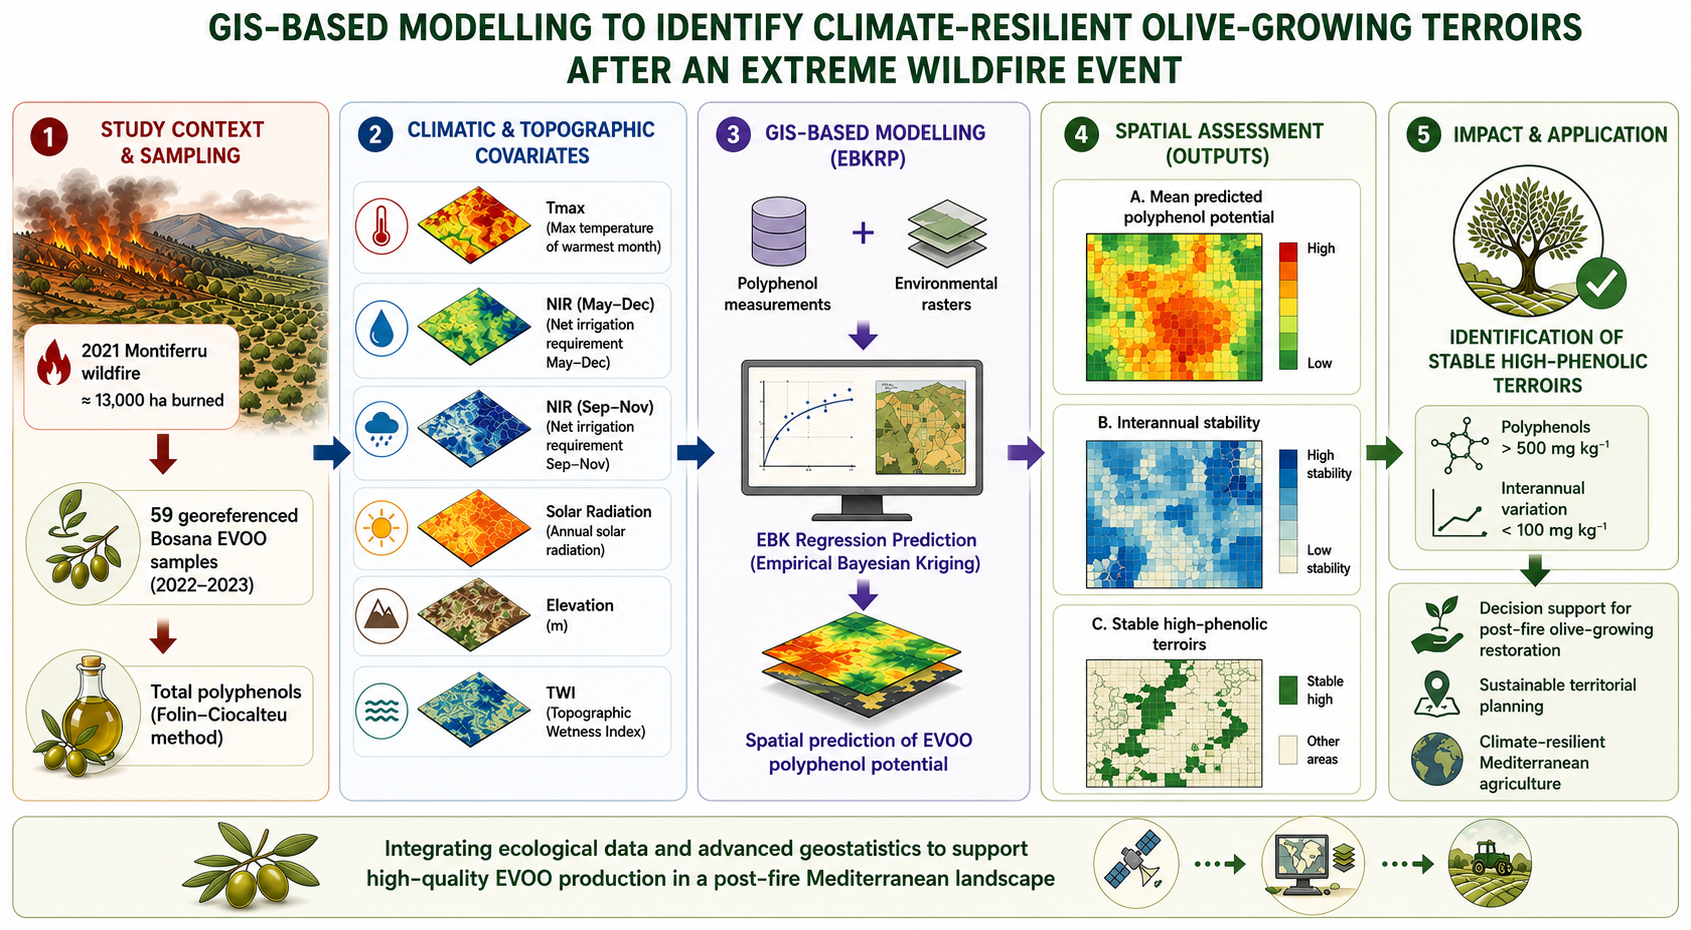
The overall workflow adopted in this study is schematically illustrated in Figure 1.
Study Area
The study was conducted in the Montiferru–Planargia olive-growing district, located in western Sardinia (Italy), covering a surface of 59742.87 ha. The study area encompasses a wide altitudinal gradient extending from coastal zones to the volcanic reliefs of the Montiferru massif. This environmental heterogeneity generates marked spatial variability in temperature regimes, solar radiation, water availability and terrain morphology, providing an ideal framework for investigating the environmental determinants of olive oil phenolic composition. The region hosts one of the most important volcanic complexes in Sardinia. In the mountainous areas, elevations reach a maximum of 1,052 m a.s.l. Landscape is characterized by imposing volcanic domes with rugged morphologies, interconnected by exposed ridges with limited vegetation cover. Slopes frequently reach gradients of 40–50%, favoring the occurrence of both sheet runoff and concentrated erosion processes. This environmental heterogeneity generates marked spatial variability in temperature regimes, solar radiation, water availability and terrain morphology, providing an ideal framework for investigating the environmental determinants of olive oil phenolic composition. The area represents one of the most important traditional olive-growing regions of the island, especially in the municipalities of Cuglieri, Bosa, Scano Montiferru, Seneghe, Bonarcado, Riola Sardo, Narbolia, and is characterized by a strong interaction between Mediterranean climatic conditions, complex topography and a long-established olive-growing heritage.
Plant Material and Sampling
The study focused exclusively on the Sardinian olive cultivar “Bosana”, which represents the dominant olive variety cultivated throughout the study area and one of the most important cultivars for virgin olive oil production in Sardinia. Olive samples were collected manually in rain-fed olive orchards during two consecutive harvest seasons (2022 and 2023), in order to evaluate the consistency of the observed spatial patterns under different annual environmental conditions. Sampling sites (Figure 2), both inside and outside the fire perimeter, were georeferenced and distributed across the study area to capture the environmental variability associated with climatic and topographic gradients. A total of 59 samples (22 in 2022 and 37 in 2023) were taken and processed. To minimize variability unrelated to environmental conditions, olives were harvested manually (6 kg of olives collected from all-over the canopy, from 5 plants) at a comparable physiological ripening stage. Fruit maturity was assessed according to [25] (Jaén’s Maturity Index 2.8±0.3) to ensure consistency among sampling locations.
Experimental Olive Oil Extraction
For each sampling site, olives were transported to the laboratory under refrigerated conditions and processed on the same day as sampling. Approximately 3 kg of olives were processed for each sample. Three replicates were randomly sampled from the harvested fruits. Oil was extracted using an Abencor system small-quantity mill, simulating commercial oil extraction systems (MC2 Ingenieria y Sistemas, Seville, Spain). The Abencor system reproduces the main mechanical phases of industrial olive oil extraction, including crushing, malaxation and centrifugation, allowing the processing a small quantities of olives under controlled laboratory conditions. The olives were crushed with the Abencor hammer mill equipped with a 4-mm sieve, then 700 g of paste were processed using the Abencor system’s malaxer and centrifuge. Malaxation conditions were: time 30 min, temperature 25 °C, with no water addition. The malaxed olive paste was centrifuged with the Abencor centrifuge for 60 sec. at 3500 rpm. Oil samples were centrifuged in a laboratory centrifuge at 3600 rpm, 20 °C, for 15 min., to eliminate residual water and solid traces. Oils were kept at +15 °C, in the dark, until time of analysis. All samples were processed following an identical and standardized extraction protocol in order to minimize technological variability and ensure comparability among samples, thus allowing the measured differences in oil composition to be primarily attributed to environmental and biological factors rather than processing effects.
Determination of Oil Commercial Category and Total Polyphenols.
The determination of the basic quality indices was performed primarily to verify the commercial category of the investigated oils. Free acidity, peroxide value, and UV spectrophotometric indices (K232, K268, and ΔK) were measured according to standard methods. Sensory panel test was conducted by the AGRIS Sardegna sensory panel, an officially accredited panel recognized by the Italian Ministry of Agriculture, Food Sovereignty and Forestry (MASAF) for the sensory assessment of virgin olive oils. All samples met the legal requirements for classification as “extra virgin olive oil” and were therefore included in the subsequent analyses of polyphenol content and spatial variability. Total polyphenol concentration was determined spectrophotometrically using the Folin–Ciocalteu colorimetric assay. Phenolic extracts were obtained from olive oil samples according to standard analytical procedures. Absorbance was measured at 765 nm using a UV–visible spectrophotometer and total phenolic concentration and results were expressed as mg gallic acid equivalents (GAE) per kg of olive oil using a gallic acid calibration curve. The Folin–Ciocalteu assay is widely employed in olive oil quality studies and provides a robust estimate of the total reducing phenolic fraction associated with antioxidant capacity and sensory characteristics of virgin olive oil.
Climatic Data Sources
Environmental predictors were derived from both climatic and topographic datasets. Climatic variables were generated from raster layers provided by the Regional Environmental Protection Agency of Sardinia (ARPAS Sardegna), which operates a network of meteorological stations distributed across the island. The original climatic surfaces were produced through spatial interpolation of ground-based observations and supplied as georeferenced raster datasets. Maximum summer temperature, precipitation, and potential evapotranspiration data were obtained from ARPAS Sardegna raster. Raster had a resolution of 250 x 250 m, and were calculated from climatic data of 10 climatic stations, 7 inside and 3 outside the study area. These datasets constituted the basis for the derivation of the water-balance indicators used in the study, including net irrigation requirement calculated for the May–December period (NIR-MD) and for the September–November period (NIR-SN). The latter was specifically included to characterize the balance between autumn precipitation and atmospheric evaporative demand during the final stages of fruit development and oil accumulation. Net irrigation requirements (NIR-MD and NIR-SN) and annual solar radiation were calculated separately for each study year (2022 and 2023), generating year-specific raster layers used as environmental covariates in the spatial modelling workflow. Topographic predictors were derived from a Digital Elevation Model (DEM) covering the study area. Elevation and slope were directly calculated from the DEM using standard terrain analysis procedures implemented in ArcGIS Pro (version 3.6.3, Esri Inc., Redlands, CA, USA). The Topographic Wetness Index (TWI), which describes the potential spatial distribution of soil moisture as a function of upslope contributing area and local slope, was computed from the same DEM using ArcGIS Pro hydrological terrain analysis tools. Annual solar radiation was estimated from the DEM using the Area Solar Radiation tool in ArcGIS Pro, which accounts for terrain geometry, slope, aspect, and topographic shading effects. The resulting raster represents the potential annual incoming solar energy and provides an integrated measure of the radiative environment experienced by olive trees across the landscape. In detail, the seven environmental raster covariates (Figure 3, NIR Sep-Nov not shown) included in the regression component of the EBKRP model were:
- Net irrigation requirement (May–December, mm):
Reference evapotranspiration was estimated using the Hargreaves-Samani equation [28], following the procedures reported in FAO-56 [29]. Contributions from groundwater and stored soil water were not avaiable for NIR calculation, but this aspect was taken into account using the Topographic Wetness Index (TWI).
Effective precipitation (Pe) was estimated according to the simplified FAO method proposed by [30], using the following equations:
PE = (0.8 x P)—25 if P > 75 mm/month
PE = (0.6 x P)—10 if P < 75 mm/month
With:
P = rainfall or precipitation (mm/month)
PE = effective rainfall or effective precipitation (mm/month)
- 2.
- Net irrigation requirement (September–November, mm):
- 3.
- Maximum temperature of the warmest month (°C);
- 4.
- Annual Global Solar Radiation (KWh m2 yr-1):
where:
Ra = cumulative annual solar radiation;
Rdir = direct solar radiation component;
Rdif= diffuse solar radiation component;
Rref= reflected solar radiation component;
d=sampled days used for annual integration;
h= hourly intervals used for daily integration.
Rdir = direct solar radiation component;
S0 = solar constant;
τ = atmospheric transmissivity coefficient;
θi = angle of incidence of solar radiation on the terrain surface.
Rdif = diffuse solar radiation component;
Rsky = diffuse radiation received from the sky hemisphere;
SVF = Sky View Factor, representing the proportion of visible sky from a given location.
Rref = reflected solar radiation component;
= surface albedo coefficient;
Rg = incoming global solar radiation.
- 5.
- Elevation (m);
- 6.
- Slope (°);
- 7.
- Topographic Wetness Index (TWI):
where:
As: Specific catchment area (m² m⁻¹);
β = local slope angle (radians).
All raster layers were projected in the same coordinate reference system (WGS 1984 UTM Zone 32N), resampled to a common spatial resolution and aligned prior to predictor extraction and geostatistical modelling.
Exploratory Statistical Analysis and Predictor Screening
Prior to geostatistical modelling, an exploratory statistical analysis was performed to assess the relationships among environmental predictors and to identify potential multicollinearity issues. Pairwise Pearson correlation coefficients were calculated to evaluate linear associations among predictors and between predictors and olive oil total polyphenol concentration. Multicollinearity among predictors was assessed using the Variance Inflation Factor (VIF) following commonly adopted thresholds [26,27]. Variables with VIF values lower than 5 were considered acceptable and retained for subsequent analyses. To explore the multivariate structure of the environmental space, Principal Component Analysis (PCA) was performed on standardized predictors. PCA was used to identify dominant environmental gradients and to evaluate potential clustering of observations according to growing season. PCA Dataset included all samples from 2022 and 2023 harvest seasons. All statistical analyses were performed prior to geostatistical modelling in order to verify predictor suitability and ensure compliance with best practices for spatial predictive modelling [18,23]. All exploratory statistical analyses were performed using Python 3.11. Pearson correlation coefficients were calculated using the SciPy statistical package, while multicollinearity diagnostics (Variance Inflation Factor, VIF) and Principal Component Analysis (PCA) were implemented using scikit-learn and pandas libraries. Data visualization was produced using Matplotlib.
Geostatistical Modelling
Spatial modelling procedures were performed in ArcGIS Pro using the EBKRP framework [24]. This approach combines a regression component based on explanatory raster covariates with Empirical Bayesian Kriging of the residual spatial structure, allowing the prediction surface to account simultaneously for environmental gradients and local spatial autocorrelation. The spatial distribution of total polyphenol concentration in olive oil was modelled separately for the 2022 and 2023 growing seasons. All elaborations were made using the total polyphenol concentration measured in olive oil samples obtained from georeferenced sampling points as the dependent variable. The 2022 dataset included 22 sampling locations, whereas the 2023 dataset included 37 sampling locations.
For both 2022 and 2023 models, EBKRP was performed using a K-Bessel semivariogram model, 100 simulations, subset size of 100, overlap factor of 1, and 95% cumulative variance. The search neighbourhood was Standard Circular, including a minimum of 10 and a maximum of 15 neighbours and one sector. Since the variables exhibited an approximately normal distribution, no data transformation was applied. Model performance was assessed through leave-one-out cross-validation. The following diagnostics were evaluated: Mean Error (ME), Root Mean Square Error (RMSE), Average Standard Error (ASE), Mean Standardized Error (MSE), Root Mean Square Standardized Error (RMSSE), Continuous Ranked Probability Score (CRPS), and the percentage of observations falling within the 90% and 95% prediction intervals. Model calibration was considered optimal when ME and MSE approached zero, ASE was close to RMSE, and RMSSE approached one. Observed-versus-predicted scatterplots and standardized error QQ plots were also inspected to evaluate agreement between measured and predicted values and the distributional behaviour of standardized residuals
Mean Predicted Polyphenol Content
To evaluate the average phenolic potential of the territory independently of year-specific climatic effects, a mean prediction raster was calculated as:
where:
P2022 = predicted polyphenol content for 2022
P2023 = predicted polyphenol content for 2023
The resulting raster represents the mean predicted polyphenol concentration and was interpreted as an indicator of phenolic suitability.
Interannual Stability Analysis
To assess the temporal consistency of phenolic expression, an interannual variability raster was calculated using the absolute difference between yearly predictions:
where D represents the absolute magnitude of variation in predicted polyphenol concentration between years (in mg kg⁻¹).
D=∣P2023−P2022∣
The resulting map was classified into five variability classes:

Table 1.
Variability Classes.
| Difference (mg kg⁻¹) | Stability level |
|---|---|
| <50 | Very high |
| 50–100 | High |
| 100–150 | Moderate |
| 150–250 | Low |
| >250 | Very low |
Lower values indicate greater temporal stability and therefore a stronger expression of terroir-related effects.
Identification of Stable High-Phenolic Terroirs
A spatial overlay analysis was performed between the mean predicted polyphenol raster (Pmean) and the interannual variability raster (D). Areas were classified according to both phenolic potential and temporal stability.
Three classes of high-phenolic terroirs were identified:
Stable High-Phenolic Core Areas
Pmean>500 mg kg⁻¹ and D<100 mg kg⁻¹
High Phenolic with Moderate Stability
Pmean>500 mg kg−1 and 100≤D≤150 mg kg−1
High-Phenolic Areas with Low Stability
Pmean>500 mg kg−1 and D>150 mg kg−1
These classes were used to delineate areas combining elevated phenolic potential and temporal consistency.
3. Results
3.1. Exploratory Analysis of Environmental Predictors
Variance Inflation Factors ranged from 1.19 to 3.43, indicating low levels of multicollinearity among predictors and confirming that all variables provided complementary environmental information. The highest VIF values were observed for elevation (3.43) and NIR-MD (3.04), although both remained well below commonly accepted thresholds. Pairwise correlations among environmental variables (Figure 4) revealed moderate relationships between elevation and NIR-MD (r = -0.779), reflecting the influence of topography on atmospheric demand and water balance. No predictor pair exceeded critical multicollinearity thresholds. Correlations between polyphenol concentration and individual environmental predictors were generally weak when considering the complete dataset, indicating that no single environmental factor alone explained the observed spatial variability. However, significant interannual differences emerged. In 2022, no statistically significant correlations were detected between polyphenol concentration and environmental variables. In contrast, the 2023 season showed significant relationships with elevation (r = -0.440, p = 0.006), slope (r = 0.355, p = 0.031) and Topographic Wetness Index (r = -0.336, p = 0.042). These results suggest that local topographic controls on water availability played a stronger role during the 2023 growing season.
The first two principal components explained 61.64% of the total environmental variance, with PC1 accounting for 36.46% and PC2 accounting for 25.18% (Table 2). PC1 was primarily associated with NIR May–December (loading = 0.787), elevation (−0.696), solar radiation (0.670), slope (−0.596), TWI (0.589), and NIR September–November (0.575). This component can therefore be interpreted as a “hydro-climatic environmental gradient integrating terrain position, atmospheric demand, solar energy and water balance”. PC2 was mainly influenced by slope (0.656) and elevation (−0.623), together with secondary contributions from TWI, Tmax and solar radiation (Table 3). This component reflects a “topographic exposure gradient related to terrain morphology and local redistribution of water resources”.
The PCA biplot (Figure 5) revealed a continuous distribution of sampling sites across the environmental space, without clear clustering of observations. Samples from 2022 and 2023 partially overlapped, suggesting that both growing seasons were characterized by the same underlying environmental gradients, although the relative influence of these gradients on polyphenol accumulation differed between years.
3.2. Cross-Validation Performance of the 2022 Model
The 2022 EBKRP model showed satisfactory predictive performance and negligible systematic bias. The Mean Error was 1.31 mg kg⁻¹, while the Mean Standardized Error was 0.017, both close to zero. This indicates that the model did not systematically overestimate or underestimate olive oil polyphenol concentration. The RMSE was 53.30 mg kg⁻¹, whereas the ASE was 76.56 mg kg⁻¹. The RMSSE was 0.742, indicating that the model overestimated prediction uncertainty. This conservative behavior was also reflected by the prediction interval diagnostics, with 100% of observations falling within both the 90% and 95% prediction intervals. The observed-versus-predicted scatterplot showed a positive linear relationship, with regression equation y = 1.187x − 75.34. Although the slope was higher than the ideal value of 1, the general agreement between measured and predicted values confirmed that the model captured the main spatial trend of polyphenol variability. The Q-Q plot of standardized errors showed an approximately normal distribution, with moderate deviations in the tails.
3.3. Cross-Validation Performance of the 2023 Model
The 2023 EBKRP model also showed robust predictive behavior. The Mean Error was −0.77 mg kg⁻¹ and the Mean Standardized Error was −0.018, again indicating negligible systematic bias. The RMSE was 58.77 mg kg⁻¹, while the ASE was 64.32 mg kg⁻¹. The close agreement between these two values suggests that the model provided a realistic estimate of prediction uncertainty. The RMSSE was 0.927, very close to the theoretical optimum of 1, indicating better uncertainty calibration than in 2022. The 90% and 95% prediction intervals contained 94.6% and 97.3% of observations, respectively. These values were slightly above the nominal levels, indicating a mildly conservative but well-calibrated uncertainty structure. The observed-versus-predicted regression equation was y = 1.048x − 34.85, with a slope very close to unity, indicating strong agreement between predicted and measured polyphenol concentrations.
3.4. Comparison Between Years
The two annual models showed complementary strengths (Table 4., Figure 6). The 2022 model had a slightly lower RMSE, suggesting marginally smaller prediction error, but its RMSSE value indicated a marked overestimation of uncertainty. Conversely, the 2023 model had a slightly higher RMSE but substantially better calibration of prediction uncertainty, as shown by the RMSSE value close to 1 and by prediction interval coverage close to the expected values. Overall, both annual models were unbiased and suitable for spatial prediction of olive oil polyphenol concentration. The 2023 model showed the most balanced geostatistical behavior, whereas the 2022 model was more conservative. Although the 2022 model achieved slightly lower prediction errors, the 2023 model provided a more realistic representation of prediction uncertainty and therefore exhibited superior overall geostatistical performance.
3.5. Mean Predicted Polyphenol Content
The mean prediction map (Figure 7 A) revealed marked spatial variability in olive oil phenolic potential across the Montiferru area. The highest predicted concentrations were predominantly located in the central and north-central sectors of the study area, whereas lower values were observed in the central plateau and in some eastern sectors. Several localized hotspots exceeded 700 mg kg⁻¹, indicating areas characterized by a particularly favorable combination of environmental and topographic conditions. Overall, most of the territory fell within the intermediate classes (400–700 mg kg⁻¹), suggesting a generally high suitability for the production of phenolic-rich olive oils.
3.6. Interannual Stability
The interannual variability map (Figure 7 B) highlighted substantial differences in the temporal stability of phenolic expression. The most stable areas (difference <100 mg kg⁻¹) were concentrated mainly in the eastern and southern portions of the study area, while higher variability characterized portions of the central mountainous sector and some north-western areas. Linear landscape features associated with steep slopes and drainage networks exhibited the greatest variability, suggesting a stronger influence of annual climatic fluctuations. Despite local variability, extensive portions of the territory maintained relatively consistent phenolic levels across the two production seasons.
3.7. Stable High-Phenolic Terroirs
The overlay analysis identified several spatially coherent zones characterized by both high phenolic potential and strong temporal stability. These areas were concentrated primarily in:
- north-central Montiferru;
- central-eastern slopes;
- southern sectors.
Two-year high-phenolic consistency zones (Figure 7 C) represented the most potentially valuable terroirs because they simultaneously exhibited:
- elevated predicted polyphenol concentrations (>500 mg kg⁻¹);
- limited interannual variability (<100 mg kg⁻¹).
Conversely, some areas with high phenolic potential displayed substantial year-to-year variability and were therefore classified as secondary phenolic zones.
Notably, some areas, classified as potentially valuable terroirs may have limits regarding altitude and slopes, therefore terroir mapping potential should be carefully compared with altitude maps regarding potential marginality of the cultivation due to excessive altitudes and slopes. In the Montiferru region, increasing elevation is generally associated with lower temperatures and a higher probability of frost events. Consequently, the suitability of these areas for commercial olive cultivation should be evaluated jointly with agronomic and climatic constraints, rather than on phenolic potential alone.
4. Discussion
The exploratory statistical analyses revealed that olive oil polyphenol concentration was only weakly correlated with individual environmental variables when considered separately. This finding suggests that phenolic accumulation is controlled by complex interactions among multiple environmental drivers rather than by a single dominant factor. The PCA results provide additional evidence that olive oil phenolic variability is controlled by the interaction of multiple environmental factors rather than by any single predictor. The dominant role of the “topographic–hydrological” gradient identified by PC1 is consistent with the central importance of plant water status in regulating olive fruit metabolism. Moderate water limitation has been shown to enhance the synthesis of phenolic compounds through the activation of stress-responsive pathways and increased allocation of carbon towards secondary metabolites [10,12,13]. The second component, associated with solar radiation and thermal conditions, is closely linked to energy availability and oxidative stress. Increased exposure to solar radiation may stimulate antioxidant defence mechanisms and influence the expression of genes involved in the phenylpropanoid pathway, ultimately affecting the concentration of phenolic compounds in olive fruits and oils [31,32]. Taken together, the PCA supports the hypothesis that olive oil phenolic accumulation in the Bosana cultivar emerges from the combined effects of water availability, topographic position and energy balance. Such complexity helps explain the relatively weak bivariate correlations observed between polyphenols and individual predictors and further justifies the adoption of multivariate geostatistical approaches such as EBKRP. The significant relationships observed during the 2023 season provide further insight into the ecophysiological mechanisms underlying phenolic variability. The negative correlation with elevation and TWI, together with the positive correlation with slope, consistently point toward the role of water availability as a major environmental regulator of phenolic metabolism. Areas characterized by lower TWI values and steeper slopes are typically associated with reduced soil moisture accumulation and increased drainage. These conditions can induce moderate water deficit, which is known to stimulate antioxidant responses and phenylpropanoid metabolism in olive trees. The resulting activation of secondary metabolic pathways may contribute to increased accumulation of phenolic compounds in fruits and oils [10,12,13]. The absence of similar relationships during the 2022 season suggests that environmental controls on phenolic accumulation are strongly modulated by annual climatic conditions. The environmental predictors included in the EBKRP models can be interpreted not only as spatial covariates, but also as proxies of ecophysiological processes involved in olive fruit development and phenolic metabolism. Olive oil phenolic compounds derive mainly from the shikimate and phenylpropanoid pathways, with secoiridoid derivatives such as oleuropein- and ligstroside-derived compounds representing the most distinctive phenolic fraction of virgin olive oil [4,31,32]. Their final concentration in the oil is therefore the result of biosynthesis, degradation, enzymatic transformation during ripening and mechanical extraction, and partitioning between fruit tissues, vegetation water and oil phase. Water availability, represented in the model by net irrigation requirement from May (fruit set) to December (full ripening), net irrigation requirement from September to November (or Net effective rainfall, i.e., the effective rainfall minus the Etc), and TWI, is one of the most ecophysiologically meaningful drivers of phenolic variability. Under moderate water deficit, olive trees activate stress-response mechanisms involving oxidative signalling, osmotic adjustment and secondary metabolism. In this context, the phenylpropanoid pathway may be stimulated as part of the antioxidant defence system, increasing the synthesis of phenolic compounds involved in protection against reactive oxygen species. Irrigation experiments have repeatedly shown that oils from trees under deficit or rainfed conditions often contain higher concentrations of total phenols and secoiridoid derivatives than oils from fully irrigated trees [10,12,13,14]. This supports the inclusion of water-balance predictors as mechanistic variables rather than merely empirical spatial descriptors. The May–December net irrigation requirement integrates water deficit over most of the fruit development cycle, from fruit set to harvest. This period includes cell division, mesocarp growth, pit hardening, oil accumulation and ripening, all of which can influence phenolic dynamics. The September–November water-balance variable is especially relevant because late fruit development and ripening are characterized by intense biochemical reorganization of the drupe. During ripening, oleuropein and related secoiridoids are progressively transformed into downstream derivatives, while the phenolic profile changes markedly with maturity stage [7,31,33]. High autumn water availability may reduce phenolic concentration through dilution effects, reduced stress signalling and altered ripening dynamics, whereas moderate pre-harvest deficit may maintain stronger antioxidant and secoiridoid-related responses. The Topographic Wetness Index provides a terrain-based proxy of potential soil moisture accumulation. Areas with high TWI are more likely to retain water, whereas low-TWI areas tend to be better drained and more prone to water deficit. From an olive ecophysiology perspective, this variable may indirectly capture differences in root-zone water availability, stomatal regulation, leaf water potential and oxidative stress intensity. Since olive is a drought-adapted species capable of strong stomatal control and osmotic adjustment [34,35,36], local differences in soil water status can substantially affect carbon allocation and the balance between primary metabolism, oil biosynthesis and secondary metabolite production. Summer maximum temperature represents the thermal stress component of the model. Temperature affects photosynthesis, respiration, enzyme kinetics, flowering and fruit development, as well as oil accumulation and final oil quality. High temperatures during fruit development have been shown to reduce olive fruit weight, oil accumulation and oil quality traits in a genotype-dependent manner [16]. At the metabolic level, heat stress may influence phenolic accumulation through multiple mechanisms: activation of heat-shock and oxidative-stress responses, modification of carbon assimilation, acceleration of ripening and alteration of enzymes involved in phenolic biosynthesis and degradation. Moderate thermal stress may stimulate antioxidant metabolism, whereas excessive heat can impair photosynthetic performance and disrupt normal fruit development, potentially reducing the accumulation of quality-related metabolites [37,38,39,40,41]. Solar radiation represents the energetic component of the olive-growing environment. Phenolic compounds are carbon-based secondary metabolites, and their synthesis is linked to the availability of carbon skeletons generated through photosynthesis. Higher radiation can increase carbon assimilation and may enhance the metabolic resources available for phenylpropanoid and secoiridoid biosynthesis. At the same time, high irradiance can induce photooxidative stress, increasing the need for antioxidant compounds. Therefore, annual solar radiation may influence phenolic concentration both through carbon supply and through stress-induced activation of antioxidant pathways. Elevation and slope represent the geomorphological control of local microclimate and hydrology. Elevation modifies temperature regimes, thermal amplitude and phenological timing, while slope affects runoff, infiltration, drainage and soil depth. These variables may therefore influence olive phenolic metabolism indirectly by modifying plant water status, fruit exposure, ripening rate and the duration of the biosynthetic window during which phenolic compounds accumulate and transform. The relevance of pedoclimatic variables for olive fruit and oil traits has also been reported in studies on Mediterranean olive-growing environments, including Sardinian conditions [11]. The spatial distribution of mean predicted polyphenol content suggests that environmental conditions exert a strong influence on the accumulation of phenolic compounds in olive oil. The concentration of high-value areas in elevated and topographically complex sectors supports previous findings indicating that altitude, thermal regime, solar radiation and moderate water stress can promote phenolic biosynthesis. The stability analysis provides additional insight beyond simple concentration mapping. While many studies focus exclusively on absolute phenolic levels, the present approach incorporates temporal consistency, allowing identification of terroirs capable of maintaining high phenolic expression under different climatic conditions. The occurrence of stable high-phenolic areas indicates that some sectors of Montiferru-Planargia area of study possess intrinsic environmental characteristics that buffer annual climatic variability. Such areas may represent potential priority zones for premium olive oil production and for the conservation of traditional olive-growing systems. The observed instability along steep drainage systems and highly heterogeneous landscapes suggests that local hydrological processes and microclimatic variability contribute significantly to year-to-year fluctuations in phenolic content. Taken together, the predictors used in the EBKRP models describe an integrated ecophysiological system in which water deficit, thermal regime, solar radiation and terrain morphology jointly regulate phenolic accumulation. Although the study encompasses only two harvest seasons, the comparison between independent annual predictions enabled the identification of areas characterized by relatively stable polyphenol accumulation patterns. The objective was therefore not to infer long-term climatic trends, but to explore the existence of persistent spatial signals that may reflect underlying terroir-related environmental conditions. The stability analysis provides a first indication of the robustness of these spatial patterns across years. Previous studies have demonstrated that geographical origin, growing site and environmental conditions significantly influence olive oil composition and quality attributes, while GIS-based approaches have been increasingly used to characterize olive-growing territories and assess land suitability for olive cultivation [42,43,44,45]. The threshold of 500 mg kg⁻¹ was adopted to identify areas with high phenolic potential. This value is consistent with previous classifications of virgin olive oils, where phenolic concentrations above 500 mg kg⁻¹ are considered indicative of high phenolic content, and with the definition proposed by [46] for high-phenolic olive oils. Even when environmental predictors are ecophysiologically meaningful, a certain residual variability is expected because the final oil phenolic concentration reflects both field-level metabolism and processing-related transformations [47,48,49,50,51,52,53]. The proposed integrated framework provides a spatially explicit basis for understanding the environmental drivers of olive oil quality and supports evidence-based strategies for the restoration and valorization of Mediterranean olive-growing landscapes.
Conclusions
The annual EBKRP models provided unbiased and reliable spatial predictions of olive oil polyphenol concentration. The 2022 model showed conservative uncertainty estimates, while the 2023 model achieved stronger calibration between observed errors and predicted uncertainty. Together, the two models demonstrate that the spatial variability of olive oil polyphenols can be effectively modeled using a geostatistical framework integrating analytical measurements with climatic, hydrological and topographic raster predictors. The mean prediction map identified extensive sectors with high suitability for the production of phenolic-rich olive oils, while the stability analysis revealed marked spatial differences in the persistence of phenolic expression between years. The overlay of these datasets allowed the delineation of potentially stable high-phenolic zones, representing areas that consistently combine elevated polyphenol concentrations with low interannual variability.
These zones constitute promising targets for:
- high-quality olive oil production;
- territorial valorization strategies;
- precision agriculture applications;
- future studies on olive oil terroir characterization.
The proposed methodology demonstrates the usefulness of integrating spatial prediction and temporal stability analyses for the identification of environmentally resilient olive-growing terroirs. From an applied perspective, this approach provides a spatial decision-support tool for identifying areas with higher potential for producing oils rich in phenolic compounds. Such maps may support terroir characterization, targeted sampling, valorization of high-quality production zones, precision agronomy, irrigation planning and the development of territorial quality labels. The results also open the way to a multi-year analysis aimed at distinguishing stable spatial patterns from year-specific climatic effects. This is particularly relevant for defining the phenolic potential of olive-growing landscapes and for identifying areas that consistently express high nutraceutical and sensory value. Beyond their scientific interest, the generated maps may represent a starting decision-support tool for the reconstruction and planning of olive cultivation in the Montiferru–Planargia district following the 2021 wildfire. A limitation of the present study is the availability of only two consecutive growing seasons. Olive oil phenolic composition is known to be strongly influenced by annual climatic variability, and longer monitoring periods would improve the characterization of temporal stability. Nevertheless, the objective of this study was not to quantify long-term climatic trends, but rather to identify spatially consistent environmental patterns associated with phenolic accumulation under contrasting annual conditions. The use of two independent seasons, combined with the identification of stable high-phenolic areas through interannual comparison, provides a first robust framework for terroir delineation and supports the application of the proposed methodology in post-fire territorial planning. Future studies including additional growing seasons will allow further refinement and validation of the identified phenolic terroirs.
Author Contributions
Conceptualization, M.C.; methodology, M.C; validation, M.C.; formal analysis, M.C., G.D., F.F., G.B; investigation, M.C., E.C., G.P., F.P.; resources, P.S; data curation, M.C., G.D., F.F., G.B.; writing—original draft preparation, M.C.; writing—review and editing, M.C., D.M., E.C.; visualization, M.C.; supervision, E.C.; project administration, E.C.; funding acquisition, P.S. All authors have read and agreed to the published version of the manuscript.”.
Funding
“This research was funded by Autonomous Region of Sardinia through the project “Olivi Montiferru—Activities for the Recovery and Restoration of the Montiferru Olive Groves Damaged by the July 2021 Wildfires and for the Improvement and Conservation of Autochthonous Olive Germplasm”, implemented by AGRIS Sardegna under Article 13, Paragraph 40, of Regional Law No. 17 of 22 November 2021.”.
Data Availability Statement
The original contributions presented in this study are included in the article. Further inquiries can be directed to the corresponding author.
Acknowledgments
Authors acknowledge Mr. Marco Serreli and Mr. Andrea Coni for technical support in the processing of olive samples. During the preparation of this study, the authors used Python 3.11 for exploratory statistical analyses, and ChatGPT (OpenAI, version 4o) for models cross validation metrics evaluation and english proofreading. The authors have reviewed and edited the output and take full responsibility for the content of this publication.
Conflicts of Interest
The authors declare no conflicts of interest.
References
- Cicerale, S.; Lucas, L.J.; Keast, R.S.J. Biological activities of phenolic compounds present in virgin olive oil. Int. J. Mol. Sci. 2010, 11, 458–479. [Google Scholar] [CrossRef] [PubMed]
- Covas, M.I.; Nyyssönen, K.; Poulsen, H.E.; Kaikkonen, J.; Zunft, H.J.F.; Kiesewetter, H.; Gaddi, A.; de la Torre, R.; Mursu, J.; Bäumler, H.; Nascetti, S.; Salonen, J.T.; Fitó, M.; Virtanen, J.; Marrugat, J. The effect of polyphenols in olive oil on heart disease risk factors: A randomized trial. Ann. Intern. Med. 2006, 145, 333–341. [Google Scholar] [CrossRef] [PubMed]
- Ghanbari, R.; Anwar, F.; Alkharfy, K.M.; Gilani, A.H.; Saari, N. Valuable nutrients and functional bioactives in different parts of olive (Olea europaea L.): A review. Int. J. Mol. Sci. 2012, 13, 3291–3340. [Google Scholar] [CrossRef] [PubMed]
- Servili, M.; Selvaggini, R.; Esposto, S.; Taticchi, A.; Montedoro, G.F.; Morozzi, G. Health and sensory properties of virgin olive oil hydrophilic phenols: Agronomic and technological aspects of production that affect their occurrence in the oil. J. Chromatogr. A 2004, 1054, 113–127. [Google Scholar] [CrossRef]
- EFSA Panel on Dietetic Products; Nutrition and Allergies (NDA). Scientific opinion on the substantiation of a health claim related to olive oil polyphenols and protection of LDL particles from oxidative damage. EFSA J. 2011, 9, 2033. [Google Scholar] [CrossRef] [PubMed]
- León, L.; Rallo, L.; Del Río, C.; Martín, L.M. Variability and early selection on the seedling stage for agronomic traits in progenies from olive crosses. Plant Breed. 2004, 123, 73–78. [Google Scholar] [CrossRef]
- Miho, H.; Díez, C.M.; Mena-Bravo, A.; Sánchez de Medina, V.; Moral, J.; Melliou, E.; Magiatis, P.; Rallo, L.; Barranco, D.; Priego-Capote, F. Cultivar influence on variability in olive oil phenolic profiles determined through an extensive germplasm survey. Food Chem. 2018, 266, 192–199. [Google Scholar] [CrossRef] [PubMed]
- Rotondi, A.; Bendini, A.; Cerretani, L.; Mari, M.; Lercker, G.; Gallina Toschi, T. Effect of olive ripening degree on the oxidative stability and organoleptic properties of cv. Nostrana di Brisighella extra virgin olive oil. J. Agric. Food Chem. 2004, 52, 3649–3654. [Google Scholar] [CrossRef] [PubMed]
- Pérez, A.G.; León, L.; Pascual, M.; Romero-Segura, C.; Sánchez-Ortiz, A.; de la Rosa, R.; Sanz, C. Fruit phenolic profiling: A new selection criterion in olive breeding programs. Front. Plant Sci. 2018, 9, 241. [Google Scholar] [CrossRef] [PubMed]
- Caruso, G.; Gucci, R.; Urbani, S.; Esposto, S.; Taticchi, A.; Di Maio, I.; Selvaggini, R.; Servili, M. Effect of different irrigation volumes during fruit development on quality of virgin olive oil of cv. Frantoio. Agric. Water Manag. 2014, 134, 94–103. [Google Scholar] [CrossRef]
- Deiana, P.; Motroni, A.; Filigheddu, M.R.; Dettori, S.; Nieddu, G.; Mercenaro, L.; Alfei, B.; Culeddu, N.; Santona, M. Effect of pedoclimatic variables on analytical and organoleptic characteristics in olive fruit and virgin olive oil. Eur. J. Agron. 2023, 148, 126856. [Google Scholar] [CrossRef]
- Romero, M.P.; Tovar, M.J.; Girona, J.; Motilva, M.J. Changes in the HPLC phenolic profile of virgin olive oil from young trees (Olea europaea L. Cv. Arbequina) grown under different deficit irrigation strategies. J. Agric. Food Chem. 2002, 50, 5349–5354. [Google Scholar] [CrossRef] [PubMed]
- Servili, M.; Esposto, S.; Lodolini, E.; Selvaggini, R.; Taticchi, A.; Urbani, S.; Montedoro, G.F.; Serravalle, M.; Gucci, R. Irrigation effects on quality, phenolic composition, and selected volatiles of virgin olive oils cv. Leccino. J. Agric. Food Chem. 2007, 55, 6609–6618. [Google Scholar] [CrossRef] [PubMed]
- Berenguer, M.J.; Vossen, P.M.; Grattan, S.R.; Connell, J.H.; Polito, V.S. Tree irrigation levels for optimum chemical and sensory properties of olive oil. HortScience 2006, 41, 427–432. [Google Scholar] [CrossRef]
- Mailer, R.J.; Ayton, J.; Graham, K. The influence of growing region, cultivar and harvest timing on the diversity of Australian olive oil. J. Am. Oil Chem. Soc. 2010, 87, 877–884. [Google Scholar] [CrossRef]
- Nissim, Y.; Shloberg, M.; Biton, I.; Many, Y.; Doron-Faigenboim, A.; Zemach, H.; Hovav, R.; Kerem, Z.; Avidan, B.; Ben-Ari, G. High temperature environment reduces olive oil yield and quality. PLoS ONE 2020, 15, e0231956. [Google Scholar] [CrossRef] [PubMed]
- Motilva, M.J.; Tovar, M.J.; Romero, M.P.; Alegre, S.; Girona, J. Influence of regulated deficit irrigation strategies applied to olive trees on oil yield and composition during fruit ripening. J. Sci. Food Agric. 2000, 80, 2037–2043. [Google Scholar] [CrossRef]
- Hengl, T. A Practical Guide to Geostatistical Mapping, 2nd ed.; European Commission, Joint Research Centre: Ispra, Italy; EUR 22904 EN, 2009; ISBN 978-92-79-06904-8. [Google Scholar]
- Cacciatori, S.; Pinna, M.T.; Cocco, M.G.; Piga, M.P.; Corda, A. The 2021 Montiferru wildfire, Sardinia (Italy): Analysis of a large wildfire. Environ. Sci. Proc. 2022, 17, 108. [Google Scholar] [CrossRef]
- ISPRA. Montiferru: Ecosistemi ed incendi boschivi in Italia—Analisi dell’evento del luglio 2021; Istituto Superiore per la Protezione e la Ricerca Ambientale: Rome, Italy, 2022. [Google Scholar]
- Pala, C.; Pellizzaro, G.; Ventura, A.; Arca, B.; Duce, P.; Salis, M. Vegetation recovery and sediment connectivity in burnt catchments: A case study of the 2021 Montiferru wildfire. In Proceedings of the EGU General Assembly 2025, Vienna, Austria, 27 April–2 May 2025. [Google Scholar]
- Rossetti, I.; Carboni, M.; Farris, E.; Bacchetta, G. Post-fire vegetation (non-)recovery across the edges of a Mediterranean megafire: The Montiferru wildfire case study. Fire 2024, 7, 250. [Google Scholar]
- Webster, R.; Oliver, M.A. Geostatistics for Environmental Scientists, 2nd ed.; John Wiley & Sons: Chichester, UK, 2007. [Google Scholar] [CrossRef]
- Krivoruchko, K. Empirical Bayesian kriging. ArcUser, 2012, Fall; pp. 6–10. [Google Scholar]
- Uceda, M.; Frías, L. Épocas de recolección. Evolución del contenido graso del fruto y de la composición y calidad del aceite. In Proceedings of the II Seminario Oleícola Internacional, Córdoba, Spain, 1975; pp. 25–46. [Google Scholar]
- Dormann, C.F.; Elith, J.; Bacher, S.; et al. Collinearity: A review of methods to deal with it and a simulation study evaluating their performance. Ecography 2013, 36, 27–46. [Google Scholar] [CrossRef]
- James, G.; Witten, D.; Hastie, T.; Tibshirani, R. An Introduction to Statistical Learning: With Applications in R, 2nd ed.; Springer: New York, NY, USA, 2021. [Google Scholar]
- Hargreaves, G.H.; Samani, Z.A. Reference crop evapotranspiration from temperature. Appl. Eng. Agric. 1985, 1, 96–99. [Google Scholar] [CrossRef]
- Allen, R.G.; Pereira, L.S.; Raes, D.; Smith, M. Crop Evapotranspiration: Guidelines for Computing Crop Water Requirements; FAO Irrigation and Drainage Paper No. 56; Food and Agriculture Organization of the United Nations: Rome, Italy, 1998. [Google Scholar]
- Brouwer, C.; Heibloem, M. Irrigation Water Management: Irrigation Water Needs. In Training Manual No. 3; Food and Agriculture Organization of the United Nations: Rome, Italy, 1986. [Google Scholar]
- Alagna, F.; Mariotti, R.; Panara, F.; Caporali, S.; Urbani, S.; Veneziani, G.; Esposto, S.; Taticchi, A.; Rosati, A.; Rao, R.; Perrotta, G.; Servili, M.; Baldoni, L. Olive phenolic compounds: Metabolic and transcriptional profiling during fruit development. BMC Plant Biol. 2012, 12, 162. [Google Scholar] [CrossRef] [PubMed]
- Servili, M.; Sordini, B.; Esposto, S.; Urbani, S.; Veneziani, G.; Di Maio, I.; Selvaggini, R.; Taticchi, A. Biological activities of phenolic compounds of extra virgin olive oil. Antioxidants 2014, 3, 1–23. [Google Scholar]
- Tekaya, M.; Mechri, B.; Bchir, A.; Attia, F.; Chehab, H.; Daoud, D. Changes in phenolic composition of olive fruits during maturation and their implications for olive oil quality. OCL 2022, 29, 18. [Google Scholar]
- Dichio, B.; Xiloyannis, C.; Angelopoulos, K.; Nuzzo, V.; Bufo, S.A.; Celano, G. Osmotic regulation in leaves and roots of olive trees during a water deficit and rewatering. Tree Physiol. 2006, 26, 179–185. [Google Scholar] [CrossRef] [PubMed]
- Sofo, A.; Dichio, B.; Xiloyannis, C.; Masia, A. The olive tree: A paradigm for drought tolerance in Mediterranean climates. Hydrol. Earth Syst. Sci. 2008, 12, 293–301. [Google Scholar] [CrossRef]
- Brito, C.; Dinis, L.T.; Moutinho-Pereira, J.; Correia, C.; Gonçalves, B. Drought stress effects and olive tree acclimation under a changing climate. Plants 2019, 8, 232. [Google Scholar] [CrossRef] [PubMed]
- Ben Ahmed, C.; Ben Rouina, B.; Sensoy, S.; Boukhriss, M.; Abdullah, F.B. Changes in gas exchange, proline accumulation and antioxidative enzyme activities in three olive cultivars under contrasting water availability regimes. Environ. Exp. Bot. 2009, 67, 345–352. [Google Scholar] [CrossRef]
- Chaves, M.M.; Maroco, J.P.; Pereira, J.S. Understanding plant responses to drought—from genes to the whole plant. Funct. Plant Biol. 2003, 30, 239–264. [Google Scholar] [CrossRef] [PubMed]
- Sharma, A.; Shahzad, B.; Rehman, A.; Bhardwaj, R.; Landi, M.; Zheng, B. Response of phenylpropanoid pathway and the role of polyphenols in plants under abiotic stress. Molecules 2019, 24, 2452. [Google Scholar] [CrossRef] [PubMed]
- Dong, N.Q.; Lin, H.X. Contribution of phenylpropanoid metabolism to plant development and plant–environment interactions. J. Integr. Plant Biol. 2021, 63, 180–209. [Google Scholar] [CrossRef] [PubMed]
- Larcher, W. Physiological Plant Ecology, 4th ed.; Springer: Berlin, Germany, 2003. [Google Scholar]
- Özalp, A.Y.; Akıncı, H.; Temuçin Kılıçer, S.; Bostan, P.A.; Yılmaz, H. Evaluation of Land Suitability for Olive (Olea europaea L.) Cultivation Using the Random Forest Algorithm. Agriculture 2023, 13, 1208. [Google Scholar] [CrossRef]
- Damak, F.; Ayadi, M.; Hammami, M.; et al. Relationship between the Multielemental Composition of Olive Oils and Their Geographical Origin: A Terroir Approach. Euro-Mediterr. J. Environ. Integr. 2021, 6, 63. [Google Scholar] [CrossRef]
- Spika, M.J.; Perica, S.; Žanić, K.; Goreta Ban, S.; Poljuha, D.; Jukić Špika, M. Virgin Olive Oil Phenols, Fatty Acid Composition and Sensory Profile in Relation to Cultivar, Growing Site and Harvest Period. Foods 2021, 10, 1222. [Google Scholar] [CrossRef] [PubMed]
- Lamanna, R.; Imparato, G.; Tano, P.; Di Paolo, E.; Naviglio, D.; Delfini, M.; Mamone, G. Territorial Origin of Olive Oil: Representing Georeferenced Maps of Olive Oils by NMR Profiling. Magn. Reson. Chem. 2017, 55, 1050–1060. [Google Scholar] [CrossRef] [PubMed]
- Diamantakos, P.; Melliou, E.; Magiatis, P. Defining a New Category of Olive Oil Called “High-Phenolic Olive Oil” Based on Total Hydroxytyrosol and Tyrosol Derivatives. Molecules 2021, 26(5), 1190. [Google Scholar] [CrossRef]
- Talhaoui, N.; Gómez-Caravaca, A.M.; León, L.; De la Rosa, R.; Segura-Carretero, A.; Fernández-Gutiérrez, A. From olive fruits to olive oil: Phenolic compound transfer in six different olive cultivars grown under the same agronomical conditions. Int. J. Mol. Sci. 2016, 17, 337. [Google Scholar] [CrossRef] [PubMed]
- García-Vico, L.; Sánchez, R.; Fernández, G.; Pérez, A.G. Study of the olive β-glucosidase gene family putatively involved in the synthesis of phenolic compounds of virgin olive oil. J. Sci. Food Agric. 2021, 101, 5703–5714. [Google Scholar] [CrossRef] [PubMed]
- Arroyo, L.; Sánchez, R.; Luaces, P.; Pérez, A.G. Olive polyphenol oxidase gene family. Int. J. Mol. Sci. 2023, 24, 3426. [Google Scholar] [CrossRef] [PubMed]
- Di Vaio, C.; Nocerino, S.; Paduano, A.; Sacchi, R. Influence of Some Environmental Factors on Drupe Maturation and Olive Oil Composition. J. Sci. Food Agric. 2013, 93, 1134–1139. [Google Scholar] [CrossRef] [PubMed]
- Theodosi, S.; Kosma, I.S.; Badeka, A. Quality Characteristics of Koroneiki Olive Oil from Zakynthos Island (Greece) and Differentiation Depending on the Altitude Level. Eur. Food Res. Technol. 2021, 247, 1237–1250. [Google Scholar] [CrossRef]
- Jukić Špika, M.; Liber, Z.; Montemurro, C.; Miazzi, M.M.; Cifarelli, S.; Peršurić, Ž.; Mikulić-Petkovšek, M.; Sladonja, B.; Poljuha, D. Quantitatively Unraveling Hierarchy of Factors Impacting Virgin Olive Oil Phenolic Profile and Oxidative Stability. Antioxidants 2022, 11, 594. [Google Scholar] [CrossRef] [PubMed]
- Ben Hmida, R.; Gargouri, B.; Chtourou, F.; Karray-Bouraoui, N.; Bouaziz, M. Study on the Effect of Climate Changes on the Composition and Quality Parameters of Virgin Olive Oil “Zalmati” Harvested at Three Consecutive Crop Seasons: Chemometric Discrimination. ACS Omega 2022, 7, 40178–40190. [Google Scholar] [CrossRef] [PubMed]
Figure 1.
Conceptual framework illustrating the integration of analytical measurements, environmental covariates, geostatistical modelling, and spatial analysis for the delineation of stable high-phenolic olive-growing terroirs.
Figure 1.
Conceptual framework illustrating the integration of analytical measurements, environmental covariates, geostatistical modelling, and spatial analysis for the delineation of stable high-phenolic olive-growing terroirs.

Figure 2.
Location of the study area within the Montiferru–Planargia olive-growing district (western Sardinia, Italy), including the 2021 wildfire perimeter (red colored shape) and the sampling sites surveyed during the 2022 (yellow spots) and 2023 (red spots) seasons.
Figure 2.
Location of the study area within the Montiferru–Planargia olive-growing district (western Sardinia, Italy), including the 2021 wildfire perimeter (red colored shape) and the sampling sites surveyed during the 2022 (yellow spots) and 2023 (red spots) seasons.

Figure 3.
Predictor raster layers employed in the EBKRP workflow. a) Elevation, b) maximum temperature of the hottest month (Tmax), c) slope, d) net irrigation requirement (NIR) from may to december and september-november (not shown) e) annual solar radiation and f) topographic wetness index (TWI). The classified maps (a and c) shown in this figure were generated exclusively for visualization and interpretation purposes. All EBK Regression Prediction models were developed using the original continuous raster layers without reclassification.

Figure 4.
Pearson Correlation matrices among polyphenols and environmental predictors. Cell values are Pearson correlation coefficients; significance level: *p<0.05; **p<0.01; ***p<0.001.
Figure 4.
Pearson Correlation matrices among polyphenols and environmental predictors. Cell values are Pearson correlation coefficients; significance level: *p<0.05; **p<0.01; ***p<0.001.

Figure 5.
Principal Component Analysis (PCA) biplot of environmental predictors. Points represent sampling locations colored according to growing season (2022 and 2023). Sample identifiers are reported next to each observation.
Figure 5.
Principal Component Analysis (PCA) biplot of environmental predictors. Points represent sampling locations colored according to growing season (2022 and 2023). Sample identifiers are reported next to each observation.

Figure 6.
EBKRP Predicted spatial distribution of olive oil total polyphenol content (mg kg⁻¹) in the Mon tiferru region (Sardinia, Italy) for the 2022 (A) and 2023 (B) growing seasons.
Figure 6.
EBKRP Predicted spatial distribution of olive oil total polyphenol content (mg kg⁻¹) in the Mon tiferru region (Sardinia, Italy) for the 2022 (A) and 2023 (B) growing seasons.

Figure 7.
Identification of two year stable high polyphenol zones in the Montiferru-Planargia olive-growing area. (A) Mean predicted total polyphenol content derived from EBK interpolation of 2022 and 2023 analytical data. (B) Interannual variability of predicted polyphenol content expressed as the absolute difference between yearly prediction surfaces. (C) Stable High-Polyphenol Terroirs identified through the integration of phenolic potential and temporal stability.

Table 2.
Variance explained by the principal components derived from the environmental predictors used in the EBKRP model.
Table 2.
Variance explained by the principal components derived from the environmental predictors used in the EBKRP model.
| Principal Component | Variance Explained (%) | Cumulative Variance (%) |
|---|---|---|
| PC1 | 36.46 | 36.46 |
| PC2 | 25.18 | 61.64 |
Table 3.
Loadings of environmental predictors on the first two principal components.
| Variable | PC1 | PC2 |
|---|---|---|
| NIR May–December | 0.787 | 0.396 |
| NIR September–November | 0.575 | 0.459 |
| Elevation | -0.696 | -0.623 |
| Slope | -0.596 | 0.656 |
| TWI | 0.589 | -0.481 |
| Solar Radiation | 0.670 | -0.429 |
| T max Summer | 0.107 | -0.439 |
Table 4.
Cross-validation performance metrics of the EBKRP models for olive oil total polyphenol concentration mapping in 2022 and 2023.
Table 4.
Cross-validation performance metrics of the EBKRP models for olive oil total polyphenol concentration mapping in 2022 and 2023.
| Metric | Ideal value | 2022 | 2023 | Interpretation |
|---|---|---|---|---|
| Number of samples | - | 22 | 37 | Number of observations used for model calibration and validation |
| Mean Error (ME) (mg kg⁻¹) | 0 | 1.31 | −0.77 | Values close to zero indicate ab sence of systematic prediction bias |
| Root Mean Square Error (RMSE) (mg kg⁻¹) | As low as possible | 53.30 | 58.77 | Overall prediction error |
| Average Standard Error (ASE) (mg kg⁻¹) |
Similar to RMSE | 76.56 | 64.32 | Estimated prediction uncertainty |
| RMSE / ASE ratio | ≈ 1 | 0.70 | 0.91 | Measures consistency between observed and estimated uncertainty |
| Mean Standardized Error (MSE) |
0 | 0.017 | −0.018 | Standardized measure of prediction bias |
| Root Mean Square Standardized Error (RMSSE) | 1 | 0.742 | 0.927 | Indicates calibration of prediction variances |
| Continuous Ranked Probability Score (CRPS) | Lower values indicate better performance | 31.86 | 33.06 | Probabilistic accuracy of the model |
| Coverage of 90% confidence interval (%) | 90 | 100.0 | 94.6 | Reliability of uncertainty estimates |
| Coverage of 95% confidence interval (%) | 95 | 100.0 | 97.3 | Reliability of uncertainty estimates |
| Regression equation (Observed vs Predicted) | y = x | y = 1.187x − 75.34 | y = 1.048x − 34.85 | Agreement between observed and predicted values |
| Semivariogram model | – | K-Bessel | K-Bessel | Spatial covariance structure |
| Simulations | – | 100 | 100 | Number of EBK simulations |
Disclaimer/Publisher’s Note: The statements, opinions and data contained in all publications are solely those of the individual author(s) and contributor(s) and not of MDPI and/or the editor(s). MDPI and/or the editor(s) disclaim responsibility for any injury to people or property resulting from any ideas, methods, instructions or products referred to in the content. |
© 2026 by the authors. Licensee MDPI, Basel, Switzerland. This article is an open access article distributed under the terms and conditions of the Creative Commons Attribution (CC BY) license.
Copyright: This open access article is published under a Creative Commons CC BY 4.0 license, which permit the free download, distribution, and reuse, provided that the author and preprint are cited in any reuse.


