

Submitted:
23 June 2026
Posted:
24 June 2026
You are already at the latest version
Abstract
Background: The two-spotted spider mite, Tetranychus urticae, is a globally significant agricultural pest, with its management increasingly complicated due to the rapid resistance development to chemical acaricides. The application of biological control utilizing predatory mites, particularly Phytoseiulus persimilis and Neoseiulus californicus, offers a sustainable alternative, but the optimization of release strategies requires the development of quantitative models that effectively integrate predator-prey dynamics. Objective: A biomathematical model, termed the Potential Predation Rate of Release (PPRR), was developed to identify the optimal release rates for the predatory mites Phytoseiulus persimilis and Neoseiulus californicus, taking into account their population growth dynamics and predation capabilities. Methods: Comprehensive measurements of life table parameters and daily predation rates were conducted for both predators and prey species at temperatures of 20°C, 25°C, and 30°C within controlled laboratory settings. Ratios of the intrinsic rate of increase (rm) of the predator to the prey were integrated with the average daily consumption figures to derive the PPRR. Results: The analysis under varying temperature conditions indicated that the prey species T. urticae exhibited an average intrinsic rate of increase (rm) of 0.180 day⁻¹. In contrast, the predatory species showed higher growth rates, with P. persimilis and N. californicus recording rm values of 0.220 day⁻¹ and 0.231 day⁻¹, respectively. Consequently, the predator-to-prey rm ratios were calculated as 1.22 for P. persimilis and 1.29 for N. californicus. The average daily consumption was recorded at 12.44 prey per individual P. persimilis and 10.13 per individual N. californicus. The PPRR model forecasts that individual predators are capable of regulating populations of 15.18 (P. persimilis) and 13.06 (N. californicus) spider mites on a daily basis. Conclusions: The PPRR model serves as a quantitative and data-driven framework for the optimization of predatory mite release strategies. This approach improves the accuracy and sustainability of biocontrol strategies targeting T. urticae, along with suggestions for field validation to confirm the model's applicability.
Keywords:
biological control
; intrinsic rate of increase
; statistical model
; phytoseiid mites
; predation modeling
; release strategy
; Tetranychus urticae
1. Introduction
Increasing concerns about pesticide resistance, environmental degradation, and potential human health risks have accelerated the shift toward sustainable pest management alternatives[1] . As a result, Integrated Pest Management (IPM) strategies that prioritize environmental sustainability have become central to global agricultural policies. Within this framework, biological control has emerged as a key sustainable approach that minimizes reliance on chemical pesticides while maintaining effective pest suppression. Tetranychus urticae Koch (Acari: Tetranychidae), commonly referred to as the two-spotted spider mite, is recognized as one of the most economically significant mite pests worldwide. Its extensive host range, exceeding 1,100 plant species, coupled with rapid reproductive rates and a well-documented ability to develop resistance to acaricides, poses significant challenges to chemical control methods[2,3,4] . These factors underscore the necessity of alternative control strategies grounded in ecological regulation rather than chemical suppression.
Predatory mites of the family Phytoseiidae represent some of the most effective biological control agents against T. urticae. Notably, Phytoseiulus persimilis (Athias-Henriot) and Neoseiulus californicus (McGregor) are widely acknowledged for their efficacy and are extensively integrated into global mite management programs[5,6,7]. Moreover, these predators have demonstrated success in controlling populations of spider mites, thrips, and whiteflies across diverse agricultural systems [8,9]. Current release protocols often rely on empirical approaches or generalized recommendations that insufficiently consider initial pest population densities, which can vary substantially between locations and crops. For instance, earlier studies have suggested release rates of approximately 10 P. persimilis individuals per cucumber plant [10] or about 5 Phytoseiulus macropilis (Banks) individuals per plant unit [11], with limited adjustment for pest density, temperature, or population dynamics. Such methodologies may jeopardize the efficacy and cost-effectiveness of pest control measures.
Life table analysis, which quantifies intrinsic rates of increase (rm), offers a robust framework for assessing population growth and predator-prey dynamics [12]. The combination of predator-to-prey rm ratios with daily prey consumption rates offers an improved method for precisely forecasting control potential. Despite extensive investigations into the biological characteristics of P. persimilis and N. californicus, quantitative models that forecast the optimal numbers of predators necessary to sustain T. urticae populations below economically damaging thresholds remain scarce, particularly when factoring in temperature influences. The objective of this study is to evaluate the demographic responses and predation capabilities of P. persimilis and N. californicus when preying on T. urticae under three controlled temperature settings (20°C, 25°C, and 30°C). In light of these observations, a new biomathematical framework, named the Potential Predation Rate of Release (PPRR), is proposed. This model synthesizes the intrinsic growth rate ratios of predators relative to prey with daily consumption rates to estimate effective predator release rates, thereby providing a quantitative and temperature-adaptive tool for enhancing the precision and efficacy of biological control strategies.
2. Materials and Methods
2.1. Host Plant Preparations
Kidney beans (Phaseolus vulgaris L.) were utilized as host plants, serving as a nutritional source for the rearing and toxicological evaluation of the two-spotted mite and its predatory counterparts. Seeds were purchased from the local agricultural market in Haidian, Beijing, China, and sown directly at a density of 20 seeds per tray within 40 × 40 × 12 cm plastic trays, comprised of a mixture of soil and peat moss in a 2:1 ratio. The plants were cultivated until they displayed a minimum of six leaves, after which they were subjected to infestation by T. urticae. The application of pesticides was deliberately omitted. The plants were sustained under meticulously controlled conditions in a growth chamber maintained at a temperature of 27 ± 2 ºC, relative humidity of 60 ± 5%, and a photoperiod of 16 hours light and 8 hours dark (L:D).
2.2. Maintenance of Prey and Predator Colonies
Laboratory colonies of the two-spotted spider mites, T. urticae, alongside the two predatory mite species, P. persimilis and N. californicus, were maintained long-term under pesticide-free conditions. Colonies were held at 25°C, 65 ± 5% relative humidity, and a 16:8 h (L:D) photoperiod in the laboratory of the Plant Protection Institute, Chinese Academy of Agricultural Sciences (IPP-CAAS), Beijing, China.
Predator rearing units consisted of a 75-mm black plastic film placed on a 90-mm filter paper, both positioned atop a water-saturated sponge (90 mm × 60 mm) inside a plastic box (140 mm × 120 mm). Each box was half-filled with water to isolate the rearing environment. Units were maintained at 25°C, 75 ± 5% relative humidity, and a 16:8 h (L:D) photoperiod.
2.3. Study Design
2.3.1. Arena Setup
Each arena consisted of a rectangular acrylic board (30 × 20 × 3 mm) with a central 10-mm orifice for T. urticae, paired with a second board (45 × 25 × 3 mm) containing a 15-mm central hole for the predatory mites P. persimilis and N. californicus. Both the top and bottom of each arena were sealed with a rectangular glass piece of congruent dimensions. The three layers were securely clipped at both ends to inhibit the escape of both mites and predatory species. The basal layer was substituted with a disk of bean leaf and a segment of water-saturated filter paper to ensure the moisture retention of the leaf disc.
The prey was subsequently introduced onto the upper surface of the leaf discs and permitted to acclimatize for a duration of 12 hours before predator release. Adult females of each predatory species were then added to the arenas. The arenas were positioned on a wet sponge within a plastic tray containing water. This setup facilitated mite observation under a dissecting microscope. Arenas were incubated in a climate-controlled chamber at 25 ± 1°C, 70 ± 5% relative humidity, and a 16:8 h (L:D) photoperiod.
2.3.2. Life Table Set-Up
Laboratory trials were conducted at three constant temperatures (20°C, 25°C, and 30°C; ±1°C), under controlled conditions of 65 ± 5% relative humidity and a 16:8 h (L:D) photoperiod. These thermal regimes were selected to represent the optimal range for the development and survival of T. urticae and its two predatory mite species, P. persimilis and N. californicus. The influence of temperature on prey consumption was systematically assessed across all feeding stages (protonymph, deutonymph, and adult) by monitoring cohorts of individual predators.
Synchronized eggs were procured by transferring 30 gravid females of T. urticae and 20 gravid females of each predatory species from the primary culture onto the ventral surfaces of bean leaf discs utilizing a fine brush. These discs were subsequently placed in 90 mm Petri dishes for the mite and 70 mm for the predators, each furnished with a copious supply of prey as a nutritional resource, and lined with water-saturated cotton wool. The females were permitted to oviposit for a duration of 24 hours before being removed from the experimental setup.
For each temperature condition examined, one hundred one-day-old eggs of T. urticae and fifty-one-day-old eggs of each of the two predatory species were incubated until the hatching process occurred. Newly emerged first-instar larvae were meticulously transferred to distinct leaf arenas. Daily observations of these arenas within the growth chambers were conducted at 8 am to monitor the progression of both immature and mature developmental stages under a binocular microscope. Each immature and mature specimen was relocated to a novel leaf disc arena every two days until mortality ensued.
Prior to the emergence of females from the quiescent deutonymph stage of the mite and the deutonymph stage of the two predators, a single untreated male from the mite population and each of the two predators from the main colonies were introduced into each arena to facilitate mating. Females were observed daily until death to document the initiation and cessation of oviposition. The females were transferred to fresh leaf disc arenas every two days. Eggs were counted daily and subsequently destroyed. The duration of immature development, as well as the timeframes for the preoviposition and oviposition phases, were computed.
Life-table analyses for T. urticae, P. persimilis, and N. californicus were conducted following the age-stage, two-sex life table theory [13,14]. The age-stage specific survival rate (sxjs_(xj)) was defined as the probability that a newly hatched individual survives to age xx (days) and stage jj, with the five developmental stages corresponding to egg, larva, protonymph, deutonymph, and adult.
The age-stage specific fecundity (fxj), representing the average number of offspring produced by a female of age x, the age specific survival rate (lx), reflecting the probability of a newly laid egg surviving to age x, and the age-specific fecundity (mx), indicating the mean fecundity of individuals at age x, were calculated following established life-table methodologies. In addition, key population parameters were estimated including the intrinsic rate of increase (r=Log eRo)/Gt; l, the finite rate of increase (l=e rm); Ro, the net reproductive rate (∑lx.mx); T, the mean generation time (∑x.mx.lx/Ro), and Dt, the doubling time, or the duration required for population doubling (Log e2/r), were calculated in accordance with established methodologies. Furthermore, reproductive value (vxj), the preoviposition period of female adults (APOP), and the total preoviposition period of females calculated from birth (TPOP) were also computed.
2.3.3. Predation Capacity Assessment
Eggs (≤1 day old) of each predatory species were incubated under three constant temperature regimes (20°C, 25°C, and 30°C; ±1°C) until hatching. Newly emerged first-instar larvae were then transferred individually to fresh leaf arenas and supplied with 40 T. urticae individuals as prey until adult emergence.
Newly emerged females were paired with males from the stock colony for a duration of 24 hours, following which the males were systematically removed. Throughout the course of development and the adult lifespan, the predators were provided with surplus stages of T. urticae, totaling approximately 40 prey items per day. Daily consumption rates were meticulously recorded under stereomicroscopy, with the replenishment of prey ensuring a consistent availability. The mean daily prey consumption per predator was subsequently calculated.
2.3.4. Potential Predation Rate of the Release Model
In order to ascertain the actual number of prey that the predator can effectively manage for the purpose of mite control, a novel equation was proposed. The overall average proportion of the intrinsic rate of increase (rm) between the predator and the prey is multiplied by the mean daily food consumption of the predator at the site, as articulated below: The Potential Predation Rate of Release (PPRR) model synthesizes the advantages of population growth with the capacity for consumption: Potential Predation Rate of Release:
where rm denotes the intrinsic rate of increase ratio of the predator-to-prey, and C represents the mean daily prey consumption of the predator, thereby reflecting its predation capacity.
2.4. Statistical Analysis
Data on the developmental duration of both sexes of T. urticae and its predatory mites, together with the daily fecundity of females, were analyzed using analysis of variance (ANOVA). Mean differences were tested at a significance level of P<0.05P < 0.05 with SPSS software (Version 21.0; IBM Corp., Armonk, NY, USA).
The life table parameters were computed employing the TWOSEX-MS Chart program [15], with variances and standard errors derived through bootstrap resampling (100,000 iterations). Pairwise comparisons were executed through the paired bootstrap test (B = 100,000), grounded in 95% confidence intervals of the differences between the treatments.
3. Results
3.1. Developmental Parameters
The three evaluated temperatures exerted a significant influence on the developmental time of both sexes of T. urticae, P. persimilis, and N. californicus (P ≤ 0.05). Developmental duration exhibited a consistent reduction with increasing temperature across all species (Table 1, Figure 1). At 30°C, the developmental time was approximately halved in comparison to that observed at 20°C. The immature developmental durations of the two predatory mites were noted to progress more rapidly than those of the prey species at the assessed temperatures.
Female development averaged 8.33 days for P. persimilis and 7.67 days for N. californicus at 20°C, in contrast to 18.75 days for T. urticae. Males of all species reached maturity earlier than females at both 25°C and 30°C. The egg stage constituted the longest developmental phase across all species. The total developmental time of T. urticae was observed to be more than twice that of the predators.
The mean longevity of females and males (calculated from birth) was significantly influenced by temperature in T. urticae (F = 77.96, P<0.001P < 0.001; F = 32.70, P<0.001P < 0.001), P. persimilis (F = 39.50, P<0.003P < 0.003; F = 25.70, P<0.001P < 0.001), and N. californicus (F = 66.25, P<0.0001P < 0.0001; F = 38.64, P<0.0004P < 0.0004) (Table 2; Figure 2).
Adult longevity was greatest in N. californicus compared with P. persimilis and T. urticae. Female longevity declined markedly with increasing temperature, from 38.9 to 19.2 days in T. urticae, from 35.8 to 22.5 days in P. persimilis, and from 45.4 to 23.6 days in N. californicus between 20°C and 30°C.
3.2. Reproductive Parameters
Temperature exerted a significant influence on the total mean pre-oviposition period (TPOP) as well as total mean fecundity in T. urticae (F=70.41, P<0.001, and F=134.91, P<0.001); however, no such effect was observed in the predatory species. The mean pre-oviposition periods (days APOP) consistently decreased with the elevation of temperature, attaining minimum values of 1.17, 2.14, and 2.94 days for T. urticae, P. persimilis, and N. californicus at 30 °C, respectively.
The oviposition period of P. persimilis was recorded to be the longest at both 25°C and 30°C. Maximum daily egg production was noted at 20°C for T. urticae (6.03 eggs/day) and P. persimilis (2.90 eggs/day). The highest total fecundity values, measured at 69.48±3.15, 39.78±2.02, and 44.89±2.22 eggs, were documented for T. urticae, P. persimilis, and N. californicus at 25°C, respectively (Table 2).
3.3. Life Table Parameters
The intrinsic rate of increase (rm) demonstrated a significant elevation with increasing temperatures for both T. urticae and P. persimilis; however, no significant effect was discerned in N. californicus (Table 3). The mean rm values across the examined temperature spectrum were 0.180 day⁻¹ for T. urticae, 0.220 day⁻¹ for P. persimilis, and 0.231 day⁻¹ for N. californicus. As a result, the predator-to-prey rm ratios averaged 1.22 for P. persimilis and 1.29 for N. californicus, indicating a superior potential for population growth (Figure 3).
The finite rate of increase (λ) reached its apex with values of 1.307 day⁻¹ for P. persimilis at 20°C, 1.286 day⁻¹ for N. californicus at 25°C, and 1.263 day⁻¹ for T. urticae at 20°C. Mean generation time (T) and doubling time (Dt) exhibited a downward trend as temperature increased, thereby substantiating an accelerated turnover rate of populations at elevated temperatures. Notably, the doubling times were shortest for N. californicus (4.64–7.62 days) in comparison to the other species.
Female-biased sex ratios remained consistent across temperature variations for all species, averaging 0.63-0.71 (T. urticae), 0.72-0.74 (P. persimilis), and 0.66-0.72 (N. californicus). The highest egg count for each Gross Reproductive Rate (GRR) and Net Reproductive Rate (Ro) was recorded by T. urticae (69.68 and 45.85 eggs/female or offspring) at 25°C, whereas the lowest was observed in N. californicus (14.86 and 21.50 eggs/female or offspring) at 30°C, respectively.
3.3. Predation and Feeding Capacity
Temperature significantly influenced the consumption rate (P < 0.05) but did not affect the total prey intake during the nymphal stages. The two predatory mite species displayed variable food consumption patterns across developmental stages and temperature conditions (Table 4, Figure 4). In aggregate, P. persimilis exhibited peak mean daily consumption of 14.59 prey at 30°C, with a notable decrease to 11.88 and 10.86 prey at 25°C and 20°C, respectively. N. californicus demonstrated a considerably higher prey consumption rate at the lowest tested temperature of 20°C, attributable to prolonged developmental durations.
Despite this, the average daily consumption was recorded as lowest at the temperature of 20°C, with a value of 8.76 prey, in contrast to 10.95 prey at 25°C and 10.67 prey at 30°C. The mean daily consumption averaged across the various temperatures was 12.44 prey per individual of P. persimilis and 10.13 prey per individual of N. californicus.
3.4. Potential Predation Rate of Release (PPRR)
Utilizing the PPRR model: (rm ratio) × (daily consumption capacity)
- For P. persimilis: 1.22 × 12.44 = 15.18 T. urticae managed per predator per day.
- For N. californicus: 1.29 × 10.13= 13.06 T. urticae managed per predator per day.
The predator-to-prey rm ratios (1.22 for P. persimilis and 1.29 for N. alifornicus), when multiplied by their respective mean daily consumption rates (12.44 and 10.13 prey/day), yielded maximum theoretical daily control capacities of 15.18 and 13.06 T. urticae individuals per predator (Table 5; Figure 4). Thus, a single P. persimilis individual could theoretically suppress 15.18 spider mites, while one N. californicus individual could suppress 13.06. This model integrates reproductive and consumption dynamics, providing a quantitative framework for optimizing predator release strategies in biological control programs.
4. Discussion
This investigation elucidates that the predatory mites P. persimilis and N. californicus demonstrate markedly superior demographic performance and predation efficiency in comparison to their prey, T. urticae, across all evaluated temperature conditions, consistent with previous comparative studies of these predators [7]. Both predatory species developed at nearly twice the rate of their prey, conferring a marked ecological advantage for rapid population establishment and effective pest suppression. Temperature exerted a strong influence on life-history parameters, consistent with previous reports on Phytoseiidae mites [16].
The total pre-oviposition period (TPOP) for females of T. urticae was found to be greater than the corresponding values for the studied predatory species, whereas the adult pre-oviposition period (APOP) consistently exhibited shorter durations across the three tested temperatures, indicating a rapid onset of reproduction upon reaching adulthood.
Fecundity analysis revealed that the highest mean total egg production occurred at 25°C for all species, aligning with the optimal temperature range for the two predatory species. N. californicus demonstrated increased female longevity compared to P. persimilis and T. urticae across different temperature conditions, indicating superior thermal tolerance and enhanced potential for sustained population control under variable environmental conditions. Female-biased sex ratios remained consistently stable, ranging from 0.63 to 0.74, which may support effective population growth in natural habitats. The observed patterns in fecundity and longevity correspond with findings reported in previous studies [17]. N. californicus demonstrated increased longevity, particularly at 20°C, which aligns with reports that classify N. californicus as more heat-tolerant and resilient under stress conditions.
The intrinsic rate of increase (rm) exhibited an upward trend with increasing temperatures for all species, attaining a maximum at 30°C, which is in accordance with reduced development times and elevated fecundity. Notably, the elevated rm values for the predators (ranging from 0.220 to 0.231 day⁻¹) in comparison to T. urticae (0.180 day⁻¹) substantiate their potential to surpass prey populations, fulfilling a critical criterion for effective biological control. N. californicus displayed enhanced adaptability to elevated thermal conditions and may be particularly advantageous for applications in summer greenhouse and field settings. The evaluation of biocontrol efficacy requires a comprehensive analysis of both predation efficiency and foraging behavior. Predation capacity primarily targets the immature stages of T. urticae, which are crucial for reducing the species' reproductive potential.
Observed daily prey consumption rates (12.44 and 10.13 individuals per day for P. persimilis and N. californicus, respectively) correspond with earlier studies [17]. Variations in these rates are likely attributable to differences in local mite strains, methodological approaches, behavioral traits, and microhabitat factors. Predation patterns reveal a clear preference for immature prey stages, consistent with previous functional response studies[9]. Targeting early life stages effectively enhances control by preventing the development of reproductive females, a critical component in population regulation.
The newly developed PPRR model integrates demographic potential, expressed via intrinsic rate of increase (rm) ratios, with functional predation capacity to predict the theoretical maximum control efficiency of each predator. This quantitative approach advances beyond prior empirical or semi-qualitative guidelines [10,11], which often lacked a solid ecological basis. The model’s predicted suppression rates, 15.18 T. urticae per P. persimilis and 13.06 per N. californicus daily may reflect methodological or strain-related differences, indicating that combining demographic and functional parameters yields more realistic thresholds for pest control.
Practically, the PPRR model offers a valuable tool for designing release strategies in greenhouse and field environments. Field studies comparing single-species versus combined releases of P. persimilis and N. californicus [7] Highlight the necessity of species-specific protocols, which the PPRR model can optimize by accounting for local temperature regimes and pest densities. For instance, N. californicus, with its higher thermal tolerance, is better suited for summer crops and arid conditions [18], whereas P. persimilis performs optimally under moderate temperatures. By quantifying the balance between predator potential and pest pressure, the model facilitates evidence-based decisions on release densities, thereby reducing costs and minimizing superfluous augmentative releases.
Nonetheless, the model’s field applicability requires further validation, as environmental heterogeneity, availability of alternative prey, and microclimatic variability may affect actual predation rates. Integrating the PPRR framework with spatial-temporal field data and functional response models could improve its predictive power.
In conclusion, this study highlights the importance of combining life table analyses and predation data within a unified modeling framework. The PPRR model provides a reproducible, quantitative basis for optimizing biocontrol agent deployment, thereby supporting more precise, sustainable, and cost-effective Integrated Pest Management strategies.
5. Conclusion
This study developed a novel mathematical model integrating population dynamics with predation capacity to optimize biological control strategies. Both P. persimilis and N. californicus demonstrated significantly higher population growth rates and predation efficiency compared to T. urticae, confirming their strong potential as biocontrol agents.
The PPRR model provides a robust quantitative framework for determining optimal predator release rates, overcoming limitations associated with existing empirical approaches. Model predictions suggest that individual predators can suppress spider mite populations by consuming 13–15 individuals daily, offering practical guidance for sustainable pest management. This research delivers a data-driven tool that enables growers to implement biological control with improved precision, cost-effectiveness, and reliability. Field validation across diverse agricultural settings is essential to refine the model and ensure its applicability under varying environmental conditions. The findings establish a foundational framework adaptable to other pest-predator systems, thereby advancing precision biocontrol and promoting sustainability by reducing dependence on chemical pesticides in agricultural practices.
Data Availability Statement
No new datasets were generated or analyzed during this study. Data supporting the findings are available from the corresponding author upon reasonable request.
Acknowledgments
The Researchers would like to thank the Deanship of Graduate Studies and Scientific Research at Qassim University (www.qu.edu.sa) for financial support (QU-APC-2026).
Conflicts of Interest
The authors declare no conflicts of interest related to this study.
Competing Interests
The authors declare that there are no known financial or personal competing interests that could have influenced the work reported in this study.
References
- Aktar, M.W.; Sengupta, D.; Chowdhury, A.J.I.t. Impact of pesticides use in agriculture: their benefits and hazards. 2009, 2(1), 1. [Google Scholar] [CrossRef]
- Grbić, M.; et al. The genome of Tetranychus urticae reveals herbivorous pest adaptations. 2011, 479(7374), 487–492. [Google Scholar]
- Gerson, U.; Weintraub, P.G.J.A.r.o.e. Mites (Acari) as a factor in greenhouse management. 2012, 57(1), 229–247. [Google Scholar]
- Van Leeuwen, T.; et al. Acaricide resistance mechanisms in the two-spotted spider mite Tetranychus urticae and other important Acari: a review. 2010, 40(8), 563–572. [Google Scholar]
- Zhang, Z.-Q.; Sanderson, J.P.J.J.o.E.E. Relative toxicity of abamectin to the predatory mite Phytoseiulus persimilis (Acari: Phytoseiidae) and twospotted spider mite (Acari: Tetranychidae). 1990, 83(5), 1783–1790. [Google Scholar]
- Van Lenteren, J.C.J.B. The state of commercial augmentative biological control: plenty of natural enemies, but a frustrating lack of uptake. 2012, 57(1), 1–20. [Google Scholar]
- Rhodes, E.M.; et al. Comparison of single and combination treatments of Phytoseiulus persimilis, Neoseiulus californicus, and Acramite (bifenazate) for control of twospotted spider mites in strawberries. 2006, 39(3), 213–225. [Google Scholar]
- McMurtry, J.A.; et al. Revision of the lifestyles of phytoseiid mites (Acari: Phytoseiidae) and implications for biological control strategies. 2013, 18(4), 297–320. [Google Scholar]
- Song, Z.-W.; et al. Prey consumption and functional response of Neoseiulus californicus and Neoseiulus longispinosus (Acari: Phytoseiidae) on Tetranychus urticae and Tetranychus kanzawai (Acari: Tetranychidae). 2016, 21(7), 936–946. [Google Scholar]
- El-Laithy, A.J.E. Integrated control of two spotted spider mite, Tetranychus urticae on cucumber grown under plastichouse conditions in Egypt. 1996, 41(3), 485–491. [Google Scholar]
- HEIKAL, I.H.; EBRAHIM, A.A.J.E.J.o.A.R. BIOLOGICAL CONTROL OF TETRANYCHUS URTICAE Koch ON SWEET PEPPER PLANTATIONS IN A COMMERCIAL FARM BY THE PREDATORY MITE, PHYTOSEIULUS MACROPILIS (BANKS). 2013, 91(3), 1161–1173. [Google Scholar]
- Birch, L.J.T.J.o.A.E. The intrinsic rate of natural increase of an insect population. 1948; pp. 15–26. [Google Scholar]
- Chi, H.J.I.S. Life-table analysis incorporating both sexes and variable development rates among individuals. 1988, 17(1), 26–34. [Google Scholar]
- Huang, Y.B.; Chi, H.J.I.S. Age‐stage, two‐sex life tables of Bactrocera cucurbitae (Coquillett)(Diptera: Tephritidae) with a discussion on the problem of applying female age‐specific life tables to insect populations 2012, 19(2), 263–273.
- Chi, H. Two-SEX-MSChart: computer program for the age-stage, two-sex life table analysis. National Chang Hsing University: Taichung, 2005. [Google Scholar]
- Walter, D.E.; Proctor, H.C. Mites: ecology, evolution and behaviour; 1999. [Google Scholar]
- Escudero, L.; Ferragut, F.J.B.C. Life-history of predatory mites Neoseiulus californicus and Phytoseiulus persimilis (Acari: Phytoseiidae) on four spider mite species as prey, with special reference to Tetranychus evansi (Acari: Tetranychidae). 2005, 32(3), 378–384. [Google Scholar]
- Weintraub, P.; Palevsky, E.J.E.; Acarology, A. Evaluation of the predatory mite, Neoseiulus californicus, for spider mite control on greenhouse sweet pepper under hot arid field conditions. 2008, 45(1), 29–37. [Google Scholar]
Figure 1.
Mean pre-adult developmental time (days) of (A) female and (B) male Tetranychus urticae, Phytoseiulus persimilis, and Neoseiulus californicus at three constant temperatures (20°C, 25°C, and 30°C).
Figure 1.
Mean pre-adult developmental time (days) of (A) female and (B) male Tetranychus urticae, Phytoseiulus persimilis, and Neoseiulus californicus at three constant temperatures (20°C, 25°C, and 30°C).
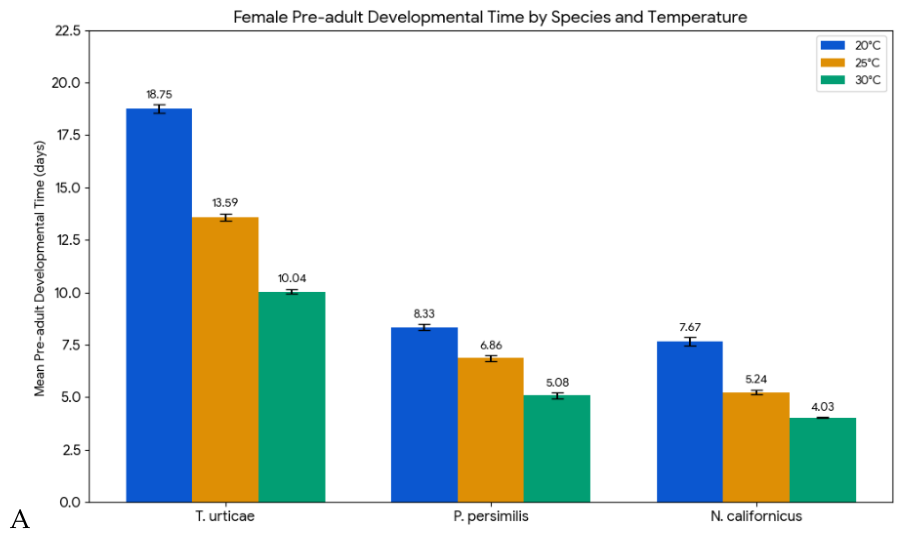
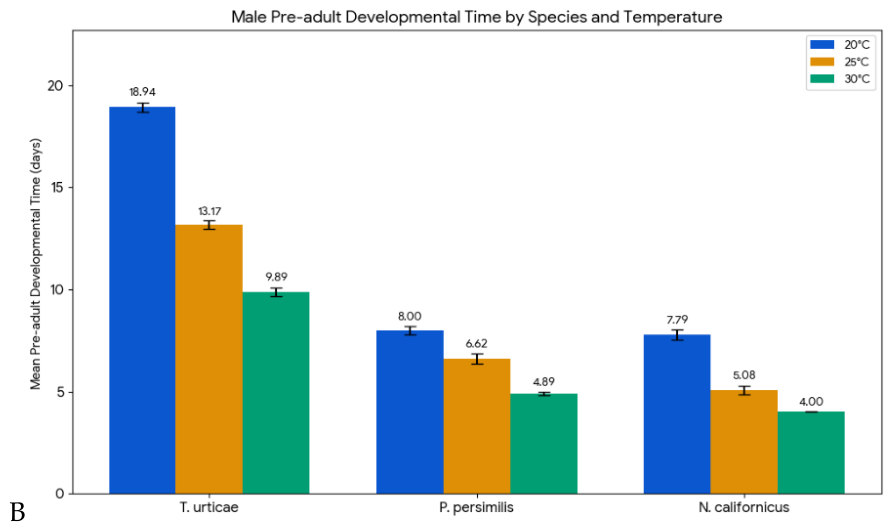
Figure 2.
Mean (A) total longevity (days) and (B) total fecundity per female (eggs/female) of Tetranychus urticae, Phytoseiulus persimilis, and Neoseiulus californicus at 20°C, 25°C, and 30°C.
Figure 2.
Mean (A) total longevity (days) and (B) total fecundity per female (eggs/female) of Tetranychus urticae, Phytoseiulus persimilis, and Neoseiulus californicus at 20°C, 25°C, and 30°C.
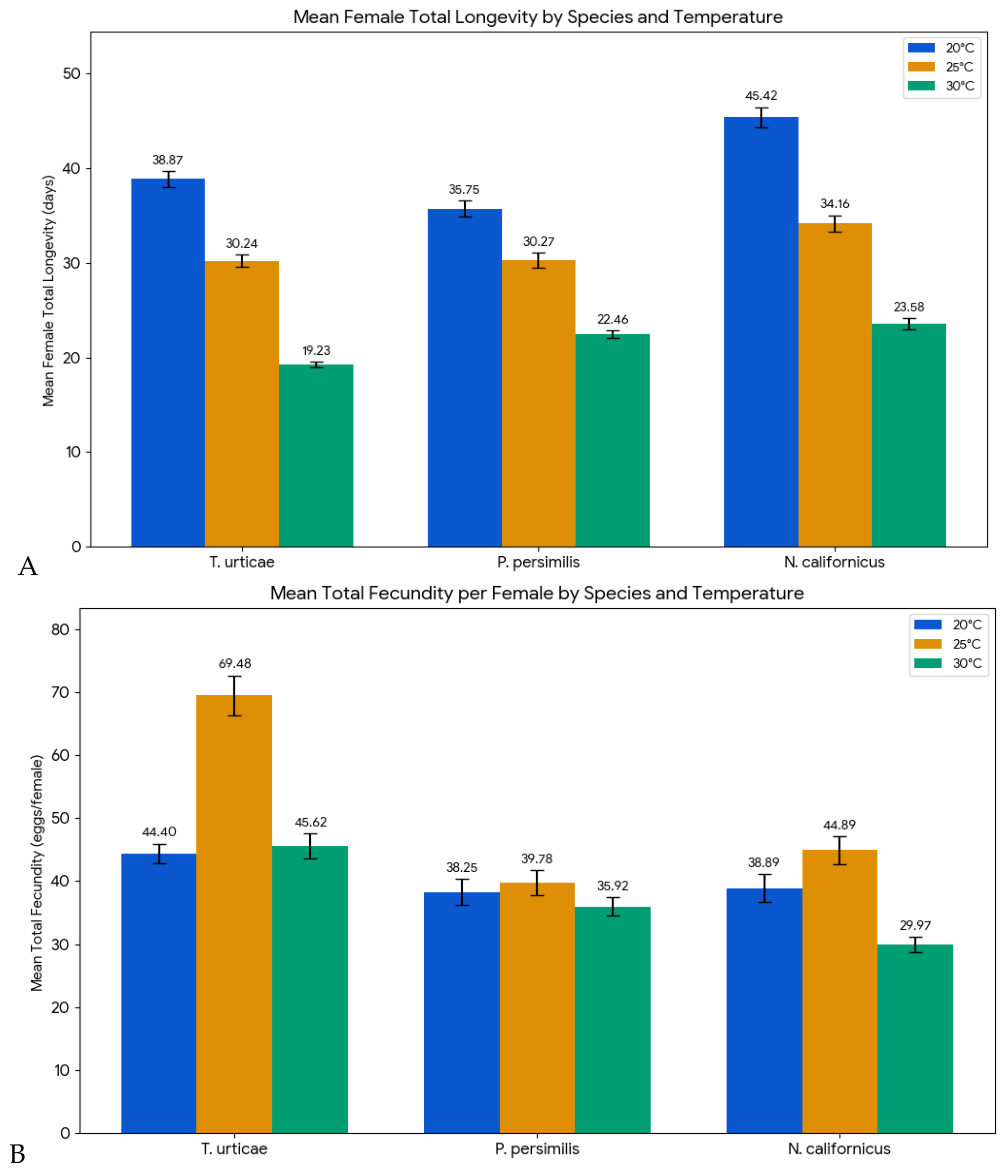
Figure 3.
(A) Intrinsic rate of natural increase (rm) and (B) net reproductive rate (R0) for Tetranychus urticae, Phytoseiulus persimilis, and Neoseiulus californicus at three constant temperatures (20°C, 25°C, and 30°C).
Figure 3.
(A) Intrinsic rate of natural increase (rm) and (B) net reproductive rate (R0) for Tetranychus urticae, Phytoseiulus persimilis, and Neoseiulus californicus at three constant temperatures (20°C, 25°C, and 30°C).
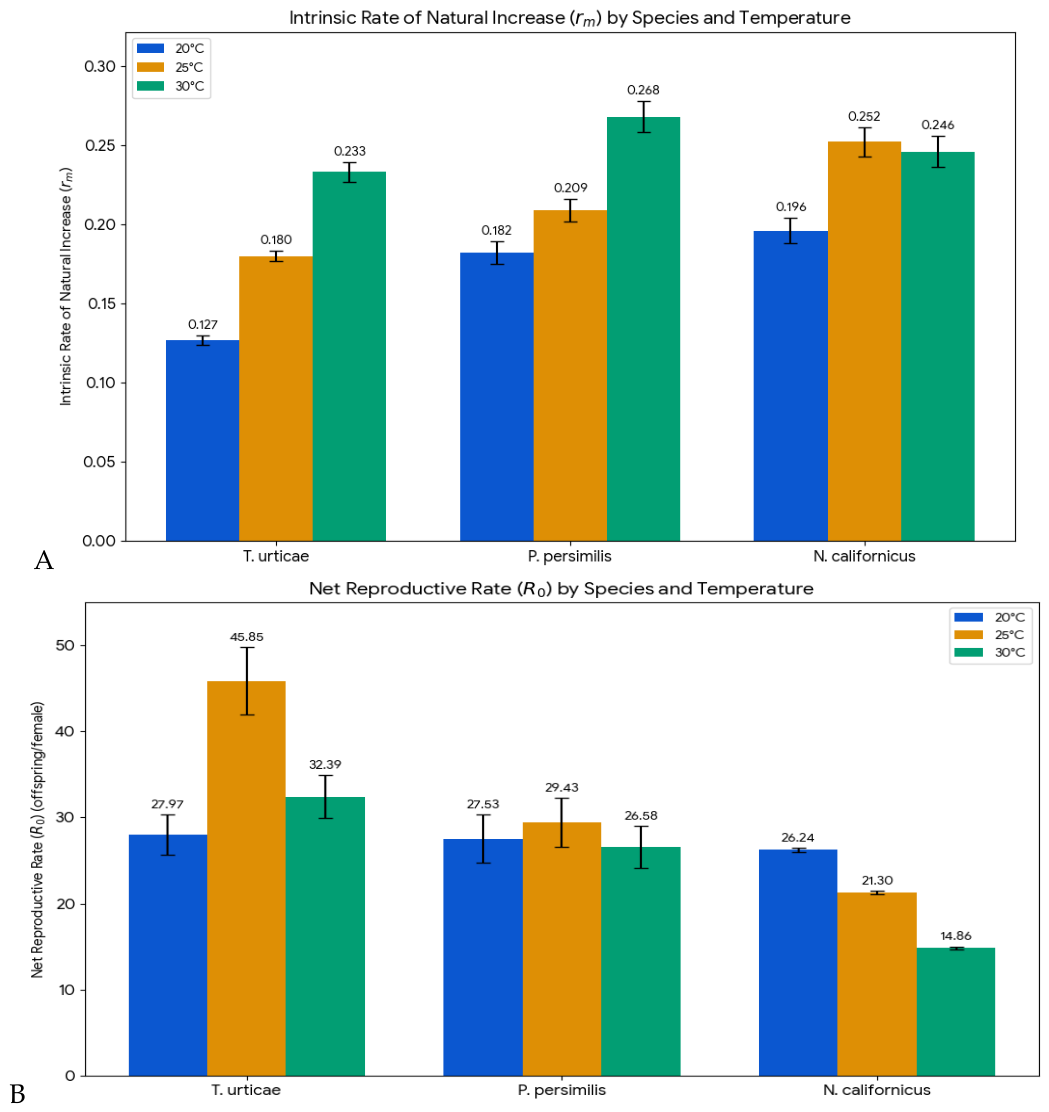
Figure 4.
Key demographic and predation parameters for Phytoseiulus persimilis and Neoseiulus californicus: (A) overall average intrinsic rate of natural increase (rm), (B) overall average daily food consumption by adult females, and (C) potential predation rate of release (PPRR).
Figure 4.
Key demographic and predation parameters for Phytoseiulus persimilis and Neoseiulus californicus: (A) overall average intrinsic rate of natural increase (rm), (B) overall average daily food consumption by adult females, and (C) potential predation rate of release (PPRR).
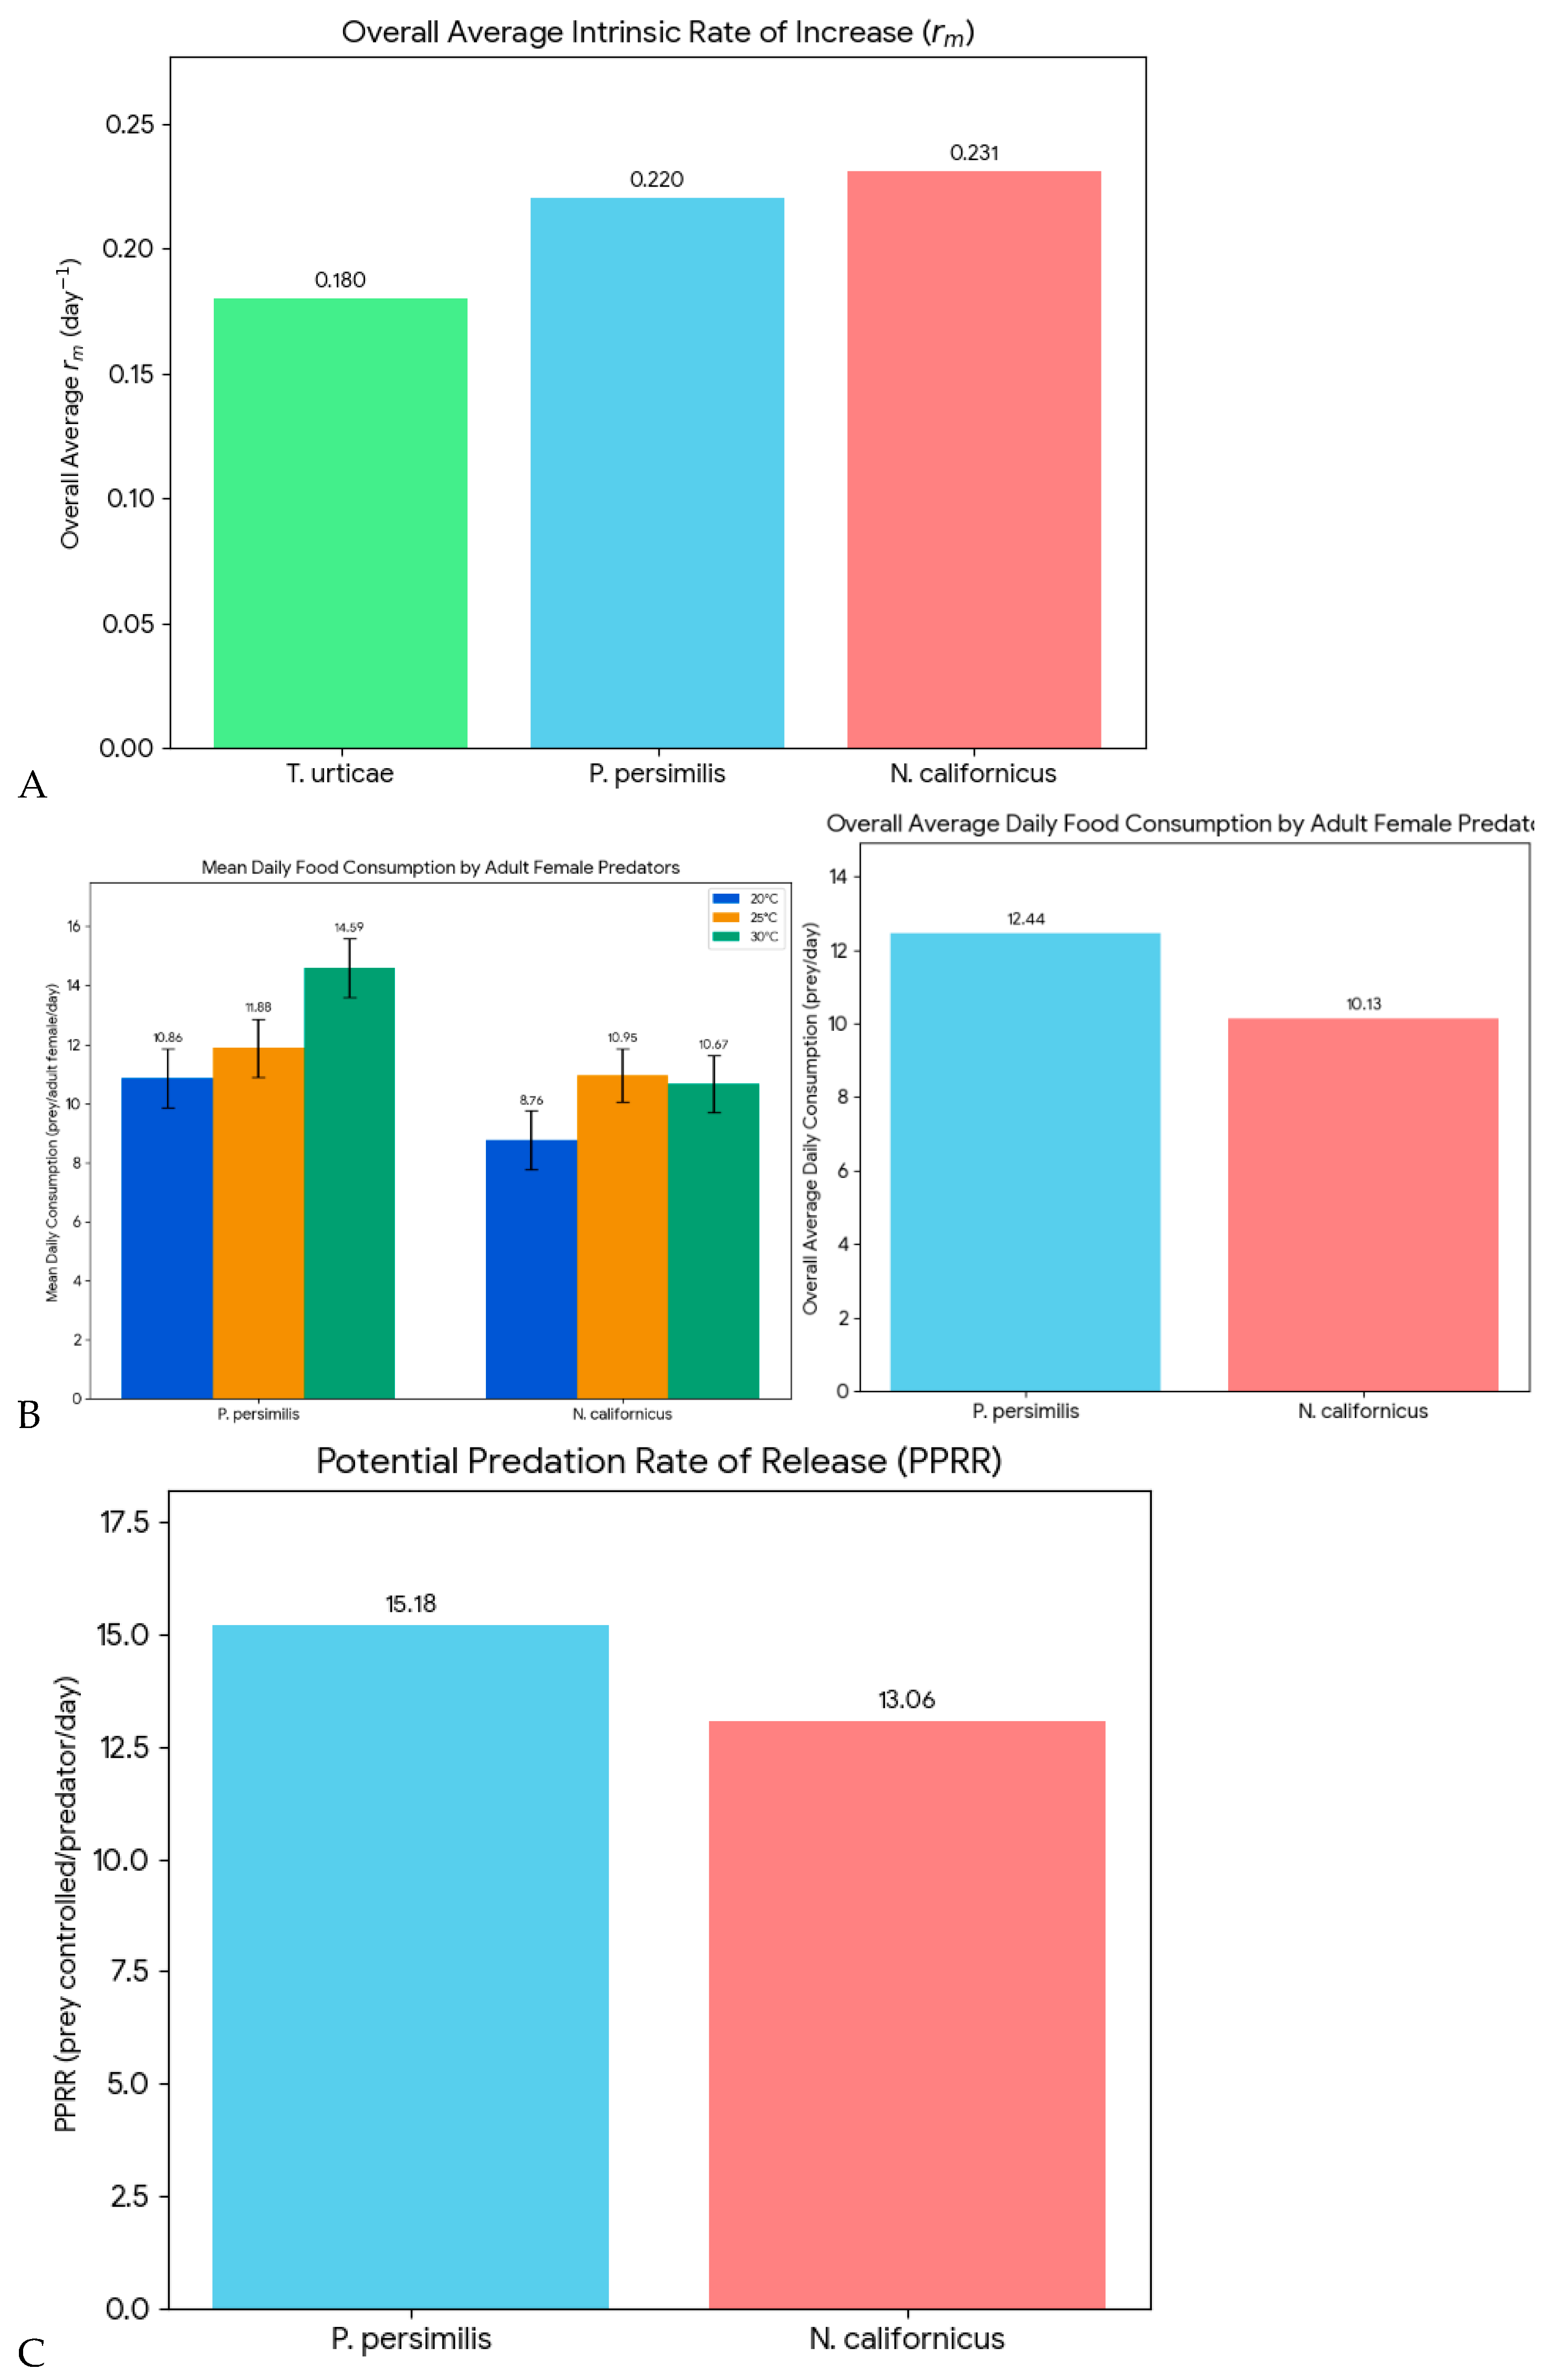

Table 1.
Mean duration (days ± SE) of developmental stages, pre-adult period, and adult longevity for Tetranychus urticae, Phytoseiulus persimilis, and Neoseiulus californicus at three constant temperatures.
Table 1.
Mean duration (days ± SE) of developmental stages, pre-adult period, and adult longevity for Tetranychus urticae, Phytoseiulus persimilis, and Neoseiulus californicus at three constant temperatures.
| Sex | Species | Temperature (°C) | Egg | Larva | Protochrysalis¹ | Protonymph | Deutochrysalis¹ | Deutonymph | Teliochrysalis¹ | Total Pre-adult | Adult Life Span | n² |
|---|---|---|---|---|---|---|---|---|---|---|---|---|
| Female | Tetranychus urticae | 20 | 6.24 ± 0.06a | 2.76 ± 0.07a | 1.16 ± 0.05a | 2.43 ± 0.06a | 1.30 ± 0.06a | 2.84 ± 0.54a | 2.02 ± 1.13a | 18.75 ± 0.22a | 20.13 ± 0.83a | 63 |
| 25 | 3.88 ± 0.07b | 2.12 ± 0.07ab | 1.18 ± 0.05a | 1.32 ± 0.06b | 1.38 ± 0.14a | 1.86 ± 0.06b | 1.85 ± 0.12a | 13.59 ± 0.17b | 17.17 ± 0.63b | 66 | ||
| 30 | 3.13 ± 0.06c | 1.27 ± 0.05b | 0.85 ± 0.00b | 1.21 ± 0.05b | 0.92 ± 0.00b | 1.44 ± 0.10b | 1.00 ± 0.00b | 10.04 ± 0.12c | 9.18 ± 0.32c | 71 | ||
| Phytoseiulus persimilis | 20 | 3.17 ± 0.10a | 1.36 ± 0.08a | -- | 1.86 ± 0.06a | -- | 1.94 ± 0.04a | -- | 8.33 ± 0.14a | 27.42 ± 0.81a | 66 | |
| 25 | 2.76 ± 0.08b | 1.08 ± 0.05b | -- | 1.43 ± 0.08b | -- | 1.59 ± 0.08b | -- | 6.86 ± 0.15b | 23.41 ± 0.81b | 37 | ||
| 30 | 1.78 ± 0.07c | 1.00 ± 0.00b | -- | 1.03 ± 0.00c | -- | 1.15 ± 0.10c | -- | 5.08 ± 0.14c | 17.57 ± 0.43c | 37 | ||
| Neoseiulus californicus | 20 | 2.89 ± 0.14a | 1.25 ± 0.07a | -- | 1.72 ± 0.08a | -- | 1.81 ± 0.07a | -- | 7.67 ± 0.20a | 37.75 ± 1.07a | 71 | |
| 25 | 1.70 ± 0.08b | 1.03 ± 0.03b | -- | 1.16 ± 0.06b | -- | 1.35 ± 0.08b | -- | 5.24 ± 0.12b | 28.92 ± 0.86b | 37 | ||
| 30 | 1.03 ± 0.03c | 1.00 ± 0.00b | -- | 1.00 ± 0.00c | -- | 1.00 ± 0.00c | -- | 4.03 ± 0.03c | 19.55 ± 0.56c | 33 | ||
| Male | Tetranychus urticae | 20 | 6.45 ± 0.09a | 2.74 ± 0.09a | 1.13 ± 0.06a | 2.45 ± 0.10a | 1.35 ± 0.09a | 2.94 ± 0.12a | 1.87 ± 0.43a | 18.94 ± 0.23a | 14.81 ± 0.88a | 31 |
| 25 | 3.81 ± 0.07b | 2.00 ± 0.10b | 1.23 ± 0.08a | 1.38 ± 0.10b | 1.21 ± 0.06ab | 2.04 ± 0.12b | 1.50 ± 0.06b | 13.17 ± 0.20b | 10.19 ± 0.80b | 26 | ||
| 30 | 2.93 ± 0.10c | 1.32 ± 0.09c | 1.04 ± 0.04b | 1.21 ± 0.08b | 0.91 ± 0.00b | 1.39 ± 0.09c | 1.00 ± 0.00c | 9.89 ± 0.21c | 4.96 ± 0.49c | 29 | ||
| Phytoseiulus persimilis | 20 | 3.07 ± 0.13a | 1.14 ± 0.10a | -- | 1.79 ± 0.11a | -- | 2.00 ± 0.10a | -- | 8.00 ± 0.21a | 26.86 ± 1.96a | 26 | |
| 25 | 2.69 ± 0.13b | 1.23 ± 0.12a | -- | 1.31 ± 0.13b | -- | 1.38 ± 0.14b | -- | 6.62 ± 0.24b | 22.46 ± 2.32b | 13 | ||
| 30 | 1.85 ± 0.10c | 1.00 ± 0.00b | -- | 1.08 ± 0.08c | -- | 1.08 ± 0.05c | -- | 4.89 ± 0.08c | 17.46 ± 1.39c | 13 | ||
| Neoseiulus californicus | 20 | 3.00 ± 0.15a | 1.14 ± 0.10a | -- | 1.71 ± 0.13a | -- | 1.93 ± 0.13a | -- | 7.79 ± 0.24a | 31.07 ± 2.11a | 28 | |
| 25 | 1.54 ± 0.14b | 1.00 ± 0.00b | -- | 1.31 ± 0.13b | -- | 1.23 ± 0.12b | -- | 5.08 ± 0.21b | 28.46 ± 2.19a | 13 | ||
| 30 | 1.00 ± 0.00c | 1.00 ± 0.00b | -- | 1.00 ± 0.00c | -- | 1.00 ± 0.00c | -- | 4.00 ± 0.00c | 17.56 ± 1.13b | 16 |
Means (±SE) within a column for each species and sex followed by different letters are significantly different (LSD Test, P < 0.05). ¹ Chrysalis stages (Protochrysalis, Deutochrysalis, Teliochrysalis) are quiescent stages specific to Tetranychus urticae; "--" indicates not applicable for Phytoseiidae mites. ² Number of individuals observed for each species at each temperature for calculating developmental times.
Table 2.
Mean (± SE) longevity and reproductive parameters of Tetranychus urticae, Phytoseiulus persimilis, and Neoseiulus californicus at three constant temperatures.
Table 2.
Mean (± SE) longevity and reproductive parameters of Tetranychus urticae, Phytoseiulus persimilis, and Neoseiulus californicus at three constant temperatures.
| Parameter | Temperature (°C) |
Tetranychus urticae |
Phytoseiulus persimilis |
Neoseiulus californicus |
|---|---|---|---|---|
|
Female Total Longevity (days)¹ |
20 | 38.87 ± 0.82a | 35.75 ± 0.85a | 45.42 ± 1.06a |
| 25 | 30.24 ± 0.63b | 30.27 ± 0.83b | 34.16 ± 0.89b | |
| 30 | 19.23 ± 0.31c | 22.46 ± 0.43c | 23.58 ± 0.56c | |
|
Male Total Longevity (days)¹ |
20 | 33.74 ± 4.82a | 34.86 ± 1.99a | 38.86 ± 2.06a |
| 25 | 23.88 ± 0.85b | 29.08 ± 2.30b | 33.54 ± 2.25a | |
| 30 | 14.86 ± 0.50c | 22.57 ± 1.36c | 21.56 ± 1.13b | |
|
Mean Total Fecundity (eggs/female) |
20 | 44.40 ± 1.54b | 38.25 ± 2.05a | 38.89 ± 2.27a |
| 25 | 69.48 ± 3.15a | 39.78 ± 2.02a | 44.89 ± 2.22a | |
| 30 | 45.62 ± 1.99b | 35.92 ± 1.47a | 29.97 ± 1.24b | |
|
Total Pre-Oviposition Period (TPOP, days) ² |
20 | 20.54 ± 0.21a | 11.61 ± 0.18a | 10.69 ± 0.24a |
| 25 | 15.02 ± 0.17b | 9.76 ± 0.18b | 7.57 ± 0.17b | |
| 30 | 11.20 ± 0.13c | 7.03 ± 0.15c | 6.97 ± 0.15b | |
|
Adult Pre-Oviposition Period (APOP, days) ³ |
20 | 1.79 ± 0.06b | 3.28 ± 0.14a | 3.03 ± 0.25a |
| 25 | 1.94 ± 0.07a | 2.89 ± 0.16a | 2.32 ± 0.12b | |
| 30 | 1.17 ± 0.06c | 2.14 ± 0.13b | 2.94 ± 0.14a | |
|
Oviposition Period (days)⁴ |
20 | 13.22 ± 0.51a | 15.08 ± 0.60a | 14.64 ± 0.60a |
| 25 | 14.08 ± 0.57a | 15.84 ± 0.61a | 14.43 ± 0.63a | |
| 30 | 7.67 ± 0.29b | 11.12 ± 0.31b | 12.41 ± 0.32a | |
| Mean Eggs per Oviposition Day | 20 | 3.36 ± 0.08b | 2.61 ± 0.06b | 2.58 ± 0.08b |
| 25 | 4.94 ± 0.10a | 2.76 ± 0.06b | 2.83 ± 0.09b | |
| 30 | 6.03 ± 0.15a | 2.90 ± 0.07b | 1.80 ± 0.30c |
For each parameter and species, means (±SE) within a column followed by different letters are significantly different (LSD Test, P < 0.05). ¹ Total longevity is calculated from birth for individuals that developed into and died as adult females or males, respectively. ² Total Pre-Oviposition Period (TPOP) is the period from birth to the first oviposition, encompassing the entire pre-adult duration. ³ Adult Pre-Oviposition Period (APOP) is the period from adult emergence to the first oviposition. ⁴ Oviposition Period is the duration during which females actively lay eggs (days with fecundity > 0).
Table 3.
Life table parameters (mean ± SE) of Tetranychus urticae, Phytoseiulus persimilis, and Neoseiulus californicus at three constant temperatures.
Table 3.
Life table parameters (mean ± SE) of Tetranychus urticae, Phytoseiulus persimilis, and Neoseiulus californicus at three constant temperatures.
| Parameter | Temperature (°C) | Tetranychus urticae (n=100) | Phytoseiulus persimilis (n=50) | Neoseiulus californicus (n=50) |
|---|---|---|---|---|
|
**Intrinsic Rate of Increase (rm, day⁻¹) ** |
20 | 0.127 ± 0.003 c | 0.182 ± 0.007 b | 0.196 ± 0.008 a |
| 25 | 0.180 ± 0.003 b | 0.209 ± 0.007 a | 0.252 ± 0.009 a | |
| 30 | 0.233 ± 0.006 a | 0.268 ± 0.010 a | 0.246 ± 0.010 a | |
| **Finite Rate of Increase (λ, day⁻¹) ** | 20 | 1.135 ± 0.004 c | 1.200 ± 0.005 b | 1.217 ± 0.010 a |
| 25 | 1.196 ± 0.005 b | 1.233 ± 0.009 a | 1.286 ± 0.010 a | |
| 30 | 1.263 ± 0.008 a | 1.307 ± 0.010 a | 1.279 ± 0.013 a | |
| Gross Reproductive Rate (GRR, eggs/female) | 20 | 37.03 ± 2.62 b | 32.23 ± 5.07 a | 28.71 ± 3.04 a |
| 25 | 69.68 ± 3.91 a | 42.12 ± 9.97 a | 36.71 ± 4.81 a | |
| 30 | 58.33 ± 7.80 a | 29.21 ± 2.68 a | 21.50 ± 2.31 b | |
| Net Reproductive Rate (R0, offspring/female) | 20 | 27.968 ± 2.35 b | 27.533 ± 2.83 a | 26.243 ± 0.23 a |
| 25 | 45.85 ± 3.88 a | 29.43 ± 2.87 a | 21.30 ± 0.20 b | |
| 30 | 32.39 ± 2.50 ab | 26.58 ± 2.47 a | 14.86 ± 0.16 c | |
| Mean Generation Time (T, days) | 20 | 26.243 ± 0.23 a | 18.147 ± 0.34 b | 16.97 ± 0.41 c |
| 25 | 21.30 ± 0.20 a | 16.14 ± 0.26 b | 13.91 ± 0.27 c | |
| 30 | 14.86 ± 0.16 a | 12.24 ± 0.20 b | 12.10 ± 0.20 b | |
| Doubling Time (Dt, days) | 20 | 5.46 ± 0.61 a | 3.79 ± 0.57 b | 3.79 ± 0.58 b |
| 25 | 3.86 ± 0.59 a | 3.31 ± 0.48 ab | 2.75 ± 0.35 b | |
| 30 | 2.96 ± 0.49 a | 2.59 ± 0.54 a | 2.81 ± 0.52 a | |
| Sex Ratio (Proportion Female)¹ | 20 | 0.63 ± 0.05 a | 0.72 ± 0.05 a | 0.72 ± 0.05 a |
| 25 | 0.66 ± 0.05 a | 0.74 ± 0.06 a | 0.74 ± 0.06 a | |
| 30 | 0.71 ± 0.05 a | 0.74 ± 0.06 a | 0.66 ± 0.07 a |
For each parameter and species, means (±SE) within a column followed by different letters are significantly different (LSD Test, P < 0.05, based on 100,000 bootstrap re-samplings for SEs). Sample size (n) indicates initial number of eggs per cohort for life table study. ¹ Proportion of female adults in the total adult population.
Table 4.
Mean (± SE) stage-specific and daily prey consumption rates (individuals of Tetranychus urticae) by Phytoseiulus persimilis and Neoseiulus californicus at three constant temperatures (n=30 predators per species/temperature).
Table 4.
Mean (± SE) stage-specific and daily prey consumption rates (individuals of Tetranychus urticae) by Phytoseiulus persimilis and Neoseiulus californicus at three constant temperatures (n=30 predators per species/temperature).
| Predator Species | Consumption Metric | Temperature (°C) | Protonymph | Deutonymph | Adult Male |
Adult Female |
Total Mean Consumption |
|---|---|---|---|---|---|---|---|
| Phytoseiulus persimilis | Stage-Specific Net Consumption (Total prey/stage) | 20 | 5.13 ± 0.25 | 7.70 ± 0.30 | 73.13 ± 2.65 | 223.63 ± 4.80 | 309.60 ± 13.21 a |
| 25 | 5.62 ± 0.49 | 9.12 ± 0.67 | 55.83 ± 2.54 | 213.93 ± 4.90 | 284.37 ± 15.13 a | ||
| 30 | 4.63 ± 0.27 | 7.33 ± 0.47 | 49.97 ± 2.45 | 200.33 ± 4.90 | 262.27 ± 6.98 a | ||
| Daily Consumption Rate (Prey/day/stage) ¹ | 20 | 2.75 ± 0.25 | 3.92 ± 0.36 | 3.11 ± 0.96 | 10.86 ± 0.99 | 10.16 ± 0.64b | |
| 25 | 3.91 ± 0.33 | 5.51 ± 0.46 | 3.53 ± 0.98 | 11.88 ± 0.99 | 11.21 ± 0.69ab | ||
| 30 | 4.48 ± 0.31 | 6.67 ± 0.46 | 4.13 ± 0.96 | 14.59 ± 0.99 | 12.47 ± 0.68a | ||
| Neoseiulus californicus | Stage-Specific Net Consumption (Total prey/stage) | 20 | 4.43 ± 0.34 | 6.77 ± 0.35 | 64.53 ± 2.65 | 247.03 ± 4.80 | 322.77 ± 10.96 a |
| 25 | 4.37 ± 0.43 | 6.23 ± 0.50 | 66.27 ± 2.67 | 204.76 ± 4.83 | 281.63 ± 15.28 a | ||
| 30 | 3.63 ± 0.32 | 4.87 ± 0.21 | 55.46 ± 3.00 | 135.33 ± 4.58 | 199.30 ± 7.86 b | ||
| Daily Consumption Rate (Prey/day/stage) ¹ | 20 | 2.61 ± 0.30 | 3.70 ± 0.42 | 2.36 ± 0.93 | 8.76 ± 0.99 | 8.11 ± 0.66c | |
| 25 | 3.54 ± 0.35 | 4.35 ± 0.42 | 2.87 ± 0.99 | 10.95 ± 0.91 | 10.19 ± 0.67a | ||
| 30 | 3.63 ± 0.34 | 4.87 ± 0.46 | 3.72 ± 0.99 | 10.67 ± 0.97 | 9.97 ± 0.69b |
For each predator species, means (±SE) in the "Total Mean Consumption" column followed by different letters indicate significant differences across temperatures (LSD Test, P < 0.05). ¹ Daily consumption rate is weighted based on the survival rate and duration of each stage.
Table 5.
Calculation inputs for the Potential Predation Rate of Release (PPRR) model for Phytoseiulus persimilis and Neoseiulus californicus against Tetranychus urticae.
Table 5.
Calculation inputs for the Potential Predation Rate of Release (PPRR) model for Phytoseiulus persimilis and Neoseiulus californicus against Tetranychus urticae.
| Species | Parameter | 20°C | 25°C | 30°C | Overall Average rm (day⁻¹) | Ratio of Predator rm to Prey rm | Overall average Daily Food Consumption (prey/day) | Potential Predation Rate of Release PPRR (prey/predator/day) |
|---|---|---|---|---|---|---|---|---|
| Phytoseiulus persimilis | Intrinsic Rate of Increase (rm) (day⁻¹) | 0.182 | 0.209 | 0.268 | 0.22 | 1.22 | 12.44 | 15.18 |
| Mean daily Food consumption by adult female(prey/day) | 10.86 | 11.88 | 14.59 | 12.44 | ||||
| Neoseiulus californicus | Intrinsic Rate of Increase (rm) (day⁻¹) | 0.196 | 0.252 | 0.246 | 0.231 | 1.29 | 10.13 | 13.06 |
| Mean daily Food consumption by adult female (prey/day) | 8.76 | 10.95 | 10.67 | 10.13 | ||||
| Tetranychus urticae | Intrinsic Rate of Increase (rm) (day⁻¹) | 0.127 | 0.18 | 0.233 | 0.18 | -- | -- | -- |
Overall average rm and daily food consumption are calculated as the arithmetic mean of the values at the three tested temperatures. PPRR is calculated as: (Ratio of Predator rm to Prey rm) × (Overall Average Daily Food Consumption of the predator).
Disclaimer/Publisher’s Note: The statements, opinions and data contained in all publications are solely those of the individual author(s) and contributor(s) and not of MDPI and/or the editor(s). MDPI and/or the editor(s) disclaim responsibility for any injury to people or property resulting from any ideas, methods, instructions or products referred to in the content. |
© 2026 by the authors. Licensee MDPI, Basel, Switzerland. This article is an open access article distributed under the terms and conditions of the Creative Commons Attribution (CC BY) license (http://creativecommons.org/licenses/by/4.0/).
Copyright: This open access article is published under a Creative Commons CC BY 4.0 license, which permit the free download, distribution, and reuse, provided that the author and preprint are cited in any reuse.


