
Submitted:
22 June 2026
Posted:
23 June 2026
You are already at the latest version
Abstract
Heavy metal contamination in water resources poses a significant environmental and public health challenge due to its toxicity, persistence, and bio accumulative nature. This study investigates the potential of molybdenum disulfide (MoS₂) nanoparticles as an efficient adsorbent for the removal of heavy metals from aqueous solutions. MoS₂ nanoparticles were synthesized and characterized using appropriate analytical techniques to evaluate their structural and surface properties. Batch adsorption experiments were conducted to assess the removal efficiency of selected heavy metal ions under varying conditions, including pH, contact time, initial metal concentration, and adsorbent dosage. The results demonstrated that MoS₂ nanoparticles exhibit a high adsorption capacity owing to their large surface area, layered structure, and abundance of active adsorption sites. The removal efficiency increased with optimized pH and contact time, achieving significant reductions in heavy metal concentrations. Adsorption behavior was analyzed using kinetic and isotherm models, indicating favourable adsorption mechanisms. The findings suggest that MoS₂ nanoparticles are a promising, cost-effective, and environmentally friendly material for wastewater treatment and heavy metal remediation. This study contributes to the development of advanced nanomaterial-based technologies for improving water quality and protecting environmental and human health.
Keywords:
heavy metals
; molybdenum disulfide nanoparticles (MoS₂)
; adsorption
; wastewater treatment
; water purification
; nanotechnology
1. Introduction
The rapid growth of population and the demand for hygienic food causes foodborne contaminants worldwide. There are certain nations still failing to supply the essential clean and nutrient-rich foods due to the economic and political reasons; resulting with many food contaminations. It is well accepted that the presence of pathogens and contaminants in the food are responsible for many foodborne illnesses, this occurs due to poor food processing practice and usages of many fertilizers during the cultivation. In recent days there are well advanced and highly precise instrumentation is available to identify the species responsible for foodborne contaminants. However, it is not affordable for all people also these techniques need more time to identify the food contaminants. In majority cases, the peoples from the poorly developed nations still suffer to identify the foodborne contaminants which are mainly heavy metals. The adsorption of toxic heavy metal substances resulting from accumulation of industrial waste is important and one of the most dangerous challenges facing the global world and society is the heavy metal as it proof to a significant contaminant affecting the food sectors and industry .The metal ion possess an acute health risk to human beings and aquatic animals because of their toxicity both at lower dose and higher dose in soil and water ,heavy metal contaminants have become increasingly harmful and dangerous with the advent of technological developments and the need for diverse of heavy metals. In agricultural system soils, is one of the most important sources of heavy metal which arise through improper handling of food material, excessive usage of pesticides and fertilizers, poor irrigation of plant with polluted water thus the metal are being transmitted through the vascular system of the plant. The adsorption of heavy metal on the active surface of solids seems to be effectives and efficient methods for heavy metal removal ,adsorption process is a physiochemical process that requires the use of solids, liquid and gas as an adsorbent for the removal of heavy metal .Activated carbon sounds to be effectives and efficient adsorbent ,however the regeneration and recovery rate is low and the cost of production is high ,these research focus on the synthesis of nanoparticles based on molybdenum disulphides as the metal precursor as an adsorbent for the removal of cadmium and lead from aqueous solution which are considered to be environmentally safe . Cadmium is a naturally occurring toxic metal with common exposure in industrial workplaces, plant soils, and from smoking. Due to its low permissible exposure in humans, overexposure may occur even in situations where only trace quantities of cadmium are found. Cadmium is used extensively in electroplating, although the nature of the operation does not generally lead to overexposure. Cadmium is also found in some industrial paints and may represent a hazard when sprayed. Operations involving removal of cadmium paints by scraping or blasting may pose a significant hazard. The primary use of cadmium is in the manufacturing of NiCd rechargeable batteries. Acute exposure to cadmium fumes may cause flu-like symptoms including chills, fever, and muscle ache sometimes referred to as "the cadmium blues." Symptoms may resolve after a week if there is no respiratory damage. The primary source for cadmium is as a byproduct of refining zinc metal. Copper serves as an essential element across all domains of life, including bacteria, fungi, plants, and animals. Within the human body, this indispensable trace metal acts as a critical cofactor for numerous biological processes. By binding to specific enzymes, copper actively facilitates blood coagulation, hormone maturation, and cellular energy metabolism, [2]Extracellular or intracellular copper concentrations exceeding daily metabolic requirements trigger cytotoxicity, ultimately leading to cell death. Conversely, copper deficiency impairs cellular absorption and homeostatic transport mechanisms, culminating in the aberrant distribution of the metal across various cellular compartments. [3]Copper, cadmium and lead are structural element which exist as a metals or dissolved metal salts .However, the rapid, inexpensive and reliable adsorbent reported in this work will be the best alternative method to the expensive heavy metals removal techniques.
2. Materials and Methods
All chemicals were of analytical grade and were used as obtained from University of York laboratory suppliers. All chemicals and solvents were used as obtained without further purification. The stoichiometry quantities of salts were mixed in deionized water or their respective solvent to prepare the metallic solutions that were used in the experiments.
2.1. Synthesis of Molybdenum Disulphide Nanoparticles
25ml of 0.001M of sodium molybdate and 25 ml of 0.005M of L-cysteine was added into 50 ml deionized water in a 100 ml beaker and sonicated for 30 minutes in an ultrasonic cell disruptor, the mixture was then transferred into a 100 ml glass vial and kept in the autoclave at 180 0 C for 30 hours at a stirring rate of 800 rpm, the solution was then cooled down naturally, the supernatant containing the molybdenum disulphide nanoparticles was transferred into a test-tube after being centrifuged for 30 minutes at 800 rpm and filtered.[4]
2.2. Adsorption Experiments
The adsorption of heavy metals by metal nanoparticles was carried out using 0.1 g of the synthesized metal nanoparticles .1000ppm of the stock solution of each metal ion and from it different concentration ranging from 0.5-20ppm were prepared by successive dilution with deionized water into these solutions was added 0.1g of synthesized molybdenum disulphides nanoparticles was added and agitated in orbital shaker at room temperature for 2 hours after which the solution was centrifuged and the supernatant analyzed using Uv/visible spectroscopy. The same procedure was used for each metal nanoparticle.
2.3. Physiochemical Parameter Study
2.3.1. The Influence of Initial Concentration of Heavy Metals on the Adsorption of Heavy Metal
0.5-20ppm of each metal ions was prepared by successive dilution with deionized water after which 0.1 g of molybdenum disulphides nanoparticles was added to the solution and agitated in the shaker for 2 hours after which the solution was filtered and the supernatants analysed using Uv/visible spectroscopy. The optimal contact time was determined for each heavy metal. This is defined as the time at which the adsorbent had sufficiently removed the adsorbate from the solution and no further adsorbate could be remove by the material after this time.
2.3.2. Effect of Contact Time
A range of different initial concentration of each metal ions was prepared and 0.1g of Molybdenum disulphides nanoparticles were added and agitated for 5-1440minutes after which the solution was filtered and supernatants was analysed using Uv/Visible spectroscopy. The optumal contact time was determined for each heavy metal .by using the following equation
Qe=(Co-Ce/W)V
Where Co is the initial concentration, Ce is the equilibrium concentration at time T(minutes),V is the working Volume and W is the weight of the adsorbent.
2.3.3. Effect of Adsorbent Dose
Optimal initial concentration of each metal ions was prepared for optimal time of respective metal ions and the doses of Molybdenum nanoparticles ranging from 0.01-0.05 g were added and agitated for the optimal time of each respective metal cation. At the end of the experiment, the solution was filtered and analysed using uv/visible spectroscopy. The optimal dose of adsorbent was determined for each heavy metal .by using the following equation
Qe= (Co-Ce) V
W
Where Co is the optimal initial concentration, Ce is the equilibrium concentration at time T(minutes), V is the working Volume and W is the weight of the adsorbent.
2.3.3. Effect of pH
optimal initial concentration was prepared for all the metal ions for the optimal time and dose of each metal ions across a pH ranges of 3-12, the solution pH were adjusted using 0.1M HCl and 0.1 M NaOH solution and optimal dose of molybdenum disulphides nanoparticles for respective metal ions were added and agitated for the optimal time of each metal ion, after which the solution was filtered and the supernatant were analysed using uv/visible spectroscopy
2.3.4. Effect of Temperature
optimal initial concentration was prepared for all the metal ions at optimal dose of respective metal ion solution and optimal pH and agitated for the optimal time of each metal ions across a temperature ranging from 30 0 C-90 0 C, after the incubation time the solution were filtered and analyse using Uv/Visible spectroscopy.
3. Results and Discussion
3.1. FTIR Spectroscope of Molybdenum Disulfide Nanoparticles
MoS2 nanoparticles showed the general spectral shape of chemically bound cysteine in the finger print region. MoS2 with bands of 3500–3200 cm−1 and 1582 cm−1 resulting from the –OH group, and the band of 1200–900 cm–1 attributed to overlapping the stretching vibrations of Mo=O and S=O which arise as a result of mild oxidation. Through this result, the presence of MoS2 can be confirmed, and it can be seen that mild oxidation occurred in the process of synthesizing MoS2 through a solution process. In the case of cysteine itself, major bands were observed at 3436, 2950, 2515, 2020, and 1525–1315 cm−1, and these corresponded to –OH, –NH2, and S–H stretching vibrations; N–H stretching vibration; and the –COOH group. In addition, in the case of MoS2-Cys, it was confirmed that the Mo=O and S=O stretch vibration bands at 1200–900 cm–1 derived from MoS2 were strengthened compared to that of the Cysteine. The S-H group in the cysteine spectra was not found in the spectra of molybdenum disulfide nanoparticles. (Figure 1) The Transmission electron microscope gives structural morphology of the synthesized MoS2 nanoparticles’ the study revealed that the MoS2 nanoparticles were within the narrow range with spherical and without aggregation. Cysteine helps stabilize the MoS2 nanoparticles.The Scanning electron microscope image reveled the synthesized molybdenum disulphides to be comprise of speherical size nanorange material.(Figure 2)
3.2. Effect of Initial Concentrations
The qe values of adsorption of Cd(II), Pb(II) and Cu(II) by MoS2NPs tends to increases as the initial concentration. The qe values varied for each ion with highest qe values with Cd(II) followed by Pb(II) and Cu(II) respectively. (Figure 3)
3.3. Effect of Contact Time
The quantity of Cd(II), Pb(II) and Cu(II) adsorbed by MoS2NPs increases with time and reached equilibrium at 40 minutes and constant thereafter, (Figure 4)
3.5. Effect of Dose
The quantity of Cd(II), Pb(II) and Cu(II) adsorbed by MoS2NPs also decrease with dose of MoS2NPs.-,A possible reason could be to the overlapping of the adsorption sites as a result of overcrowding of MoS2NPs particles or else to the screening effect of the outer layer imposed by the high adsorbent dosage, thereby shielding the active sites from metal (Tumain et al., 2008)[5]. In certain cases, the excess particles can be deposited on the walls of the container creating heterogeneity in the solution. Thus, no contact with metal solution occurred. Figure 5
3.6. Effect of pH
The effect of pH increases with pH for all the metal ions with Cd(II) ions having the highest qe values of 9.1 mg/g, followed by Pb(II) 7.3 mg/g and Cu(II) with 6.5mg/g respective (Figure.) This is due to the availability of more negatively charged surface facilitating greater metal removal by electrostatic attraction. At a low pH value (3 to 6), removal was totally assured by adsorption, and rose to higher at a higher pH. The major mechanism responsible for metal uptake in this range may be ion exchange and electronic attraction. (Figure 6)
3.7. Effect of Temperature
The qe values increases with temperature for Cd(II) and Pb(II) adsorption by MoS2NPs except for Cu(II) ion which decrease with increasing temperature. A similar decrease in the value of qe for Cu(II) ions adsorption is also observed with the cys-AuNPs. this can be as a result of the inelasticity of the surface of the MoS2NPs at a high temperature. (Figure 7)
3.8. Adsorption Kinetics
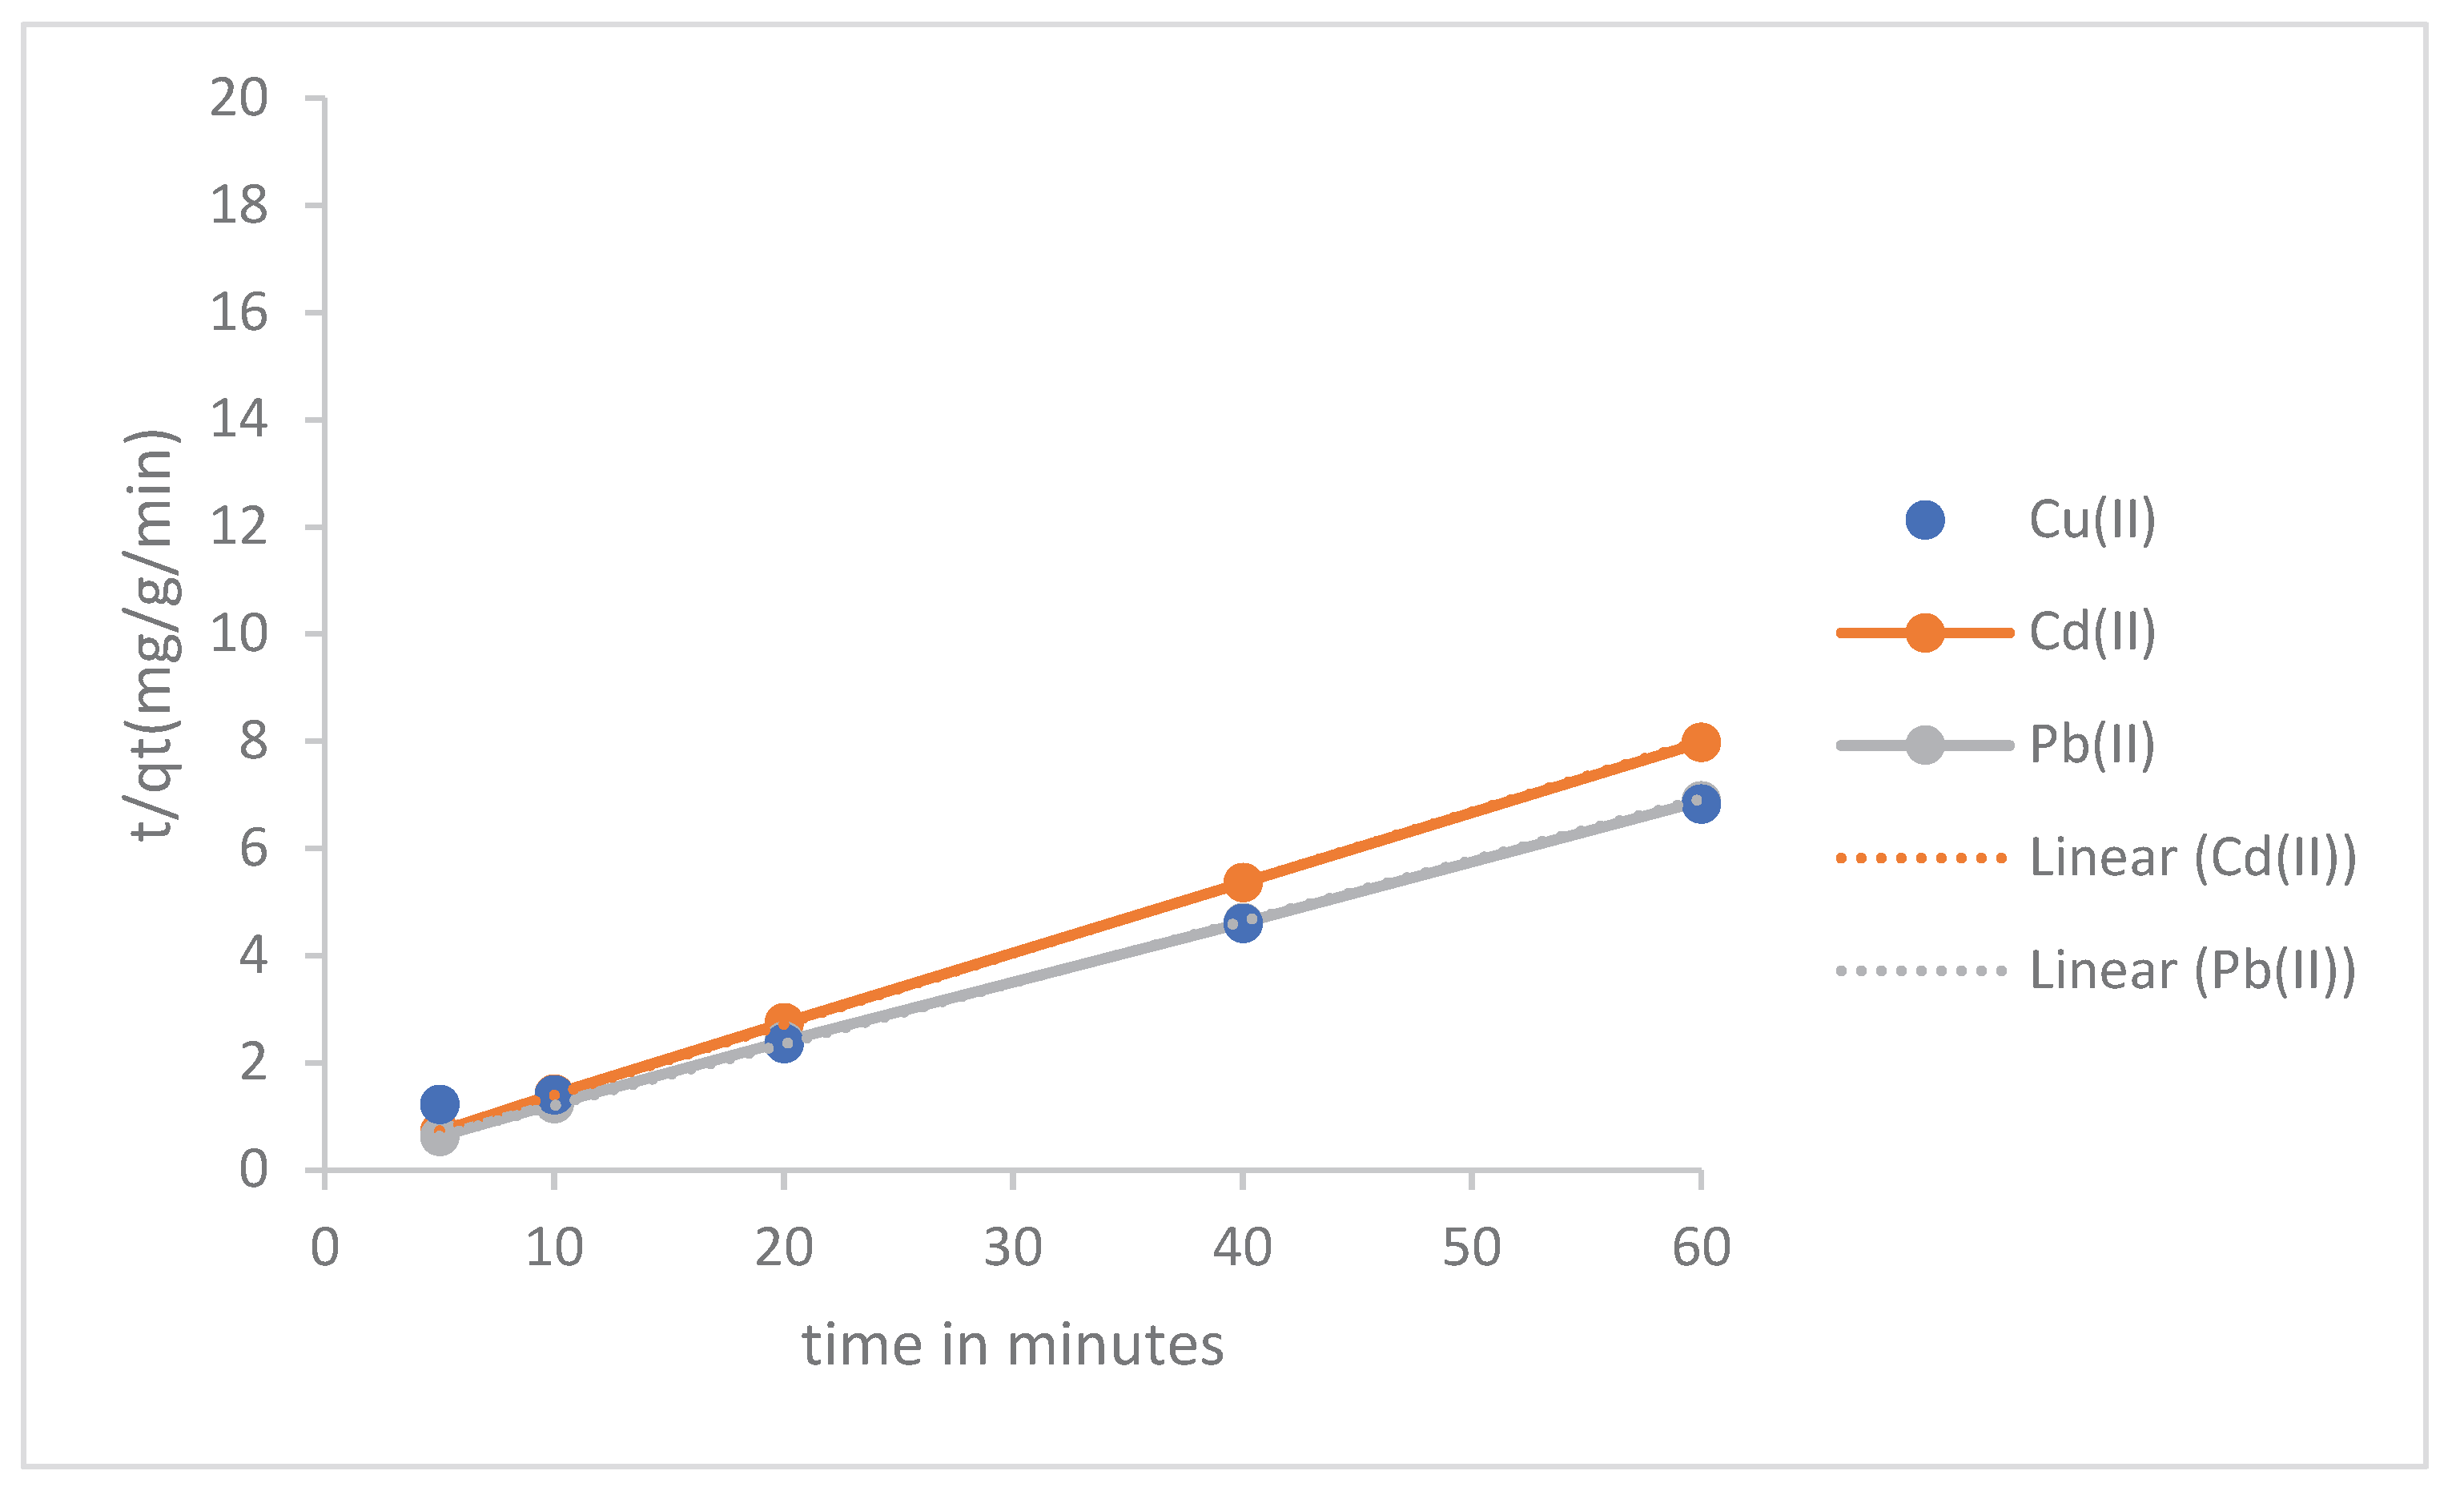
Adsorption kinetic follow pseudo-second order kinetic for all the metal ions adsorbed by MoS2NPs and suggest that the process of adsorption occur vial chemisorption Figure 8

Table 1.
adsorption kinetic plot on adsorption of Cd(II), Pb(II) and Cu(II) by MoS2NPs at 5-60 minutes.
Table 1.
adsorption kinetic plot on adsorption of Cd(II), Pb(II) and Cu(II) by MoS2NPs at 5-60 minutes.
| metals | Pseudo first-order R2 | Pseudo second-order R2 |
| Cu (II) | 0.2698 | 1 |
| Cd (II) | 0.2778 | 1 |
| Pb (II) | 0.2509 | 1 |
Figure 7.
pseudo first-order plot on adsorption of Cd(II), Pb(II) and Cu(II) by MoS2NPs at 5-60 minutes.
Figure 7.
pseudo first-order plot on adsorption of Cd(II), Pb(II) and Cu(II) by MoS2NPs at 5-60 minutes.
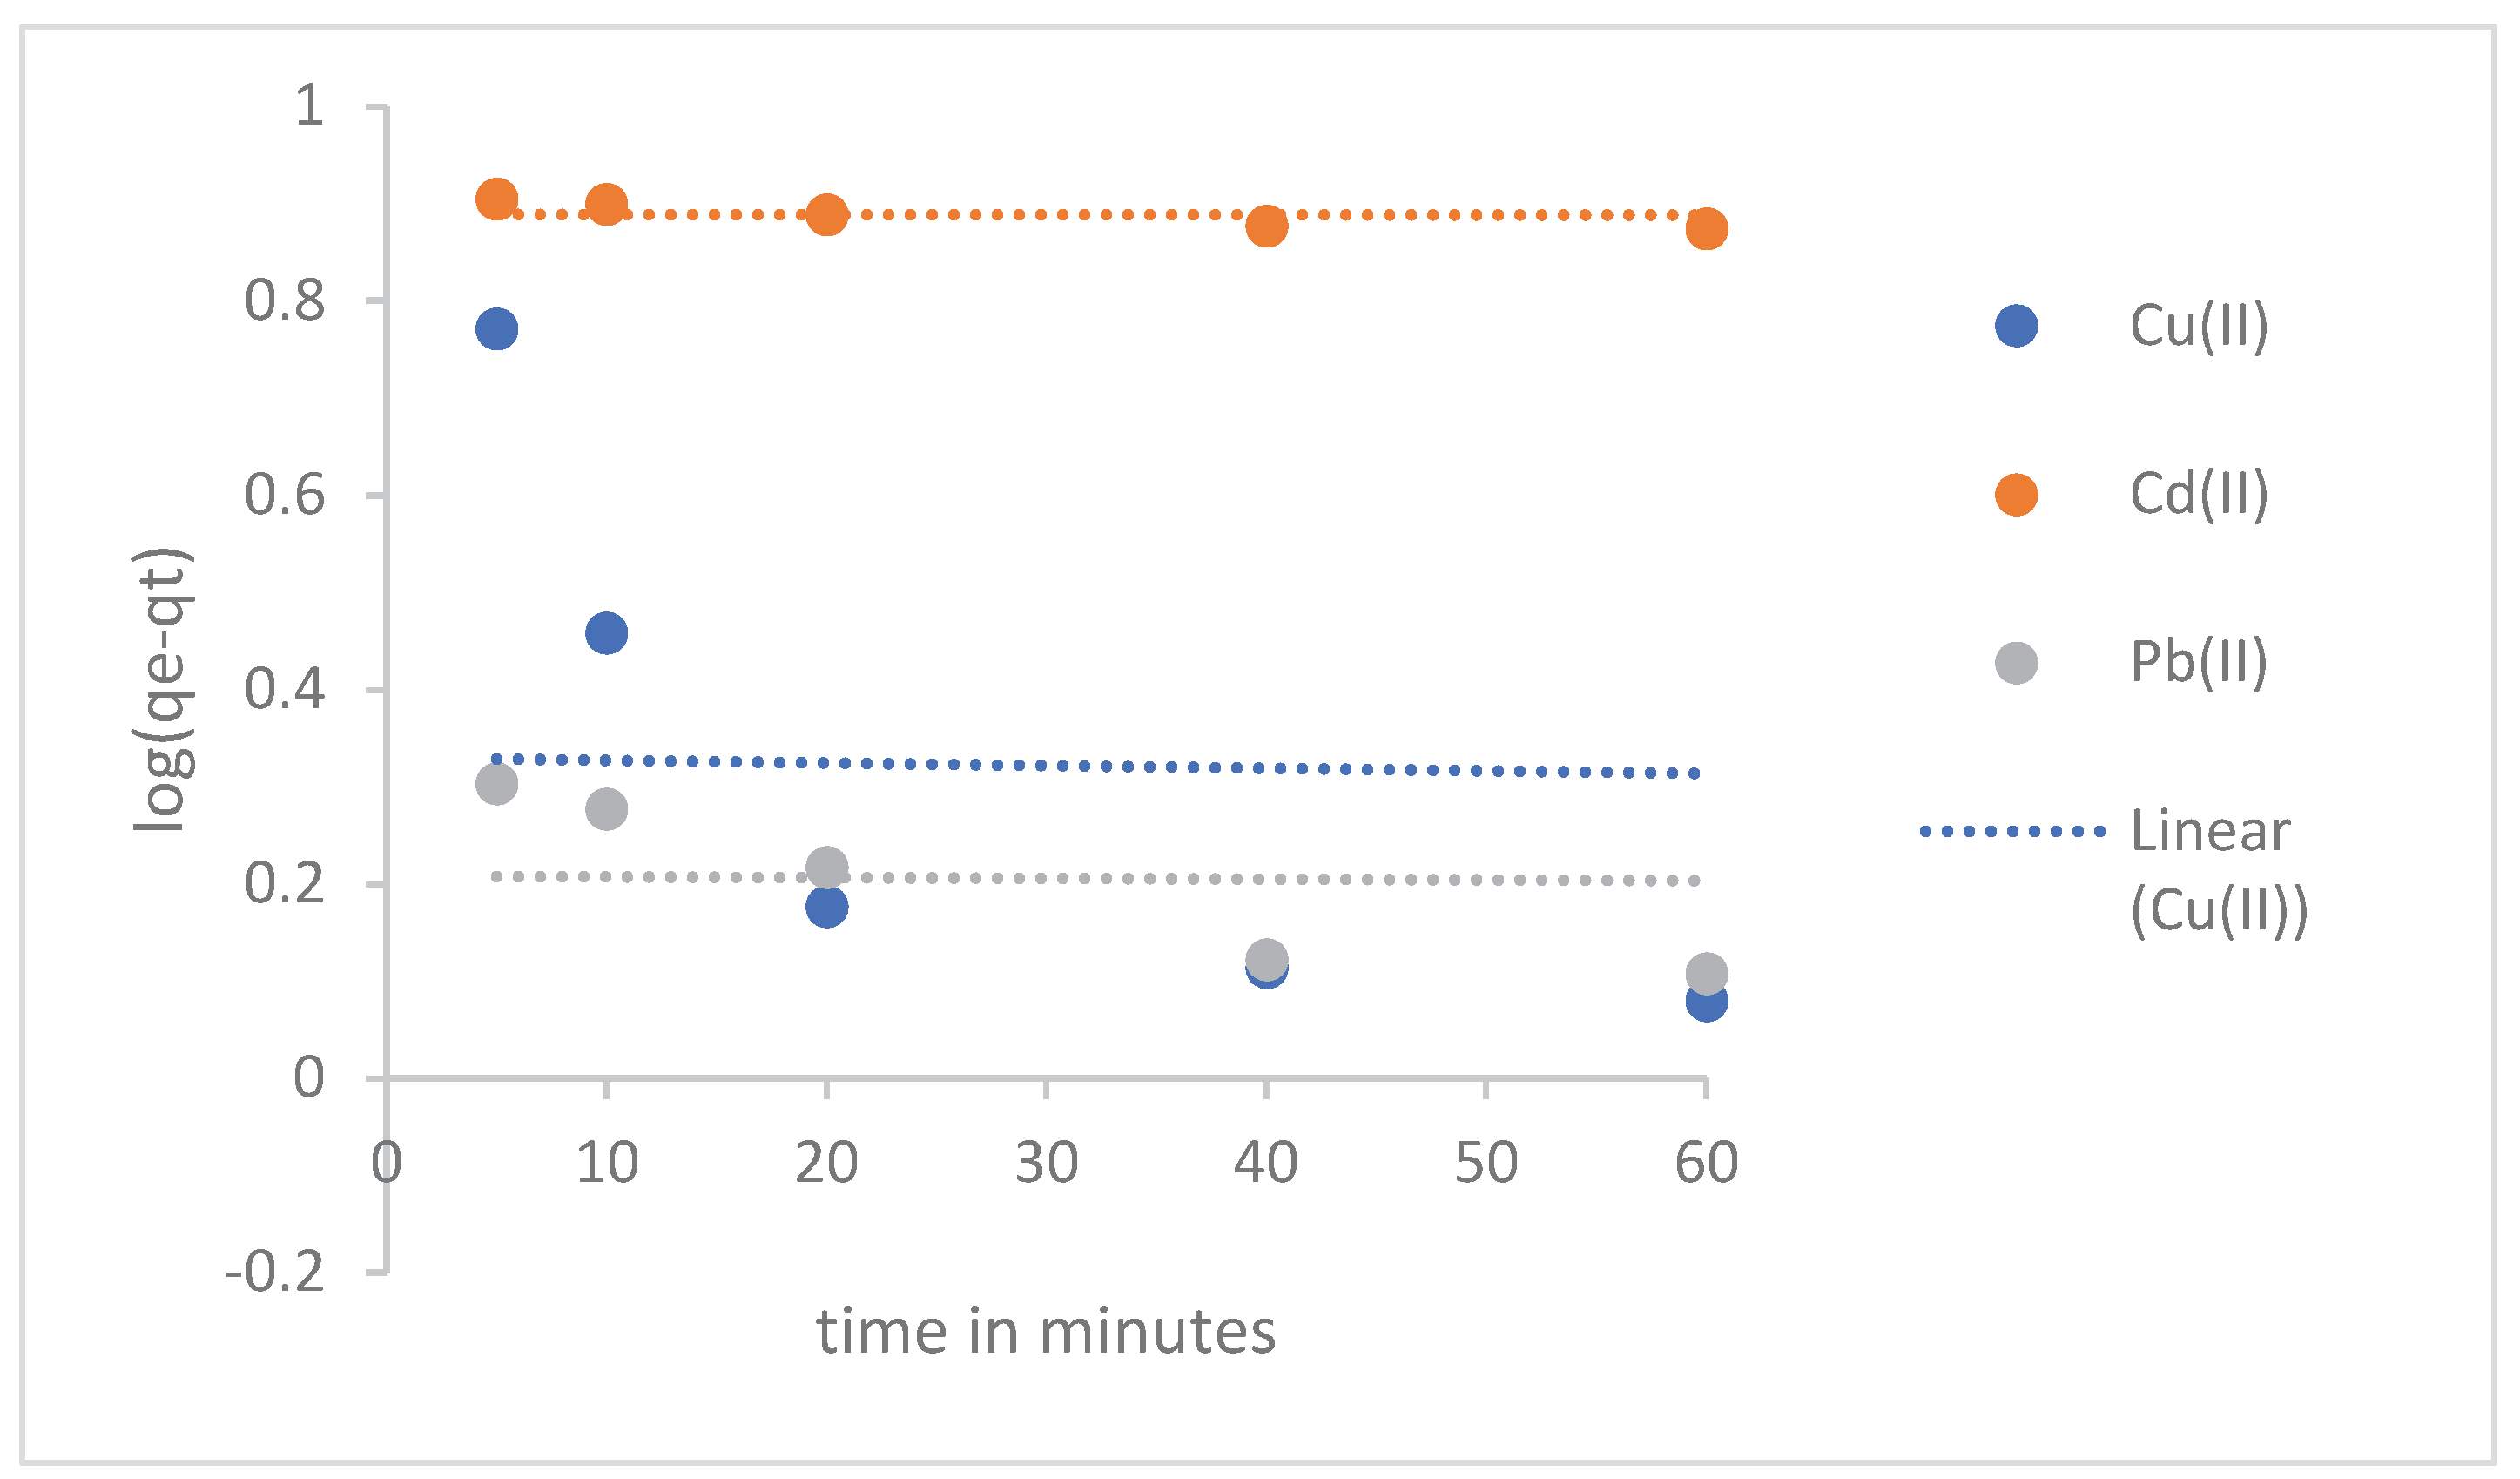
Figure 8.
pseudo second-order plot on adsorption of Cd(II),Pb(II) and Cu(II) by MoS2NPs at 5-60minutes.
Figure 8.
pseudo second-order plot on adsorption of Cd(II),Pb(II) and Cu(II) by MoS2NPs at 5-60minutes.
3.9. Adsorption Isotherm
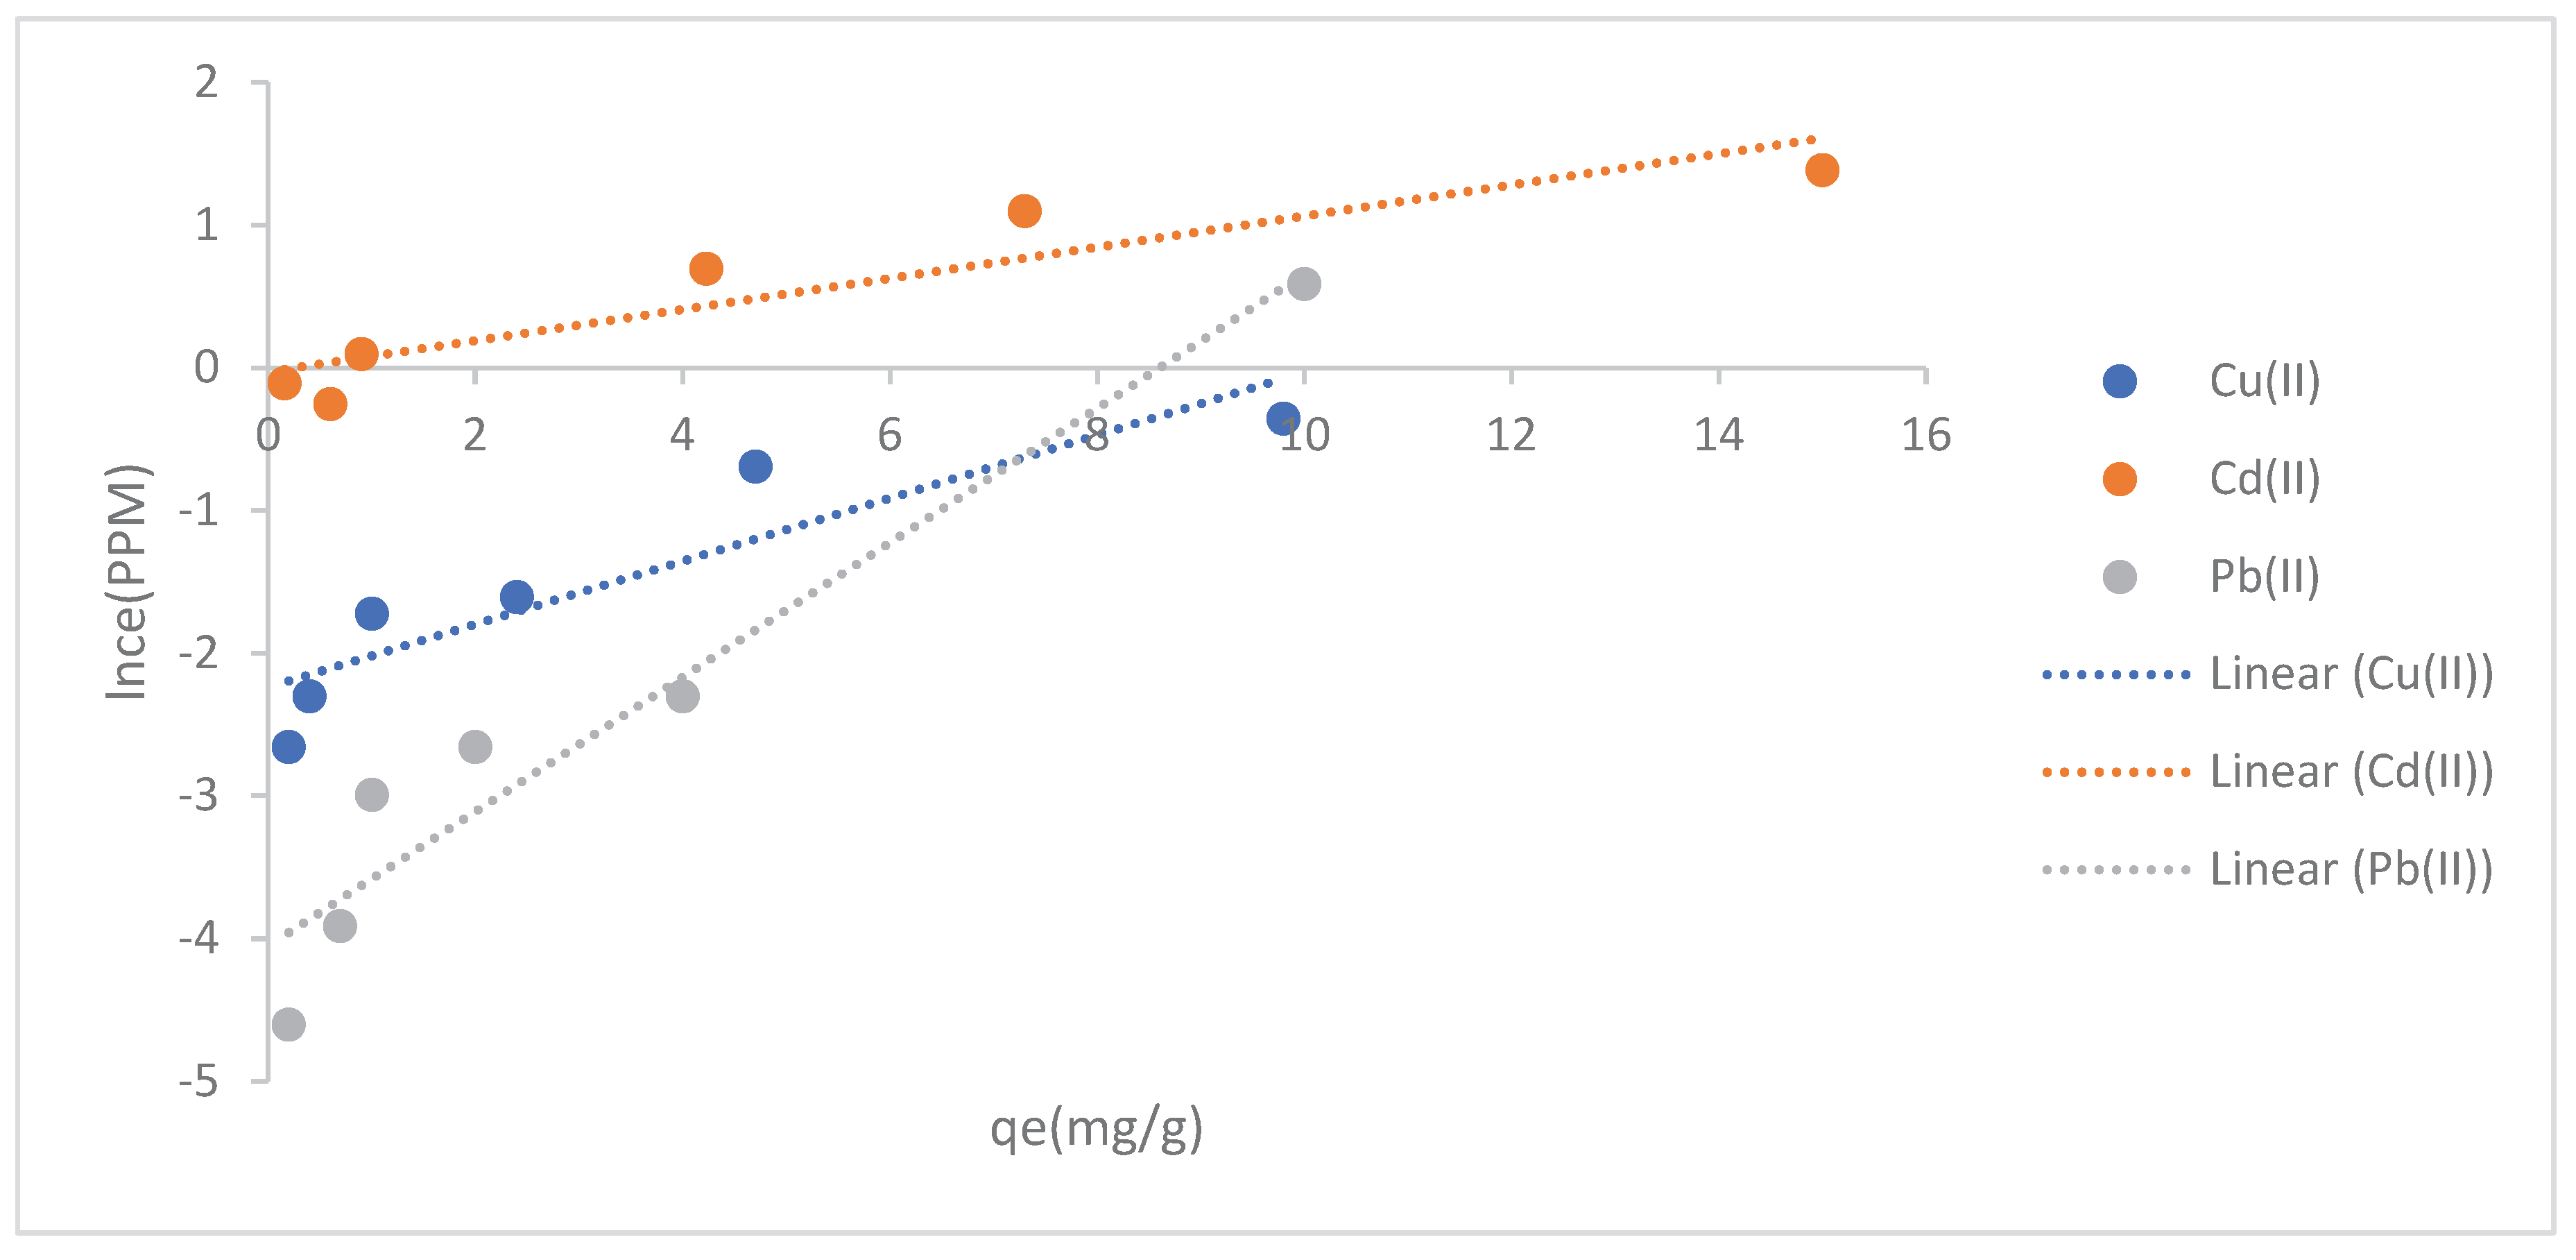
Adsorption isotherm fits best for in Freundlich Isotherm for Cu(II) ions adsorption by MoS2NPs and suggest the process of adsorption occurring on heterogeneous surface rather than homogenous surface, the adsorption of Cd(II) by MoS2NPs fit best in Henry isotherm which support the mechanism of adsorption via a surface homogeneity. The adsorption isotherm fit best in Temkin isotherm for Pb(II) ions adsorption by MoS2NPs and this account for the heat of adsorption of all molecules in the layer decreases linearly as a result of increase surface coverage [6]. (Figure 9) and list of R values are depicted in Table 2
Figure 9.
Henry isotherm plot on adsorption of Cd(II), Pb(II) and Cu(II) by MoS2NPs.
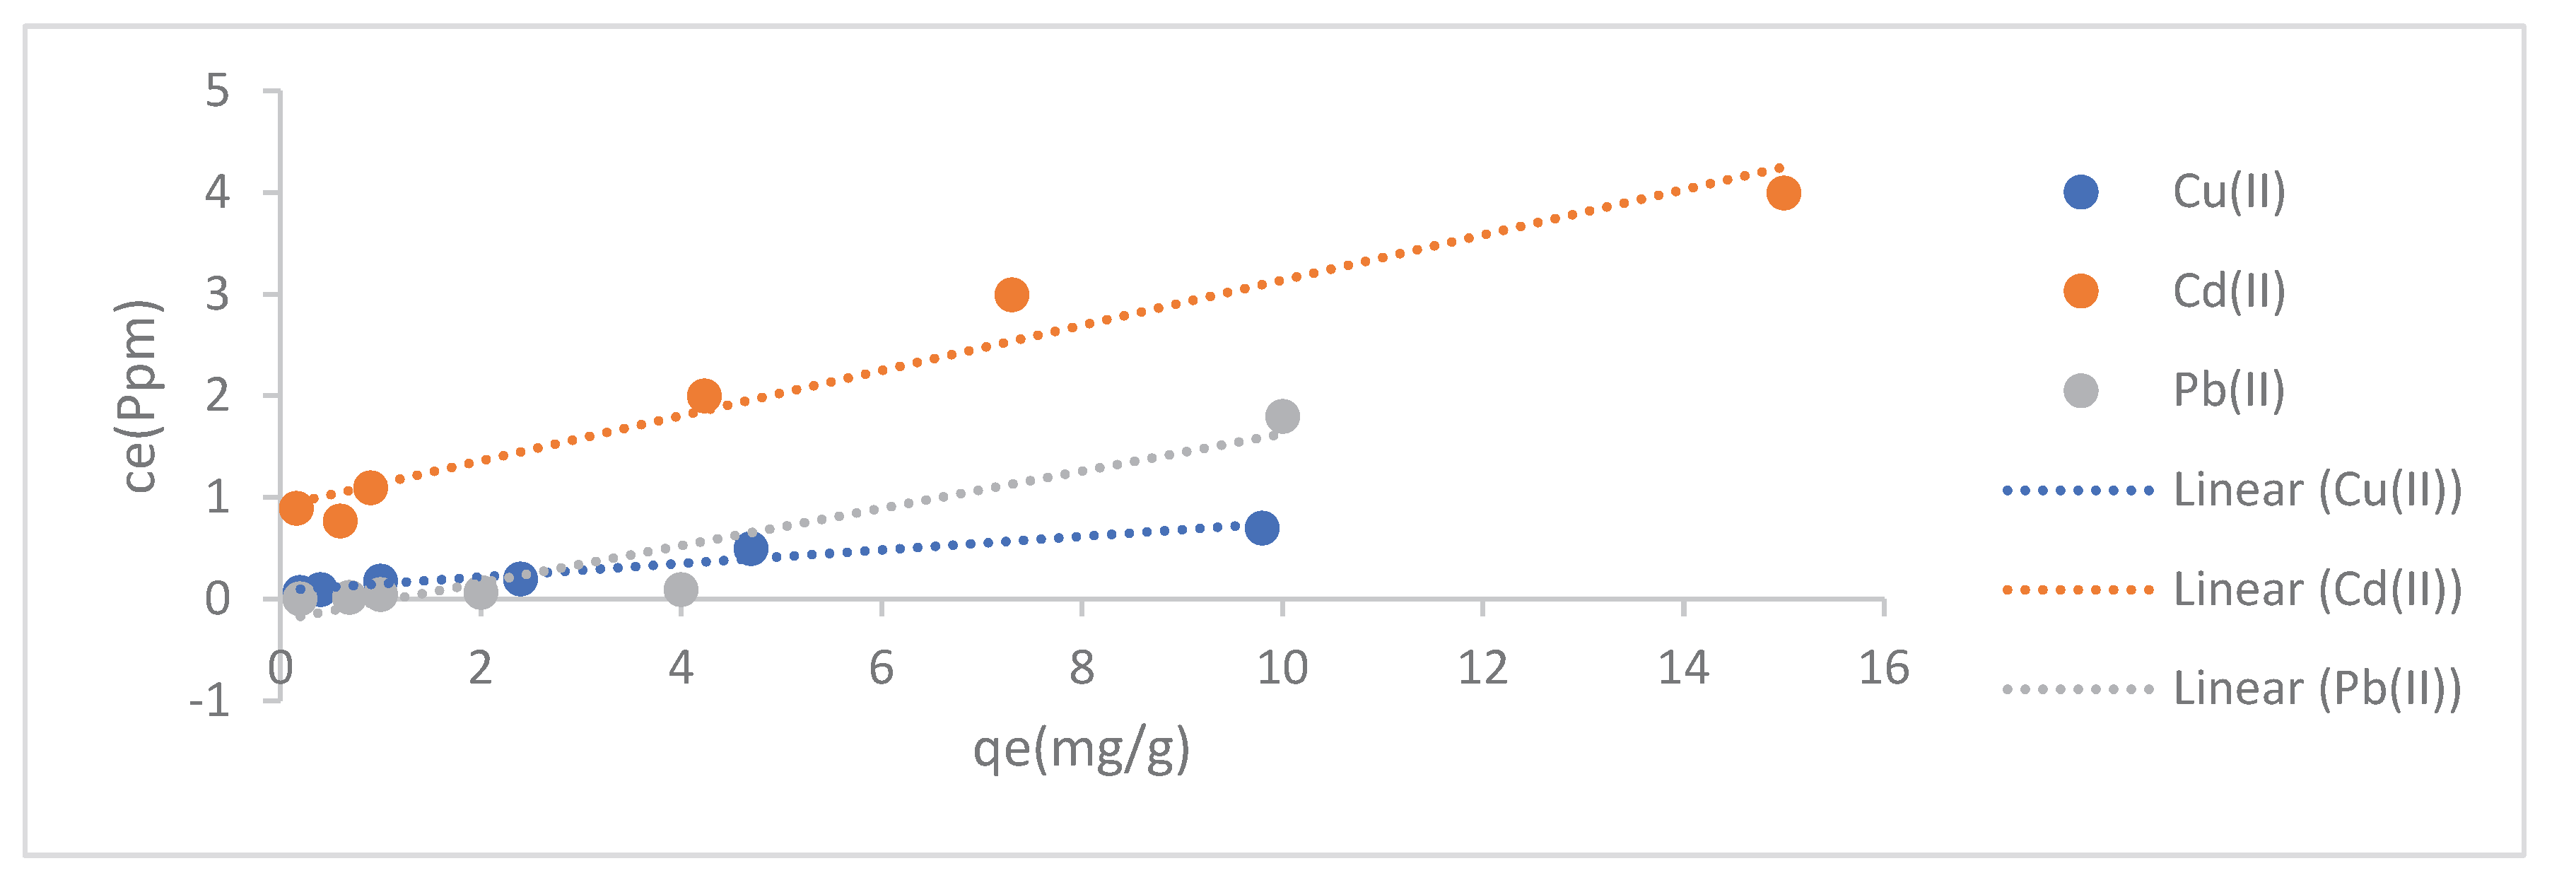
Figure 10.
Freundlich isotherm plot on adsorption of Cd(II), Pb(II) and Cu(II) by MoS2NPs.
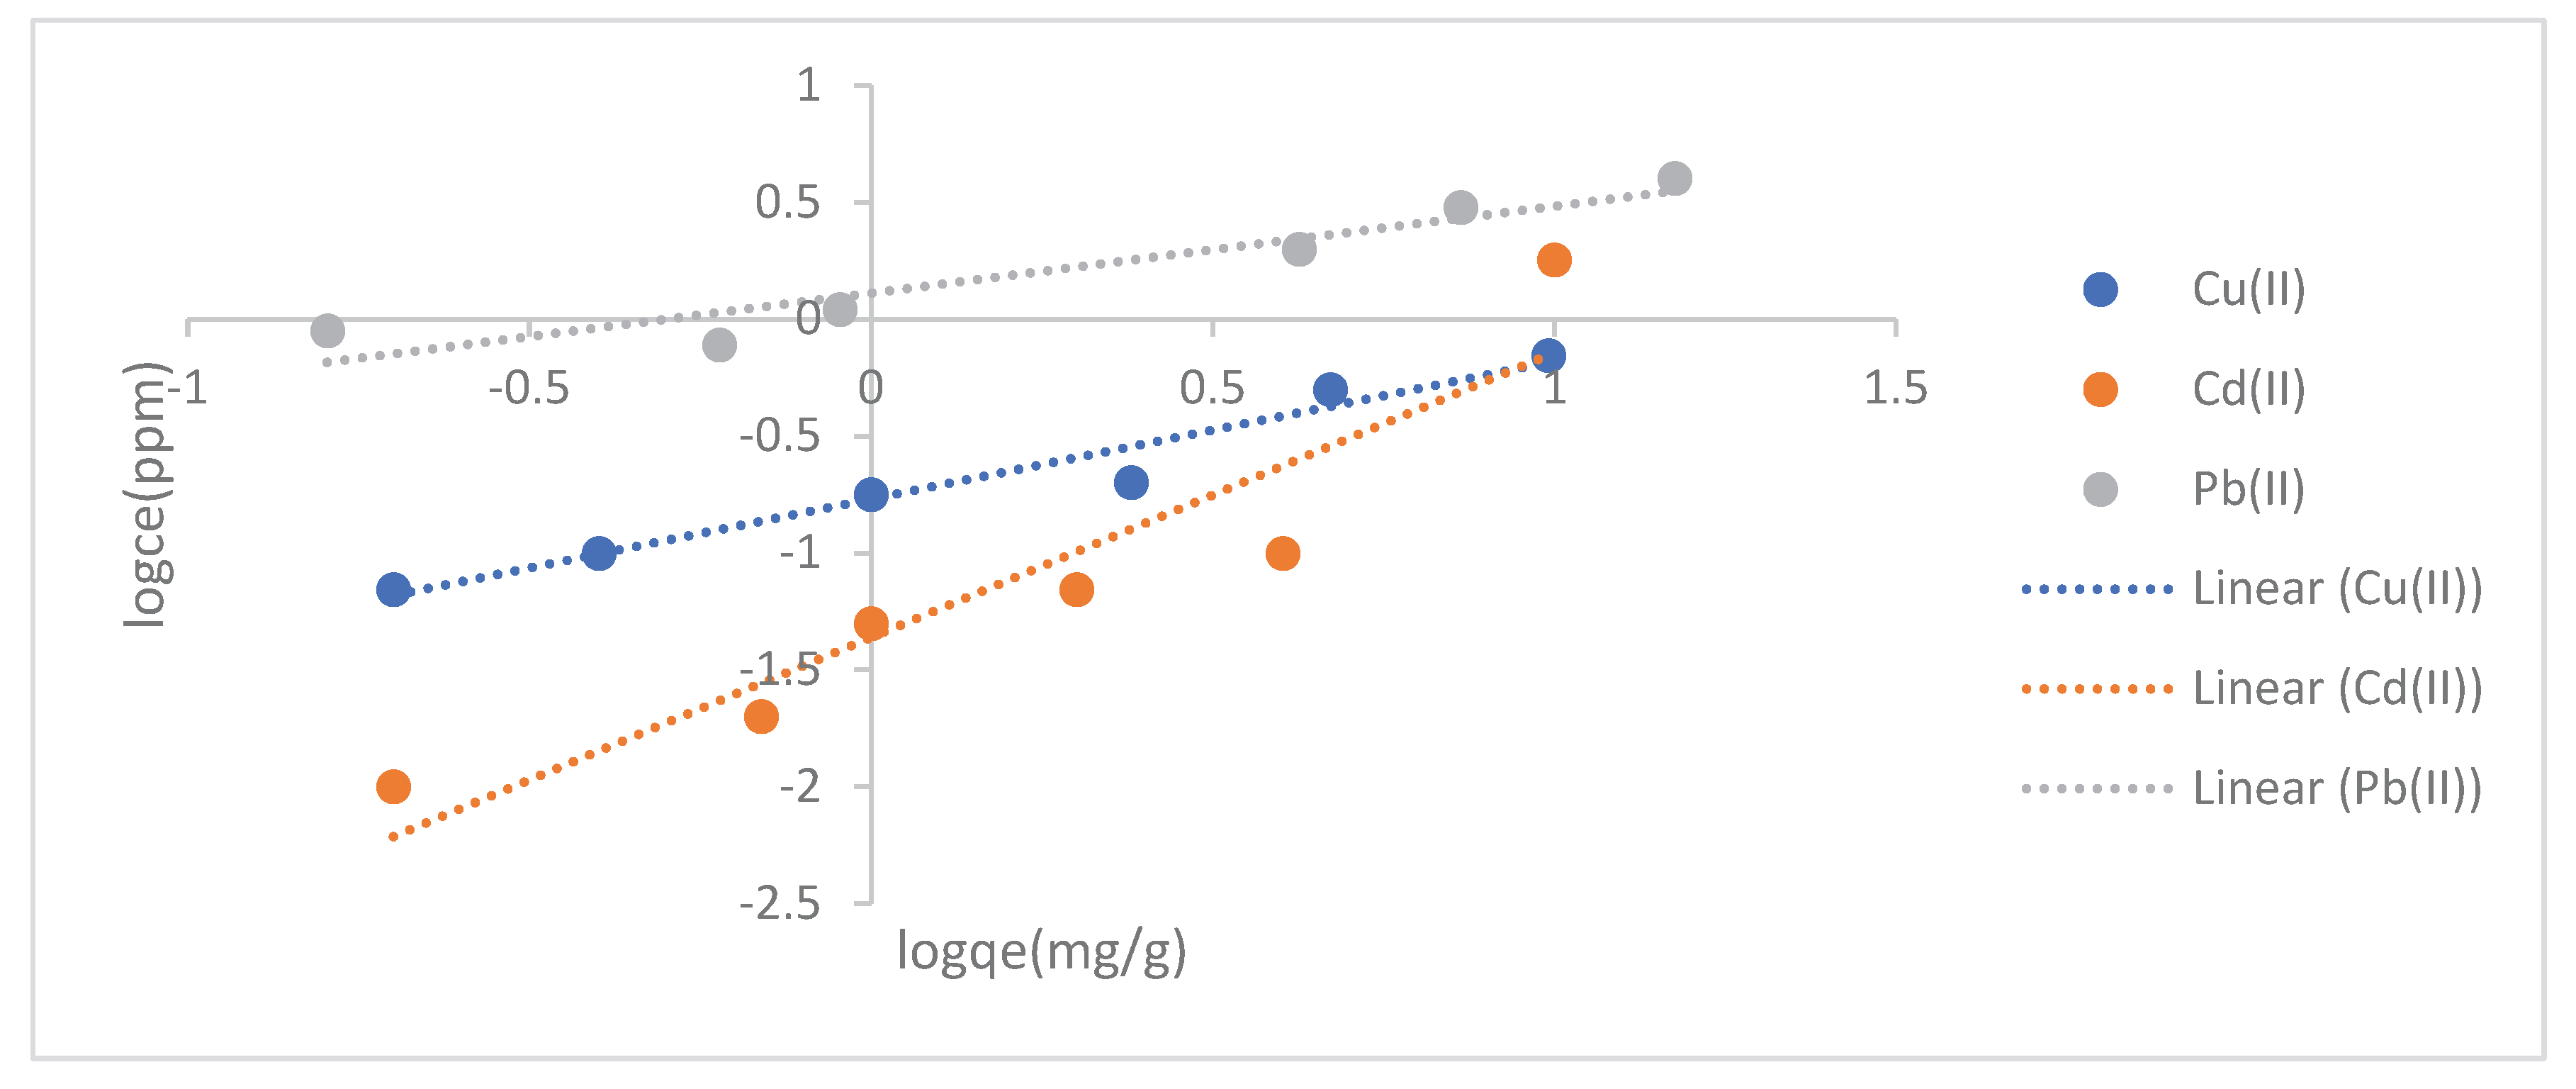
Figure 11.
Langmuir isotherm plot on adsorption of Cd(II), Pb(II) and Cu(II) by MoS2NPs.
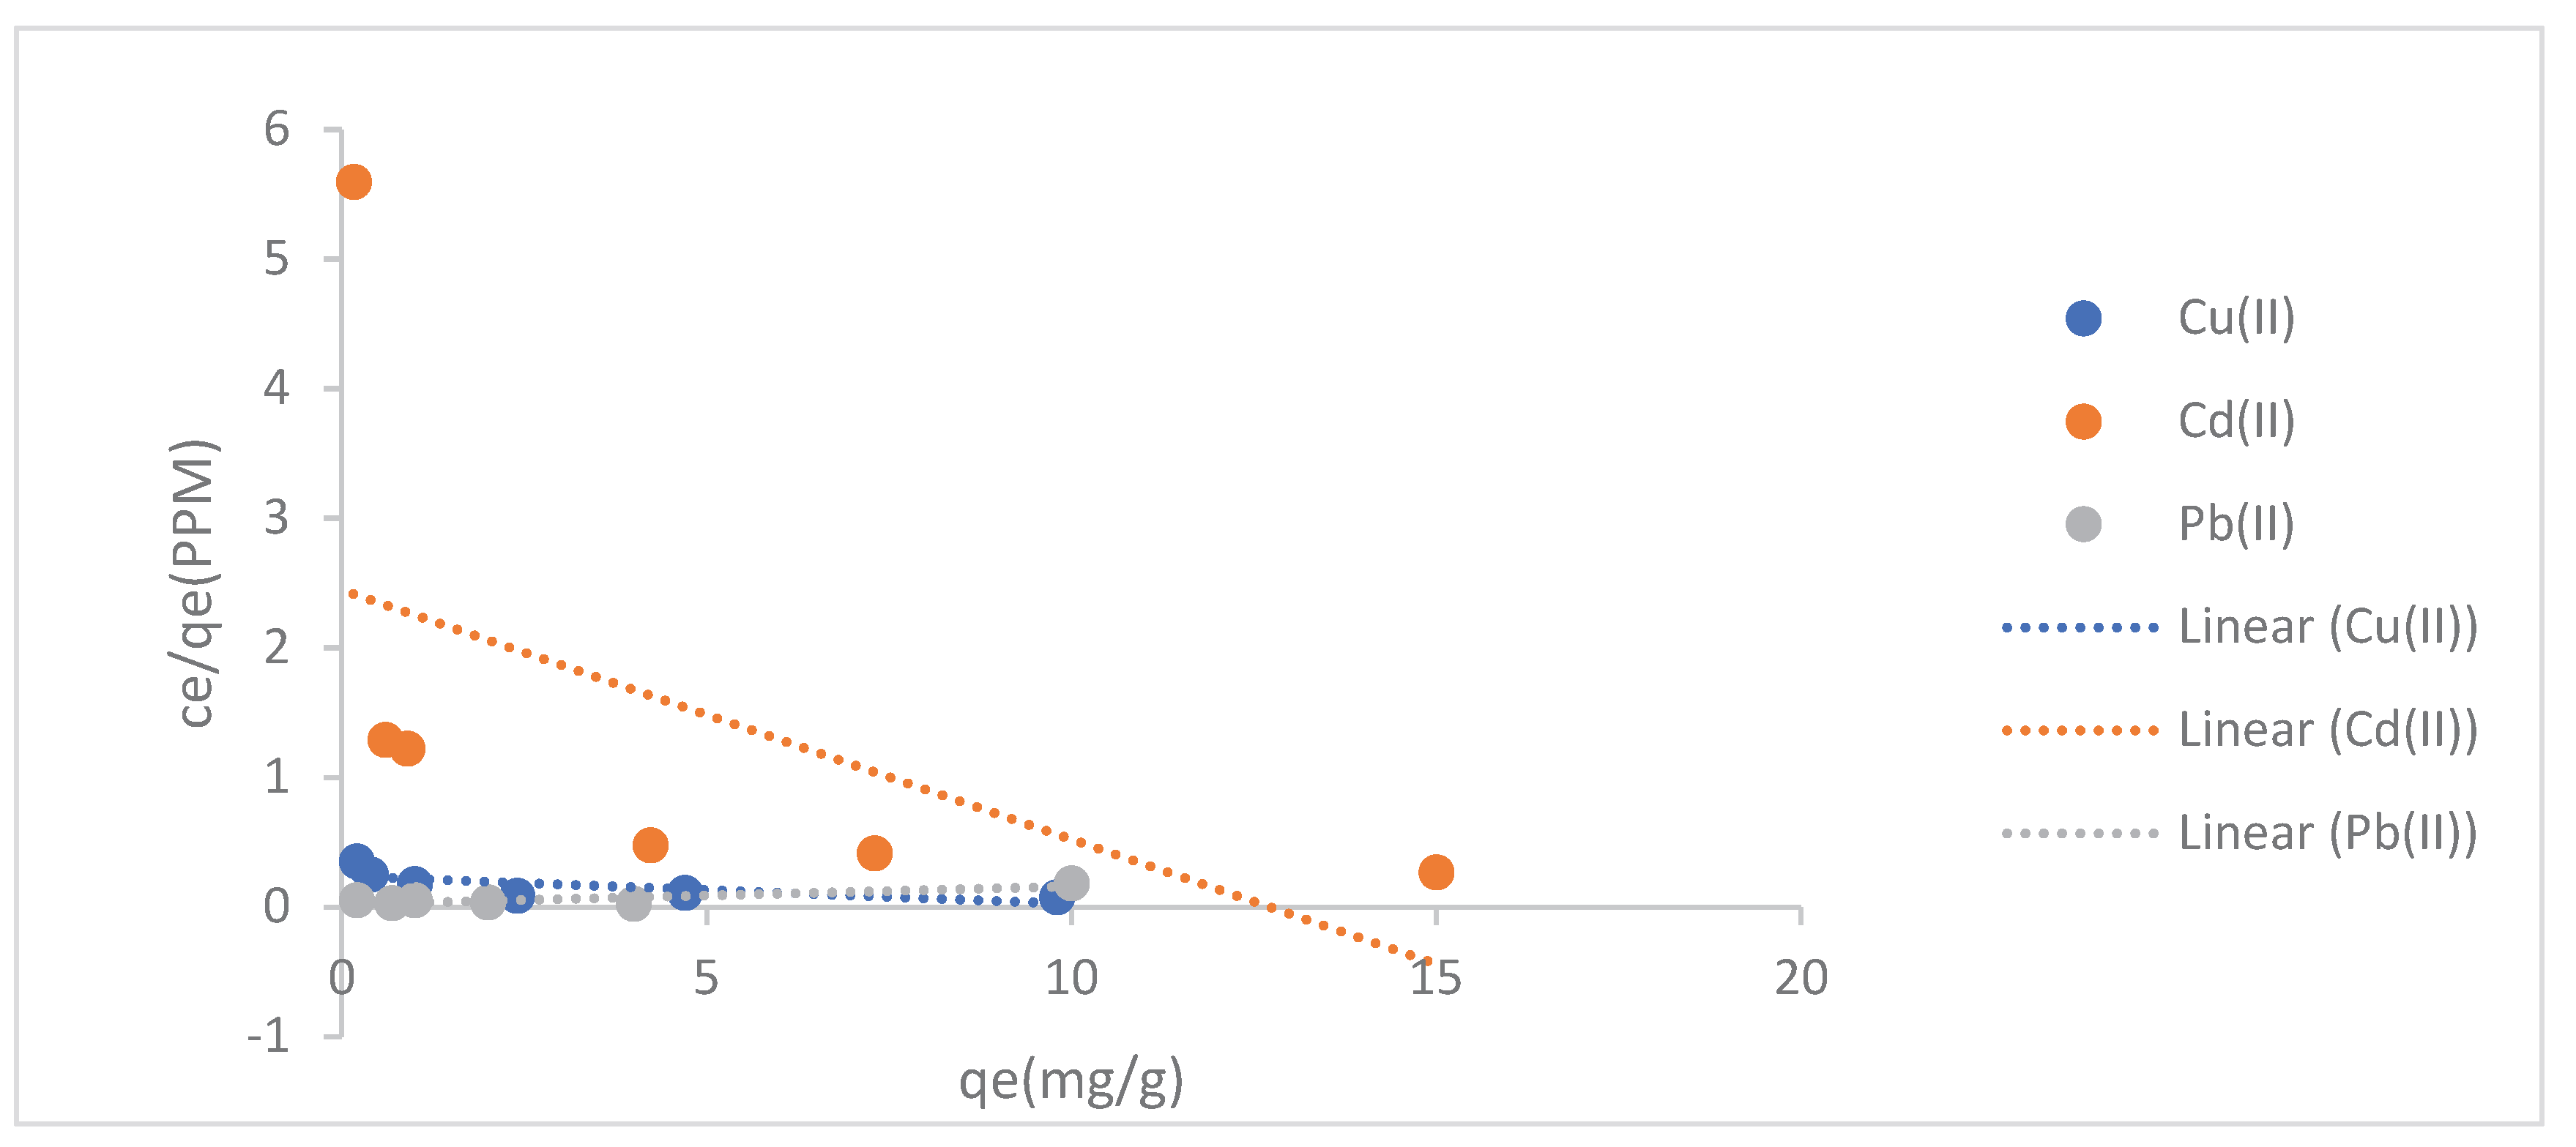
Figure 12.
D-R isotherm plot on adsorption of Cd(II), Pb(II) and Cu(II) by MoS2NPs.
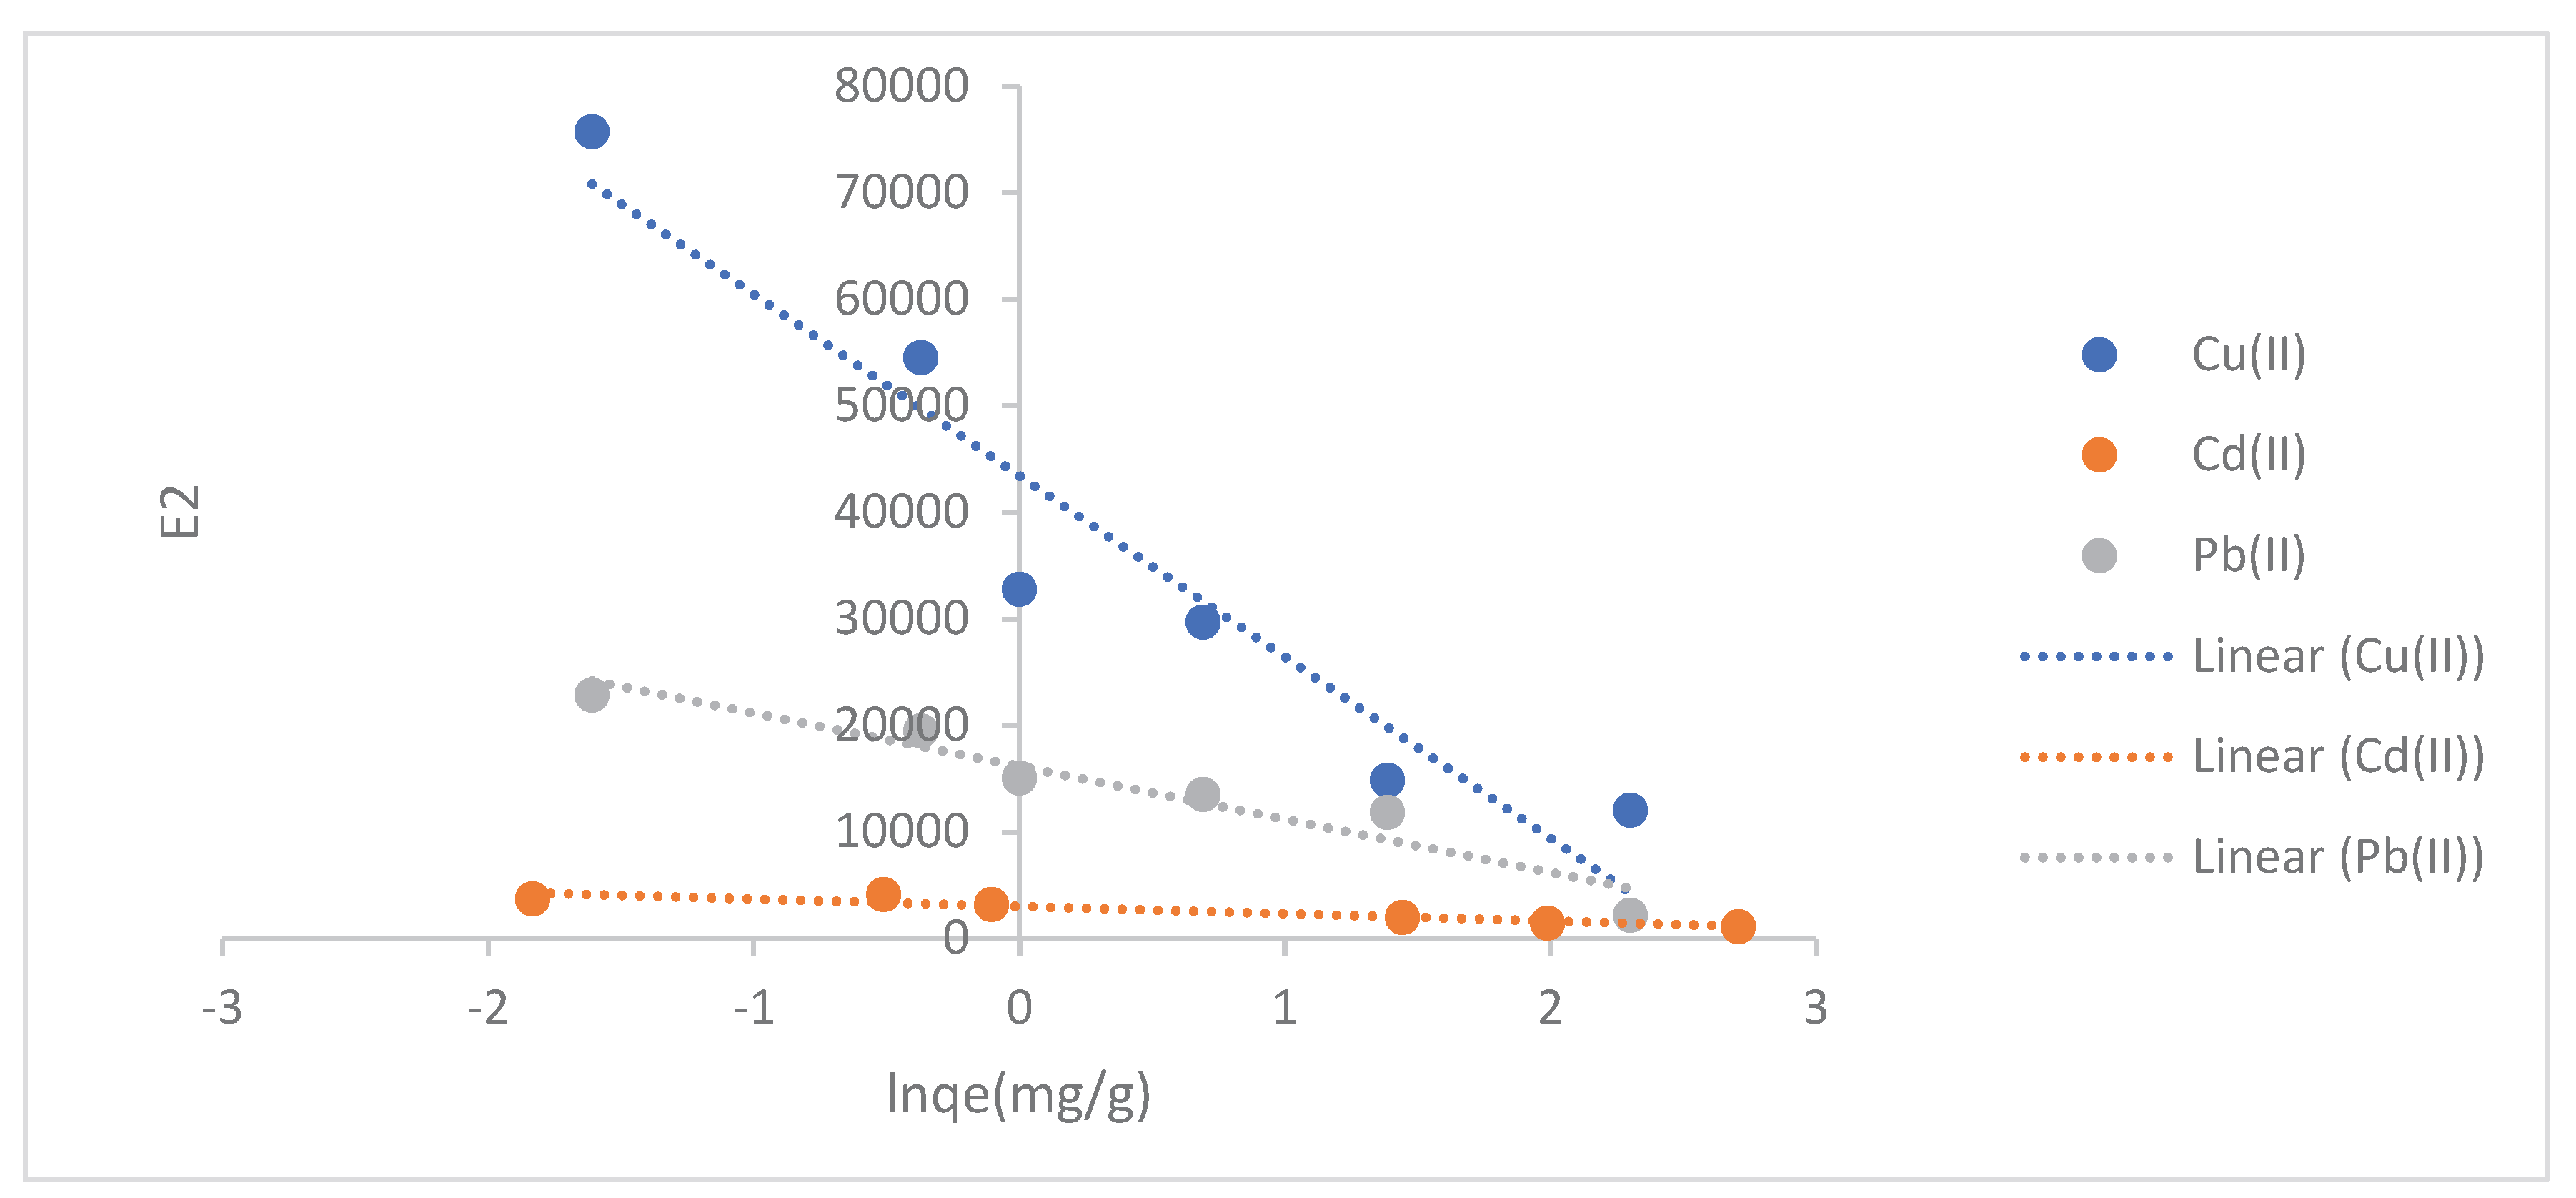
Figure 13.
Temkin isotherm plot on adsorption of Cd(II), Pb(II) and Cu(II) by MoS2NPs.
3.10. Adsorption Thermodynamics
The adsorption occurs via a non-spontaneous process for all adsorption of Cd(II) and Cu(II) by MoS2NPs as confirmed by the negative values of Gibbs free energy values and spontaneous for Pb(II). The heat of reaction were endothermic in nature for Pb(II) and exothermic for Cd (II) and Cu(II) (Figure 14 and list of adsorption thermodynamics parameters are highlighted in Table 4
4. Conclusions
Complete synthesis of the molybdenum disulphides nanoparticles and structure establishments shown the possible formation of molybdenum disulphides nanoparticles, the stabilization of the molybdenum disulfides nanoparticles are done by cysteine in order to prevent agglomeration at the surface. The adsorption of Cd(II), Cu(II) , Pb(II) by MoS2NPs show the optimal initial concentration for all the three ions to be 20ppm with difference in qe values ,the adsorption equilibrium time forMoS2NPs attain equilibrium at 40 minutes and remains constant after 40 minutes and constant till 1440 minutes. The effect of pH for the adsorption of Cd(II), Cu(II) and Pb(II) by MoS2NPs increases with pH, the effect of temperature also increases for all the adsorption experiments. Adsorption kinetic fits best to Pseudo second-order kinetics and the adsorption isotherm fits best with Henry Adsorption isotherm. The values of adsorption thermodynamic parameters for the adsorption of Cu(II) and Cd(II) by MoS2NPs ishows a spontaneous adsorption process with an increase in randomness and a spontaneous reaction process ,exception with the Pb (II) ions adsorption by MoS2NPs which is characterised by a non-spontaneous adsorption process with a positive value for an enthalpy of the system and also negative value for the entropy of the reaction
References
- USGS. Cadmium. 2018. Available online: https://minerals.usgs.gov/minerals/pubs/commodity/cadmium/mcs-2018-cadmi.pdf.
- Li, C.; Li, Y.; Ding, C. The Role of Copper Homeostasis at the Host-Pathogen Axis: From Bacteria to Fungi. Int. J. Mol. Sci. 2019, 20, 175. [Google Scholar] [CrossRef] [PubMed]
- Cobine, P.A.; Brady, D.C. Cuproptosis: Cellular and molecular mechanisms underlying copper-induced cell death. Mol. Cell. 2022, 82, 1786–1787. [Google Scholar] [CrossRef] [PubMed]
- Chen, J.; Li, S. L.; Xu, Q.; Tanaka, K. Synthesis of open-ended MoS 2 nanotubes and the application as the catalyst of methanation``. Chemical Commun. s 2002, (16), 1722–1723. [Google Scholar] [CrossRef]
- Tumain, N.D. Adsorption of Copper from Aqueous Solution by Elaeis guineensis Kernel Activated Carbon. J. Eng. Sci. Technol. 2008, 3, 180–189. [Google Scholar]
- Batool, F.; Akbar, J.; Iqbal, S.; Noreen, S.; Bukhari, S. N. A. Study of Isothermal, Kinetic, and Thermodynamic Parameters for Adsorption of Cadmium: An Overview of Linear and Nonlinear Approach and Error Analysis. Bioinorg. Chem. Appl. 2018, 3463724. [Google Scholar] [PubMed]
Figure 1.
Fourier transform IR spectra of molybdenum disulphides nanoparticles.
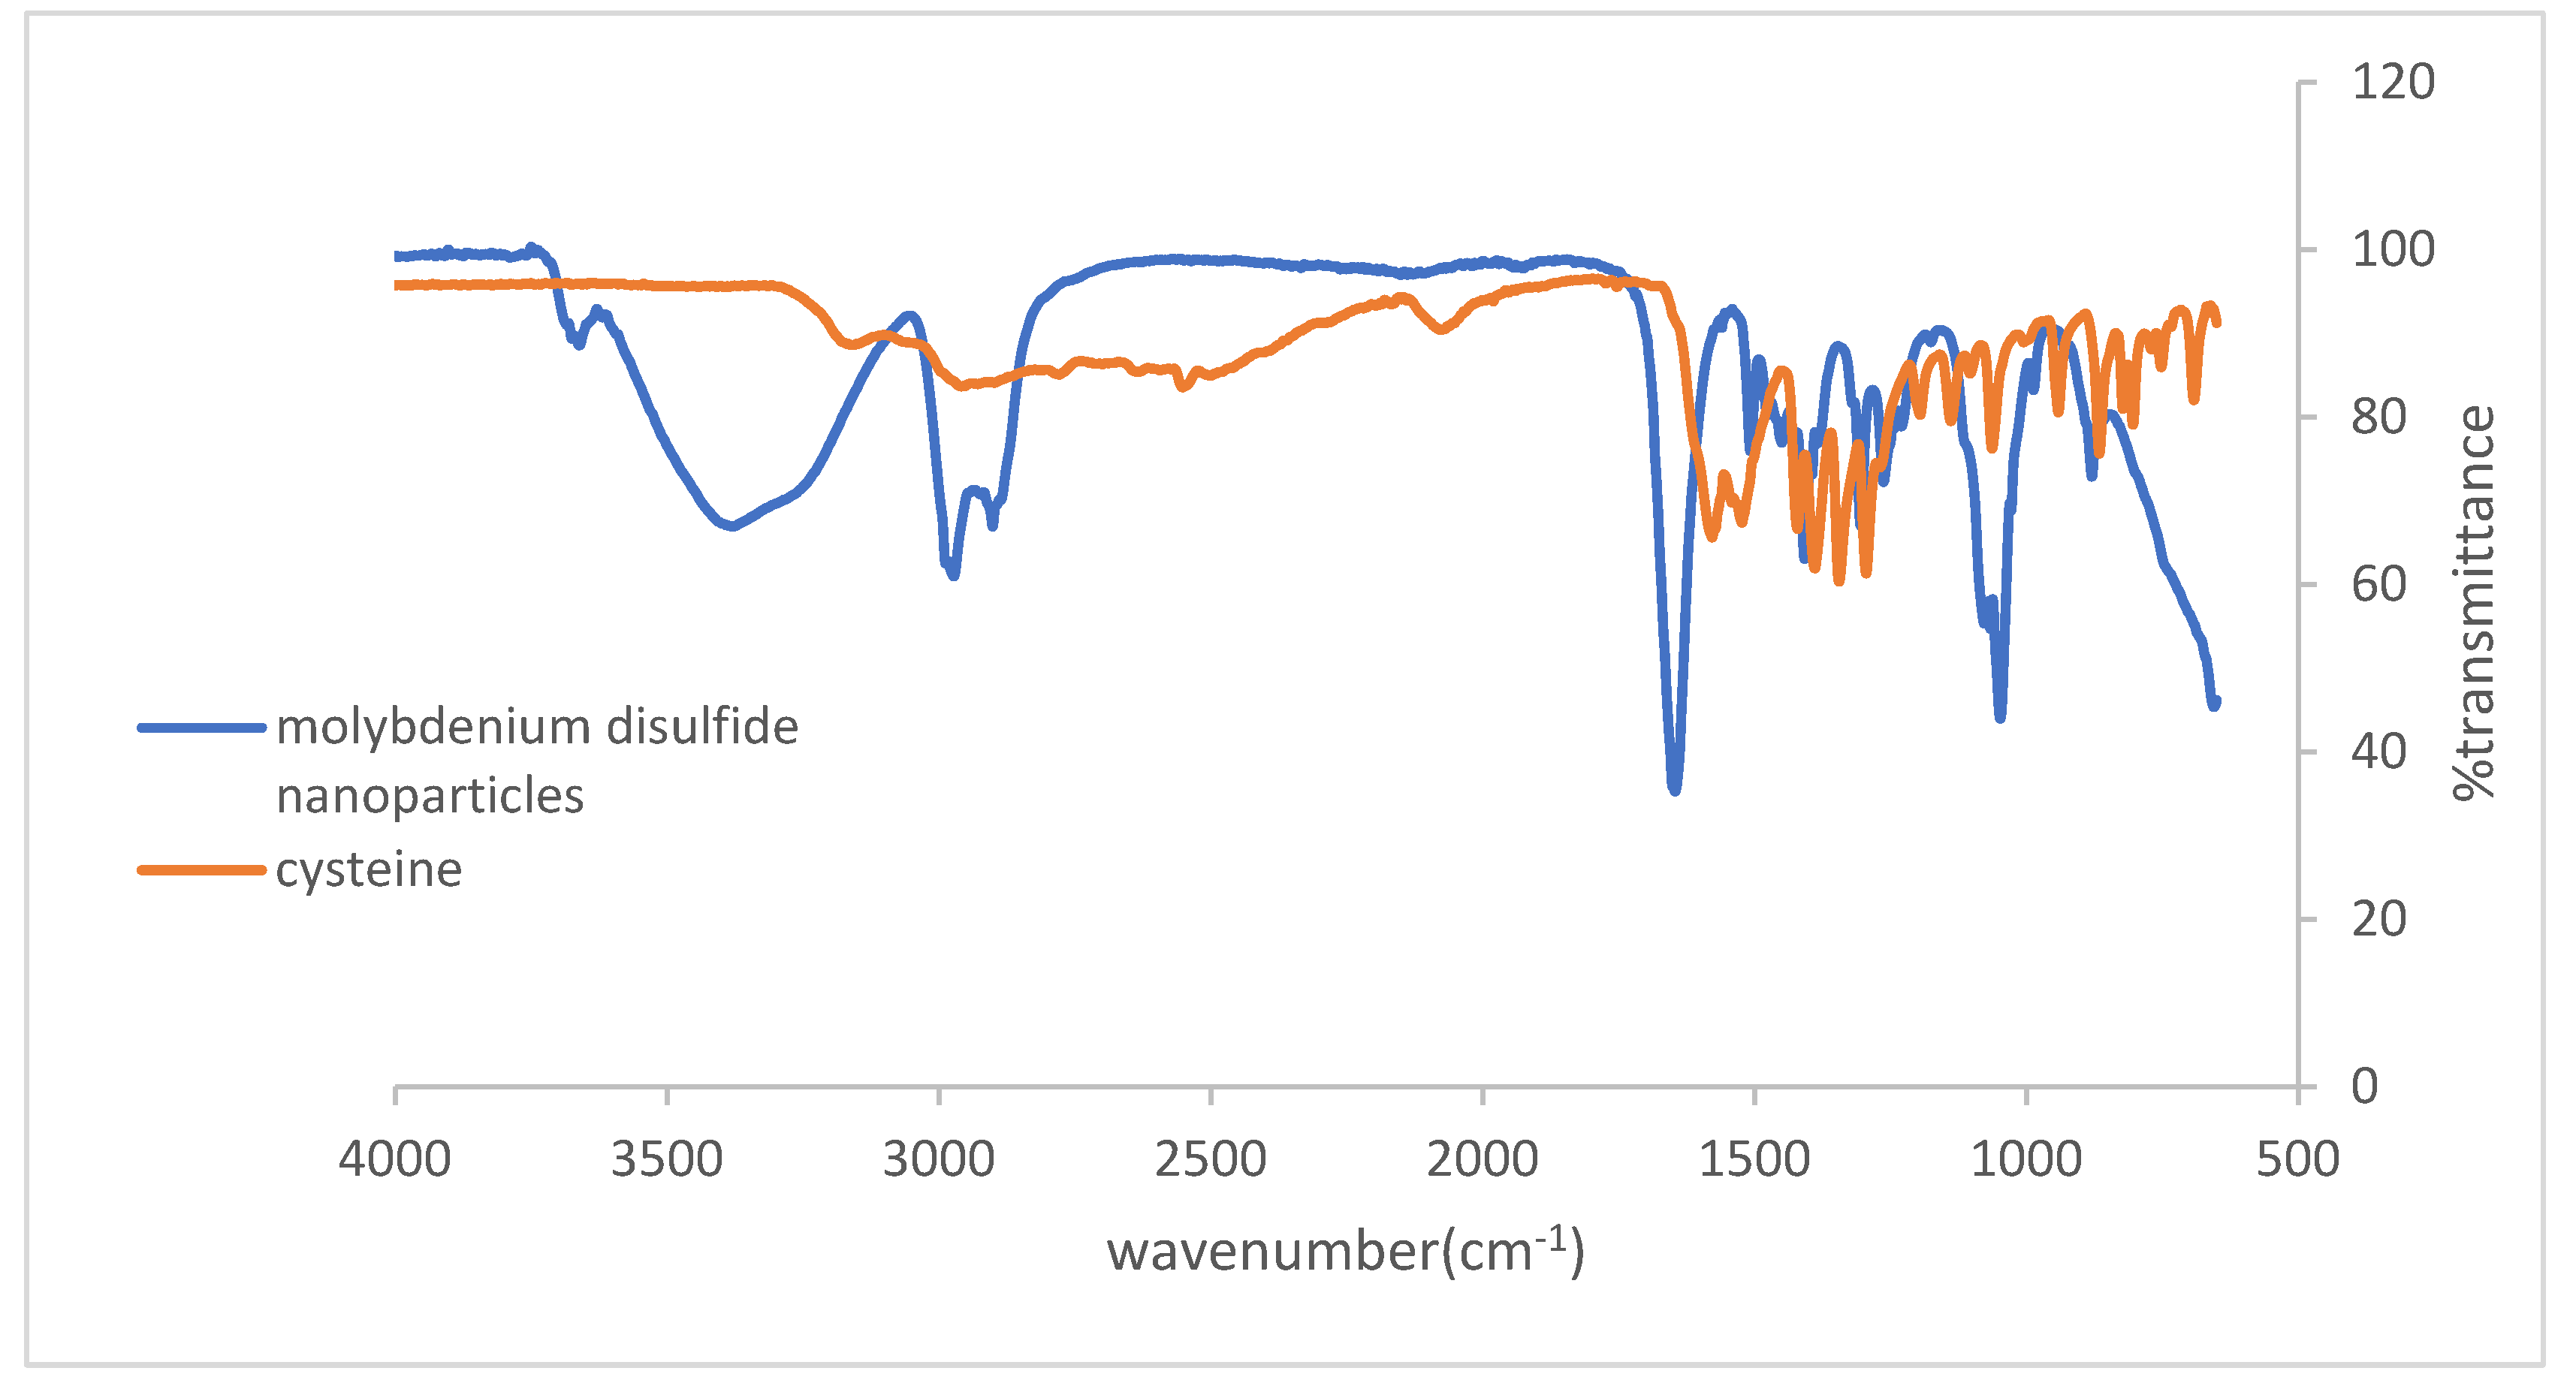
Figure 2.
a)Scanning electron microscope of molybdenum disulphides nanoparticles (left) b) Transmission electron microscope of molybdenum disulphides nanoparticles.
Figure 2.
a)Scanning electron microscope of molybdenum disulphides nanoparticles (left) b) Transmission electron microscope of molybdenum disulphides nanoparticles.
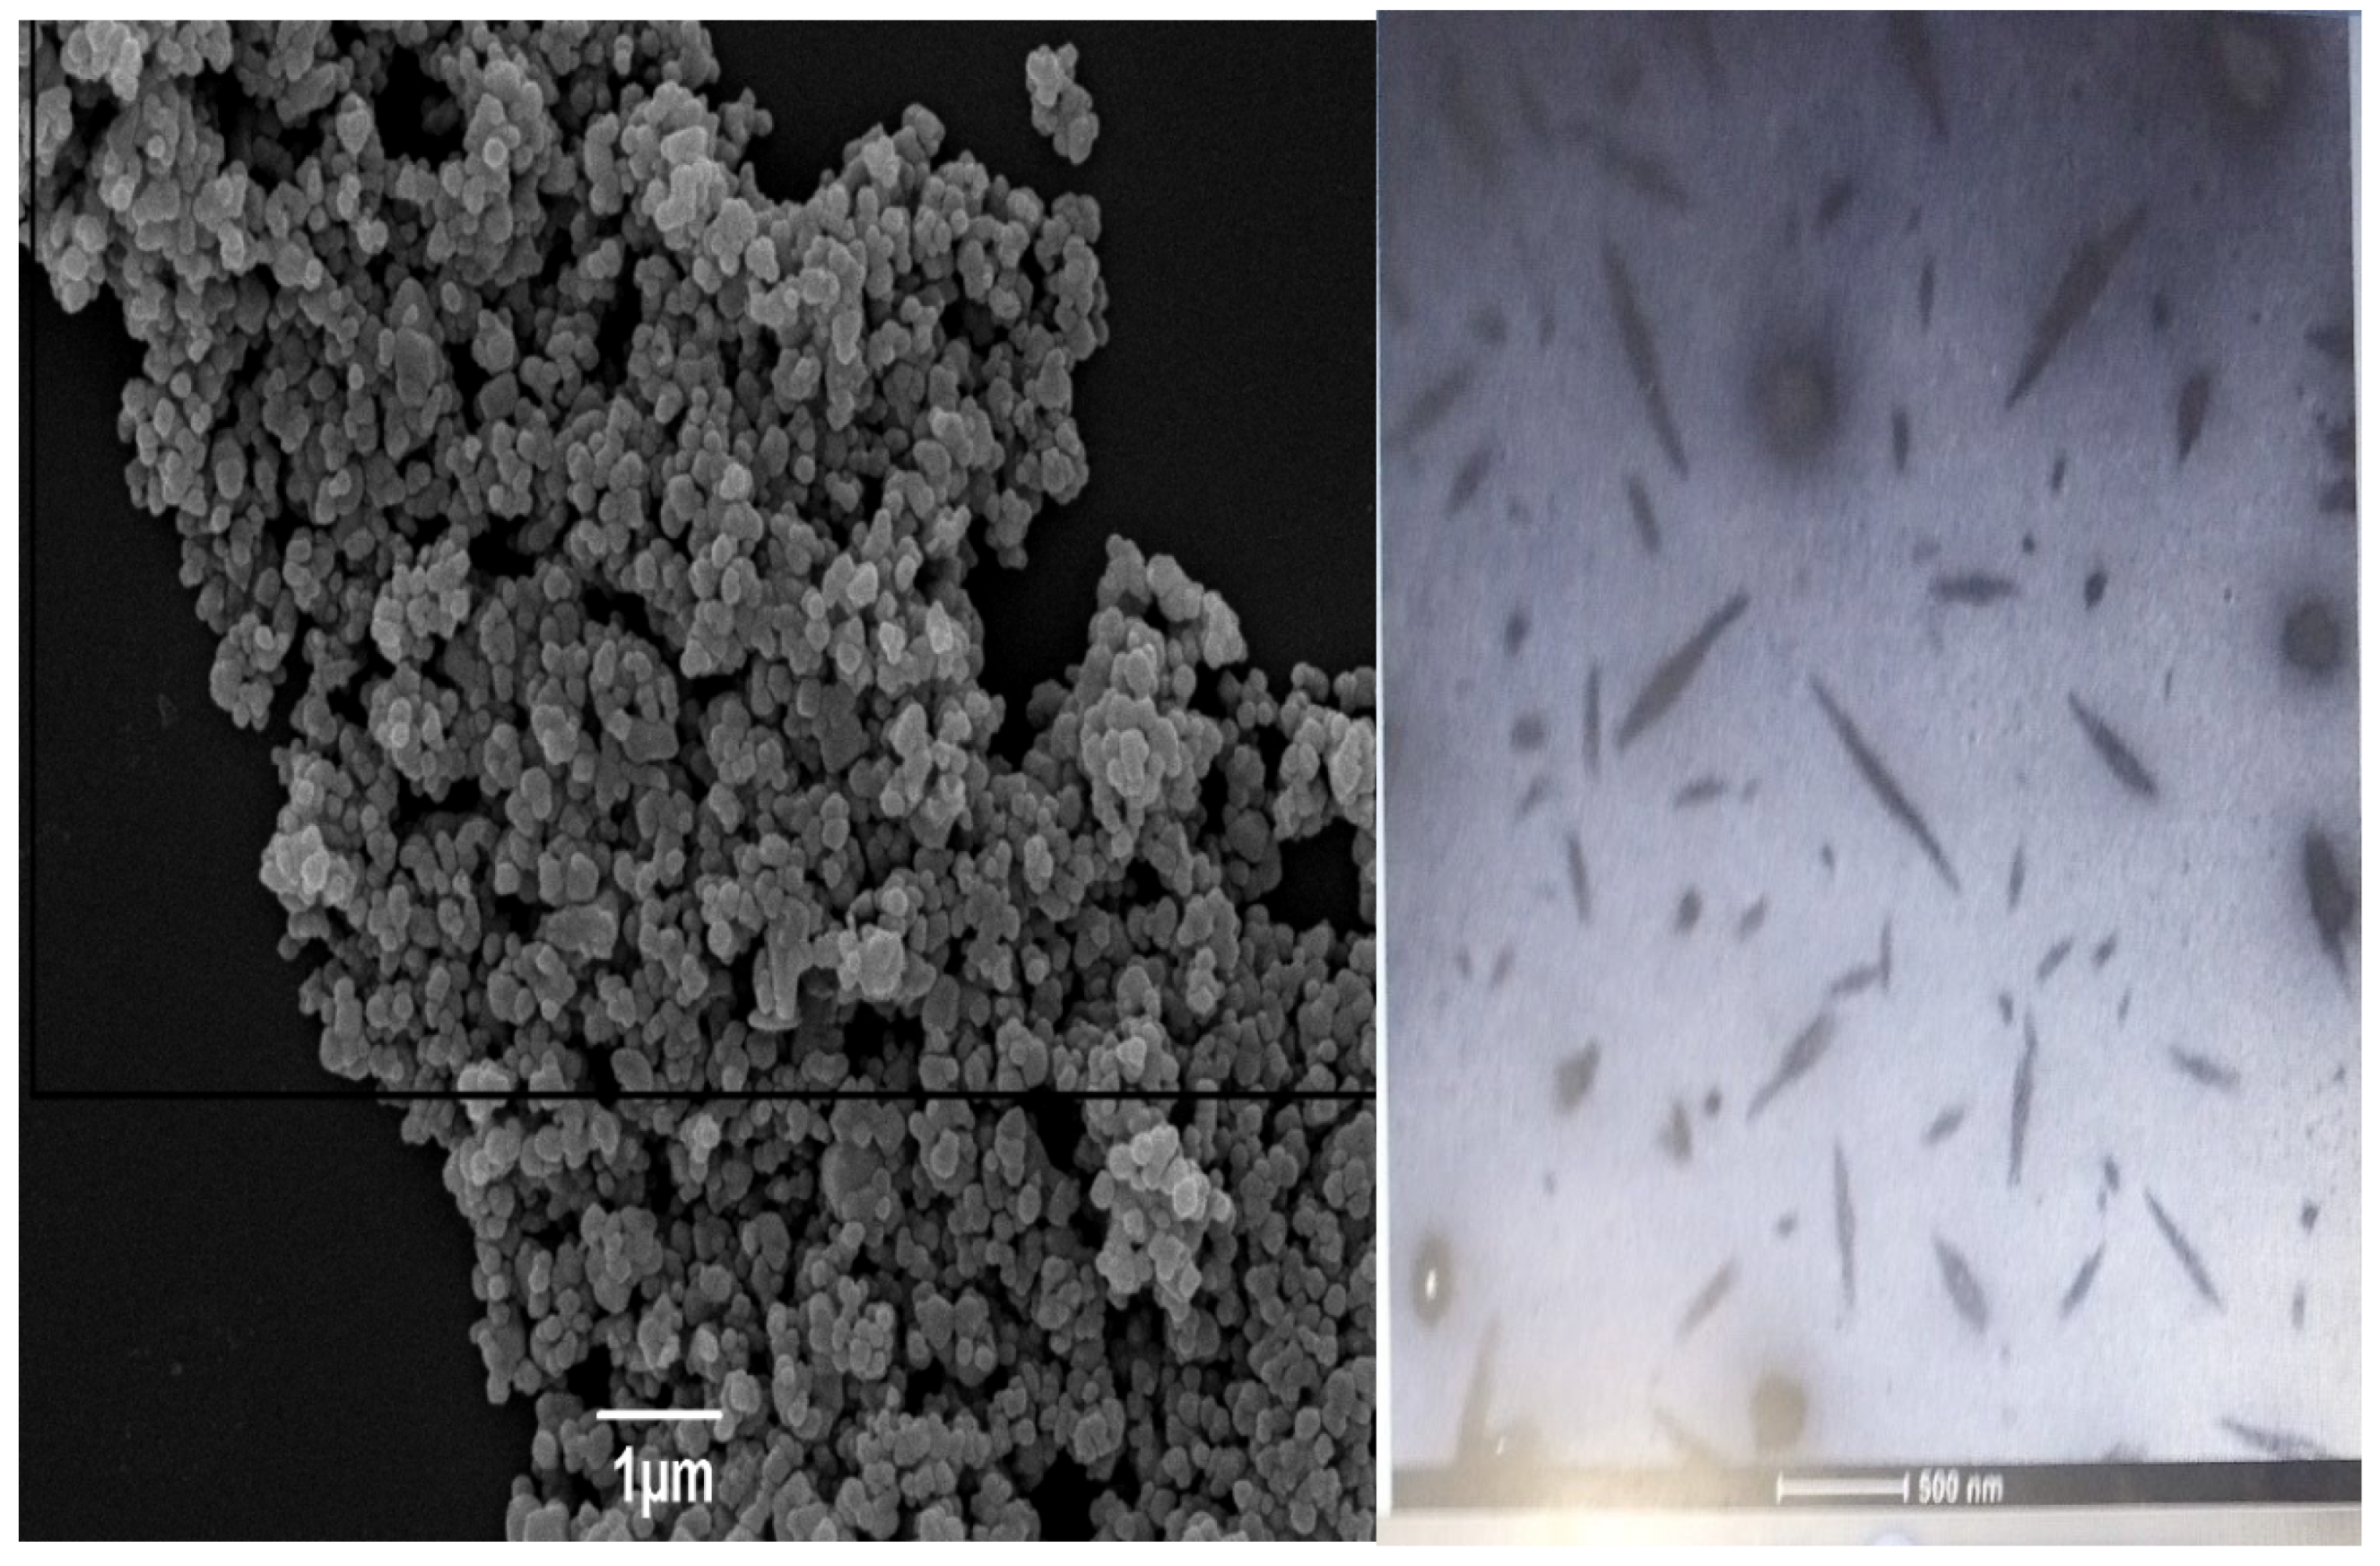
Figure 3.
Effect of initial concentration on adsorption of Cd(II),Pb(II) and Cu(II) by MoS2NPs.
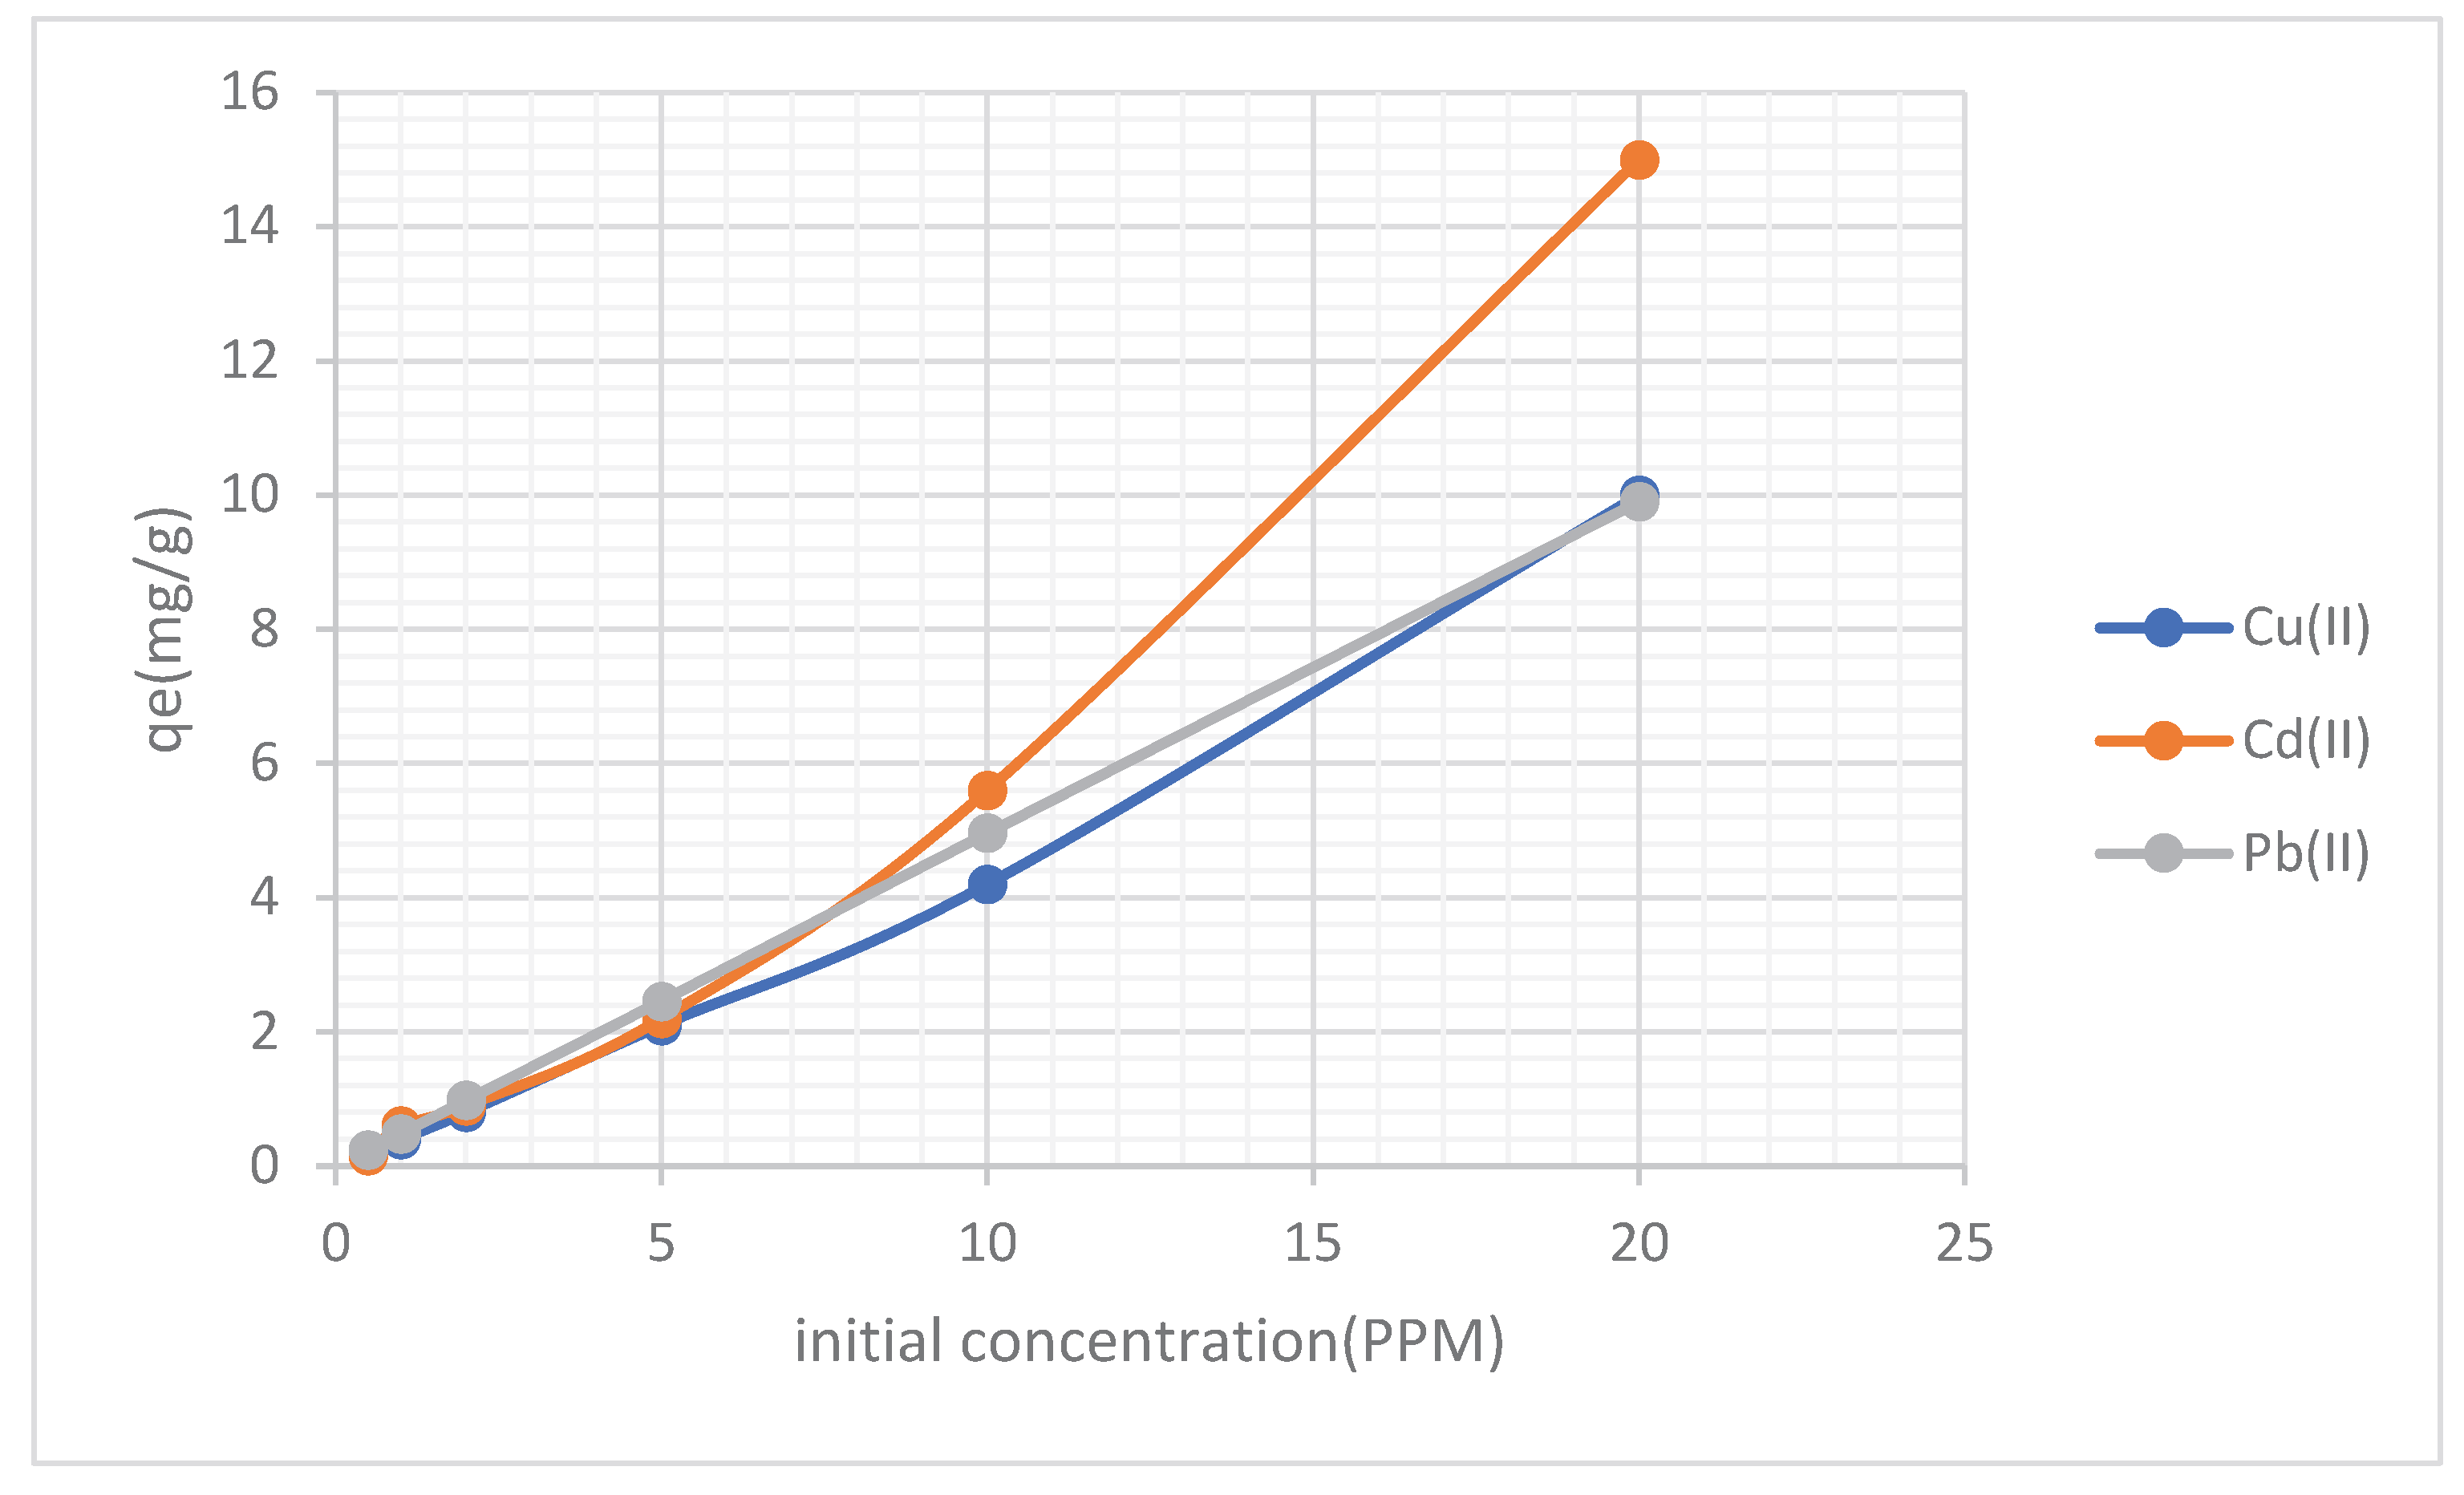
Figure 4.
Effect of initial concentration on adsorption of Cd(II), Pb(II) and Cu(II) by MoS2NPs.
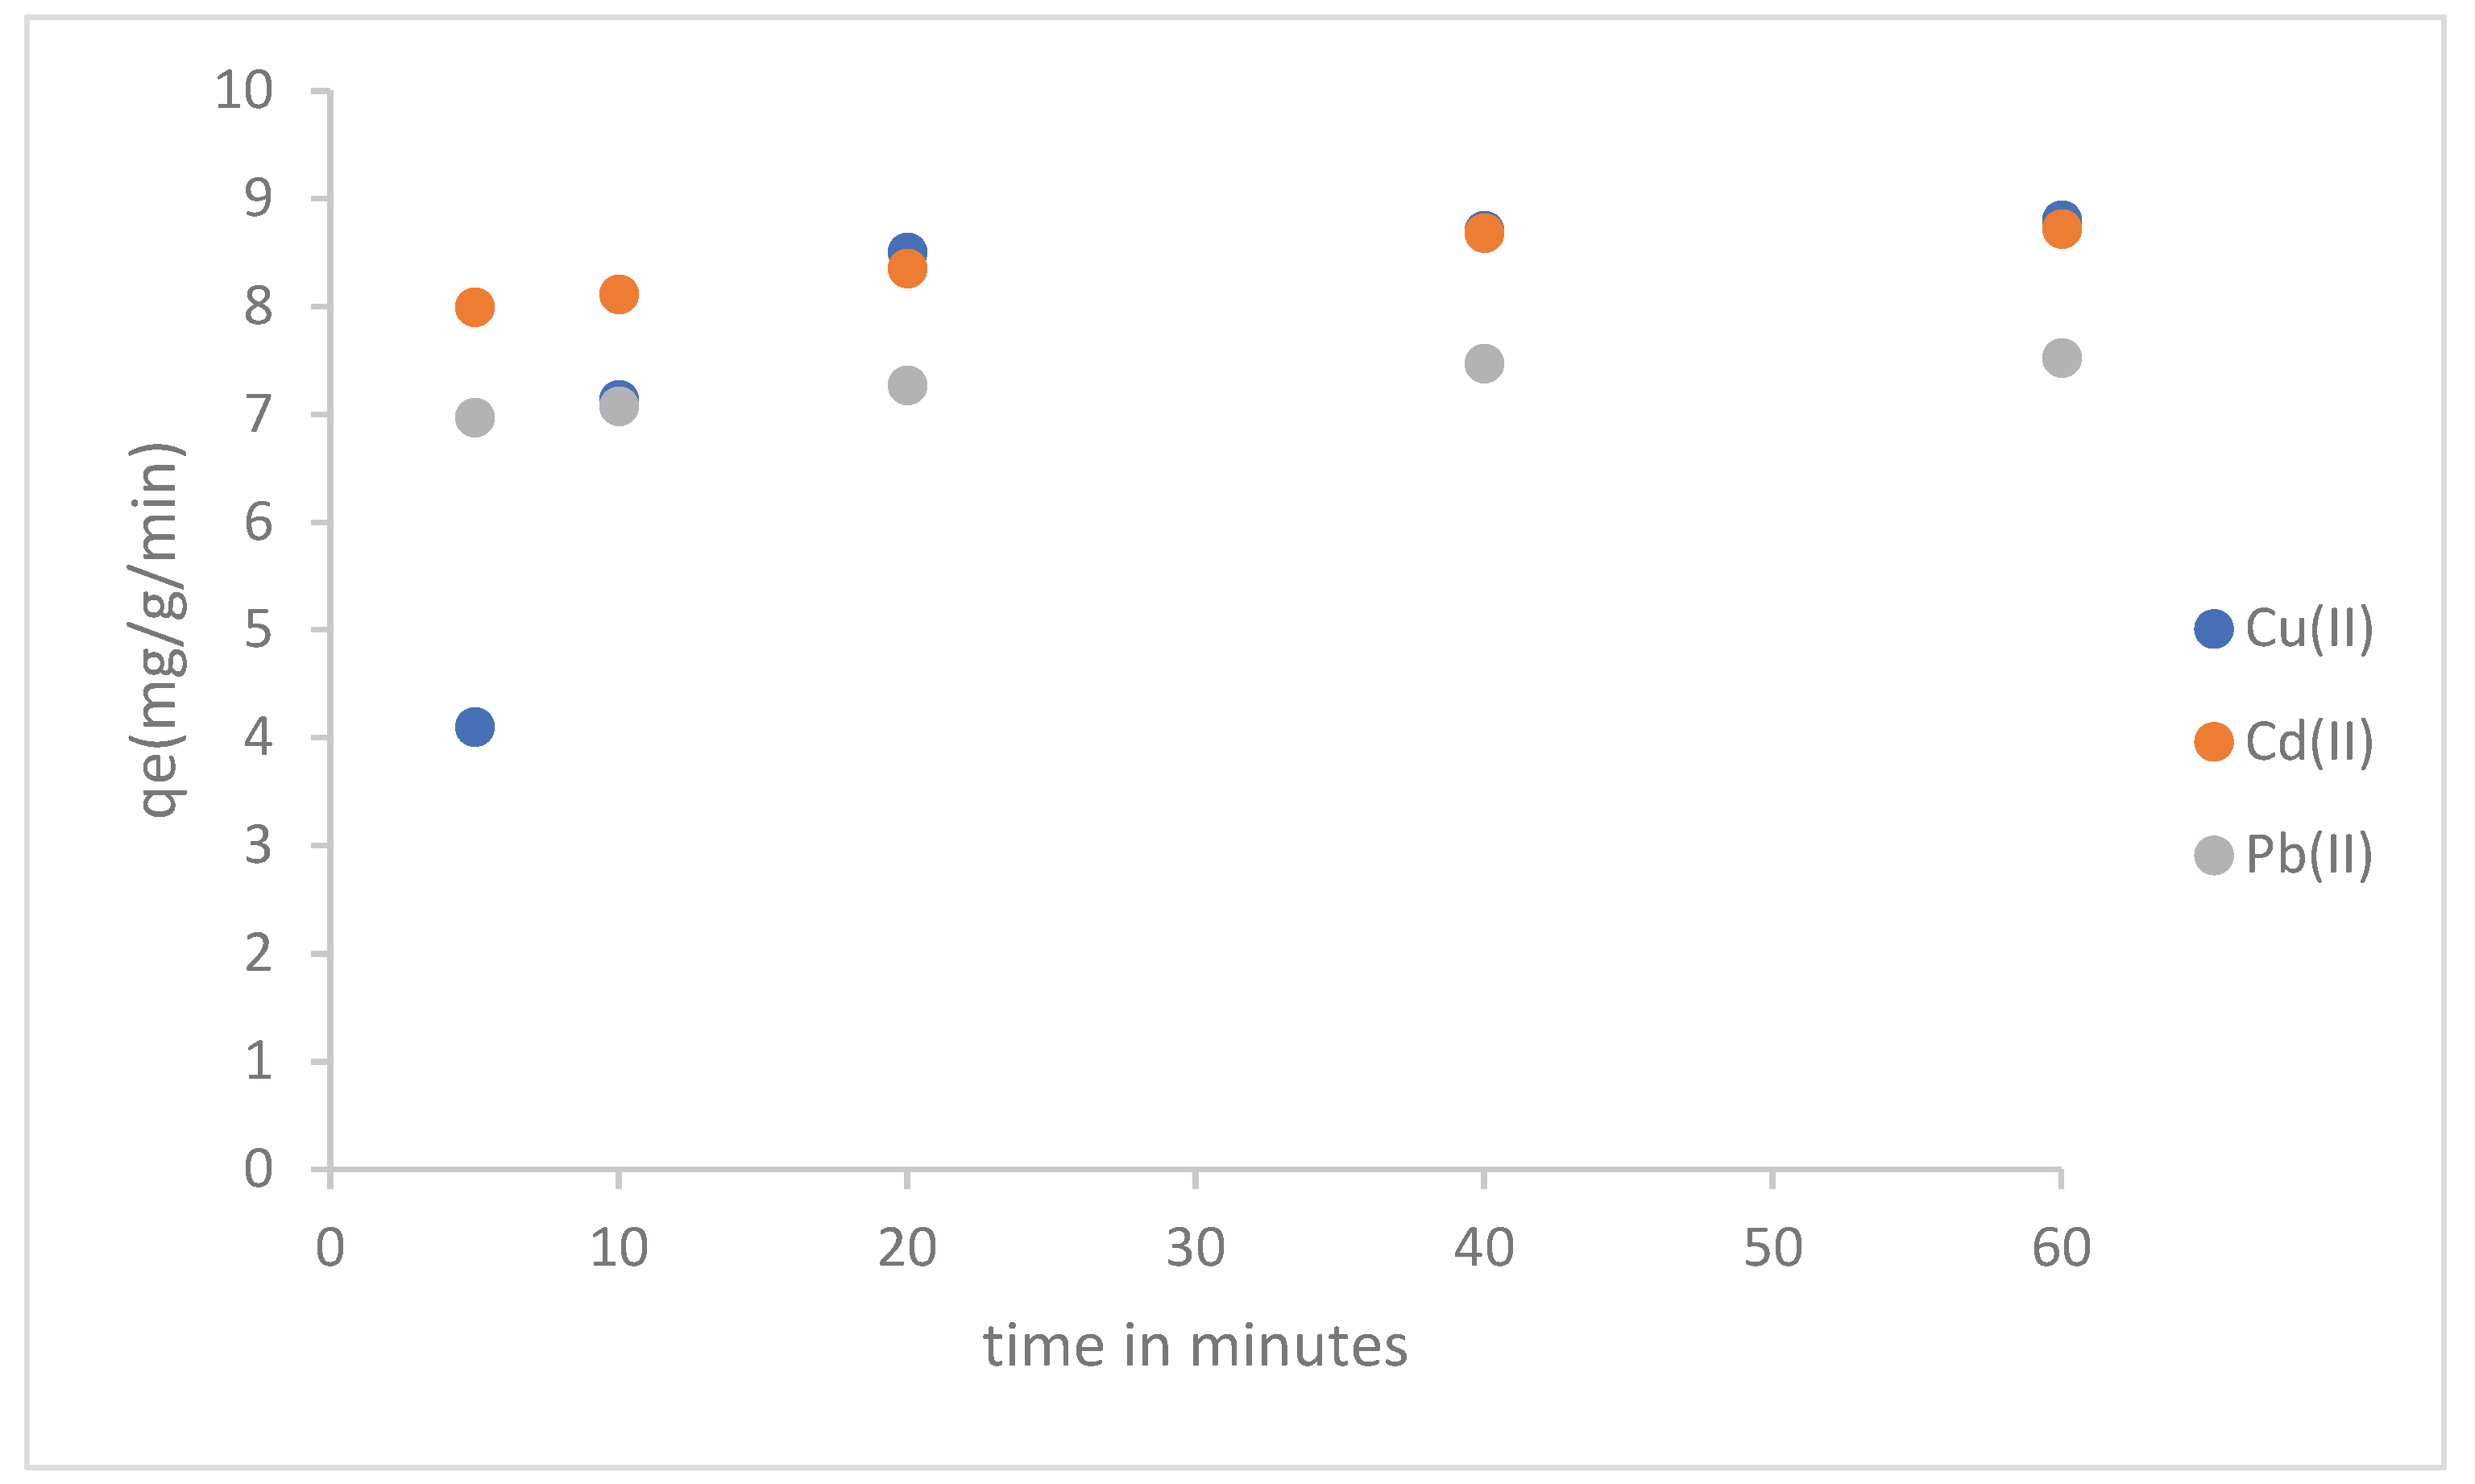
Figure 5.
Effect of dose on adsorption of Cd (II), Pb (II) and Cu (II) by MoS2NPs.
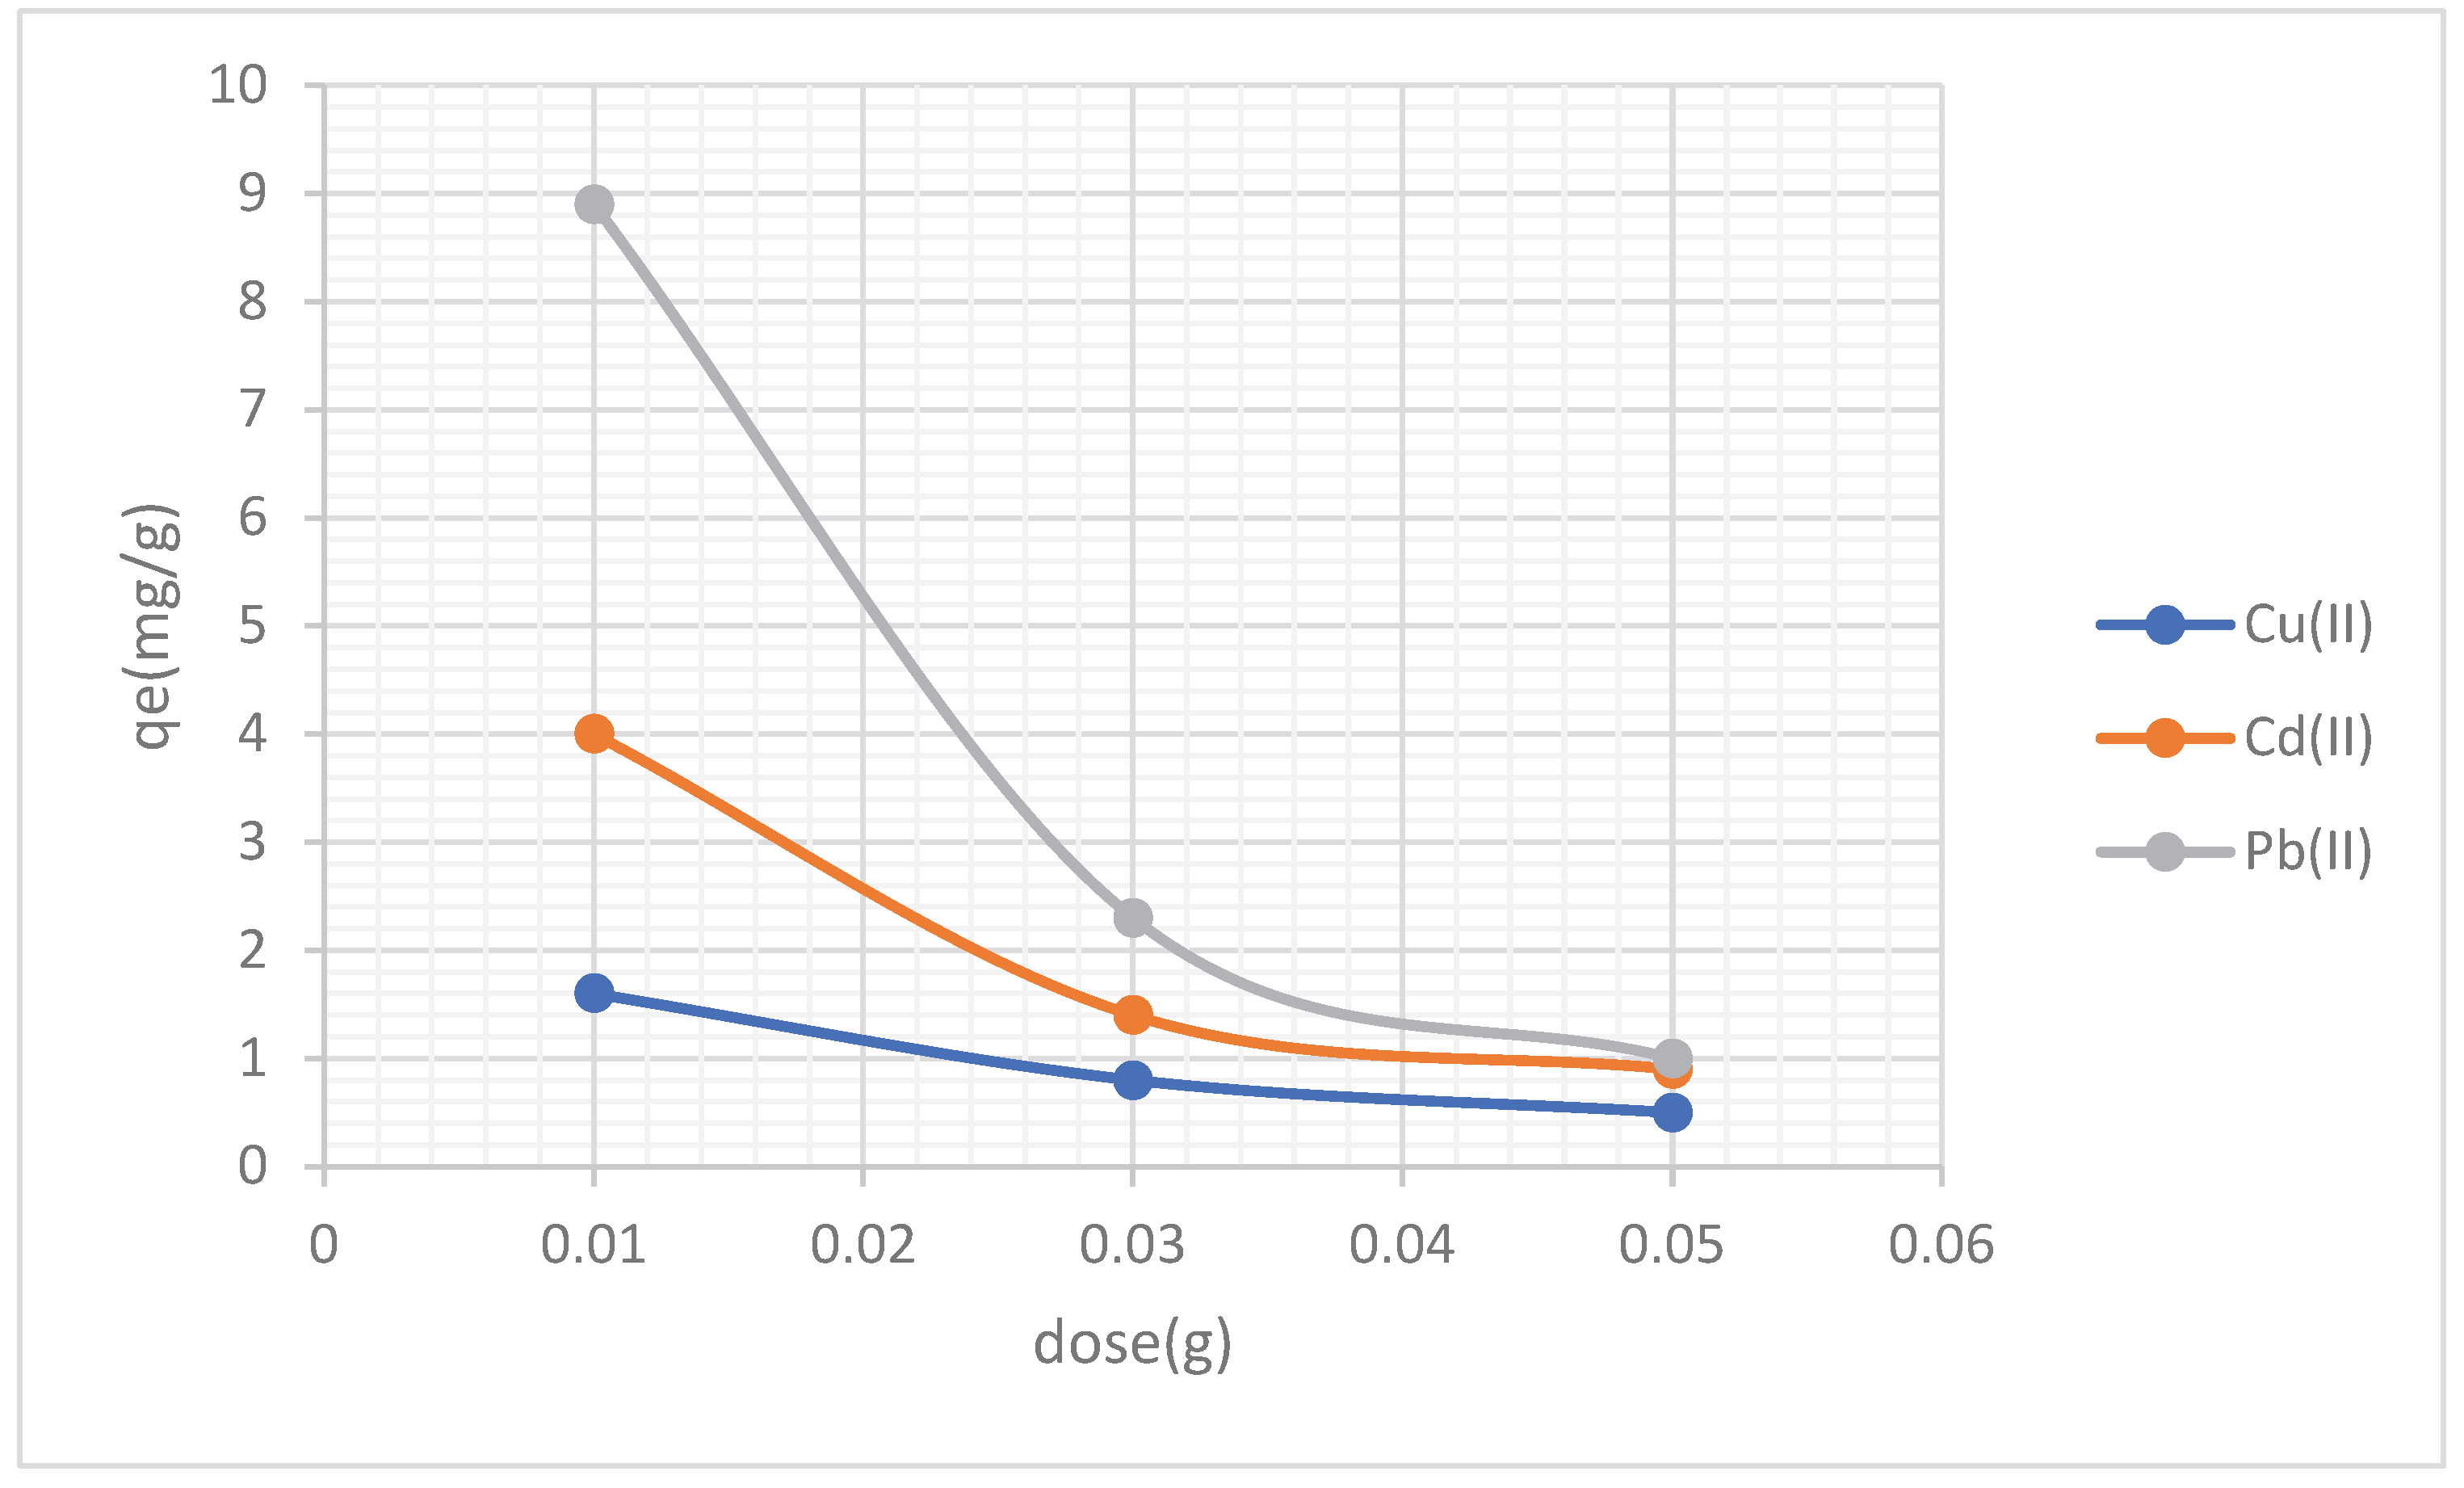
Figure 6.
Effect of pH on adsorption of Cd (II),Pb (II) and Cu (II) by MoS2NPs.
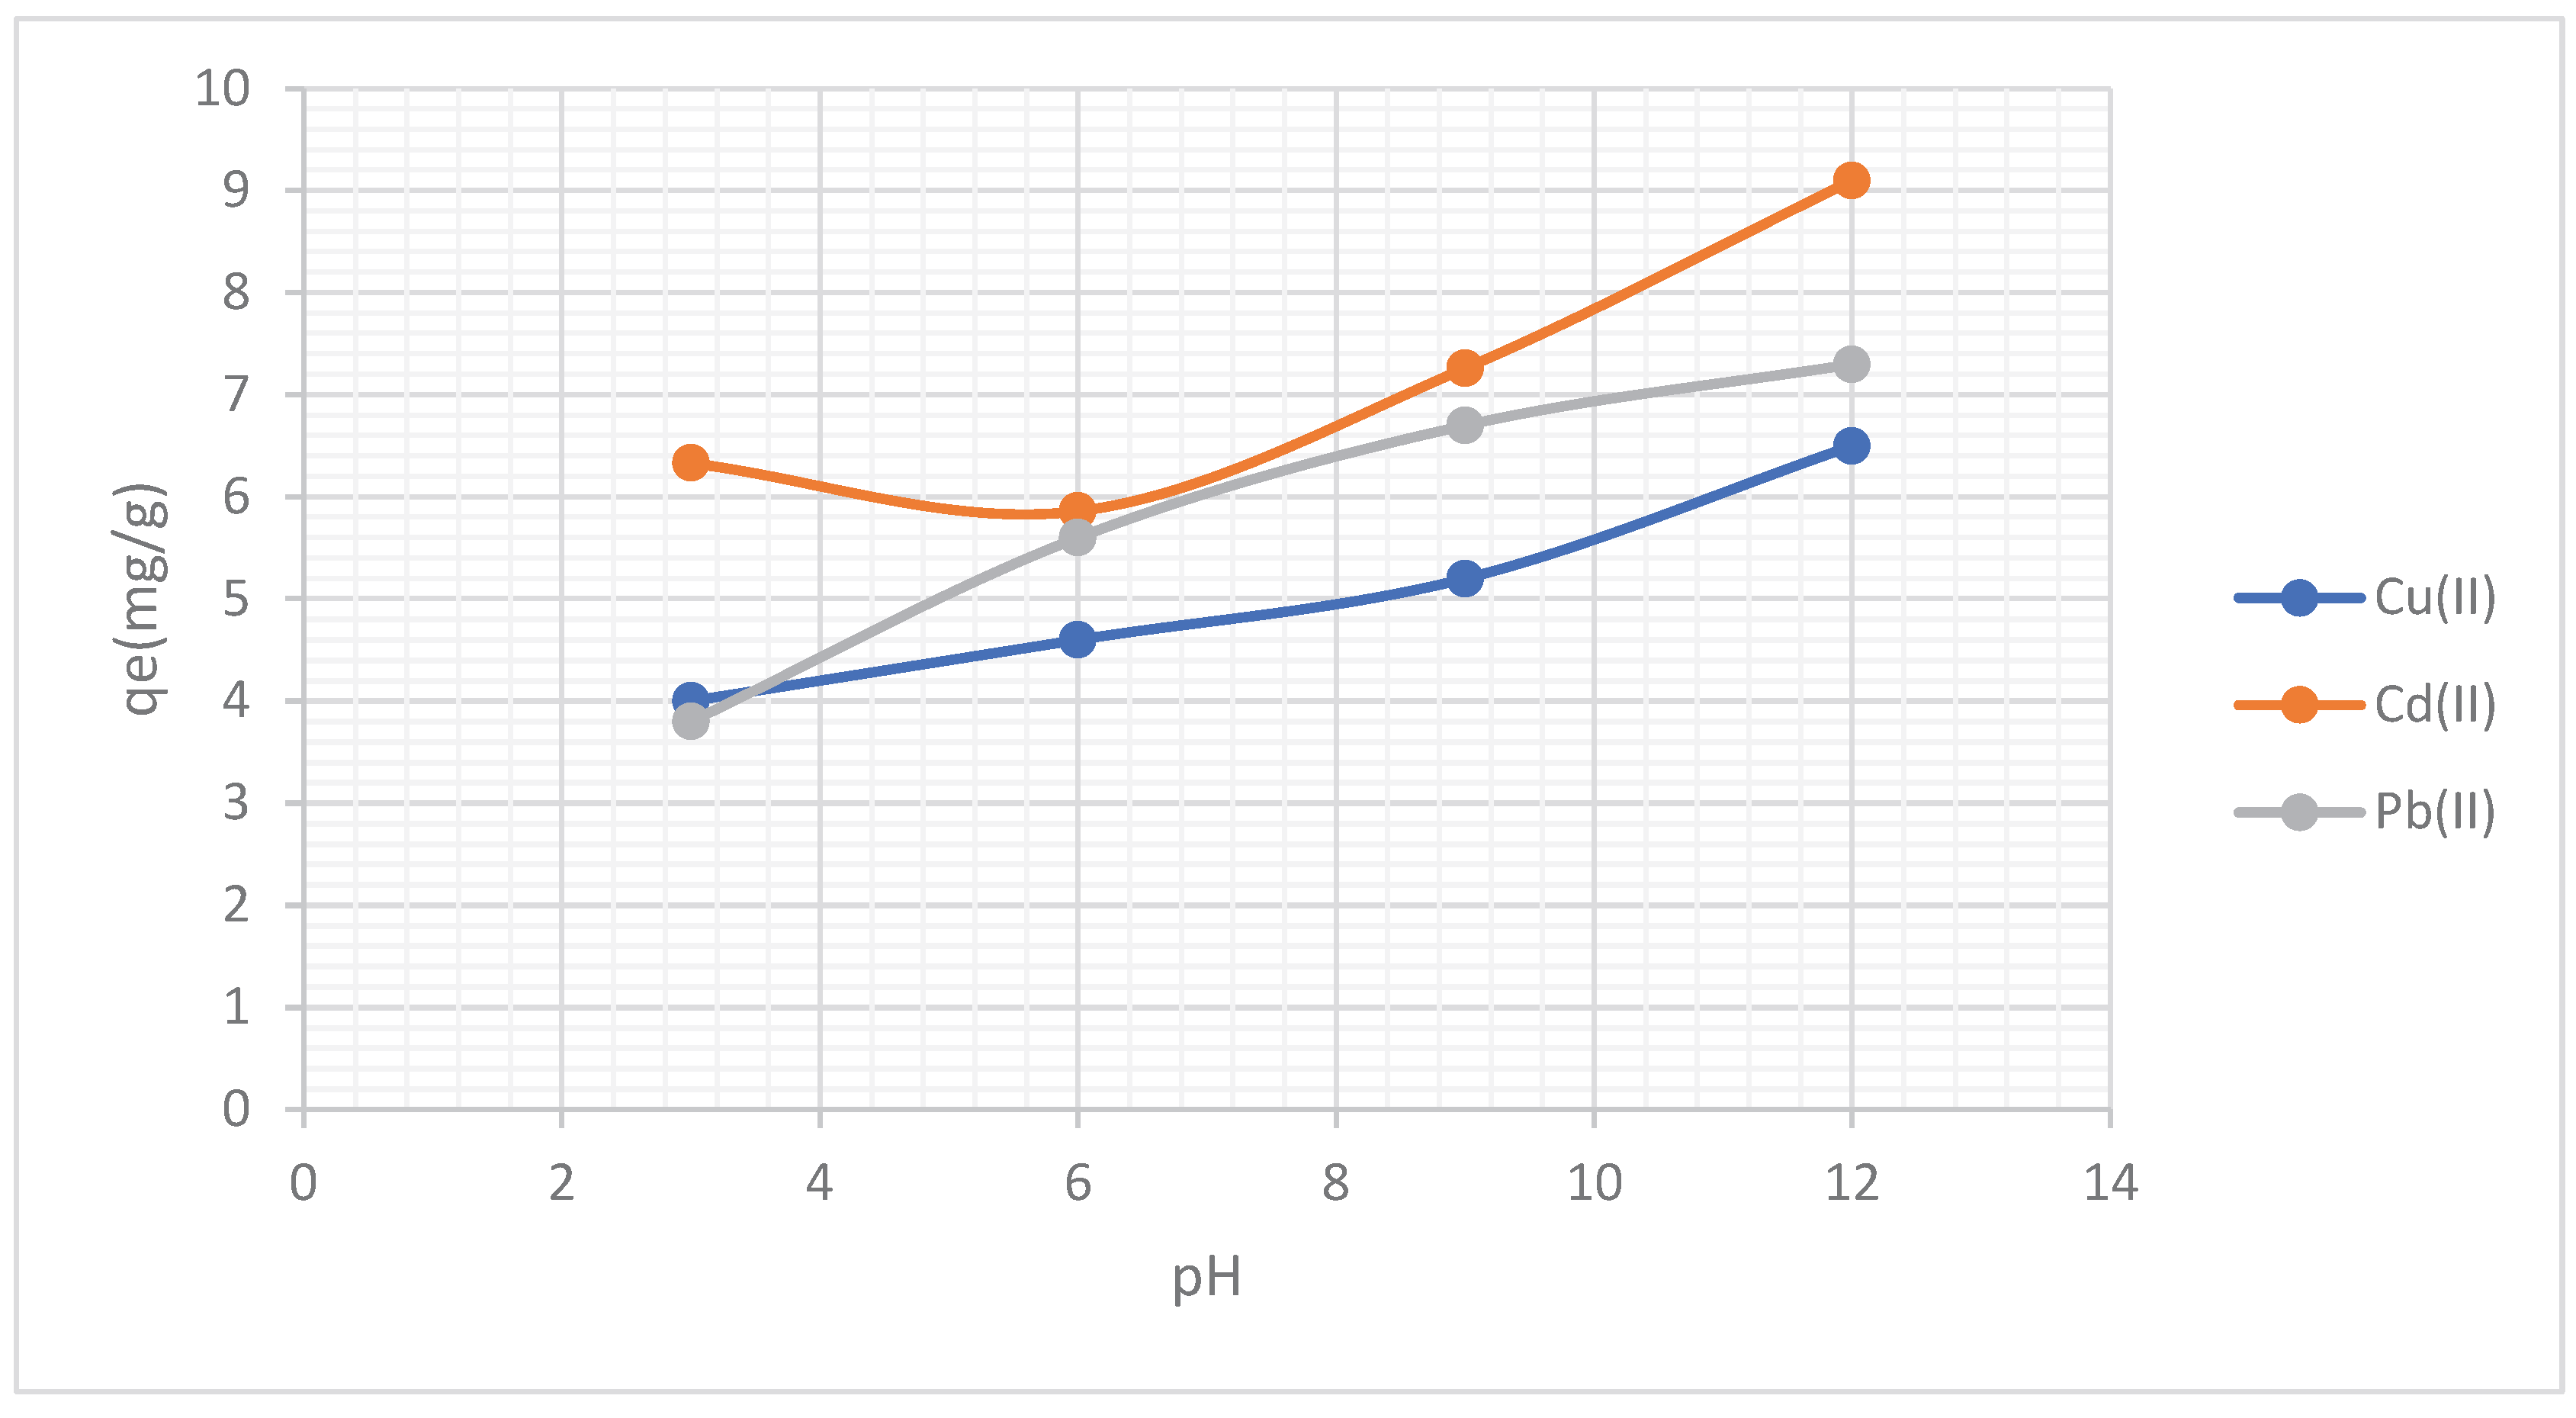
Figure 7.
Effect of temperature on adsorption of Cd(II), Pb(II) and Cu(II) by MoS2NPs.
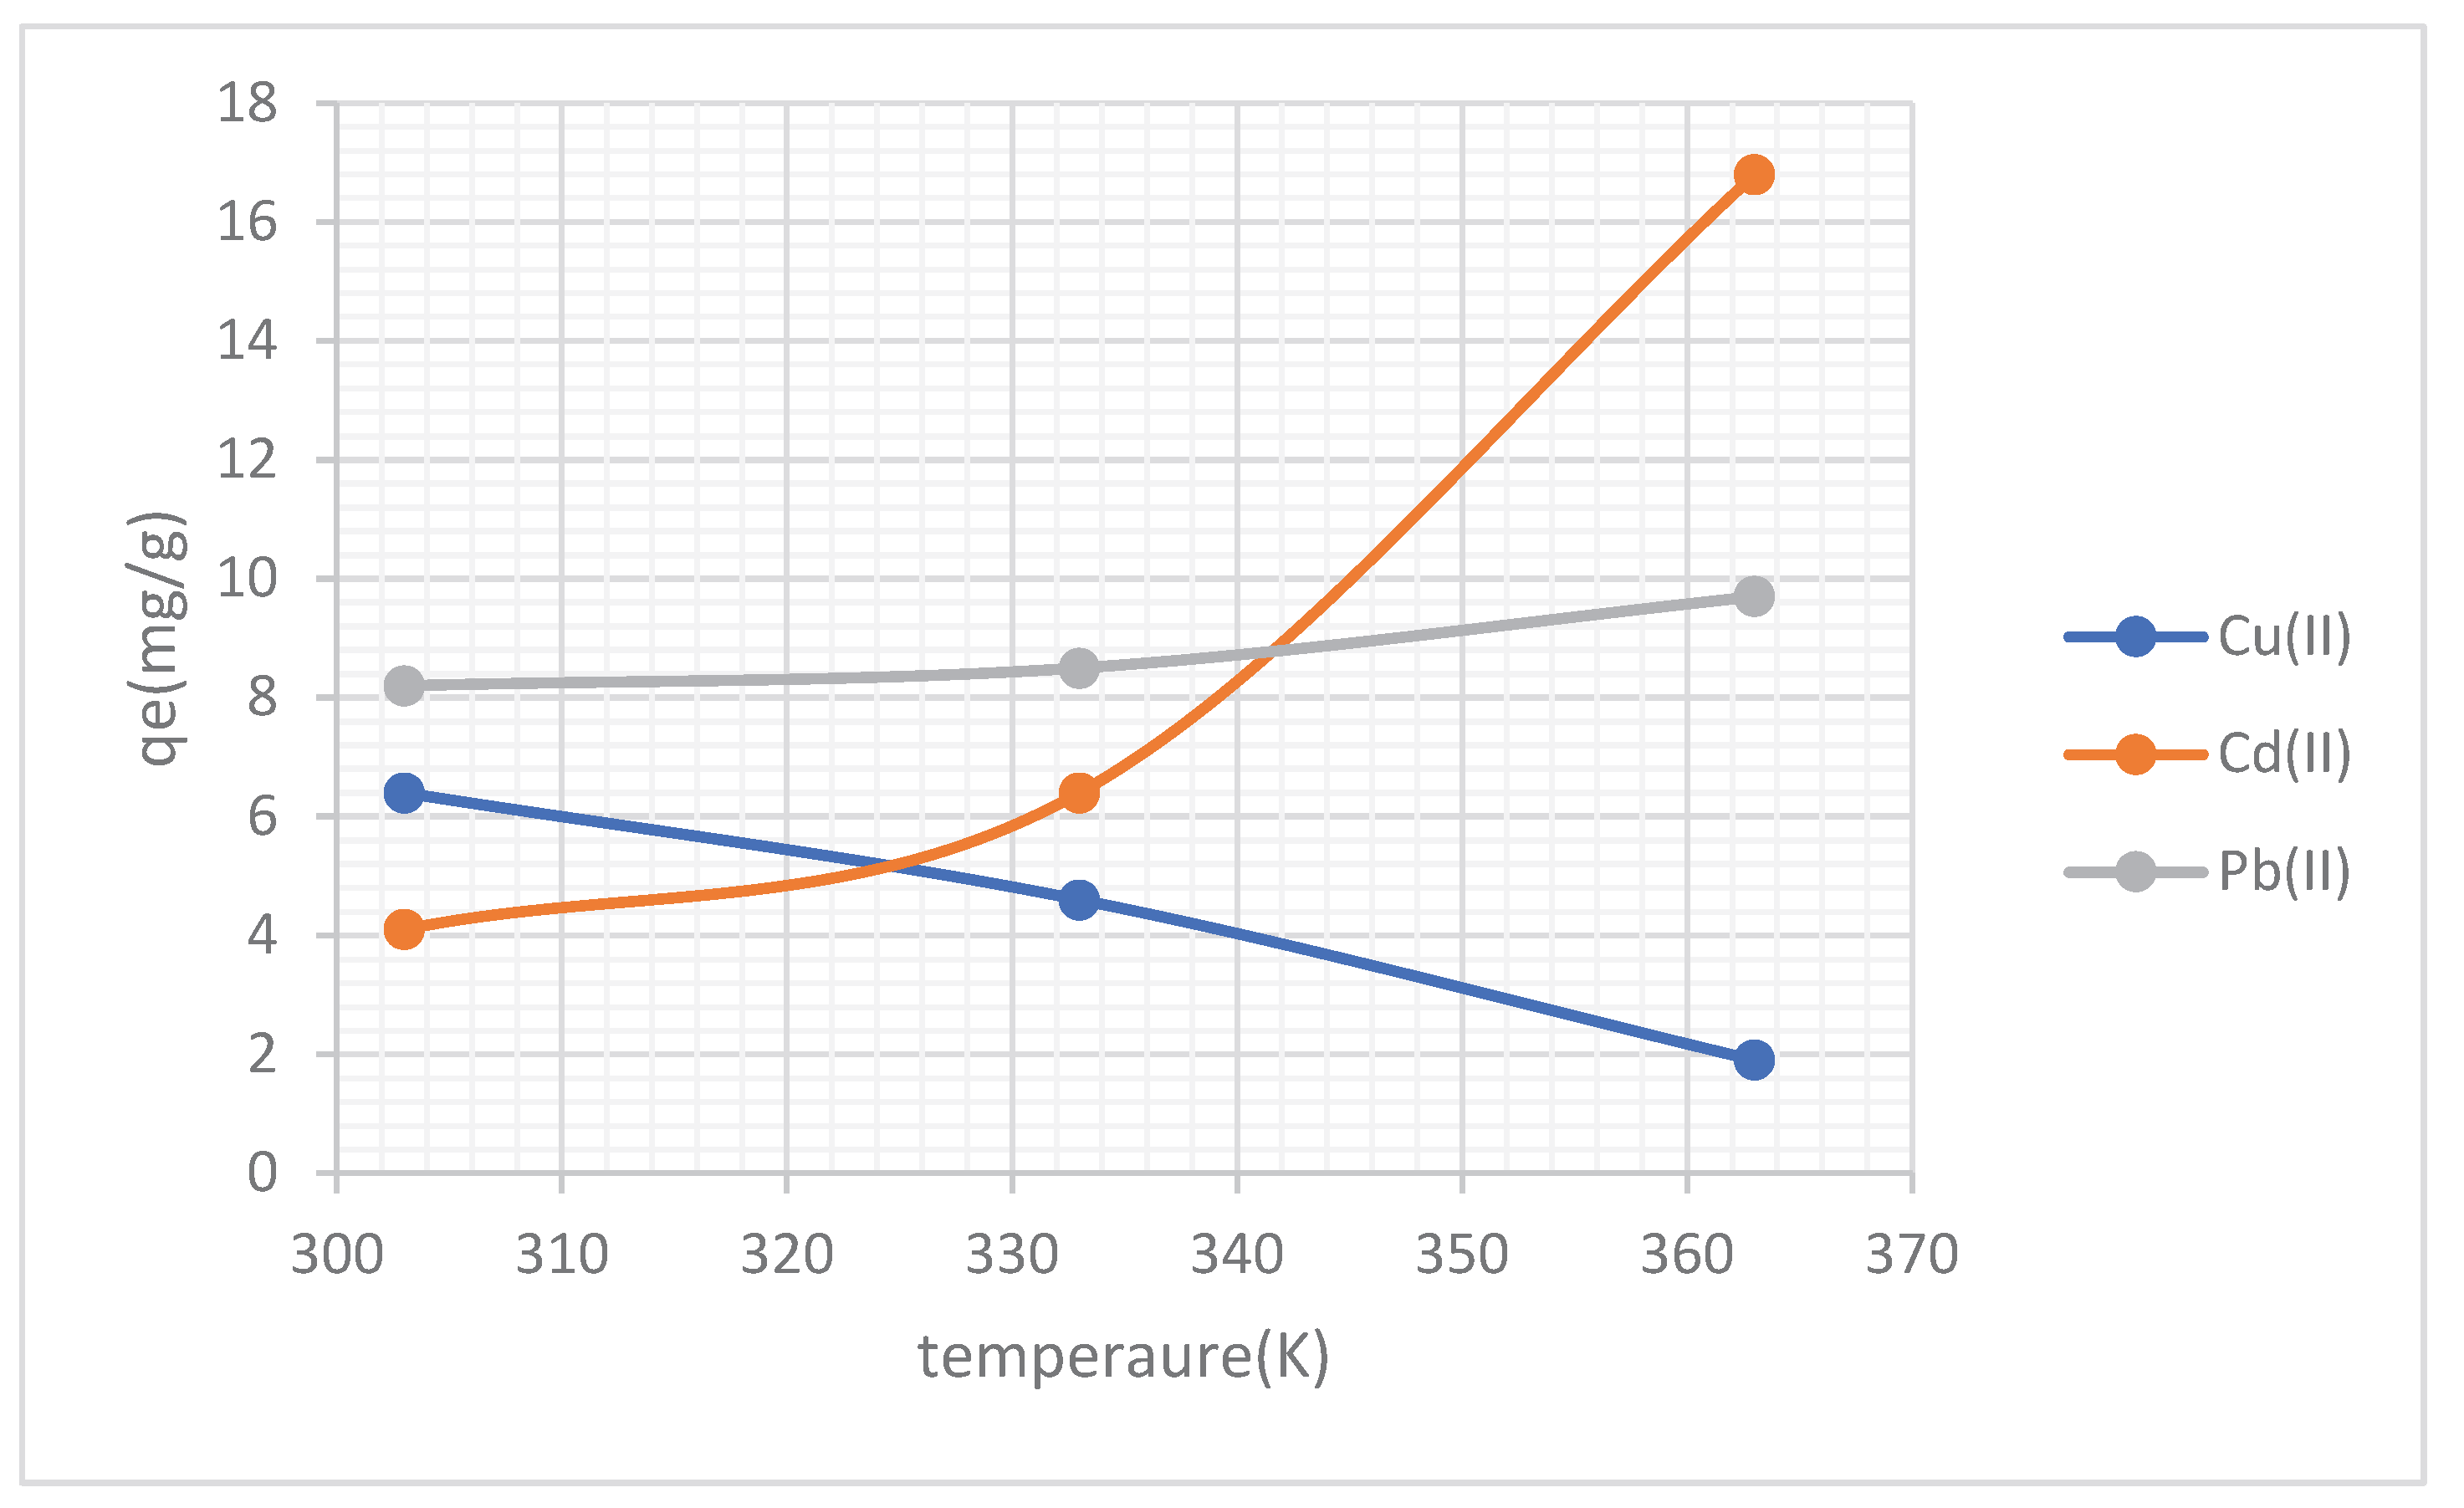
Figure 14.
adsorption thermodynamics of adsorption of Cd(II), Pb(II) and Cu(II) by MoS2NPs.
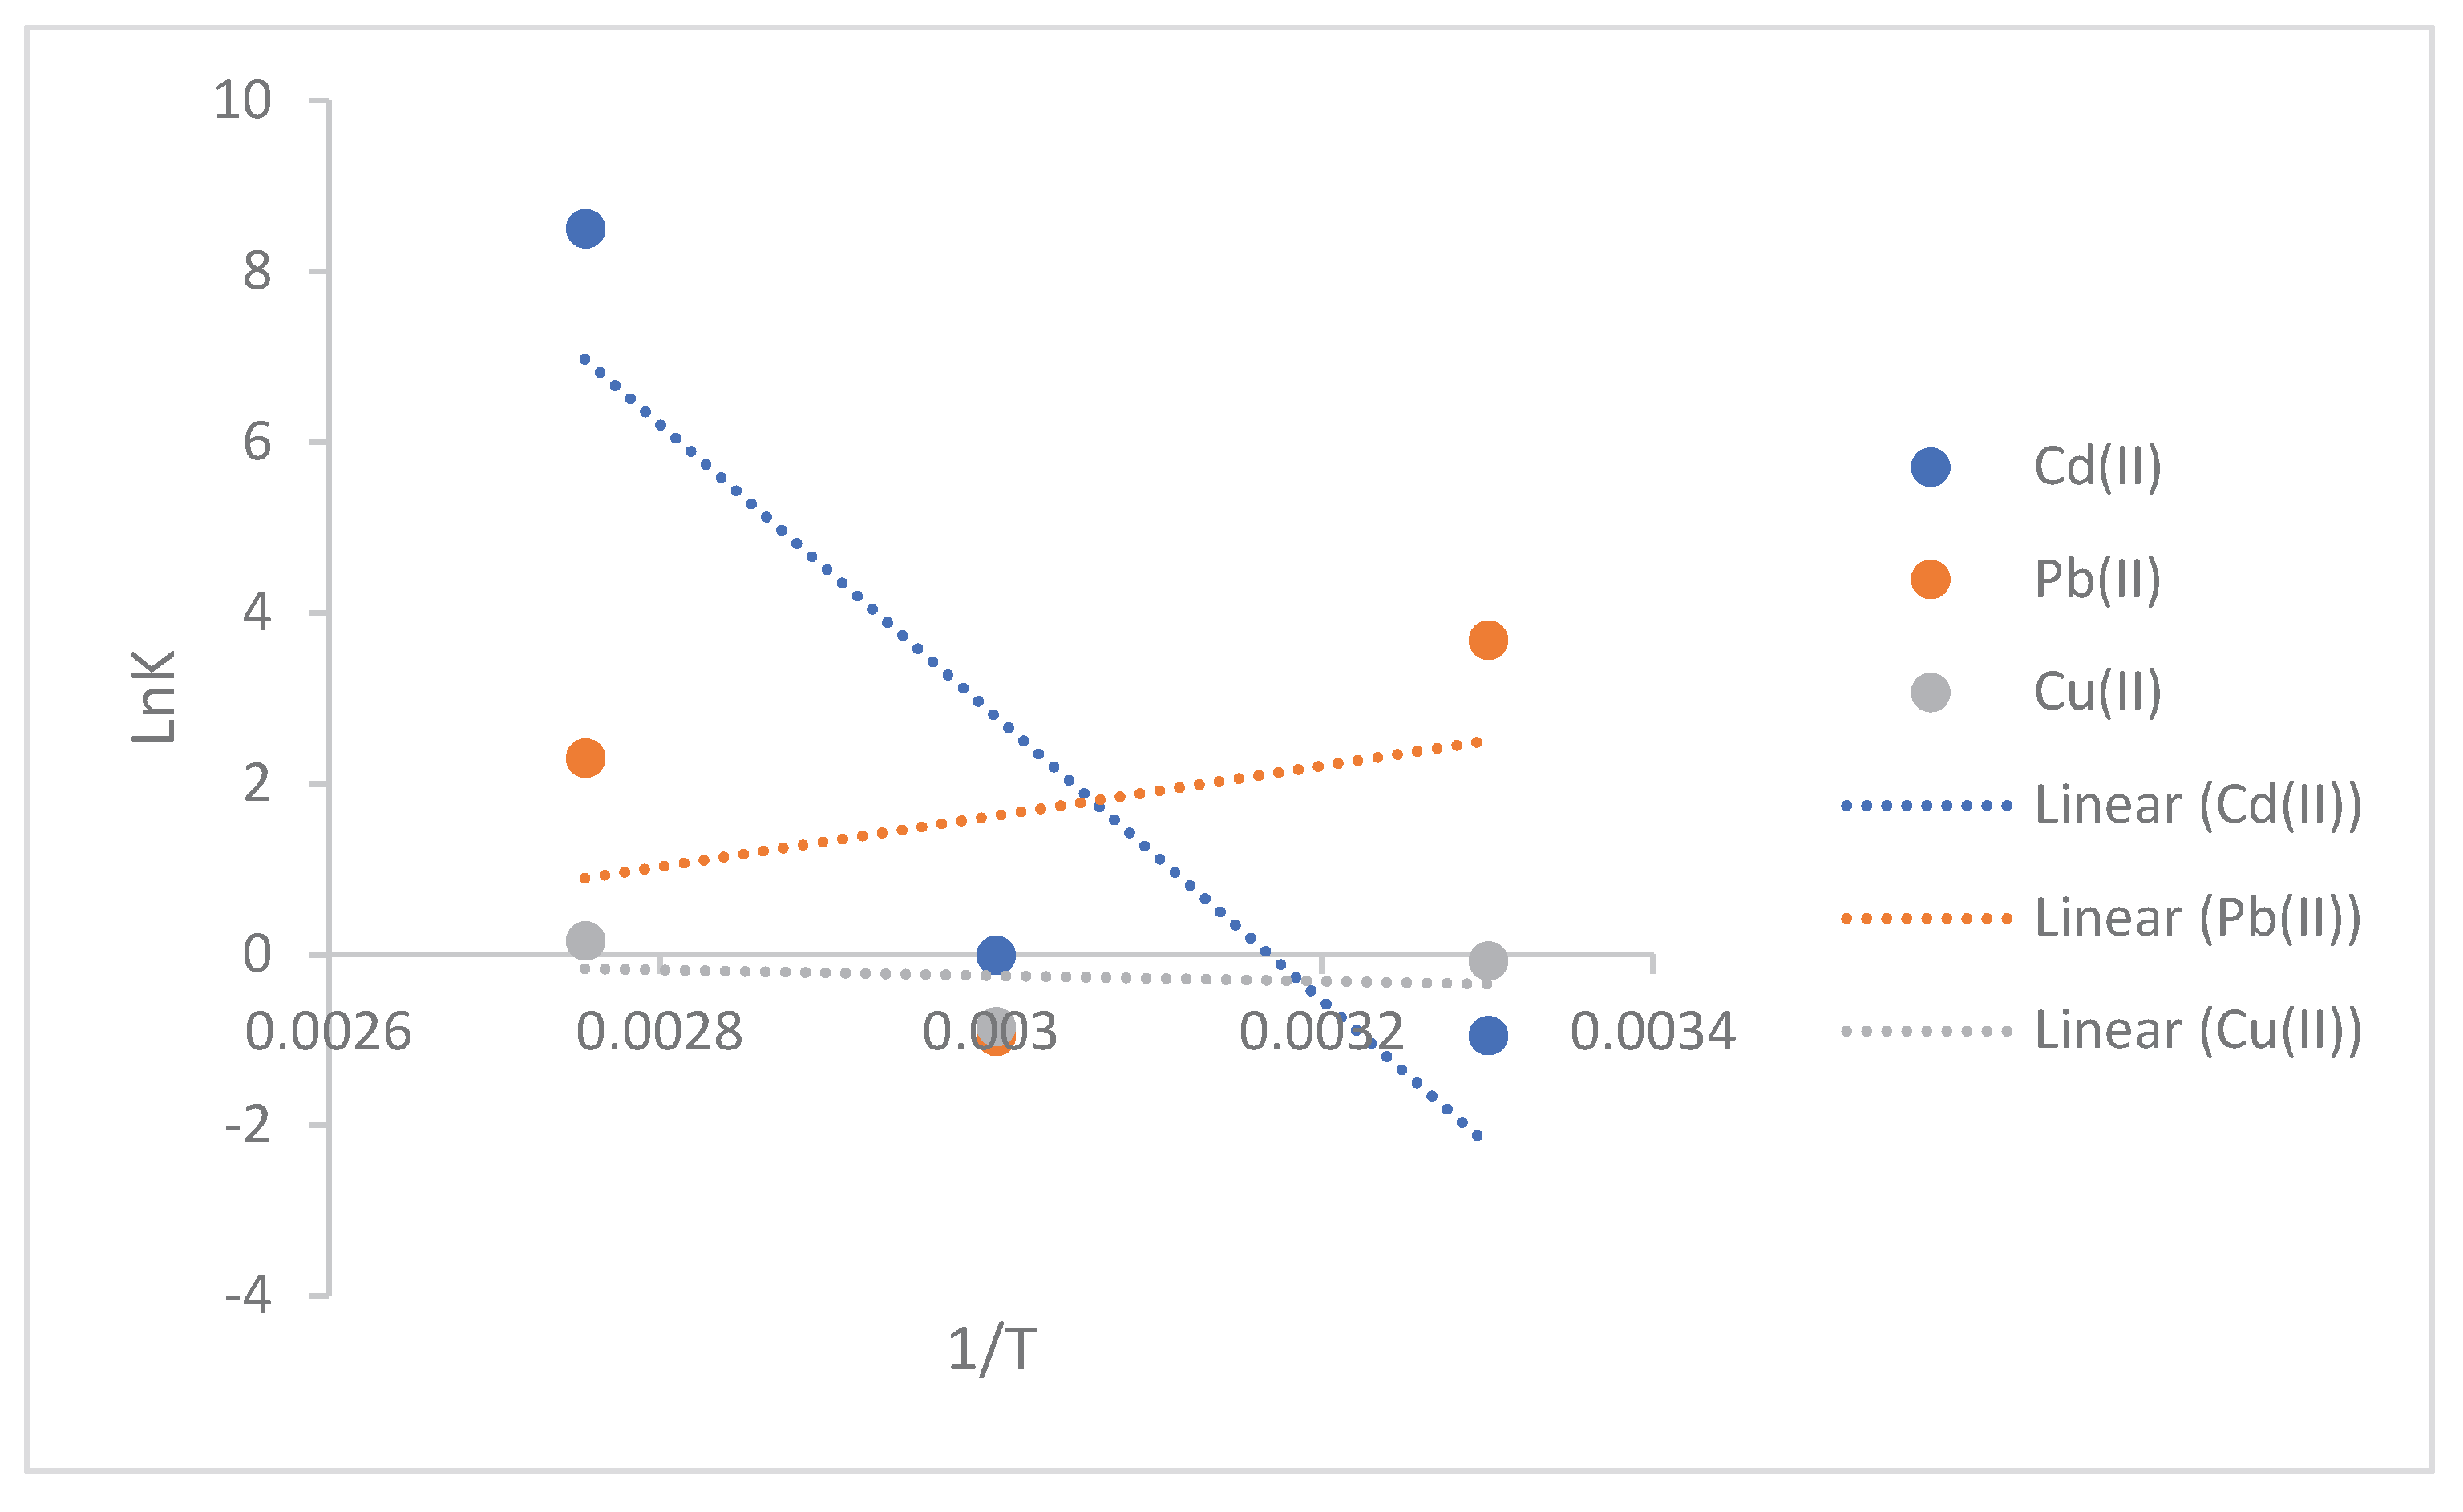
Table 2.
adsorption kinetic of adsorption of Cd(II), Pb(II) and Cu(II) by MoS2NPs.
| metals | Henry isotherm R2 | Freundlich isotherm R2 | Temkin isotherm R2 |
Langmuir isotherm R2 |
D-R R2 |
| Cu(II) | 0.9513 | 0.959 | 0.8317 | 0.5186 | 0.9167 |
| Cd(II) | 0.956 | 0.8713 | 0.8592 | 0.2958 | 0.8828 |
| Pb(II) | 0.895 | 0.8896 | 0.9367 | 0.7606 | 0.9258 |
Table 4.
Adsorption thermodynamic of adsorption of Cd(II), Pb(II) and Cu(II) by MoS2NPs.
| metals | |||
| Cd (II) | -132.56 | -140.2 | 444.43 |
| Pb (II) | 17.98 | 24.57 | -60.27 |
| Cu (II) | -1.79 | -2.74 | 6.02 |
Disclaimer/Publisher’s Note: The statements, opinions and data contained in all publications are solely those of the individual author(s) and contributor(s) and not of MDPI and/or the editor(s). MDPI and/or the editor(s) disclaim responsibility for any injury to people or property resulting from any ideas, methods, instructions or products referred to in the content. |
© 2026 by the authors. Licensee MDPI, Basel, Switzerland. This article is an open access article distributed under the terms and conditions of the Creative Commons Attribution (CC BY) license (http://creativecommons.org/licenses/by/4.0/).
Copyright: This open access article is published under a Creative Commons CC BY 4.0 license, which permit the free download, distribution, and reuse, provided that the author and preprint are cited in any reuse.


