

Submitted:
23 June 2026
Posted:
24 June 2026
You are already at the latest version
Abstract
Improving salt tolerance (ST) is a critical objective for rice production in China’s Huang-Huai-Hai (3H) region, where soil salinity poses a persistent threat to crop productivity. Natural allelic variations in ST genes serve as vital genetic resources for addressing this challenge. In this study, we investigated nine single nucleotide polymorphisms (SNPs) associated with seven known ST genes across 215 geng/japonica rice varieties from this region, including OsSTG5, SKC1, OsHKT1;1, OsHKT2;3, OsWRKY53, OsSTL1, and RST1. Through KASP genotyping and haplotype analysis, these varieties were classified into 14 distinct haplotypes. Functional assessment of these SNPs revealed that OsSTL1, OsHKT1;1, RST1 and OsSKC1 variants significantly contribute to improved ST. Notably, RST1G530A was identified as a pivotal factor in enhancing ST rarely distributed in geng/xian varieties of the 3H region. Further physiological and molecular analyses demonstrated that the RST1530A allele confers ST by attenuating repression of OsAS1, thereby increasing its expression under salt stress. Evolutionary analysis suggests that the RST1G530A allele in geng/japonica rice likely originated from xian/indica varieties through historical hybridization and selection, involving introgression of a ≥68-Kb chromosomal segment. These findings clarify the genetic basis of ST and provide promising candidate loci for breeding in the 3H region.
Keywords:
salt tolerance
; geng/japonica rice
; single nucleotide polymorphism (SNP)
; KASP
; RST1
1. Introduction
The Huang-Huai-Hai (3H) rice region, a vital area for geng/japonica rice cultivation in China, typically refers to the agricultural zone formed by the alluvial plains where the Yellow, Huai, and Hai Rivers converge [1,2]. Rice yield in this region plays a crucial role in ensuring food security. The 3H rice region is bordered by the Bohai and Yellow Seas of China. Due to seawater intrusion, rising groundwater levels, and strong evaporation, the area of saline-alkali soil continues to expand, increasingly subjecting geng/japonica rice to salt stress during its growth [3,4,5]. This type of abiotic stress not only inhibits seed germination and seedling growth and development but also significantly reduces yield [6,7]. Therefore, breeding salt-tolerant geng/japonica rice varieties has become an urgent priority to ensure food security in this region [8]. Although many QTLs and genes have beenidentified to confer rice salt tolerance (ST), most of them remain at the theoretical level [9]. Only a few loci, like “Saltol”, have been reported as being applied for breeding salt-tolerant varieties [10]. Other loci that have been found to be related to ST need further functional tests in natural varieties, especially in those cultivated in saline-alkali areas, and varieties of the 3H rice region are appropriate for such assessment.
In the field of rice ST research, several key genes involved in ion balance, signal transduction, and transcriptional regulation have been identified from various materials [11,12]. However, most studies focus on xian/indica rice or model varieties, and the natural variation and breeding potential of these genes in geng/japonica rice—particularly local germplasm from the 3H region—remain unclear. For instance, SKC1, also referred to as OsHKT1;5, is a Na+ selective transporter of the HKT family in rice [13]. Expressed mainly in root stele and xylem parenchyma cells, it unloads Na+ from the xylem to reduce sodium buildup in aerial tissues and improve plant salt resistance [13,14,15]. It is the causal gene underlying the major ST QTL “Saltol” on rice chromosome 1 [10,16]. OsWRKY53, mapped by genome-wide association studies (GWAS), is a key negative regulator gene of ST, directly repressing the expression of the major salt-tolerant gene SKC1 (OsHKT1;5) and OsMKK10.2 [17]. Natural variation of OsWRKY53 enhances ST predominantly in xian/indica rice varieties [17,18]. STG5 was identified via a combined mutli-omics and genetic mapping strategy and was found to regulate HKT family genes to contribute to ST [19]. The ST haplotype of STG5 is also predominantly enriched in xian/indica rice populations [18,19]. RST1, also referred to as OsARF18, negatively regulates ST in rice by directly repressing the transcription of OsAS1, a key gene in nitrogen metabolism [20,21]. Loss of RST1 function improves nitrogen utilization, reducing NH4+ accumulation, maintaining a lower Na+/K+ ratio, and ultimately enhancing ST [20]. Two key single nucleotide polymorphism (SNP) sites with transversions from G to C and C to G, respectively, cause the G530A and E611G amino acid substitutions and have been reported to improve ST [18]. OsHKT1;1 and OsHKT2;3 were two HKT family genes discovered by GWAS, regulated by HST1, OsWRKY53, and STG5 [17,20,22,23,24]. OsSTL1 encodes a C2C2-type zinc finger protein on chromosome 4 and positively regulates ST in rice seedlings [25]. All these genes have not been investigated in specific cultivars in the 3H rice region in China, hindering the potential application of these ST genes for improving the ST of these varieties.
Natural variations cause different functional levels of gene alleles [26,27]. Some ST genes have been reported to be classified into haplotypes based on SNP differences, which provides us with a tool for functional evaluation and utilization of these genes [28,29]. Here, we collected nine SNPs distributed in seven STt associated genes reported to be associated with ST, including OsSTG512S, SKC1140A, SKC1184H, OsHKT1;194K, OsHKT2;3I77T, OsWRKY53173G, OsSTL1289S, RST1530A and RST1E611G [13,17,18,19,21,23,24,25]. We investigated the distribution of these genes in a population of 215 geng/japonica rice varieties in the 3H rice region in China. These varieties could be divided into 14 haplotypes. Then based on haplotype comparison, we evaluated the functional levels of these SNPs in the geng/japonica rice population. The results showed that OsSTL1289S, OsHKT1;194K, RST1530A and SKC1140A significantly contributed to improving ST, whereas OsWRKY53173G and STG512S did not confer detectable benefits in this population. Among these SNPs, RST1530A contributes the most to ST. Then we performed functional validation of RST1530A compared with RST1530G based on chromosome segment substitution lines (CSSLs), combined with transcription and biochemical analyses. We found that RST1530A represses OsAS1 expression weaker than RST1530G and genetically associates with ST. Subspecies cluster analysis shows that RST1530A is mainly present in xian/indica rice varieties. A few geng/japonica rice varieties, such as Yanfeng47 and Lindao20, have acquired chromosome fragments carrying RST1530A from the ancestors of xian/indica rice during domestication, thereby enhancing their ST. These varieties could be used as appropriate donors to contribute RST1530A for geng/japonica rice ST improvement.
2. Materials and Methods
2.1. Rice Resources and Growth Conditions
The 215 Huang-Huai-Hai geng/japonica rice varieties were used in this study (Supplementary Table S1); among them, varieties 1-194 were from the collections as previously described [2], while varieties 195-215 were collected by Mr. Ruihua Zhang (Linyi Academy of Agricultural Science). Prior to the experiment, seeds were dried at 37 °C for 3 d and then soaked in double-distilled water (ddH₂O) for 3–4 d until germination. Germinated seeds were then sown in 96-well black plastic plant boxes containing ddH₂O for 2 d. Subsequently, the water was replaced with Yoshida rice nutrient salts (Coolaber, Beijing, China). The nutrient solution was renewed every 3 d to ensure a stable nutrient supply. Rice seedlings were grown in a phytotron within the Plant Growth Breeding System (PGBS, Wuhan Greenfafa Institute of Novel Genechip R&D Co., Ltd., China) greenhouse with 12 h of light at 30◦C and 12 h of darkness at 26◦C, and the humidity maintained at 70% [18].
2.2. SNP Genotyping Based on KASP and Cluster Analysis
Nine ST associated nucleotide polymorphisms (SNPs) including OsSTG512S, SKC1140A, SKC1184H, OsHKT1;194K, OsHKT2;3I77T, OsWRKY53173G, OsSTL1289S, RST1530A and RST1E611G were used for genotyping analysis. Kompetitive Allele Specific PCR (KASP) serves as a robust tool for genotyping SNPs within gene sequences [2,30]. In this assay, each SNP was designed with a group of KASP primers listed in Supplementary Table S2. One genotyping sample was a 5 μL mixture consisting of 50–100 ng genomic DNA, 0.05 μM each forward primer, and 0.15 μM reverse primer, added with 2.5 μL 2×Master Mix for ASPCR V1 (HC Scientific, Chengdu, China). The PCR program was as follows: First, initial hot-start activation at 95 °C for 10 min; Then 10 touchdown cycles including 95 °C denaturation for 20 s and starting at 61 °C annealing/extension for 40 s, decreasing by 0.5 °C per cycle; Followed by 26 standard cycles, including 95 °C for 20 s and 56 °C for 40 s; Finally, fluorescence endpoint signals of FAM and HEX were scanned after amplification, and genotype clustering analysis was conducted using LGC SNP viewer software to distinguish homozygous reference alleles, homozygous variant alleles and heterozygous genotypes. Based on the genotyping of the nine SNPs, varieties with identical types at all SNPs were clustered into one haplotype. Then the genetic distance was calculated between different haplotypes based on the neighbor-joining method to create the phylogenetic tree [31].
2.3. Phenotype Assessment of ST
Phenotypic assessment of ST was performed as previously described [18]. In brief, two–weeks-old seedlings had the nutrient solution replaced with 150 mM NaCl to simulate a salt stress environment. After being treated and re-watered for certain days, the relative shoot fresh weight (rSFW) and dead leaf rate (DLR) were measured to characterize ST. The rSFW was the ratio of shoot fresh weight (SFW) measured under treatment to SFW in control. The DLR was the ratio of the number of dead leave to the total number of leaves.
Fv/Fm (the maximum quantum efficiency of PSII) was reported to be significantly positively correlated with ST in rice and is a key physiological indicator for evaluating ST [32,33]. Here we used the ratio of Fv/Fm under salt stress to Fv/Fm before treatment as relative Fv/Fm (rFv/Fm) to characterize the effect of salt stress on photosynthetic rate. The Fv/Fm was detected by the PathoScreen plant pathological phenotype measurement system (PhenoVation, Netherlands).
2.4. RNA Extraction and Quantitative Real-Time PCR
Total RNA was extracted from plant tissues using the RNApure Fast Plant Kit (CWBIO, Beijing, China) according to the manufacturer’s instructions. Briefly, tissue samples were ground in liquid nitrogen and lysed with RSL buffer. After gDNA removal, RNA was bound to the spin column, washed with RW1 and RW2 buffers, and eluted with RNase-free water. Reverse transcription was done for the synthesis of the first-strand cDNA using the HiFiScript gDNA Removal cDNA Synthesis Kit (CWBIO). Then, qRT-PCR was performed on the Archimed X4 Detection System (ROCGENE, Beijing, China) using the UltraSYBR Mixture kit (CWBIO). The amplification program was set as follows: initial denaturation at 95 °C for 3 min, followed by 40 cycles of 95 °C for 10 s and 60 °C for 30 s. Melting curve analysis was conducted from 65 °C to 95 °C to verify amplification specificity. Relative gene expression levels were calculated using the 2−∆∆Ct relative quantitative method with a reference gene for normalization [34]. The primers used for RST1, OsAS1, and OsACTIN are listed in Supplementary Table S3.
2.5. FBP-LUZ Reporter Assay for Transcription Repression Analysis
The fungal bioluminescence pathway (FBP) is an autonomous, caffeic acid-dependent luminescence system originating from fungi. The expression level of LUZ in the system determines the intensity of bioluminescence when caffeic acid is sufficient. FBP-LUZ was validated to function well in Nicotiana benthamiana leaves and has been used to evaluate the effect of transcription factors on target promoters [35]. Unlike conventional luciferase reporters, it enables continuous, substrate-free bioluminescence, making it a powerful tool for non-invasive monitoring of gene expression in planta [36]. We constructed the FBP-LUZ system in three parts. One is the reporter system, consisting of the target promoter linked with LUZ in the plasmid, pGreenⅡ 0800. The second is the transcription factor expression system driven by the Cauliflower Mosaic Virus 35S promoter (p35S) in the plasmid pCAMBIA1300, into which thecoding sequence of RST1530G and RST1530A were inserted, respectively. The final one is the caffeic acid synthesis system, called “CHN,” constructed with four genes (HispsS, H3H, CPH and NPGA) driven by p35S in the plasmid pCAMBIA1300. These plasmids were separately transformed into Agrobacterium tumefaciens strain GV3101 for transient expression. They were then co-infiltrated into 4-week-old N. benthamiana leaves for 48 h [37,38]. The salt induction method involved spraying a 100 mM NaCl solution evenly onto leaves 45 h after inoculation and treating them for 3h . Then, luminescence signals were detected by the NightShade LB985 plant imaging system (Berthold Technologies, Germany), which operates at a spectral range of 350–1050 nm. The luciferase deviation was quantified to evaluate transcriptional repression efficiency.
2.6. Statistical Method for Data Analysis
For comparisons between two independent groups, the independent-samples t-test was adopted, and two-tailed P values were calculated. For comparisons involving three or more groups, one-way analysis of variance (one-way ANOVA) was performed, and two-tailed P values were calculated. A statistically significant difference was defined as P < 0.05.
3. Results
3.1. Distribution of ST Genes in a Huang-Huai-Hai Geng/Japonica Rice Population.
To investigate the distribution of ST genes in the geng/japonica rice population, we selected seven cloned ST genes including STG5, SKC1, OsHKT1;1, OsHKT2;3, OsWRKY53, OsSTL1 and RST1, and investigated their functional single nucleotide polymorphism (SNP) loci in 215 geng/japonica rice varieties belonging to the 3H geng/japonica rice region in China. The functional SNP loci included OsSTG5I12S, SKC1P140A, SKC1R184H, OsHKT1;1L94K, OsHKT2;3I77T, OsWRKY53A173G, OsSTL1P289S, RST1G530A and RST1E611G according to previous reports [18]. The number in the superscript at each site represents the position of the amino acid, and the amino acid typing before and after the number corresponds to the salt-sensitive and salt-tolerant types respectively. We used KASP to realize the typing of the above nine SNP loci. The genotyping maps of the nine SNP loci were shown in Figure 1A-I, which showed the availability of these primers, and the certain genotypes of each SNP in each variety were listed in Supplementary Table S1.
Then, we compared the typing of various SNP loci in different varieties and found that 71.2% (153/215) of geng/japonica rice varieties had the same typing at each locus (Figure 2). The 153 varieties were classified as the major haplotype group of Hap1, and only two out of nine SNP loci, including OsHKT2;377T and RST1611G were ST type in the Hap1 varieties. The other haplotype groups (Haps) were listed from Hap2 to Hap14 in the order of the number of varieties included. The genetic distances between different haps were calculated and shown in Figure 2. Correspondingly, OsHKT2;377T and RST1611G, were shared with up to 99.53% and 100%, respectively, in the investigated varieties. ST types at other SNP loci were much less than OsHKT2;377T and RST1611G; listed from high to low order, they were OsSTL1289S (14.42%, 31/215), STG512S (7.44%, 16/215), OsWRKY53173G (6.98%, 15/215), SKC1140A (3.72%, 8/215), RST1530A (3.72%, 8/215), OsHKT1;194K (2.32%, 5/215), and no variety had the ST type, SKC1184H.
3.2. Functional Assessment of Six ST Genes in the Geng/Japonica Rice Population
To evaluate the contribution of each SNP locus to ST, we compared ST levels between specific haplotype groups according to the method previously described [18]. Because most varieties belonged to Hap1, which contains three conserved SNPs, we selected several varieties of Hap1 as a control and compared ST between the control and varieties representing each of the other haplotypes (Hap2–4, 6, 7, and 10). As mentioned above, Hap1 had just two ST-type SNP loci, while Hap2 carried three ST type SNP loci, with an additional locus of OsSTL1289S. Therefore, we compared ST between Hap2 and Hap1 to evaluate the function of OsSTL1289S. Similarly, we compared Hap1 with Hap3, Hap4, Hap6, Hap7, and Hap10, respectively, to assess the ST function of OsWRKY53173G, OsSTG512S, OsHKT1;194K, RST1530A, and SKC1140A. Selected varieties were treated with 150 mM NaCl for seven days, then re-watered for an additional five days. Then, relative shoot fresh weight (rSFW) was measured as an ST index. The results showed that the genotypes of OsSTL1289S, OsHKT1;194K, RST1530A, and SKC1140A significantly contributed to ST improvement, with contribution rates of 33.3%, 12.5%, 57.1%, and 16.50%, respectively (Figure 3A,D–G), while OsWRKY53173G and STG512S did not show significant contributions (Figure 3B,C,G).
3.3. RST1530A Impaired the Repression of OsAS1 and Genetically Associated with ST
In the ST comparison experiment, we noticed that Hap7 showed the highest ST level compared with Hap1, indicating that RST1530A plays a pivotal role in improving ST. The result was consistent with our previous assessment of a xian/indica rice population [18]. Previous studies have shown that RST1 is a negative regulator of ST, reducing rice ST by repressing the target gene, OsAS1 [20]. OsAS1 participates in the primary assimilation of NH4+ and catalyzes the synthesis of asparagine in roots. The loss of function of RST1 results in the upregulation of OsAS1, which enhances nitrogen utilization efficiency by promoting asparagine synthesis and mitigates excessive NH4+ accumulation, thereby improving plant ST [20,21]. We hypothesized that the variation of RST1G530A caused a nonsynonymous mutation might affect the RST1-OsAS1 regulation axis and impact rice ST. To verify this hypothesis, three varieties of Hap7 (Yanfeng47, Lindao20, and Xuxiangjing6) and three varieties of Hap1 (Nipponbare, Jingjing818, and Jinyuan45) were used for salt-tolerant comparison. Simultaneously, we detected the expression of RST1 and OsAS1 of these varieties before and after salt stress in root tissue. The results showed Hap7 had higher rSFW and lower DLR than Hap1 (Figure 4A–C). qRT-PCR showed that both RST1 and OsAS1 were upregulated after 3 hours of treatment with 150 mM NaCl. The average fold changes of RST1 were 1.94 in Hap7 and 2.60 in Hap1, and the average fold changes of OsAS1 were 6.97 in Hap7 and 4.55 in Hap1 (Figure 4D,E). These results indicated that RST1530A leads to slightly more impaired repression of OsAS1 expression than RST1530G under salt stress, which confers stronger ST in Hap7 than Hap1.
3.4. An Introgression Line of RST1530G Impaired the ST and Increased the Repression of Salt-induced OsAS1 Expression
To further validate the effect of RST1530G/A on ST, forward genetic assessment was performed. Huanghuazhan (HHZ) was a conventional planting xian/indica rice variety carrying RST1530A, while Jizi 2 (JZ2) was a conventional geng/japonica rice variety carrying RST1530G. Using HHZ as the recurrent parent and JZ2 as the donor introgression parent, lines of HHZ genetic background with a chromosome segment substitution line (CSSL) of JZ2 ranging from Chr6_27105342 to Chr6_29615495 were generated and named HHZCSSL6-JZ2. We planted HHZ and HHZCSSL6-JZ2 lines in Yoshida solution and compared ST between them (Figure 5A,B). The results showed that HHZCSSL6-JZ2 had significantly lower rSFW and rFv/Fm, and a higher dead leaf rate (DLR) than HHZ (Figure 5C–E). Then we compared the transcription level of RST1 and its target gene OsAS1 in the roots of HHZ and HHZCSSL6-JZ2 respectively at 0 h, 3 h, and 24 h post-treatment with 150 mM NaCl. The results indicated that the expressions of RST1 and OsAS1 were both induced by salt stress as reported before (Figure 5F,G). The expression level of RST1 was equal in HHZ and HHZCSSL6-JZ2 before or after salt stress, while the expression of OsAS1 was significantly higher in HHZ than in HHZCSSL6-JZ2 at 3 h and 24 h post-salt treatment (Figure 5F,G). The phenotype and transcription level comparison verified that RST1530A confers to ST and is impaired in repressing OsAS1 expression.
3.5. FBP-LUZ Based Assay Revealed that RST1530A Impaired the Repression of Salt-Induced OsAS1 Expression
To directly reflect the influence of different Haps of RST1 on the promoter of OsAS1, we performed an FBP-LUZ (Fungal Bioluminescence Pathway-based LUZ reporter system) assay. The FBP-LUZ assay was recently developed for detecting transcription factor (TF) activity, which requires no exogenous substrates and possesses the advantages of high sensitivity, low background, and stable signals [36]. The genomic region spanning the 2 Kb sequence upstream of the start codon of OsAS1 was used as the promoter and inserted upstream of the reporter gene LUZ, designated as pAS1:LUZ. It was co-transiently expressed with RST1530G or RST1530A protein, respectively. The leaves of N. benthamiana were divided into four parts; each part was co-expressed using the CHN expression system. As demonstrated in Figure 6A,B, compared to pAS1:LUZ and a control of JAMYB+pAGO18:LUZ [36], there was no change for the co-expressed groups of RST1530G+pAS1:LUZ and RST1530A+pAS1:LUZ without salt treatment. Under stress, the luciferase activity of both transient groups, RST1530G+pAS1:LUZ and RST1530A+pAS1:LUZ, was significantly lower than that ofpAS1:LUZ, and that of RST1530A+pAS1:LUZ was significantly higher than RST1530G+pAS1:LUZ (Figure 6C,D). These results demonstrated that both Haps of RST1 repressed the promoter activity of OsAS1, and RST1530A exhibited weaker inhibition than RST1530G.
3.6. Evolutionary Analysis Reveals RST1530A of Geng/Japonica Rice Varieties Originated from Specific Xian/Indica ones
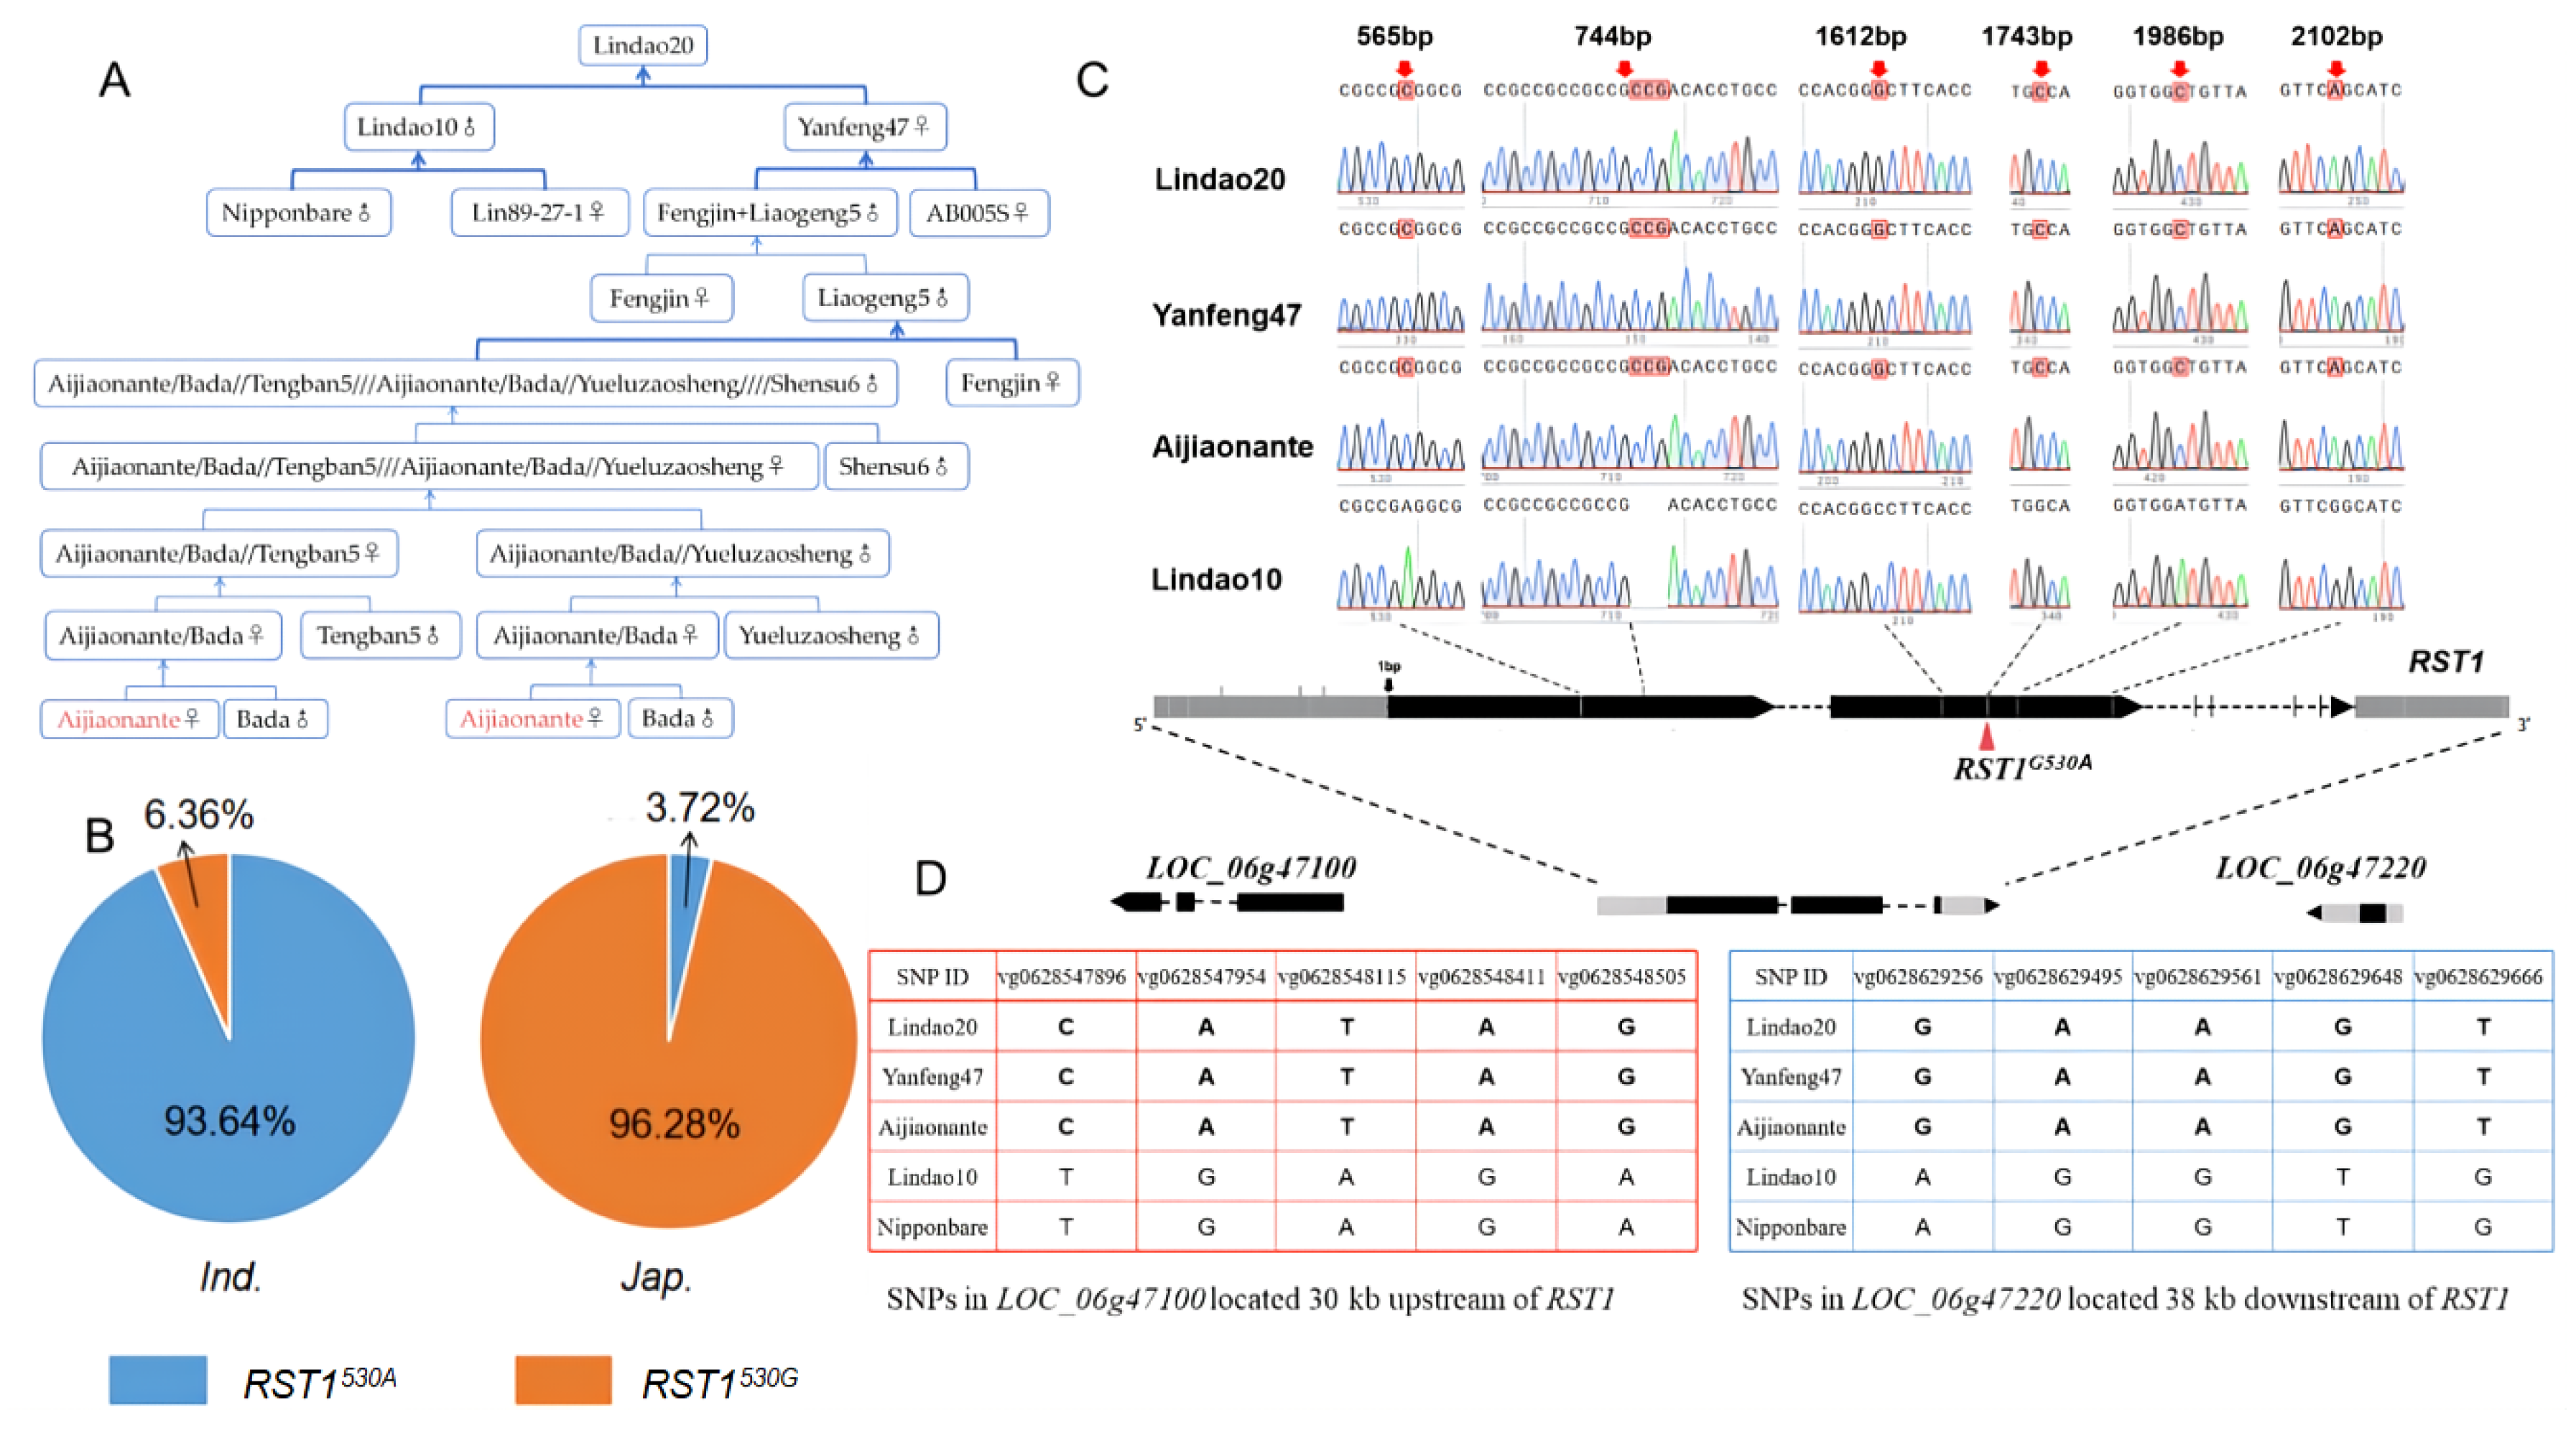
Only three varieties carrying RST1530A were identified in Hap7 (Figure 2), including Lindao20 and its parent line Yanfeng 47 (Figure 7A). We previously revealed that the proportion of RST1530A in a xian/indica rice population reached 93.64% as reported [18], while the proportion of RST1530A was only 3.7% in the 3H geng/japonica rice population (Figure 7B). Thus, we speculated that RST1530A in a few geng/japonica rice varieties may originated from xian/indica rice varieties during the process of subspecies hybridization breeding. To verify this assumption, we investigated the sequence of the RST1 gene in Lindao20 and Yanfeng47. Lindao20 was a progeny selected from a cross of Lindao10 (♂) with Yanfeng47 (♀), which originated from the donor parent xian/indica rice variety Aijiaonante by the Yinan County Rice Research Institute in China (Figure 7A). We found that both Lindao20 and Yanfeng47 had six variations compared to Nipponbare in the RST1 coding region, including five SNPs at 565 bp, 1612 bp, 1743 bp (RST1G530A), 1986 bp, 2102 bp, and one “CCG” INDEL at 744 bp (Figure 7C). While Lindao10 had an identical sequence of RST1 to Nipponbare (Figure 7C), this indicated that the RST1 gene in Lindao20 originated from Yanfeng47. Aijiaonante was an early xian/indica rice variety used as one of the donor lines on the inhierarchical diagram of Lindao20 (Figure 7B). We found that Aijiaonante had the same sequence of RST1 as Lindao20 (Figure 7C), suggesting that RST1530A in Lindao20 originated from xian/indica Aijiaonante. Additionally, LOC_06g47100 and LOC_06g47220 are two flanking genes, which are located 30 Kb upstream and 38 Kb downstream of RST1, respectively. We cloned each gene from all four rice varieties (Lindao20, Yanfeng47, Aijiaonante, and Lindao10) and aligned them with the reference sequence of Nipponbare. Five SNPs for each gene were mined, and they are classified into two Haps, with Lindao20, Yanfeng47 and Aijiaonante grouped together while Lindao10 and Nipponbare grouped as the other Haps (Figure 7C,D). These results suggest that a chromosomal segment of over 68 Kb carrying the RST1530A allele transferred from the xian/indica rice variety Aijiaonante into the geng/japonica rice varieties Lindao20 and Yanfeng47.
4. Discussion
4.1. Contrasting Frequencies of ST SNPs Between Xian/Indica and Geng/Japonica Populations
Previously, alleles associated with ST had been found largely differentiated between xian/indica and geng/japonica rice populations [39]. However, the specific ST genes were not well-documented. A striking finding emerging from the comparison between our previous xian/indica study [18] and the present geng/japonica survey is the dramatic difference in the frequencies of ST alleles. Among the nine investigated SNPs, seven showed a markedly lower frequency in the geng/japonica population (215 Huang-Huai-Hai varieties) than in the xian/indica population (550 accessions). Specifically, OsSTL1289S is fixed in xian/indica (100%) but accounts for only 14.4% in geng/japonica; OsWRKY53173G drops from 92.6% to 7.0%; RST1530A declines from 93.6% to 3.7%; SKC1140A from 79.3% to 3.7%; and SKC1184H is completely absent in geng/japonica. Only two ST-alleles, OsHKT2;377T and RST1611G, shared similarly high frequencies in both subspecies (88.6–99.5% and 93.8–100%, respectively), suggesting they may be ancient [40], functionally indispensable components of the ST machinery that were already fixed before subspecific divergence.
What might explain this pronounced subspecific divergence? Several hypotheses can be proposed. First, differential selection pressures during domestication and breeding likely played a major role. Xian/indica rice is predominantly cultivated in southern China and Southeast Asia, where hot, humid climates often coincide with naturally or anthropogenically salinized soils (e.g., coastal areas, irrigation-induced salinity) [41,42,43]. In such environments, alleles that confer even modest ST would be strongly favored. In contrast, the 3H region, the key geng/japonica production area in northern China, experiences lower temperatures and historically less acute soil salinity, and breeding efforts have focused primarily on yield and cold tolerance, with only indirect or weak selection for ST. Second, the reproductive barrier between xian/indica and geng/japonica (hybrid sterility) has restricted gene flow, preventing the spread of xian/indica-derived tolerant alleles into geng/japonica gene pools [43,44]. Third, some ST-alleles, such as SKC1184H, may have originated relatively recently within the xian/indica lineage and have not yet had sufficient time or opportunity to introgress into geng/japonica [18,39]. Finally, the possibility of epistatic constraints cannot be ruled out: a ST-allele that is beneficial in a xian/indica background might be neutral or even detrimental in a geng/japonica background, thus being purged by selection [45]. Regardless of the exact causes, the observed rarity of most ST-alleles in geng/japonica strongly indicates that genetic improvement of ST in this subspecies will require targeted introgression of favorable alleles from xian/indica donors.
4.2. Subspecies-Specific Functional Comparisons of Three Representative SNPs Reveal the Critical Role of Genetic Background
In both xian/indica and geng/japonica populations, RST1530A exhibits the strongest contribution to ST (confirmed by haplotype comparisons in xian/indica; 57.1% improvement in rSFW in geng/japonica) [18]. Notably, this conclusion directly corrects the earlier report that considered RST1530G as tolerant and RST1530A as sensitive [20]. Our xian/indica study already demonstrated through rigorous haplotype contrasts (Hap12 vs. Hap11) that RST1530A is really the tolerant allele [18]. The present study further validates this finding in a geng/japonica background: Hap7 varieties carrying RST1530A (e.g., Yanfeng47, Lindao20) display significantly higher rSFW and lower DLR than that of Hap1 varieties under 150 mM NaCl treatment. More importantly, using chromosome segment substitution lines and the FBP-LUZ transcriptional reporter system, we provide the first mechanistic evidence in geng/japonica: the RST1530A protein exhibits weaker repression of its target gene OsAS1 expression compared to RST1530G, resulting in higher up-regulation of OsAS1 under salt stress (Figure 5 and Figure 6). This likely promotes asparagine synthesis in nitrogen metabolism, alleviates excessive ammonium accumulation, and ultimately enhances ST [21]. Thus, RST1530A is a functionally conserved, mechanistically well-defined core ST allele across subspecies, making it a priority target for cross-subspecies breeding.
SKC1140A contributes a 23.8%–27.5% increase in rSFW in xian/indica [18] but only 16.5% in geng/japonica (Figure 3). Although significantly positive in both backgrounds, its effect is attenuated in geng/japonica. This may be attributed to the absence of the synergistic SKC1184H allele in the geng/japonica gene pool. It is proposed that the two amino acid substitutions (P140A and R184H) lie on different sides of a cytoplasm-exposed loop of the SKC1 protein and may exert additive effects on transport activity or phosphorylation status [40]. In xian/indica, ~31.6% of accessions carry both alleles and exhibit higher ST; in geng/japonica, SKC1184H is entirely missing, so SKC1140A acts alone and consequently less effectively. This again illustrates that ST is a polygenic trait, and the contribution of a single locus is conditioned by the presence of interacting partners in the genetic background.
The most striking discrepancy between our xian/indica and geng/japonica studies concerns OsWRKY53173G. In xian/indica, this allele confers a 38.6% improvement in rSFW [18] and the effect was shown to depend on the presence of SKC1140A and/or SKC1184H (Figure 5). In the present geng/japonica population, however, we did not detect a significant positive contribution of OsWRKY53173G to ST; instead, a slight negative trend was observed. Why does this happen? It is reported that OsWRKY53 acts as a transcriptional repressor that directly binds the SKC1 promoter and suppresses its expression [17]. Yet our haplotype comparisons and expression analyses in natural populations do not support a simple repression model; rather, a positive correlation was observed. A plausible explanation is that in genetic backgrounds already carrying SKC1140A/184H, OsWRKY53173G may, via feedback loops or interactions with other transcription factors, ultimately enhance SKC1 expression or function. In geng/japonica backgrounds that lack these SKC1 tolerant alleles (frequency of SKC1140A is only 3.7%, and SKC1184H is zero), this regulatory circuit fails to operate, and OsWRKY53173G might even impose a metabolic burden. Thus, the two studies together uncover an important epistatic network: the ST function of OsWRKY53173G depends on the prior existence of SKC1 tolerant alleles. This finding provides a clear example of why a gene effective in xian/indica may not be directly transferable to geng/japonica and emphasizes that genetic background must be carefully considered in breeding.
4.3. Origin of RST1530A: Introgression from Xian/Indica into Geng/Japonica
Pedigree analysis and SNP linkage markers demonstrate that the RST1530A allele in the geng/japonica varieties Yanfeng47 and Lindao20 is not endogenous to geng/japonica but was introgressed from the xian/indica variety Aijiaonante via a chromosomal segment. Several lines of evidence support this conclusion: (1) Aijiaonante, Yanfeng47 and Lindao20 share an identical combination of SNPs in the RST1 coding region, including the key G→A transition at position +1743 bp (RST1530A). (2) SNP markers located 30 Kb upstream (LOC_06g47100) and 38 Kb downstream (LOC_06g47220) of RST1 form the same haplotype in these three varieties, whereas the geng/japonica varieties Lindao10 and Nipponbare belong to a different haplotype, indicating that at least a 68 Kb chromosomal segment was introgressed. This finding has important breeding implications [46]. First, it demonstrates that xian/indica rice is a valuable donor reservoir for ST genes in geng/japonica. Second, Yanfeng47 and Lindao20, which have already acquired RST1530A through conventional crossing, exhibit good ST and can serve as direct donor parents for transferring this allele into other elite geng/japonica varieties. Third, the KASP markers we developed can efficiently track the introgressed segment, facilitating marker-assisted selection.
5. Conclusions
In this study, we investigated the distribution of nine ST associated SNPs from seven cloned genes in 215 geng/japonica varieties from the Huang-Huai-Hai region. Compared with our previous work in xian/indica rice, the geng/japonica population exhibits markedly lower frequencies of most tolerant alleles, with the exceptions of OsHKT2;377T and RST1611G. Functional assessment revealed that OsSTL1289S, OsHKT1;194K, RST1530A and SKC1140A significantly improve ST in geng/japonica, among which RST1530A contributes the most (57.1% increase in rSFW). Notably, OsWRKY53173G and OsSTG512S do not confer detectable benefits in the geng/japonica background, likely due to the absence of interacting SKC1 tolerant alleles. Mechanistically, we demonstrated that RST1530A enhances ST by more weakly repressing its target gene OsAS1 compared with RST1530G. Furthermore, we traced the origin of RST1530A in geng/japonica to a xian/indica donor (Aijiaonante) through a chromosomal segment of at least 68 Kb, as evidenced by pedigree and SNP linkage analyses. Collectively, this study provides a subspecies-specific evaluation of seven major ST genes, corrects the functional assignment of RST1530A, and identifies both a key tolerant allele and its carrier varieties (Yanfeng47, Lindao20) as practical resources for marker-assisted breeding of ST geng/japonica rice.
Supplementary Materials
The following supporting information can be downloaded at the website of this paper posted on Preprints.org. Supplementary Table S1: Distribution of ST Genes in 215 varieties of 3H Geng/Japonica Rice Population; Supplementary Table S2: KASP primers developed for SNP genotyping in this study; Supplementary Table S3: Primers used for qRT-PCR in this study.
Author Contributions
Conceptualization, H.L., and Z.C.; methodology, Y.C., R.Z., W.F., H.Z., and W.N.; data curation, Y.C., H.Z., W.F., and W.N.; project administration, H.L. and Z.C.; writing—original draft preparation, Y.C. and H.L.; writing—review and editing, Z.C.; funding acquisition, H.L., W.F., and Z.C. All authors have read and agreed to the published version of the manuscript.
Funding
This research was funded by the Innovation Team Project for Modern Agricultural Industrious Technology System of Shandong Province (SDAIT-17-06, SDAIT-17-11); the Hubei Agriculture Science and Technology Innovation Center Program (2025-620-000-001-030); the “Double Ten Project” (Major Technology Breakthrough Category) of Taian City (2025JSGG13); the Innovation and Entrepreneurship Talent Project (the “DaiZong Talent Program” of Tai’an City; DZRC 20250107); and the Large-scale Instrument and Equipment Sharing Foundation of Wuhan University.
Institutional Review Board Statement
Not applicable.
Informed Consent Statement
Not applicable.
Data Availability Statement
All data that support the findings in this study are available in this article and its supplementary files. The KASP genotyping data of 215 varieties are provided in Supplementary Table S1. KASP primers used for SNP genotyping are listed in Supplementary Table S2. The primers used for qRT-PCR are listed in Supplementary Table S3.
Acknowledgments
We thank Dr. Xinlian Liu and Dr. Qin Lu from the Core Facility of State Key Laboratory of Hybrid Rice, Wuhan University, for their assistance with the PathoScreen plant pathological phenotype measurement system. We thank Dr. Jian Zhang from China National Rice Research Institute for providing CSSL lines, and Prof. Hao Du from Zhejiang University for providing the FBP-LUZ system.
Conflicts of Interest
The authors declare no conflicts of interest.
Abbreviations
The following abbreviations are used in this manuscript:
| CSSL | Chromosome segment substitution line |
| DLR | Dead leaf rate |
| FBP | Fungal bioluminescence pathway |
| GWAS | Genome-wide association study |
| KASP | Kompetitive Allele Specific PCR |
| qRT-PCR | Quantitative real-time PCR |
| rSFW | Relative shoot fresh weight |
| SNP | Single nucleotide polymorphism |
| ST | Salt tolerance |
References
- Liu, X.; Li, Z.; Zhang, H.; Zhang, S.; Liu, W.; Yao, F.; Li, P. Evaluating Blast Resistance of Huang-Huai Geng/Japonica Varieties Using Intragenic Markers. Rice 2026, 19, 19. [Google Scholar] [CrossRef] [PubMed]
- Liu, P.; Feng, W.; Wang, T.; Zhang, H.; Mao, S.; Zhang, H.; Huang, W.; Liu, H.; Feng, S.; Chu, Z. Investigation of Imidazolinone Herbicide Resistance Gene with KASP Markers for Geng/Japonica Rice Varieties in the Huang-Huai-Hai Region of China. Plants 2024, 13, 1097. [Google Scholar] [CrossRef] [PubMed]
- Zhao, Y.; Xiao, D.; Bai, H.; Liu, D.; Tang, J.; Qi, Y.; Shen, Y. Climate Change Impact on Yield and Water Use of Rice–Wheat Rotation System in the Huang-Huai-Hai Plain, China. Biology 2022, 11, 1265. [Google Scholar] [CrossRef] [PubMed]
- Shi, W.; Wang, M.; Tao, F.; Xu, X.; Deng, X.; Liu, L.; Kong, X.; Zuo, L.; Lei, M.; Shi, X.; Wang, X. Wheat Redistribution in Huang-Huai-Hai, China, Could Reduce Groundwater Depletion and Environmental Footprints Without Compromising Production. Commun. Earth Env. 2024, 5, 380. [Google Scholar] [CrossRef]
- Shi, Y. Comprehensive Reclamation of Salt-Affected Soils in China’s Huang-Huai-Hai Plain. J. Sustain. Agric. 2003, 7, 163–179. [Google Scholar] [CrossRef]
- Liu, C.; Mao, B.; Yuan, D.; Chu, C.; Duan, M. Salt Tolerance in Rice: Physiological Responses and Molecular Mechanisms. Crop J. 2022, 10, 13–25. [Google Scholar] [CrossRef]
- Sackey, O. K.; Feng, N.; Mohammed, Y. Z.; Dzou, C. F.; Zheng, D.; Zhao, L.; Shen, X. A Comprehensive Review on Rice Responses and Tolerance to Salt Stress. Front. Plant Sci. 2025, 16, 1561280. [Google Scholar] [CrossRef] [PubMed]
- Marè, C.; Zampieri, E.; Cavallaro, V.; Frouin, J.; Grenier, C.; Courtois, B.; Brottier, L.; Tacconi, G.; Finocchiaro, F.; Serrat, X.; et al. Marker-Assisted Introgression of the Salinity Tolerance Locus Saltol in Temperate Japonica Rice. Rice 2023, 16, 2. [Google Scholar] [CrossRef]
- Ma, L.; Li, J.; Li, J.; Huo, Y.; Yang, Y.; Jiang, C.; Guo, Y. Plant Salt-Tolerance Mechanisms: Classic Signaling Pathways, Emerging Frontiers, and Future Perspectives. Mol. Plant 2026, 19, 538–570. [Google Scholar] [CrossRef] [PubMed]
- Yadav, A.K.; Kumar, A.; Grover, N.; Ellur, R.K.; Krishnan, S.G.; Bollindei, H.; Bhowmick, P.K.; Vinod, K.K.; Nagarajan, M.; Krishnamurthy, S.L.; Singh, A.K. Marker Aided Introgression of ‘Saltol’, A Major QTL For Seedling Stage Salinity Tolerance Into An Elite Basmati Rice Variety ‘Pusa Basmati 1509’. Sci. Rep. 2020, 10, 13877. [Google Scholar] [CrossRef] [PubMed]
- Liu, C.; Mao, B.; Yuan, D.; Chu, C.; Duan, M. Salt Tolerance in Rice: Physiological Responses and Molecular Mechanisms. Crop J. 2022, 10, 13–25. [Google Scholar] [CrossRef]
- Yuan, C.; Zhang, Y.; Zhao, M.; Ma, D. Integrated Phylogenomics and Expression Profiling of the Peptide Deformylase Gene Family in Oryza sativa Reveals Their Role in Development and Stress Tolerance. Curr. Issues Mol. Biol. 2026, 48, 396. [Google Scholar] [CrossRef] [PubMed]
- Ren, Z.; Gao, J.; Li, L.; Cai, X.; Huang, W.; Chao, D.; Zhu, M.; Wang, Z.; Luan, S.; Lin, H. A Rice Quantitative Trait Locus for Salt Tolerance Encodes a Sodium Transporter. Nat. Genet. 2005, 37, 1141–1146. [Google Scholar] [CrossRef] [PubMed]
- Kobayashi, N.I.; Yamaji, N.; Yamamoto, H.; Okubo, K.; Ueno, H.; Costa, A.; Tanoi, K.; Matsumura, H.; Fujii-Kashino, M.; Horiuchi, T.; et al. OsHKT1;5 Mediates Na+ Exclusion in The Vasculature to Protect Leaf Blades And Reproductive Tissues From Salt Toxicity in Rice. Plant J. 2017, 91, 657–670. [Google Scholar] [CrossRef] [PubMed]
- Li, C.; Guan, J.; Liang, W.H.; Yao, S.; He, L.; Wei, X.D.; Zhao, L.; Zhou, L.H.; Zhao, C.F.; Zhao, Q.Y.; et al. OsWRKY72 Enhances Salt Tolerance in Rice via SKC1-Mediated Na⁺ Regulation. Plant Stress 2025, 17, 100962. [Google Scholar] [CrossRef]
- Thomson, M.J.; de Ocampo, M.; Egdane, J.; Rahman, M.A.; Sajise, A.G.; Adorada, D.L.; Tumimbang-Raiz, E.; Blumwald, E.; Seraj, Z.I.; Singh, R.K.; Gregorio, G.B.; Ismail, A.M. Characterizing the Saltol Quantitative Trait Locus for Salinity Tolerance in Rice. Rice 2010, 3, 148–160. [Google Scholar] [CrossRef]
- Yu, J.; Zhu, C.; Xuan, W.; An, H.; Tian, Y.; Wang, B.; Chi, W.; Chen, G.; Ge, Y.; Li, J.; Dai, Z.; Liu, Y.; Sun, Z.; Xu, D.; Wang, C.; Wan, J. Genome-Wide Association Studies Identify OsWRKY53 as a Key Regulator of Salt Tolerance in Rice. Nat. Commun. 2023, 14, 3550. [Google Scholar] [CrossRef] [PubMed]
- Cheng, Y.; Wang, T.; Wen, Y.; Zheng, X.; Liu, H.; Chen, X.; Diao, Y.; Hu, Z.; Feng, W.; Chu, Z. Genetic Variation and Assessment of Seven Salt-Tolerance Genes in an Xian/indica Rice Population. Agronomy 2025, 15, 570. [Google Scholar] [CrossRef]
- Wei, H.; Wang, X.; Zhang, Z.; Yang, L.; Zhang, Q.; Li, Y.; He, H.; Chen, D.; Zhang, B.; Zheng, C.; et al. Uncovering Key Salt-Tolerant Regulators Through a Combined Eqtl and GWAS Analysis Using the Super Pan-Genome in Rice. Natl. Sci. Rev. 2024, 11, nwae043. [Google Scholar] [CrossRef] [PubMed]
- Deng, P.; Jing, W.; Cao, C.; Sun, M.; Chi, W.; Zhao, S.; Dai, J.; Shi, X.; Wu, Q.; Zhang, B.; et al. Transcriptional Repressor RST1 Controls Salt Tolerance and Grain Yield in Rice by Regulating Gene Expression of Asparagine Synthetase. Proc. Natl. Acad. Sci. USA 2022, 119, e2210338119. [Google Scholar] [CrossRef] [PubMed]
- Ohashi, M.; Ishiyama, K.; Kojima, S.; Konishi, N.; Nakano, K.; Kanno, K.; Hayakawa, T.; Yamaya, T. Asparagine Synthetase1, but not Asparagine Synthetase2, is Responsible for the Biosynthesis of Asparagine Following the Supply of Ammonium to Rice Roots. Plant Cell Physiol. 2015, 56, 769–778. [Google Scholar] [CrossRef] [PubMed]
- Mishra, S.; Singh, B.; Panda, K.; Singh, B.P.; Singh, N.; Misra, P.; Rai, V.; Singh, N.K. Association of SNP Haplotypes of HKT Family Genes with Salt Tolerance in Indian Wild Rice Germplasm. Rice 2016, 9, 15. [Google Scholar] [CrossRef] [PubMed]
- Lv, Y.; Ma, J.; Wei, H.; Xiao, F.; Wang, Y.; Jahan, N.; Hazman, M.; Qian, Q.; Shang, L.; Guo, L. Combining GWAS, Genome-Wide Domestication and a Transcriptomic Analysis Reveals the Loci and Natural Alleles of Salt Tolerance in Rice (Oryza sativa L.). Front. Plant Sci. 2022, 13, 912637. [Google Scholar] [CrossRef] [PubMed]
- Imran, S.; Ono, S.; Horie, R.; Katsuhara, M.; Horie, T. Chloride-Transporting OsHKT1;1 Splice Variants and Their Expression Profiles Under Salinity Stress in Rice. Int. J. Mol. Sci. 2026, 27, 1178. [Google Scholar] [CrossRef] [PubMed]
- Yuan, J.; Wang, X.; Zhao, Y.; Khan, N.U.; Zhao, Z.; Zhang, Y.; Wen, X.; Tang, F.; Wang, F.; Li, Z. Genetic Basis and Identification of Candidate Genes for Salt Tolerance in Rice by GWAS. Sci. Rep. 2020, 10, 9958. [Google Scholar] [CrossRef] [PubMed]
- Rafalski, A. Applications of Single Nucleotide Polymorphisms in Crop Genetics. Curr. Opin. Plant Biol. 2002, 5, 94–100. [Google Scholar] [CrossRef] [PubMed]
- Chen, X.; Ren, Y.; Dong, H.; Jiang, X.; Zheng, X.; Duan, E.; Teng, X.; Wang, Y.; Gu, C.; Chen, R.; et al. Natural Variation in Ostps8 Confers Differential Regulation of Chalkiness and Seed Vigor in Indica and Japonica Rice. Nat. Genet. 2026, 58, 206–217. [Google Scholar] [CrossRef] [PubMed]
- Aycan, M. Salinity Stress in Rice: Mechanisms and Molecular Approaches to Mitigation. Planta 2026, 263, 82. [Google Scholar] [CrossRef]
- Fan, W.; Raza, A.; Zhu, Q.; Wang, Q.; Ren, Q.; Liu, M.; Wang, S.; Hassan, M. A. Regulatory Networks and Molecular Mechanisms Underlying Salt Stress Tolerance in Rice. Front. Plant Sci. 2026, 17, 1757448. [Google Scholar] [CrossRef] [PubMed]
- Dipta, B.; Sood, S.; Mangal, V.; Bhardwaj, V.; Thakur, A.K.; Kumar, V.; Singh, B. KASP: A High-Throughput Genotyping System and Its Applications in Major Crop Plants for Biotic and Abiotic Stress Tolerance. Mol. Biol. Rep. 2024, 51, 508. [Google Scholar] [CrossRef]
- Tamura, K.; Stecher, G.; Kumar, S. MEGA11: Molecular Evolutionary Genetics Analysis Version 11. Mol. Biol. Evol. 2021, 38, 3022–3027. [Google Scholar] [CrossRef] [PubMed]
- Zhu, C.; Song, J.; Bai, T.; Wang, N.; Ma, S.; Pu, Z.; Dong, Y.; Lü, J.; Li, J.; Tian, R.; Luo, C.; Zhang, Y.; Ma, T.; Li, P.; Tian, L. Effects of Nacl Stress on The Chlorophyll Fluorescence Characteristics of Seedlings of Japonica Rice Germplasm with Different Salt Tolerances. Sci. Agric. Sin. 2022, 55, 2509–2525. [Google Scholar] [CrossRef]
- Wang, K.; Zhu, J.; Xu, X.; Li, T.; Wang, X.; Warner, T. A.; Cheng, T.; Zhu, Y.; Cao, W.; Yao, X.; Zhang, Z. Quantitative Monitoring of Salt Stress in Rice with Solar-Induced Chlorophyll Fluorescence. Eur. J. Agron. 2023, 148, 126954. [Google Scholar] [CrossRef]
- Bi, Y.; Yu, Y.; Mao, S.; Wu, T.; Wang, T.; Zhou, Y.; Xie, K.; Zhang, H.; Liu, L.; Chu, Z. Comparative Transcriptomic Profiling of the Two-Stage Response of Rice to Xanthomonas oryzae pv. oryzicola Interaction with Two Different Pathogenic Strains. BMC Plant Biol. 2024, 24, 347. [Google Scholar] [CrossRef] [PubMed]
- Kotlobay, A.A.; Sarkisyan, K.S.; Mokrushina, Y.A.; Marcet-Houben, M.; Serebrovskaya, E.O.; Markina, N.M.; Somermeyer, L.G.; Gorokhovatsky, A.Y.; Vvedensky, A.; Purtov, K.V.; et al. Genetically Encodable Bioluminescent System from Fungi. Proc. Natl. Acad. Sci. U.S.A. 2018, 115, 12728–12732. [Google Scholar] [CrossRef] [PubMed]
- Sun, S.; Ni, Q.; Luo, D.; Wang, T.; Lang, X.; Du, H. Development of an FBP-Based Bioluminescence Reporter System for Investigating Transcriptional Regulation in Plants. Plant Commun. 2025, 6, 101143. [Google Scholar] [CrossRef]
- Zheng, P.; Ge, J.; Ji, J.; Zhong, J.; Chen, H.; Luo, D.; Li, W.; Bi, B.; Ma, Y.; Tong, W.; et al. Metabolic Engineering and Mechanical Investigation of Enhanced Plant Autoluminescence. Plant Biotechnol. J. 2023, 21, 1671–1681. [Google Scholar] [CrossRef] [PubMed]
- Shakhova, E.S.; Karataeva, T.A.; Markina, N.M.; Mitiouchkina, T.; Palkina, K.A.; Perfilov, M.M.; Wood, M.G.; Hoang, T.T.; Hall, M.P.; Fakhruranova, L.I.; et al. An Improved Pathway for Autonomous Bioluminescence Imaging in Eukaryotes. Nat. Methods 2024, 21, 406–410. [Google Scholar] [CrossRef] [PubMed]
- Li, S.; Feng, T.; Zhang, C.; Zhang, F.; Li, H.; Chen, Y.; Liang, L.; Zhang, C.; Zeng, W.; Liu, E.; et al. Genetic Dissection of Salt Tolerance and Yield Traits of Geng (japonica) Rice by Selective Subspecific Introgression. Curr. Issues Mol. Biol. 2023, 45, 4796–4813. [Google Scholar] [CrossRef] [PubMed]
- Negrão, S.; Cecília Almadanim, M.; Pires, I.S.; Abreu, I.A.; Maroco, J.; Courtois, B.; Gregorio, G.B.; McNally, K.L.; Margarida Oliveira, M. New Allelic Variants Found in Key Rice Salt-Tolerance Genes: An Association Study. Plant Biotechnol. J. 2013, 11, 87–100. [Google Scholar] [CrossRef] [PubMed]
- Campbell, M. T.; Bandillo, N.; Al Shiblawi, F. R. A.; Sharma, S.; Liu, K.; Du, Q.; Schmitz, A. J.; Zhang, C.; Véry, A.-A.; Lorenz, A. J.; Walia, H. Allelic Variants of OsHKT1;1 Underlie the Divergence between Indica and Japonica Subspecies of Rice (Oryza sativa) for Root Sodium Content. PLoS Genet. 2017, 13, e1006823. [Google Scholar] [CrossRef] [PubMed]
- Li, J.; Huang, F.; Jiang, Y.; Rao, J.; Fan, Y.; Yang, J. Effect Analysis of S5-Interacting Genes on Rice Hybrid Sterility Using Nontransgenic Gamete Killer. Plant Sci. 2025, 352, 112357. [Google Scholar] [CrossRef] [PubMed]
- Min, M. H.; Maung, T. Z.; Cao, Y.; Phitaktansakul, R.; Lee, G. S.; Chu, S. H.; Kim, K. W.; Park, Y. J. Haplotype Analysis of BADH1 by Next-Generation Sequencing Reveals Association with Salt Tolerance in Rice during Domestication. Int. J. Mol. Sci. 2021, 22, 7578. [Google Scholar] [CrossRef] [PubMed]
- Chen, J.; Ding, J.; Ouyang, Y.; Du, H.; Yang, J.; Cheng, K.; Zhao, J.; Qiu, S.; Zhang, X.; Yao, J.; et al. A Triallelic System of S5 Is a Major Regulator of the Reproductive Barrier and Compatibility of Indica–Japonica Hybrids in Rice. Proc. Natl. Acad. Sci. U.S.A. 2008, 105, 11436–11441. [Google Scholar] [CrossRef]
- Wang, Z.; Cheng, J.; Chen, Z.; Huang, J.; Bao, Y.; Wang, J.; Zhang, H. Identification of QTLs with Main, Epistatic and QTL × Environment Interaction Effects for Salt Tolerance in Rice Seedlings under Different Salinity Conditions. Theor. Appl. Genet. 2012, 125, 807–815. [Google Scholar] [CrossRef] [PubMed]
- Ouyang, Y.; Zhang, Q. Understanding Reproductive Isolation Based on the Rice Model. Annu. Rev. Plant Biol. 2013, 64, 111–135. [Google Scholar] [CrossRef]
Figure 1.
The genotyping maps of nine SNP loci based on KASP. A-I indicate the SNPs conforming to OsSTG5I12S (A), SKC1P140A (B), SKC1R184H (C), OsHKT1;1L94K (D), OsHKT2;3I77T (E), OsWRKY53A173G (F), OsSTL1P289S (G), RST1G530A (H) and RST1E611G (I), respectively. The fluorescence value on the horizontal axis represents HEX, and the fluorescence value on the vertical axis represents FAM. The orange dot indicates that a certain variety is classified as salt-tolerant at this SNP locus, the blue dot indicates that a certain variety is classified as salt-sensitive at this SNP locus, and the gray dot indicates a blank control or that this SNP of a certain variety has not been detected.
Figure 1.
The genotyping maps of nine SNP loci based on KASP. A-I indicate the SNPs conforming to OsSTG5I12S (A), SKC1P140A (B), SKC1R184H (C), OsHKT1;1L94K (D), OsHKT2;3I77T (E), OsWRKY53A173G (F), OsSTL1P289S (G), RST1G530A (H) and RST1E611G (I), respectively. The fluorescence value on the horizontal axis represents HEX, and the fluorescence value on the vertical axis represents FAM. The orange dot indicates that a certain variety is classified as salt-tolerant at this SNP locus, the blue dot indicates that a certain variety is classified as salt-sensitive at this SNP locus, and the gray dot indicates a blank control or that this SNP of a certain variety has not been detected.
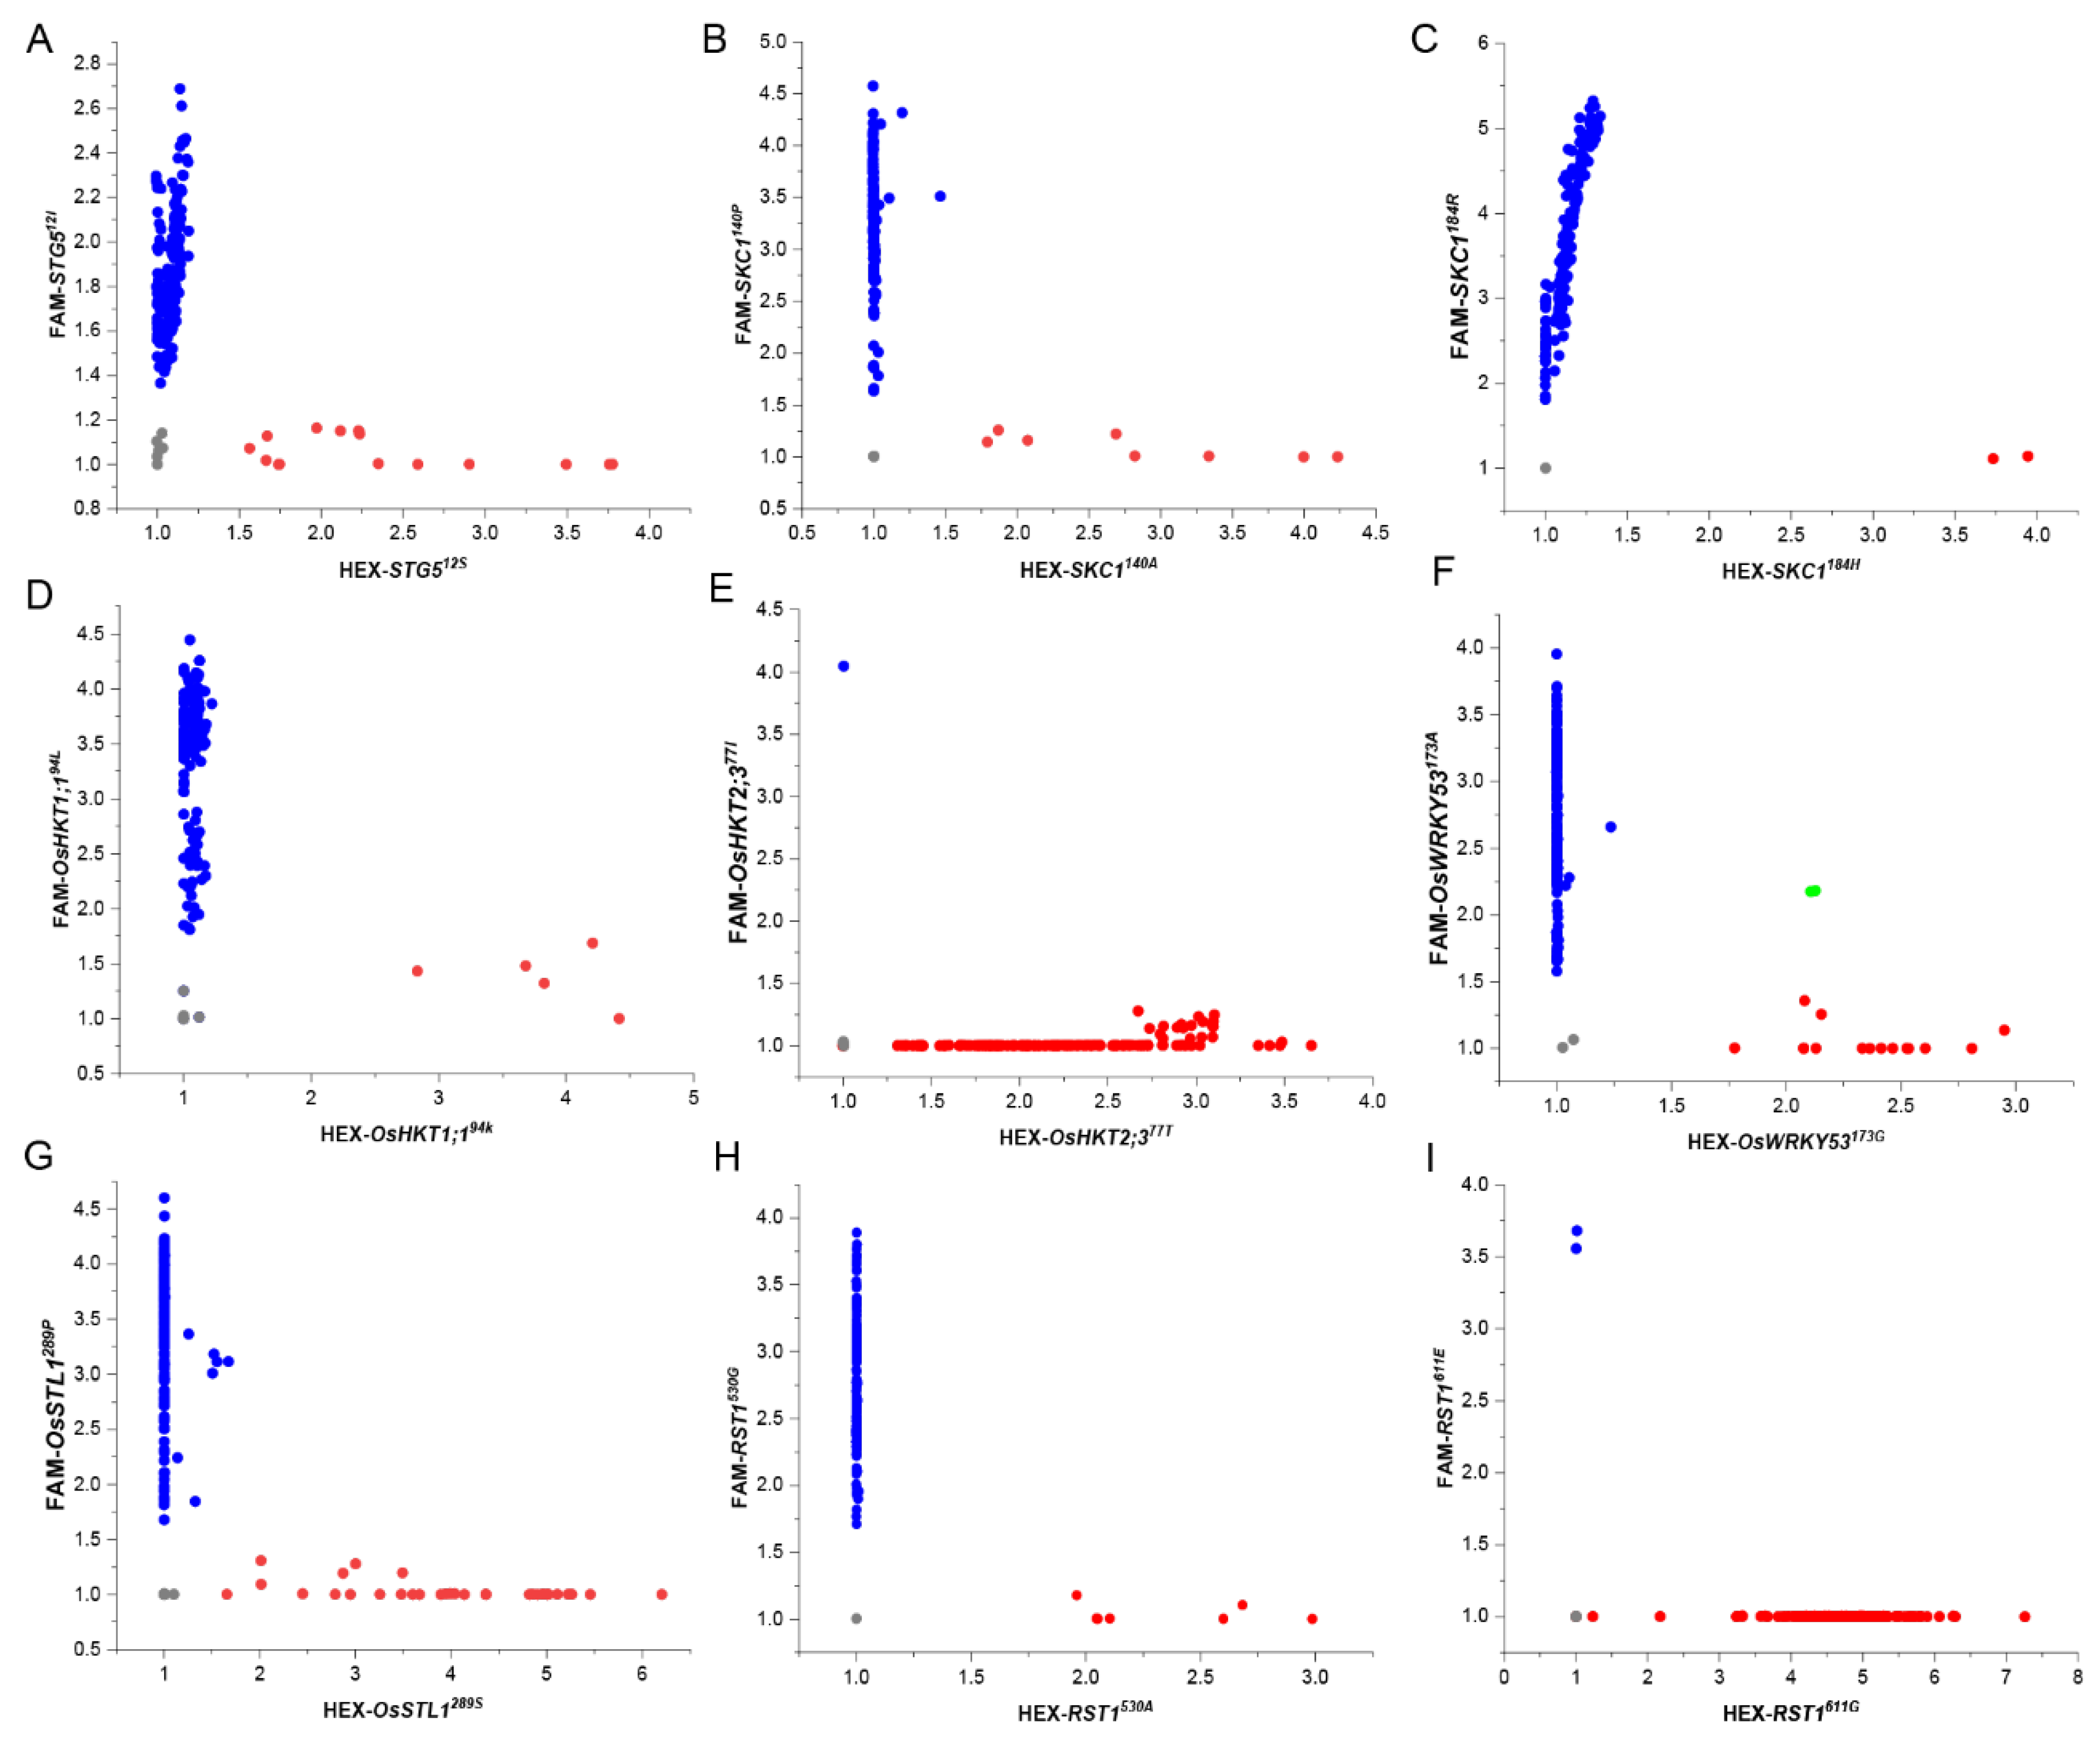
Figure 2.
The figure shows the distribution of ST-associated SNP genotypes in the geng/japonica rice population of the Huang-Huai-Hai rice region. The left evolutionary branch represents the genetic distance between each haplotype, and the right side shows the specific genotypes of each SNP locus and the number of varieties included for each haplotype. The salt-tolerance SNP genotypes were marked in red.
Figure 2.
The figure shows the distribution of ST-associated SNP genotypes in the geng/japonica rice population of the Huang-Huai-Hai rice region. The left evolutionary branch represents the genetic distance between each haplotype, and the right side shows the specific genotypes of each SNP locus and the number of varieties included for each haplotype. The salt-tolerance SNP genotypes were marked in red.
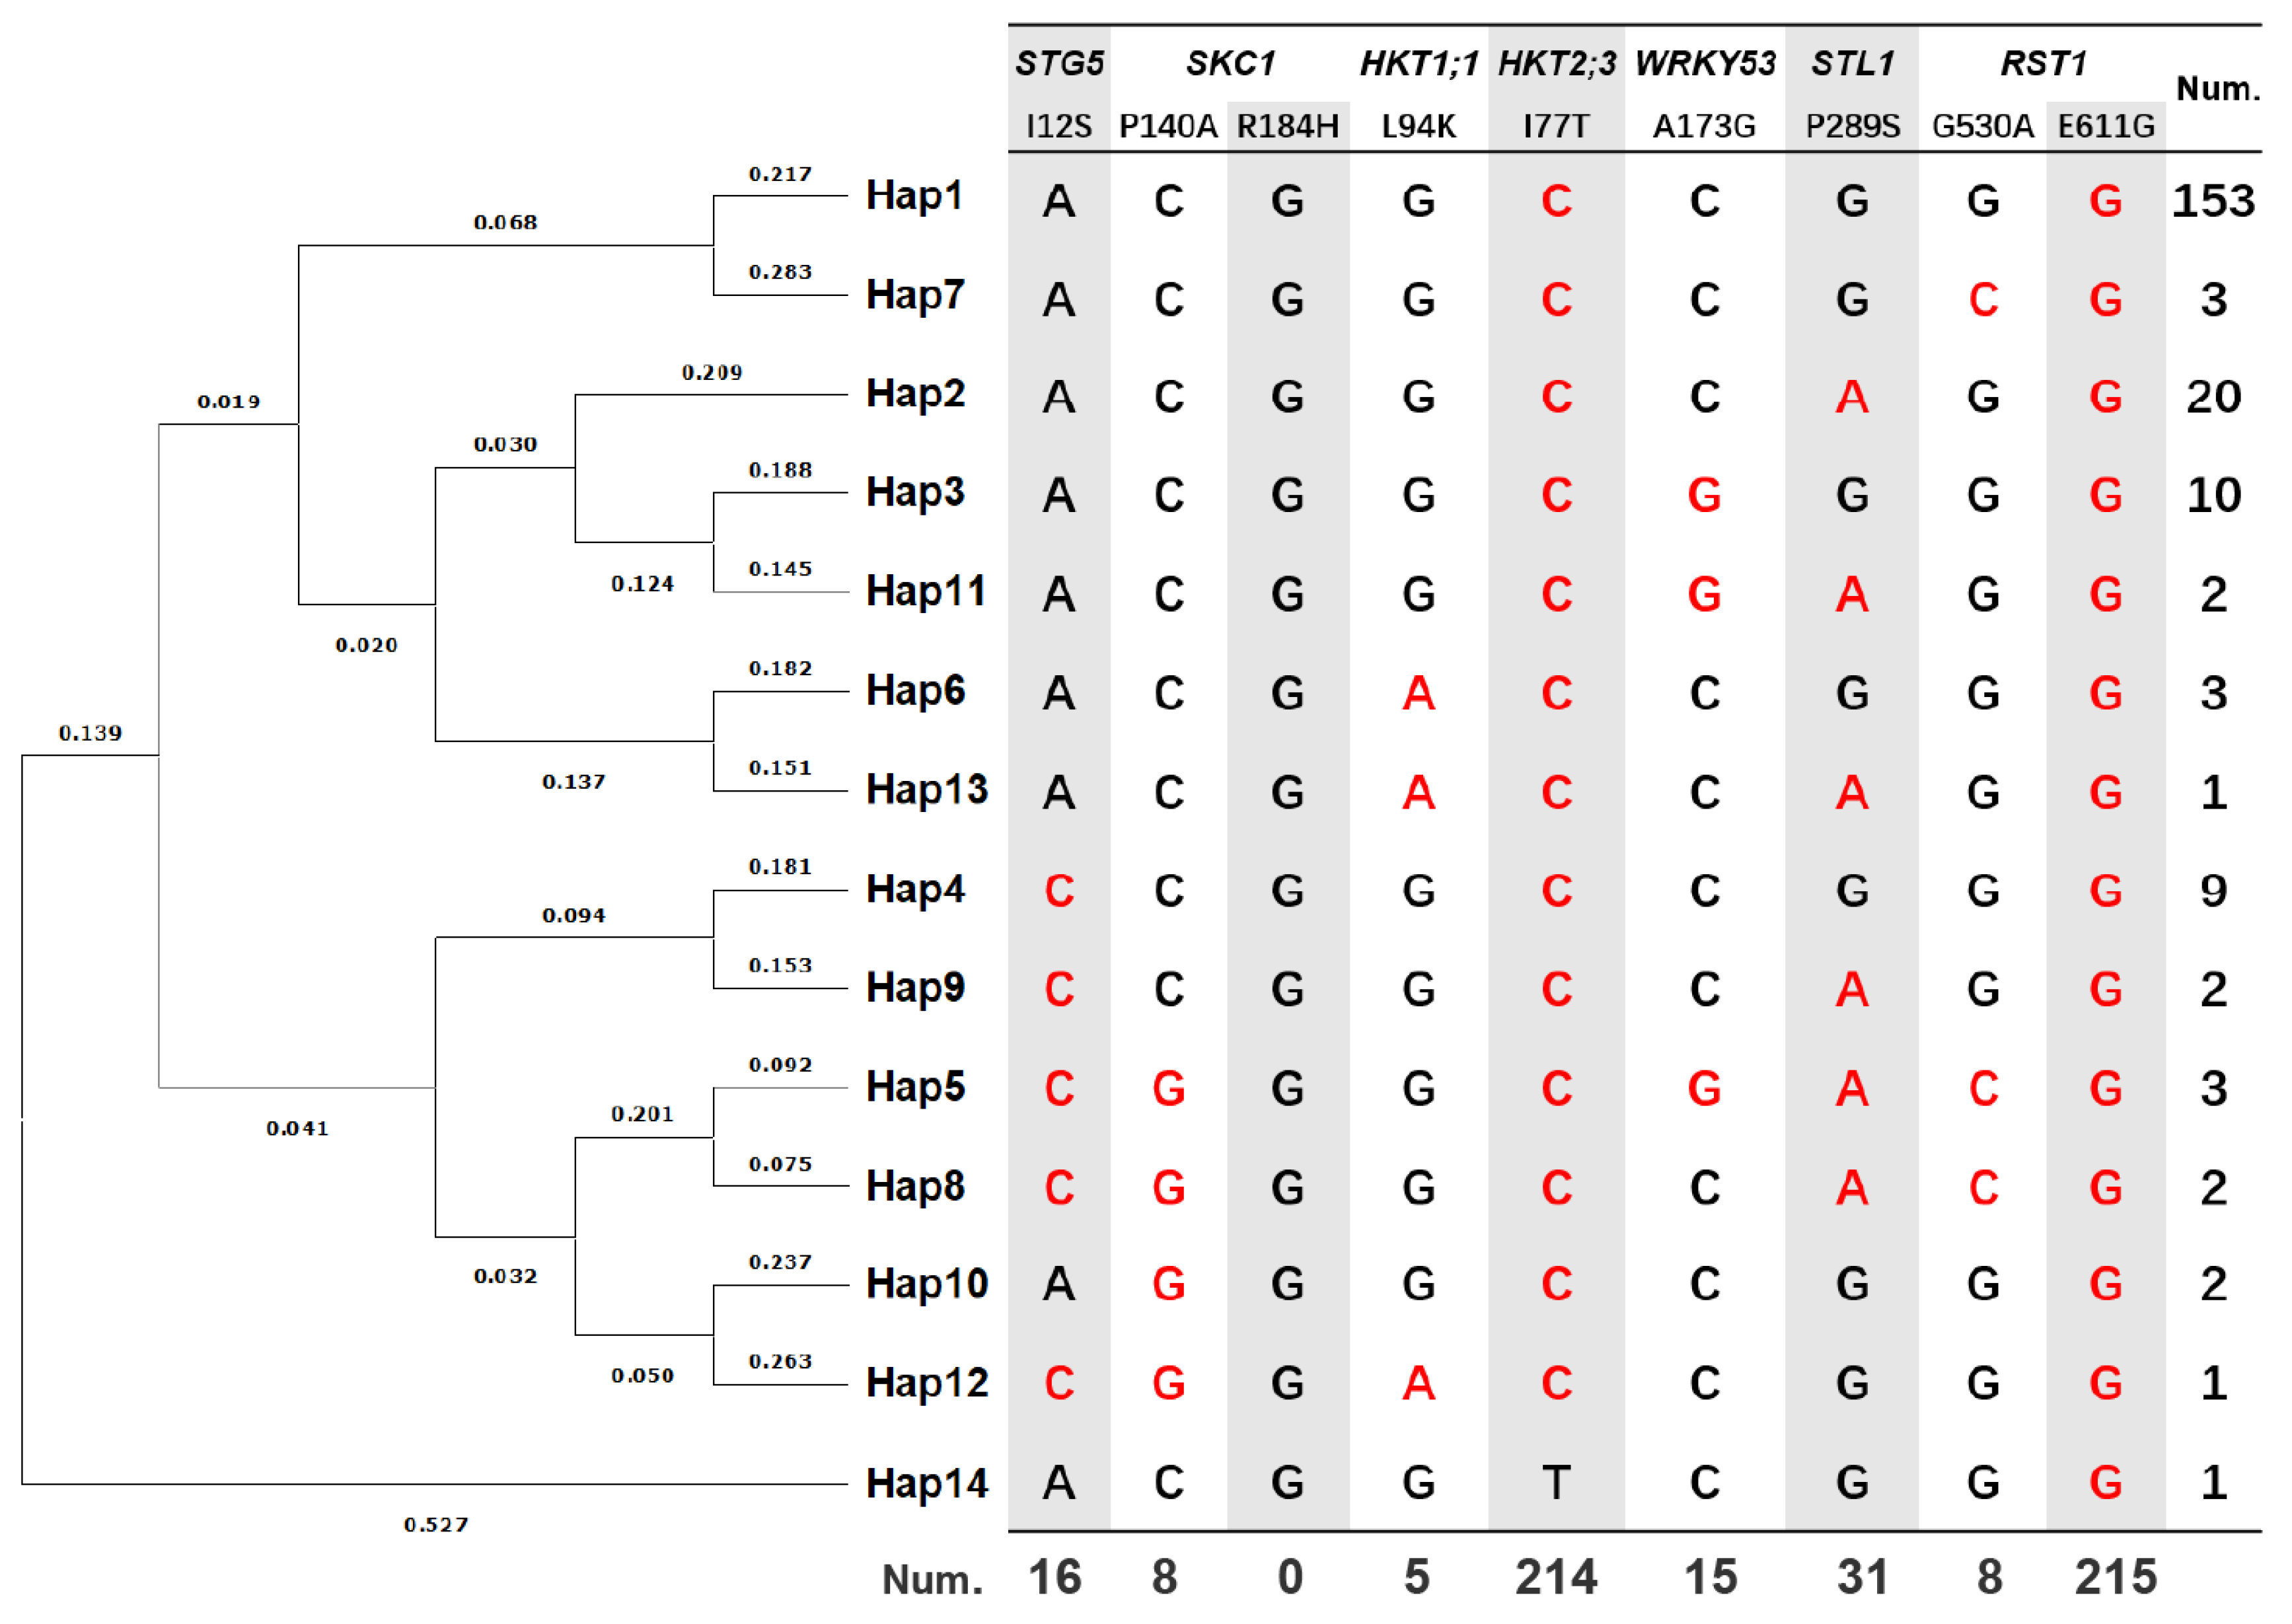
Figure 3.
Functional assessment of ST-related genes in the geng/japonica rice population. (A-F) Images for evaluation of relative ST for Haps containing OsSTL1289S, OsWRKY53173G, OsSTG512S, OsHKT1;194K, RST1530A, and SKC1140A. Seedlings in the control group grew normally in the nutrient solution, while those in the treated group were grown in the nutrient solution supplemented with 150 mM NaCl for 7 days and then rewatered for 5 days. The scale bar represents 10 cm. N1 and N2 indicate the number of Hap1 and compared Haps used in the experiment, respectively. (G) Statistical analysis of ST level assessment of Haps compared with Hap1. n represents the number of individual plants statistically analyzed for the corresponding haplotype. The statistical method was a two-tailed t-test for independent samples.
Figure 3.
Functional assessment of ST-related genes in the geng/japonica rice population. (A-F) Images for evaluation of relative ST for Haps containing OsSTL1289S, OsWRKY53173G, OsSTG512S, OsHKT1;194K, RST1530A, and SKC1140A. Seedlings in the control group grew normally in the nutrient solution, while those in the treated group were grown in the nutrient solution supplemented with 150 mM NaCl for 7 days and then rewatered for 5 days. The scale bar represents 10 cm. N1 and N2 indicate the number of Hap1 and compared Haps used in the experiment, respectively. (G) Statistical analysis of ST level assessment of Haps compared with Hap1. n represents the number of individual plants statistically analyzed for the corresponding haplotype. The statistical method was a two-tailed t-test for independent samples.
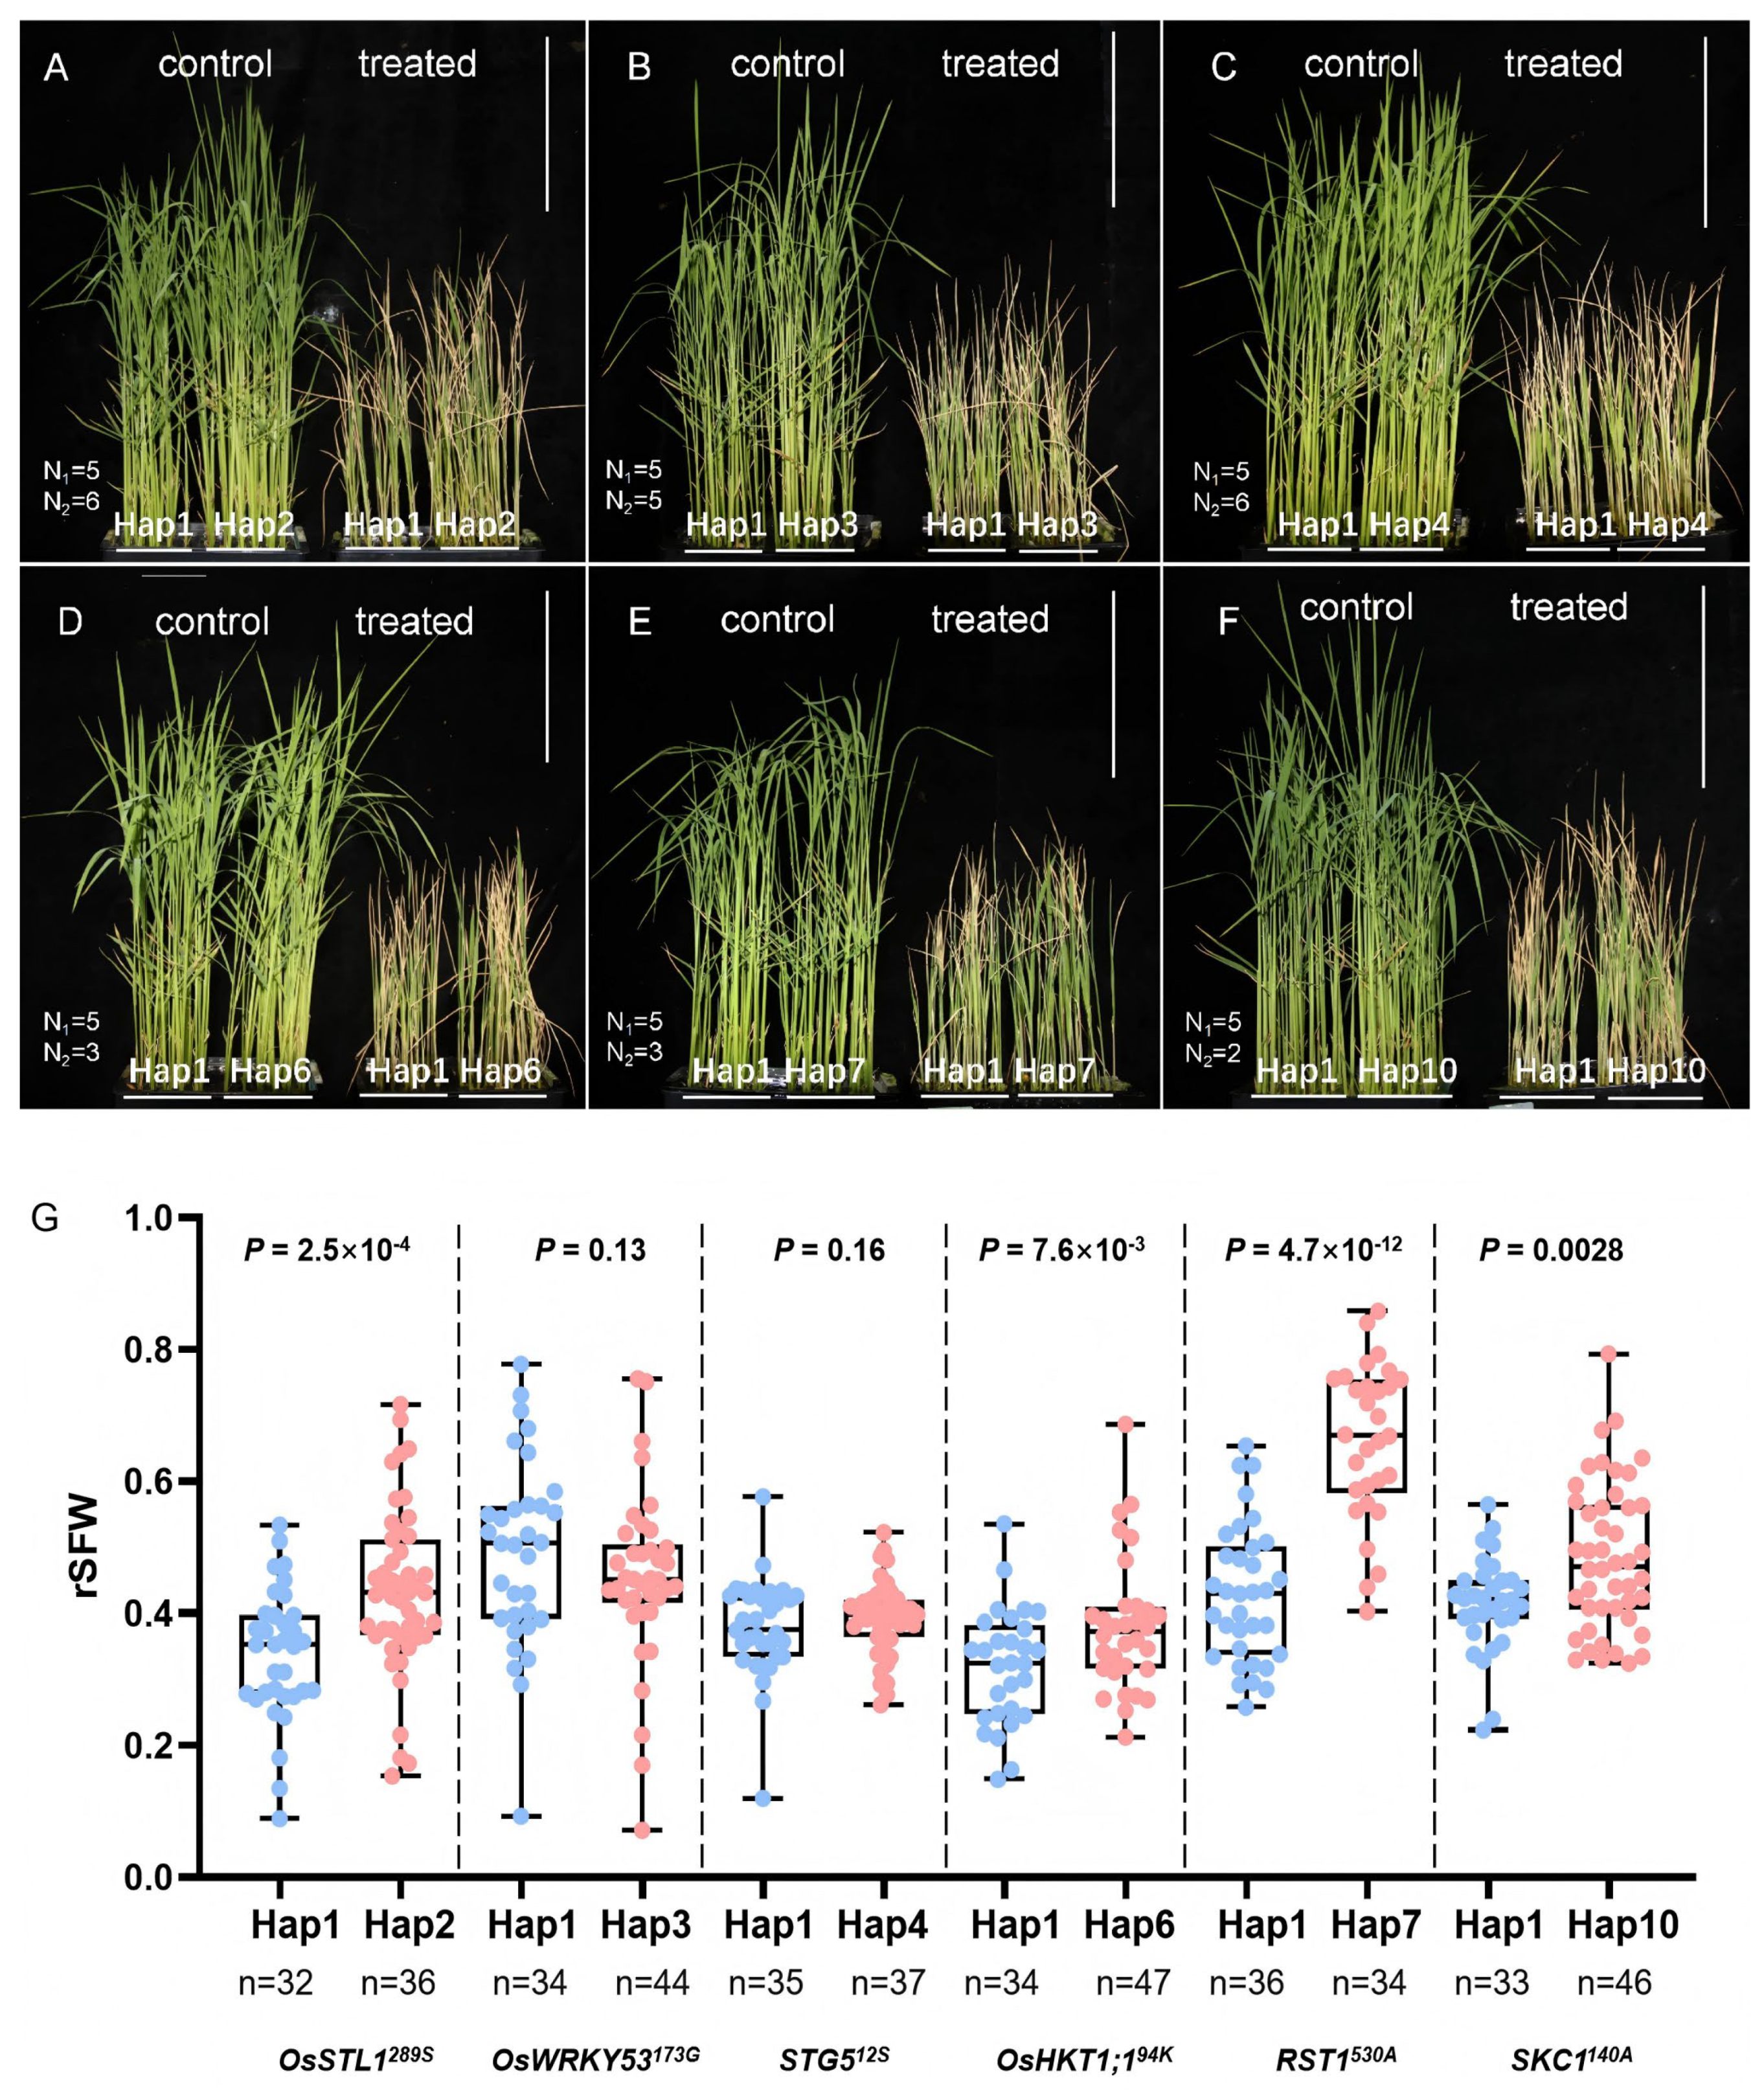
Figure 4.
Assessment of the relative ST and transcription level of OsAS1 between Hap7 and Hap1. (A) The phenotype of Hap7 and Hap1 in control group and salt-treated group. The scale bar represents 5 cm. (B, C) The comparison of rSFW (B) and DLR (C) between Hap7 and Hap1. (D, E) The relative expression level of RST1 (D) and OsAS1 (E) between varieties in Hap7 and Hap1 in control group and salt-treated group. The statistical method was a two-tailed t-test for independent samples.
Figure 4.
Assessment of the relative ST and transcription level of OsAS1 between Hap7 and Hap1. (A) The phenotype of Hap7 and Hap1 in control group and salt-treated group. The scale bar represents 5 cm. (B, C) The comparison of rSFW (B) and DLR (C) between Hap7 and Hap1. (D, E) The relative expression level of RST1 (D) and OsAS1 (E) between varieties in Hap7 and Hap1 in control group and salt-treated group. The statistical method was a two-tailed t-test for independent samples.
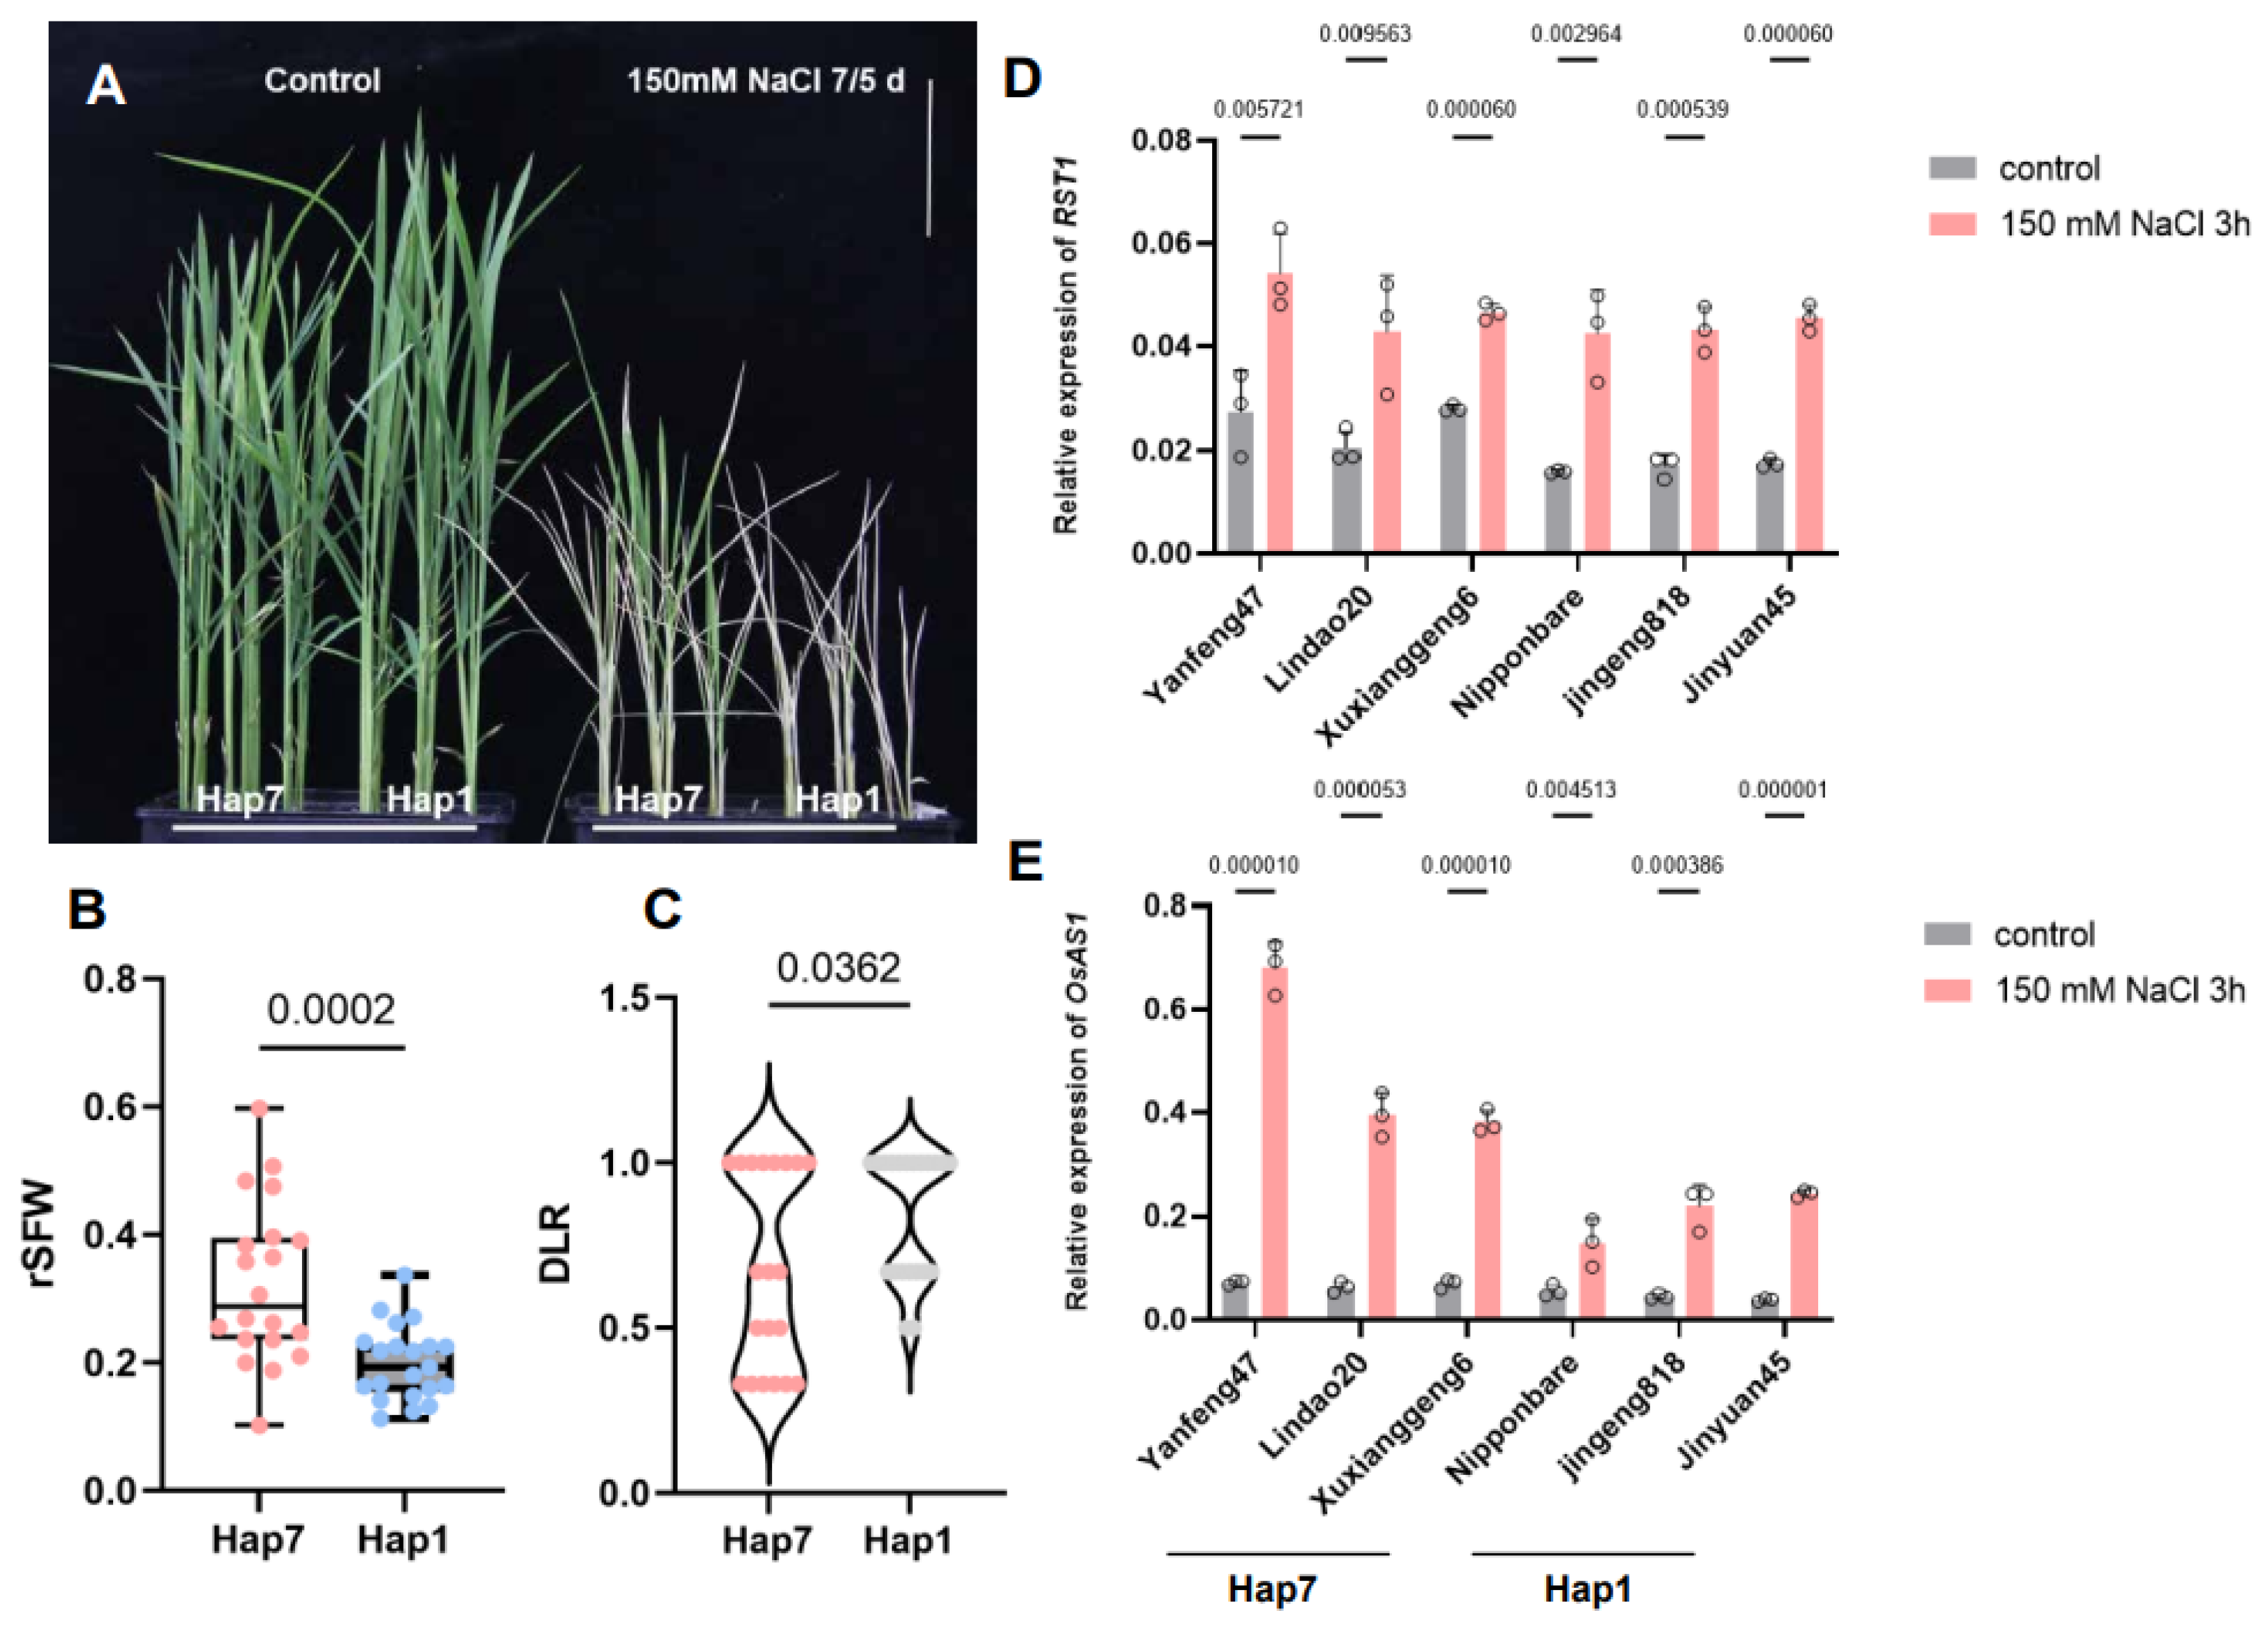
Figure 5.
A chromosome segment substitution line of RST1530G impaired the ST as well as increased the repression of salt-induced OsAS1 expression. (A, B) The growth performance of HHZ and HHZ-CSSL6JZ2 before treatment with salt stress (A) and after being treated with 150 mM NaCl for 7 d (B). The scale bar represents 5 cm. (C-E) The rSFW (C), DLR (D) and rFv/Fm comparison between HHZ and HHZ-CSSL6JZ2. (F, G) The relative expression of RST1 (F) and OsAS1 (G) was quantified for HHZ and HHZ-CSSL6JZ2 respectively at 0 h, 3 h, and 24 h post salt treatment. The statistical method was a two-tailed independent-samples t-test for Figure 5C-5G.
Figure 5.
A chromosome segment substitution line of RST1530G impaired the ST as well as increased the repression of salt-induced OsAS1 expression. (A, B) The growth performance of HHZ and HHZ-CSSL6JZ2 before treatment with salt stress (A) and after being treated with 150 mM NaCl for 7 d (B). The scale bar represents 5 cm. (C-E) The rSFW (C), DLR (D) and rFv/Fm comparison between HHZ and HHZ-CSSL6JZ2. (F, G) The relative expression of RST1 (F) and OsAS1 (G) was quantified for HHZ and HHZ-CSSL6JZ2 respectively at 0 h, 3 h, and 24 h post salt treatment. The statistical method was a two-tailed independent-samples t-test for Figure 5C-5G.
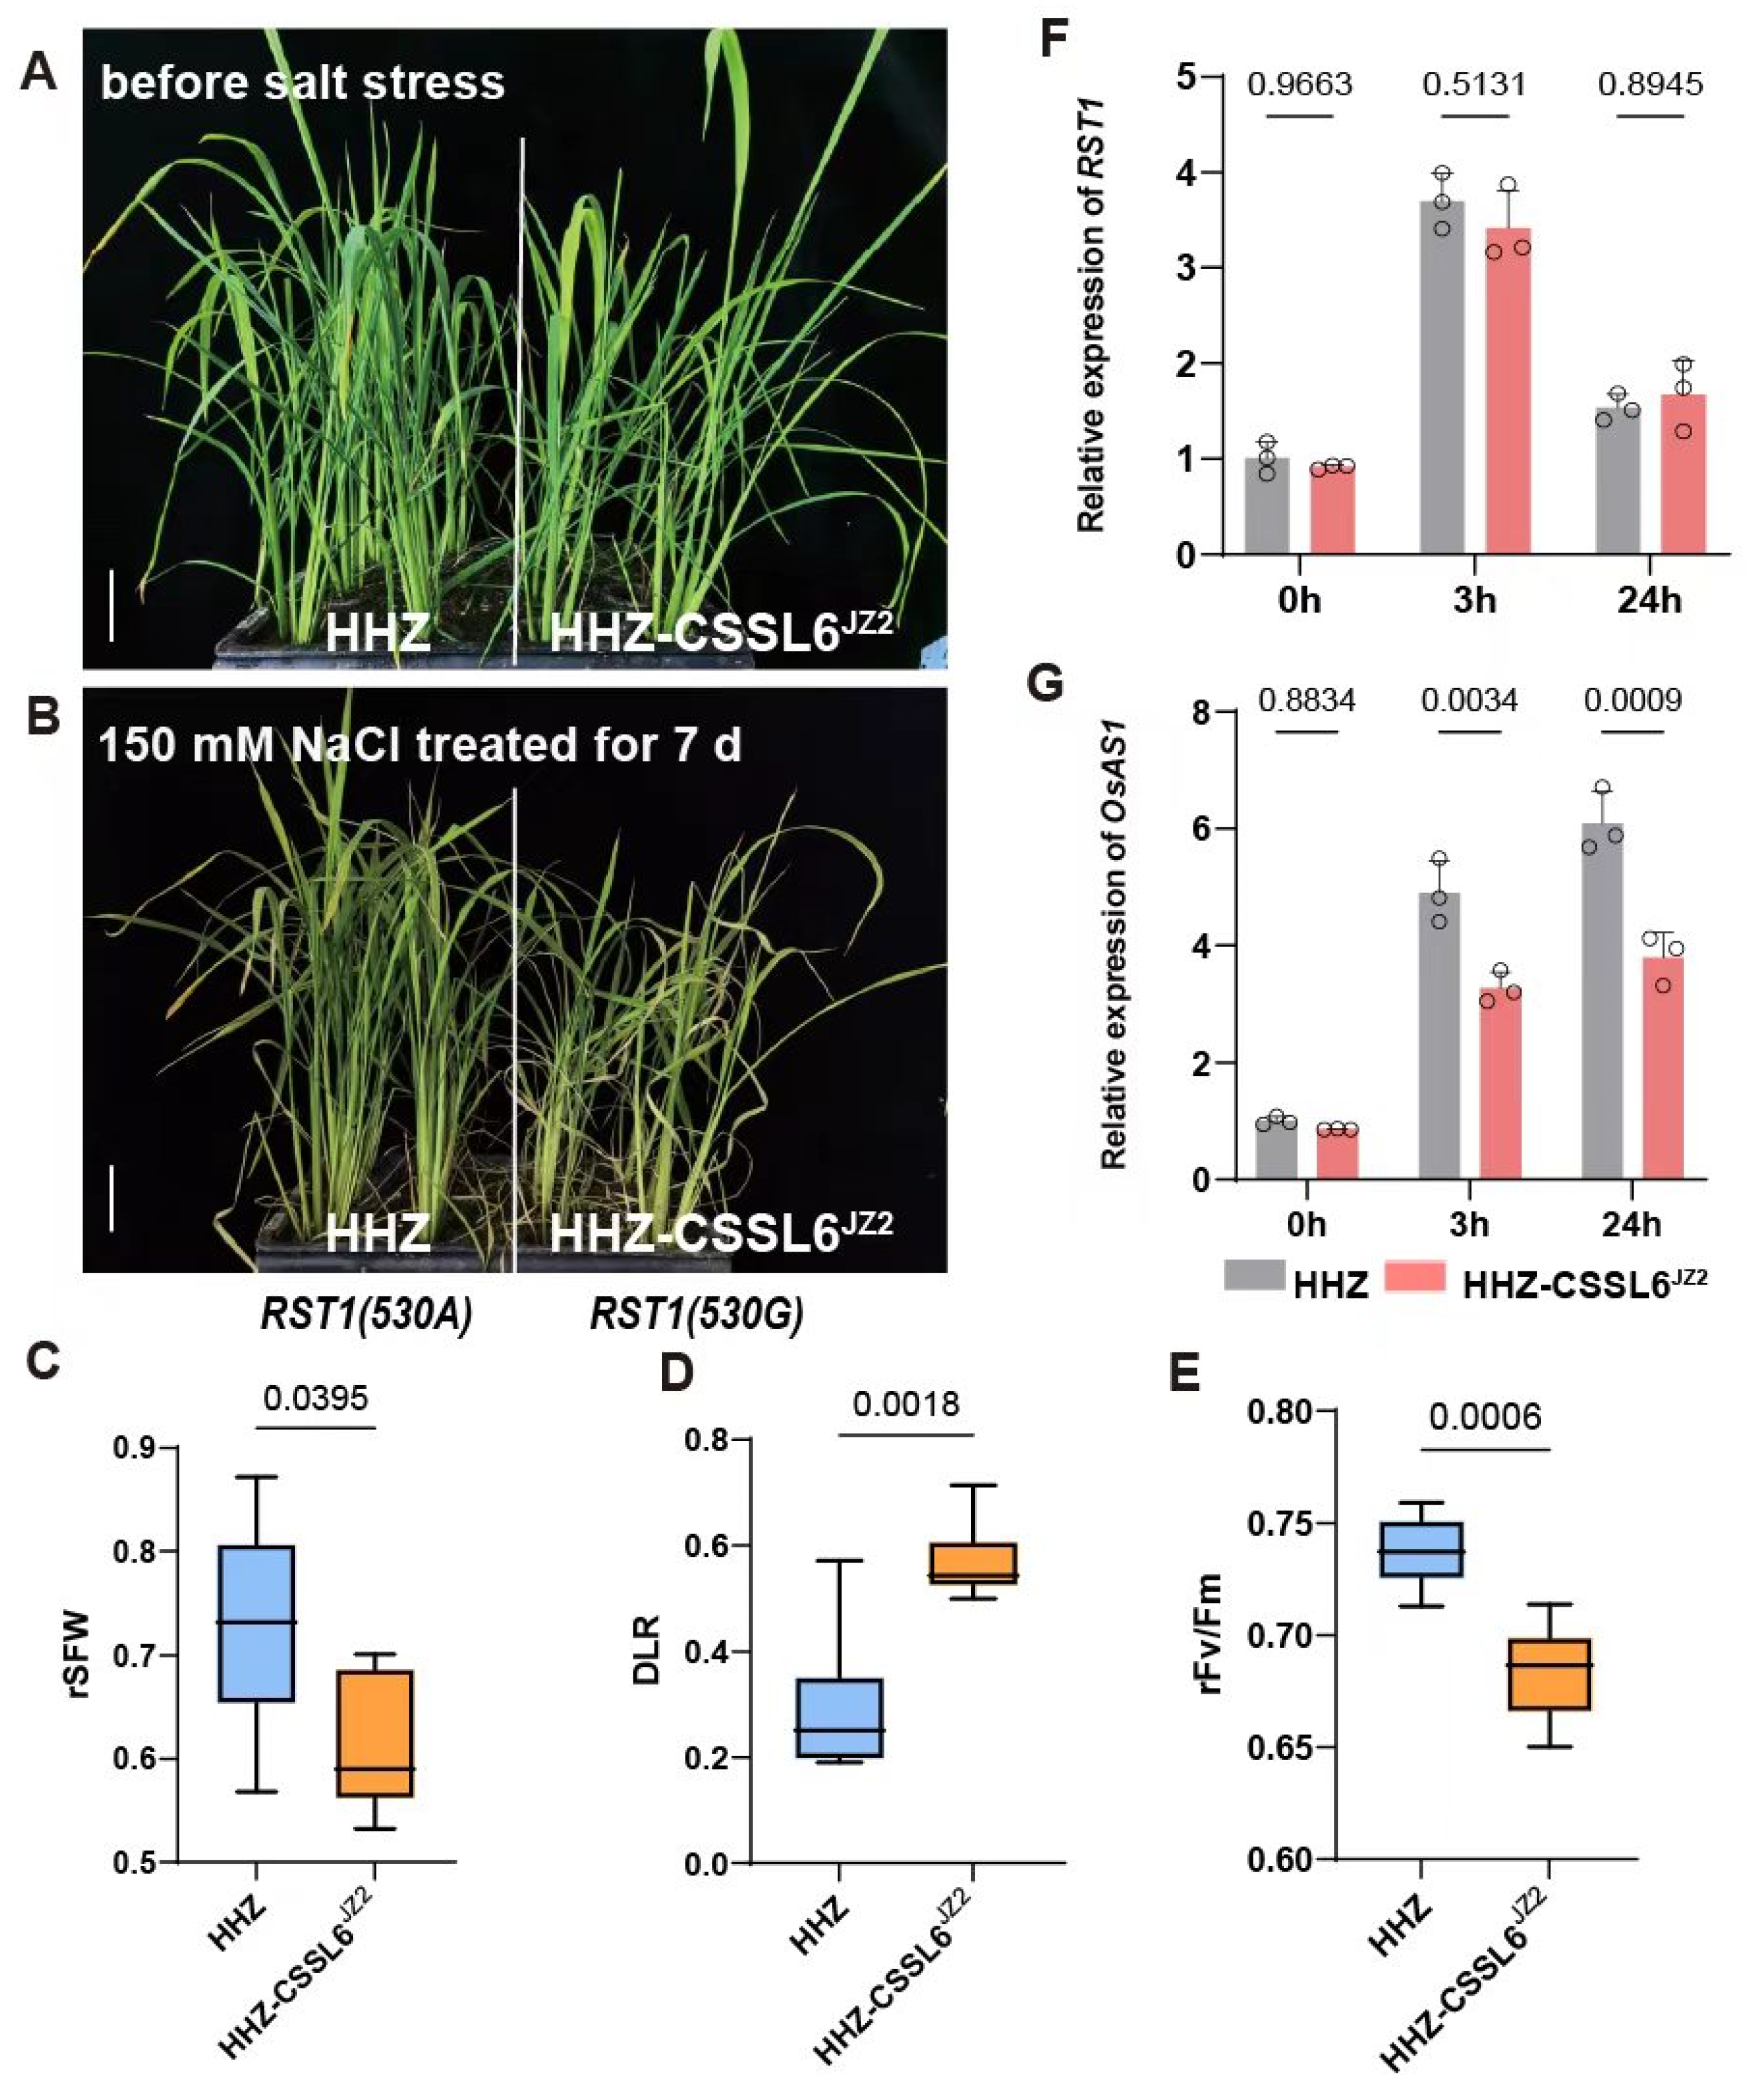
Figure 6.
The FBP-LUZ-based assay revealed that RST1530A impaired the repression of salt-induced OsAS1 expression. (A, B) Luciferase detection in pAS1:LUZ, RST1530G+pAS1:LUZ, RST1530A+pAS1:LUZ, and JAMYB+pAGO18:LUZ without (A) and with (B) salt treatment. (C, D) Luciferase deviation of pAS1:LUZ, RST1530G+pAS1:LUZ, RST1530A+pAS1:LUZ, and JAMYB+pAGO18:LUZ without (C) and with (D) salt treatment. The statistical method used was one-way ANOVA in Figure 6C and 6D.
Figure 6.
The FBP-LUZ-based assay revealed that RST1530A impaired the repression of salt-induced OsAS1 expression. (A, B) Luciferase detection in pAS1:LUZ, RST1530G+pAS1:LUZ, RST1530A+pAS1:LUZ, and JAMYB+pAGO18:LUZ without (A) and with (B) salt treatment. (C, D) Luciferase deviation of pAS1:LUZ, RST1530G+pAS1:LUZ, RST1530A+pAS1:LUZ, and JAMYB+pAGO18:LUZ without (C) and with (D) salt treatment. The statistical method used was one-way ANOVA in Figure 6C and 6D.
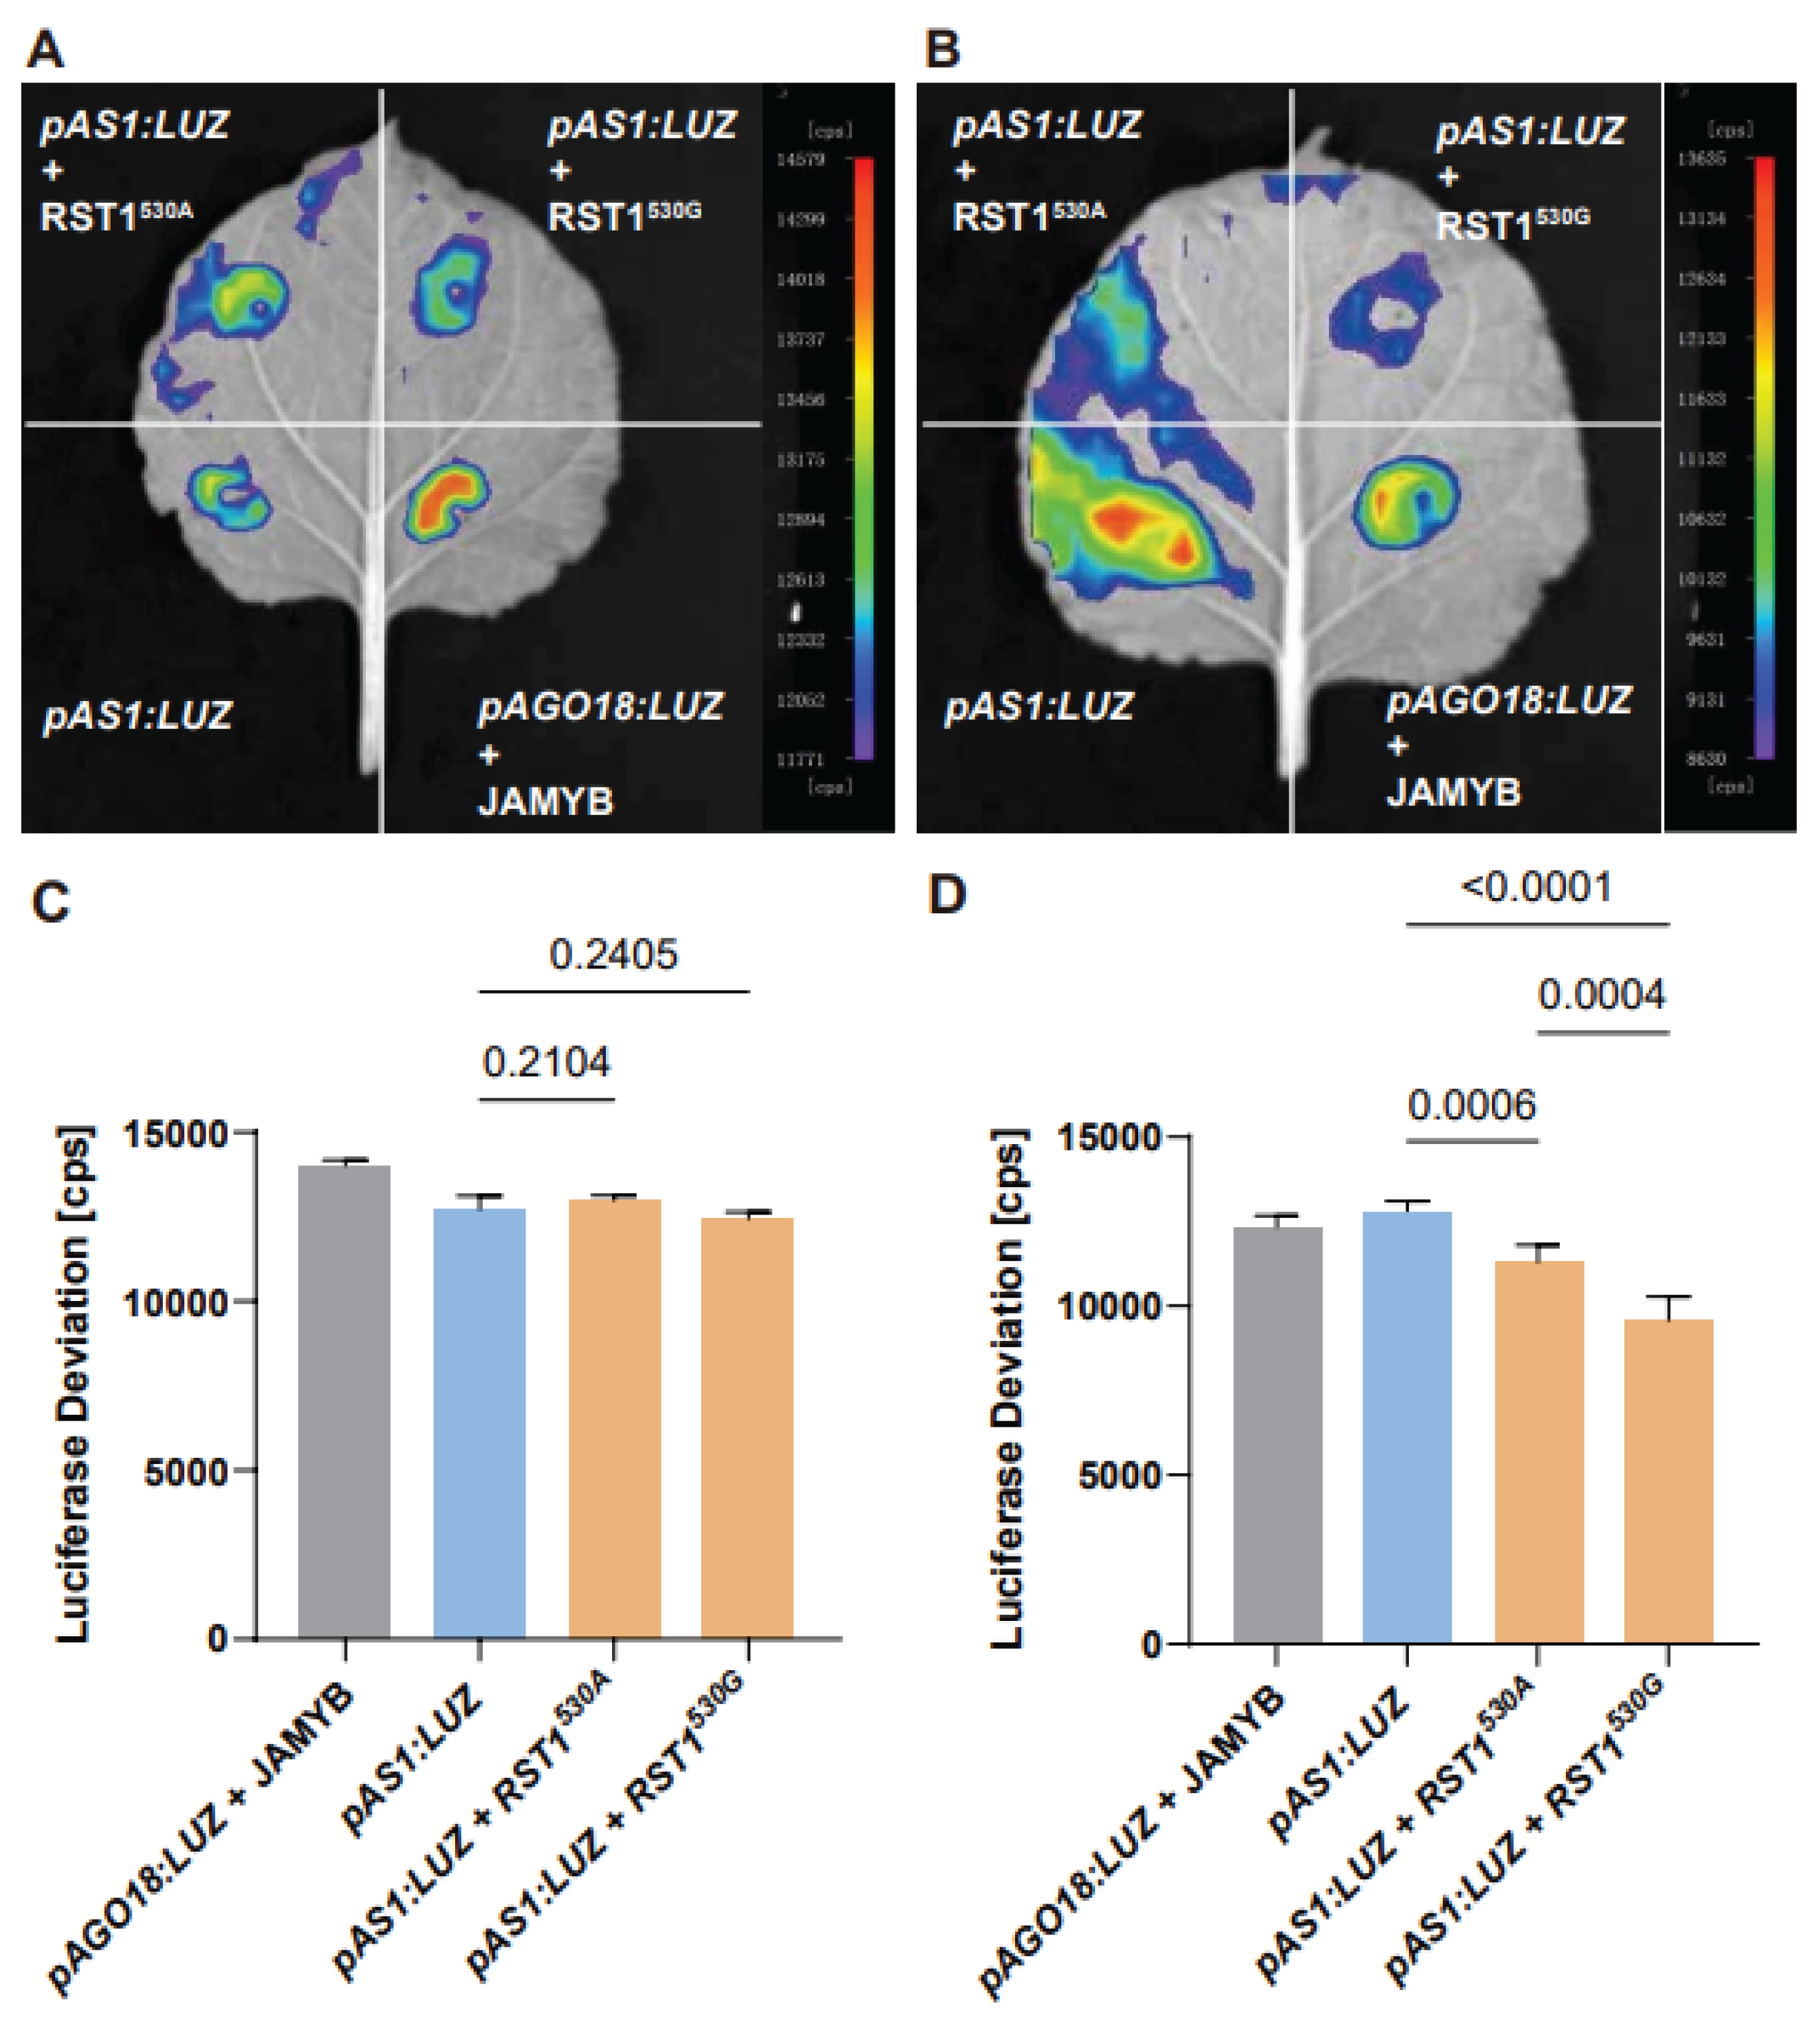
Figure 7.
RST1530A in geng/japonica rice Lindao20 originated from the xian/indica variety Aijiaonante. (A) Pedigree diagram of Lindao20. Blue arrows point to progeny. Bold blue braces and arrows indicate varieties derived from crossbreeding, while non-bolding markers represent direct offspring from a single cross. (B) Distribution of RST1530G and RST1530A in xian/indica and geng/japonica rice populations. (C) SNP variations in the RST1 coding sequence of Lindao20, Yanfeng47, Aijiaonante, and Lindao10. The RST1 and Chr6 models were based on MSU 7.0, the Nipponbare reference genome. RST1G530A, located at +1743 bp in RST1, is marked. (D) SNPs of LOC_06g47100 and LOC_06g47220 in Lindao20, Yanfeng47, Aijiaonante, Lindao10, and Nipponbare. SNP IDs are availableat https://ricerc.sicau.edu.cn/.
Figure 7.
RST1530A in geng/japonica rice Lindao20 originated from the xian/indica variety Aijiaonante. (A) Pedigree diagram of Lindao20. Blue arrows point to progeny. Bold blue braces and arrows indicate varieties derived from crossbreeding, while non-bolding markers represent direct offspring from a single cross. (B) Distribution of RST1530G and RST1530A in xian/indica and geng/japonica rice populations. (C) SNP variations in the RST1 coding sequence of Lindao20, Yanfeng47, Aijiaonante, and Lindao10. The RST1 and Chr6 models were based on MSU 7.0, the Nipponbare reference genome. RST1G530A, located at +1743 bp in RST1, is marked. (D) SNPs of LOC_06g47100 and LOC_06g47220 in Lindao20, Yanfeng47, Aijiaonante, Lindao10, and Nipponbare. SNP IDs are availableat https://ricerc.sicau.edu.cn/.
Disclaimer/Publisher’s Note: The statements, opinions and data contained in all publications are solely those of the individual author(s) and contributor(s) and not of MDPI and/or the editor(s). MDPI and/or the editor(s) disclaim responsibility for any injury to people or property resulting from any ideas, methods, instructions or products referred to in the content. |
© 2026 by the authors. Licensee MDPI, Basel, Switzerland. This article is an open access article distributed under the terms and conditions of the Creative Commons Attribution (CC BY) license.
Copyright: This open access article is published under a Creative Commons CC BY 4.0 license, which permit the free download, distribution, and reuse, provided that the author and preprint are cited in any reuse.


