

Submitted:
21 June 2026
Posted:
23 June 2026
You are already at the latest version
Abstract
This study presents an explainable artificial intelligence framework for climate-responsive residential envelope design in Gulf coastal cities by integrating building performance simulation, multi-objective optimization, machine learning, and explainability analysis. While previous studies have largely focused on minimizing energy consumption, limited research has simultaneously considered energy performance, capital cost, and thermal comfort within a unified and interpretable decision-support framework. The objective of this research was to identify dominant envelope design variables and derive practical design recommendations for residential buildings located in Dubai, Doha, and Manama. A two-story detached villa prototype was developed and simulated under representative coastal hot-arid climate conditions. Six envelope and operational design variables, including window-to-wall ratio (WWR), shading depth, cooling setpoint, glazing type, wall construction, and roof construction, were evaluated through a simulation-based optimization framework. A total of 600 design alternatives were generated using NSGA-II optimization and subsequently used to train Random Forest predictive models for energy use intensity (EUI), capital cost, and ASHRAE 55 thermal discomfort hours. SHAP (Shapley Additive Explanations) analysis was then applied to quantify variable importance and extract interpretable design rules. The results demonstrated strong predictive capability, with Random Forest models achieving R² values of 0.933 for EUI, 0.982 for capital cost, and 0.955 for thermal discomfort. SHAP analysis revealed that WWR was the dominant driver of energy performance, accounting for 65.2% of total feature importance, while wall construction exerted the greatest influence on capital cost. Thermal comfort was primarily governed by cooling setpoint, followed by WWR and shading depth. Dependence analysis further identified clear threshold relationships between envelope variables and performance outcomes. The proposed framework transforms optimization datasets into actionable design knowledge and provides interpretable decision support for architects, consultants, and developers seeking cost-effective and climate-responsive residential envelope solutions in Gulf coastal environments.
Keywords:
building performance simulation
; multi-objective optimization
; explainable artificial intelligence
; Random Forest
; SHAP
; residential envelope design
; decision support framework
1. Introduction
1.1. Gulf Residential Cooling Challenge
Buildings remain a central concern in global energy policy because they account for a substantial share of final energy consumption and energy-related greenhouse-gas emissions. Cooling demand has become particularly important as urbanization expands in warm regions and rising temperatures increase dependence on mechanical air-conditioning. In the Gulf, this challenge is intensified by prolonged summer conditions, high solar irradiance, and electricity systems that must respond to large seasonal cooling peaks. Reducing demand at the building level is therefore essential for lowering operational energy use and improving the resilience of urban electricity infrastructure [1,2,3].
Dubai, Doha, and Manama provide a relevant setting for examining this issue. Each city has a coastal climate marked by high ambient temperatures for extended periods of the year. Humidity also remains elevated during parts of the cooling season, which increases latent loads and limits the effectiveness of passive heat rejection. Although the three cities share broad climatic characteristics, their hourly weather profiles differ in solar availability, diurnal temperature range, humidity, and wind conditions. These variations can alter the relative performance of envelope measures that appear similar at first glance. A strategy that performs favorably in one location may therefore require adjustment in another [4,5,6].
Residential villas deserve particular attention. Detached housing remains common across Gulf cities because it responds to household size, privacy expectations, and prevailing development patterns. At the same time, villas often have a large exposed envelope area relative to their floor area. Extensive glazing, insufficient solar protection, and lightly insulated roof assemblies can increase cooling demand substantially. The envelope consequently becomes a decisive interface between outdoor climate conditions and indoor thermal performance. Decisions made during early design can affect electricity demand for decades, long before occupants or facility managers have an opportunity to adjust operational settings [7,8].
The problem cannot be reduced to energy use alone. A design that lowers annual energy consumption may require more expensive materials or may depend on cooling setpoints that reduce thermal acceptability for occupants. Conversely, a low-cost envelope can increase solar gains and impose a greater burden on the cooling system. These relationships create a design problem in which capital expenditure, operational demand, and thermal comfort must be assessed together. Treating one objective as dominant can obscure the consequences for the others [9,10].
1.2. Envelope Trade-Offs and Computational Design
Envelope configuration influences the amount of heat entering a building through solar radiation, conduction, and air exchange. In cooling-dominated settings, window-to-wall ratio is often a critical variable because larger glazed areas admit more solar energy and may increase cooling loads. The effect depends on glazing properties, façade orientation, shading geometry, and local weather conditions. Lower glazing ratios can reduce annual energy demand, although they may also affect daylight access and architectural expression. The relevant question is therefore not whether glazing should be reduced in all cases, but how its proportion should be balanced against the wider performance objectives of the project [11,12].
External shading can moderate solar gains before radiation reaches the glazing. Its effectiveness depends on depth, form, orientation, and the solar path associated with the site. However, shading devices also affect construction cost and façade composition. Opaque assemblies introduce another set of decisions. Wall and roof specifications can reduce conductive heat transfer, but their contribution must be evaluated against material costs and the extent to which glazing-related gains remain dominant. Cooling setpoint adds an operational dimension. Increasing the setpoint may lower cooling energy use, yet it can increase annual discomfort hours when indoor conditions move beyond the selected comfort limits [13].
Simulation-based optimization provides a structured method for examining these trade-offs. Dynamic simulation can estimate annual energy demand and thermal conditions under changing weather, occupancy schedules, internal gains, and HVAC operation. When linked to an evolutionary algorithm, it can evaluate many candidate configurations without imposing a fixed weighting between competing objectives. NSGA-II is frequently used in building performance research because it can search nonlinear design spaces that contain both continuous variables and discrete construction alternatives. The result is generally a set of non-dominated solutions, each representing a different balance between the objectives under consideration [14,15,16]. Recent research has also shown that evolutionary optimization can identify climate-specific passive design strategies across distinct weather contexts, reinforcing the value of using computational search methods to move beyond single-scenario envelope assessment [17,18,19,20].
Despite its value, optimization alone does not necessarily provide usable design knowledge. A Pareto set can show that several alternatives perform well, but it may not clarify why they perform well or which variable deserves priority during conceptual design. This limitation becomes important when architects, consultants, and developers need to justify decisions before detailed specifications are fixed. A large simulation dataset can contain useful evidence, yet its practical value remains limited if the relationships between design inputs and performance outcomes are not interpreted clearly.
Machine learning can assist with this task. Models trained on simulation outputs can identify nonlinear patterns and interactions that may not be apparent from individual scatter plots or selected Pareto solutions. Random Forest regression is appropriate for mixed design datasets because it can accommodate continuous variables alongside categorical envelope options without requiring a predefined functional relationship. It has been used widely in building energy prediction and performance classification, particularly where the relationship between inputs and outputs is complex [21].
Prediction, however, is not sufficient. A model can achieve high accuracy while remaining difficult to interpret. If a model predicts energy use or discomfort reliably but does not reveal the role of glazing, shading, wall construction, or cooling operation, it offers limited support for design decisions. This issue has encouraged growing interest in explainable artificial intelligence, which aims to make model behavior more transparent without reducing the analytical value of data-driven methods [22,23,24]. In environmental decision-making, transparency is particularly important because algorithmic outputs can influence design priorities, investment decisions, and the distribution of environmental performance responsibilities [24,25].
1.3. Explainable Machine Learning and the Study Contribution
Shapley Additive explanations, commonly known as SHAP, provide one approach to interpreting machine-learning models. SHAP values indicate how individual predictors contribute to a model estimate relative to a baseline prediction. Global analysis can establish which variables exert the greatest influence across a dataset. Dependence analysis can then show how changes in a selected variable are associated with changes in the predicted outcome. These outputs do not establish physical causality. They explain the logic learned by the model from the available data. When the underlying dataset is generated through controlled building simulation, this form of interpretation can provide a useful bridge between computational analysis and design reasoning [26,27].
Previous studies have demonstrated the importance of envelope design in hot climates. Others have applied evolutionary optimization to identify energy-efficient building configurations or used machine learning to predict energy outcomes. Yet these approaches are often treated as separate analytical tasks. Optimization studies frequently report Pareto solutions without explaining the relative importance of the variables that produced them. Machine-learning studies may report prediction accuracy without converting model outputs into design guidance. This gap is particularly evident in research on Gulf residential buildings, where comparative evidence across coastal cities remains limited and the combined assessment of energy, capital cost, and thermal discomfort is less common [28,29,30].
This study addresses that gap through an integrated framework for residential envelope design across Dubai, Doha, and Manama. A standardized villa prototype is evaluated through annual building performance simulation. NSGA-II is used to examine competing outcomes for energy use intensity, capital cost, and annual discomfort hours. The resulting simulation dataset is then used to train Random Forest models, after which SHAP analysis identifies the predictors that most strongly influence each outcome.
The study examines how envelope and operational variables affect energy use intensity, capital cost, and thermal discomfort across the three cities. It also evaluates whether Random Forest models can predict these outcomes reliably from simulation-generated design data. A further objective is to identify the variables that exert the strongest model-based influence on each performance objective and to determine whether SHAP analysis can translate the resulting evidence into interpretable guidance for early residential design.
The contribution is both methodological and practical. Methodologically, the study connects dynamic simulation, multi-objective optimization, predictive learning, and model explanation within a single workflow. The empirical contribution lies in the comparison of three Gulf coastal cities under a consistent villa prototype and a common set of envelope alternatives. At the practical level, the study produces design guidance that identifies when window-to-wall ratio, shading depth, cooling setpoint, or construction choice should receive priority. The intention is not to define a universal optimum for Gulf housing. Instead, the framework clarifies the trade-offs that arise within the tested design space and supports more defensible early-stage envelope decisions.
2. Materials and Methods
2.1. Study Framework and Analytical Sequence
This study used a staged analytical framework that linked dynamic building simulation with multi-objective optimization, predictive modelling, and explainability analysis. The purpose was not only to identify envelope configurations that achieved favorable performance outcomes, but also to determine how individual design choices contributed to energy use, capital cost, and thermal discomfort. Dynamic simulation provided annual performance outputs for each design alternative. NSGA-II was then used to explore competing objectives. Random Forest models were trained from the resulting dataset, and SHAP analysis was applied to interpret the modelled relationships. This sequence is appropriate where building performance depends on nonlinear interactions between climate, envelope properties, solar control, and cooling operation [14,15,16,17,19,20,27,31]. Figure 1 presents the analytical sequence used in the study.
At the first stage, a standardized detached villa was modelled under the weather conditions of Dubai, Doha, and Manama. Fixed assumptions were retained across the three locations so that differences in outcomes could be attributed to climate conditions and the selected envelope or operational variables. The simulation stage generated annual values for energy use intensity (EUI), capital cost, and annual discomfort hours. These outputs formed the basis of the optimization and machine-learning stages.
The second stage evaluated a defined design space. Window-to-wall ratio, shading depth, cooling setpoint, glazing type, wall construction, roof construction, and shading type were varied within the selected ranges. The city identifier was retained as an additional predictor during the learning stage. A balanced dataset of 600 simulated cases was assembled, comprising 200 cases for each city. This dataset was used to visualize performance trade-offs, train the predictive models, and examine feature importance.
Random Forest regression models were developed separately for EUI, capital cost, and discomfort hours. Their performance was assessed on held-out test data using the coefficient of determination and mean absolute error. After model validation, SHAP values were calculated to identify the relative contribution of each predictor to the three model outputs. The resulting evidence was translated into design rules only when the observed pattern was consistent with the simulated dataset and physically plausible within the defined search space.
2.2. Climate Cases and Standardized Villa Prototype
Dubai, Doha, and Manama were selected because they represent major coastal urban contexts in the Gulf. All three cities experience long cooling seasons, intense solar exposure, and high electricity demand associated with air-conditioning. Their climatic conditions are nevertheless not identical. Differences in humidity, hourly temperature profiles, solar radiation, and wind conditions can affect cooling demand and the performance of solar-control strategies. A comparative design was therefore necessary to assess whether the same envelope variables retained importance across the three locations [4,5,6]. Table 1 summarizes the climatic role of each city within the comparative framework.
Hourly EPW files supplied the climatic inputs required by the annual simulations, including dry-bulb temperature, relative humidity, solar radiation, wind speed, and sky conditions. City was also retained as a categorical predictor in the Random Forest dataset. This allowed the models to test whether location added explanatory value after envelope and operational decisions had been considered.
The reference building was a two-story detached villa with a conditioned floor area of 264.19 m². The prototype represented a medium-sized residential dwelling suitable for comparative analysis in Gulf urban contexts. Building geometry, orientation, zoning arrangement, occupancy schedules, internal gains, ventilation assumptions, and HVAC configuration remained fixed throughout the simulations. This control was necessary because changes in form or internal operation could otherwise obscure the effect of the selected envelope variables. Cooling was provided through a unitary cooling system with a coefficient of performance of 2.5. The model was divided into thermal zones so that annual simulation could capture differences in solar exposure and internal conditions across the villa. Baseline envelope assumptions were retained only for the reference assessment; they were subsequently modified during the parametric evaluation.
Table 2 combines the fixed prototype assumptions with the baseline performance values. The baseline was not intended to represent measured consumption from an occupied villa. It provided a controlled reference condition against which the simulated alternatives could be compared.
The baseline results indicate that Doha produced the highest EUI under the fixed reference assumptions, whereas Manama recorded the lowest. Annual discomfort hours remained high in all cases. These outputs reflect hours outside the selected ASHRAE 55 comfort boundaries and should not be interpreted as cooling setpoint not-met hours. Their purpose was to establish a consistent starting point before envelope and operational variables were varied.
2.3. Design Variables and Performance Objectives
The design space included seven adjustable variables. Three were continuous: window-to-wall ratio, shading depth, and cooling setpoint. Four were categorical: shading type, glazing type, wall construction, and roof construction. City was not manipulated as a design variable. It was included as a categorical predictor because the same variable combinations were evaluated under three distinct climate files.
The selected variables represent decisions that are commonly made during early villa design. WWR affects solar gains and the quantity of glazing required. Shading depth and shading type influence direct solar exposure. Glazing, wall, and roof selections alter thermal transfer and construction cost. Cooling setpoint changes the operational relationship between energy demand and thermal acceptability. Together, these variables capture a substantial part of the envelope and operational decision space without changing the fundamental building geometry [11].
Table 3 summarizes the variables and candidate ranges used in the analysis. Detailed layer-by-layer material specifications can be provided in the Supplementary Material to preserve the readability of the main manuscript.
The optimization was formulated around three objectives. EUI was used as the energy metric because the building floor area remained fixed. Capital cost represented the comparative construction cost associated with the selected envelope alternatives. Annual discomfort hours were calculated using the ASHRAE 55 assessment output. Each objective was minimized. This formulation prevented the analysis from treating lower energy demand as automatically preferable when it could require higher expenditure or reduce thermal acceptability [9].

Table 4.
Objective functions, analytical procedure, and model settings.
| Analytical stage | Parameter or output | Final setting |
| Building simulation | Performance engine | DesignBuilder with EnergyPlus calculation engine |
| Objective 1 | Energy use intensity | Minimize, kWh/m²·yr |
| Objective 2 | Capital cost | Minimize, GBP |
| Objective 3 | Annual discomfort hours | Minimize, h/yr under ASHRAE 55 assessment |
| Optimization method | Search procedure | NSGA-II multi-objective evaluation |
| Dataset size | Simulated cases | 600 total; 200 per city |
| Random Forest | Target models | Separate models for EUI, capital cost, and discomfort hours |
| Random Forest | Validation split | 80% training; 20% testing |
| Model evaluation | Accuracy measures | R² and MAE |
| Explainability method | SHAP procedure | Tree-based SHAP analysis using global importance and dependence relationships |
2.4. Optimization, Random Forest, and SHAP Protocol
NSGA-II was used to evaluate the competing objectives without applying a predetermined weighting structure. This approach is suitable for building design because energy use, capital cost, and comfort rarely move in the same direction. Each simulated configuration was assessed through an annual EnergyPlus run. The resulting records retained the input variables and the three performance outputs. Rather than treating the final dataset as evidence of a single universal optimum, the study used it to examine trade-offs within the defined ranges [14,15,16].
NSGA-II was executed separately for Dubai, Doha, and Manama using city-specific search settings. Each optimization run generated 200 evaluated design alternatives, and all evaluated solutions were retained rather than restricting the dataset to the final non-dominated solutions. This produced a balanced dataset of 600 simulation records, comprising 200 alternatives for each city, which was subsequently used for Random Forest training and SHAP interpretation. The retained dataset preserved variation across the tested ranges of energy use intensity, capital cost, and annual ASHRAE 55 discomfort hours.
Capital cost was treated as a comparative construction-cost indicator rather than a tender-ready market estimate. Unit costs for envelope assemblies, glazing systems, and shading configurations were obtained from [database/source], standardized to [year] GBP values. The calculation included [state included elements] and excluded [state excluded elements, such as land, professional fees, contractor overhead, taxes, and mechanical equipment]. Because the same prototype geometry and fixed building systems were used across all cities, the cost objective was intended to compare relative differences among envelope alternatives rather than represent city-specific procurement prices.
The 600 simulation records were then combined for predictive modelling. Categorical variables were encoded before Random Forest training. An 80:20 training-test split was applied to the integrated dataset. Separate models were fitted for EUI, capital cost, and annual discomfort hours. The reported metrics were calculated on the held-out test data. This distinction is important because the models were evaluated as predictors of simulation outcomes, not as replacements for dynamic simulation.
The EUI model achieved an R² of 0.933 and an MAE of 3.93 kWh/m²·yr. The capital-cost model achieved an R² of 0.982 with an MAE of £884. For annual discomfort hours, the model achieved an R² of 0.955 and an MAE of 97.6 h. These values indicate that the dataset contained sufficiently stable patterns for model-based interpretation. Their detailed results are reported in Section 3.
SHAP analysis was subsequently applied to the trained Random Forest models. Mean absolute SHAP values were used to establish global feature importance. Dependence plots were then generated for the dominant variables in each model. A positive SHAP value indicates that a predictor increased the model estimate relative to its baseline, while a negative value indicates a reduction. These outputs explain the model’s learned relationships; they do not independently demonstrate causality in the physical building system [26,27].
The interpretation was therefore bounded by the simulation assumptions, the selected villa prototype, the available construction alternatives, and the defined variable ranges. The next section reports the baseline comparison, the distribution of simulated alternatives, and the predictive accuracy of the Random Forest models.
3. Optimization and Predictive Modelling Results
3.1. Baseline Performance and Simulated Performance Space
The results section reports the performance behavior of the 600 simulated residential villa alternatives before moving to the explainable machine-learning analysis in Section 4. The aim is to establish how the design alternatives were distributed across energy use intensity, capital cost, and annual thermal discomfort. The baseline model provides the reference condition, while the simulation dataset shows the range of outcomes generated when envelope and operational variables were varied within the defined search space.
Figure 2.
Baseline performance comparison across Dubai, Doha, and Manama. The figure presents annual energy use intensity, capital cost, and annual ASHRAE 55 discomfort hours for the standardized detached villa prototype before optimization.
Figure 2.
Baseline performance comparison across Dubai, Doha, and Manama. The figure presents annual energy use intensity, capital cost, and annual ASHRAE 55 discomfort hours for the standardized detached villa prototype before optimization.
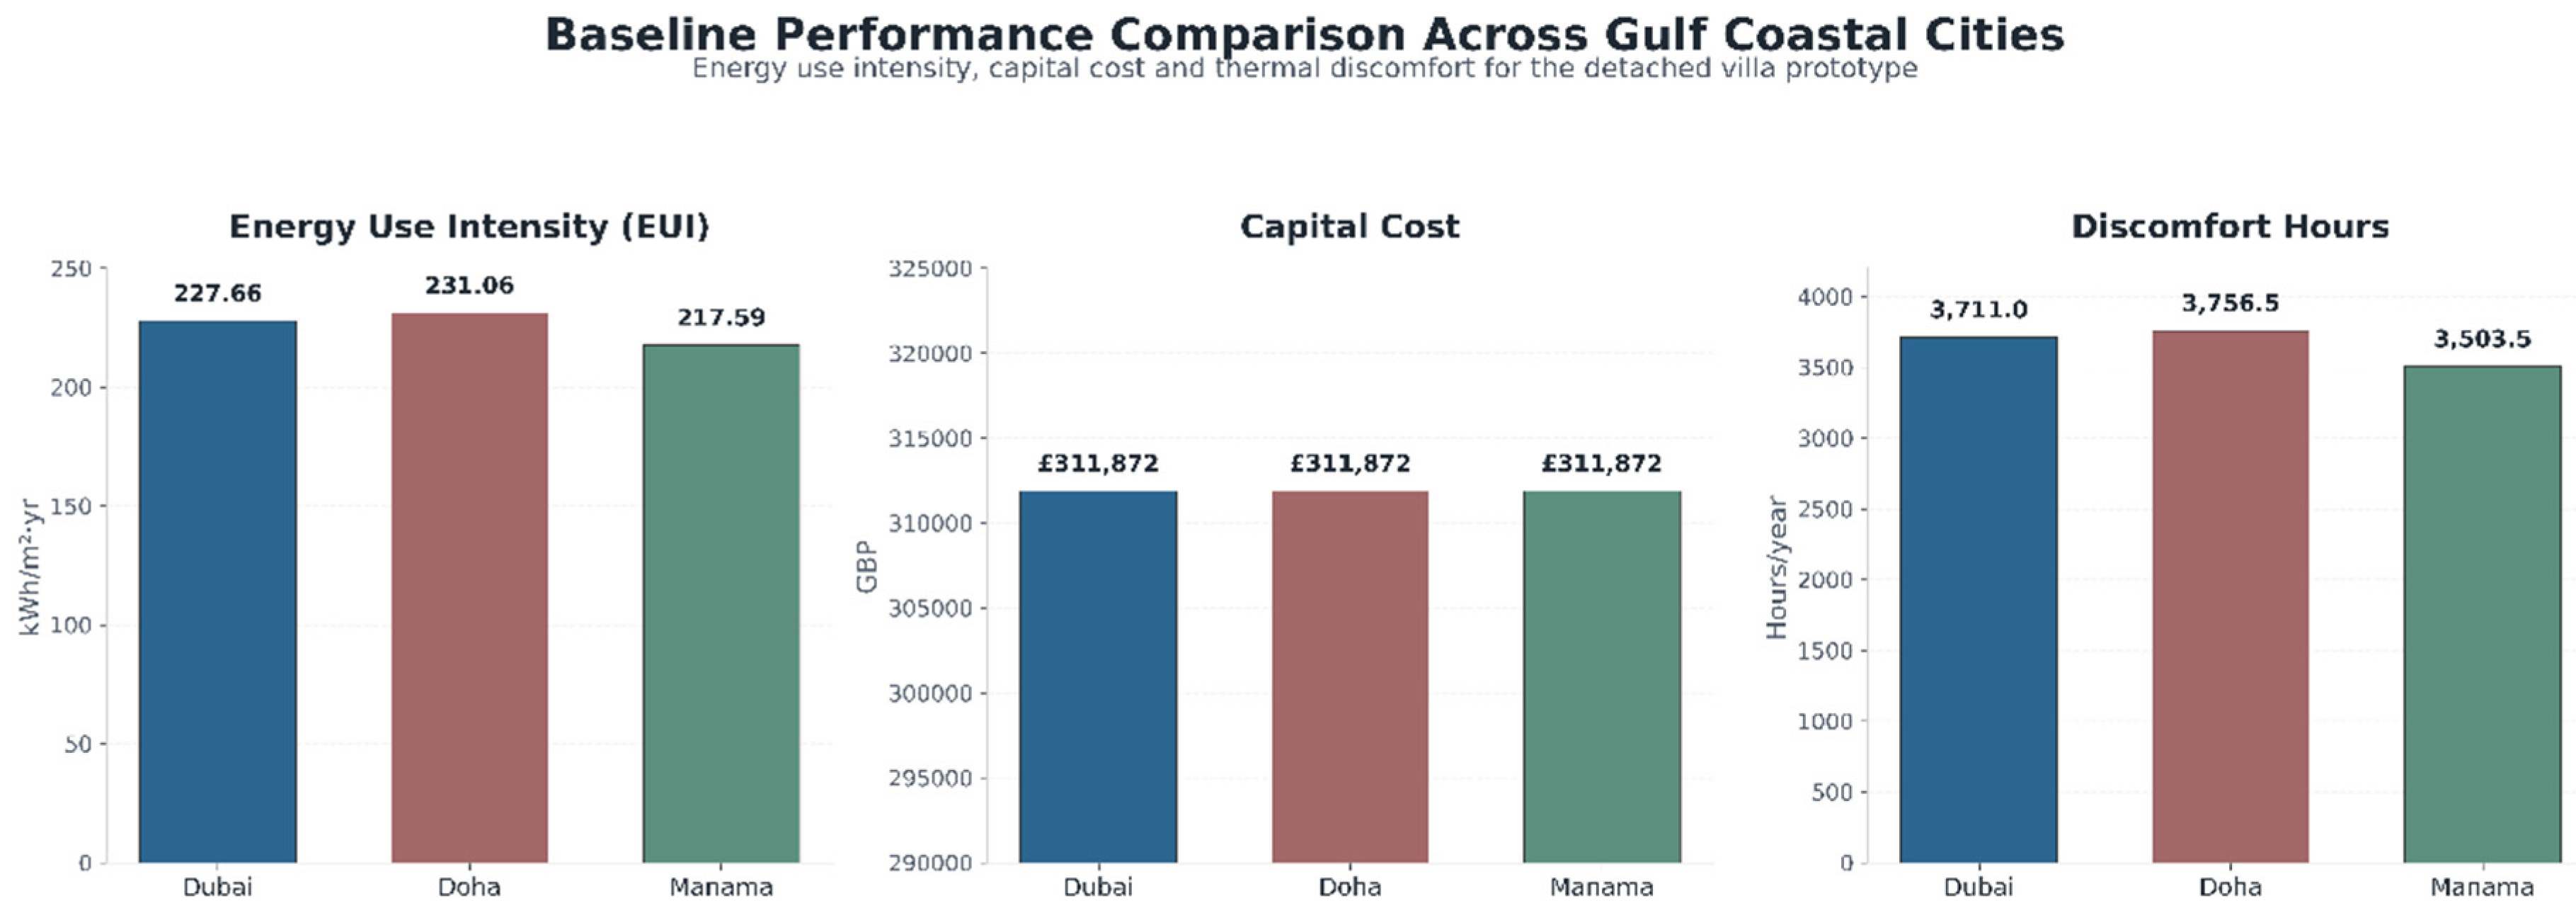
The baseline results showed clear differences among the three cities despite the use of identical building geometry, internal loads, HVAC assumptions, and construction specifications. Doha recorded the highest baseline EUI at 231.06 kWh/m²·yr, followed by Dubai at 227.66 kWh/m²·yr and Manama at 217.59 kWh/m²·yr. Capital cost remained identical at £311,872 because the same reference construction was applied in all three baseline models. Annual ASHRAE 55 discomfort hours were also high in all cities, reaching 3,756.5 h in Doha, 3,711.0 h in Dubai, and 3,503.5 h in Manama. These values confirm that the reference villa faced substantial thermal stress under the selected climate files and comfort assumptions.
The simulation dataset produced a wide range of performance outcomes. In Dubai, EUI varied from 75.95 to 186.94 kWh/m²·yr. In Doha, the range extended from 81.08 to 177.48 kWh/m²·yr. In Manama, EUI ranged from 73.61 to 158.55 kWh/m²·yr. These results show that the tested design variables produced substantial reductions relative to the baseline condition. The lowest observed EUI occurred in Manama, followed by Dubai and Doha. This ordering differs from the baseline ranking and indicates that the response to envelope and operational changes was not uniform across the three coastal contexts.
Capital cost also varied across the dataset. The lowest observed cost was £304,370.64 in Manama, £305,089.76 in Dubai, and £306,108.28 in Doha. The highest values reached £342,381.78 in Manama, £346,338.23 in Dubai, and £347,922.76 in Doha. The cost range indicates that the construction alternatives had a measurable economic effect, particularly through wall construction, glazing proportion, and shading configurations. The spread was narrower than the spread observed for discomfort hours but was large enough to justify treating capital cost as a separate optimization objective.
Thermal discomfort showed the broadest performance variation in absolute terms. The lowest observed discomfort value was 1,515.25 h in Dubai, 1,605.81 h in Doha, and 1,782.19 h in Manama. The maximum discomfort values exceeded 4,200 h in all three cities, reaching 4,352.25 h in Dubai, 4,393.81 h in Doha, and 4,255.56 h in Manama. The difference between the best and worst cases confirms that thermal comfort was highly sensitive to design and operational decisions within the tested range.
Table 5.
Baseline and observed simulation-performance ranges across the three Gulf coastal cities.
| City | Baseline EUI (kWh/m²·yr) | Minimum EUI (kWh/m²·yr) | EUI Range (kWh/m²·yr) | Baseline Capital Cost (GBP) | Cost Range (GBP) |
| Dubai | 227.66 | 75.95 | 75.95–186.94 | 311,872 | 305,089.76–346,338.23 |
| Doha | 231.06 | 81.08 | 81.08–177.48 | 311,872 | 306,108.28–347,922.76 |
| Manama | 217.59 | 73.61 | 73.61–158.55 | 311,872 | 304,370.64–342,381.78 |
Note: EUI = annual energy use intensity. The minimum values and performance ranges refer to the simulated alternatives generated for each city, while the baseline values refer to the standard reference villa.
The minimum EUI cases were not identical to the minimum discomfort or minimum cost cases. For example, the lowest EUI in Dubai occurred at 75.95 kWh/m²·yr, but the lowest discomfort case occurred at 93.17 kWh/m²·yr. A similar pattern appeared in Doha and Manama. This separation confirms that a design alternative selected only for energy reduction would not necessarily provide the best thermal comfort or the lowest initial cost. The results therefore support the use of a multi-objective framework rather than a single energy-centered assessment.
3.2. Multi-Objective Trade-Offs
The distribution of simulated alternatives reveals the performance trade-offs generated by the design space. Figure 3 plots annual EUI against capital cost. The scatter pattern shows that low-energy solutions were not confined to the highest capital-cost range. Several alternatives achieved EUI values below 100 kWh/m²·yr while remaining close to or moderately above the baseline cost. At the same time, some high-cost cases did not achieve the lowest EUI values. Cost alone therefore did not determine energy performance.
The energy–cost distribution suggests that envelope decisions had different economic and thermal effects. Some configurations increased capital cost without producing proportional energy reductions, while others produced substantial energy improvement with limited cost increase. This pattern is important because it indicates that performance cannot be inferred from investment level alone. In practical design terms, cost-sensitive optimization should identify which cost increases produce meaningful performance gains and which changes mainly add expenditure.
Figure 4 plots annual EUI against annual ASHRAE 55 discomfort hours. The distribution shows a wider and more complex relationship than the energy–cost plot. Some alternatives combined relatively low EUI with relatively low discomfort, but other low-energy cases produced higher discomfort values. This pattern reflects the role of cooling setpoint. Higher cooling setpoints can reduce energy consumption, yet they can also increase discomfort hours. The plot therefore illustrates the need to evaluate energy and comfort simultaneously rather than assuming that lower energy demand always corresponds to better indoor performance.
Across the three cities, the simulated points overlap substantially. This indicates that the tested envelope and operational variables produced stronger differentiation than city identity alone. Nevertheless, the ranges were not identical. Manama achieved the lowest observed EUI, while Dubai achieved the lowest observed discomfort. Doha recorded the highest baseline EUI and the highest maximum discomfort value. These differences confirm that local climate still shaped performance outcomes, even when its influence was smaller than that of dominant design variables.
The trade-off plots also show boundary tendencies. Minimum-EUI cases generally occurred with low WWR values and deeper shading. Minimum-discomfort cases were associated with lower cooling setpoints and, in several cases, reduced glazing exposure. Minimum-cost cases tended to avoid deeper shading and used lower-cost construction alternatives. These tendencies are reported descriptively here. Their relative importance is quantified through Random Forest and SHAP analysis in the following sections
3.3. Random Forest Predictive Accuracy
Random Forest models were trained to test whether the simulation dataset contained stable relationships between design inputs and performance outcomes. The models were developed separately for EUI, capital cost, and discomfort hours. Their predictive accuracy was evaluated using the held-out test dataset. Strong predictive performance was necessary before applying SHAP analysis, because feature-attribution results are meaningful only if the underlying model has captured the principal structure of the data.
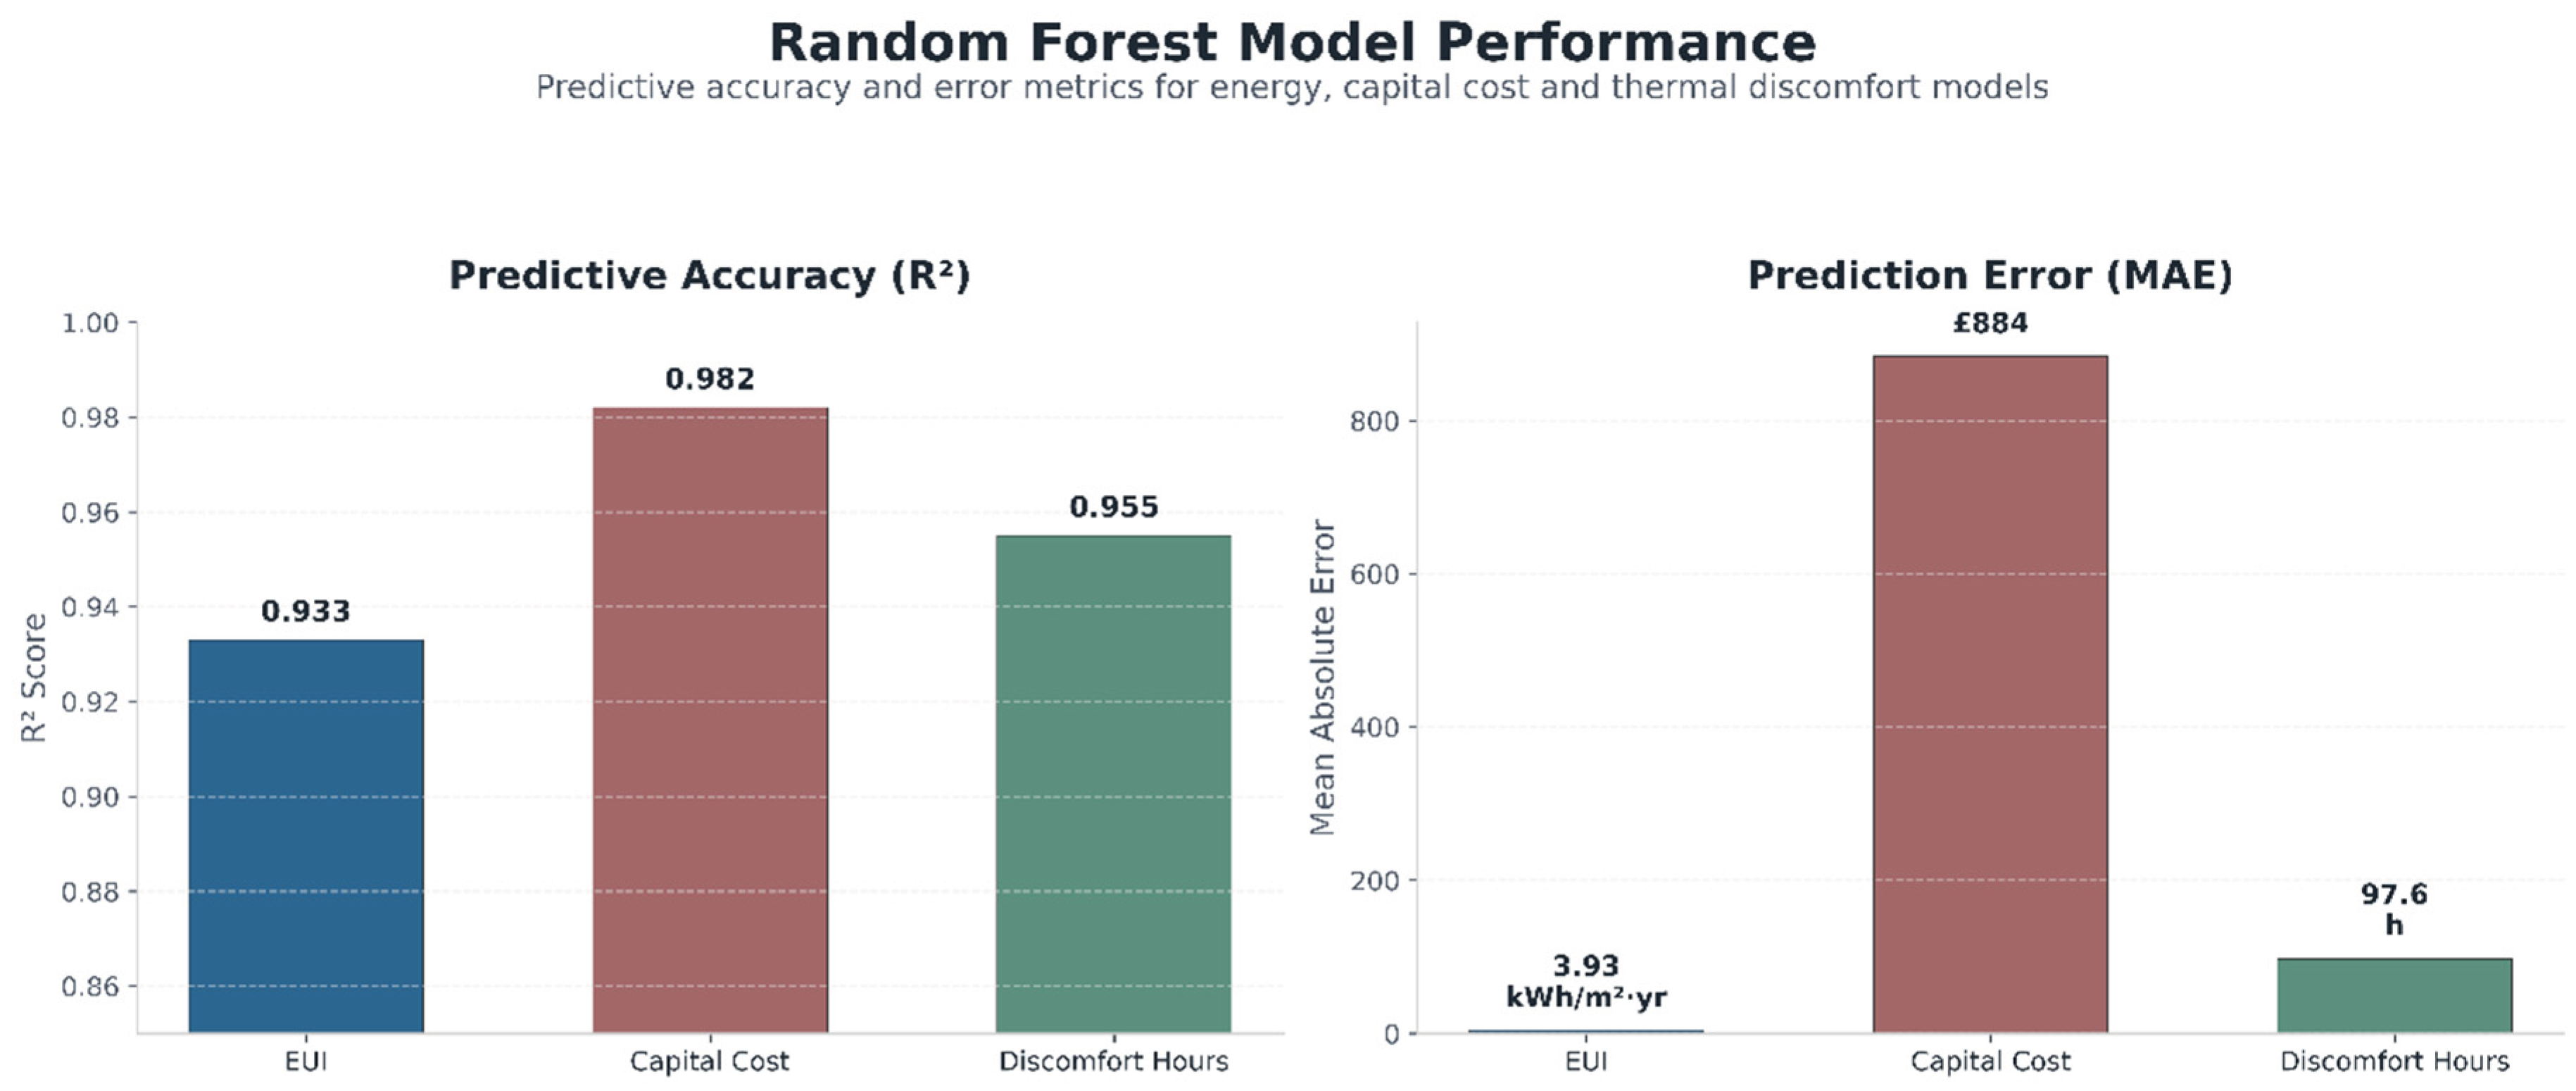
The three models achieved high predictive accuracy. The EUI model obtained an R² of 0.933 and an MAE of 3.93 kWh/m²·yr. The capital-cost model performed strongest, with an R² of 0.982 and an MAE of £884. The discomfort model achieved an R² of 0.955 and an MAE of 97.6 h. These results indicate that Random Forest regression represented the simulated relationships with sufficient accuracy for model-based interpretation.
Table 6.
Random Forest predictive performance for the three target outcomes.
| Model | Target Output | R² | MAE | Interpretation |
| RF-EUI | Annual energy use intensity |
0.933 | 3.93 kWh/m²·yr | Strong predictive accuracy |
| RF-Cost | Capital cost | 0.982 | £884 | Very strong predictive accuracy |
| RF-Comfort | Annual ASHRAE 55 discomfort hours | 0.955 | 97.6 h | Strong predictive accuracy |
Note: R² is the coefficient of determination. MAE is mean absolute error.
Figure 5.
Random Forest model performance for annual energy use intensity, capital cost, and annual ASHRAE 55 discomfort hours. The figure reports predictive accuracy, expressed as R², and prediction error, expressed as mean absolute error, for the three independently trained models.
Figure 5.
Random Forest model performance for annual energy use intensity, capital cost, and annual ASHRAE 55 discomfort hours. The figure reports predictive accuracy, expressed as R², and prediction error, expressed as mean absolute error, for the three independently trained models.
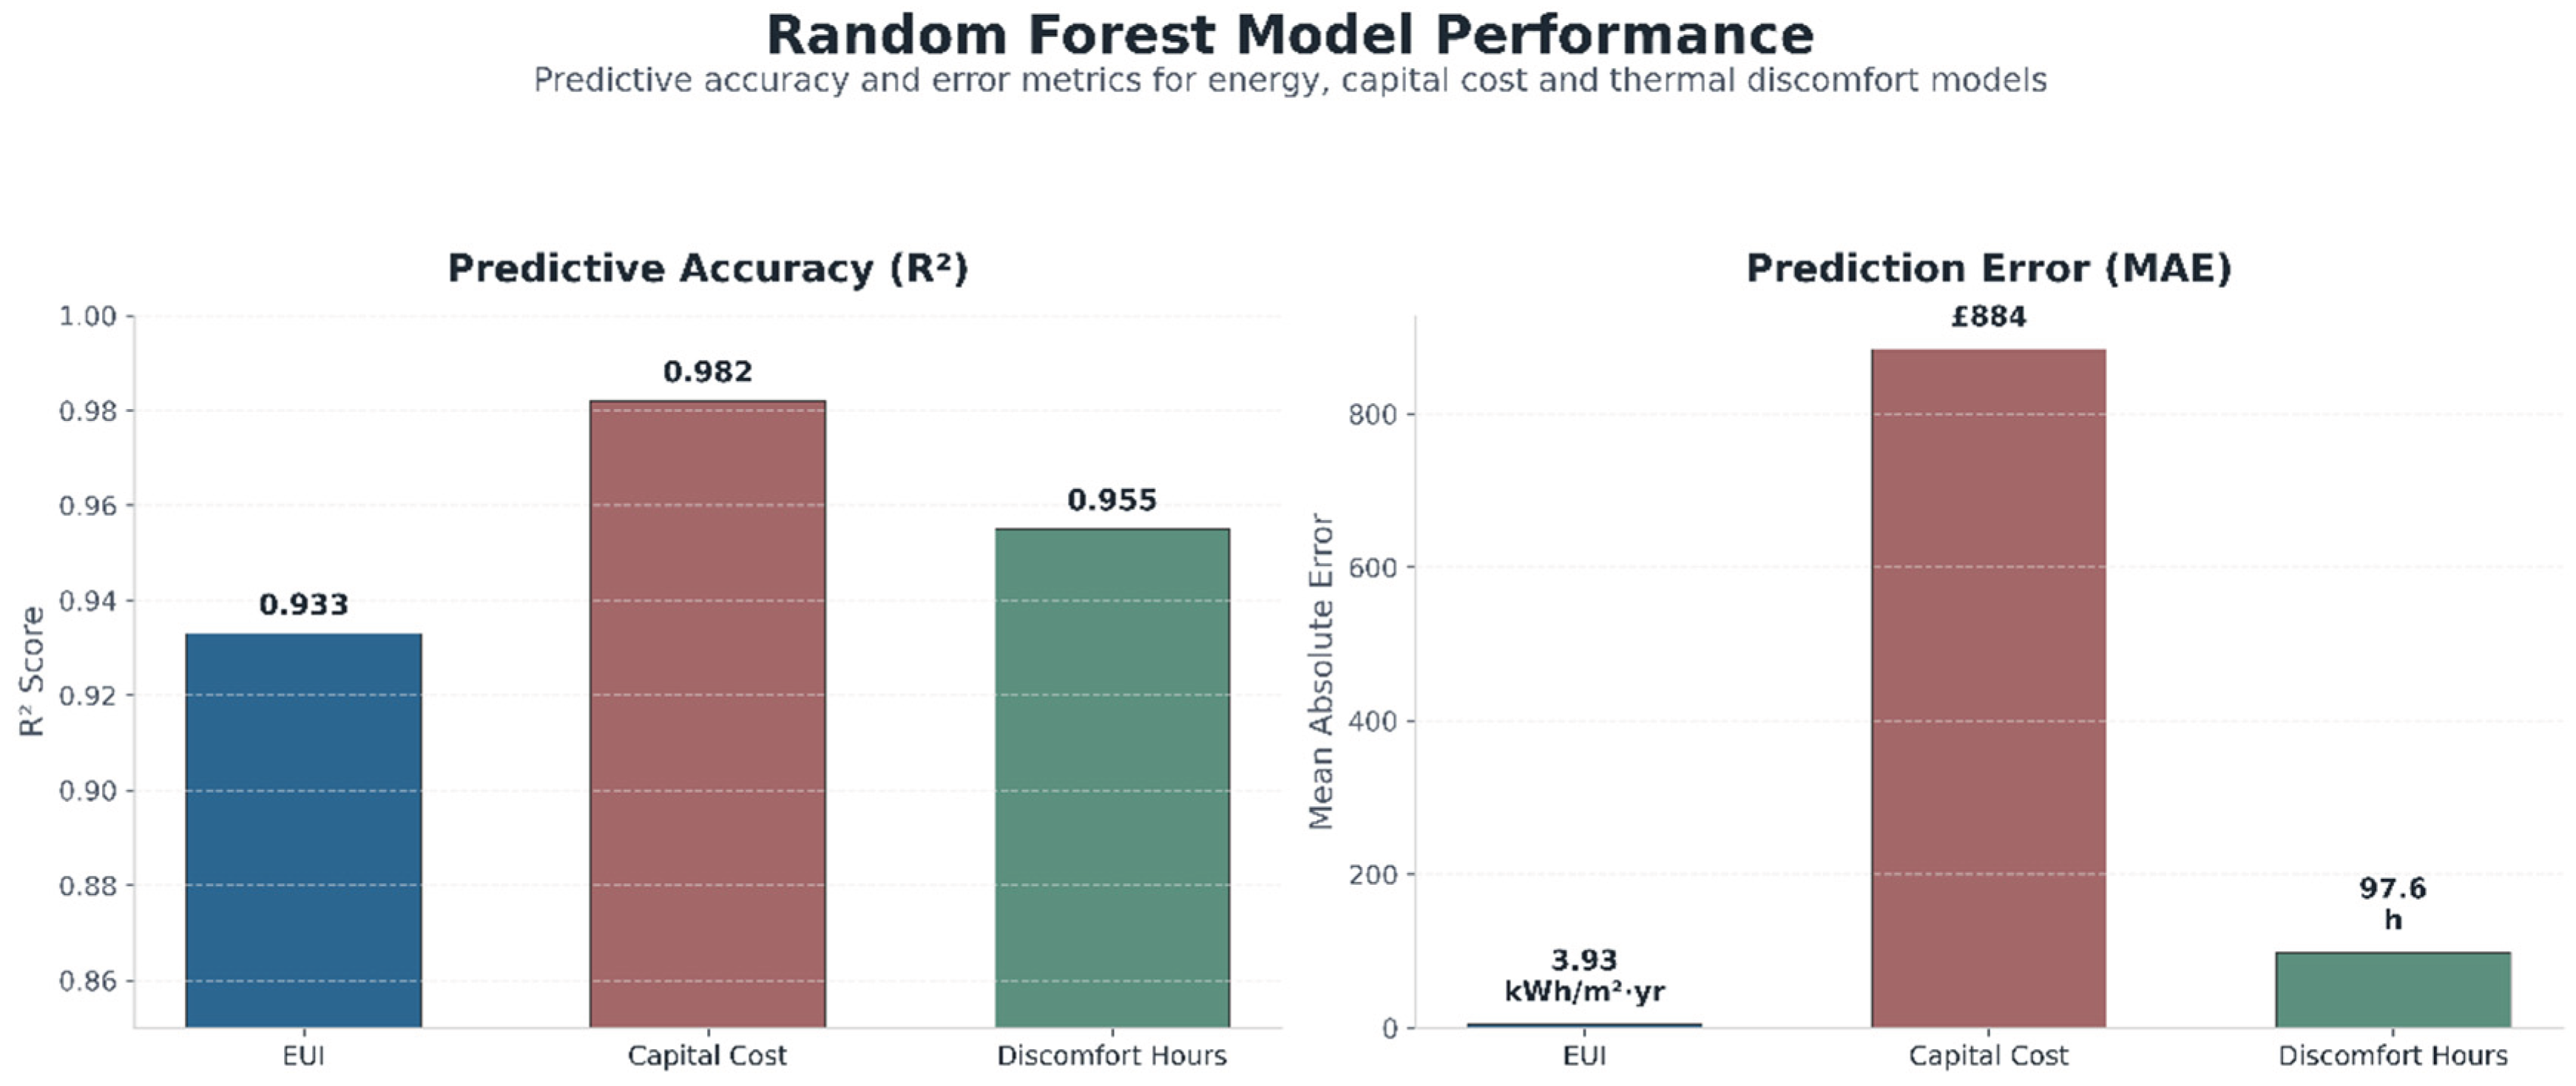
The capital-cost model achieved the strongest fit because cost was strongly structured by discrete construction choices, particularly wall construction and glazing-related quantities. The EUI and discomfort models also performed well, although their relationships were more influenced by interactions among WWR, shading, setpoint, and city conditions. The error values remained small relative to the observed performance ranges. For example, the EUI MAE of 3.93 kWh/m²·yr is limited compared with the full simulated EUI range, while the discomfort MAE of 97.6 h is modest relative to the difference between the best and worst cases.
These model results justify the use of SHAP interpretation in Section 4. The predictive models are not presented as replacements for dynamic simulation. Instead, they provide a compact representation of the simulation dataset, allowing the study to identify which variables contributed most strongly to predicted energy use, cost, and discomfort.
4. Explainable Machine Learning and AI-Derived Design Rules
4.1. Global Feature Importance Across Energy, Cost, and Comfort
The Random Forest models established that the simulation dataset could predict energy use intensity, capital cost, and annual discomfort hours with strong accuracy. The next analytical step was to determine which design variables drove those predictions. This was undertaken using two complementary explainability methods: grouped Random Forest feature importance and SHAP analysis. Random Forest importance provides an initial ranking of variables according to their contribution to predictive accuracy. SHAP analysis then quantifies the direction and magnitude of each variable’s contribution to individual predictions.
The results show a clear separation between the dominant drivers of energy, cost, and comfort. Window-to-wall ratio was the most influential variable for EUI. Wall construction was the dominant determinant of capital cost. Cooling setpoint was the strongest driver of annual thermal discomfort. This distinction is central to the study because it demonstrates that a single “best” envelope variable does not exist across all objectives. Instead, different decisions govern different performance dimensions.
For the EUI model, WWR accounted for 65.3% of grouped feature importance. Shading depth ranked second at 19.1%, followed by cooling setpoint at 6.6% and shading type at 4.7%. The remaining variables: glazing type, wall construction, city, and roof construction. Each contributed less than 2%. The energy model therefore indicates that façade openness and solar-control geometry dominated annual operational demand within the tested design space.
For capital cost, wall construction accounted for 71.7% of feature importance. WWR contributed 17.4%, while shading depth and shading type contributed 5.0% and 4.1%, respectively. Glazing type contributed only 1.0%, and cooling setpoint had almost no influence because it does not alter the physical construction specification. This result is expected in principle but important in quantitative terms: the wall system was substantially more influential on capital cost than all other variables combined.
The discomfort model produced a different hierarchy. Cooling setpoint accounted for 51.2% of feature importance, followed by WWR at 33.4% and shading depth at 10.5%. Together, these three variables accounted for 95.1% of the model’s predictive importance. This finding indicates that thermal comfort in the tested villa prototype was shaped primarily by operational cooling control and solar exposure rather than by the wall, roof, or glazing alternatives.
Table 7.
Grouped Random Forest feature importance across the three predictive models.
| Variable | EUI importance (%) | Capital-cost importance (%) | Discomfort importance (%) |
| Window-to-wall ratio | 65.3 | 17.4 | 33.4 |
| Shading depth | 19.1 | 5.0 | 10.5 |
| Cooling setpoint | 6.6 | 0.4 | 51.2 |
| Shading type | 4.7 | 4.1 | 1.4 |
| Glazing type | 1.7 | 1.0 | 1.4 |
| Wall construction | 1.1 | 71.7 | 0.6 |
| City | 1.0 | 0.3 | 1.0 |
| Roof construction | 0.5 | 0.2 | 0.4 |
Figure 6.
Grouped Random Forest feature importance across the annual energy use intensity, capital-cost, and annual ASHRAE 55 discomfort-hour models. Values indicate the relative contribution of each predictor to model performance.
Figure 6.
Grouped Random Forest feature importance across the annual energy use intensity, capital-cost, and annual ASHRAE 55 discomfort-hour models. Values indicate the relative contribution of each predictor to model performance.
The relatively low contribution of city identity requires careful interpretation. It does not mean that climate is unimportant. Rather, it indicates that within the selected Gulf coastal context, the design variables produced larger variation in the modelled outcomes than the categorical city variable. Dubai, Doha, and Manama all represent cooling-dominated coastal climates, and the common building prototype was exposed to the same range of envelope and operational alternatives. The results therefore suggest that transferable design rules may be possible across these cities, while still requiring local calibration during detailed design.
The low importance of roof construction should also be interpreted within the defined search space. The three roof alternatives were all code-standard flat-roof systems with different thermal mass classifications. Their performance differences were therefore limited compared with the large solar-exposure differences created by WWR and shading depth. A broader roof-insulation range, reflective roof finishes, photovoltaic integration, or more diverse roof assemblies might have produced a stronger effect.
4.2. SHAP Interpretation of Energy, Cost, and Comfort Drivers
SHAP analysis was used to examine the contribution of individual variables to the three target outcomes. Unlike grouped feature importance, SHAP values identify whether a variable pushed a prediction upward or downward relative to the model’s average prediction. The analysis therefore allows the study to move from ranking variables to identifying interpretable design relationships.
For EUI, the mean absolute SHAP values confirmed the dominance of WWR. WWR produced a mean absolute SHAP value of 13.85 kWh/m²·yr, almost twice the contribution of shading depth at 7.17 kWh/m²·yr. Cooling setpoint ranked third at 4.14 kWh/m²·yr. Shading type, glazing type, wall type, city, and roof type had substantially smaller contributions. The SHAP results support the conclusion that façade opening proportion was the principal determinant of annual energy demand in the simulated villas.
Figure 7.
Mean absolute SHAP contributions for annual energy use intensity, capital cost, and annual ASHRAE 55 discomfort hours. The panels show the magnitude of each predictor’s contribution to the corresponding Random Forest model output.
Figure 7.
Mean absolute SHAP contributions for annual energy use intensity, capital cost, and annual ASHRAE 55 discomfort hours. The panels show the magnitude of each predictor’s contribution to the corresponding Random Forest model output.
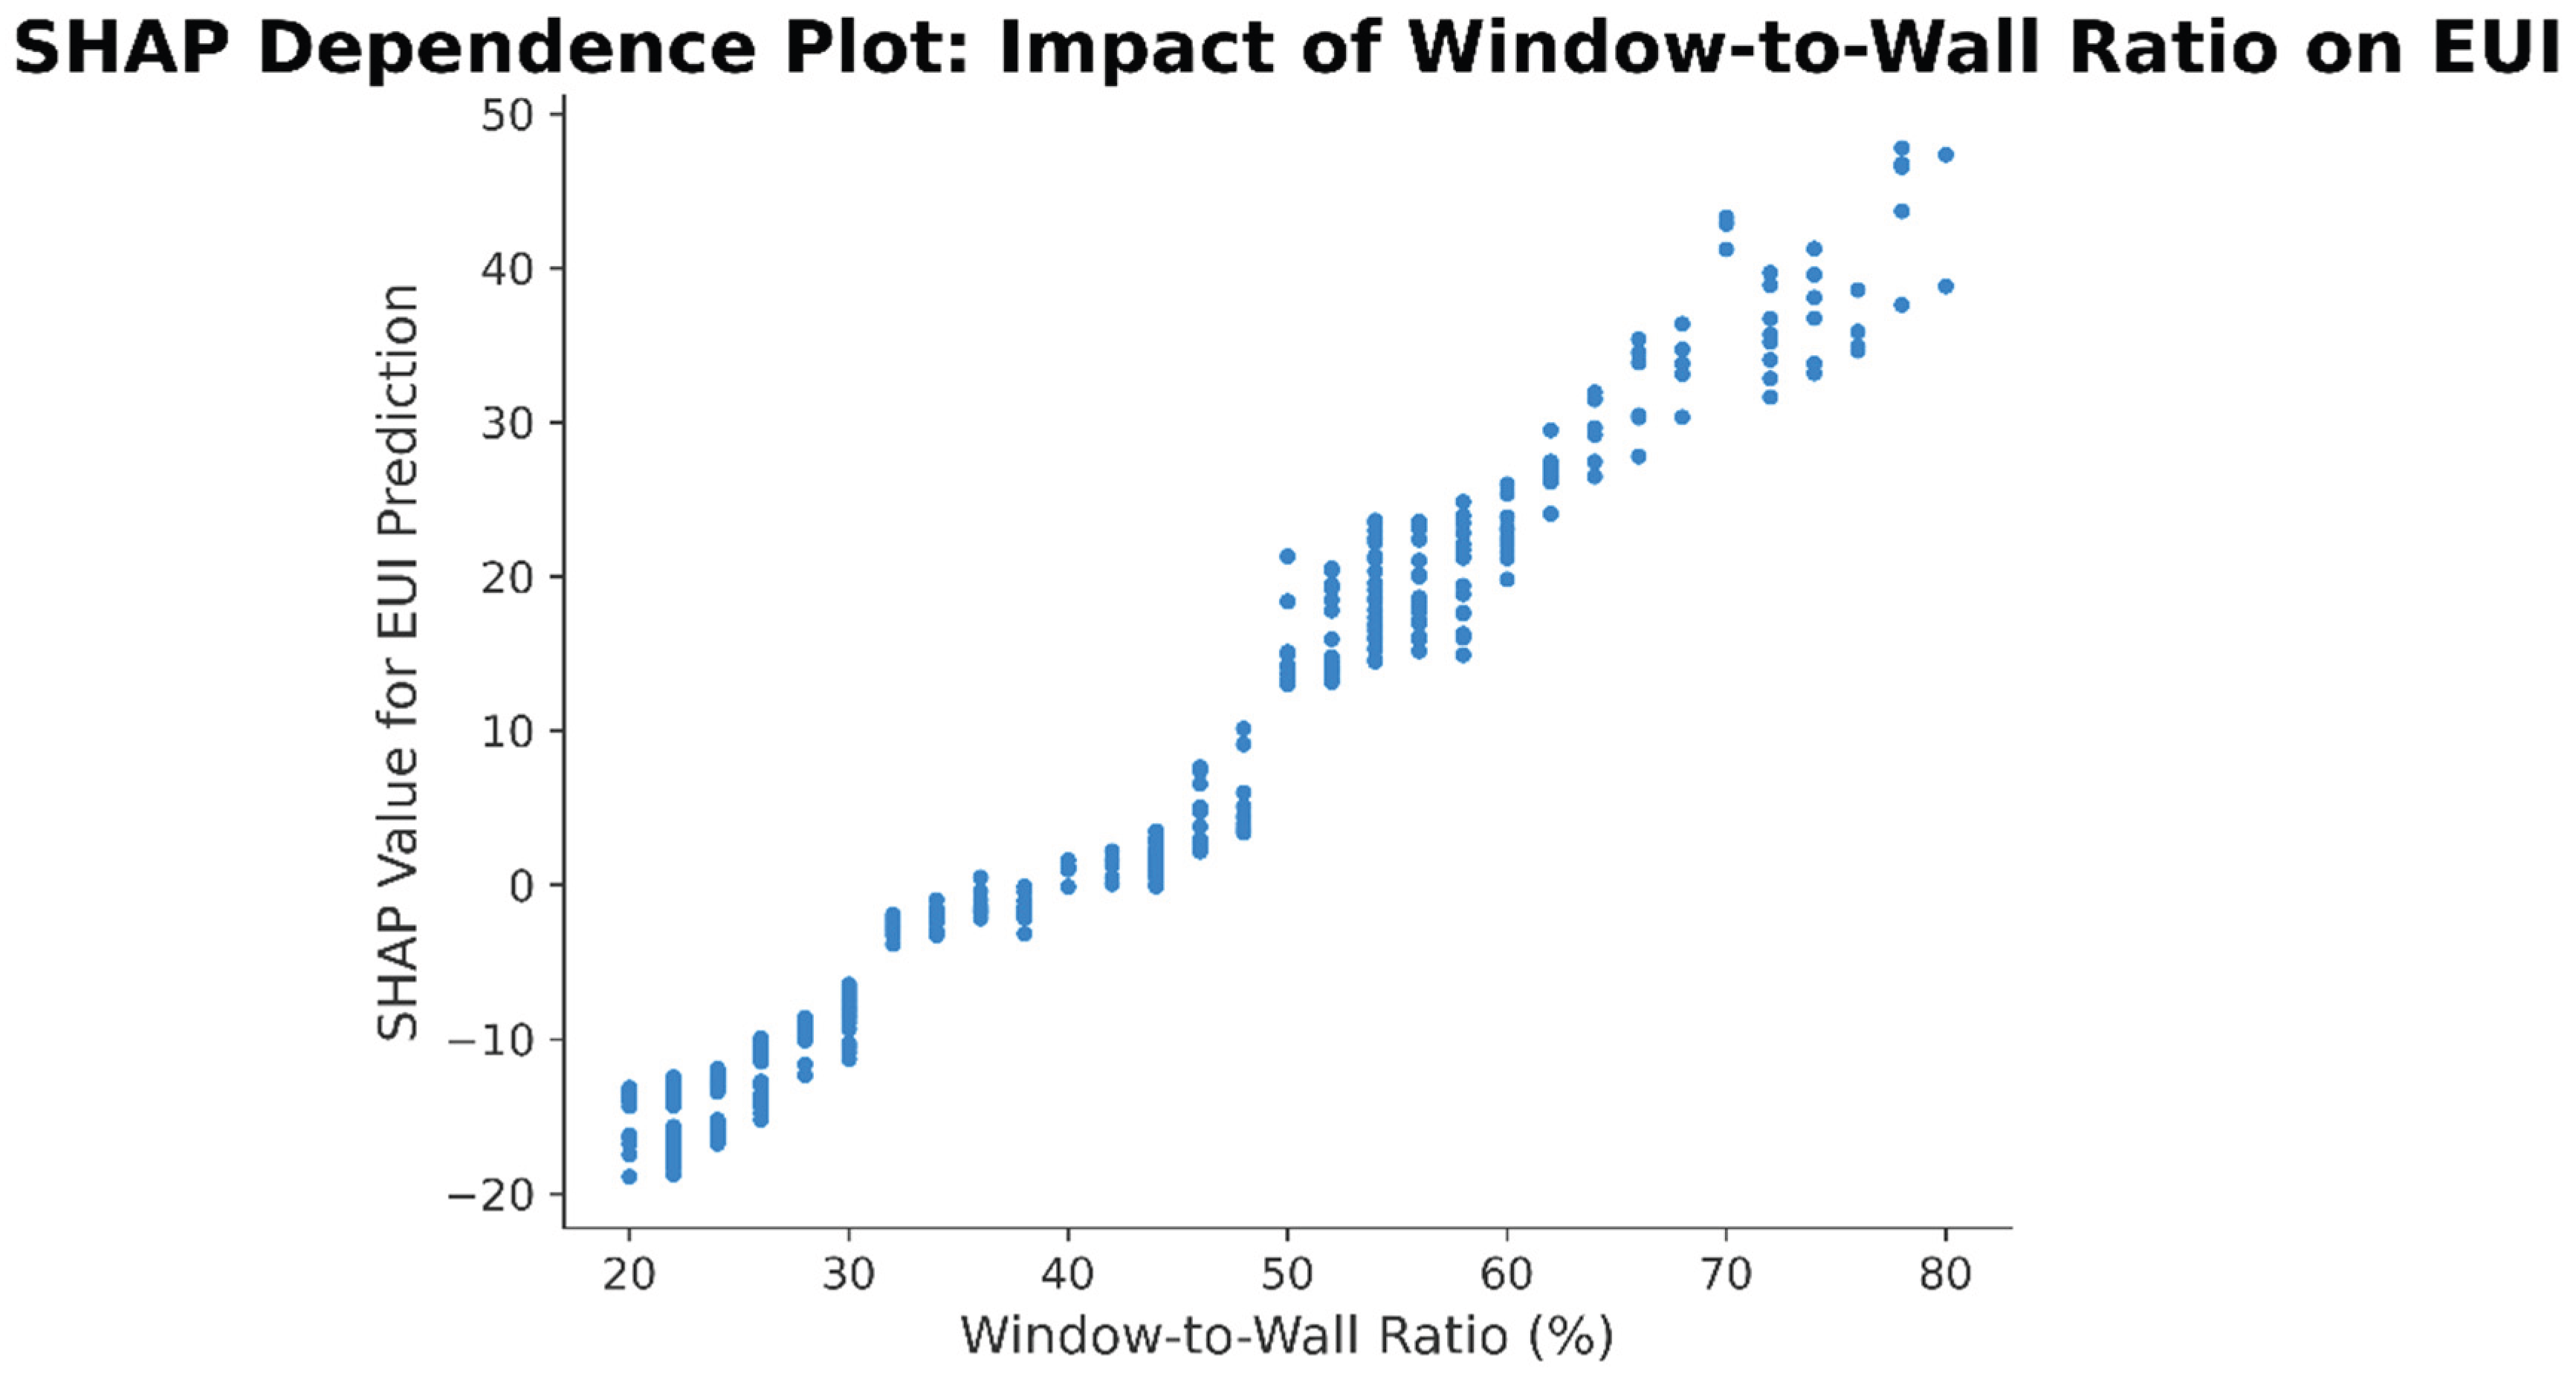
The EUI SHAP dependence plot for WWR shows a strong positive relationship. Higher WWR values consistently produced positive SHAP values, indicating increased predicted EUI. Lower WWR values produced negative SHAP values, indicating reduced EUI relative to the model average. The relationship was nearly monotonic across the tested range, confirming that larger glazing proportions increased cooling demand under Gulf coastal conditions.
Figure 8.
SHAP dependence plot showing the effect of window-to-wall ratio on predicted annual energy use intensity. Positive SHAP values indicate an increase in predicted EUI, whereas negative values indicate a reduction.
Figure 8.
SHAP dependence plot showing the effect of window-to-wall ratio on predicted annual energy use intensity. Positive SHAP values indicate an increase in predicted EUI, whereas negative values indicate a reduction.
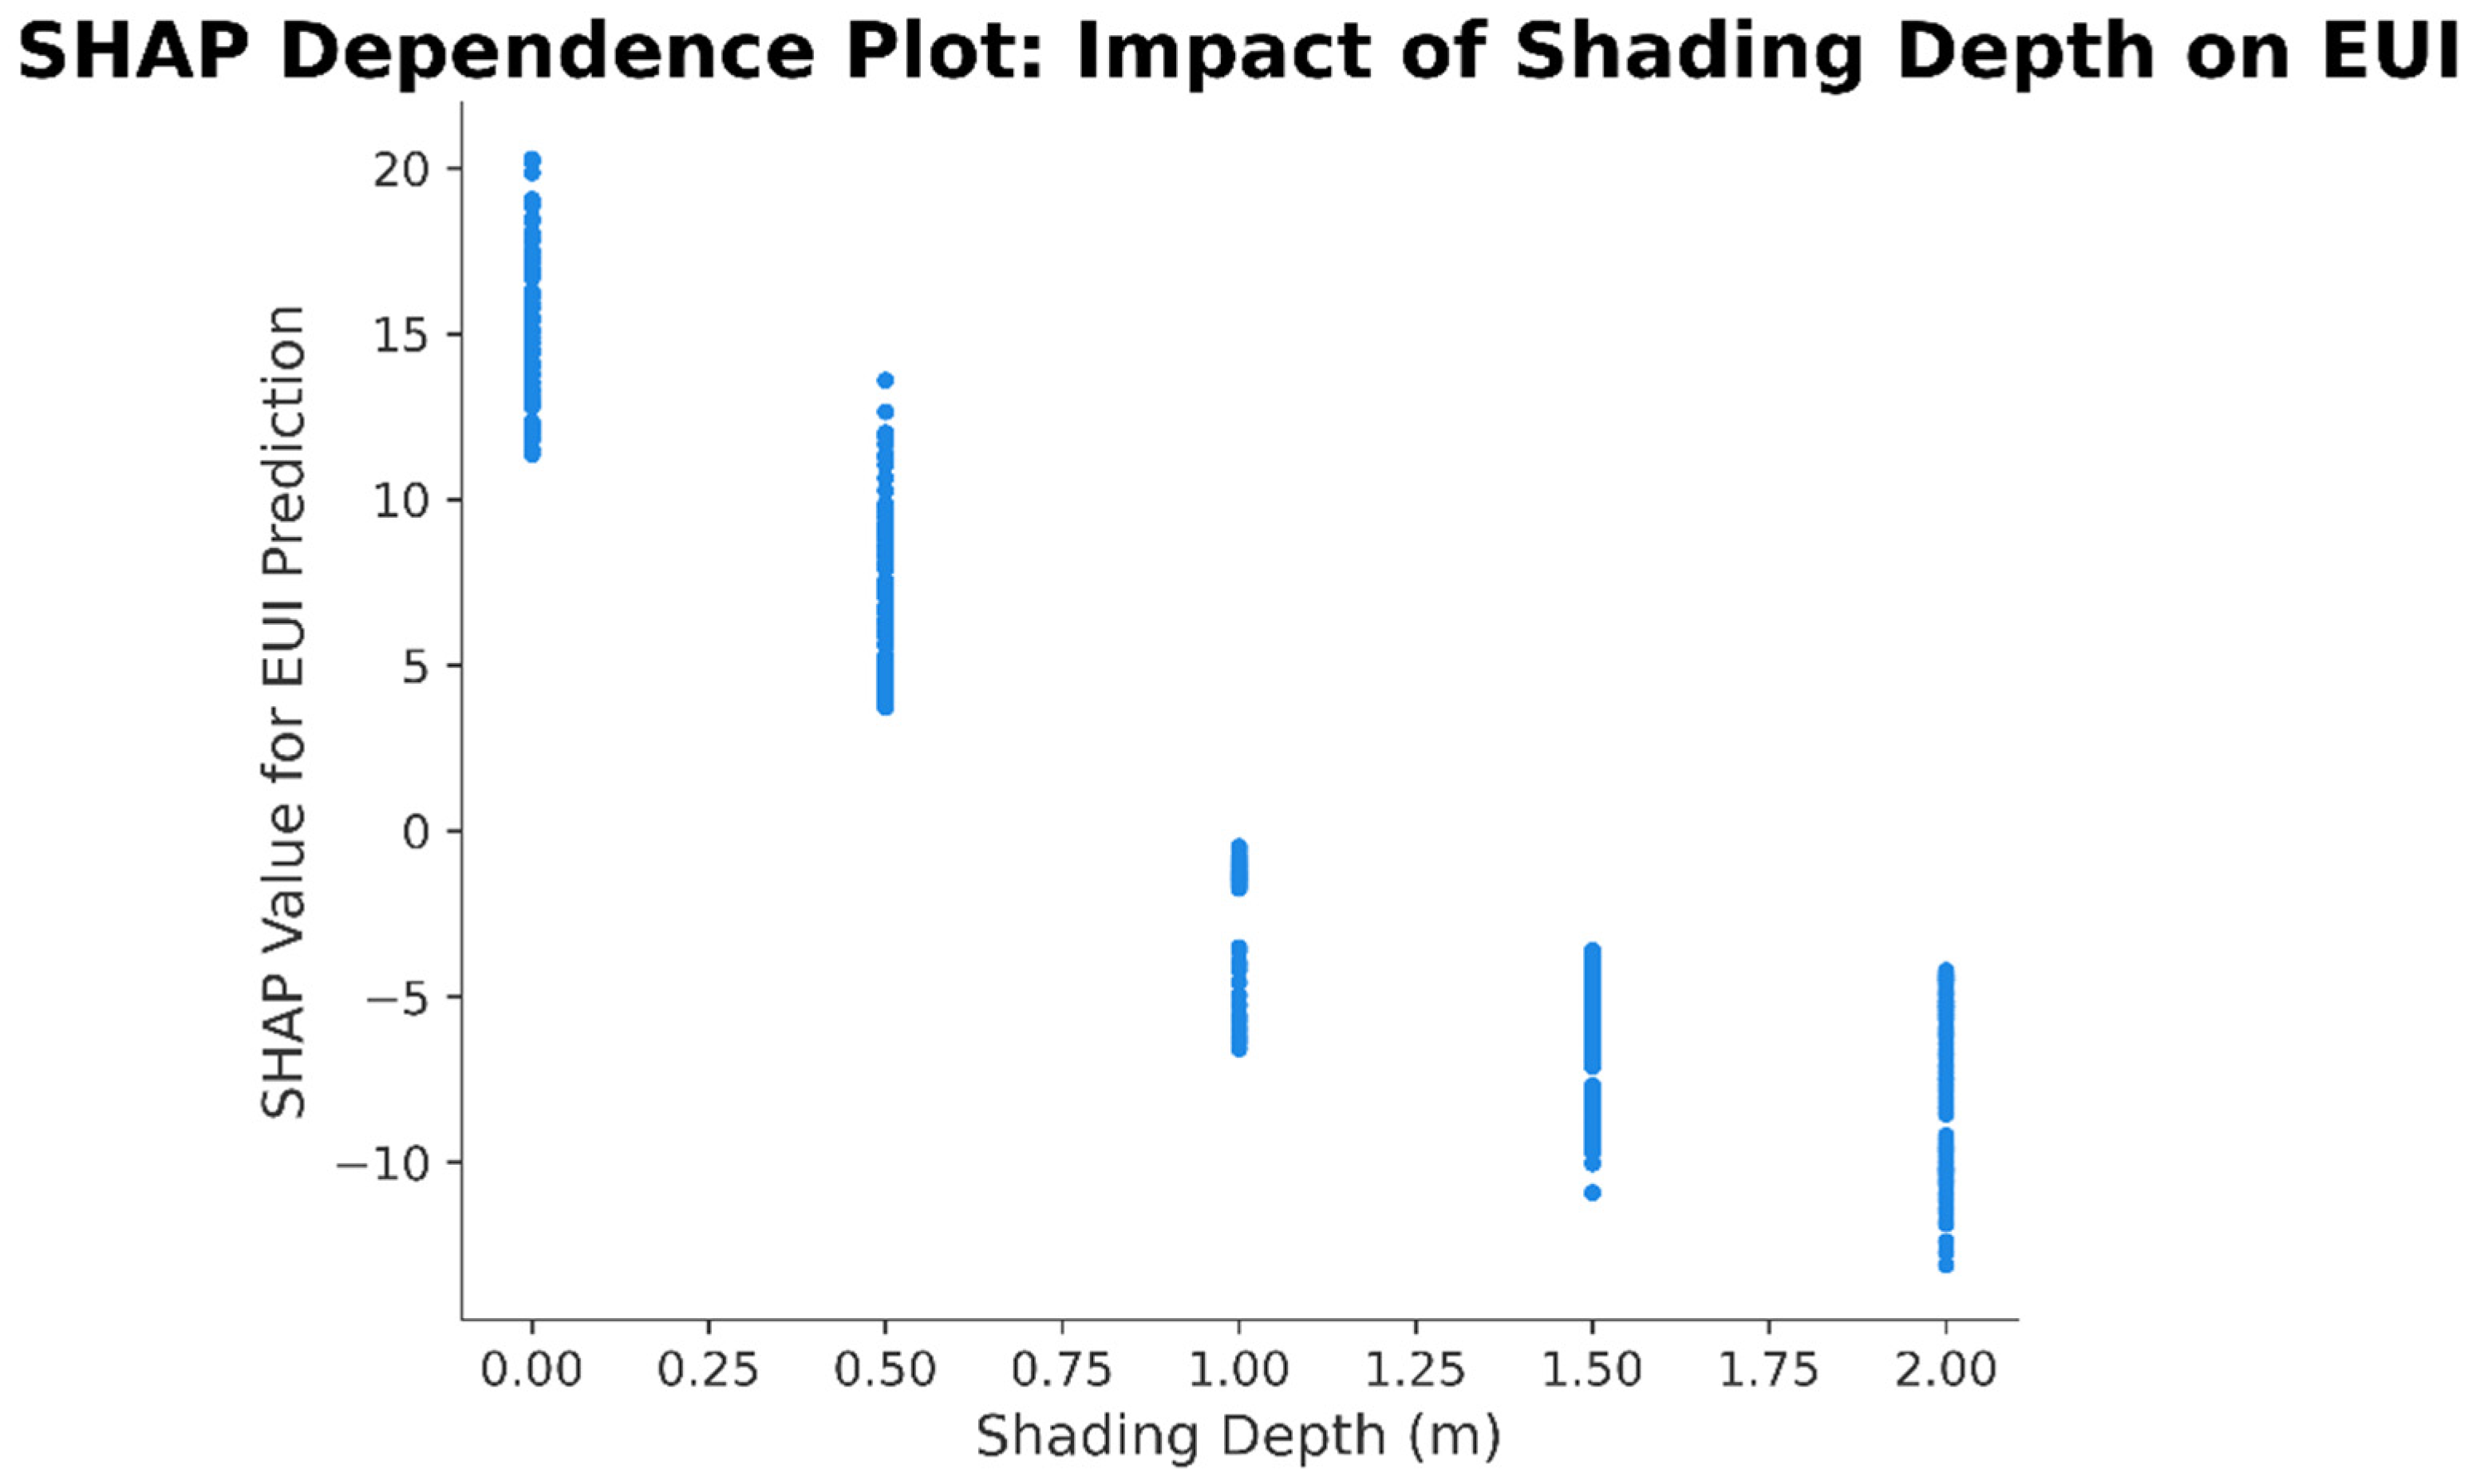
Shading depth produced the opposite directional pattern. Zero or shallow shading generated positive SHAP contributions to EUI, while deeper shading generally produced negative contributions. The effect became more pronounced as shading depth increased from 0.0 m to 2.0 m. This indicates that shading depth reduced solar gains and annual cooling demand. The relationship is particularly relevant because shading was also associated with higher capital cost. It therefore represents a clear multi-objective trade-off rather than an unconditional recommendation.
Figure 9.
SHAP dependence plot showing the effect of shading depth on predicted annual energy use intensity. Positive SHAP values indicate an increase in predicted EUI, whereas negative values indicate a reduction.
Figure 9.
SHAP dependence plot showing the effect of shading depth on predicted annual energy use intensity. Positive SHAP values indicate an increase in predicted EUI, whereas negative values indicate a reduction.
For capital cost, wall construction had a mean absolute SHAP value of £7,380.58, substantially higher than WWR at £3,245.41. Shading depth ranked third at £1,161.65, followed by shading type at £770.03 and glazing type at £371.24. These results show that the cost structure was governed mainly by material and construction-system selection. The strong influence of wall type reflects the large surface area of opaque façade elements in the villa prototype and the cost differences among the tested wall assemblies.
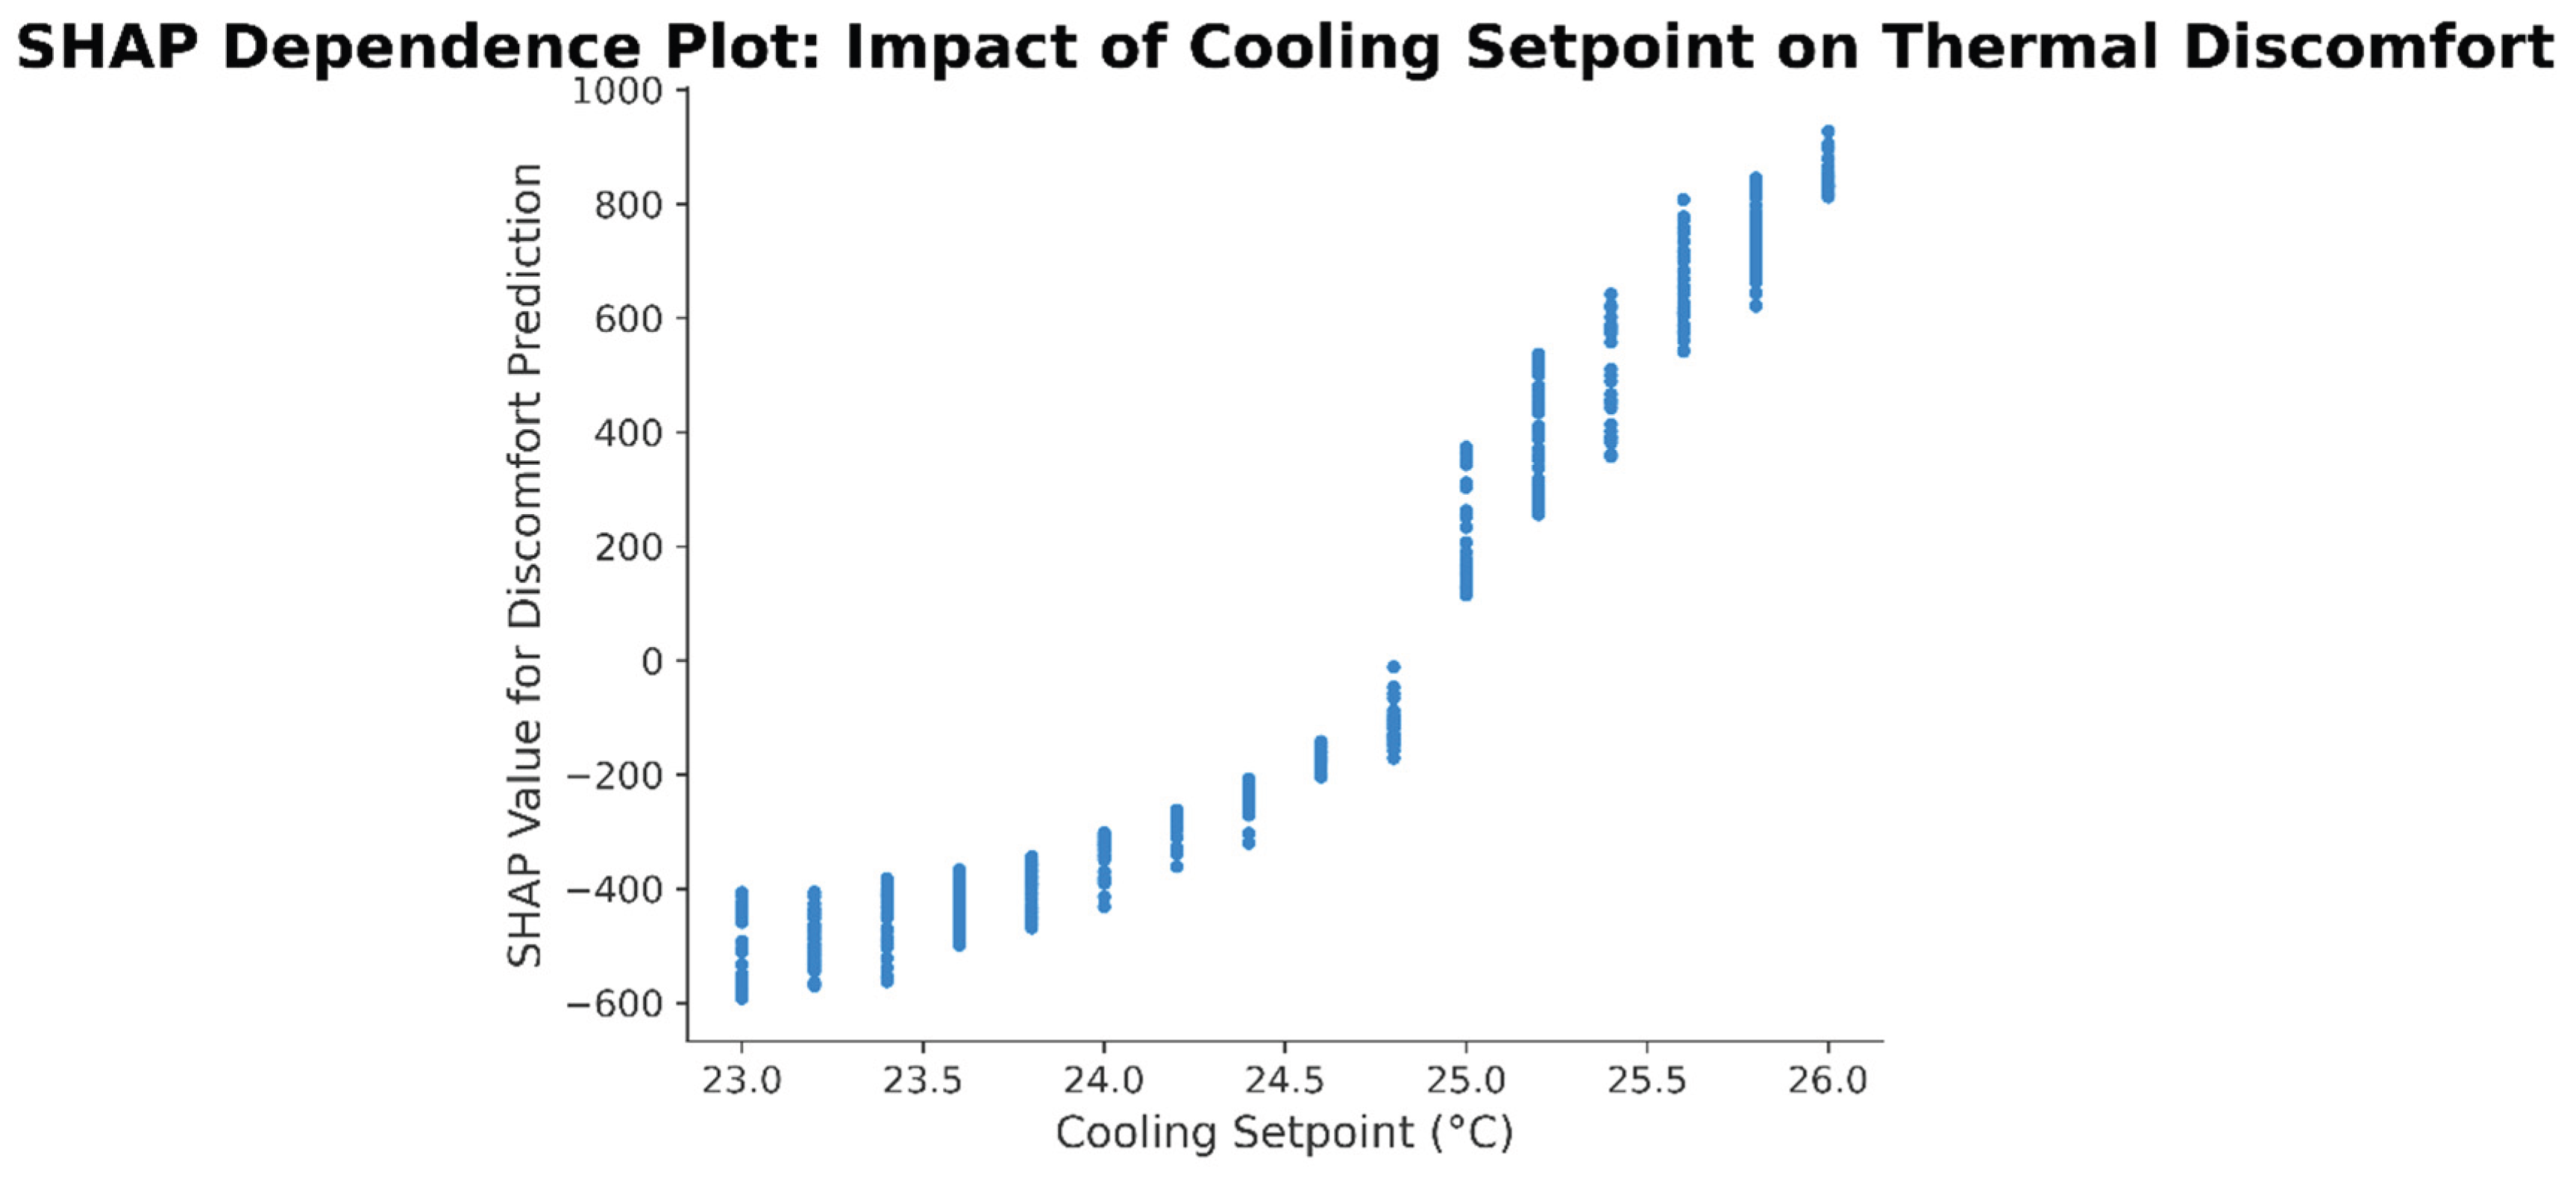
For discomfort, cooling setpoint had the highest mean absolute SHAP value at 429.58 h/year. WWR ranked second at 296.21 h/year, followed by shading depth at 155.71 h/year. The cooling-setpoint dependence relationship was strongly positive: higher cooling setpoints increased predicted discomfort hours. This result reflects the direct relationship between thermostat control and the number of hours in which indoor conditions fall outside the ASHRAE 55 comfort range.
The SHAP findings reveal an important tension. A higher cooling setpoint can reduce operational energy demand, but it also increases thermal discomfort. Conversely, a lower setpoint improves comfort but increases cooling energy. This trade-off is not a methodological limitation; it is a real design and operation decision that must be addressed by designers, clients, and building operators. The model makes this relationship explicit and quantifiable
Figure 10.
SHAP dependence plot showing the effect of cooling setpoint on predicted annual ASHRAE 55 discomfort hours. Positive SHAP values indicate an increase in predicted discomfort, whereas negative values indicate a reduction.
Figure 10.
SHAP dependence plot showing the effect of cooling setpoint on predicted annual ASHRAE 55 discomfort hours. Positive SHAP values indicate an increase in predicted discomfort, whereas negative values indicate a reduction.
4.3. AI-Derived Residential Envelope Design Rules
The combined Random Forest and SHAP results were synthesized into a set of design rules. These rules are not universal prescriptions. They apply to the tested detached villa prototype, the defined ranges of envelope alternatives, the selected HVAC assumptions, and the climate conditions represented by Dubai, Doha, and Manama. Their value lies in converting a large simulation dataset into a practical decision-support output. This interpretation is aligned with the wider principle of algorithmic sustainability, in which AI-supported environmental decisions should remain transparent, bounded by explicit assumptions, and open to professional scrutiny rather than being treated as autonomous prescriptions [24,25].
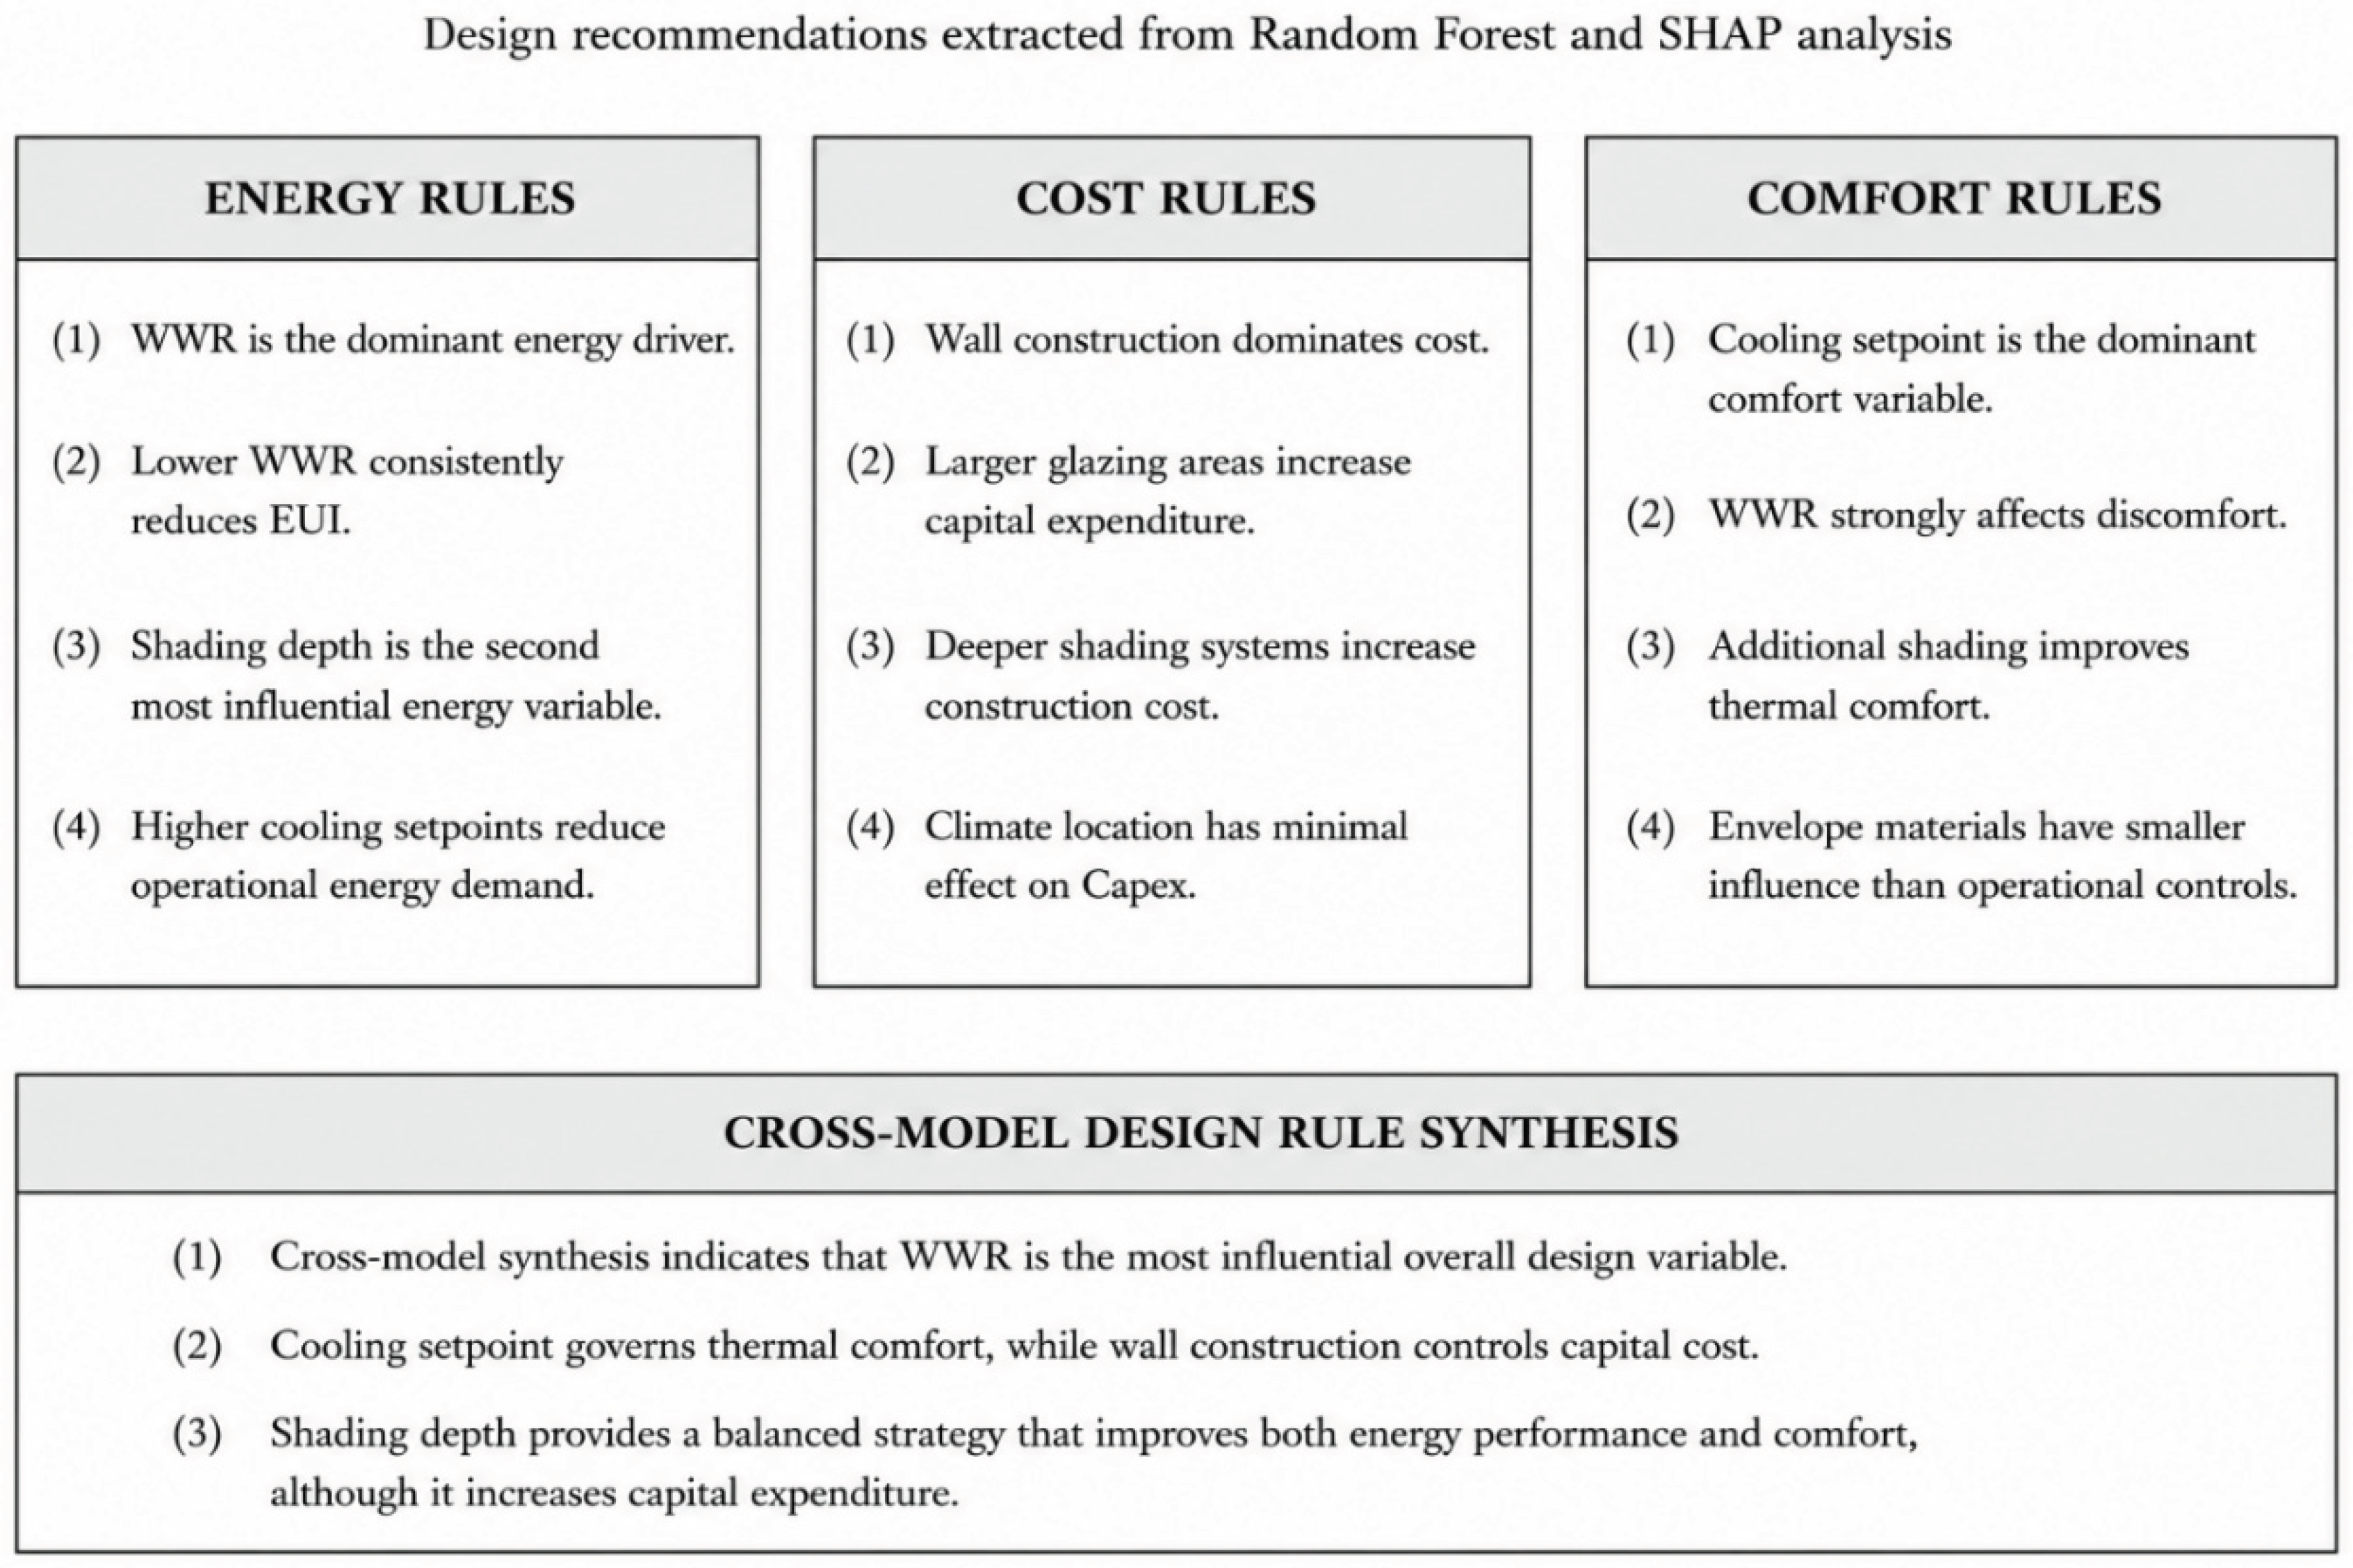
Rule 1: Keep WWR low when annual energy reduction is the primary objective.
WWR was the strongest energy driver and the second strongest comfort driver. Lower WWR values consistently reduced EUI and generally improved thermal performance. In early-stage design, WWR should therefore be treated as a primary performance decision rather than a purely aesthetic choice. Large glazed areas should be justified by daylight, views, architectural expression, or other project-specific benefits, then compensated through shading and glazing specification.
Rule 2: Use external shading as a strategic solar-control measure, but evaluate its capital-cost effect.
Shading depth was the second most influential energy variable and the third most influential comfort variable. Deeper shading reduced EUI and discomfort, particularly when combined with moderate or low WWR. However, shading also increased capital cost. The appropriate strategy is not necessarily maximum shading depth, but the selection of a depth that provides measurable thermal benefit relative to its construction cost and architectural integration.
Rule 3: Treat cooling setpoint as a comfort-critical operational variable.
Cooling setpoint had the strongest influence on discomfort but a moderate influence on EUI. Raising the setpoint can reduce cooling demand, yet the SHAP results show that it increases discomfort hours. Designers should therefore avoid treating setpoint adjustment as a simple energy-saving measure. It must be assessed alongside occupant expectations, indoor comfort criteria, occupancy patterns, and the ability of the envelope to limit solar and conductive gains.
Rule 4: Select wall construction through an affordability and lifecycle lens.
Wall construction was the dominant capital-cost variable but had limited influence on EUI and discomfort within the tested alternatives. This does not imply that wall design is unimportant. It means that, among the four tested systems, wall selection mainly changed upfront cost rather than annual operational performance. The choice should therefore consider capital budget, durability, maintenance, embodied carbon, local availability, and construction capability in addition to operational energy.
Rule 5: Do not overstate the independent effect of glazing and roof type within the tested range.
Glazing and roof construction contributed less to the three predictive models than WWR, shading depth, cooling setpoint, and wall type. Their selection remains relevant for compliance, durability, condensation control, acoustic performance, and detailed thermal design. However, they should not be assumed to compensate for high WWR or insufficient shading.
The resulting framework provides a structured sequence for early-stage decision-making. First, establish a WWR target consistent with energy and comfort priorities. Second, test shading depth against both solar-control benefit and capital cost. Third, define the cooling setpoint according to an explicit comfort strategy rather than energy reduction alone. Fourth, select the wall system according to budget and lifecycle priorities. Finally, refine glazing and roof construction as supporting design variables.
This sequence differs from conventional specification-led practice, where wall and glazing systems are often selected before the fundamental geometry of façade openness and shading has been resolved. The present results suggest that this order should be reversed for Gulf coastal villas. Early design attention should focus first on WWR, shading, and operational comfort settings because these variables have the strongest influence on the three performance objectives.
5. Discussion
5.1. Interpreting the Performance Hierarchy in Gulf Coastal Villas
This study combined dynamic building simulation, tri-objective optimization, Random Forest learning, and SHAP explainability to identify the envelope and operational variables that most strongly influence energy use, capital cost, and thermal comfort in detached residential villas across Dubai, Doha, and Manama. The central result is not simply that one design alternative outperformed another. Rather, the analysis reveals a clear hierarchy of decision variables: window-to-wall ratio governed annual energy use, wall construction governed capital cost, and cooling setpoint governed annual thermal discomfort.
This hierarchy has direct implications for early-stage villa design in Gulf coastal climates. Architectural decisions are often made through a sequence that prioritizes visual composition, façade materials, and glazing specification. Thermal performance is then addressed through mechanical cooling capacity, thicker insulation, or higher-performance glazing. The present findings suggest that this sequence can be inefficient. The strongest performance levers were not the detailed material selections alone. They were the proportion of glazing, the geometry of external shading, and the indoor temperature target used to operate the cooling system.
The dominance of WWR in the EUI model is particularly important. WWR accounted for 65.3% of grouped feature importance and had the highest mean absolute SHAP contribution. Across the tested range, larger glazed areas consistently increased predicted EUI. This result is physically coherent for cooling-dominated Gulf climates, where solar gains through glazing increase cooling demand for much of the year. It also indicates that the energy implications of façade openness are more substantial than the effects of changing among the tested glazing, wall, and roof options.
This finding should not be interpreted as an argument against glazing. Windows remain essential for daylight, views, spatial quality, visual connection, and architectural identity. However, the results indicate that glazing area should be treated as a performance-critical variable. Large glazed façades require a deliberate mitigation strategy that includes external shading, orientation-sensitive façade design, glazing specification, and appropriate HVAC control. In the absence of such measures, increasing WWR is likely to create a persistent operational energy penalty.
Shading depth was the second most influential energy variable and also contributed meaningfully to discomfort reduction. The SHAP results showed that deeper shading generally reduced predicted EUI. This supports the use of external shading as a primary solar-control strategy in Gulf villas. Importantly, shading operates before solar radiation enters the building. It therefore reduces cooling loads more directly than many interior or mechanical interventions.
The cost implications of shading must nevertheless be recognized. Shading depth and shading type increased capital expenditure. This creates a practical trade-off. The lowest-energy option is not automatically the most cost-effective option, particularly where deep overhangs, fins, screens, or custom façade elements require substantial fabrication and structural support. The appropriate design response is therefore not maximum shading in every case. It is performance-based shading, selected according to façade orientation, glazing proportion, solar exposure, architectural form, and construction budget.
The results also show that city identity contributed relatively little to the predictive models. This does not mean that Dubai, Doha, and Manama have identical climates. Their weather files produced different baseline EUI and discomfort values, and the best-performing alternatives were not identical across cities. However, the explanatory analysis indicates that the tested design variables generated more variation in the outcomes than the categorical city variable. This suggests that a common performance framework can be applied across Gulf coastal cities, while detailed calibration should still respond to local humidity, solar conditions, wind patterns, and cooling-season characteristics.
5.2. Energy–Cost–Comfort Trade-Offs and Design Implications
The multi-objective results demonstrate that energy, cost, and comfort cannot be optimized independently. The scatter plots showed that low-EUI solutions were not always the lowest-cost alternatives, and low-energy cases did not always provide the lowest discomfort hours. These relationships are expected in cooling-dominated residential buildings, but the present framework makes them explicit through a unified dataset.
The clearest trade-off occurred between cooling setpoint, energy demand, and thermal comfort. Cooling setpoint had a moderate influence on EUI but was the strongest predictor of discomfort hours, accounting for 51.2% of feature importance. The SHAP dependence results showed that increasing the cooling setpoint raised predicted discomfort. This finding reflects a basic operational reality: allowing indoor temperatures to rise reduces cooling energy, but it also increases the number of hours in which occupants experience conditions outside the selected ASHRAE 55 comfort criteria.
The practical implication is that cooling setpoint should not be used as a simplistic energy-saving adjustment. A recommendation to increase cooling setpoints must be accompanied by an explicit comfort strategy. This may include improved shading, lower WWR, ceiling fans, occupant-adaptive comfort controls, zoning, smart thermostats, or occupant education. Without such supporting measures, energy reductions achieved through higher setpoints may shift the burden to occupants through increased discomfort.
Wall construction produced the strongest capital-cost effect, accounting for 71.7% of feature importance. Yet it had limited influence on EUI and discomfort within the tested alternatives. This result is significant because wall systems are often selected on the assumption that higher-cost thermal assemblies will automatically produce proportionally better operational performance. The results indicate that, in this particular design space, the wall alternatives changed initial cost much more than they changed annual energy or comfort outcomes.
This does not reduce the importance of wall construction. Wall systems affect durability, moisture resistance, construction speed, maintenance, embodied carbon, acoustic performance, fire safety, and local supply chains. The finding instead suggests that wall selection should be evaluated through a broader lifecycle and affordability perspective rather than being assumed to be the dominant operational-energy measure. For the tested villa prototype, reducing glazing area and improving shading produced larger energy effects than changing among the available wall systems.
The role of glazing type was also smaller than might be expected. Glazing type contributed only 1.7% of EUI importance, 1.0% of cost importance, and 1.4% of discomfort importance. This result should be interpreted carefully. It does not imply that glazing specification is irrelevant. It indicates that, within the selected six glazing alternatives and the broader tested WWR range, the amount of glazing mattered more than the specific glazing type. A high-performance glazing system can reduce solar gains, but it cannot fully offset the energy implications of a very large glazed façade.
Roof construction had the lowest influence across all three models. This may reflect the relatively narrow range of roof alternatives, all of which were code-standard flat-roof systems. A study including highly reflective roofs, larger insulation differences, ventilated roof cavities, green roofs, photovoltaic systems, or roof-integrated shading could produce different results. The current conclusion should therefore remain bounded by the tested roof options.
Table 8.
Cross-model synthesis of design-variable influence and practical interpretation.
| Variable | Energy influence | Cost influence | Comfort influence | Practical interpretation |
| Window-to-wall ratio | Very high | High | Very high | Establish WWR early; large glazing areas require mitigation. |
| Shading depth | High | Moderate | High | Use external shading strategically; evaluate cost against performance benefit. |
| Cooling setpoint | Moderate | Negligible | Very high | Define setpoint through a comfort strategy, not energy reduction alone. |
| Wall construction | Low | Very high | Negligible | Select based on budget, lifecycle, durability, and embodied-carbon priorities. |
| Glazing type | Low | Low | Low | Use as a supporting measure after WWR and shading are resolved. |
| Roof construction | Very low | Very low | Very low | Refine during detailed design; broader roof options may change this result. |
The synthesis confirms that the design process should be objective-specific. If the project priority is operational energy reduction, WWR and shading should receive the greatest attention. If the priority is upfront affordability, wall construction is the primary decision. If the priority is indoor comfort, cooling setpoint, WWR, and shading must be considered together. The framework therefore supports a more transparent conversation between architects, engineers, clients, and developers about what is being prioritized and what trade-offs are acceptable.
5.3. Contribution, Transferability, and Limitations
The methodological contribution of the study lies in linking simulation-based optimization to explainable machine learning. Building performance simulation can generate large numbers of design alternatives, but raw simulation outputs are difficult to translate into design guidance. Optimization can identify efficient alternatives, yet it does not always explain why those alternatives perform well or which variables should be prioritized in future projects. Random Forest learning and SHAP analysis address this limitation by extracting patterns from the simulated dataset and converting them into interpretable variable hierarchies.
The resulting design rules are more useful than a list of isolated optimum cases. Instead of stating that one villa configuration is best for one city, the framework identifies recurring relationships: lower WWR reduces energy demand; deeper shading reduces solar-related energy and comfort penalties; higher cooling setpoints increase discomfort; wall construction drives initial cost. These findings can guide early-stage decision-making before detailed simulation is undertaken for a specific project.
The framework also supports transferability across Gulf coastal contexts, where climate-responsive building design must be considered alongside the wider environmental implications of rapid coastal urbanization and resource-intensive development [32]. Dubai, Doha, and Manama share cooling-dominated conditions, high solar exposure, and substantial reliance on mechanical cooling. The low relative importance of city identity suggests that the principal rules may be relevant across comparable coastal Gulf locations. However, transferability should not be interpreted as direct replication. Detailed design must still account for local weather data, humidity levels, solar geometry, local construction costs, building codes, occupancy patterns, and client comfort expectations.
Several limitations define the scope of the findings. First, the study used a standardized detached villa prototype. The results may not transfer directly to apartments, courtyard houses, high-rise residential buildings, or mixed-use developments. Second, the building model was not calibrated against measured energy data from an occupied villa. The results should therefore be interpreted as comparative simulation outcomes rather than measured operational performance.
Third, the study evaluated a defined range of envelope and operational variables. Other important variables were not included, such as building orientation, natural ventilation, daylight autonomy, visual comfort, air movement, photovoltaic generation, thermal storage, smart control systems, occupancy behavior, and embodied carbon as an optimization objective. Fourth, discomfort was represented through annual ASHRAE 55 discomfort hours. This metric provides a consistent basis for comparison but does not capture every dimension of perceived comfort, including air movement, clothing adaptation, behavioral control, or cultural expectations.
Finally, the Random Forest and SHAP models identify relationships within the generated simulation dataset. They do not establish causal relationships beyond the tested conditions. The models explain how the simulation engine responded to the selected design space; they do not replace physical validation, post-occupancy evaluation, or project-specific engineering analysis.
Despite these limitations, the results provide a robust basis for decision support. The study demonstrates that explainable machine learning can transform simulation outputs into practical, transparent design knowledge. For Gulf coastal villas, the evidence suggests that early design attention should focus first on WWR, shading depth, and cooling setpoint, while wall construction should be selected through a cost and lifecycle perspective.
6. Conclusions
6.1. Summary of the Study
This study developed an explainable simulation-to-design framework for cost-aware and climate-responsive residential envelope design in Gulf coastal cities. The framework integrated dynamic building performance simulation, tri-objective optimization, Random Forest regression, and SHAP-based explainability. It was applied to a standardized detached villa prototype simulated under the climatic conditions of Dubai, Doha, and Manama.
The study addressed a practical gap in building-performance research. Simulation and optimization can generate many design alternatives, but the resulting datasets are often difficult for architects, engineers, developers, and policy actors to interpret. A large number of simulations may identify high-performing configurations without clarifying which design decisions matter most, how those decisions affect competing objectives, or whether the findings can be transferred to similar climatic contexts.
The proposed framework addressed this limitation by converting simulation outputs into interpretable design rules. The optimization process evaluated annual energy use intensity, total capital cost, and annual ASHRAE 55 discomfort hours. The resulting dataset was then used to train separate Random Forest models for each performance outcome. SHAP analysis was subsequently used to identify the relative contribution and directional influence of the design variables.
The results demonstrate that the simulated design space was sufficiently structured for accurate predictive modelling. The Random Forest models achieved R² values of 0.933 for EUI, 0.982 for capital cost, and 0.955 for discomfort hours. These values confirm that the selected design variables captured the main performance relationships represented in the simulation dataset. The models therefore provided a credible basis for explainable analysis.
The baseline results also confirmed the need for performance-driven design intervention. The reference villa recorded EUI values between 217.59 and 231.06 kWh/m²·yr across the three cities, while annual discomfort hours exceeded 3,500 h in all cases. The simulation dataset showed that major improvements were possible through alternative combinations of envelope and operational variables. Minimum EUI values ranged from 73.61 kWh/m²·yr in Manama to 81.08 kWh/m²·yr in Doha. These reductions demonstrate the potential of early-stage envelope and operational decisions to improve the performance of detached villas in cooling-dominated Gulf coastal climates.
6.2. Principal Findings and Design Implications
The explainable analysis identified a consistent hierarchy of design variables across the three objectives.
First, WWR was the dominant driver of annual energy use. It accounted for 65.3% of Random Forest feature importance in the EUI model and had the highest mean absolute SHAP contribution. Higher WWR values consistently increased predicted EUI, while lower WWR values reduced cooling-related energy demand. This result confirms that façade openness should be treated as an early-stage energy decision rather than a later aesthetic adjustment.
Second, shading depth was the second most influential energy variable and a major contributor to thermal-comfort performance. Deeper shading generally reduced EUI and discomfort by limiting solar gains before they entered the building. However, shading also increased capital cost. The result therefore supports a performance-based shading strategy in which depth, geometry, orientation, and construction cost are evaluated together rather than applying a uniform shading solution to all façades.
Third, cooling setpoint was the dominant driver of annual discomfort hours. It accounted for 51.2% of feature importance in the comfort model and produced the strongest SHAP contribution to predicted discomfort. Higher cooling setpoints reduced energy demand but increased annual discomfort hours. This result demonstrates a direct operational trade-off: energy savings achieved through relaxed cooling targets may reduce indoor comfort unless they are supported by effective solar control, lower WWR, air movement, or occupant-adaptive strategies.
Fourth, wall construction was the primary determinant of capital cost. It accounted for 71.7% of cost-model feature importance, substantially exceeding the contribution of WWR and shading depth. However, wall construction had limited influence on EUI and discomfort within the tested alternatives. This suggests that wall selection should be evaluated primarily through affordability, durability, constructability, maintenance, embodied carbon, and lifecycle criteria, rather than being assumed to be the strongest operational-energy intervention.
Finally, glazing type and roof construction had lower relative importance across the three models. Their role should not be dismissed. They remain relevant for detailed thermal design, durability, code compliance, acoustic performance, condensation control, and architectural specification. However, the results indicate that they should be treated as supporting variables after WWR, shading depth, cooling setpoint, and wall system have been addressed.
The core design implication is therefore clear: Gulf coastal villa design should prioritize the sequence of façade openness, external shading, thermal-comfort operation, and wall-system affordability. This sequence is more performance-sensitive than a conventional specification-led process that begins with material selection and glazing type.
6.3. Contributions, Application, and Future Research
The study makes three principal contributions:
The first contribution is methodological. It demonstrates a replicable workflow that connects simulation, multi-objective optimization, predictive learning, and explainable AI. Rather than treating optimization as the final analytical stage, the framework uses optimization outputs as a structured dataset for machine-learning interpretation. This allows the analysis to move beyond identifying individual high-performing solutions toward identifying the recurring rules that explain performance variation.
The second contribution is practical. The framework provides decision-support knowledge that can be used during early design. It helps architects and engineers understand which variables should be prioritized when energy, cost, and comfort objectives conflict. The approach can also support client discussions by making trade-offs explicit. For example, it can show that deeper shading may reduce annual energy use but increase capital expenditure, or that raising the cooling setpoint may reduce energy demand while increasing discomfort hours.
The third contribution is regional. The study provides evidence from three Gulf coastal cities rather than treating the region as climatically uniform. Although city identity had a relatively low influence compared with WWR, shading depth, cooling setpoint, and wall construction, baseline differences remained visible. The findings therefore support a transferable Gulf coastal design framework while recognizing the need for local weather-file calibration and project-specific assessment.
The framework can be extended in several directions. Future work should incorporate embodied carbon as a fourth objective so that the trade-off between operational energy, upfront cost, thermal comfort, and lifecycle carbon can be evaluated directly. This is especially important because wall construction strongly influenced capital cost and is also likely to affect embodied emissions.
Future studies should also include daylight autonomy, visual comfort, glare risk, natural ventilation, air movement, photovoltaic generation, roof reflectance, thermal storage, smart controls, and occupant behavior. These additions would produce a more comprehensive representation of residential performance. In particular, the integration of adaptive comfort models and ceiling-fan strategies could improve the interpretation of cooling-setpoint trade-offs.
Further research should test the framework using calibrated case-study villas with measured energy data and post-occupancy comfort surveys. Such validation would strengthen confidence in the simulation assumptions and help distinguish between modelled discomfort and actual occupant experience. The approach should also be extended to other residential typologies, including apartments, courtyard houses, townhouses, and high-rise buildings.
In conclusion, the study shows that explainable machine learning can convert large simulation datasets into clear and usable design intelligence. For the tested Gulf coastal villa prototype, WWR was the primary energy lever, shading depth was the principal solar-control measure, cooling setpoint was the critical comfort variable, and wall construction was the dominant capital-cost determinant. These findings provide a transparent basis for climate-responsive, cost-aware, and comfort-sensitive residential envelope design.
Funding
This research received no external funding.
Institutional Review Board Statement
Not applicable.
Informed Consent Statement
Not applicable.
Data Availability Statement
The simulation dataset and derived analysis outputs generated during the current study are available from the corresponding author upon reasonable request.
Acknowledgments
The authors acknowledge IMAGINE Studios for providing research support, computational resources, and technical infrastructure that facilitated the simulation, optimization, machine-learning analysis, and preparation of this study.
Conflicts of Interest
The authors declare no conflicts of interest.
Abbreviations
The following abbreviations are used in this manuscript:
| Abbreviation | Full Term |
| ACH | Air Changes per Hour |
| ASHRAE | American Society of Heating, Refrigerating and Air-Conditioning Engineers |
| CO₂ | Carbon Dioxide |
| COP | Coefficient of Performance |
| EUI | Energy Use Intensity |
| EPW | EnergyPlus Weather File |
| HVAC | Heating, Ventilation, and Air Conditioning |
| MAE | Mean Absolute Error |
| NSGA-II | Non-Dominated Sorting Genetic Algorithm II |
| R² | Coefficient of Determination |
| RF | Random Forest |
| SHAP | Shapley Additive Explanations |
| WWR | Window-to-Wall Ratio |
References
- United Nations Environment Programme; Global Alliance for Buildings and Construction (GlobalABC). Global Status Report for Buildings and Construction - Beyond Foundations: Mainstreaming Sustainable Solutions to Cut Emissions from the Buildings Sector; United Nations Environment Programme, 2024; ISBN 978-92-807-4131-5. [Google Scholar]
- International Energy Agency. Energy Efficiency 2025 – Buildings; International Energy Agency (IEA): Paris, 2025. [Google Scholar]
- Intergovernmental Panel On Climate Change (Ipcc). Climate Change 2022 – Impacts, Adaptation and Vulnerability: Working Group II Contribution to the Sixth Assessment Report of the Intergovernmental Panel on Climate Change, 1st ed.; Cambridge University Press, 2023; ISBN 978-1-009-32584-4. [Google Scholar]
- Pajek, L.; Potočnik, J.; Košir, M. The Effect of a Warming Climate on the Relevance of Passive Design Measures for Heating and Cooling of European Single-Family Detached Buildings. Energy Build. 2022, 261, 111947. [Google Scholar] [CrossRef]
- Resende, J.; Corvacho, H. Optimisation of Nearly Zero Energy Building Envelope for Passive Thermal Comfort in Southern Europe. Buildings 2024, 14, 2757. [Google Scholar] [CrossRef]
- Sayadi, S.; Akander, J.; Hayati, A.; Cehlin, M. Analyzing the Climate-Driven Energy Demand and Carbon Emission for a Prototype Residential nZEB in Central Sweden. Energy Build. 2022, 261, 111960. [Google Scholar] [CrossRef]
- Albatayneh, A. Sensitivity Analysis Optimisation of Building Envelope Parameters in a Sub-Humid Mediterranean Climate Zone. Energy Explor. Exploit. 2021, 39, 2080–2102. [Google Scholar] [CrossRef]
- Taleb, H.M. Using Passive Cooling Strategies to Improve Thermal Performance and Reduce Energy Consumption of Residential Buildings in U.A.E. Buildings. Front. Archit. Res. 2014, 3, 154–165. [Google Scholar] [CrossRef]
- American Society of Heating, Refrigerating and Air-Conditioning Engineers (ASHRAE). ANSI/ASHRAE Standard 55-2023: Thermal Environmental Conditions for Human Occupancy; Atlanta, GA, USA, 2023. [Google Scholar]
- Hamdy, M.; Hasan, A.; Siren, K. A Multi-Stage Optimization Method for Cost-Optimal and Nearly-Zero-Energy Building Solutions in Line with the EPBD-Recast 2010. Energy Build. 2013, 56, 189–203. [Google Scholar] [CrossRef]
- Attia, S.; Gratia, E.; De Herde, A.; Hensen, J.L.M. Simulation-Based Decision Support Tool for Early Stages of Zero-Energy Building Design. Energy Build. 2012, 49, 2–15. [Google Scholar] [CrossRef]
- Tawfeeq, H.; Qaradaghi, A.M.A. Optimising Window-to-Wall Ratio for Enhanced Energy Efficiency and Building Intelligence in Hot Summer Mediterranean Climates. Sustainability 2024, 16, 7342. [Google Scholar] [CrossRef]
- Ozel, M. Thermal Performance and Optimum Insulation Thickness of Building Walls with Different Structure Materials. Appl. Therm. Eng. 2011, 31, 3854–3863. [Google Scholar] [CrossRef]
- Deb, K.; Pratap, A.; Agarwal, S.; Meyarivan, T. A Fast and Elitist Multiobjective Genetic Algorithm: NSGA-II. IEEE Trans. Evol. Comput. 2002, 6, 182–197. [Google Scholar] [CrossRef]
- Evins, R. A Review of Computational Optimisation Methods Applied to Sustainable Building Design. Renew. Sustain. Energy Rev. 2013, 22, 230–245. [Google Scholar] [CrossRef]
- Nguyen, A.-T.; Reiter, S.; Rigo, P. A Review on Simulation-Based Optimization Methods Applied to Building Performance Analysis. Appl. Energy 2014, 113, 1043–1058. [Google Scholar] [CrossRef]
- Ali, K.; Tintawi, G.; Bassma, M.K. AI-Guided Evolutionary Optimization of Passive Solar Design for Residential Heating Across Distinct Climate Zones. Solar 2026, 6, 13. [Google Scholar] [CrossRef]
- Bokhari, A.; Ali, K. Simulation-Based Evolutionary Optimization of Residential Buildings for Energy and Carbon Reduction Across Warm–Humid and Coastal Hot–Arid Climates. Buildings 2026, 16, 2157. [Google Scholar] [CrossRef]
- Tintawi, G.; Ali, K.; Monteiro, L.; Bassma, M.K.; Rosse Caldas, L. Material Sufficiency, Energy Use, and Life-Cycle Carbon in Hot-Arid Residential Buildings: A Pareto-Informed Multi-Criteria Evaluation of Envelope Design Strategies. 2026. [Google Scholar] [CrossRef]
- Bassma, M.K.; Tintawi, G. Envelope Design Trade-Offs for Low-Carbon Residential Buildings in Dubai: A Simulation-Based Multi-Objective Optimization Study. Int. J. Sci. Res. Arch. 2026, 19, 157–170. [Google Scholar] [CrossRef]
- Araújo, G.R.; Gomes, R.; Gomes, M.G.; Guedes, M.C.; Ferrão, P. Surrogate Models for Efficient Multi-Objective Optimization of Building Performance. Energies 2023, 16, 4030. [Google Scholar] [CrossRef]
- Ribeiro, M.T.; Singh, S.; Guestrin, C. “Why Should I Trust You?”: Explaining the Predictions of Any Classifier. In Proceedings of the Proceedings of the 22nd ACM SIGKDD International Conference on Knowledge Discovery and Data Mining; 13 August 2016, ACM: San Francisco California USA, 2016; pp. 1135–1144. [Google Scholar]
- Barredo Arrieta, A.; Díaz-Rodríguez, N.; Del Ser, J.; Bennetot, A.; Tabik, S.; Barbado, A.; Garcia, S.; Gil-Lopez, S.; Molina, D.; Benjamins, R.; et al. Explainable Artificial Intelligence (XAI): Concepts, Taxonomies, Opportunities and Challenges toward Responsible AI. Inf. Fusion 2020, 58, 82–115. [Google Scholar] [CrossRef]
- Ali, K.; Tintawi, G. Algorithmic Sustainability: Ethics, Governance, and Global Policies for AI-Driven Environmental Decision-Making. 2026. [Google Scholar] [CrossRef]
- Ali, K.; Tintawi, G. Accountability in the AI Era: Governing Environmental Impact through Algorithmic Sustainability. 2026. [Google Scholar] [CrossRef]
- Molnar, C. Interpretable Machine Learning: A Guide for Making Black Box Models Explainable, Second edition.; Christoph Molnar: Munich, Germany, 2022; ISBN 979-8-4114-6333-0. [Google Scholar]
- Lundberg, S.M.; Erion, G.; Chen, H.; DeGrave, A.; Prutkin, J.M.; Nair, B.; Katz, R.; Himmelfarb, J.; Bansal, N.; Lee, S.-I. From Local Explanations to Global Understanding with Explainable AI for Trees. Nat. Mach. Intell. 2020, 2, 56–67. [Google Scholar] [CrossRef] [PubMed]
- Shirzadi, N.; Lau, D.; Stylianou, M. Surrogate Modeling for Building Design: Energy and Cost Prediction Compared to Simulation-Based Methods. Buildings 2025, 15, 2361. [Google Scholar] [CrossRef]
- Gigasari, A.R.; Cañada-Soriano, M.; Aparicio-Fernández, C.; Vivancos, J.-L. Impact of Window-to-Wall Ratio (WWR) and Shading on Energy Demand in a Residential Building across Five Distinct Climates. Results Eng. 2025, 28, 107518. [Google Scholar] [CrossRef]
- D’Agostino, D.; D’Agostino, P.; Minelli, F.; Minichiello, F. Proposal of a New Automated Workflow for the Computational Performance-Driven Design Optimization of Building Energy Need and Construction Cost. Energy Build. 2021, 239, 110857. [Google Scholar] [CrossRef]
- Tintawi, G.; Ali, K.; Bassma, M.K. Tri-Objective Pareto Optimization of Residential Building Envelopes for Energy, Thermal Comfort, and Embodied Carbon in Inland and Coastal Hot-Arid Climates 2026.
- Ali, K.; Nogueira De Vasconcellos, V.M. Vizinhança Sustentável: Avaliação Da Sustentabilidade Da Ilha Palm Jumeirah Em Dubai. Paranoá 2020, 146–170. [Google Scholar] [CrossRef]
Figure 1.
Integrated analytical framework linking building performance simulation, NSGA-II multi-objective optimization, Random Forest predictive modelling, SHAP-based explainability, and AI-derived design rules for Gulf coastal residential villas.
Figure 1.
Integrated analytical framework linking building performance simulation, NSGA-II multi-objective optimization, Random Forest predictive modelling, SHAP-based explainability, and AI-derived design rules for Gulf coastal residential villas.
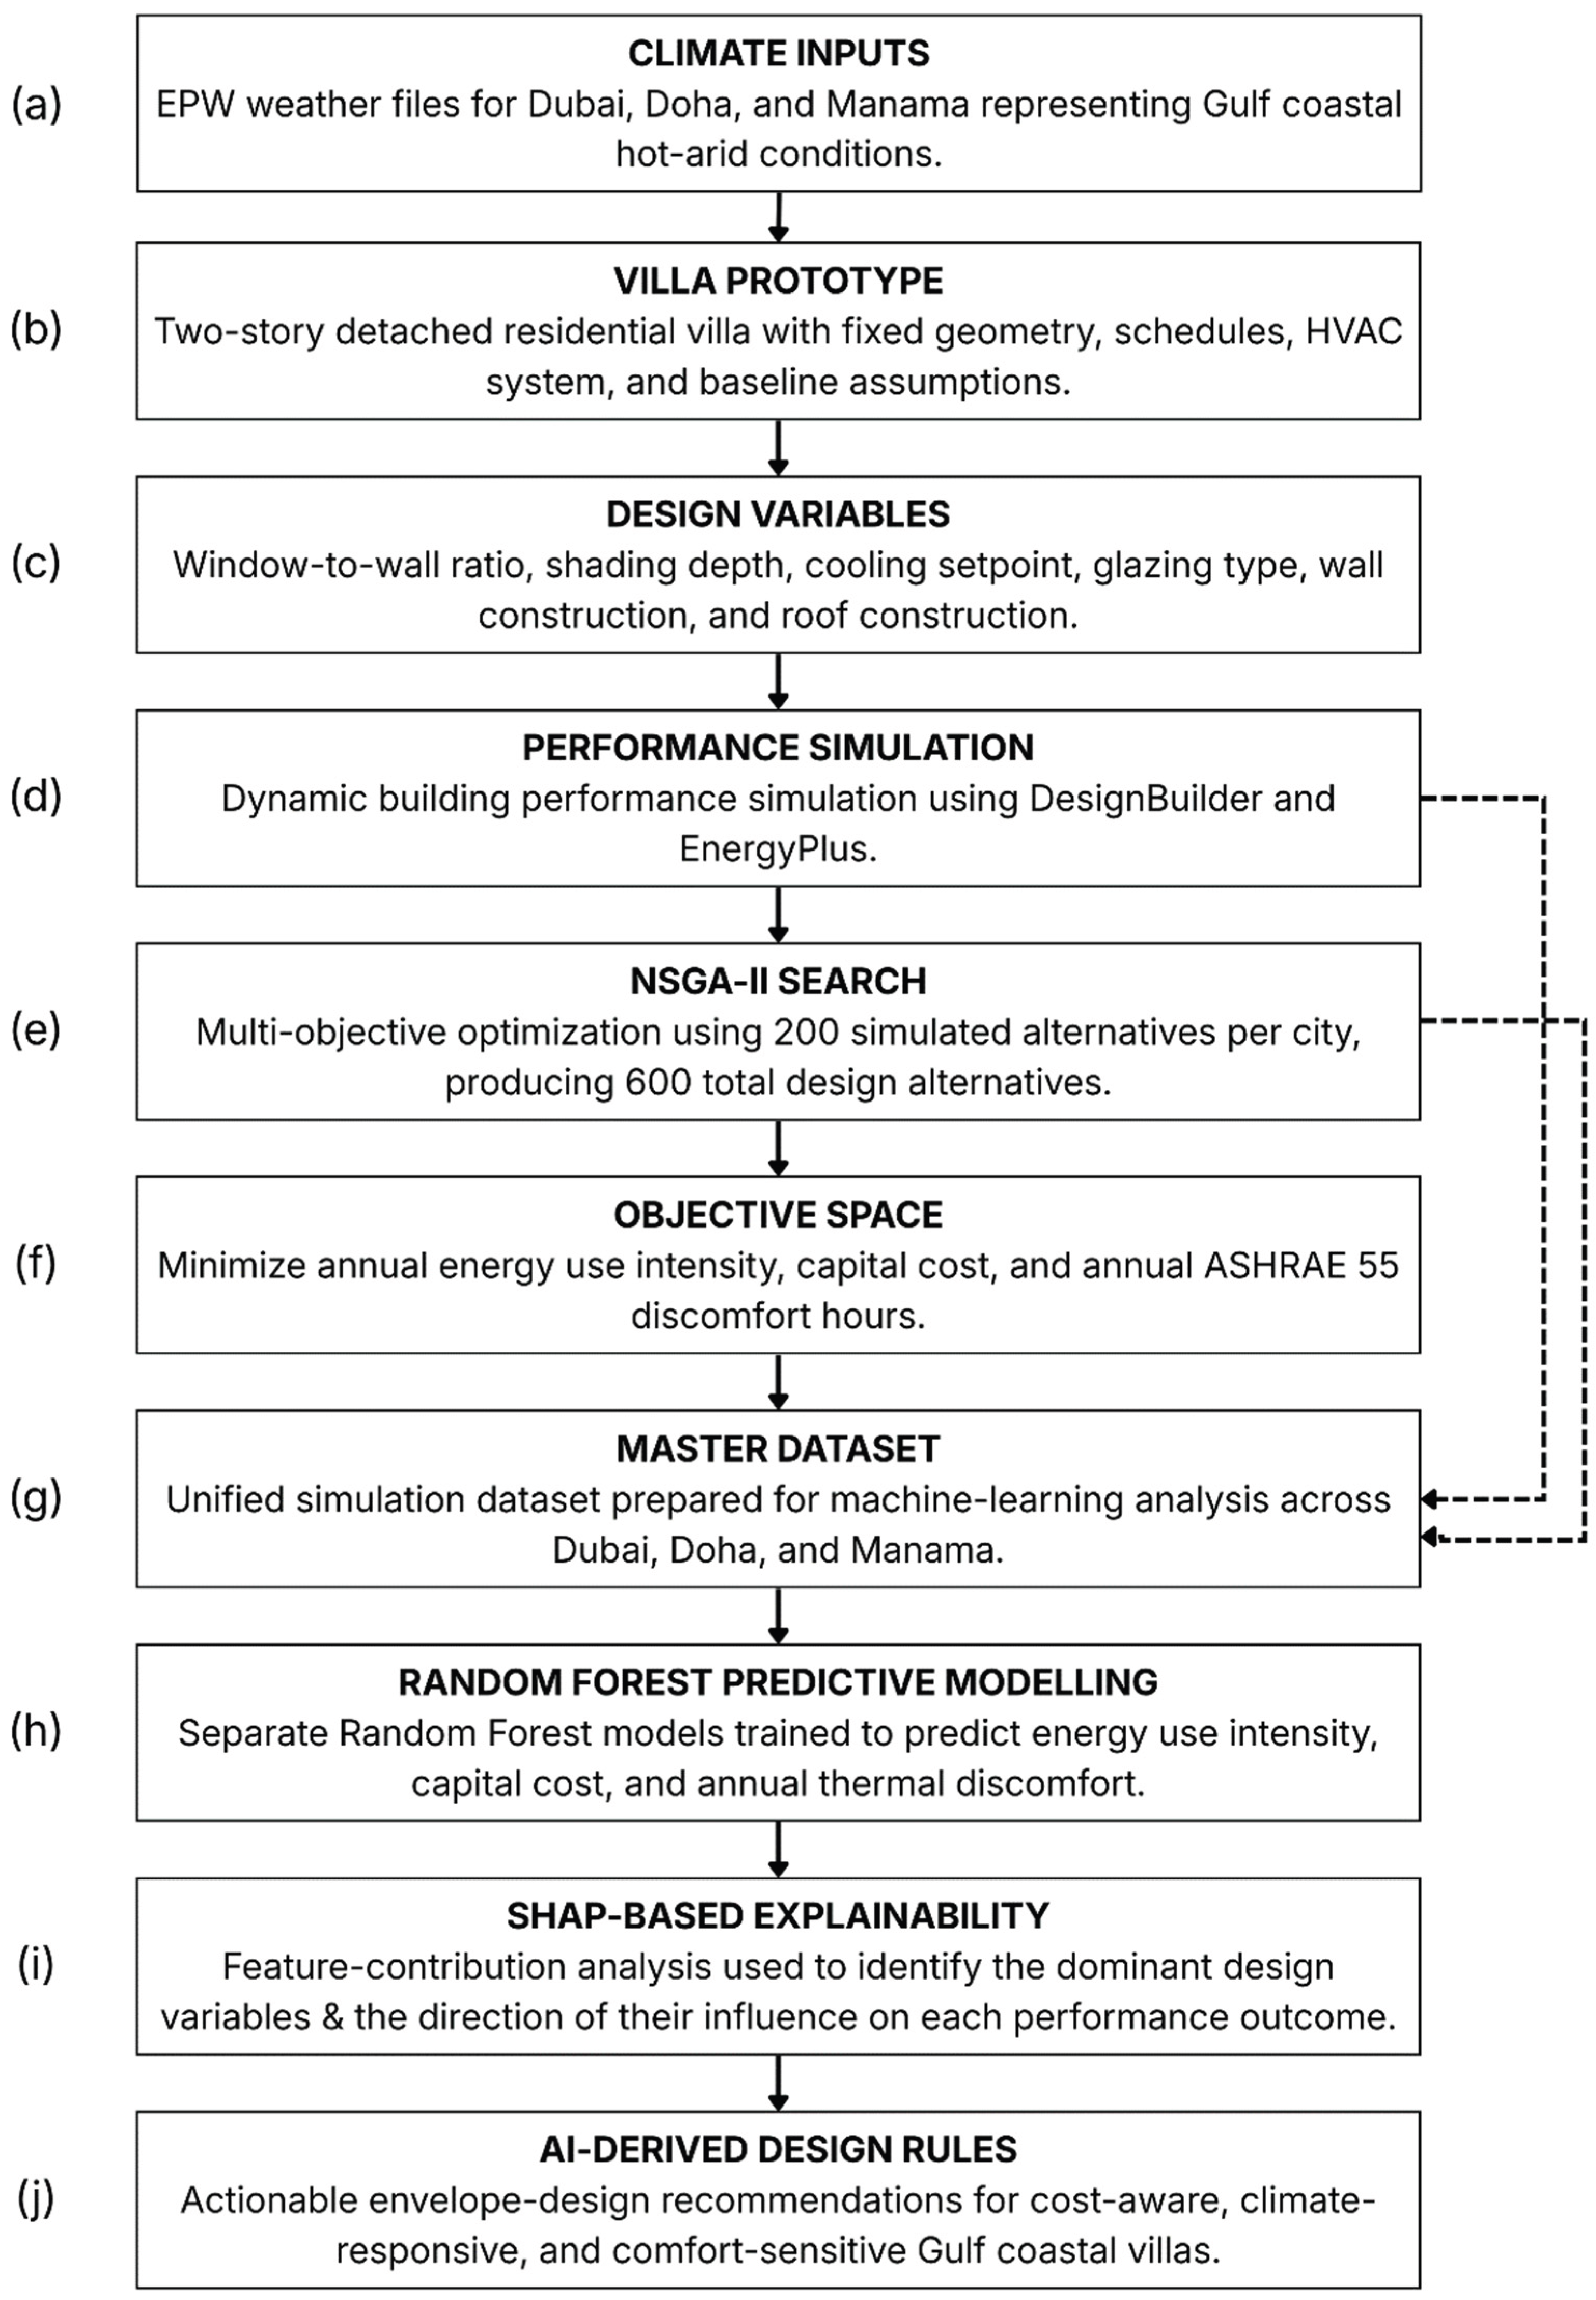
Figure 3.
Distribution of simulated alternatives in the energy–cost performance space. Each point represents one simulated villa alternative, with color indicating city.
Figure 3.
Distribution of simulated alternatives in the energy–cost performance space. Each point represents one simulated villa alternative, with color indicating city.
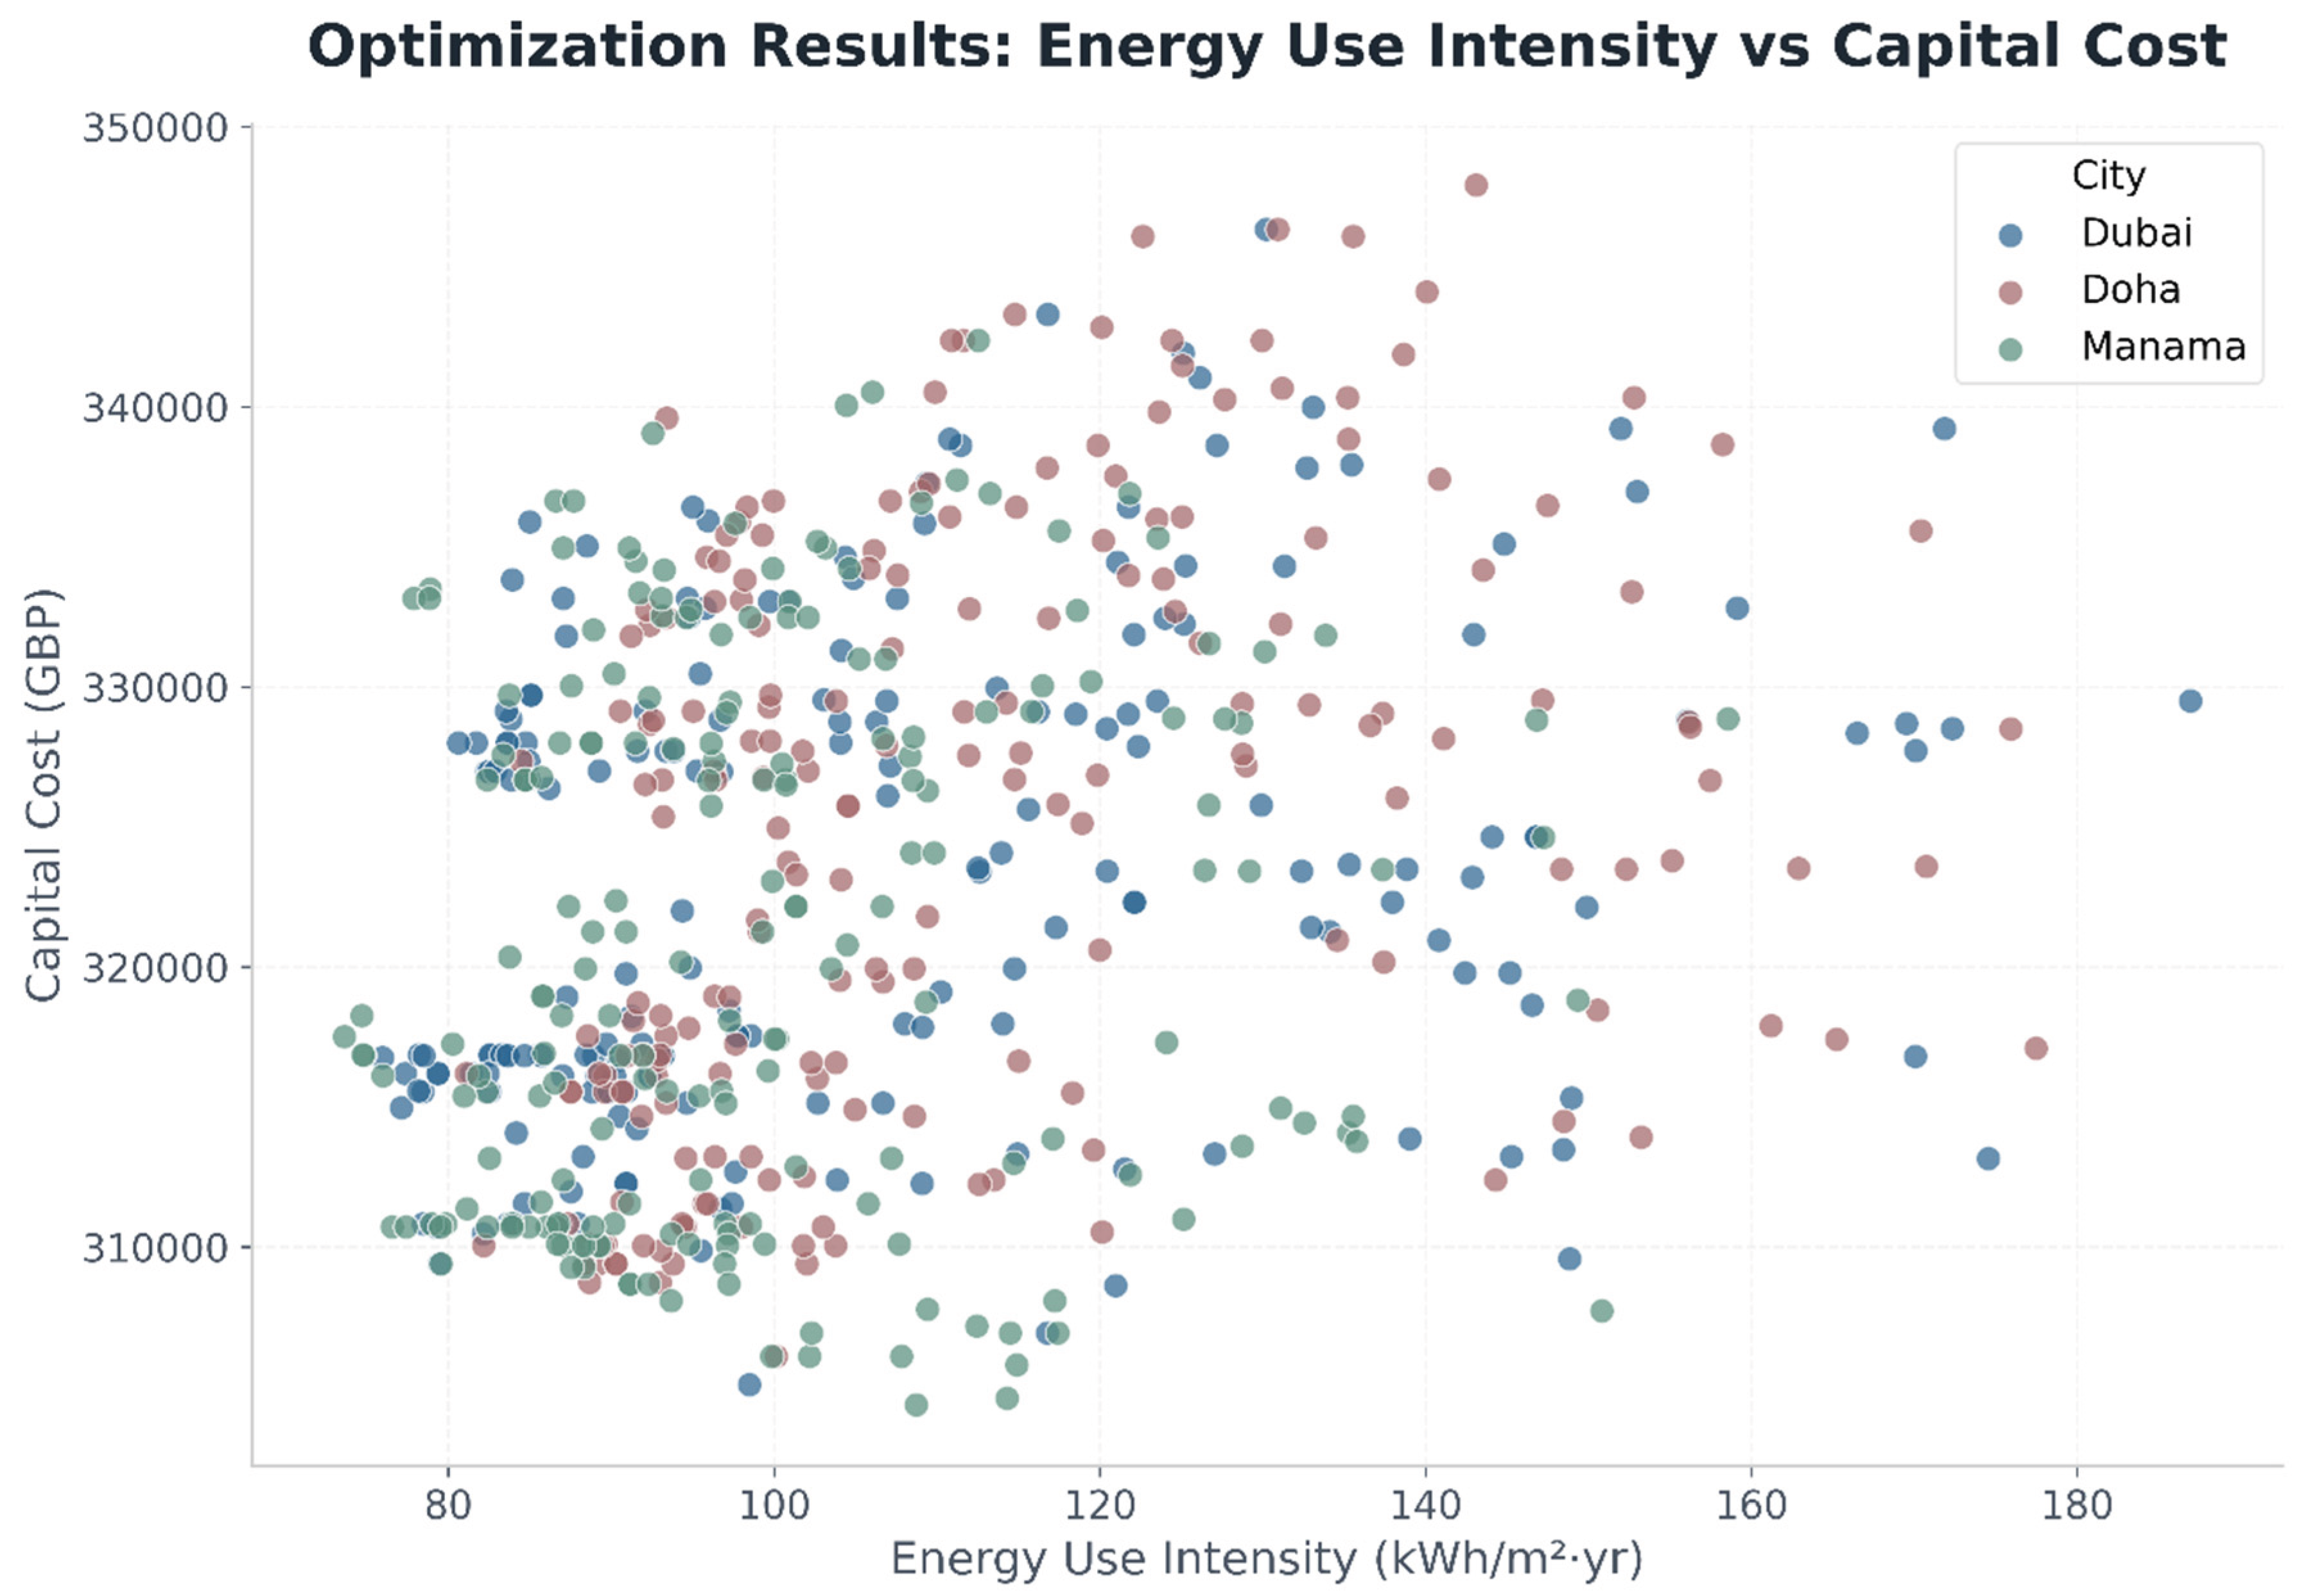
Figure 4.
Distribution of simulated alternatives in the energy–comfort performance space. Each point represents one simulated villa alternative, with annual EUI plotted against annual ASHRAE 55 discomfort hours.
Figure 4.
Distribution of simulated alternatives in the energy–comfort performance space. Each point represents one simulated villa alternative, with annual EUI plotted against annual ASHRAE 55 discomfort hours.
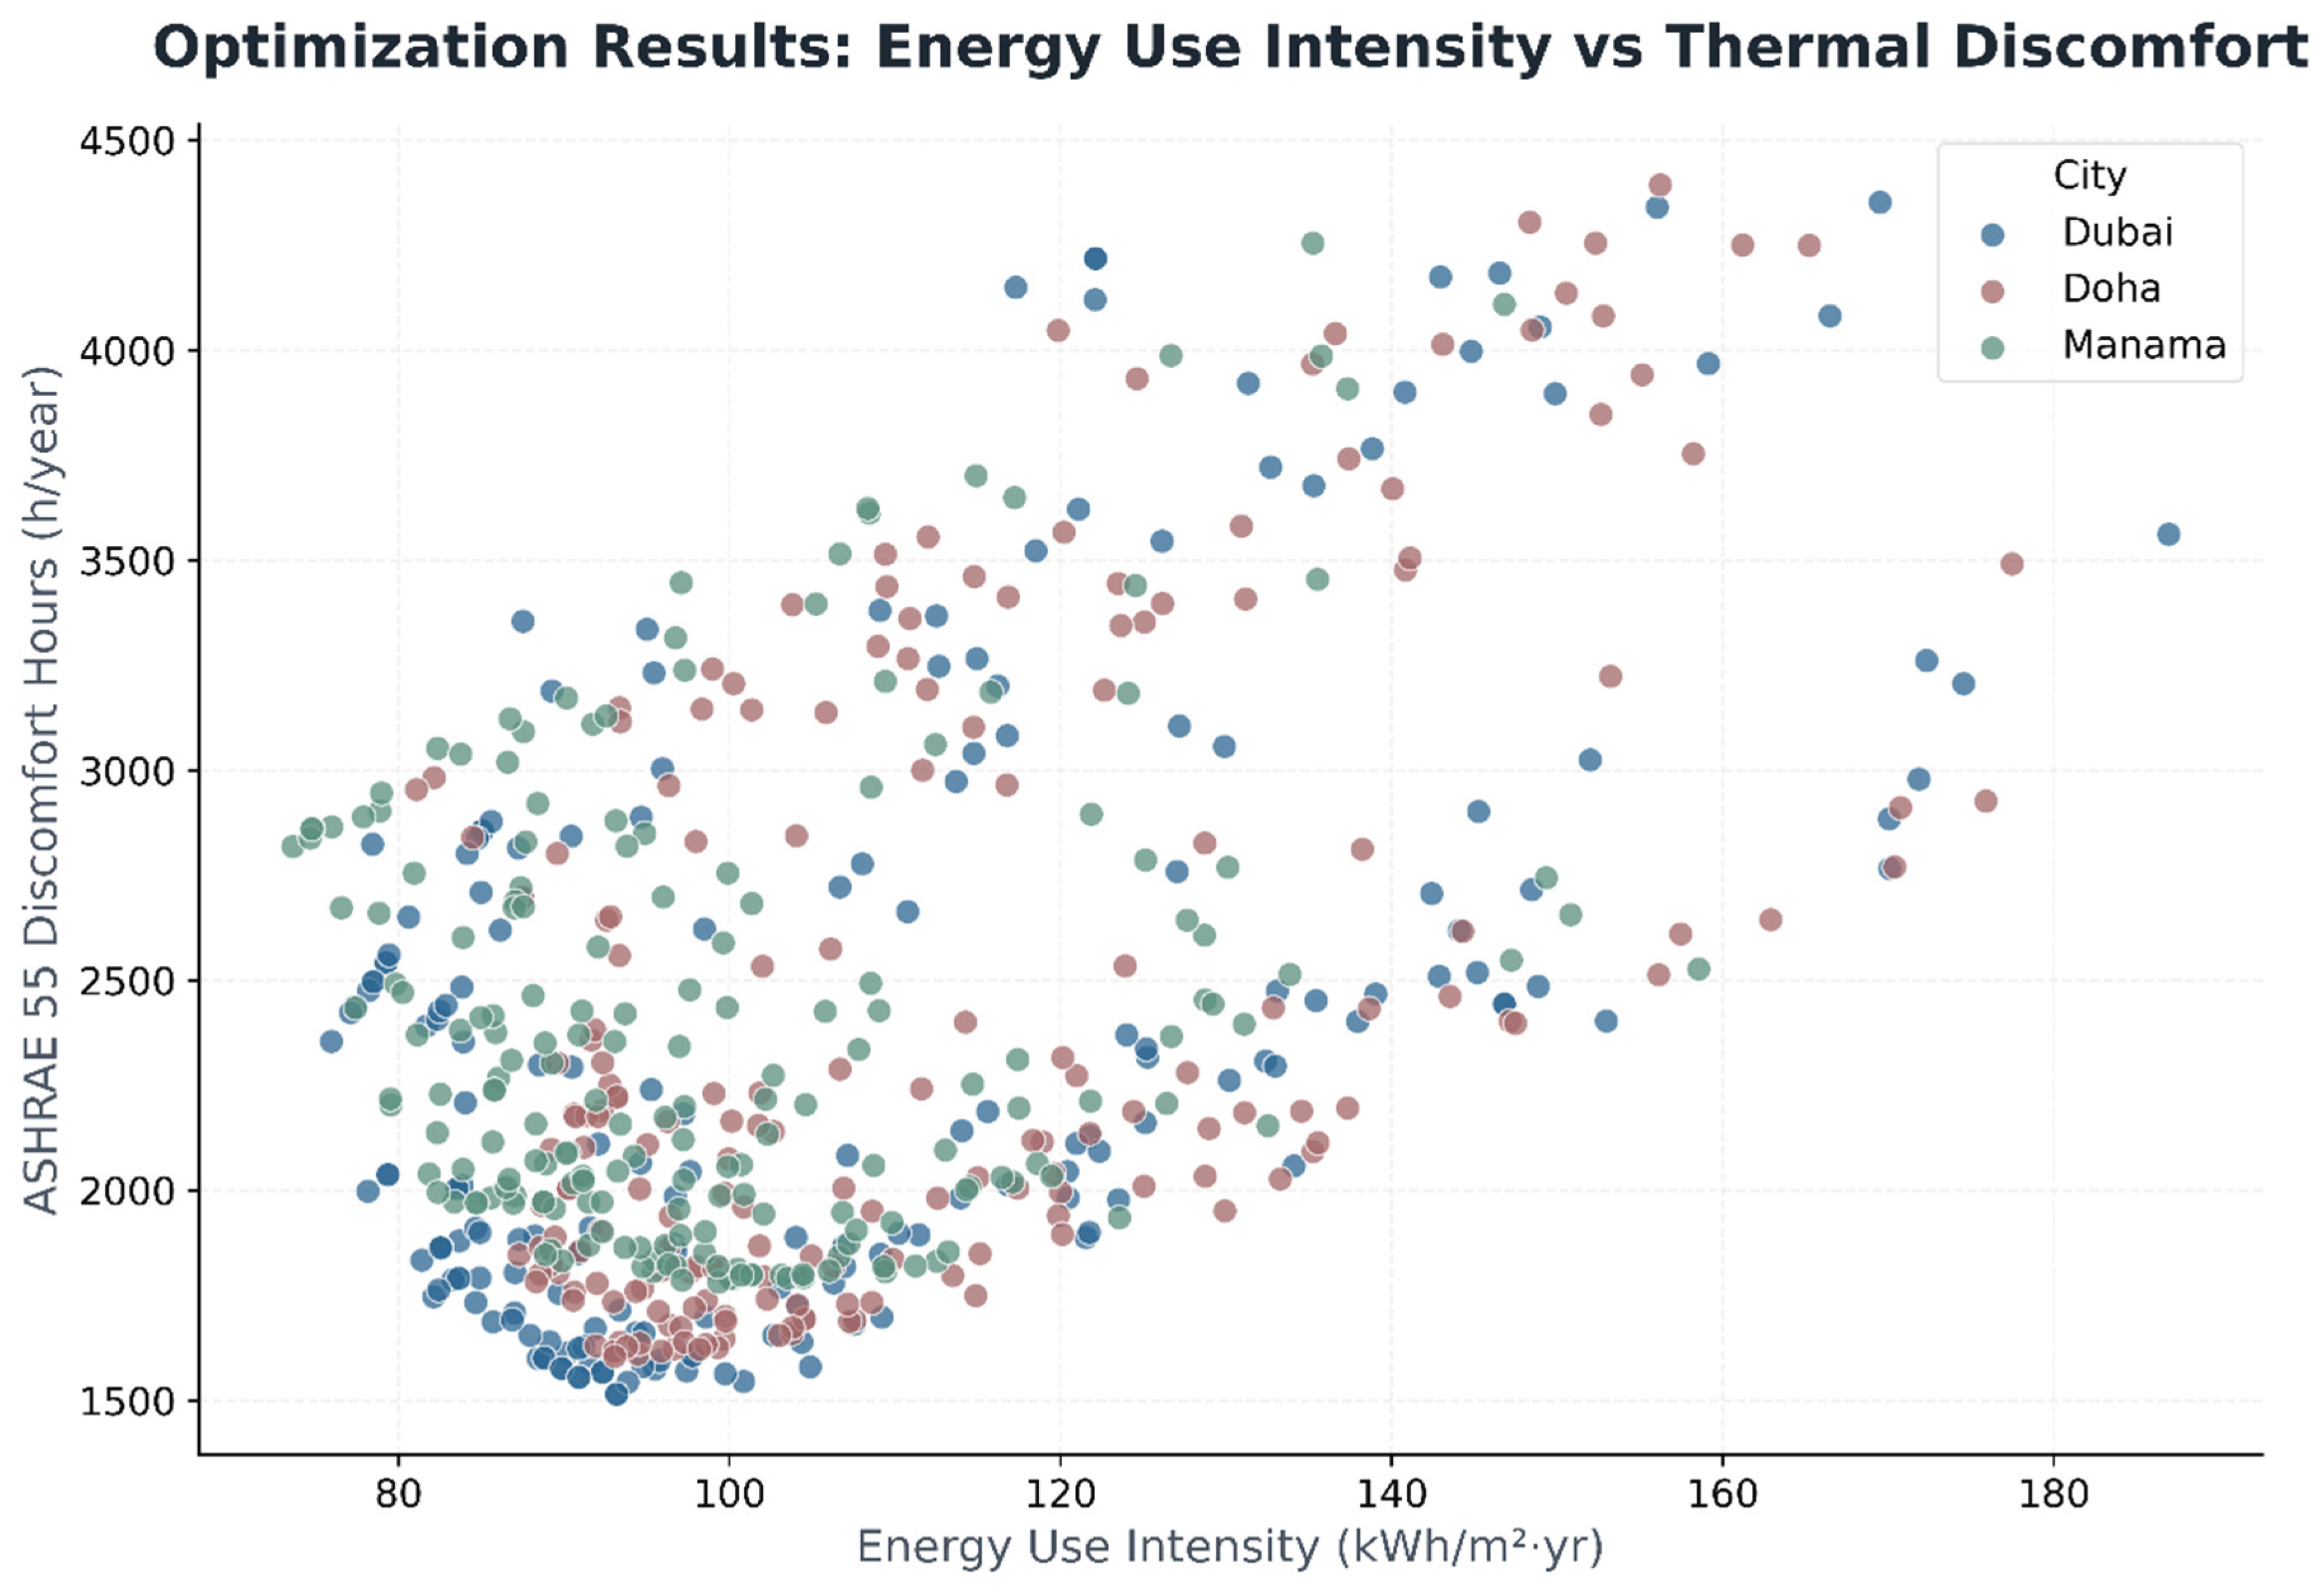
Table 1.
Climatic context and weather-data role for the selected Gulf coastal cities.
| City | Country | Climatic context | Weather-data input | Role in the comparative analysis |
| Dubai | United Arab Emirates | Coastal Gulf climate with high solar exposure and elevated summer humidity | EnergyPlus Weather (EPW) file | United Arab Emirates reference case |
| Doha | Qatar | Coastal Gulf climate with extreme summer heat and substantial cooling demand | EnergyPlus Weather (EPW) file | Qatar reference case |
| Manama | Bahrain | Coastal Gulf climate with strong solar exposure and maritime humidity effects | EnergyPlus Weather (EPW) file | Bahrain reference case |
Table 2.
Standardized villa prototype, fixed simulation assumptions, and baseline performance across the three Gulf coastal cities.
Table 2.
Standardized villa prototype, fixed simulation assumptions, and baseline performance across the three Gulf coastal cities.
| City | Conditioned floor area (m²) | Building type | Cooling system | Annual site energy (kWh/yr) | EUI (kWh/m²·yr) | Capital cost (GBP) | Annual ASHRAE 55 discomfort hours (h) |
| Dubai | 264.19 | Two-story detached villa | Unitary cooling system, COP 2.5 | 60,146.28 | 227.66 | 311,872 | 3,711.0 |
| Doha | 264.19 | Two-story detached villa | Unitary cooling system, COP 2.5 | 61,043.10 | 231.06 | 311,872 | 3,756.5 |
| Manama | 264.19 | Two-story detached villa | Unitary cooling system, COP 2.5 | 57,484.31 | 217.59 | 311,872 | 3,503.5 |
Note: Building geometry, zoning arrangement, occupancy schedules, internal gains, ventilation assumptions, and baseline envelope configuration were held constant across the three city cases. Capital cost remained identical because the same baseline construction specification was used.
Table 3.
Optimization variables, ranges, and candidate envelope alternatives.
| Variable | Data type | Range or alternatives | Analytical role |
| Window-to-wall ratio | Continuous | 20–60% | Controls glazed area and solar exposure |
| Shading depth | Continuous | 0–2.0 m | Controls solar protection of glazed façades |
| Cooling setpoint | Continuous | 23–26°C | Controls cooling operation and comfort conditions |
| Shading type | Categorical | Candidate shading configurations | Defines the form of solar-control intervention |
| Glazing type | Categorical | Six alternatives | Alters solar and conductive performance |
| Wall construction | Categorical | Four alternatives | Alters opaque-envelope thermal and cost characteristics |
| Roof construction | Categorical | Three alternatives | Alters upper-envelope thermal performance |
| City | Categorical predictor | Dubai, Doha, Manama | Represents climatic variation during model training |
Disclaimer/Publisher’s Note: The statements, opinions and data contained in all publications are solely those of the individual author(s) and contributor(s) and not of MDPI and/or the editor(s). MDPI and/or the editor(s) disclaim responsibility for any injury to people or property resulting from any ideas, methods, instructions or products referred to in the content. |
© 2026 by the authors. Licensee MDPI, Basel, Switzerland. This article is an open access article distributed under the terms and conditions of the Creative Commons Attribution (CC BY) license (http://creativecommons.org/licenses/by/4.0/).
Copyright: This open access article is published under a Creative Commons CC BY 4.0 license, which permit the free download, distribution, and reuse, provided that the author and preprint are cited in any reuse.


