
Submitted:
17 June 2026
Posted:
22 June 2026
You are already at the latest version
Abstract
Interconnector geometry strongly affects gas transport, polarization loss, and pressure drop in planar solid oxide fuel cells (SOFCs). In this study, four interconnector configurations were investigated for an anode-supported planar SOFC, including one conventional straight-rib interconnector and three connected-rib interconnectors, namely circular-rib(CI), rectangular-rib(RI), and triangular-rib(TI) designs. A three-dimensional multi-physics model coupling electric field, flow field, species transport, and temperature field was established and validated against experimental polarization data of the conventional straight-rib cell. To ensure a fair comparison, all interconnectors were designed with the same interconnector-electrode contact area. The effects of rib configuration on electrical performance, overpotential components, reactant distribution, velocity distribution, and pressure drop were systematically analyzed. At 800 °C, the peak power densities of CI-SOFC, RI-SOFC, and TI-SOFC increased by 4.9%, 9.7%, and 11.7%, respectively, compared with SI-SOFC. The connected-rib interconnectors mainly reduced cathode-side activation and concentration overpotentials by improving oxygen redistribution beneath the ribs. Among the four configurations, the TI-SOFC showed the highest power density and the strongest under-rib transport enhancement, while the RI-SOFC provided a better compromise between flow uniformity and pressure drop.
Keywords:
solid oxide fuel cell
; connected-rib interconnector
; multi-physics modeling
; mass transfer
; polarization loss
; uniformity index
1. Introduction
Solid oxide fuel cells (SOFCs) are regarded as a promising high-temperature electrochemical energy conversion technology for distributed power generation, combined heat and power (CHP), and hybrid energy systems [1,2,3]. The attractiveness of SOFCs for these applications arises from high electrical efficiency, broad fuel flexibility, and favorable integration with thermal processes [4,5,6,7]. A typical planar SOFC mainly consists of an anode, a cathode, an electrolyte, and an interconnector. Fuel is supplied to the anode, while the oxidant stream is delivered to the cathode, and the electrolyte separates the two electrodes and permits oxygen-ion transport. In practical applications, multiple single cells are usually connected in series to form a stack in order to achieve higher power output. Cell performance is governed not only by electrode and electrolyte materials, but also by transport and current-collecting components [8]. Among these components, the interconnector plays a particularly important role, since it provides gas separation and current collection while also affecting reactant distribution, pressure balance, and flow-field uniformity [9,10,11]. Accordingly, optimization of interconnector structures and flow-field configurations has become an important research direction for improving the performance of planar SOFCs.
Early studies on interconnector optimization mainly focused on conventional geometric parameters. Lin et al. [12] clarified the influence of interconnect rib size on concentration polarization in planar SOFCs, thereby establishing one of the earliest quantitative links between rib geometry and transport losses. Liu et al. [13] further examined the effect of interconnect rib contact resistance and optimized rib dimensions from the viewpoint of electrical loss and stack performance. Kong et al. [14] subsequently analyzed the influence of interconnect ribs on planar SOFC performance and proposed formulae for optimal rib sizes, while Kong et al. [15] extended this line of work to cathode-supported cells and demonstrated that rib geometry optimization can effectively reduce polarization losses. In a related study, Moreno-Blanco et al. [16] showed that channel width, rib width, and, in particular, the channel–electrode interfacial area strongly affect reactant transport and concentration overpotential. These studies collectively established that, even under conventional straight-channel configurations, the geometric characteristics of interconnectors can exert a substantial influence on transport behavior and cell performance.
With the development of three-dimensional numerical modeling, research interest gradually expanded from simple rib-size optimization to more diverse flow-field geometries. Khazaee and Rava [17] numerically investigated SOFCs with different flow-channel geometries and demonstrated that non-rectangular flow channels can significantly alter local transport behavior. Canavar and Timurkutluk [18] demonstrated that nickel-based woven meshes can serve simultaneously as anode current collectors and anode flow fields in commercial-size SOFC short stacks with an active area of 81 cm2. The highest performance was achieved with three meshes of 0.6 mm wire diameter and 2 mm opening width. Further, Canavar and Kaplan [19] evaluated three nickel-based meshes in eight short-stack configurations and showed, through performance and impedance measurements, that Ni-mesh based flow-field and interconnector design has a strong influence on gas distribution and cell output. Bhattacharya et al. [20] and Saied et al. [21] examined various bipolar-plate and serpentine flow-field designs, demonstrating that serpentine-type configurations can increase fuel residence time and enhance mass transfer, although the associated pressure drop should also be considered. These studies indicated that flow-field design is not merely a geometric issue, but a transport-regulation strategy involving the balance between residence time, reactant accessibility, and hydraulic resistance.
Subsequent studies moved beyond conventional straight-channel or serpentine layouts and proposed more distinctive interconnector concepts. Yan et al. [22] developed a spiral-like interconnector and showed that enhanced lateral transport can significantly improve mass transfer in planar SOFCs. Fu et al. [23] proposed a beam-and-slot interconnector for an anode-supported SOFC stack and demonstrated that the modified structure enhanced gas disturbance and alleviated concentration polarization. Kong et al. [24] introduced an X-type interconnector and found that the design was beneficial to under-rib gas transport and current collection, thereby improving SOFC performance. Dong et al. [25] analyzed a planar anode-supported SOFC stack and emphasized the importance of structural design for local flow distribution and electrochemical behavior. At a larger scale, Kim et al. [26] proposed a novel interconnect design for thermal management of a commercial-scale planar SOFC stack, highlighting that interconnector geometry also affects temperature distribution and stack stability. More recently, Gong et al. [27,28] designed novel flow fields aimed at reactant redistribution and temperature homogenization, demonstrating that the function of interconnector and channel design has gradually expanded from performance enhancement alone to broader control of coupled transport and thermal fields. Guo et al. [29] developed new interconnector designs through three-dimensional modeling and showed that improved oxygen distribution beneath the ribs can lead to enhanced electrical performance. These studies collectively indicate that structural optimization of interconnectors and flow fields plays a critical role in regulating transport behavior and electrochemical performance in planar SOFCs.
Despite these advances, several issues remain insufficiently clarified. Most existing studies have focused on performance comparisons among specific interconnector geometries, whereas the more general effect of rib continuity on under-rib transport, local species redistribution, and polarization reduction has not been systematically established. In particular, the transport characteristics associated with conventional continuous straight ribs and connected-rib structures remain inadequately understood under comparable geometric and operating conditions. Moreover, structural modifications that enhance transverse transport and reactant redistribution are often accompanied by an increase in flow resistance, yet the relationship between electrochemical improvement and hydraulic penalty has not always been evaluated in a balanced manner. With increasing emphasis on transport uniformity and engineering applicability in planar SOFC design, interconnector optimization should be assessed not only in terms of output performance, but also in terms of distribution quality and flow-field effectiveness. Therefore, a systematic investigation of the effects of rib configuration on species transport, polarization behavior and pressure-drop characteristics remains necessary.
Accordingly, this study investigates four interconnector configurations for an anode-supported planar SOFC, including a conventional straight-rib interconnector (SI) and three connected-rib interconnectors, namely a circular-rib interconnector (CI), a rectangular-rib interconnector (RI), and a triangular-rib interconnector (TI). A three-dimensional multi-physics model coupling electric field, flow field, species transport and temperature field is established. The model is validated against experimental polarization data for the conventional cell. On this basis, the effects of rib configuration on polarization behavior, overpotential components, species distribution, velocity uniformity, fuel utilization, and pressure-drop characteristics are systematically analyzed. In addition, the influences of electrode porosity and operating temperature are examined in order to evaluate the robustness of the structural effects. The aim of this study is to clarify the transport mechanism associated with different rib interconnectors and to provide theoretical guidance for the structural optimization of planar SOFC interconnectors.
2. Experimental
The configuration of the experimental system is shown in Figure 1(a). The SOFC test system consisted of a gas supply and control module, an SOFC module and a data acquisition module. Gas flow rates were controlled by DFC10-500SCCM-B01 and DFC50-1000SCCM-B01 mass flow controllers (Flows Instrument, China). Deionized water was delivered into a preheating furnace by an infusion pump (MP0102D, Sanotac, China) for vapor generation. The polarization curves of the SOFC were measured using an IT8812 electronic load (ITECH, China).
An anode-supported planar SOFC (Huatsing Power, China) with an active area of 5×5 cm² and equipped with the conventional straight-rib interconnector was tested for model validation. The geometries of the four interconnector configurations considered in this study are shown in Figure 1(b). The conventional straight-rib interconnector was experimentally tested, whereas the other three connected-rib interconnectors were investigated numerically under the same geometric and operating conditions. Mica sheets and ceramic adhesive were used to seal the contact region between the SOFC and the interconnectors. Silver mesh current collectors and silver wires were pressed against the electrode surfaces on both sides.
The furnace temperature was raised from 25 °C to 600 °C at a heating rate of 5 °C/min and then increased to 750 °C at 2 °C/min. Before testing, nitrogen (250 SCCM) was introduced into both the anode and cathode sides for 15 min to remove air from the chambers. Hydrogen (200 SCCM) was then fed into the anode chamber as the reducing gas, and the cell was maintained at 750 °C for 4 h to reduce NiO to Ni. After the reduction process was completed, a gas mixture of nitrogen (395 SCCM) and oxygen (105 SCCM) was introduced into the cathode side.
3. Model Description
3.1. Geometric Models
The cell considered in this study was an anode-supported planar SOFC. The porous anode consisted of NiO and yttria-stabilized zirconia (YSZ) with a weight ratio of 4:6 and included a 500 μm anode support layer (ASL) and a 10 μm anode functional layer (AFL). The dense electrolyte layer (EL) was composed of YSZ with a thickness of 15 μm and served as the oxygen-ion conducting phase. A 3 μm gadolinium-doped ceria (GDC) barrier layer (BL) was introduced between the electrolyte and cathode to suppress Sr diffusion. The porous cathode was composed of La0.6Sr0.4Co0.2Fe0.8O3 (LSCF) and included a 10 μm cathode functional layer (CFL). Figure 2 shows the cross-sectional SEM image of the tested anode-supported planar SOFC.
Full-size cell geometries were adopted in the simulations in order to capture the influence of boundary effects on gas transport. Four interconnector configurations were considered, including a conventional straight-rib interconnector and three connected-rib interconnectors with circular, rectangular, and triangular rib characteristics. All interconnectors were assumed to be made of the same material, and the interconnector-electrode contact area was kept identical for all configurations so that the effect of rib geometry could be evaluated under comparable conditions. The detailed geometrical parameters of the interconnectors are presented in Figure 1(c-f) and Table 1.
3.2. Governing Equations
A three-dimensional multi-physics model was established to describe the coupled electrochemical and transport phenomena in the planar SOFC. The model simultaneously considers electrochemical reactions, mass and momentum transport, species transport, charge transport, and heat transfer. Electrochemical reactions are assumed to occur at the triple-phase boundaries (TPBs) in the functional electrode layers. Meanwhile, local thermodynamic equilibrium is assumed for heat transfer in the porous electrodes. The governing equations used in the present model are described as follows.
3.2.1. Electrochemical Reactions
The actual operating voltage of the SOFC is expressed as the reversible Nernst potential minus the polarization losses, including activation, ohmic and concentration overpotentials [16].
Where is the actual cell operating voltage [V]; is the reversible potential derived from the Nernst equation [V]; is the activation overpotential of electrodes [V]; is the ohmic overpotential [V]; is the concentration overpotential [V].
Electrode reaction kinetics are described by the extended Butler–Volmer equations, in which the dependence of the exchange current density on local species concentrations at the TPBs is taken into account.
Where =0.5 and =0.5 are the charge transfer coefficient; is the number of electrons; is the Faraday’s constant [C/mol]; R is the universal gas constant [J/mol/K]; T is the temperature [K]; and represent the exchange current density of the anode and cathode [A/m2].
The activation overpotential, ohmic overpotential, and concentration overpotential are formulated to characterize the major electrochemical losses in the cell.
3.2.2. Mass and Momentum Transport
The flow of gases in the flow channels and porous electrodes is modeled by the following mass conservation equation [14]:
The momentum transport in both flow channels and porous electrodes was described by a unified equation. For the flow channels, the porosity was set to 1 and the permeability was assumed to be infinite, so that the equation reduced to the Navier-Stokes equation. For the porous electrodes, the equation reduced to the Brinkman equation with the prescribed porosity and permeability.
Where is the density of the mixture gases [kg/m3]; represents the permeability of each porous electrode layers [m2]; is the dynamic viscosity of the mixture gases [Pa∙s].
3.2.3. Species Transport
The species conservation equations within the flow channels and porous electrodes layers can be described as:
Where is the effective diffusion coefficient of species i [m2/s]; is the mass flux term of species i due to electrochemical reactions [kg/m3/s].
In the porous electrodes, molecular diffusion and Knudsen diffusion occur simultaneously. Therefore, the effective diffusivity of species i was calculated by combining these two mechanisms through the Bosanquet relation [30]:
Where is the binary diffusion coefficient between species i and j [m2/s]; is the Knudsen diffusion coefficient of species i [m2/s]; and are the diffusion volume of species i and j [m3/mol]; is the pore diameter of electrodes [m].
3.2.4. Charge Transport
The charge transport equations of ion and electron can be written as:
Where and are the current density of electronic and ionic [A/m2]; and are the potential of electronic and ionic [V], respectively.
3.2.5. Heat Transport
The temperature difference between the solid and gas phases in the porous electrodes was assumed to be negligible, according to the local thermodynamic equilibrium assumption reported by Andersson et al. [31]. Since electrochemical reactions occur mainly in the anode functional layer (AFL) and cathode functional layer (CFL), electrochemical heat generation was considered only in these functional layers. Accordingly, heat transport in the present model was described by the following energy conservation equation [32]:
Where is the heat source term [W/m3]; is the entropy change of the electrochemical reactions [J/mol/K]; and are specific heat capacity [J/kg/K] and effective thermal conductivity [W/m/K] of the gases and solid phases, respectively.
3.3. Boundary Conditions
Mass-flow inlet boundary conditions were prescribed at the anode and cathode channel inlets with flow rates of 200 SCCM and 500 SCCM, respectively. No-slip conditions were imposed on the channel walls, and a zero-gauge pressure condition was specified at the outlet boundaries. The anode inlet gas composition was set to 97 mol% H2 and 3 mol% H2O, whereas the cathode inlet gas composition was set to 79 mol% N2 and 21 mol% O2. For charge transport, a constant operating voltage was applied to the top surface of the cathode-side interconnector, while the bottom surface of the anode-side interconnector was set to ground potential. For heat transfer, constant temperature boundary conditions were imposed on the selected external boundaries of the computational domain.
3.4. Model Validation
The commercial finite element software COMSOL Multiphysics was employed to solve the coupled multi-physics model. The convergence criterion was set such that the residuals of all governing equations were lower than 1×10⁻⁴. To balance numerical accuracy and computational cost, three mesh levels were compared for each interconnector configuration. The mesh containing 543,250, 640,164, 523,447, and 1,487,398 elements for the SI-SOFC, CI-SOFC, RI-SOFC, and TI-SOFC, respectively, was adopted in the subsequent simulations. The model was validated against experimental polarization data obtained for the SI-SOFC. Figure 3 compares the simulated and experimental polarization curves under 200 SCCM wet hydrogen and 500 SCCM air at 700, 750, and 800 °C. The numerical results agree well with the experimental data, with deviations below 3.6%, 4.3%, and 4.4% at 700, 750, and 800 °C, respectively. This agreement demonstrates that the present model is capable of describing the electrochemical and transport behavior of the SOFC with reasonable accuracy.
4. Results and Discussion
4.1. Electrical Performance
Figure 4 compares the polarization and power-density curves of SOFCs with different interconnector configurations at 800 °C. All cases exhibit the typical electrochemical behavior of SOFCs, and concentration polarization becomes increasingly pronounced at high current densities, particularly above 0.9 A/cm2. Among the four configurations, TI-SOFC shows the best overall performance, followed by RI-SOFC and CI-SOFC, whereas SI-SOFC gives the lowest power output. The maximum power density reaches 0.46 W/cm2 for TI-SOFC. Compared with SI-SOFC, the peak power densities of CI-SOFC, RI-SOFC, and TI-SOFC increase by 4.9%, 9.7%, and 11.7%, respectively. In addition, the inflection points of the power-density curves shift from 0.93 A/cm2 for SI-SOFC to 0.87, 0.89, and 0.84 A/cm2 for CI-SOFC, RI-SOFC, and TI-SOFC, respectively, indicating that the interconnector configuration significantly affects the high-current-density behavior of the cell. These results suggest that SOFC performance depends not only on channel connectivity but also on rib geometry. Since all interconnectors were designed with the same interconnector-electrode contact area (1300 mm2), the observed differences can be mainly attributed to the longer contact perimeter(1352 mm for SI-SOFC, 1405.9 mm for CI-SOFC, 1586.4 mm for RI-SOFC and 2708.2 mm for TI-SOFC) and enhanced lateral gas transport in the connected-rib designs, which promote reactant redistribution between adjacent channels and improve mass transfer at the ASL/interconnector interface.
Figure 5 compares the activation, concentration, ohmic, and total overpotentials of SOFCs with different interconnector configurations at 800 °C. In all cases, activation overpotential and concentration overpotential dominate the total polarization loss, whereas the ohmic overpotential remains nearly unchanged. The anode-side activation and concentration overpotentials vary only slightly with interconnector geometry, while the cathode-side losses are significantly reduced in the connected-rib designs. At 0.5 A/cm2, the cathode activation overpotential decreases from 0.198 V in SI-SOFC to 0.180, 0.166, and 0.152 V in CI-SOFC, RI-SOFC, and TI-SOFC, respectively. Similarly, the cathode concentration overpotential decreases from 0.045 V to 0.037, 0.030, and 0.023 V. Since the material properties and thicknesses of the cell components are identical in all cases, the effect of interconnector geometry on ohmic loss is limited. Consequently, the reduction in total overpotential from SI-SOFC to CI-SOFC, RI-SOFC, and TI-SOFC is mainly attributed to the improved reactant redistribution and enhanced mass transfer enabled by the connected-rib structures.
4.2. Concentration Distribution
Figure 6(a-d) shows the hydrogen mole fraction at the interconnector/ASL interface under 0.7 V and 800 °C. In all cases, the hydrogen mole fraction decreases along the flow direction due to continuous electrochemical consumption. Compared with SI-SOFC, the connected-rib interconnectors lead to lower downstream hydrogen mole fractions, indicating enhanced fuel utilization. Among the four configurations, TI-SOFC exhibits the lowest outlet value, approximately 0.64, although the hydrogen mole fraction remains above 0.55 even at the end of the channel. The line profiles in Figure 6(e-f) further show that SI-SOFC exhibits a clear difference between the regions beneath the ribs and channels, with hydrogen mole fractions of about 0.79 and 0.83, respectively, indicating limited lateral diffusion under the conventional straight-rib structure. By contrast, this difference becomes smaller in the connected-rib designs, confirming that channel connectivity promotes transverse hydrogen redistribution and improves mass transfer in the porous anode. Among the three novel configurations, RI-SOFC shows a relatively moderate side-to-center concentration gradient, suggesting a stronger ability to redistribute hydrogen across the channel width.
Figure 7(a-d) shows the oxygen mole fraction at the interconnector/CFL interface under 0.7 V and 800 °C. In SI-SOFC, the oxygen mole fraction beneath the ribs decreases rapidly along the flow direction, forming extended oxygen-deficient zones that limit the electrochemical performance of the cathode. This behavior is mainly associated with the limited oxygen diffusion in the porous cathode, where the transport of oxygen is inherently slower than that of hydrogen. In contrast, the connected-rib interconnectors break up the continuous oxygen-deficient regions and promote oxygen transport toward the rib-covered areas, leading to a more distributed oxygen field. The line profiles in Figure 7(e-f) further illustrate this effect. Along the flow direction, the oxygen mole fraction decreases sharply from about 0.21 beneath the channels to approximately 0.025 beneath the ribs in TI-SOFC, whereas it approaches zero in CI-SOFC and RI-SOFC. In SI-SOFC, the oxygen-deficient zones persist almost continuously to the channel end, indicating weak transverse oxygen redistribution. Along the channel width direction, the oxygen mole fraction beneath the ribs remains about 0.02 in TI-SOFC, while the value beneath the channels is about 0.14. This channel value is 0.01, 0.02, and 0.03 lower than those in RI-SOFC, CI-SOFC, and SI-SOFC, respectively, indicating that more oxygen is consumed in TI-SOFC due to the enhanced electrochemical reaction. The connected-rib interconnectors alleviate oxygen depletion beneath the ribs, and TI-SOFC shows the most effective cathode side mass-transfer enhancement among the four configurations.
4.3. Velocity Distribution
Figure 8 shows the velocity distribution beneath the ribs in the ASL at the cross-section of Y=25 mm under 0.7 V. Compared with SI-SOFC, all connected-rib interconnectors produce significantly higher gas velocities beneath the ribs, indicating enhanced convective transport in the porous anode. Among the four configurations, TI-SOFC exhibits the highest local velocity, reaching about 0.05 m/s, which is more than one order of magnitude higher than that in SI-SOFC(0.004 m/s). In CI-SOFC and TI-SOFC, the high-velocity regions are mainly distributed near the channel-rib junctions above the ASL, where the local geometry drives part of the gas from the flow channel into the porous anode. By contrast, RI-SOFC shows a more uniform velocity distribution along the channel length.
Figure 9 shows the velocity distribution beneath the fuel channels in the ASL under 0.7 V. In SI-SOFC, the velocity in the porous anode remains relatively low and varies only slightly along the channel length, indicating weak gas penetration from the fuel channel into the ASL. In contrast, the connected-rib interconnectors generate distinct high-velocity regions near the upper part of the ASL, especially close to the channel-rib junctions, demonstrating enhanced convective transport from the fuel channel into the porous electrode. Among the three modified configurations, CI-SOFC and TI-SOFC exhibit more pronounced local velocity peaks, whereas RI-SOFC shows a comparatively smoother and more uniform velocity distribution along the flow direction. The results indicate that the connected-rib designs strengthen under-channel mass transfer in the porous anode, while the rectangular-rib configuration provides the best velocity uniformity and the triangular-rib configuration gives the strongest local flow enhancement.
Figure 10 compares the velocity distributions in the porous anode along line 5 (under the ribs) and line 6 (under the fuel channels) for the four SOFC configurations under 0.7 V. SI-SOFC shows the largest difference between the two lines, with the velocity on line 5 remaining below 0.002 m/s, whereas that on line 6 decreases gradually from about 0.03 m/s near the inlet to about 0.017-0.018 m/s at the channel end. CI-SOFC and TI-SOFC exhibit pronounced periodic velocity peaks on both lines, and the peak values on line 5 reach nearly 0.048-0.05 m/s in the inlet region before decaying to around 0.02 m/s in the downstream region. RI-SOFC maintains a relatively stable velocity on line 6, fluctuating only within about 0.018-0.022 m/s, together with smaller fluctuations on line 5, resulting in the most uniform velocity distribution among the four configurations. The CI-SOFC and TI-SOFC provide stronger local flow enhancement, whereas RI-SOFC is more effective in maintaining uniform mass transfer throughout the porous anode. To quantify this difference, the velocity uniformity index γ is defined in Equation (21).
Where is the mean velocity at the cross section (Y = 25 mm) of ASL under the channels; is the mean velocity at the cross section (Y = 23 mm) of ASL under the ribs.
Figure 11(a) compares the mean velocities beneath the ribs and beneath the fuel channels in the ASL at different current densities. In all configurations, the mean velocity increases gradually with current density. SI-SOFC shows the largest difference between the two regions. The mean velocity under the ribs remains lower than 0.002 m/s over the whole current-density range, whereas the corresponding value beneath the fuel channels increases to about 0.023 m/s at 0.9 A/cm2. In contrast, the connected-rib interconnectors significantly increase the mean velocity beneath the ribs. At 0.9 A/cm2 current density, the under-rib mean velocity reaches about 0.015 m/s in CI-SOFC and RI-SOFC, and further increases to about 0.023 m/s in TI-SOFC. Beneath the fuel channels, the mean velocities in CI-SOFC and TI-SOFC rise to about 0.027 m/s, which is slightly higher than those in SI-SOFC and RI-SOFC. The connected-rib interconnectors enhance both the mean velocity beneath the ribs and the velocity uniformity in the porous anode, with TI-SOFC showing the strongest under-rib flow enhancement among the four configurations.
Figure 11(b) further compares the velocity uniformity index . The value of follows the order of TI-SOFC, RI-SOFC, CI-SOFC, and SI-SOFC over the whole current-density range. SI-SOFC exhibits the lowest , remaining in the range of about 8% to 12%, which corresponds to the largest velocity difference between the rib-covered and channel-covered regions. By contrast, TI-SOFC maintains the highest , decreasing from about 98% at 0.1 A/cm2 to about 85% at 0.9 A/cm2. RI-SOFC and CI-SOFC remain in the ranges of about 60% to 68% and 54% to 60%, respectively. Therefore, the connected-rib interconnectors not only enhance mass transfer in the porous anode but also improve the velocity uniformity, with TI-SOFC showing the best overall performance among the four configurations.
4.4. Pressure Drop
Figure 12 compares the pressure drops in the air and fuel channels of the four SOFC configurations at different current densities. In all cases, the connected-rib interconnectors introduce a significantly larger hydraulic penalty than the conventional straight-rib design, and the pressure drop follows the order of TI-SOFC, CI-SOFC, RI-SOFC, and SI-SOFC. This trend is mainly associated with the narrower flow passages and stronger local flow constriction in the connected-rib configurations. As the current density increases from 0.1 to 0.9 A/cm2, the pressure drop in the fuel channel increases for all cases, reaching about 73.3 Pa in TI-SOFC, which is the highest among the four configurations. By contrast, the pressure drop in the air channel decreases slightly with increasing current density, owing to the gradual consumption of oxygen along the cathode side. Although CI-SOFC and RI-SOFC have similar connected-channel characteristics, RI-SOFC shows a lower pressure drop because its rectangular flow passages produce weaker local contraction and expansion losses. At 0.9 A/cm2, the total pressure drops of SI-SOFC, CI-SOFC, RI-SOFC, and TI-SOFC are about 16.9, 64.9, 56.9, and 154.9 Pa, respectively. Such a hydraulic penalty is relatively small compared with the pressure levels reported for pressurized SOFC and SOFC-GT hybrid systems, which commonly operate under elevated pressure [33,34,35,36]. Therefore, the improvement in mass transfer achieved by the connected-rib interconnectors is accompanied by an increase in hydraulic resistance.
4.5. Porosity Effect
Figure 13 show the effects of anode porosity and cathode porosity on the power density at 0.7 V. In all cases, the power density exhibits an initial increase with porosity, followed by a relatively stable region within the range of 0.3-0.6 and a slight decrease at higher porosity. This trend indicates a balance between improved gas diffusion and the reduction of effective electrochemical reaction sites at excessive porosity. For both anode and cathode porosity variations, the relative performance ranking remains unchanged. TI-SOFC exhibits the highest power density throughout, followed by RI-SOFC, CI-SOFC, and SI-SOFC. This result confirms that the advantage of the connected-rib interconnectors is preserved over a relatively wide porosity range.
4.6. Temperature Effect
Figure 14 shows the effect of operating temperature on the power density of SOFCs with different interconnector configurations. In all cases, the power density increases monotonically with temperature over the range of 600-800 °C. The performance ranking remains unchanged throughout, with TI-SOFC showing the highest power density, followed by RI-SOFC, CI-SOFC, and SI-SOFC. At 800 °C, the power densities of SI-SOFC, CI-SOFC, RI-SOFC, and TI-SOFC reach about 0.33, 0.35, 0.38, and 0.41 W/cm2, respectively. Compared with SI-SOFC, the power density is higher by about 7% in CI-SOFC, 16% in RI-SOFC, and 24.5% in TI-SOFC. These results indicate that the performance advantage of the connected-rib interconnectors is maintained over the whole temperature range, and the triangular-rib configuration remains the most effective for improving cell output.
5. Conclusions
Connected-rib interconnectors improve the electrochemical performance of anode-supported planar SOFCs under the condition of identical interconnector–electrode contact area. At 800 °C, the peak power densities of CI-SOFC, RI-SOFC, and TI-SOFC increase by 4.9%, 9.7%, and 11.7%, respectively, compared with SI-SOFC. The performance enhancement mainly originates from the reduction of cathode-side activation and concentration overpotentials, whereas the ohmic overpotential remains nearly unchanged. The connected-rib structures also promote reactant redistribution and strengthen under-rib transport in the porous electrodes.
The three connected-rib designs do not provide the same balance between transport enhancement and hydraulic cost. TI-SOFC delivers the strongest under-rib transport enhancement and the highest power density, but it also causes the largest pressure drop. RI-SOFC provides a more uniform velocity distribution in the porous anode and a lower pressure-drop penalty than CI-SOFC and TI-SOFC, giving a better compromise between mass-transfer enhancement and hydraulic resistance.
Author Contributions
Conceptualization, H.L., H.Z. and Z.L.; methodology, H.L.; software, H.L., B.C. and Z.L.; validation, W.W. and X.Z.; formal analysis, H.L. and H.Z.; writing—original draft preparation, H.L.; writing—review and editing, H.L., X.Z. and H.Z. All authors have read and agreed to the published version of the manuscript.
Funding
This research was funded by PetroChina Company Limited, grant number 2024ZZ49 and 2025ZS68.
Data Availability Statement
The original contributions presented in this study are included in the article. Further inquiries can be directed to the corresponding authors.
Conflicts of Interest
The authors declare no conflicts of interest.
Abbreviations
| SOFC | Solid oxide fuel cell |
| SI | Straight-rib interconnector |
| CI | Circular-rib interconnector |
| RI | Rectangular-rib interconnector |
| TI | Triangular-rib interconnector |
References
- Malicek, B.; Speckmann, F.-W.; Entenmann, M.; Birke, K.P. Scoping Review of Potentials to Optimize Planar Solid Oxide Cell Designs for Use in Fuel Cell and Electrolysis Applications. Energies 2025, 18, 6420. [Google Scholar] [CrossRef]
- Kim, Y.S.; Lee, Y.D.; Ahn, K.Y. System Integration and Proof-of-Concept Test Results of SOFC-Engine Hybrid Power Generation System. Appl. Energy 2020, 277, 115542. [Google Scholar] [CrossRef]
- Liu, Y.; Yang, C.; Jiang, H.; Wang, H. Controller Hardware-in-the-Loop Simulation of SOFC-GT Hybrid System. Energies 2025, 18, 6500. [Google Scholar] [CrossRef]
- Nourpour, M.; Khoshgoftar Manesh, M.H. Evaluation of Novel Integrated Combined Cycle Based on Gas Turbine-SOFC-Geothermal-Steam and Organic Rankine Cycles for Gas Turbo Compressor Station. Energy Convers. Manag. 2022, 252, 115050. [Google Scholar] [CrossRef]
- Lei, Z.; Wang, X.; Wang, F.; Huo, H.; Wang, B. Surrogate Modeling of a SOFC/GT Hybrid System Based on Extended State Observer Feature Extraction. Energies 2026, 19, 587. [Google Scholar] [CrossRef]
- Gu, S.; Lu, Y.; Zhuang, Y. Investigation of a System Combining Separate Hydrolysis and Fermentation of Biomass with a Direct-Ethanol Solid Oxide Fuel Cell: Thermodynamic and Reaction Kinetic Studies. Energies 2025, 18, 6456. [Google Scholar] [CrossRef]
- De Lorenzo, G.; Briguglio, N.; Vita, A.S. Renewable Energy Storage in a Poly-Generative System Fuel Cell/Electrolyzer, Supporting Green Mobility in a Residential Building. Energies 2025, 18, 5343. [Google Scholar] [CrossRef]
- Fu, Q.; Li, H.; Wei, W.; Hun, L.; Tian, C.; Dai, Y.; Huang, J. Enhancing Transport Properties and Electrical Performance of Planar Solid Oxide Fuel Cell Stacks Using Tibial-Ribbed Interconnectors. Chem. Eng. J. 2025, 520, 166089. [Google Scholar] [CrossRef]
- Li, Y.-F.; Sun, S.-D.; Pang, J.-L.; Dai, Y.; Zhang, H.-Y.; Li, C.-X. Anode-Side Flow Channel Structure Design for Metal-Supported Solid Oxide Fuel Cell: An Investigation of Discrete Interconnect Based on Multi-Physics Coupling Simulation. J. Power Sources 2025, 653, 237705. [Google Scholar] [CrossRef]
- Yang, G.; Potter, A.; Sumner, J. An Overview on Oxidation of Metallic Interconnects in Solid Oxide Fuel Cells under Various Atmospheres. Int. J. Hydrogen Energy 2025, 99, 974–984. [Google Scholar] [CrossRef]
- Ren, K.; Su, Y.; Zhong, Z.; Jiao, Z. Microstructure-Insight Topology Optimization for Efficient Interconnect Flow Channels in Solid Oxide Fuel Cells. Int. J. Heat Mass Transf. 2025, 242, 126823. [Google Scholar] [CrossRef]
- Lin, Z.; Stevenson, J.W.; Khaleel, M.A. The Effect of Interconnect Rib Size on the Fuel Cell Concentration Polarization in Planar SOFCs. J. Power Sources 2003, 117, 92–97. [Google Scholar] [CrossRef]
- Liu, S.; Song, C.; Lin, Z. The Effects of the Interconnect Rib Contact Resistance on the Performance of Planar Solid Oxide Fuel Cell Stack and the Rib Design Optimization. J. Power Sources 2008, 183, 214–225. [Google Scholar] [CrossRef]
- Kong, W.; Li, J.; Liu, S.; Lin, Z. The Influence of Interconnect Ribs on the Performance of Planar Solid Oxide Fuel Cell and Formulae for Optimal Rib Sizes. J. Power Sources 2012, 204, 106–115. [Google Scholar] [CrossRef]
- Kong, W.; Gao, X.; Liu, S.; Su, S.; Chen, D. Optimization of the Interconnect Ribs for a Cathode-Supported Solid Oxide Fuel Cell. Energies 2014, 7, 295–313. [Google Scholar] [CrossRef]
- Moreno-Blanco, J.; Elizalde-Blancas, F.; Riesco-Avila, J.M.; et al. On the Effect of Gas Channels-Electrode Interface Area on SOFCs Performance. Int. J. Hydrogen Energy 2019, 44, 446–456. [Google Scholar] [CrossRef]
- Khazaee, I.; Rava, A. Numerical Simulation of the Performance of Solid Oxide Fuel Cell with Different Flow Channel Geometries. Energy 2017, 119, 235–244. [Google Scholar] [CrossRef]
- Canavar, M.; Timurkutluk, B. Design and Fabrication of Novel Anode Flow-Field for Commercial Size Solid Oxide Fuel Cells. J. Power Sources 2017, 346, 49–55. [Google Scholar] [CrossRef]
- Canavar, M.; Kaplan, Y. Effects of Mesh and Interconnector Design on Solid Oxide Fuel Cell Performance. Int. J. Hydrogen Energy 2015, 40, 7829–7834. [Google Scholar] [CrossRef]
- Bhattacharya, D.; Mukhopadhyay, J.; Biswas, N.; et al. Performance Evaluation of Different Bipolar Plate Designs of 3D Planar Anode-Supported SOFCs. Int. J. Heat Mass Transf. 2018, 123, 382–396. [Google Scholar] [CrossRef]
- Saied, M.; Ahmed, K.; Nemat-Alla, M.; et al. Performance Study of Solid Oxide Fuel Cell with Various Flow Field Designs: Numerical Study. Int. J. Hydrogen Energy 2018, 43, 20931–20946. [Google Scholar] [CrossRef]
- Yan, M.; Fu, P.; Li, X.; Zeng, M.; Wang, Q. Mass Transfer Enhancement of a Spiral-Like Interconnector for Planar Solid Oxide Fuel Cells. Appl. Energy 2015, 160, 954–964. [Google Scholar] [CrossRef]
- Fu, Q.; Li, Z.; Wei, W.; Liu, F.; Xu, X.; Liu, Z. Performance Enhancement of a Beam and Slot Interconnector for Anode-Supported SOFC Stack. Energy Convers. Manag. 2021, 241, 114277. [Google Scholar] [CrossRef]
- Kong, W.; Han, Z.; Lu, S.; Gao, X.; Wang, X. A Novel Interconnector Design of SOFC. Int. J. Hydrogen Energy 2020, 45, 20329–20338. [Google Scholar] [CrossRef]
- Dong, S.-K.; Jung, W.-N.; Rashid, K.; et al. Design and Numerical Analysis of a Planar Anode-Supported SOFC Stack. Renew. Energy 2016, 94, 637–650. [Google Scholar] [CrossRef]
- Kim, J.; Kim, D.H.; Lee, W.; et al. A Novel Interconnect Design for Thermal Management of a Commercial-Scale Planar Solid Oxide Fuel Cell Stack. Energy Convers. Manag. 2021, 246, 114682. [Google Scholar] [CrossRef]
- Gong, C.; Tu, Z.; Chan, S.H. A Novel Flow Field Design with Flow Re-Distribution for Advanced Thermal Management in Solid Oxide Fuel Cell. Appl. Energy 2023, 331, 120364. [Google Scholar] [CrossRef]
- Gong, C.; Luo, X.; Tu, Z.; Chan, S.H. A Novel Flow Channel Design to Achieve High Temperature Homogenization in Solid Oxide Fuel Cell. Int. J. Hydrogen Energy 2024, 52, 442–453. [Google Scholar] [CrossRef]
- Guo, M.; He, Q.; Cheng, C.; Zhao, D.; Ni, M. New Interconnector Designs for Electrical Performance Enhancement of Solid Oxide Fuel Cells: A 3D Modelling Study. J. Power Sources 2022, 533, 231373. [Google Scholar] [CrossRef]
- Suwanwarangkul, R.; Croiset, E.; Fowler, M.W.; et al. Performance Comparison of Fick’s, Dusty-Gas and Stefan–Maxwell Models to Predict the Concentration Overpotential of a SOFC Anode. J. Power Sources 2003, 122, 9–18. [Google Scholar] [CrossRef]
- Andersson, M.; Yuan, J.; Sundén, B. SOFC Modeling Considering Electrochemical Reactions at the Active Three Phase Boundaries. Int. J. Heat Mass Transf. 2012, 55, 773–788. [Google Scholar] [CrossRef]
- Ni, M. Modeling and Parametric Simulations of Solid Oxide Fuel Cells with Methane Carbon Dioxide Reforming. Energy Convers. Manag. 2013, 70, 116–129. [Google Scholar] [CrossRef]
- Patcharavorachot, Y.; Chatrattanawet, N.; Saebea, D.; Arpornwichanop, A. Performance Assessment of a 10 kW Pressurized Solid Oxide Fuel Cell Integrated with Glycerol Supercritical Water Reforming. Int. J. Energy Res. 2022, 46, 13613–13626. [Google Scholar] [CrossRef]
- Bakalis, D.P.; Stamatis, A.G. Optimization Methodology of Turbomachines for Hybrid SOFC-GT Applications. Energy 2014, 70, 86–94. [Google Scholar] [CrossRef]
- Larosa, L.; Traverso, A.; Ferrari, M.L. Pressurized SOFC Hybrid Systems: Control System Study and Experimental Verification. J. Eng. Gas. Turbines Power 2015, 137, 031602. [Google Scholar] [CrossRef]
- Chan, C.Y.; Rosner, F.; Samuelsen, S. Techno-Economic Analysis of Solid Oxide Fuel Cell-Gas Turbine Hybrid Systems for Stationary Power Applications Using Renewable Hydrogen. Energies 2023, 16, 4955. [Google Scholar] [CrossRef]
Figure 1.
SOFC system: (a) Schematic diagram of the SOFC experimental system; (b) geometric model of the SOFC and interconnectors; (c) the straight interconnector (SI); (d) the circular interconnector (CI); (e) the rectangular interconnector (RI); (f) the triangular interconnector (TI).
Figure 1.
SOFC system: (a) Schematic diagram of the SOFC experimental system; (b) geometric model of the SOFC and interconnectors; (c) the straight interconnector (SI); (d) the circular interconnector (CI); (e) the rectangular interconnector (RI); (f) the triangular interconnector (TI).
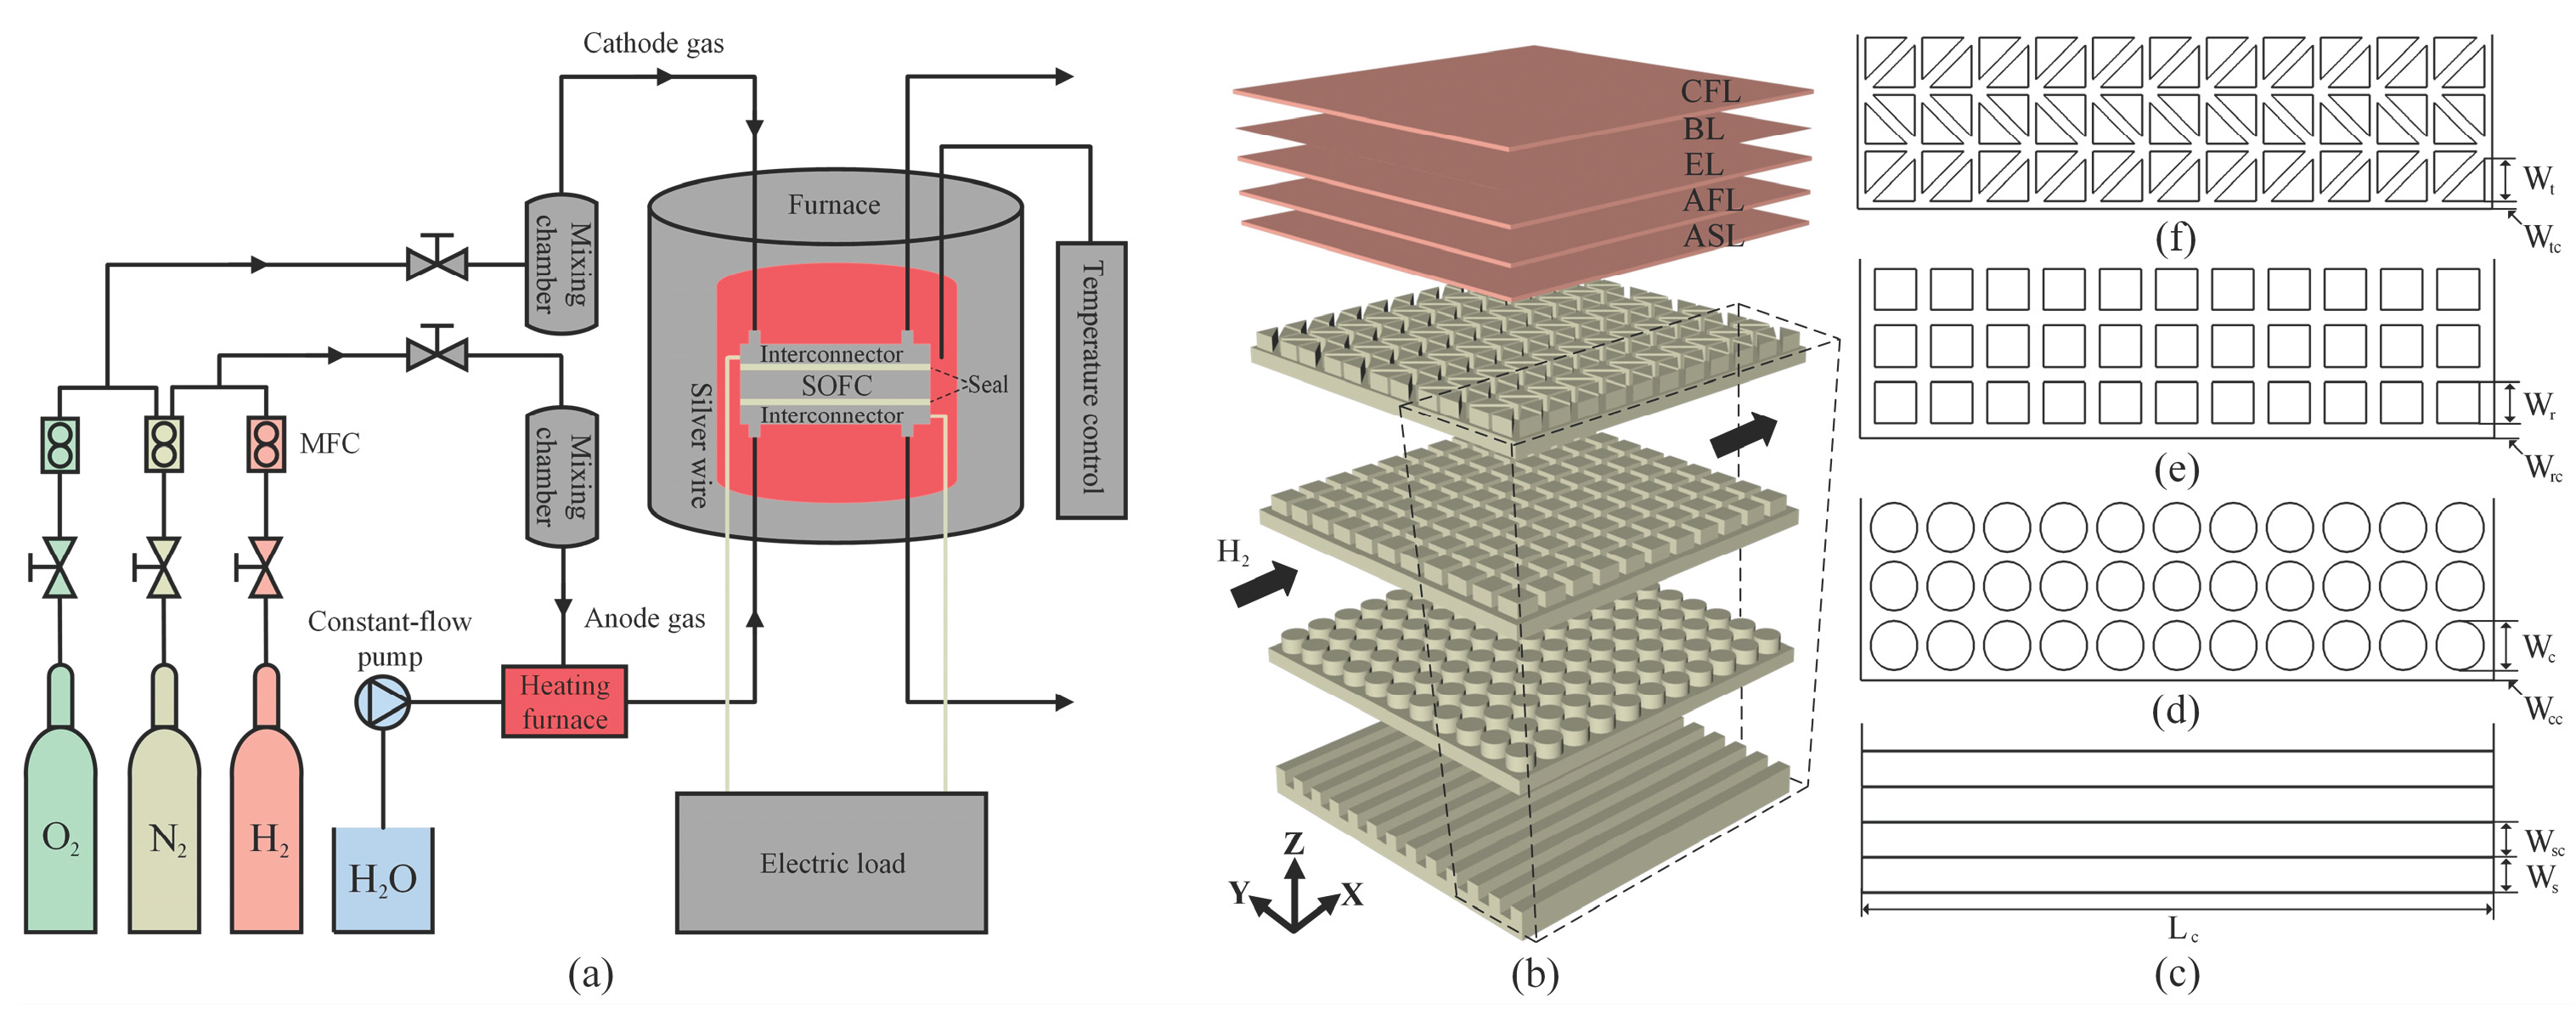
Figure 2.
SEM image of the cross section of the anode support plane SOFC after tests.
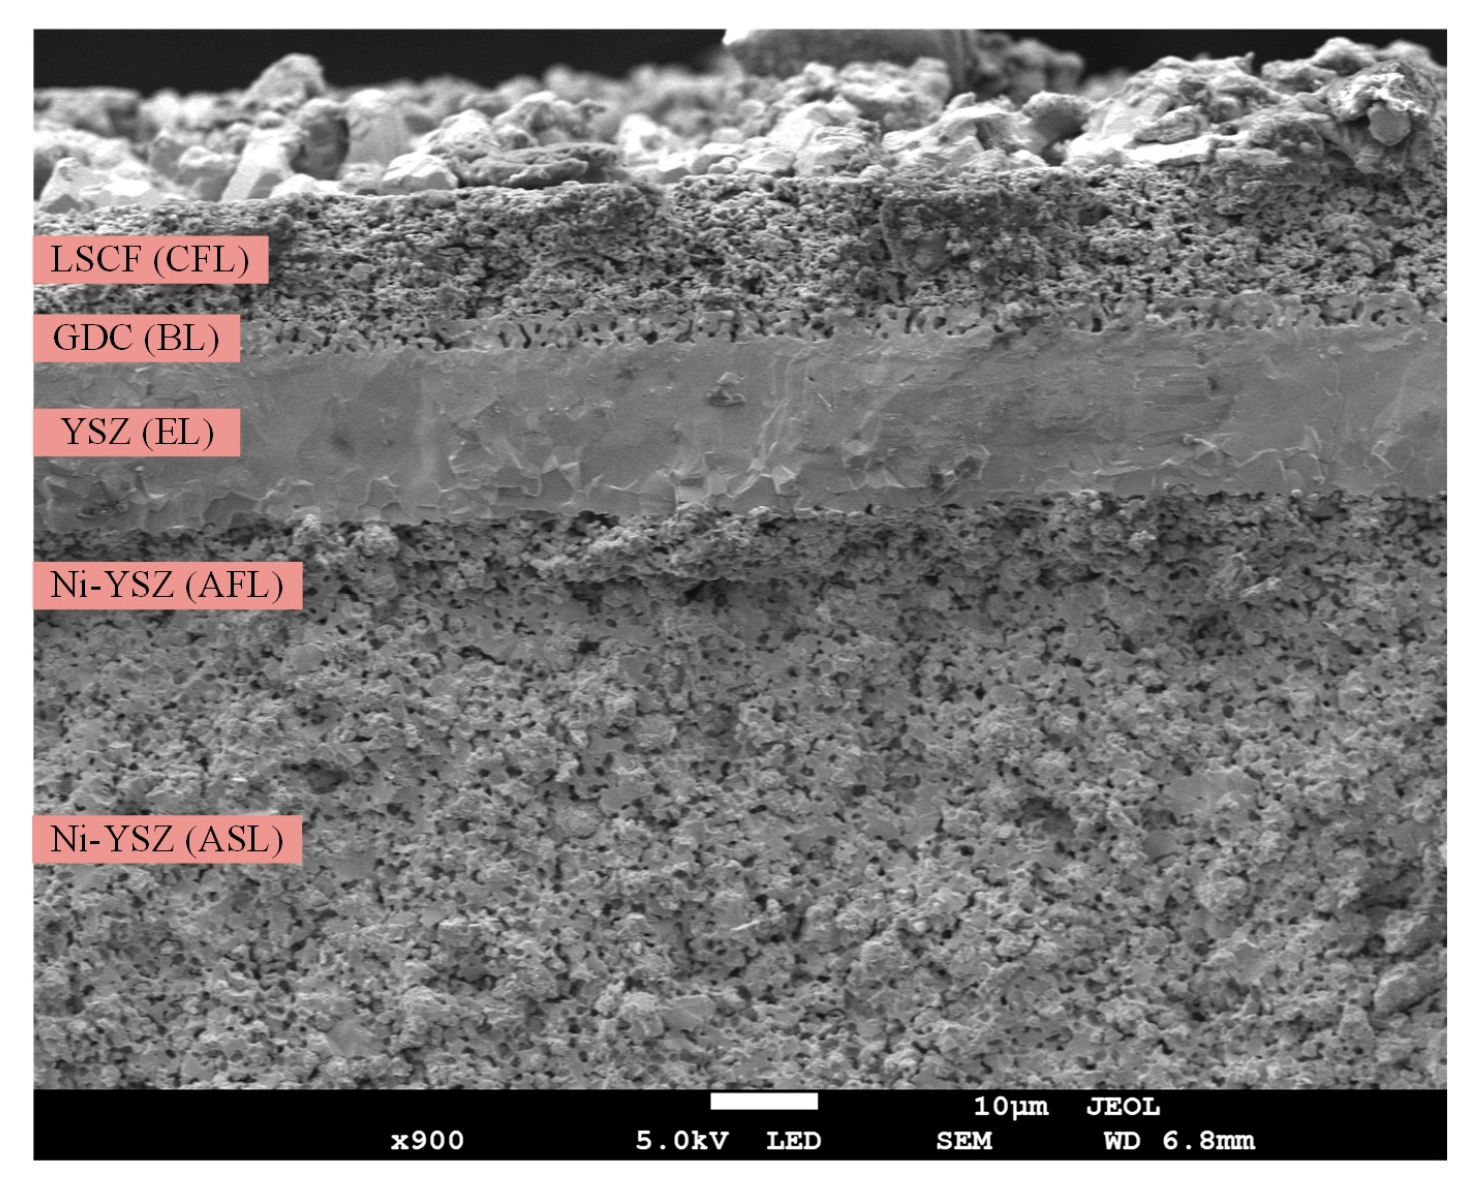
Figure 3.
Validation of SOFC model.
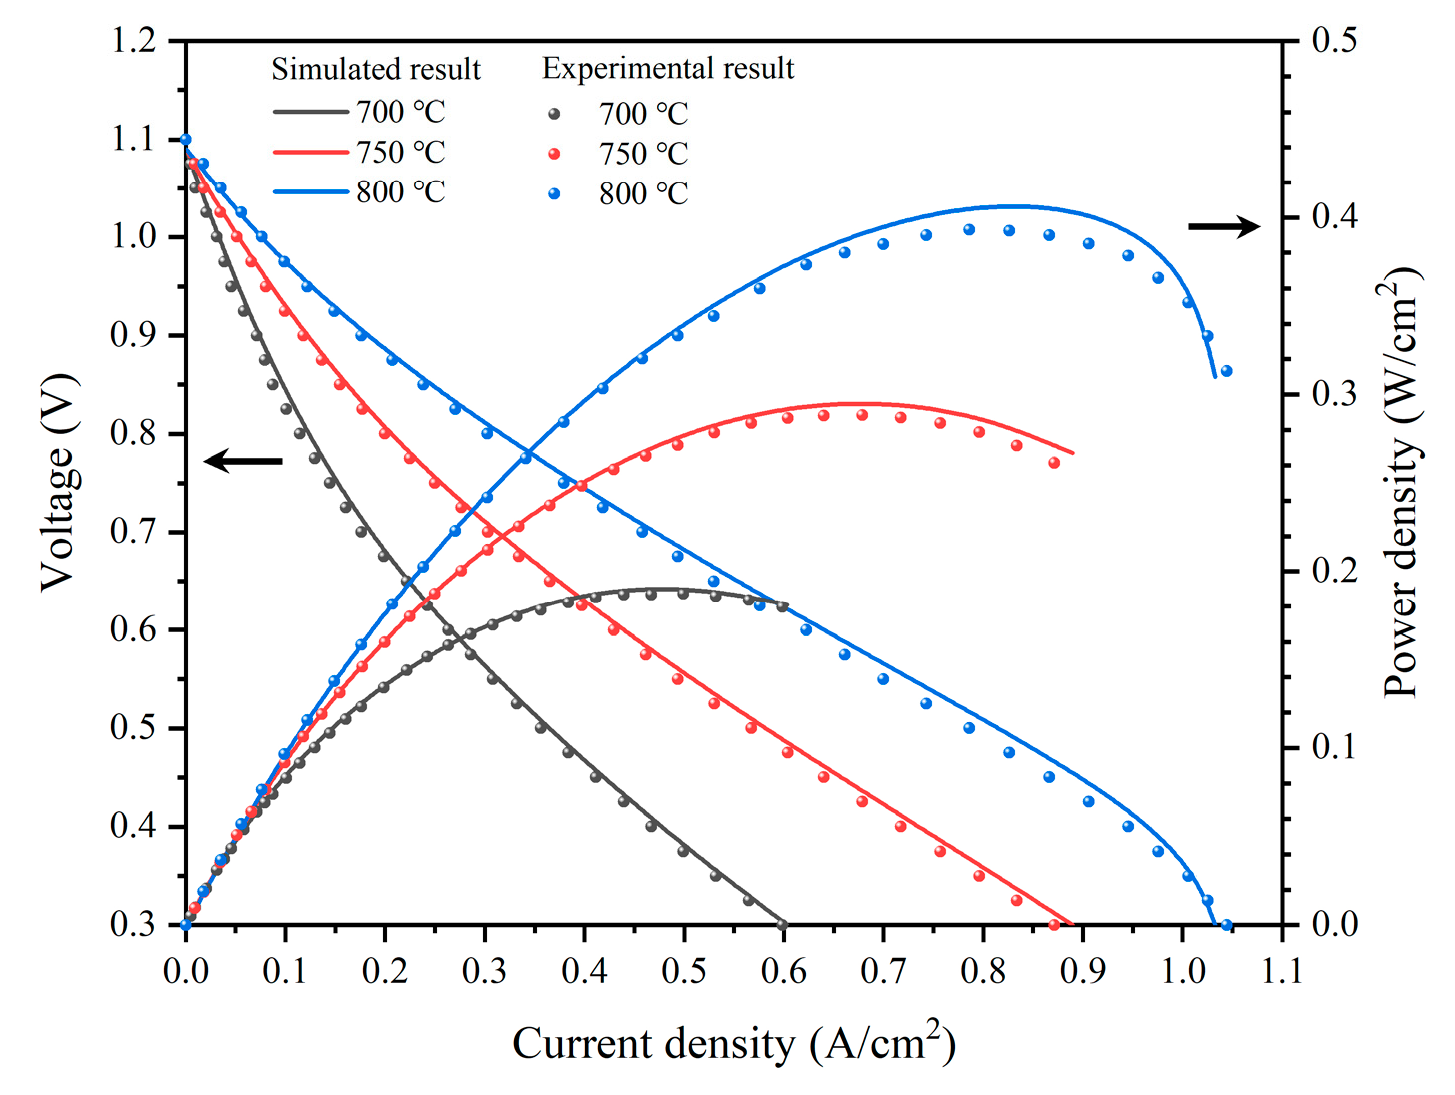
Figure 4.
Electrical performance of different SOFCs at 800 ℃.
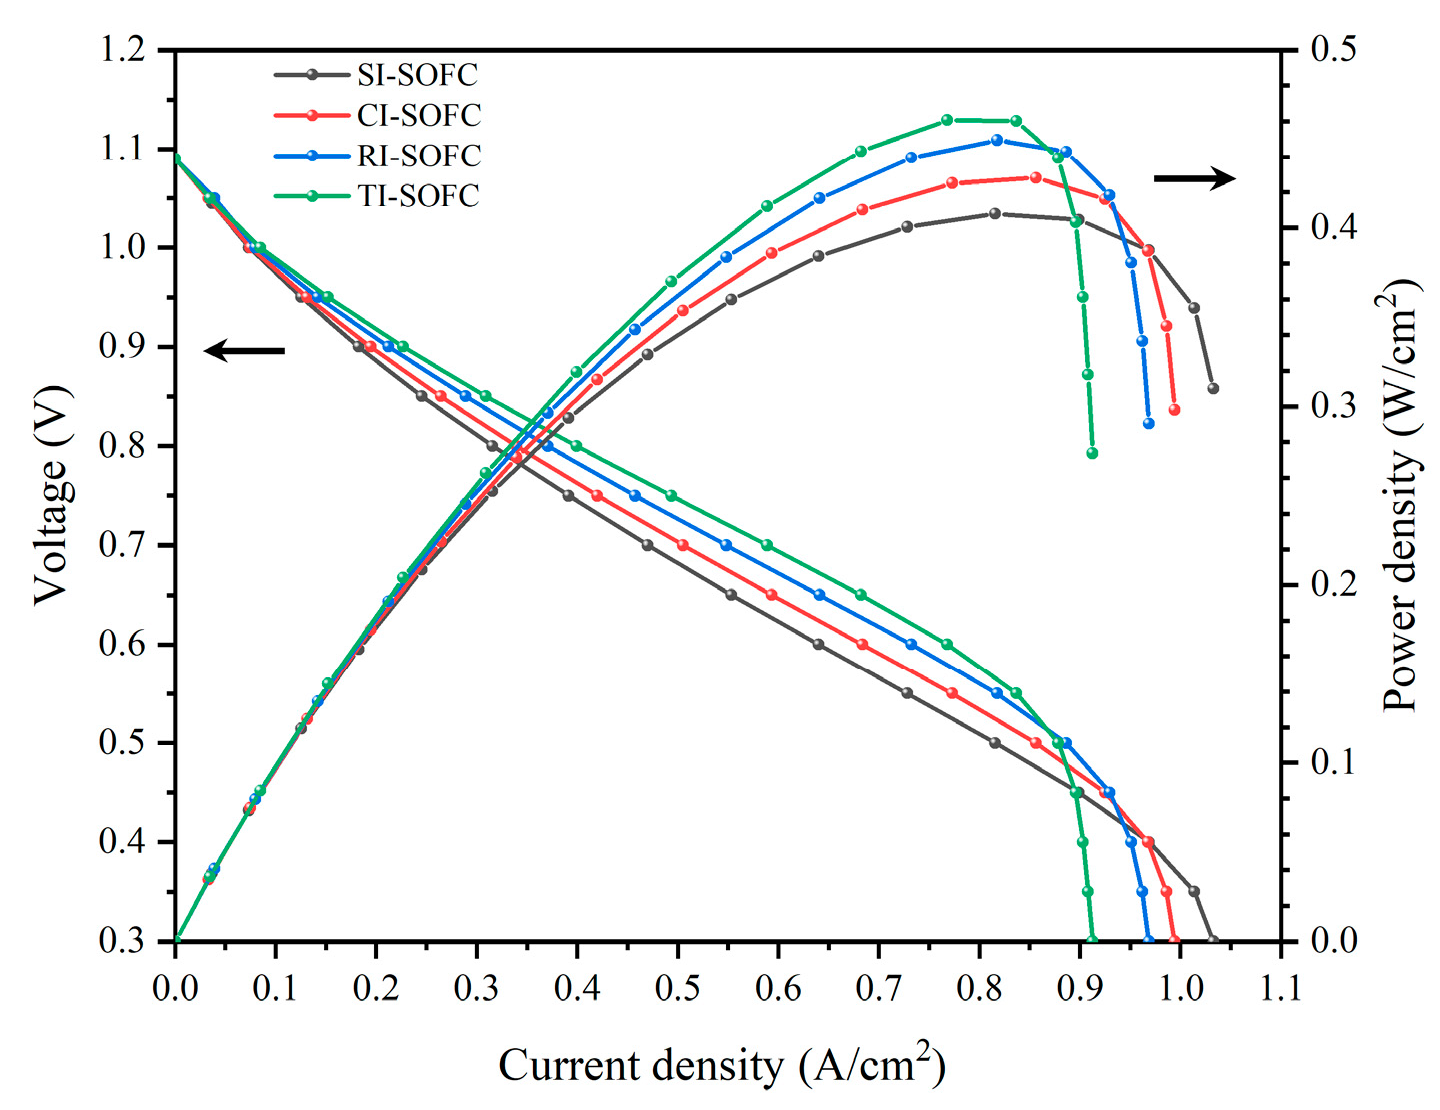
Figure 5.
Comparison of various overpotentials in SOFC with different interconnectors under 800℃: (a) activation overpotential; (b) concentration overpotential; (c) ohmic overpotential; (d) total overpotential.
Figure 5.
Comparison of various overpotentials in SOFC with different interconnectors under 800℃: (a) activation overpotential; (b) concentration overpotential; (c) ohmic overpotential; (d) total overpotential.
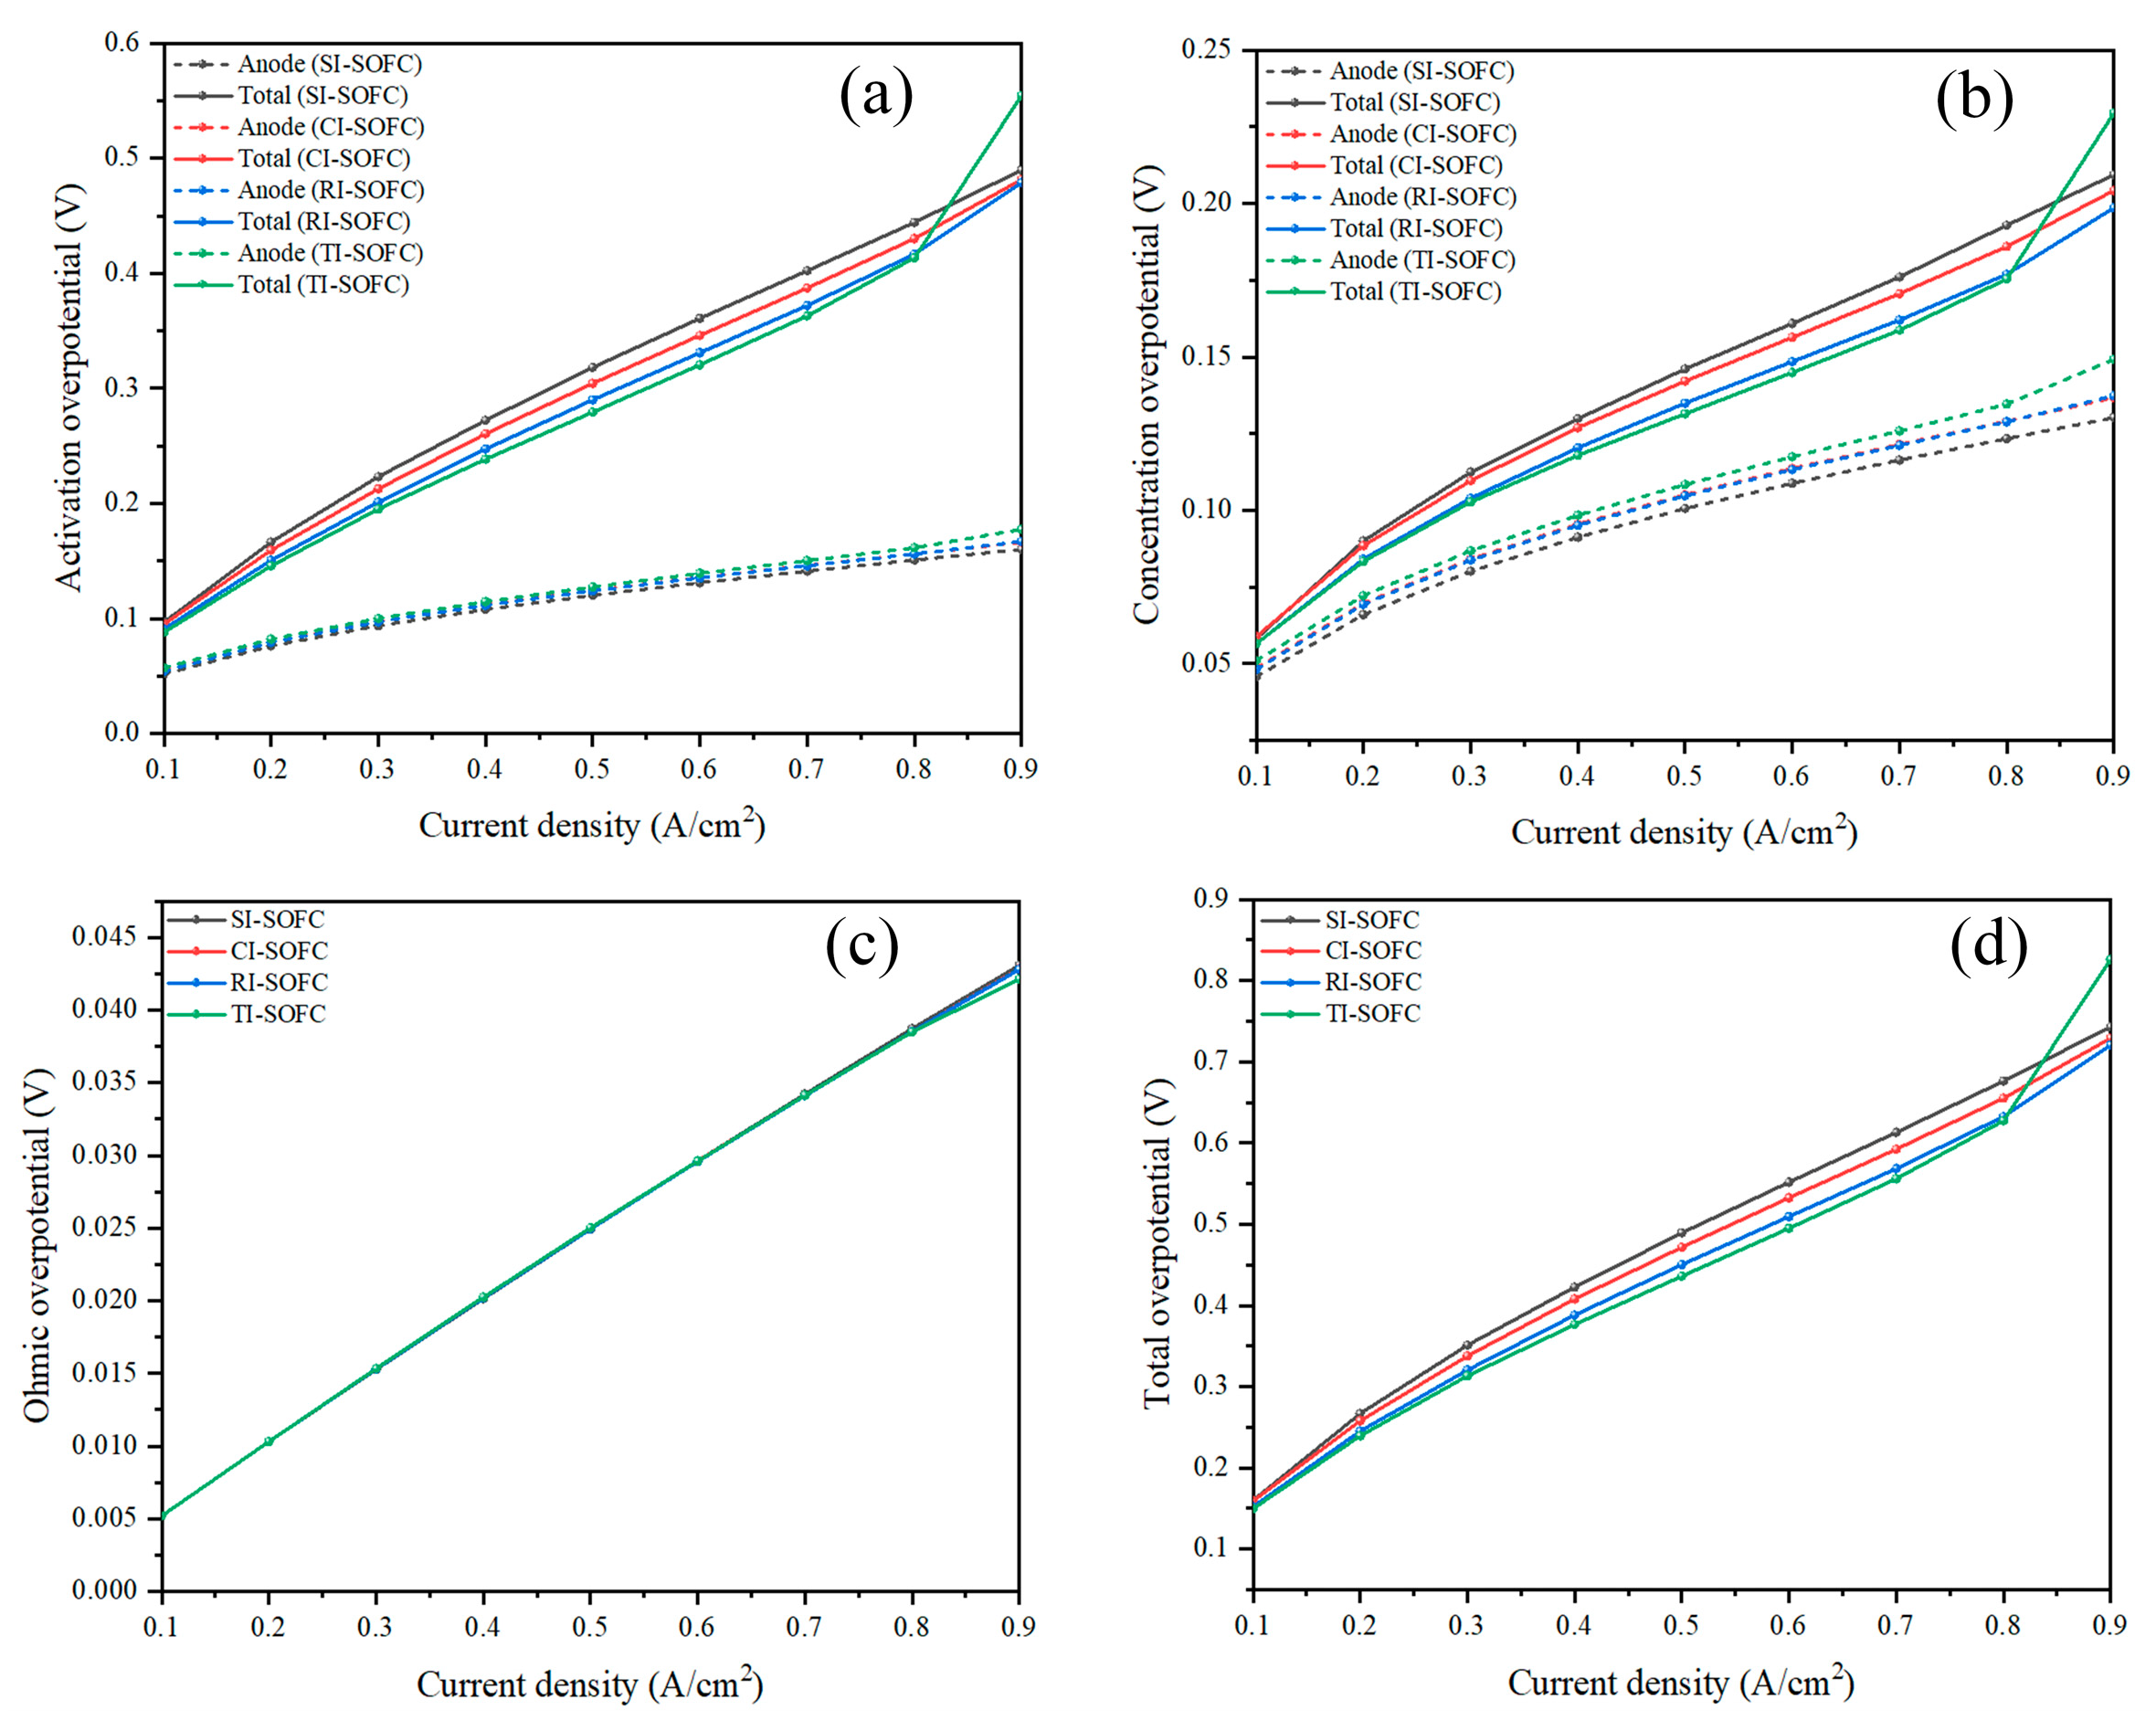
Figure 6.
Hydrogen mole fraction at the interconnector/ASL interface under 0.7 V and 800 °C: (a) SI-SOFC; (b) CI-SOFC; (c) RI-SOFC; (d) TI-SOFC; (e) hydrogen mole fraction along Line 1 (Y = 25 mm); (f) hydrogen mole fraction along Line 2 (X = 25 mm).
Figure 6.
Hydrogen mole fraction at the interconnector/ASL interface under 0.7 V and 800 °C: (a) SI-SOFC; (b) CI-SOFC; (c) RI-SOFC; (d) TI-SOFC; (e) hydrogen mole fraction along Line 1 (Y = 25 mm); (f) hydrogen mole fraction along Line 2 (X = 25 mm).
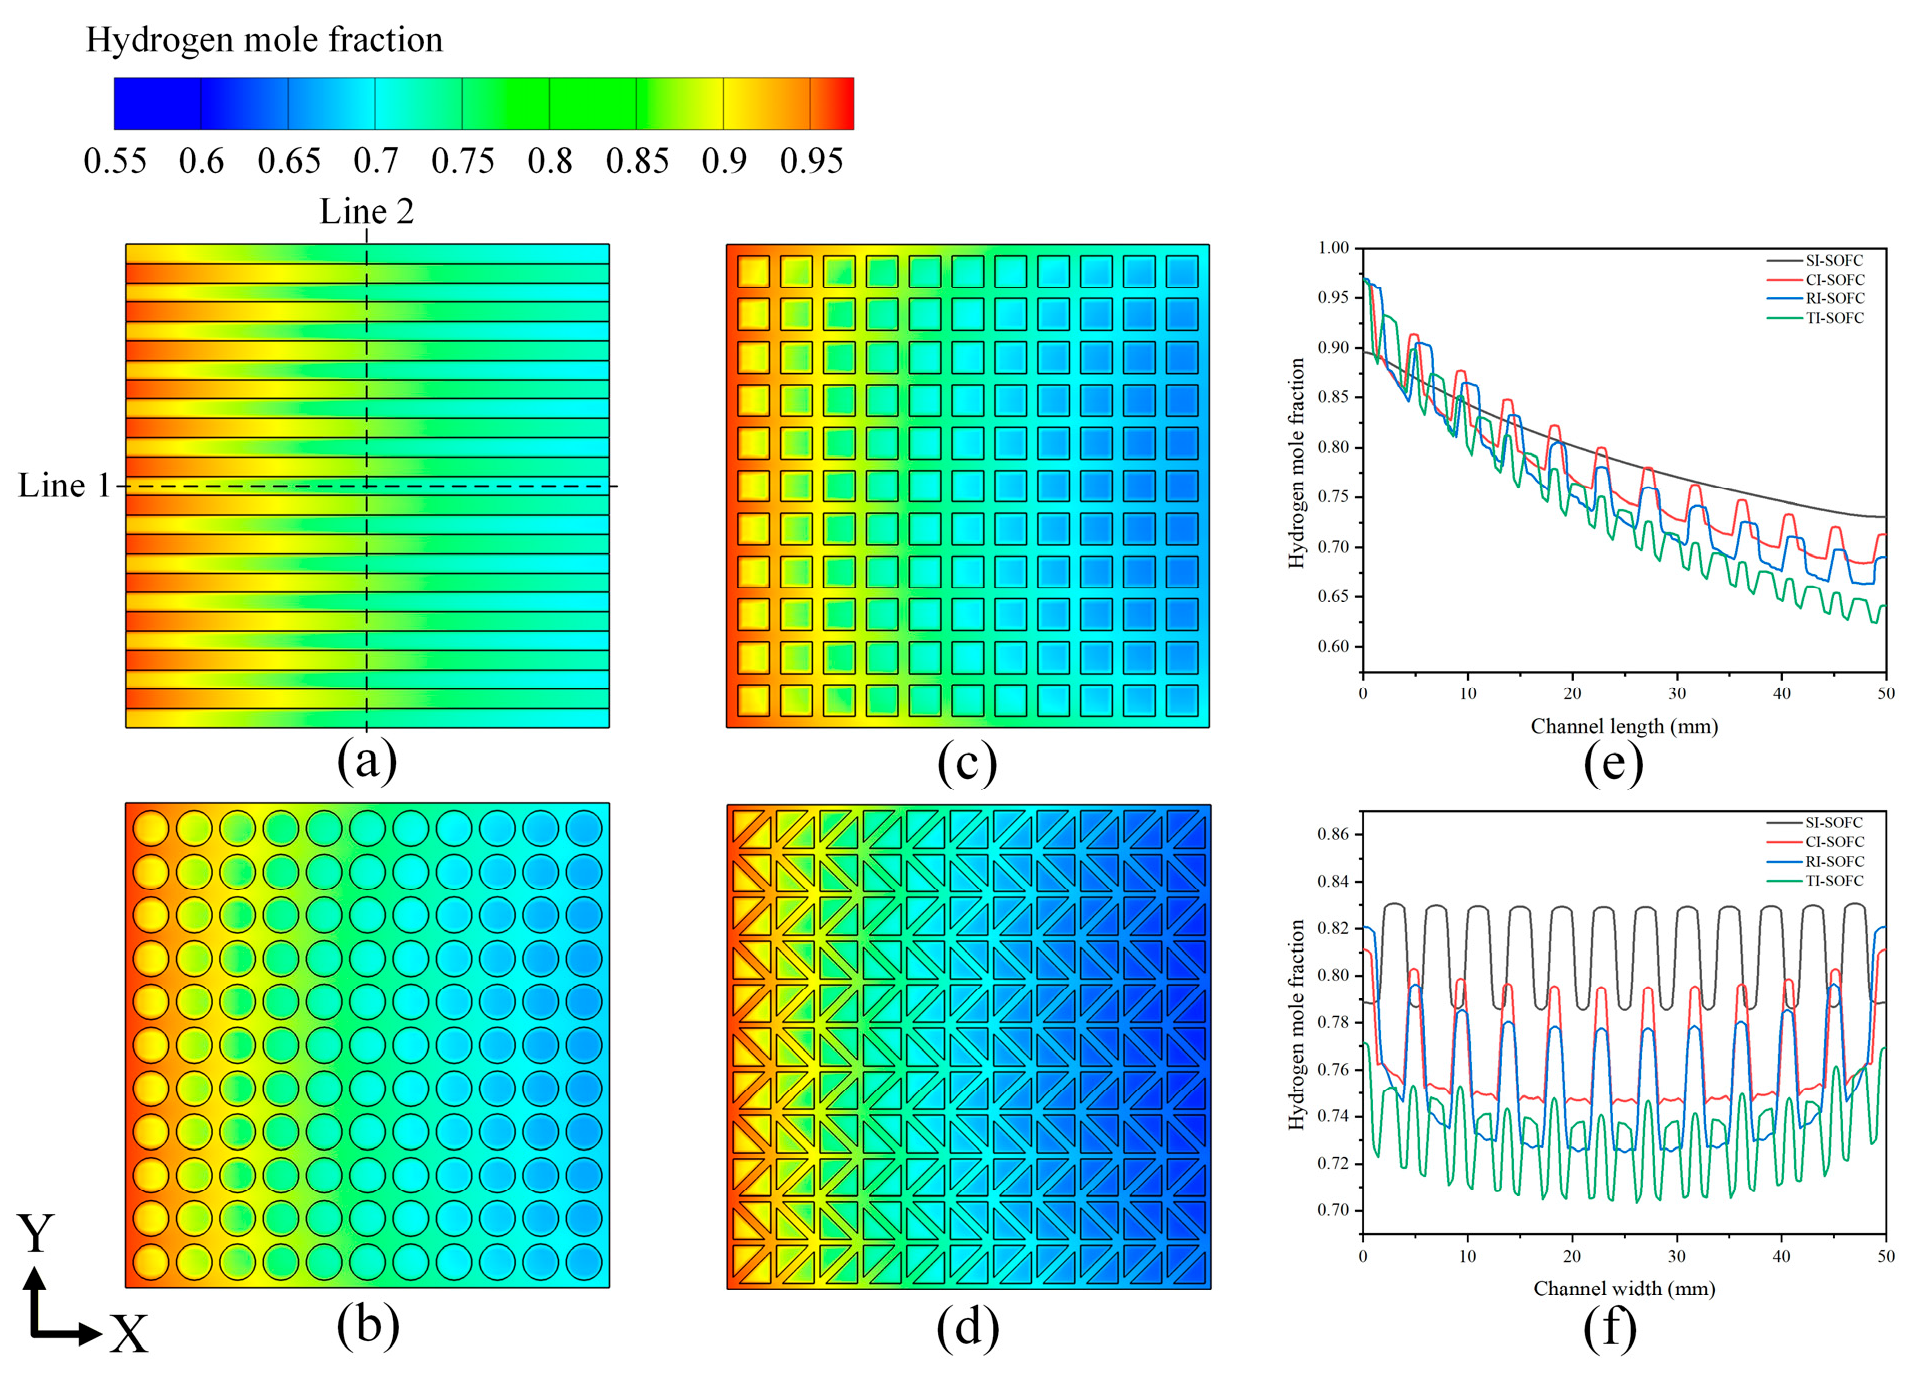
Figure 7.
Oxygen mole fraction at the interconnector/CFL interface under 0.7 V and 800 °C: (a) SI-SOFC; (b) CI-SOFC; (c) RI-SOFC; (d) TI-SOFC; (e) oxygen mole fraction along Line 3 (Y = 25 mm); (f) oxygen mole fraction along Line 4 (X = 25 mm).
Figure 7.
Oxygen mole fraction at the interconnector/CFL interface under 0.7 V and 800 °C: (a) SI-SOFC; (b) CI-SOFC; (c) RI-SOFC; (d) TI-SOFC; (e) oxygen mole fraction along Line 3 (Y = 25 mm); (f) oxygen mole fraction along Line 4 (X = 25 mm).
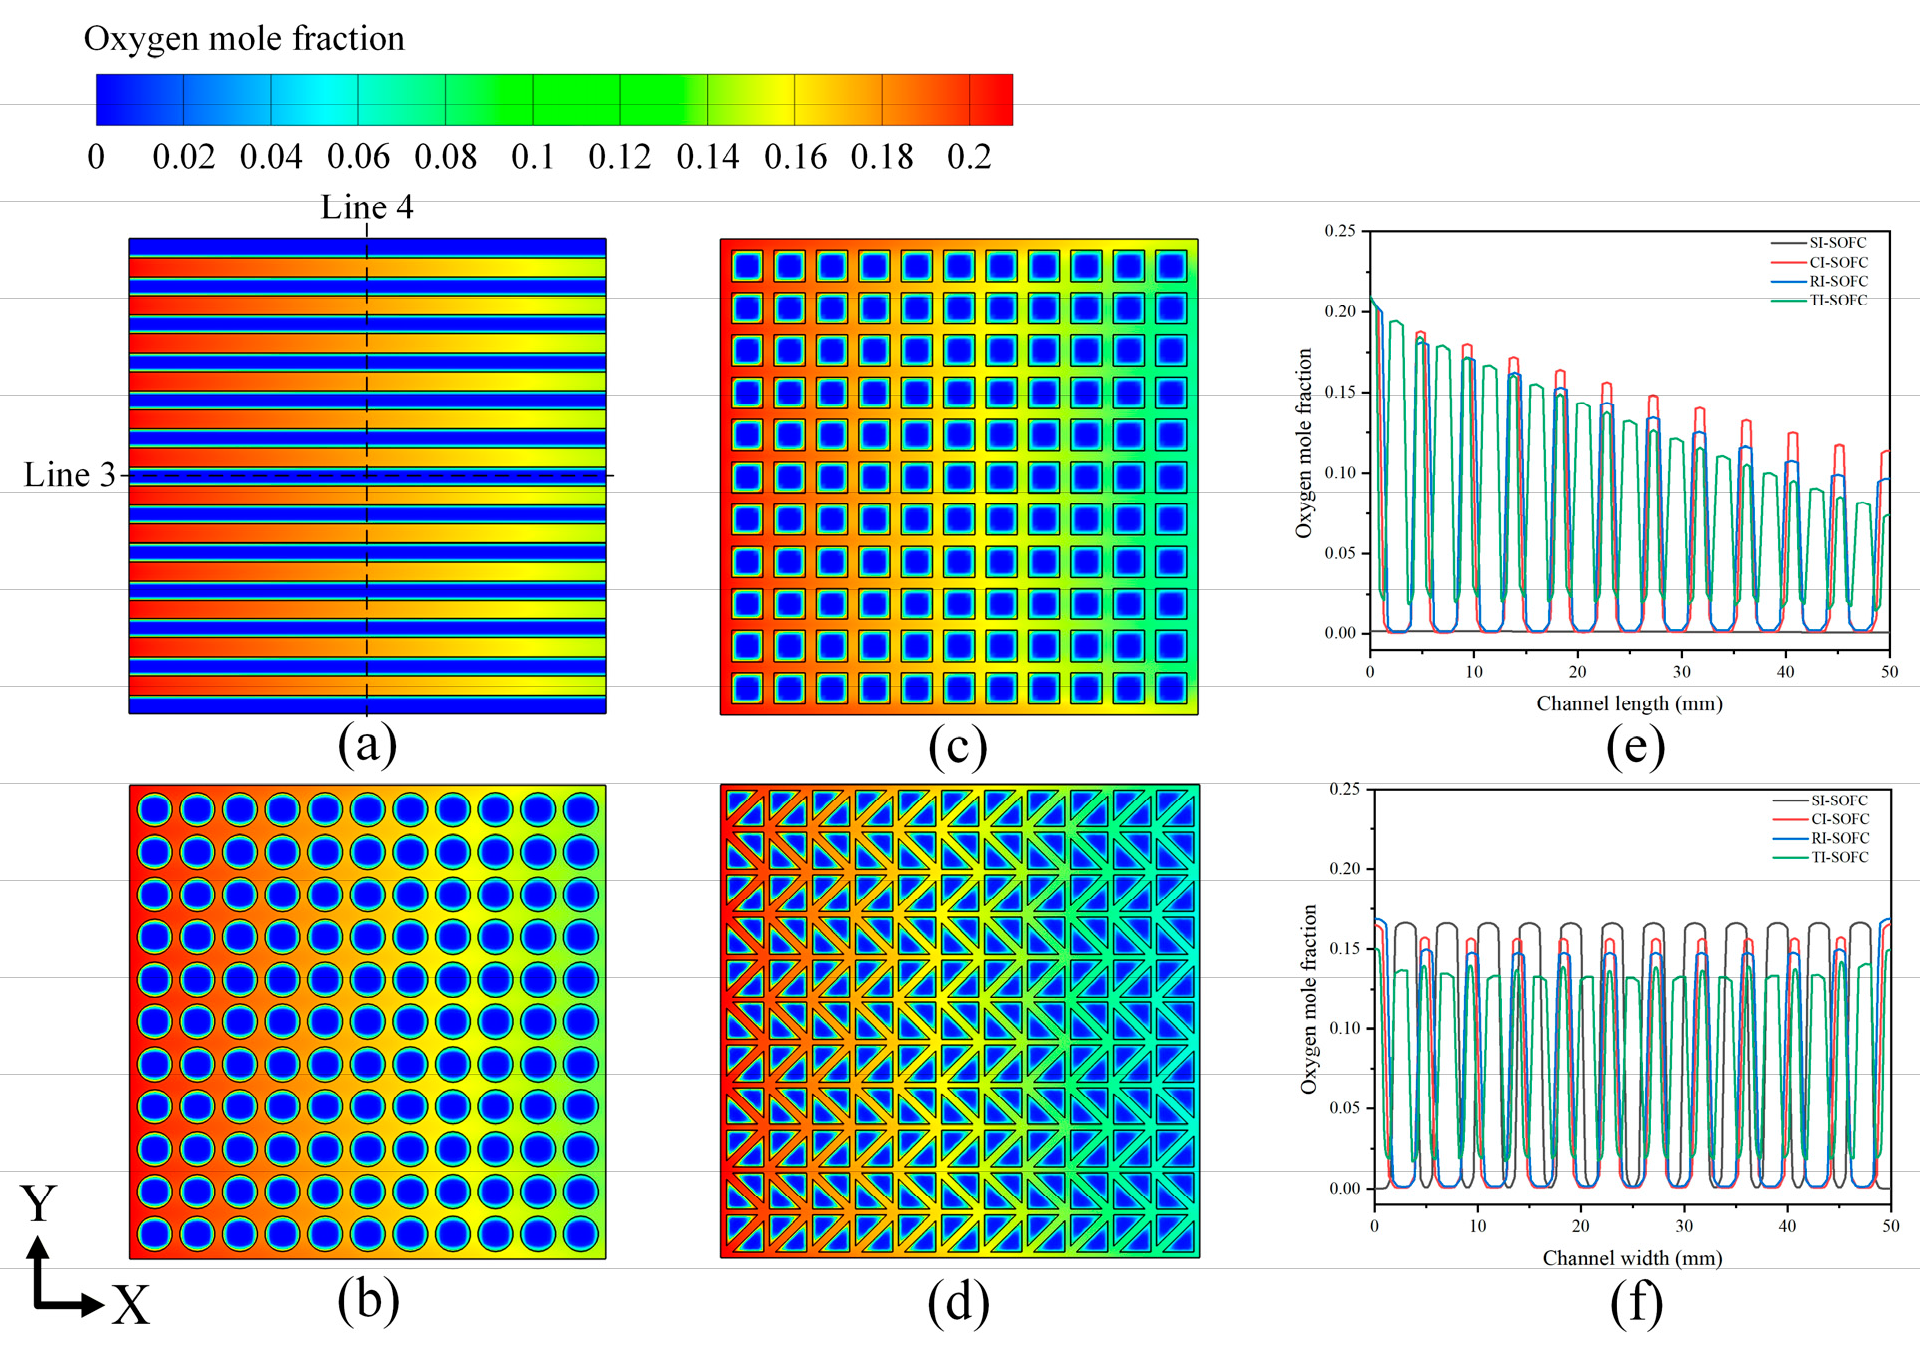
Figure 8.
Velocity distribution beneath the ribs in the ASL at the cross-section of Y=25 mm under 0.7 V: (a) SI-SOFC; (b) CI-SOFC; (c) RI-SOFC; (d) TI-SOFC.
Figure 8.
Velocity distribution beneath the ribs in the ASL at the cross-section of Y=25 mm under 0.7 V: (a) SI-SOFC; (b) CI-SOFC; (c) RI-SOFC; (d) TI-SOFC.
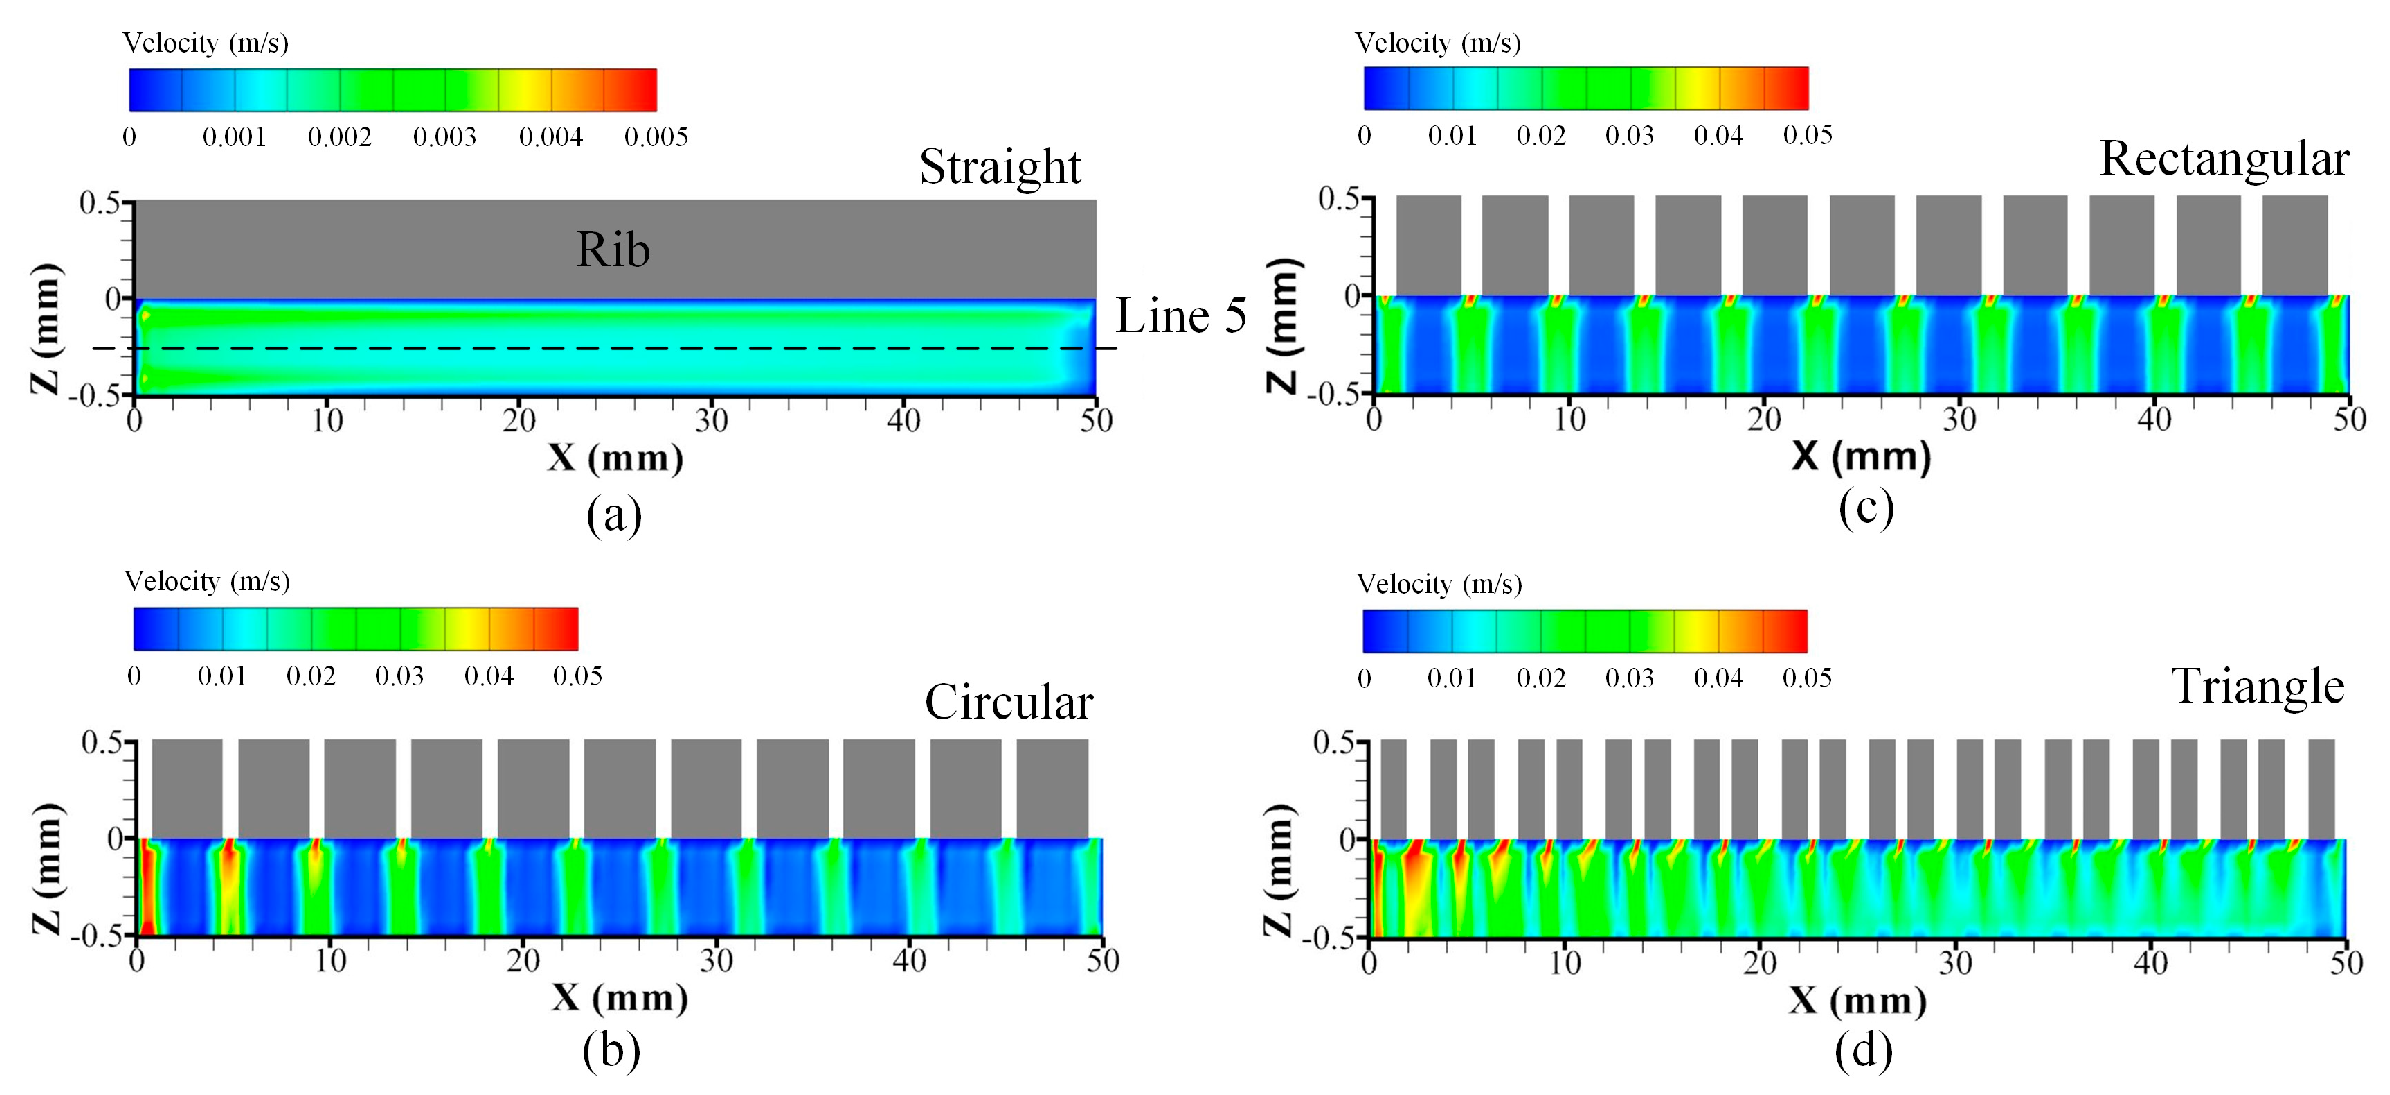
Figure 9.
Velocity distribution beneath the fuel channels in the ASL at the corresponding cross-sections (Y = 23 mm) under 0.7 V: (a) SI-SOFC; (b) CI-SOFC; (c) RI-SOFC; (d) TI-SOFC.
Figure 9.
Velocity distribution beneath the fuel channels in the ASL at the corresponding cross-sections (Y = 23 mm) under 0.7 V: (a) SI-SOFC; (b) CI-SOFC; (c) RI-SOFC; (d) TI-SOFC.
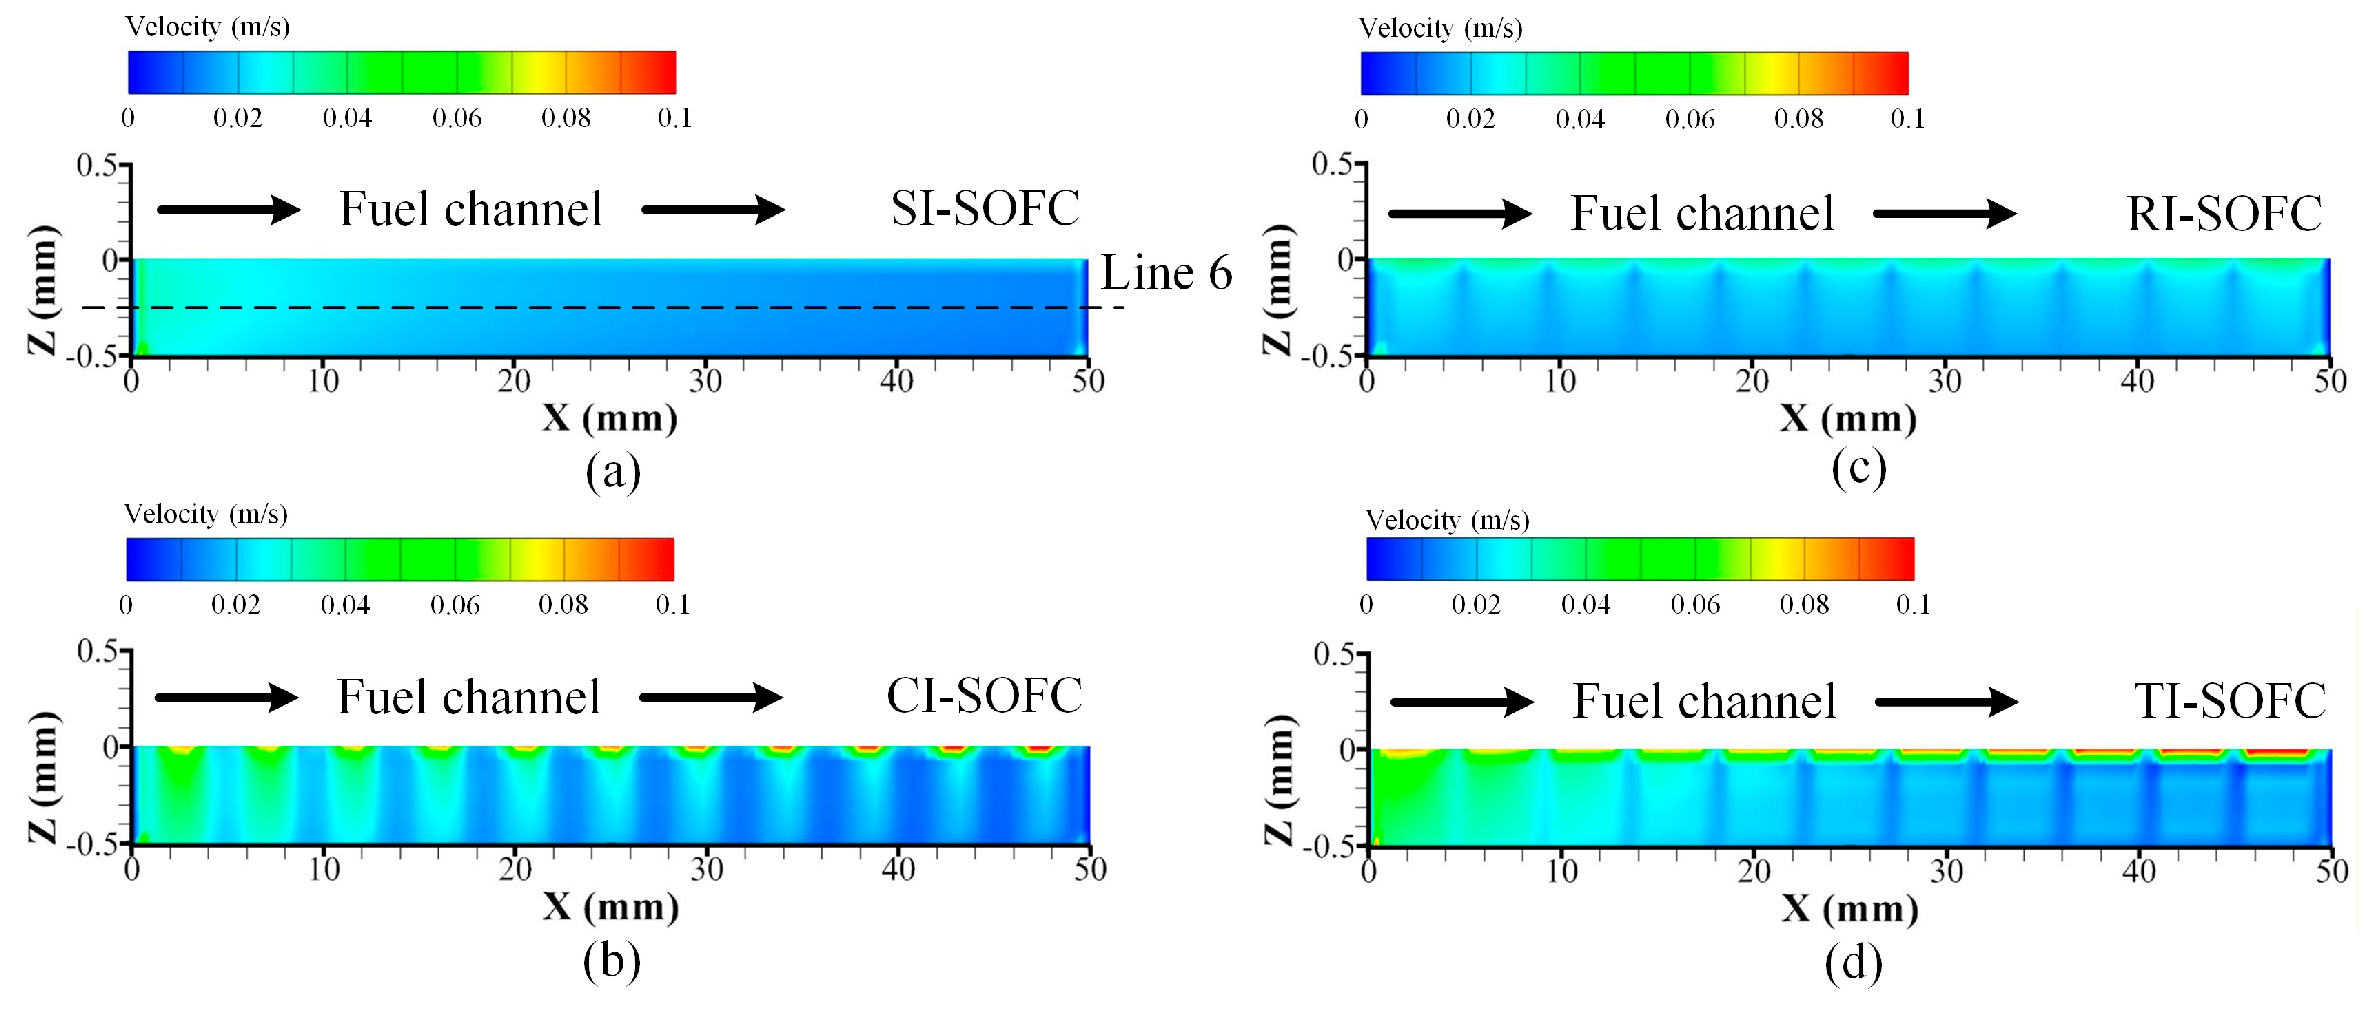
Figure 10.
Velocity distribution at (a) line 5 and (b) line 6 on the interface at the cross section under ribs and fuel channels with 0.7 V operate voltage.
Figure 10.
Velocity distribution at (a) line 5 and (b) line 6 on the interface at the cross section under ribs and fuel channels with 0.7 V operate voltage.
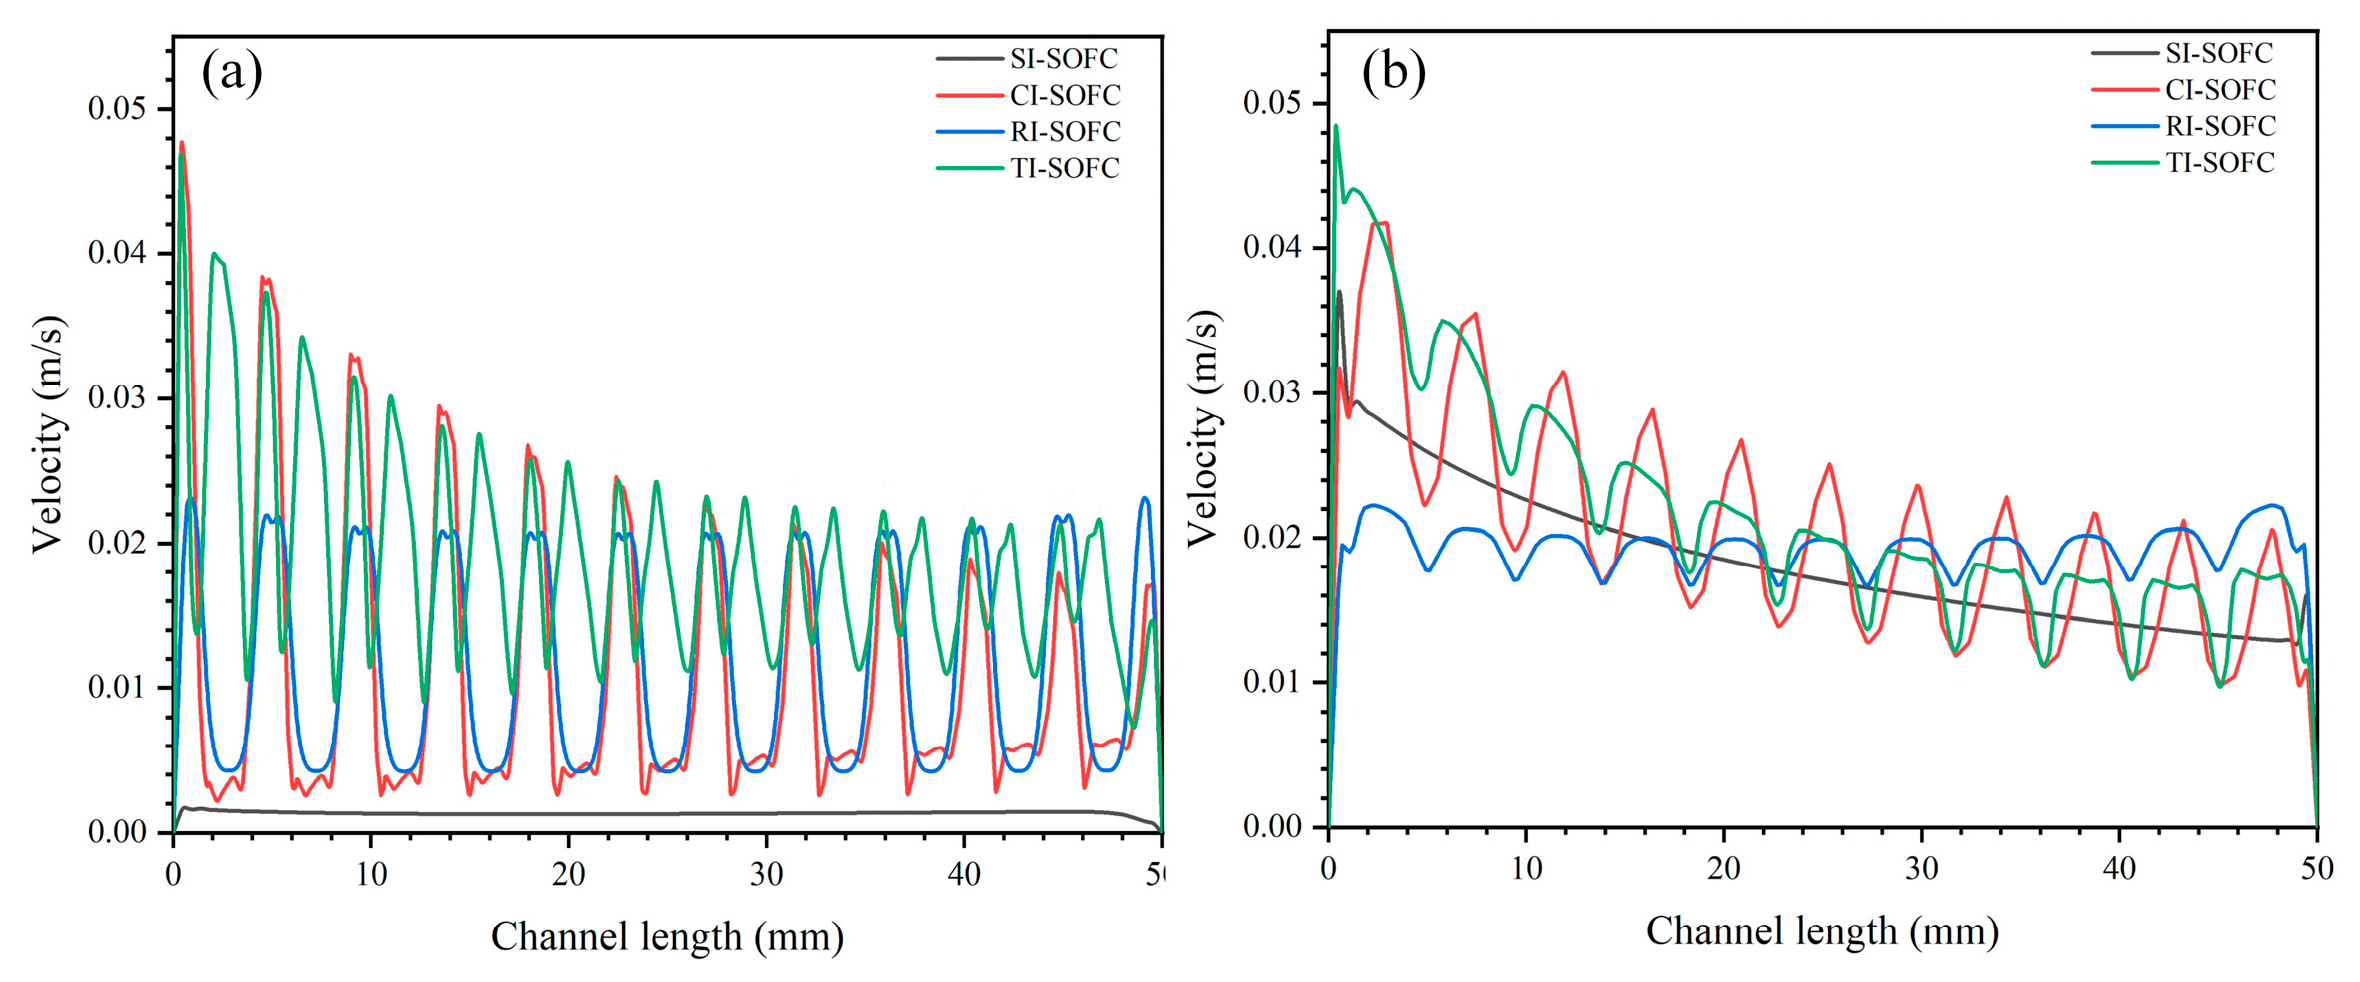
Figure 11.
Velocity and uniformity characteristics in the ASL:(a) Mean velocities under the ribs and under the fuel channels in the ASL at different current densities; (b) velocity uniformity index at different current densities.
Figure 11.
Velocity and uniformity characteristics in the ASL:(a) Mean velocities under the ribs and under the fuel channels in the ASL at different current densities; (b) velocity uniformity index at different current densities.
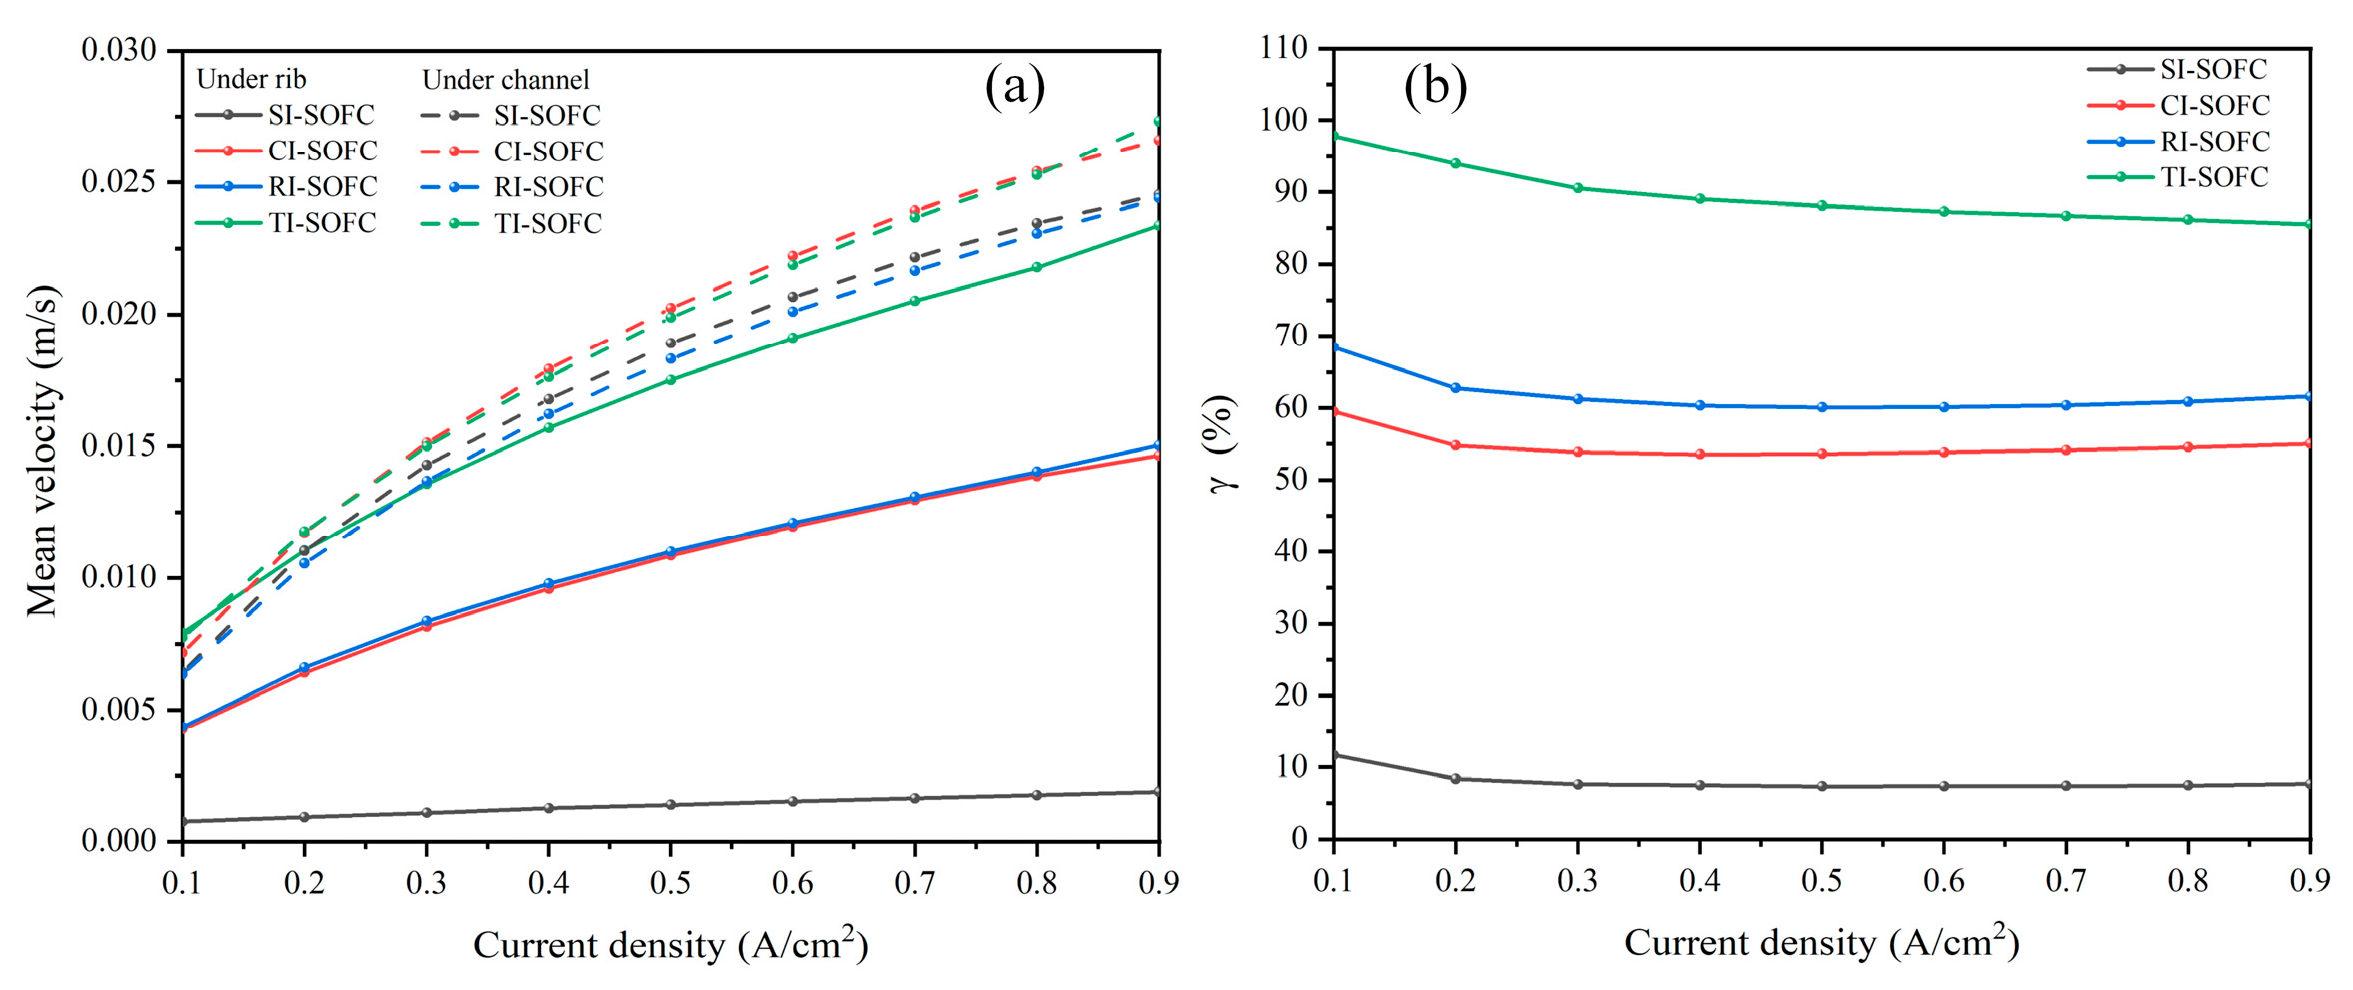
Figure 12.
Pressure drops in the air and fuel channels at 800 °C under different current densities.
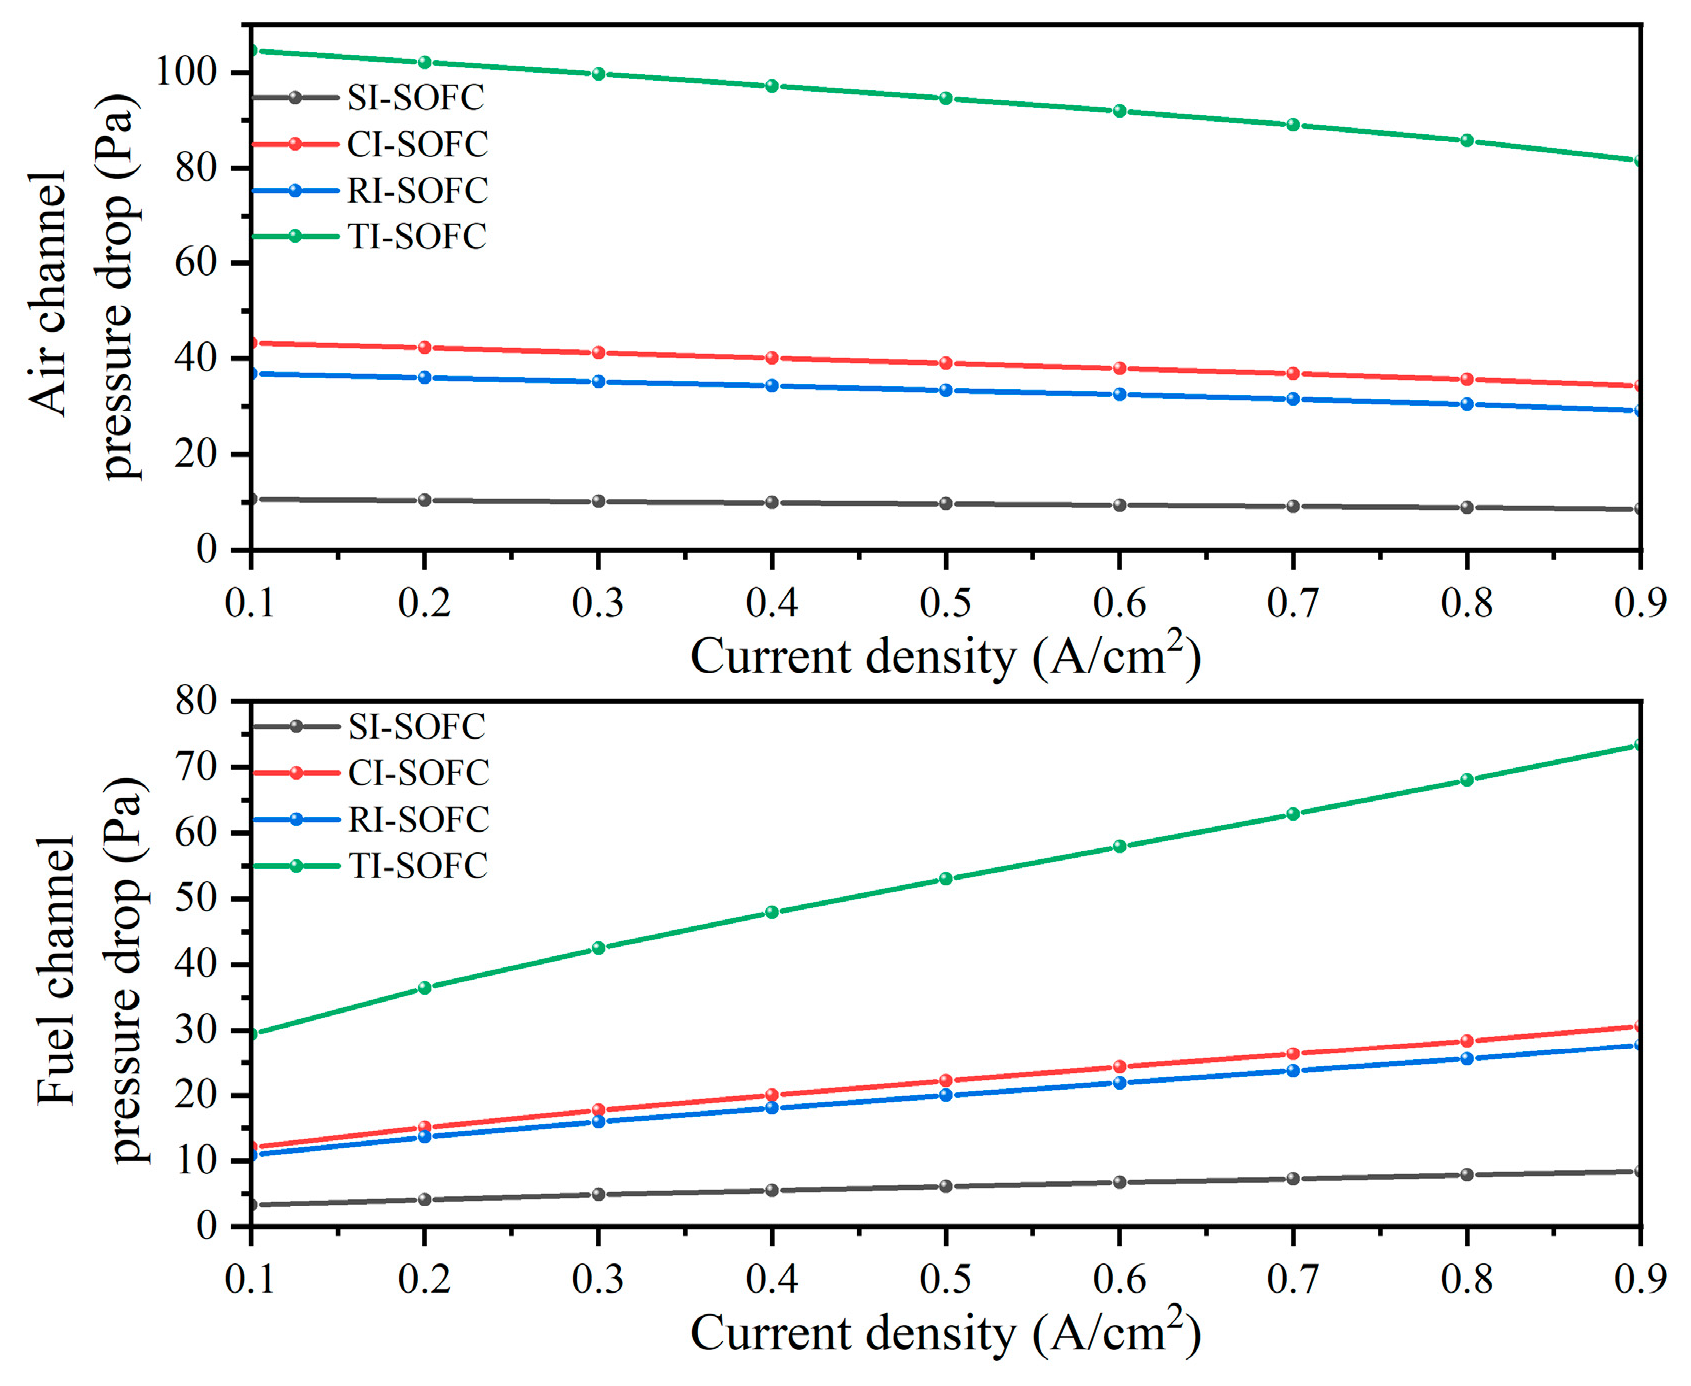
Figure 13.
Effects of anode and cathode porosity on the power density of different SOFC configurations at 0.7 V: (a) anode porosity; (b) cathode porosity.
Figure 13.
Effects of anode and cathode porosity on the power density of different SOFC configurations at 0.7 V: (a) anode porosity; (b) cathode porosity.
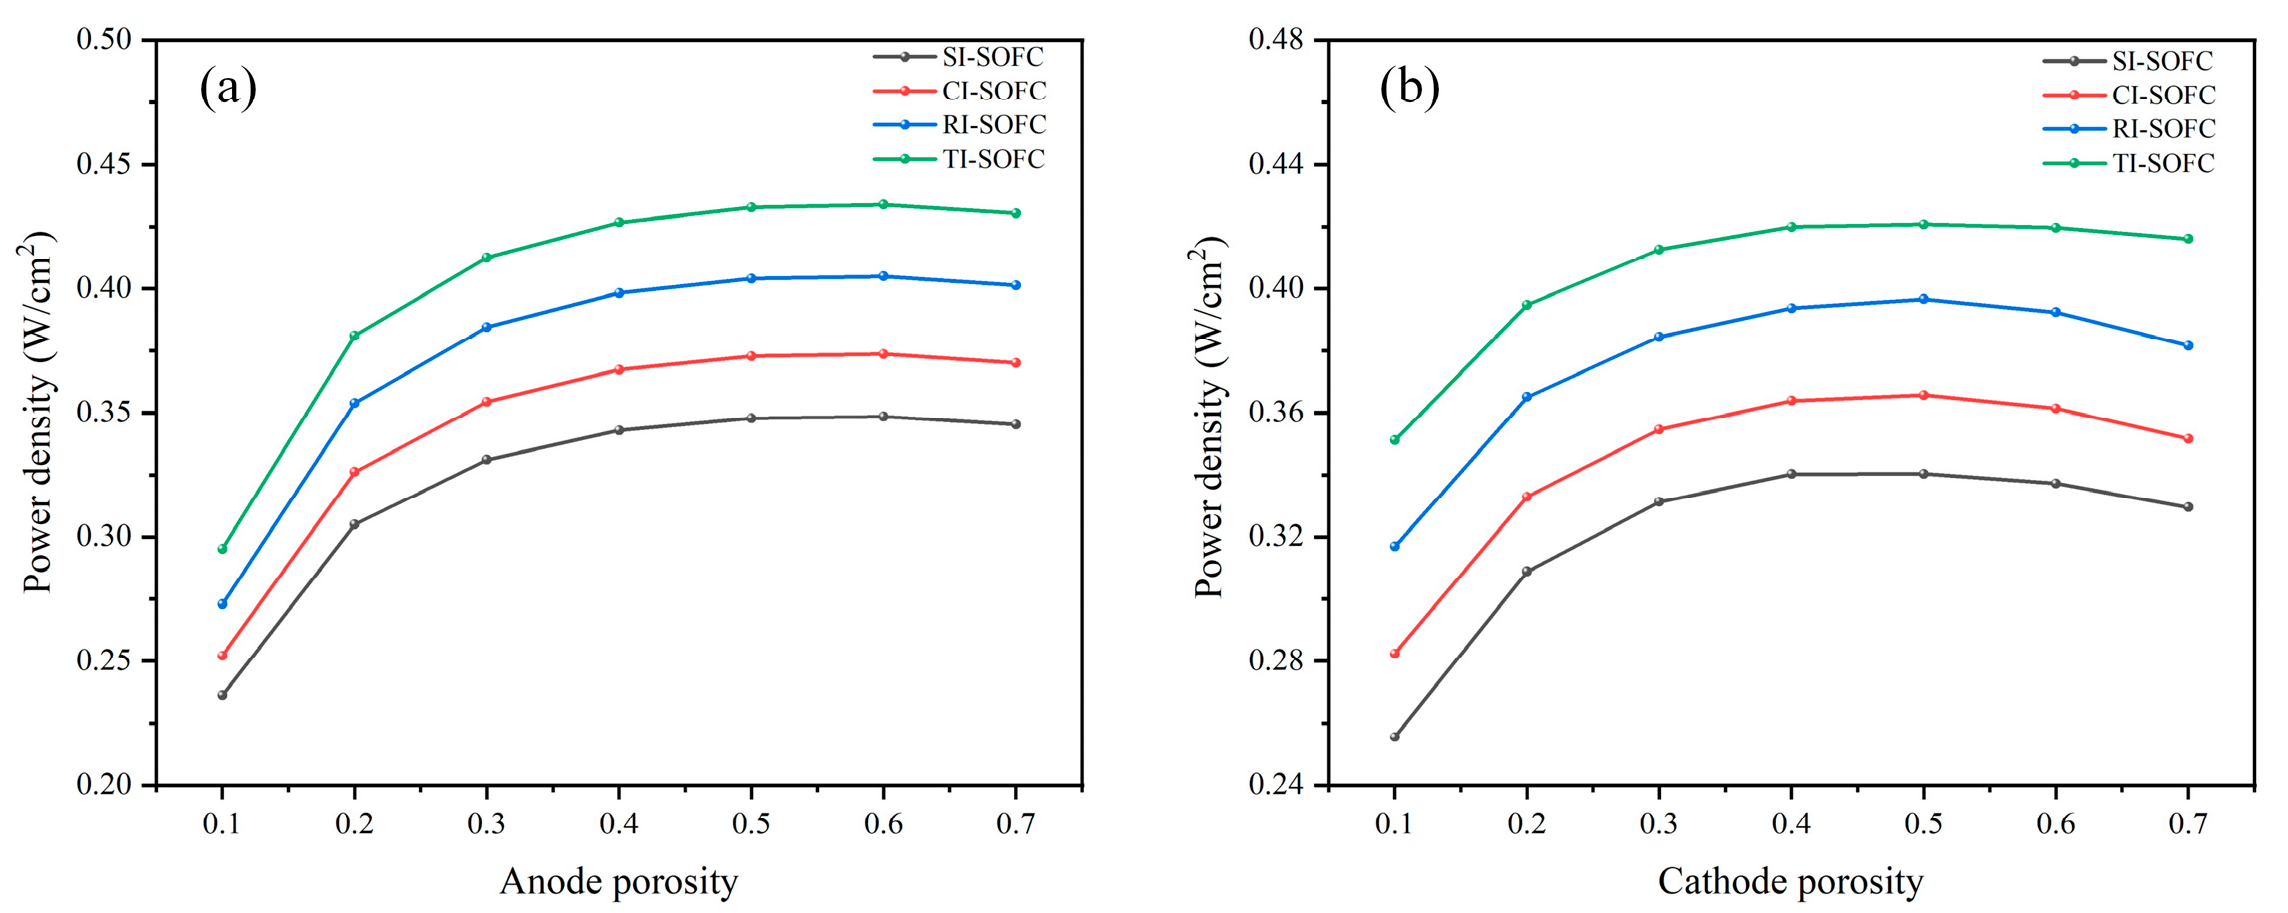
Figure 14.
Effect of operating temperature on the power density of different SOFC configurations.
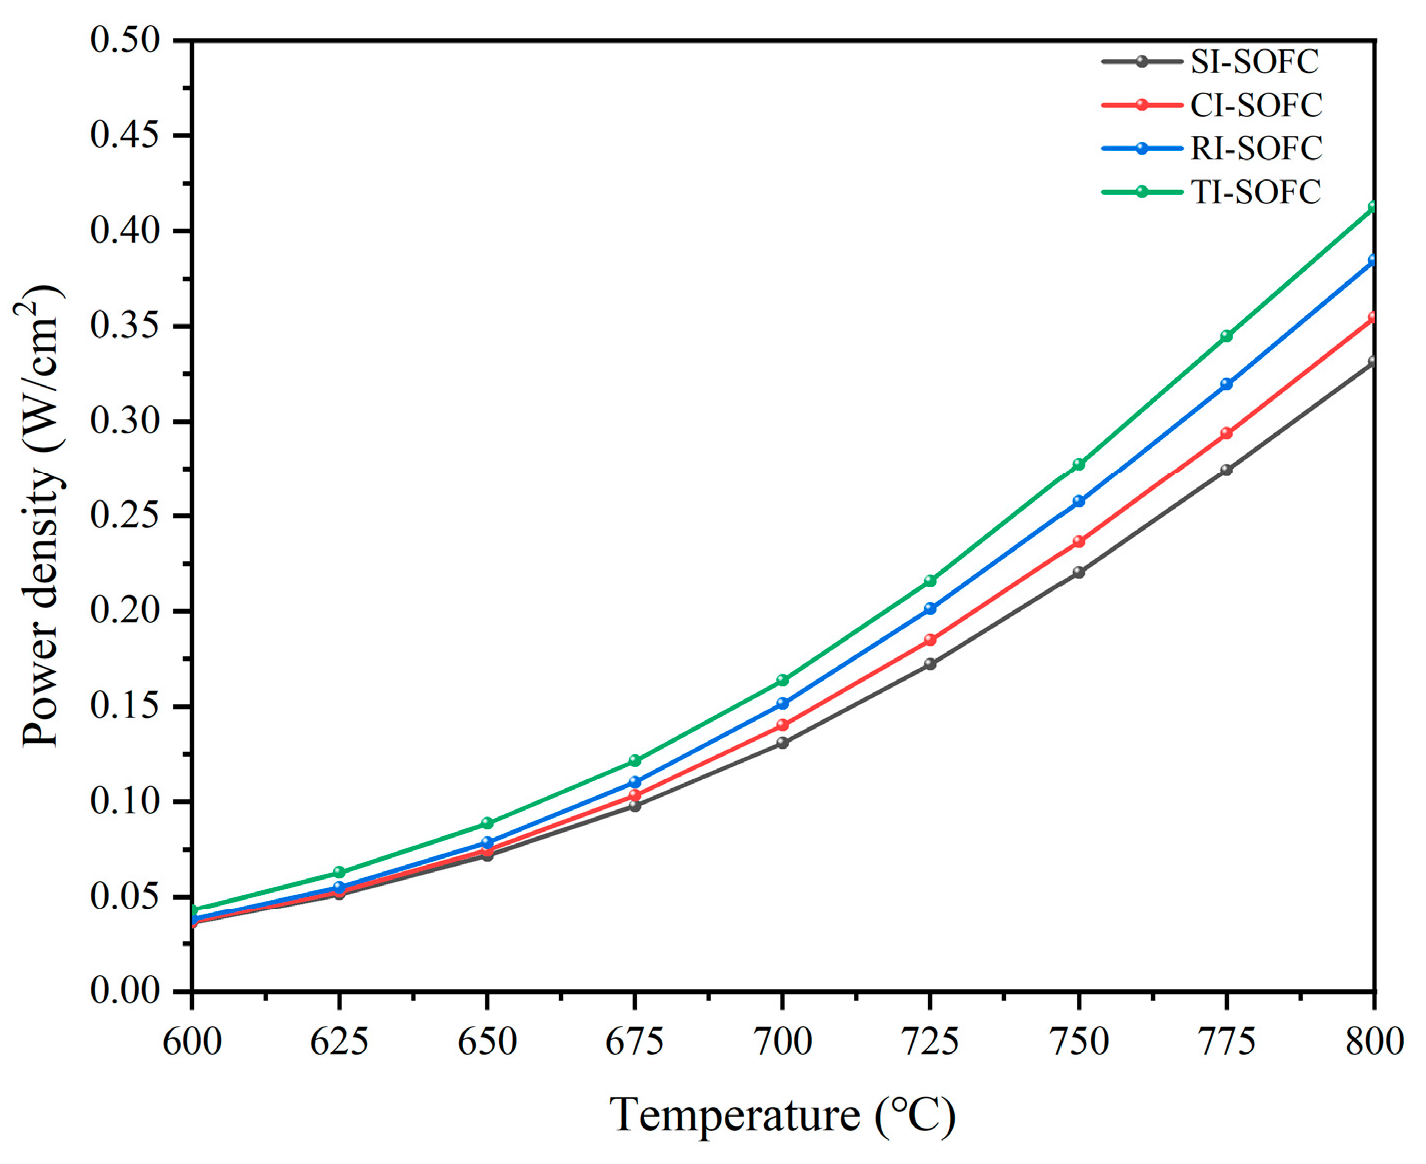

Table 1.
Geometrical parameters of the interconnectors.
| Parameters | Values (mm) |
| Channel length, Lc | 50.00 |
| Interconnector height, Hc | 2.00 |
| SI rib width, Ws | 2.00 |
| SI channel width, Wsc | 2.00 |
| CI rib width, Wc | 3.70 |
| CI channel width, Wcc | 0.78 |
| RI rib width, Wr | 3.28 |
| RI channel width, Wrc | 1.16 |
| TI rib width, Wt | 3.28 |
| TI channel width, Wtc | 0.61 |
Disclaimer/Publisher’s Note: The statements, opinions and data contained in all publications are solely those of the individual author(s) and contributor(s) and not of MDPI and/or the editor(s). MDPI and/or the editor(s) disclaim responsibility for any injury to people or property resulting from any ideas, methods, instructions or products referred to in the content. |
© 2026 by the authors. Licensee MDPI, Basel, Switzerland. This article is an open access article distributed under the terms and conditions of the Creative Commons Attribution (CC BY) license (http://creativecommons.org/licenses/by/4.0/).
Copyright: This open access article is published under a Creative Commons CC BY 4.0 license, which permit the free download, distribution, and reuse, provided that the author and preprint are cited in any reuse.


