Submitted:
18 June 2026
Posted:
19 June 2026
You are already at the latest version
Abstract
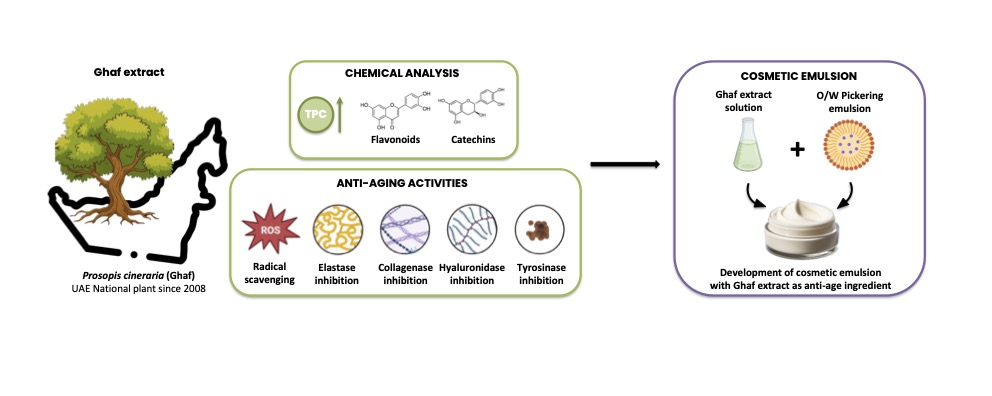
The ecological transition of the cosmetics industry emphasizes the need for sustainable formulations based on natural raw materials without compromising efficacy. Anti-aging skincare is a major cosmetic application, as skin aging can be accelerated by oxidative stress and extracellular matrix degradation mediated by enzymes. In this context, identifying natural ingredients with antioxidant and enzyme-modulating properties is of increasing interest. Prosopis cineraria (Ghaf), the national plant of the United Arab Emirates, thrives in arid environments and is hypothesised to produce bioactive secondary metabolites. Ghaf extract was evaluated for its antioxidant potential and enzyme-modulating properties relevant to skin aging. Chemical profiling (UHPLC–DAD–HRMS/MS) revealed a polyphenol-rich composition dominated by catechins and flavonoid derivatives. The extract exhibited exceptionally high radical scavenging activity in the DPPH assay, surpassing ascorbic acid under identical conditions, and showed a strong correlation with its elevated total phenolic content. In addition to antioxidant effects, Ghaf extract demonstrated biologically relevant inhibition of elastase, hyaluronidase, tyrosinase and collagenase, skin-aging–related enzymes involved in extracellular matrix degradation and pigmentation. These combined activities position Ghaf extract as a multifunctional natural ingredient for dermocosmetic applications. For this reason, we developed and evaluated a facial cream formulation as a relevant and commercially attractive delivery system for skincare applications. Further studies in cellular and ex vivo models are needed to confirm efficacy, safety, and formulation compatibility.
Keywords:
Prosopis cineraria (Ghaf)
; drought- and heat-tolerant plant
; antioxidant activity
; anti-aging
; topical cosmetic formulation
1. Introduction
The cosmetics industry has experienced sustained global growth over the past decade, driven in large part by increasing consumer interest in skin-care products. This trend is closely linked not only to physical appearance but also to well-being and self-esteem, reflecting a broader societal shift that extends across genders [1]. Furthermore, market expansion has been further reinforced by demographic changes including population aging and increased life expectancy [2], which have heightened consumer demand for effective strategies to hydrate the skin, prevent premature aging, or reduce visible signs of photoaging [3].
Parallel to these demographic and economic factors, consumer awareness of sustainability, safety, and ethical production has markedly increased. Recent market analyses estimate that the global natural cosmetics sector reached approximately USD 33 billion in 2025, and natural-ingredient formulations currently account for a substantial portion of the ‘clean beauty’ segment (32.6%), reflecting a strong consumer-driven demand for sustainably sourced products [4]. As a result, there is a growing preference for cosmetic products containing plant-based, eco-friendly ingredients and manufactured using environmentally responsible extraction processes. Green extraction approaches—such as ultrasound-assisted extraction and the use of low-toxicity solvent systems—have therefore gained considerable attention [5]. Nevertheless, botanical-derived actives still represent a relatively small fraction of the global cosmetic ingredient market, underscoring the need for further research on new plant sources with potential anti-age properties.
Skin aging is a multifactorial process characterized by the gradual appearance of fine lines, wrinkles, uneven pigmentation, loss of elasticity, and dermal thinning [6]. Intrinsic factors, such as genetics and hormonal changes, contribute to these alterations; however, extrinsic factors, including ultraviolet (UV) radiation, pollution, smoking, and diet, play a predominant role in accelerating cutaneous aging, mainly by promoting the excessive production of reactive oxygen species (ROS) [7]. Oxidative stress is therefore recognized as a key driver of skin aging, representing a primary target for preventive intervention. Although the skin comes with endogenous antioxidant defense systems, these progressively decline with age and may become insufficient to contrast ROS accumulation, thus highlighting the protective value of topical supplementation with natural antioxidants [8]. Excess ROS induce oxidative damage to lipids, proteins, and DNA, while activating signaling pathways that upregulate matrix-degrading enzymes such as collagenase and elastase [9]. Degradation of collagen and elastin disrupts the structural integrity and biomechanical properties of the extracellular matrix (ECM), ultimately leading to wrinkle formation and loss of firmness [10]. Another key component of the ECM is hyaluronic acid which contributes to wrinkle reduction and skin hydration [11]. Because it is degraded by both hyaluronidase enzymes and oxidative damage, the identification of bioactive compounds capable of inhibiting this catalytic enzyme and scavenging reactive oxygen species could be crucial for preventing skin aging [12]. Furthermore, unlike collagen, HA has a relatively short half-life in the skin, meaning that treatment efficacy can be observed earlier than for collagen-targeted interventions [13]. In addition, tyrosinase is a key regulatory enzyme in the skin. By catalyzing the initial steps of melanin synthesis within melanocytes, it plays a central role in determining skin pigmentation [11]. Although melanin is essential for photoprotection, enhancing the skin’s defense against UV radiation and other environmental or hormonal factors, excessive UV exposure leads to increased ROS generation, which can further stimulate tyrosinase activity and melanin production [14]. This ROS-driven hyperactivation of melanogenesis contributes to pigmentary disorders such as lentigo, melasma, and age-related hyperpigmentation, ultimately resulting in uneven skin tone and accentuated photoaging signs [15]. Therefore, inhibitors of tyrosinase not only help prevent excessive melanin synthesis and dark spot formation, but may also indirectly attenuate oxidative stress by limiting ROS-associated melanogenic pathways. Consequently, given the central role of oxidative stress as a triggering factor for multiple aging-related cascades, there is a growing demand for cosmetic actives with strong antioxidant properties capable of counteracting ROS overproduction and, often correlated, exhibiting anti-collagenase, anti-elastase, anti-hyaluronidase, and skin-brightening activities [16].
According to these current socio-demographic trends and the growing demand for sustainable production models, plant biodiversity represents a vast and largely untapped reservoir of bioactive compounds with potential applications in skin care and anti-aging cosmetics, as capable of targeting multiple molecular pathways involved in skin aging [5]. Plants adapted to harsh environments — such as deserts, semi-arid zones, and other extreme ecosystems — often produce unique secondary metabolites that help survival under oxidative, drought, or heat stress [17]. These compounds can exhibit antioxidant [18], anti-inflammatory, and extra cellular matrix-protective activities [19], making them particularly attractive for dermo-cosmetic formulation.
Within this context, the native flora of the United Arab Emirates (UAE) offers especially interesting opportunities. The UAE hosts a set of resilient, drought-adapted species that have evolved to withstand extreme aridity, salinity, and high temperatures [20]. Such ecological pressures often drive the accumulation of protective phytochemicals, potentially exploitable for skin care. Moreover, there is growing local interest in valorizing indigenous plants both for their ecological importance and as sustainable sources of natural ingredients [21].
Among these native species, Prosopis cineraria, commonly known as Ghaf, stands out as a culturally and ecologically emblematic tree. Declared the national tree of the UAE in 2008, Ghaf plays a central role in desert ecology, soil stabilization, and biodiversity preservation [22]. Traditional medicine and ethnobotanical records attribute to Ghaf a variety of therapeutic uses including anti-inflammatory, antimicrobial, and general wellness applications based on preparations derived from bark, leaves, pods, and other tissues [23]. Recent works of Ghaf’s pharmacological potential highlight its richness in flavonoids, phenolic acids, tannins, and other bioactive constituents known for antioxidant, hepatoprotective [24], and antimicrobial properties [25].
Despite this promising background, the use of Ghaf in cosmetic science remains underexplored. Few studies have addressed its phytochemical composition in detail [26], and even fewer have evaluated its potential for skin-related applications such as oxidative stress mitigation, inhibition of extracellular matrix–degrading enzymes, or formulation into stable topical systems [27].
In light of these considerations, the present study aims to explore the use of Ghaf extract as a multifunctional cosmetic ingredient. A comprehensive evaluation including (i) the characterization of its chemical profile; (ii) the assessment of antioxidant capacity and enzyme-inhibitory activity related to skin aging; and (iii) the development of a prototype topical formulation incorporating the extract, with physicochemical and stability assessment was conducted. This work seeks to bridge ethnobotanical knowledge, desert biodiversity, and modern cosmetic science, demonstrating that native plants like Ghaf can provide sustainable, efficacious solutions for skin health and anti-aging needs.
2. Materials and Methods
2.1. Chemicals and Materials
2,2-Diphenyl-1-picrylhydrazyl (DPPH), (±)-6-Hydroxy-2,5,7,8-tetramethylchromane-2-carboxylic acid (Trolox), ascorbic acid, elastase from porcine pancreas (Type IV), N-Methoxysuccinyl-Ala-Ala-Pro-Val p-nitroanilide (MAAPVN), Trizma®base, oleanolic acid, N,N-Dimethylformamide (DMF) anydrous, Folin & Ciocalteu′s phenol reagent, 3,4,5- Trihydroxybenzoic acid (gallic acid), sodium carbonate, collagenase from Clostridium histolyticum Sigma Blend Type H, N-[3-(2 Furyl)acryloyl]-Leu-Gly-Pro-Ala (FALGPA), tricine, calcium chloride dihydrate, sodium chloride, epigallocatechin gallate (ECGC), hyaluronidase type I-S, hyaluronic acid sodium salt from rooster comb, albumin from bovin serum (BSA), sodium phosphate monobasic, sodium phosphate dibasic, sodium acetate anhydrous, acetic acid, phosphate buffered saline (PBS), kojic acid, dimethyl sulfoxide (DMSO), 3,4-Dihydroxy-L-phenylalanine (L-DOPA), potassium sorbate, citric acid/sodium hydroxide/hydrogen chloride (buffer solutions for pH calibration curve), Sodium Dodecyl Sulfate (SDS) were all purchased from Sigma-Aldrich (St. Louis, MO, USA). Ultrapure water (18 MΩ) was prepared by a Milli-Q purification system (Millipore, Bedford, MA, USA), while ethanol and methanol were purchased from CARLO ERBA Reagents s.r.l. (Milan, Italy). Acetonitrile and formic acid were purchased from Romil Chemicals (Cambridge, UK). High-glucose Dulbecco’s Modified Eagle Medium (DMEM) with and without L-glutamine, fetal bovine serum (FBS), 1% penicillin–streptomycin (P/S), L-glutamine, 96-well and 48-well plates were purchased from EuroClone (Pero, Italy). Sunflower oil (commercial food grade Fruit d’Or) was acquired from a local retail market (Orléans, France) and used without further purification, whereas plum oil and glycerin were acquired from AromaZone (Paris, France) and VIVAPUR® CS TEX EASY was kindly provided JRS Retteinmaier (Rosenberg, Germany).
2.2. Plant Material
Samples of different portions of Prosopis cineraria, including twigs, roots, leaves, and bark were harvested in September 2022 from multiple individuals in the United Arab Emirates. Flower and fruits were not collected, as these tissues were not available at the time of sampling. Each type of plant material was pooled by type and immediately freeze-dried after collection. The dried samples were homogenized using a Grindomix GM 200 knife mill (Retsch, Haan, Germany), and sieved (300–600 μm; Retsch AS 200) to obtain powders with uniform particle size distribution.
However, a unified extraction approach was adopted to streamline the workflow and support future scale-up. Accordingly, after lyophilization, mechanical homogenization, and maceration of each plant component, the powders were combined into a single matrix representative of the whole plant. A final mass of 1 g was prepared (Table 1) by mixing the individual fractions in proportions reflecting their relative abundance in the sampled plant material (based on the dry weight obtained for each part). This whole-plant matrix was subsequently used for all extraction procedures reported in this study.
2.3. Sample Preparation and Extraction
The whole-Ghaf plant matrix (comprehensive of twigs, roots, leaves, and bark) thus obtained was subjected to ultrasound-assisted extraction using an ElmaSonic S 30H ultrasonic bath (Elma Schmidbauer GmbH, Singen, Germany). A 50% aqueous ethanol solution (v/v) was selected as extraction solvent due to its balanced polarity and established suitability for recovering a wide spectrum of bioactive metabolites, including phenolics (which are well known for their antioxidant properties) [28,29], while maintaining low toxicity for subsequent biological assays [30,31]. For the extraction, 1 g of plant powder was mixed with 40 mL of solvent (solid-to-solvent ratio 1:40, w/v) in a 50-mL polypropylene tube, which is commonly applied in metabolite profiling studies [32]. Ultrasonic extraction was performed at 25 °C for 15 min. To ensure exhaustive recovery of soluble compounds, the process was repeated several times with fresh solvent until colorless supernatant was obtained. After each cycle, the sample was centrifuged at 3112 × g for 5 min using a ROTINA 380R centrifuge (Hettich Zentrifugen, Germany), and the resulting supernatant was clarified by filtration through Whatman No. 1 filter paper (pore size 7–12 µm). The combined filtrates were then concentrated under reduced pressure at 40 °C using a Hei-VAP Core rotary evaporator (Heidolph, Germany) to remove ethanol. The aqueous residue was reconstituted in Milli-Q water and subjected to a second clarification step by centrifugation at 2375 × g for 10 min to isolate the water-soluble fraction. The resulting supernatant was subsequently lyophilized using an Alpha 1-4 LSCplus freeze dryer (Christ, Germany) to obtain dry extract for further characterization. Extraction yield was calculated as the percentage ratio between the weight of the dried extract and the initial dry mass of plant material.
2.4. Characterization of Extract
The chemical characterization of extract was performed in negative mode using a Thermo Scientific Vanquish UPLC system coupled with an Orbitrap Exploris 120 mass spectrometer (Thermo Scientific, Waltham, Massachusetts, USA). The compounds were separated using a 100 × 2.1 mm, 2.6 μm biphenyl column (Phenomenex, Torrance, California, USA). The mobile phase consisted of 0.1% (v/v) formic acid in water (A) and 0.1% (v/v) formic acid in acetonitrile (B) at a flow rate of 0.4 mL min−1. The following gradient was used: 5% B (0-1 min), 5-30% B (1-7 min), 30-60% B (7-15 min), 60% B (15-18 min), 60-95% B (18-28 min) with 5 minutes of washing (95% B) and 5 minutes of equilibration (5% B) after each run. The injection volume was 5 μL for each analysis and the column was set to 30 °C. For positive ion mode, the spray voltage was set to 3400 V, while for negative ion mode it was set to −2500 V. The flow rates of the sheet gas and the auxiliary gas were set to 40 and 10 arb, respectively. The flow rate of the sweep gas was set to 2 arb. The ion transfer temperature was set to 325 °C and the vaporizer temperature to 350 °C. The full scan resolution was set to 60,000 with a scan range of m/z 100–1200 and the ddMS2 resolution to 45,000. The dynamic exclusion duration was set to 8 seconds, with an intensity threshold of 4 × 10⁵, and the collision energy was normalized to 30%. Metabolite identification followed the Metabolomics Standards Initiative (MSI) guidelines, which define three confidence levels indicated in the “IL” column of Table 4: Level 1 (IL1): compounds were unequivocally identified by comparison with authentic reference standards (retention time, MS/MS spectrum, and exact mass); Level 2 (IL2): tentative identifications were assigned based on matches between experimental MS/MS spectra and literature data or spectral libraries (e.g., GNPS, MassBank); Level 3 (IL3): compounds were classified by spectral similarity to known chemical families and supported by taxonomic evidence. Level 4 (IL4): unknown compounds.
2.5. Antioxidant Capacity and Phytochemical Content
2.5.1. DPPH Radical Scavenging Assay
The antioxidant capacity (AOC) of the Ghaf extract was quantified using the 1,1-diphenyl-2-picrylhydrazyl (DPPH•) radical scavenging assay, following the method described by Cerri et al. [33] with minor modifications. The extract was dissolved in ultrapure water and tested over a concentration range of 1.25–20 µg/mL, while Trolox (0–75 μM) was used as calibration standard starting from a 5 mM stock solution in methanol, subsequently diluted to generate working standards. Ascorbic acid solution in ultrapure water was included as a positive control. A fresh 150 µM DPPH• solution was prepared in ethanol immediately before each experiment and protected from light due to the reagent’s photosensitivity. All reactions were carried out in 96-well plates. For each measurement, 10 µL of sample, Trolox standard, or ultrapure water (blank) were added to 190 µL of the operative DPPH solution, reaching a final reaction volume of 200 µL. Plates were then incubated for 30 min at room temperature, under gentle orbital shaking (70 rpm) and protected from light. After incubation, absorbance was recorded at 517 nm using EnSight Multimode Microplate Reader (PerkinElmer, Waltham, MA,USA).
DPPH scavenging activity (%) was calculated after blank correction using the following equation:
The antioxidant activity of the Ghaf extract was then converted into Trolox Equivalent Antioxidant Capacity (TEAC), by interpolating the scavenging activity of sample on the Trolox standard curve according to the following equation:
2.5.2. Total Phenolic Content (TPC)
The total phenolic content of the Ghaf extract was quantified using the Folin–Ciocalteu method described by Dewanto et al. [34] in 48-well microplate-adapted, with minor modifications. The extract was solubilized in 80% methanol with sonication, and 62.5 µL of the resulting solution were added to each well, together with 250 µL of ultrapure water, yielding final extract concentrations ranging from 7.8 to 62.5 µg/mL. Wells containing water instead of extract served as negative controls. Subsequently, 62.5 µL of Folin–Ciocalteu reagent (2 N) were added, and the mixture was incubated for 5 min at room temperature. Then, 62.5 µL of 7% (w/v) sodium carbonate were added to initiate color development. Plates were incubated 90 min at room temperature in the dark, after which absorbance was measured at 760 nm using a microplate reader. A standard calibration curve was generated using gallic acid dissolved in 80% methanol at final concentrations of 0.24, 0.49, 0.98, 1.95, 3.91, 7.81, and 15.63 µg/mL, yielding the equation:
Total phenol content was expressed as micrograms of gallic acid equivalents per milligram of extract (μg GAE/mg). Values are expressed as mean ± standard deviation of two independent experiments, each in technical triplicate. The assay relies on the reduction of the Folin–Ciocalteu reagent by phenolic compounds under alkaline conditions, producing a blue molybdenum–tungsten complex quantifiable spectrophotometrically.
2.6. In Vitro Enzymatic Inhibition Assays
2.6.1. Elastase Inhibition Assay
The inhibitory activity of the Ghaf extract against elastase (a serine protease involved in the degradation of elastin, a key component of the extracellular matrix) was evaluated using a spectrophotometric assay adapted from Wittenauer et al. [35], with minor modifications. The method is based on the ability of pancreatic porcine elastase to hydrolyze the synthetic chromogenic substrate N-Methoxysuccinyl-Ala-Ala-Pro-Val p-nitroanilide (MAAPVN), releasing p-nitroaniline (pNA), which can be quantified by measuring absorbance at 410 nm. A stock solution of MAAPVN (25 mg/mL) was prepared in dimethylformamide (DMF) and subsequently diluted in Tris-HCl buffer (50 mM, pH 8.0) to obtain the working substrate solution (1.328 mg/mL). Porcine pancreatic elastase was prepared at a concentration of 0.375 U/mL in the same buffer.
Assays were performed in 96-well microplates by mixing 10 µL of Ghaf extract aqueous solution with 20 µL of enzyme solution and 120 µL of buffer, resulting in final extract concentrations ranging from 12.5 to 400 µg/mL. The mixture was pre-incubated for 15 min at room temperature to allow interaction between the enzyme and the extract. Subsequently, 50 µL of the working substrate solution were added to initiate the reaction. After 15 min, absorbance at 410 nm was recorded using a microplate reader.
Elastase activity (%) was calculated by comparing the absorbance of extract-treated wells with that of enzyme controls (without inhibitor). Oleanolic acid (OA) was included as a positive control.
2.6.2. Collagenase Inhibition Assay
The inhibitory activity of the Ghaf extract against collagenase was assessed using a microplate-based assay adapted from Widowati et al. [36] procedures, with minor modifications. The assay quantifies the ability of the extract to inhibit Clostridium histolyticum collagenase (ChC), which catalyzes the cleavage of the synthetic peptide N-[3-(2-furyl)acryloyl]-Leu-Gly-Pro-Ala (FALGPA). Hydrolysis of FALGPA results in a decrease in absorbance at 335 nm, enabling spectrophotometric monitoring of residual non-cleaved substrate. In a 96-well microplate, 30 μL of Ghaf extract aqueous solutions at concentrations ranging from 0.05 to 1.08 mg/mL were mixed with 20 μL of FALGPA 2mM, previously diluted in methanol from a 4.1971 mM stock, in 60 µL of assay buffer (50 mM tricine, 10 mM CaCl2, 400 mM NaCl, pH 7.5). The plate was immediately placed in the microplate reader pre-equilibrated at 37 °C, and the absorbance at 335 nm was recorded to determine the value corresponding to 0% activity (substrate in the absence of enzyme). Collagenase was then added by dispensing 10 µL of enzyme solution (1 U/mL in cold water, freshly prepared immediately before use) into each well. Following a 20 min incubation at 37 °C, the absorbance at 335 nm was measured again. Collagenase activity (%) was calculated by comparing the decrease in absorbance in extract-treated wells with that observed in enzyme-only control wells. Epigallocatechin gallate (EGCG) was used as positive control.
2.6.3. Hyaluronidase Inhibition Assay
The inhibitory effect of the Ghaf extract on hyaluronidase activity was evaluated using a turbidimetric assay adapted from Tu and Tawata [37], with minor modifications. Hyaluronidase catalyzes the hydrolytic degradation of hyaluronic acid (HA), a key glycosaminoglycan responsible for maintaining skin hydration, viscoelasticity, and structural integrity. In this assay, the remaining non-degraded HA reacts with an acidic bovine serum albumin (BSA) solution to form an insoluble precipitate whose turbidity is proportional to the amount of intact HA and can be quantified at 600 nm. Ghaf aqueous extract solutions (5 µL) were added to wells of a 48-well microplate and incubated with 100 µL of hyaluronidase type I-S (15 U/mL prepared in 20 mM sodium phosphate buffer containing 77 mM NaCl and 0.01% BSA, pH 7.0). The mixture was pre-incubated at 37 °C for 10 min to test final extract concentrations ranging from 3.7 to 66 µg/mL. Subsequently, 100 µL of HA substrate solution (0.03% w/v dissolved in 300 mM sodium phosphate buffer, pH 5.35) were added to each well, followed by a 45 min incubation at 37 °C. The reaction was terminated by adding 1 mL of acid albumin reagent (0.1% BSA, 24 mM sodium acetate, 79 mM acetic acid, pH 3.75). After a further 10 min incubation at RT, turbidity was measured at 600 nm using a spectrophotometric microplate reader. Increased absorbance reflects higher levels of remaining HA and therefore higher inhibition of hyaluronidase activity. Hyaluronidase activity (%) was calculated by comparing sample turbidity with that of the control conditions, where 0% activity corresponds to the turbidity of HA incubated in the absence of enzyme, and 100% activity corresponds to HA fully hydrolyzed by the enzyme (untreated condition). Oleanolic acid was used as positive control.
2.6.4. Human Tyrosinase Inhibition Assay
Lyophilized Ghaf extract was dissolved in PBS and serially diluted to obtain concentrations ranging from 400 µg/mL to 0 µg/mL. Kojic acid (1.4 mg/mL to 0 mg/mL) was used as a positive control. Then, 20 µL of each Ghaf extract dilution (in PBS) and positive control (in DMSO) were dispensed in triplicate into a 96-well plate. The MNT-1 human melanoma cell line (highly pigmented) was lysed with PBS containing 0.1% Triton X-100. Subsequently, 90 µL of the MNT-1 lysate, diluted to 5 × 10⁵ cells/mL in PBS, was added to each well. For blank controls (no-enzyme condition), 90 µL of PBS was added instead of lysate. Finally, 100 µL of L-DOPA substrate solution (4 mM in PBS) was added to each well. Absorbance was recorded in kinetic mode every 30 min for 18h at 478 nm (DOPAchrome formation) and 600 nm (eumelanin formation) by using Multiskan SkyHigh Microplate Spectrophotometer (ThermoFischerScientific, MA,USA). Enzyme activity was expressed as the percentage slope normalized to the untreated condition (no extract or positive control).
2.7. Cell Viability Assay
2.7.1. Cell Lines and Culture Conditions
The immortalized human keratinocyte cell line HaCaT was purchased from AddexBio Technologies (San Diego, CA, USA), and the highly pigmented human melanoma cell line MNT-1 was kindly provided by AgroParisTech, Chaire de Cosmétologie (Orléans, France). HaCaT cells were cultured in high-glucose Dulbecco’s Modified Eagle Medium (DMEM, ECB7501, Euroclone, Pero, Italy) supplemented with 10% heat-inactivated fetal bovine serum (FBS), 1% penicillin–streptomycin (P/S), and 2 mM L-glutamine. MNT-1 cells were maintained under the same conditions using DMEM (Gibco, 42430-025), which contains L-glutamine as supplied by the manufacturer. All cell lines were grown at 37 °C in a humidified incubator with 5% CO2 and 95% air.
2.7.2. Viability Assay
The cytotoxicity of Ghaf extract was investigated using the in vitro colorimetric MTS assay (CellTiter 96® AQueous One Solution Cell Proliferation Assay, Promega, Madison, WI, USA) on an immortalized human keratinocyte cell line (HaCaT) following the manufacturer’s protocol. This assay detects the mitochondrial cell activity, measuring the conversion of MTS by NADPH and NADH produced by dehydrogenase enzymes in soluble formazan product, whose absorbance can be recorded at 490 nm. Briefly, 5x10³ cells in 100 μL of growth medium were seeded in a 96-well microplate. After an incubation of 24 hours at 37 °C in 5% CO2, the medium was removed and cells were treated with 9 extracts concentrations (0, 25, 50, 100, 140, 200, 270, 350 and 400 µg/mL). After 48 hours of incubation, the treated medium was replaced and 20 μL of MTS solution were added. After 2 hours at 37 °C in 5% CO2, formazan product was detected by using a microplate reader at 490 nm. Cell viability was expressed as a mean percentage compared with the untreated cells and medium with MilliQ water at the same concentration (10% v/v) of extract-treated wells was used as blank.
2.8. Statistical Analysis
Statistical analyses were conducted using one-way analysis of variance (ANOVA) followed by Tukey’s honest significant difference (HSD) post hoc test. Data are presented as mean values ± standard deviation (SD). All tests assumed normal distribution and the statistical significance was considered when p < 0.05. Statistical analyses were performed by using GraphPad Prism (version 10.4.1).
2.9. Development and Characterization of Cosmetic Emulsion
2.9.1. Cream Formulation
Oil-in-water (O/W) cream emulsions (semisolid formulations) were formulated. A combination of vegetable oils (sunflower oil and plum oil) was employed as the dispersed phase (oil phase). VIVAPUR® CS TEX EASY (Pickering stabilizer) was pre-activated in water at 2000 rpm by using Hei-TORQUE Core mechanical stirrer (Heidolf, Schwabach, Germany). After a resting period of 15 minutes, the aqueous phase was completed by adding glycerin as humectant and potassium sorbate as preservative. The aqueous phase was then gradually added to the oil phase, and emulsification was performed for 3 minutes at 10,000 rpm using the high-shear homogenizer POLYTRON® PT 10-35GT (Kinematica, AG, Switzerland).
2.9.2. Base Emulsion (BE) Composition
The base emulsion was prepared following the procedure described in Cream formulations (section 2.9.1), with the composition % (w/w) summarized in Table 2.
2.9.3. Ghaf Extract Formulation
A formulation study was conducted to evaluate the physicochemical stability of the selected base emulsion containing the aqueous Ghaf extract obtained from hydroalcoholic extraction (50% EtOH/water). An aqueous solution of Ghaf extract was prepared at a concentration of 2 mg/mL and used as active ingredient. The extract solution was incorporated into the aqueous phase at inclusion levels of 3%, 5%, and 10% (w/w), corresponding to final extract concentrations in the formulation of 60, 100, and 200 μg/mL, respectively (Table 3) prior to emulsification with the oil phase.
2.9.4. Cream Characterization
Each formulation was characterized in terms of organoleptic properties, phase stability, rheological behavior, droplet size distribution analysis, pH, and accelerated stability.
2.9.4.1. Organoleptic Characteristics
Formulations were visually inspected to assess their appearance, odor, and color. The evaluation was carried out under standardized conditions (fixed light, location, and black background). The odor was assessed by direct smelling, and the color was recorded for each sample.
2.9.4.2. pH Determination
The pH of each formulation was measured after 24h of preparation at RT using a pH meter 1100L (VWR Phenomenal, Germany) calibrated with standard buffers at pH 4.0, 7.0, and 9.0. The electrode probe was directly immersed in the emulsion.
2.9.4.3. Centrifugation (Accelerated Stability) Test
Accelerated stability was assessed by transferring ~10 g of emulsion into Falcon tubes and centrifuging at 4000 rpm for 30 minutes at 25 °C. Phase separation or the appearance of distinct layers was evaluated visually after centrifugation.
2.9.4.4. Rheological Behavior
Rheological properties were studied using a Discovery HR-10 rheometer (TA Instruments, DE, USA) by placing the cream between a 40 mm diameter sandblasted plate. Two types of measurements were performed at 25 °C: flow sweep analysis by setting shear rate ranging from 0.01 to 1000 s−1 to measure the viscosity profile and strain sweep oscillatory test performed at a fixed frequency of 1 Hz, with strain ranging from 0.01% to 1000% to investigate linear viscoelastic region (LVR) limits. For both analyses, samples were allowed to equilibrate for 3 minutes prior to measurement.
2.9.4.5. Droplet Size Distribution Analysis
Droplet size distribution was measured using a SALD-2300 laser diffraction granulometer equipped with the SALD-MS23 Flow Cell with Sampler mode (Shimadzu, Japan). For each test, 2 g of emulsion were dispersed in either 18 g of water or 1% (w/v) SDS solution under magnetic stirring at room temperature for ~30 minutes until homogeneous dispersion was achieved. The suspension was then introduced dropwise into the flow cell. Measurements were conducted using the Fraunhofer optical model, suitable for micron-sized samples with unknown refractive indices (set to 3.00 – 0.20i). Each sample was analyzed in triplicate, at a light intensity corresponding to an absorbance of ~0.07. The software returned normalized droplet size distributions (µm), along with mean, mode, median, standard deviation, and D10–D50–D90 percentiles.
3. Results
3.1. Plant Extraction
To obtain a phytochemically representative extract reflecting the intrinsic metabolic diversity of Ghaf, the different anatomical parts of the plant (leaves, bark, roots, and twigs) were first collected and then pooled prior to extraction. This strategy was deliberately adopted to capture the complementary and potentially synergistic contribution of the distinct plant compartments. Moreover, pooling the plant fractions allowed to streamline the experimental workflow and supports future scale-up toward industrially relevant processes, while simultaneously ensuring a more sustainable and value-added use of the entire plant biomass rather than selectively exploiting individual tissues. From a translational perspective, the use of a whole-plant approach is expected to contribute to a broader functional profile and enhanced robustness of the resulting phytocomplex compared to tissue-specific extracts.
To cover the widest possible polarity range and thus maximize the recovery of diverse classes of metabolites, the whole-Ghaf plant powder was extracted exclusively using a hydroalcoholic solvent system (water–ethanol). The pooled extraction efficiency yields, expressed as % w/w of lyophilized extract relative to the dry weight of the initial plant material, was 25% ± 0.8 and highly reproducible across seven independent replicates. The violin plot (Figure 1) displays a narrow distribution with a symmetric profile, indicative of excellent process robustness and consistent phytochemical recovery. The resulting pooled hydroalcoholic extract—hereafter referred to as Ghaf extract—was used for all subsequent biochemical, cellular, and formulation studies.
3.2. Characterization of Ghaf Extract
The metabolite profile of Ghaf extract was analysed by UHPLC–DAD–HRMS/MS. The chromatographic profile of the extract is reported in Figure 2 and the compounds tentatively identified are shown in Table 4, with their corresponding identification level (IL), which reflects the confidence of compound annotation based on MSI guidelines (see Section 2.4). For compounds assigned to IL2, the identification relied on comparisons of MS/MS fragmentation data with published spectra from the literature or spectral databases included directly in the table.

Table 4.
HPLC-HRMS data of compounds detected in Ghaf extract.
| N° | RT (min) | [M−H]− | Formula | Error (ppm) | Diagnostic products ion (m/z) | Name | Class | IL | Ref. |
|---|---|---|---|---|---|---|---|---|---|
| 1 | 0.56 | 209.0305 | C6H10O8 | 1.40 | 115.0039, 89.0246, 85.0297, 71.0140 | Galactaric acidb | Dicarboxylic Acid | 4 | [38] |
| 2 | 0.85 | 191.0216 | C6H8O7 | 2.24 | 111.0089, 87.0089, 85.0296, | Citric acid | Tricarboxylic acids | 2 | [39] |
| 3 | 1.33 | 169.0145 | C7H6O5 | 1.47 | 125.0247, 97.0297, 81.0343, 79.0192, 69.0347 | Gallic acid | Phenolic acids and derivatives | 1 | std* |
| 4 | 2.82 | 305.0650 | C15H14O7 | -3.6 | 179.0334, 167.0376, 139.0372, 137.0254,125.0244, 109.0281 | (Epi)gallocatechin | Catechins | 2 | [40] |
| 5 | 6.12 | 451.2191 | - | - | 405.2136, 389.1100, 287.0162, 179.0567, 161.0463 | Unknown | - | 4 | - |
| 6 | 7.67 | 325.0936 | C15H18O8 | 2.49 | 163.0405, 119.0505 | Cumaric acid O-glucoside | Hydroxycinnamic acid derivative | 2 | [41] |
| 7 | 8.33 | 289.0724 | C15H14O6 | 2.16 | 245.0825, 221.0826, 205.0511, 203.0719, 161.0611, 151.0389, 125.0245, 123.0454, 109.0297, 97.0296 | (Epi)catechin | Catechins | 1 | std* |
| 8 | 8.72 | 457.0773 | C22H18O11 | 0.44 | 305.0654, 169.0128, 125.0230 | (Epi)gallocatechin gallate | Catechins | 2 | [42] |
| 9 | 8.90 | 431.1928a | C19H30O8 | 1.92 | 385.1875, 223.1343, 205.1241, 153,0926 | Drovomifoliol-O-glucoside (roseoside) | Sesquiterpenoid glycoside | 2 | [41] |
| 10 | 9.01 | 197.0459 | C9H10O5 | 2.70 | 169.0148, 125.0247, 124.0169 | Ethyl gallate | Ellagitannins | 2 | [43] |
| 11 | 9.21 | 557.2253 | C26H38O13 | 3.23 | - | Unknown | - | 4 | - |
| 12 | 9.41 | 163.0405 | C9H8O3 | 3.18 | 119.0505 | p-cumaric acid | Hydroxycinnamic acids | 2 | [44] |
| 13 | 10.50 | 479.0841 | C21H20O13 | 1.38 | 316.0230, 271.0252 | myricetin 3-O-beta-D-galactopyranoside | Flavonoid-glycosides | 2 | [45] |
| 14 | 11.26 | 463.0891 | C21H20O12 | 1.71 | 316.0232, 271.0256, 179.0565 | Myricitrin | Flavonoid-glycosides | 2 | [46] |
| 15 | 11.65 | 577.1574 | C27H30O14 | 2.77 | 457.1149, 413.0885, 293.0463 | 2”-O-rhamnosylvitexin | Flavonoid-glycosides | 2 | [42] |
| 16 | 11.68 | 609.1479 | C27H30O16 | 2.72 | 300.0282 | Rutin | Flavonoid-glycosides | 1 | std* |
| 17 | 11.80 | 463.0889 | C21H20O12 | 1.65 | 301.0335, 300.0256 | Quercetin-3-O-galactoside (hyperoside) | Flavonoid-glycosides | 2 | [45] |
| 18 | 12.15 | 493.0998 | C22H22O13 | 2.15 | 330.0389, 315.0155 | Patuletin-7-O-glucoside | Flavonoid-glycosides | 2 | [45] |
| 19 | 12.53 | 567.2099 | C27H36O13 | 3.52 | 457.1146, 383,0775, 353,0668, 341,0668, 293,0461 | Dimethoxylflavanone derivate | Flavonoid derivates | 3 | [47] |
| 20 | 13.31 | 415.1979 | - | - | 255.4785, 240.5105, 137.0976 | Unknown | - | 4 | - |
| 21 | 13.61 | 547.1471 | C26H28O13 | 2.64 | 383.0777 | Unknown | - | 4 | - |
| 22 | 13.97 | 577.1577 | C27H30O14 | - | 559.1448, 457.1127, 395.0760, 293.0451, 269.0450 | Apigenin-di-C-glucoside isomer | Flavonoid-glycosides | 2 | [48,49] |
| 23 | 14.51 | 577.1578 | C27H30O14 | - | 559.1445, 457.1126, 395.0762, 293.0457, 269.0444 | Apigenin-di-C-glucoside isomer | Flavonoid-glycosides | 2 | [48,49] |
*std: standard compound, a [M + HCOOH − H]− , b Annotations based on accurate mass and molecular formula only (no MS/MS) MSI level 4.
The analysis revealed that the Ghaf extract contains 23 compounds, which mainly belong to the phenolic compound class. Flavonoids are a heterogeneous group of polyphenols with high antioxidant activity that are widely distributed in the plant kingdom and are the most representative of the phenols compounds in the Ghaf extract. In plants, flavonoids can be either aglycones or glycosides containing hexose, deoxyhexose or pentose sugar moieties. Flavonoid glycosides can be classified as O-glycosides or C-glycosides according to their sugar linkage [50]. These can be clearly distinguished by their characteristic MS/MS fragmentation behaviour in negative ion mode. C-glycosides typically exhibit neutral losses of 30, 90 and 120 Da for hexose sugars, 74 and 104 Da for deoxyhexose sugars and 60 Da for pentose sugars. Based on this diagnostic fragmentation pattern, compound 15 was tentatively identified as a C-glycoside. Specifically, the deprotonated molecular ion [M–H]− at m/z 577.1574, which corresponds to the molecular formula C27H30O14, was assigned to 2′-O-rhamnosylvitexin. The fragment ion at m/z 457.1146 resulted from the characteristic neutral loss of 120 Da, confirming the presence of a C-linked hexose moiety. Following this fragmentation pattern the compounds 22, 23 were identified as C-glycosides. In contrast, O-glycosides exhibit neutral losses of 162 Da (hexose sugars), 176 Da (glucuronic acid), 146 Da (deoxyhexose sugars) and 132 Da (pentose sugar). Based on this information, the compound 17 with m/z 463.0889 and molecular formula C21H20O12 was tentatively identified as quercetin-3-O-galactoside as indicated by the fragment ion at m/z 301.0335 corresponded to the loss of hexose sugar (162 Da) with O-linked. Following this fragmentation pattern the compounds 13, 14, 16 and 18 were identified as O-glycosides.
A group of flavonoids is represented by flavan-3-ols, to which catechins belong. Peak 4, with an m/z of 305.0650 (C15H14O7) [M-H-], was identified as epigallocatechin, based on its fragmentation pattern[40]. The main ions produced during fragmentation were 179.0329 ([M-H-C6H6O3]-), 167.0331 ([M-H-C7H6O3]-), and 125.0230. The latter corresponds to ring A of the flavonoid. Meanwhile, peak 8 (m/z 457.0773 (C27H18O11)) [M-H-], was identified as epigallocatechin gallate, exhibiting characteristic fragments at m/z 305.0654 and 169.0128 corresponding to epigallocatechin and gallic acid, respectively.
Flavonoids and phenolic acids are known for their antioxidant activity and their ability to modulate enzymes involved in the degradation of the extracellular matrix, such as metalloproteinases (MMPs). Among the compounds present in the extract, gallic acid shows a marked inhibition of collagenase, due to the number and arrangement of hydroxyl groups on the benzene ring, which facilitate interaction with the catalytic site and chelation of the Zn2+ ion [10,35]. Similarly, flavan-3-ols such as catechin, epicatechin, and epicatechin gallate inhibit collagenase and elastase, with the galloyl group enhancing their activity, and also glycosidic flavonoids, such as quercetin glycosides, also modulate these proteases. Although aglycones are generally more active, glycosylation improves solubility and stability [35]. Furthermore, this class of molecules is also known for its important anti-inflammatory and immunostimulatory activity, contributing to a protective and beneficial effect[51]. Overall, the composition of the hydroalcoholic extract of Ghaf suggests the presence of bioactive molecules with anti-aging potential, justifying its selection for further functional studies.
3.3. Antioxidant Capacity and Phytochemical Content
3.3.1. DPPH Radical Scavenging Assay
The antioxidant capacity of the Ghaf extract was assessed using the DPPH radical scavenging assay. This method evaluates the ability of a sample to reduce the stable radical DPPH by monitoring spectrophotometrically its color shift from violet (oxidized form) to yellow (reduced form). Ghaf extract was tested at increasing concentrations, and the decrease in absorbance was converted into percentage scavenging activity normalized on the control (lacking antioxidant). As shown in Figure 3.a, the extract exhibited a nearly linear increase in radical scavenging activity over the range 0–20 µg/mL, reaching 60–65% inhibition at the maximum tested concentration. These findings reflect a high abundance of redox-active constituents capable of donating electrons or hydrogen atoms to neutralize free radicals [52].
To further quantify and standardize this activity, the results were expressed as µmol Trolox equivalents per gram of extract (µmol TE/g), calculated by interpolating the sample response against the Trolox calibration curve. Figure 3.b shows that Ghaf extract displays a remarkably high DPPH scavenging capacity, reaching approximately 3000 µmol TE/g, substantially higher than the standard antioxidant. Furthermore, its activity significantly exceeded that of ascorbic acid, which yielded around 800 µmol TE/g under identical experimental conditions. This finding indicates that the extract possesses a stronger antioxidant potential than the pure compound commonly used as a reference antioxidant.
Such a high radical scavenging capacity may be attributed to the complex phytochemical composition of the Ghaf extract, likely containing polyphenols, flavonoids, and other redox-active metabolites acting either additively or synergistically. Considering that the extract represents a crude mixture, its ability to achieve antioxidant activity comparable or superior to that of pure ascorbic acid highlights the strong intrinsic redox potential and possible synergistic interactions among its constituents.
3.3.2. Total Phenolic Content (TPC)
Phenolic compounds, including flavonoids and phenolic acids, are known to be the major contributors to the antioxidant capacity of plants [53,54]. Accordingly, the total phenolic content of Ghaf extract was also evaluated by using the Folin–Ciocalteu colorimetric assay. This assay relies on the reagent reduction by phenolic compounds under alkaline conditions, leading to the production of a blue coloration detectable in absorbance at 760 nm, proportional to the phenolic content in the samples. The total phenol content of extract was expressed in terms of gallic acid equivalent (µg GAE/mg extract) as described in Section 2.5.2. The Ghaf extract exhibited remarkably high TPC, with a mean value obtained from two independent experiments, each in technical triplicate of 281.82 ± 14.63 µg GAE/mg of extract, indicative of a rich presence of secondary metabolites with known redox potential. This finding aligns well with the strong antioxidant capacity previously observed in the DPPH radical scavenging assay, suggesting a close relationship between chemical composition and biological activity. Such correlation between total polyphenol content and antioxidant efficacy is consistently reported in literature, where polyphenolic compounds (especially flavonoids, tannins, and catechins) are recognized as major contributors to the antioxidant potential of plant extracts [55].
The UHPLC–DAD–HRMS/MS analysis further confirmed the presence of abundant catechins and flavonoid derivatives, both known for their ability to donate hydrogen atoms or electrons to neutralize free radicals, as well as to chelate metal ions involved in oxidative reactions [56]. These results provide strong evidence that the antioxidant activity of the Ghaf extract can be primarily attributed to its polyphenolic fraction, although synergistic effects among different compound classes cannot be excluded.
3.4. In Vitro Enzymatic Inhibition Assays
Skin aging is closely associated with the dysregulation of key ECM-degrading enzymes, including elastase, collagenase, and hyaluronidase, as well as tyrosinase, the rate-limiting enzyme in melanogenesis. An excessive activity of these proteolytic enzymes accelerates the breakdown of elastin, collagen, and hyaluronic acid, leading to loss of elasticity, wrinkle formation, and reduced skin firmness [57]. In addition, tyrosinase overactivation contributes to age-related hyperpigmentation [58]. Since plant extracts rich in antioxidants have been shown to modulate these enzymatic pathways and display multi-target anti-aging potential [57], it was investigated whether the Ghaf extract, previously shown to possess strong antioxidant capacity, also exhibits inhibitory effects on these enzymes. Evaluating its inhibitory activity toward elastase, collagenase, hyaluronidase, and tyrosinase provides a comprehensive assessment of the extract’s potential for dermocosmetic anti-aging applications.
3.4.1. Elastase Inhibition Assay
Elastase inhibition was investigated to evaluate whether the Ghaf extract could modulate the activity of this protease, which plays a central role in the degradation of dermal elastin and in the loss of skin elasticity. The assay quantifies elastase activity in the presence of increasing concentrations of Ghaf extract or oleanolic acid (positive control) by measuring the amount of substrate converted by the enzyme relative to the untreated condition. A reduction in enzymatic activity therefore reflects an inhibitory effect of the tested sample. As shown in Figure 4, the Ghaf extract produced a slight dose-dependent reduction in elastase activity, with inhibition becoming evident already at low concentrations (12.5–25 µg/mL) and gradually approaching a plateau around 50% residual activity at concentrations ≥100 µg/mL. The maximal inhibition observed was approximately 53% at the highest concentration tested (400 µg/mL). Although higher concentrations could not be tested due to solubility limitations, the inhibition trend was statistically significant (p < 0.05) compared to the untreated condition. Interestingly, oleanolic acid showed a comparable degree of inhibition at similar final extract concentrations, although it is a single purified compound, whereas the extract is a crude mixture. This suggests the presence of highly active constituents or synergistic interactions among phytochemicals in Ghaf extract.
A plausible explanation for the observed plateau is that a fraction of the elastase population remains catalytically active even in the presence of excess inhibitor. This behavior is typical for natural extracts, whose constituents often exhibit moderate affinity and only partially suppress enzyme activity. As a result, once the high-affinity fraction of the enzyme is inhibited, the remaining low-affinity portion continues to convert substrate, leading to a stable residual activity of approximately 50%. This phenomenon suggests that the extract achieves its maximal inhibitory effect within a relatively low concentration range, which may represent an advantage for topical applications.
3.4.2. Collagenase Inhibition Assay
The collagenase inhibition activity of the Ghaf extract was also evaluated to investigate its ability to slow down collagen degradation, a key process underlying dermal aging given the central role of collagen in maintaining tensile strength and structural integrity within the extracellular matrix. In this assay, collagenase activity was quantified in the presence of increasing concentrations of the extract, with epigallocatechin gallate (EGCG) included as a reference inhibitor. The method relies on spectrophotometric monitoring of the decrease in absorbance of the non-cleaved synthetic substrate, where lower absorbance corresponds to greater substrate conversion by the enzyme. Enzymatic activity was therefore expressed as a percentage relative to the untreated control, allowing inhibition to be calculated accordingly.
As shown in Figure 5, Ghaf extract significantly inhibited collagenase activity starting at 100 µg/mL and displayed a clear dose-dependent trend, reaching a maximal reduction of enzymatic activity of approximately 34% at the highest tested concentration. Interestingly, EGCG exhibited lower inhibitory activity than the crude Ghaf extract at the same concentration, suggesting that the extract contains either highly potent individual constituents or synergistic phytochemical interactions that enhance its overall efficacy.
Given the key role of collagenase in the degradation of ECM proteins, such inhibition suggests that the Ghaf extract may contribute to protecting skin structural integrity and counteracting skin aging processes. Although the specific molecular components responsible for this activity remain to be identified, the results clearly indicate the presence of constituents capable of modulating metalloproteinase activity.
3.4.3. Hyaluronidase Inhibition Assay
Hyaluronic acid (HA) contributes to skin hydration, elasticity, and structural integrity. During aging, HA levels decline due to hyaluronidase activity, resulting in decreased skin strength and moisture retention [59]. The hyaluronidase inhibitory activity of Ghaf extract was therefore evaluated. This assay quantifies the enzyme activity by measuring the turbidity generated by undigested HA in the presence of acidified BSA solution and increasing concentrations of the test inhibitor, with oleanolic acid serving as a positive control. As shown in Figure 6, Ghaf extract exhibited a marked, concentration-dependent reduction of hyaluronidase activity, reaching near-complete inhibition at the highest tested concentration (66 µg/mL). Furthermore, the Ghaf extract performance was strongly higher compared to oleanolic acid, a pure compound widely used as a reference hyaluronidase inhibitor. Indeed, the inhibition observed with 100 µg/mL of oleanolic acid was comparable to that achieved with approximately 11 µg/mL of Ghaf extract. These results strongly suggest synergistic effects among bioactive constituents. Such synergism may enhance the overall potency of the extract, making it a promising natural candidate for anti-aging and skin-protective applications.
Because hyaluronidase catalyzes the depolymerization of hyaluronic acid (a key molecule for skin hydration and viscoelasticity), the strong inhibitory potential of the extract indicates a robust capacity to counteract ECM degradation and preserve dermal moisture, thereby contributing to maintaining skin hydration and elasticity, which are key factors in preventing or mitigating visible signs of aging.
3.4.4. Human Tyrosinase Inhibition Assay
Tyrosinase is the crucial, rate-limiting enzyme in melanogenesis. It first hydroxylates L-tyrosine to L-DOPA and subsequently oxidizes L-DOPA to o-dopaquinone, which is further converted into melanin (the pigment responsible for skin, hair, and eye coloration) [60]. Although melanin plays an essential photoprotective role, its excessive accumulation within the epidermis is associated with several pigmentary disorders, including lentigo, melasma, and age-related hyperpigmentation [15]. Accordingly, tyrosinase inhibitors represent valuable candidates for skin-brightening and whitening applications. Ghaf extract was therefore investigated for human cellular tyrosinase inhibiting abilities in MNT-1 cell lysate. In this assay the TYR-mediated dopachrome and eumelanin formation was monitored at 478 nm and 600 nm respectively, in the presence or absence of Ghaf extract, with kojic acid included as a positive control. The resulting typical kinetic profiles were subsequently converted into slope values normalized on the untreated condition, yielding the percentage of human tyrosinase activity. As shown in Figure 7, kojic acid produced a characteristic sigmoidal dose–response with strong inhibition, validating the sensitivity and robustness of the assay. Ghaf extract similarly reduced tyrosinase activity in a concentration-dependent manner, although with lower potency, reaching an estimated IC50 below 100 µg/mL. Despite being less active than kojic acid, this inhibitory effect is remarkable given the crude, heterogeneous nature of the botanical extract.
Taken together, these findings suggest that the Ghaf extract contains bioactive molecules capable of modulating melanogenic enzymes, supporting its potential use as a multifunctional cosmetic ingredient with mild skin-brightening or tone-evening effects. The observed activity, together with previously demonstrated antioxidant and hyaluronidase-inhibitory properties at low concentrations, indicates that the extract’s dermo-cosmetic potential likely arises from complementary mechanisms.
3.5. Cell Viability Assay
To determine the non-cytotoxic concentration range of the Ghaf extract, HaCaT keratinocytes were treated with increasing concentrations of Ghaf extract and incubated for 48 hours. Cell viability was subsequently assessed using the MTS assay, with results expressed as percentage of viable cells relative to untreated control (Figure 8).
The obtained data revealed that the extract maintained high cell viability (>70%) up to concentrations of 200 µg/mL, followed by a slow decrease reaching 47% of cell viability at the highest tested concentration. Althought a cytotoxic effect is observed at higher doses, the profile suggests that the Ghaf extract does not negatively affect HaCaT cell viability within the concentration range relevant to the enzymatic and antioxidant activities observed in the aforementioned assays. These findings confirm that the extract can exert meaningful bioactivity without compromising cell viability, supporting its safe integration into topical formulations. Furthermore, cytotoxicity in monolayer cultures should be interpreted cautiously, as formulated systems typically reduce the effective bioavailable concentration of active ingredients [61,62].
3.6. Development and Characterization of Cosmetic Emulsion
3.6.1. Base Emulsion Formulation
Based on the biological findings presented above, which identified the Ghaf extract as a highly promising anti-aging active, the next step of this study focused on the development and evaluation of a cosmetic formulation incorporating the Ghaf extract. A facial cream was selected as the delivery system, as nowadays creams together with serums, represent the most widely attractive and commercially relevant cosmetic formats for facial skincare applications [63].
The first step consisted in the design of a base emulsion suitable for the incorporation of the Ghaf extract. In line with current trends in sustainable and eco-conscious skincare, the formulation was developed according to strict sustainability-driven criteria, including a minimal INCI list, avoidance of heating steps, and the exclusive use of biodegradable and naturally derived ingredients. To further enhance sustainability and skin compatibility, a Pickering emulsification strategy was adopted. This approach reduces the need for conventional synthetic surfactants and is increasingly recognized as an innovative, environmentally friendly alternative that offers improved biocompatibility, physical stability, and biodegradability [64,65]. The key stabilizing agent selected was VIVAPUR® CS TEX EASY, a co-processed, natural and biodegradable powder composed of microcrystalline cellulose, xanthan gum, and cellulose. This material is capable of forming a robust interfacial stabilizing network by adsorbing at the oil–water interface, thereby efficiently stabilizing the emulsion through a particulate-based mechanism. The oil phase was intentionally kept at low levels and composed exclusively of plant-derived oils, selected for their dual role as emollients enhancing skin sensorial properties and as natural sources of fragrance.
The optimized base emulsion consisted of an aqueous phase (84% w/w), containing water (74.88% w/w), glycerin (5% w/w), VIVAPUR® CS TEX EASY (4% w/w), and potassium sorbate (0.2% w/w), and an oil phase (16% w/w) composed of sunflower oil (10.5% w/w) and plum oil (5.5% w/w). This composition resulted in a physically stable, energy-efficient formulation suitable for further functionalization with the bioactive extract.
3.6.2. Ghaf Extract Formulation
After defining and formulating the base emulsion, the Ghaf extract was incorporated as an aqueous solution (2 mg/mL, based on its solubility in water) at three different concentrations: 3%, 5%, and 10% (w/w), corresponding to final extract concentrations in the formulation of 60, 100, and 200 μg/mL, respectively. The lowest inclusion level (3% w/w) was selected as a rational compromise between extract concentration range commonly reported in the literature [66] for cosmetic actives and the favorable safety profile observed in preliminary cell viability assays. Given that the biological activity and tolerability of an active ingredient may change within a complex formulation matrix [61], higher extract loadings (5% and 10% w/w) were also evaluated to explore potential concentration-dependent effects.
All Ghaf-containing emulsions were subsequently characterized and compared with the base formulation in order to evaluate their physicochemical stability and organoleptic properties.
3.6.2.1. Organoleptic Characteristics
Firstly, the organoleptic characterization of the emulsions obtained was conducted and results are summarized in Table 5. Both the base emulsion and the formulations containing the Ghaf extract retained a semi-solid, homogeneous appearance over 7 days, regardless of temperature conditions (4 °C, 25 °C, or 45 °C).
A slight color shift from the off white of the base emulsion to a light beige/gray tone was observed at higher extract concentrations, with further intensification at elevated storage temperatures. Such behavior is consistent with natural pigment oxidation (e.g., polyphenols and flavonoids that may undergo mild oxidation or color deepening upon heat exposure) [67], but no signs of degradation or phase instability were observed.
Odor evaluation revealed an enhancement of the characteristic plum oil scent, complemented by a subtle vegetal note that increased proportionally with extract content. The odor profile remained stable at all three storage temperatures, indicating the absence of extract degradation or rancidity phenomena during the observation period.
3.6.2.2. pH Determination
The pH values of formulations were 5.6, 5.9, 5.8, 5.9 for the base emulsion and for the emulsions containing 3% (w/w), 5% (w/w), and 10% (w/w) of Ghaf extract solution, respectively. Thus, all samples remained within the dermocompatible acidic range typically recommended for topical applications [68]. Importantly, Ghaf extract solution therefore does not perturb acid–base equilibria within the emulsion, a desirable feature in cosmetic emulsions, as it prevents irritation potential and ensures formulation stability and preservative efficacy [69].
3.6.2.3. Centrifugation (Accelerated Stability) Test
The centrifugation test was performed on both the base emulsion and the Ghaf-containing formulations after 24 h. No phase separation or signs of creaming or sedimentation were observed in any sample. This result demonstrates that all emulsions were physically stable even under strong mechanical stress, confirming the excellent interfacial stabilization capacity of VIVAPUR® CS TEX EASY. The findings suggest that the formulations possess high kinetic stability, which is a strong predictor of long-term shelf stability and robustness under real storage conditions.
3.6.2.4. Rheological Behavior
The rheological behavior of the base emulsion and of formulations containing increasing concentrations of Ghaf extract solution at 2 mg/mL (3%, 5%, and 10% w/w) was evaluated to investigate the effect of extract incorporation on the structural integrity and viscoelastic properties of the system. Flow and oscillatory measurements were performed at 25 °C using a Discovery HR-10 rheometer, following the procedure described in Section 2.9.4.4.
The flow sweep analysis (Figure 9.a) revealed a shear-thinning behavior for all samples, characterized by a marked decrease in viscosity with increasing shear rate—from approximately 104 Pa·s at 0.01 s−1 down to below 1 Pa·s at 1000 s−1. This pseudoplastic profile is typical of Pickering-type emulsions and indicates a stable, structured network that can recover its internal organization after shear removal [70]. Importantly, the viscosity curves of the Ghaf-containing formulations perfectly overlapped with that of the base emulsion, confirming that extract solution incorporation did not significantly alter the microstructure and flow properties of the system. The consistency and slope of the viscosity profiles remained nearly identical across all tested concentrations, suggesting that the polysaccharide–cellulose interfacial network provided by VIVAPUR® CS TEX EASY dominates the rheological response, even in the presence of bioactive solutes.
Oscillatory strain sweep tests (Figure 9.b) further supported these findings. All formulations exhibited a linear viscoelastic region (LVR) extending up to approximately 63% strain, within which the storage modulus (G′) exceeded the loss modulus (G″), indicating predominantly elastic solid-like behavior. Beyond this point, both moduli decreased as the structure progressively broke down under increasing deformation. The near superimposition of G′ and G″ curves across all samples confirmed that the addition of the Ghaf extract solution at concentrations up to 10% (w/w) did not compromise the internal microstructure or viscoelastic balance of the emulsion.
Overall, these results demonstrate that the incorporation of Ghaf extract as aqueous solution does not negatively impact the mechanical stability or rheological integrity of the Pickering emulsion. The formulations maintain consistent shear-thinning and viscoelastic properties, essential for good spreadability, sensory performance, and storage stability in topical cosmetic applications.
3.6.2.5. Droplet Size Distribution Analysis
The droplet size distribution of the base emulsion and of formulations containing the Ghaf extract solution at 3%, 5%, and 10% (w/w) was assessed by laser diffraction granulometry. As shown in Figure 10, the measured parameters indicate a consistent micrometric size distribution across all formulations, with median values ranging between 11.05 and 15.78 µm.
Although slight numerical variations were observed, especially an increase in the median and mode values in the emulsion containing Ghaf solution at 5% (w/w) formulation, the differences remain within the expected experimental variability and do not indicate a systematic or concentration-dependent shift in droplet size. Importantly, neither the mean diameter nor the variability among independent measurements exhibited a progressive trend with increasing extract concentration. The reported standard deviation values in Table 6 (remaining within the narrow interval 0.44–0.52 µm) refer to the variability between replicate measurements, highlighting the high reproducibility of the laser diffraction analysis across all samples. This observation suggests that the particulate stabilization mechanism provided by VIVAPUR® CS TEX EASY control droplet formation and stabilization and is not disrupted by extract loading.
From a formulation perspective, this structural stability together with the consistent rheological behavior and physical stability described above, is a desirable feature for consistent texture, stability, and sensorial performance in cosmetic applications.
4. Discussion
This study identifies Prosopis cineraria (Ghaf) extract as a promising cosmetic active, distinguished by its strong antioxidant profile and multifunctional properties relevant to skin protection and aging prevention. By combining chemical characterization with antioxidant and enzyme inhibition assays, the work provides a solid scientific basis for positioning Ghaf extract within modern dermocosmetic strategies aimed at reducing oxidative and enzymatic skin damage.
The extract exhibited exceptionally high radical scavenging capacity in the DPPH assay, highlighting its ability to neutralize reactive species that drive skin aging. Oxidative stress is a well-established contributor to both intrinsic and extrinsic aging, particularly under UV exposure, pollution, and other environmental stressors [71]. Notably, Ghaf extract outperformed ascorbic acid under identical conditions, suggesting strong potential for protecting lipids, proteins, and extracellular matrix components from oxidative degradation.
This antioxidant activity correlates with the elevated total phenolic content and the rich polyphenolic profile revealed by UHPLC–DAD–HRMS/MS analysis. Catechins and flavonoids, including quercetin derivatives, predominate and are known not only for radical scavenging but also for skin-soothing, anti-inflammatory, and barrier-supporting effects. The presence of glycosylated flavonoids may further enhance chemical stability and formulation compatibility, an important factor for shelf-stable cosmetic products [35].
Beyond antioxidant effects, Ghaf extract demonstrated significant inhibition of the main enzymes involved in ECM degradation and the loss of skin elasticity: elastase, collagenase, and hyaluronidase. The inhibition level was particularly relevant compared to the positive controls and suggests potential for preserving skin firmness and structural integrity. Importantly, partial inhibition is desirable in cosmetics, as it supports anti-aging benefits while maintaining physiological tissue remodeling. This balanced modulation aligns with the concept of “skin-friendly” actives that respect natural skin functions.
Ghaf extract exhibited a concentration-dependent inhibition of human tyrosinase activity is with an estimated IC50 below 100 µg/mL, indicating a potential anti-melanogenic effect. Although less potent than the control, the observed activity is noteworthy given the crude and heterogeneous nature of the botanical extract
The combined antioxidant and age-related hyperpigmentation reduction position Ghaf extract as a multifunctional ingredient capable of addressing multiple pathways in visible skin aging. Such multifunctionality is increasingly valued in cosmetic formulation, enabling simplified yet effective products. Additionally, the botanical origin and traditional use of Ghaf enhance its appeal in the growing market for natural, sustainable, and culturally rooted ingredients [72].
Studies on the incorporation of Ghaf extract into a semisolid formulation were conducted to obtain a facial cream. The optimal Ghaf-containing emulsion was identified by evaluating its physicochemical stability and organoleptic properties.
It should be noted that the assays used were in vitro and do not fully replicate skin physiology. Factors such as penetration, interaction with other formulation components, and real-use performance require further investigation. Nevertheless, the strong antioxidant capacity and enzyme modulation observed here provide a compelling rationale for continued development and formulation-oriented studies.
5. Conclusions
This study demonstrates that Prosopis cineraria (Ghaf) extract offers a highly promising profile for cosmetic and dermocosmetic applications, combining exceptional antioxidant capacity with biologically relevant modulation of enzymes involved in skin aging processes. Its strong radical scavenging performance, supported by high polyphenol content and a flavonoid-rich phytochemical composition, underscores its potential to protect skin from oxidative stress caused by environmental and intrinsic factors.
The ability of Ghaf extract to inhibit elastase, hyaluronidase, tyrosinase and collagenase, suggests a role in preserving skin elasticity, structural integrity, and pigmentation which are key tasks in anti-aging formulations. This multifunctional nature aligns with current cosmetic trends favoring natural actives that deliver multiple benefits within a single ingredient.
In addition, this work included formulation studies leading to the development of a stable facial cream prototype with optimal organoleptic properties, which may be used as such or serve as a versatile base for other cosmetic products, including night creams and serums.
Overall, these findings position Ghaf extract as a valuable natural cosmetic active for antioxidant and anti-aging formulations. Future research should focus on formulation compatibility, skin penetration, and efficacy in cellular or ex vivo models to fully translate its in vitro performance into practical applications.
Author Contributions
Conceptualization, Lucia Salvioni, Miriam Colombo; methodology, Beatrice De Santes, Lucia Morelli, Marco Giustra, Luca Campone; formal analysis and investigation, Beatrice De Santes, Stefania Pagliari, Francesca Spena; resources, Paolo Galli, Luca Campone, Davide Prosperi, Miriam Colombo; writing—original draft preparation, Beatrice De Santes, Lucia Salvioni, Davide Prosperi; writing—review and editing, Miriam Colombo, Luca Campone; supervision, Lucia Salvioni, Miriam Colombo, Delphine Huc-Mathis; funding acquisition, Paolo Galli, Miriam Colombo. All authors have read and agreed to the published version of the manuscript.
Funding
This work was supported by the Multilayered Urban Sustainability Action project, funded by the European Union under the NextGenerationEU initiative through the National Recovery and Resilience Plan.
Data Availability Statement
The authors declare that the data supporting the findings of this study are available within the paper. Should any raw data files be needed in another format they are available from the corresponding author upon reasonable request.
Conflicts of Interest
The authors Miriam Colombo and Paolo Galli have submitted a patent application related to the content of this article. All other authors declare no competing interests.
References
- Ho, H.-C.; Chiu, C. L.; Mansumitrchai, S.; Quarles, B. J. Hedonic and utilitarian value as a mediator of men’s intention to purchase cosmetics. J. Glob. Fash. Mark. 2020, vol. 11(no. 1), 71–89. [Google Scholar] [CrossRef]
- Daniels, G.; Gupta, S. Responsible and Sustainable Beauty Consumption for Wellbeing of Older Adults. J. Macromarketing 2025, vol. 45(no. 4), 747–761. [Google Scholar] [CrossRef]
- Juncan, A.M.; Morgovan, C.; Rus, L.-L.; Loghin, F. Development and Evaluation of a Novel Anti-Ageing Cream Based on Hyaluronic Acid and Other Innovative Cosmetic Actives. Polymers . 2023, vol. 15(no. 20), 4134. [Google Scholar] [CrossRef]
- Coherent market insights. Available online: https://www.coherentmarketinsights.com/industry-reports/natural-cosmetics-market (accessed on 12 December 2025).
- Plainfossé, H.; Burger, P.; Azoulay, S.; Landreau, A.; Verger-Dubois, G.; Fernandez, X. Development of a Natural Anti-Age Ingredient Based on Quercus pubescens Willd. Leaves Extract—A Case Study. Cosmetics 2018, vol. 5(no. 1), 15. [Google Scholar] [CrossRef]
- Csekes, E.; Račková, L. Skin Aging, Cellular Senescence and Natural Polyphenols. Int. J. Mol. Sci. 2021, vol. 22(no. 23), 12641. [Google Scholar] [CrossRef]
- Mahendra, C. K.; et al. The Potential of Sky Fruit as an Anti-Aging and Wound Healing Cosmeceutical Agent. Cosmetics 2021, vol. 8(no. 3), 79. [Google Scholar] [CrossRef]
- Francois-Newton, V.; et al. Antioxidant and Anti-Aging Potential of Indian Sandalwood Oil against Environmental Stressors In Vitro and Ex Vivo. Cosmetics 2021, vol. 8(no. 2), 53. [Google Scholar] [CrossRef]
- Cui, L.; et al. Anti-skin Aging Potential of Sargassum thunbergii Ethanolic Extract: Antioxidant, Anti-inflammatory, and Antiwrinkle Effects on L929 Fibroblast Cells. J. Food Process. Preserv. 2023, vol. 2023, 1–16. [Google Scholar] [CrossRef]
- Pientaweeratch, S.; Panapisal, V.; Tansirikongkol, A. Antioxidant, anti-collagenase and anti-elastase activities of Phyllanthus emblica, Manilkara zapota and silymarin: an in vitro comparative study for anti-aging applications. Pharm. Biol. 2016, vol. 54(no. 9), 1865–1872. [Google Scholar] [CrossRef]
- Pintus, F.; et al. Hydroxy-3-Phenylcoumarins as Multitarget Compounds for Skin Aging Diseases: Synthesis, Molecular Docking and Tyrosinase, Elastase, Collagenase and Hyaluronidase Inhibition, and Sun Protection Factor. Molecules 2022, vol. 27(no. 20), 6914. [Google Scholar] [CrossRef]
- Fallacara, A.; Baldini, E.; Manfredini, S.; Vertuani, S. “Hyaluronic Acid in the Third Millennium,”. Polymers . 2018, vol. 10(no. 7), 701. [Google Scholar] [CrossRef]
- Shin, S. H.; Lee, Y. H.; Rho, N.-K.; Park, K. Y. Skin aging from mechanisms to interventions: focusing on dermal aging. Front. Physiol. 2023, vol. 14. [Google Scholar] [CrossRef]
- Lee, A.-Y. Skin Pigmentation Abnormalities and Their Possible Relationship with Skin Aging. Int. J. Mol. Sci. 2021, vol. 22(no. 7), 3727. [Google Scholar] [CrossRef]
- Ersoy, E.; Eroglu Ozkan, E.; Boga, M.; Yilmaz, M. A.; Mat, A. Anti-aging potential and anti-tyrosinase activity of three Hypericum species with focus on phytochemical composition by LC–MS/MS. Ind. Crops Prod. 2019, vol. 141, 111735. [Google Scholar] [CrossRef]
- Charles Dorni, A.I.; Amalraj, A.; Gopi, S.; Varma, K.; Anjana, S. N. Novel cosmeceuticals from plants—An industry guided review. J. Appl. Res. Med. Aromat. Plants 2017, vol. 7, 1–26. [Google Scholar] [CrossRef]
- Yang, L.; Wen, K.-S.; Ruan, X.; Zhao, Y.-X.; Wei, F.; Wang, Q. Response of Plant Secondary Metabolites to Environmental Factors. Molecules 2018, vol. 23(no. 4), 762. [Google Scholar] [CrossRef]
- Palma-Wong, M.; et al. Exploration of Phenolic Content and Antioxidant Potential from Plants Used in Traditional Medicine in Viesca, Mexico. Horticulturae 2023, vol. 9(no. 12), 1252. [Google Scholar] [CrossRef]
- Chaiyana, W.; Charoensup, W.; Sriyab, S.; Punyoyai, C.; Neimkhum, W. Herbal Extracts as Potential Antioxidant, Anti-Aging, Anti-Inflammatory, and Whitening Cosmeceutical Ingredients. Chem. Biodivers. 2021, vol. 18(no. 7). [Google Scholar] [CrossRef]
- Sakkir, S.; Kabshawi, M.; Asmita, N.; Almansoori, S.; Alahbabi, H. Systematic composition, species diversity and plant chorology of Wadi Shuwaib: A typical desert wadi in the eastern region of United Arab Emirates (UAE). Biodivers. Data J. 2025, vol. 13. [Google Scholar] [CrossRef]
- Alyammahi, N. A. S. A.; Ridouane, F. L.; Almoalla, A. A.; Al Dhanhani, A. S. S. J.; Gorashi, A.; Mirza, S. B. Exploration of the Native Plants from the Biodiversity of United Arab Emirates for Conservation and Reintroduction Efforts: Collection, Verification, Design, and Implementation of UAE Flora Database. Int. J. Plant Biol. 2023, vol. 14(no. 2), 493–502. [Google Scholar] [CrossRef]
- Gkanogiannis, A.; et al. Population Genomics and Genetic Diversity of Prosopis cineraria in the United Arab Emirates: Insights for Conservation in Arid Ecosystems. Plants 2025, vol. 14(no. 19), 2970. [Google Scholar] [CrossRef]
- Giustra, M.; et al. Eco-luxury: Making sustainable drugs and cosmetics with Prosopis cineraria natural extracts. Front. Sustain. 2022, vol. 3. [Google Scholar] [CrossRef]
- Roy, R.; Roy, J.; Liya, I. J.; Ahmed, J.; Akter, A.; Basher, M. A. Antioxidant and hepatoprotective activities of methanolic extract of Fimbristylis miliacea (L.) Vahl. Phytomed. Plus 2023, vol. 3(no. 2), 100449. [Google Scholar] [CrossRef]
- Vajjiravelu, R.; Palani, B.; Shanmugam, R.; Jayakodi, S. Green Synthesis of Copper Oxide Nanoparticles Using Prosopis cineraria Extract: Evaluation of Cytotoxic Antioxidant and Antimicrobial Activity. 2025. [Google Scholar] [CrossRef] [PubMed]
- Nastić, N.; et al. Comprehensive two-step sequential extraction and pharmacological profiling of Emirati plant leaves: A multi-target natural product discovery approach. J. Agric. Food Res. 2026, vol. 25, 102551. [Google Scholar] [CrossRef]
- I. S. , K. H. M. S. , A. A. I. , I. H. , B. P. , K. A. U. , et al. In vitro characterization and assessment of cosmetic potentials of W/O emulsion cream containing 2% Prosopis cineraria extract. Acta Pol. Pharm.-Drug Res. 2015, vol. 72, 1233–1238.
- Huamán-Castilla, N. L.; et al. Exploring a Sustainable Process for Polyphenol Extraction from Olive Leaves. Foods 2024, vol. 13(no. 2), 265. [Google Scholar] [CrossRef]
- Palaiogiannis, D.; Chatzimitakos, T.; Athanasiadis, V.; Bozinou, E.; Makris, D. P.; Lalas, S. I. Successive Solvent Extraction of Polyphenols and Flavonoids from Cistus creticus L. Leaves. Oxygen 2023, vol. 3(no. 3), 274–286. [Google Scholar] [CrossRef]
- Lim, J. A.; Cabajar, A. A.; Lobarbio, C. F. Y.; Taboada, E. B.; Lacks, D. J. Extraction of bioactive compounds from mango (Mangifera indica L. var. Carabao) seed kernel with ethanol–water binary solvent systems. J. Food Sci. Technol. 2019, vol. 56(no. 5), 2536–2544. [Google Scholar] [CrossRef] [PubMed]
- Plaskova, A.; Mlcek, J. New insights of the application of water or ethanol-water plant extract rich in active compounds in food. Front. Nutr. 2023, vol. 10. [Google Scholar] [CrossRef]
- Selahvarzi, et al. Optimization of ultrasonic-assisted extraction of phenolic compounds from pomegranate and orange peels and their antioxidant activity in a functional drink. Food Biosci. 2022, vol. 49, 101918. [Google Scholar] [CrossRef]
- Cerri, F.; et al. Phytochemical Profiling, Antioxidant Activity, and In Vitro Cytotoxic Potential of Mangrove Avicennia marina. Pharmaceuticals 2025, vol. 18(no. 9), 1308. [Google Scholar] [CrossRef]
- Dewanto, V.; Wu, X.; Liu, R. H. Processed Sweet Corn Has Higher Antioxidant Activity. J. Agric. Food Chem. 2002, vol. 50(no. 17), 4959–4964. [Google Scholar] [CrossRef] [PubMed]
- Wittenauer; Mäckle, S.; Sußmann, D.; Schweiggert-Weisz, U.; Carle, R. Inhibitory effects of polyphenols from grape pomace extract on collagenase and elastase activity. Fitoterapia 2015, vol. 101, 179–187. [Google Scholar] [CrossRef] [PubMed]
- Widowati, W.; et al. Antioxidant and Anti Aging Assays of <I>Oryza sativa</I> Extracts, Vanillin and Coumaric Acid. J. Nat. Rem. 2016, vol. 16(no. 3), 88. [Google Scholar] [CrossRef]
- Tu, P.; Tawata, S. Anti-Oxidant, Anti-Aging, and Anti-Melanogenic Properties of the Essential Oils from Two Varieties of Alpinia zerumbet. Molecules 2015, vol. 20(no. 9), 16723–16740. [Google Scholar] [CrossRef]
- Steingass, B.; Glock, M. P.; Schweiggert, R. M.; Carle, R. Studies into the phenolic patterns of different tissues of pineapple (Ananas comosus [L.] Merr.) infructescence by HPLC-DAD-ESI-MS n and GC-MS analysis. Anal. Bioanal. Chem. 2015, vol. 407(no. 21), 6463–6479. [Google Scholar] [CrossRef]
- Bylund; Norström, S. H.; Essén, S. A.; Lundström, U. S. Analysis of low molecular mass organic acids in natural waters by ion exclusion chromatography tandem mass spectrometry. J. Chromatogr. A 2007, vol. 1176(no. 1–2), 89–93. [Google Scholar] [CrossRef] [PubMed]
- Hofmann, T.; Nebehaj, E.; Albert, L. Antioxidant properties and detailed polyphenol profiling of European hornbeam (Carpinus betulus L.) leaves by multiple antioxidant capacity assays and high-performance liquid chromatography/multistage electrospray mass spectrometry. Ind. Crops Prod. 2016, vol. 87, 340–349. [Google Scholar] [CrossRef]
- Spínola, V.; Castilho, P. C. Phytochemical Profile, Chemotaxonomic Studies, and In Vitro Antioxidant Activities of Two Endemisms from Madeira Archipelago: Melanoselinum decipiens and Monizia edulis (Apiaceae). Chem. Biodivers. 2016, vol. 13(no. 10), 1290–1306. [Google Scholar] [CrossRef] [PubMed]
- Dou, J.; Lee, V. S. Y.; Tzen, J. T. C.; Lee, M.-R. Identification and Comparison of Phenolic Compounds in the Preparation of Oolong Tea Manufactured by Semifermentation and Drying Processes. J. Agric. Food Chem. 2007, vol. 55(no. 18), 7462–7468. [Google Scholar] [CrossRef] [PubMed]
- Sun, J.; Liang, F.; Bin, Y.; Li, P.; Duan, C. Screening Non-colored Phenolics in Red Wines using Liquid Chromatography/Ultraviolet and Mass Spectrometry/Mass Spectrometry Libraries. Molecules 2007, vol. 12(no. 3), 679–693. [Google Scholar] [CrossRef]
- Clifford, N.; Marks, S.; Knight, S.; Kuhnert, N. Characterization by LC-MS nof Four New Classes of p -Coumaric Acid-Containing Diacyl Chlorogenic Acids in Green Coffee Beans. J. Agric. Food Chem. 2006, vol. 54(no. 12), 4095–4101. [Google Scholar] [CrossRef]
- Parejo; Jáuregui, O.; Viladomat, F.; Bastida, J.; Codina, C. Characterization of acylated flavonoid- O -glycosides and methoxylated flavonoids from Tagetes maxima by liquid chromatography coupled to electrospray ionization tandem mass spectrometry. Rapid Commun. Mass Spectrom. 2004, vol. 18(no. 23), 2801–2810. [Google Scholar] [CrossRef] [PubMed]
- Dos Santos, et al. Antioxidative, Antiproliferative and Antimicrobial Activities of Phenolic Compounds from Three Myrcia Species. Molecules 2018, vol. 23(no. 5), 986. [Google Scholar] [CrossRef]
- Gouveia, S.; Castilho, P. C. Characterisation of phenolic acid derivatives and flavonoids from different morphological parts of Helichrysum obconicum by a RP-HPLC–DAD-(−)–ESI-MSn method. Food Chem. 2011, vol. 129(no. 2), 333–344. [Google Scholar] [CrossRef]
- Tahir, I.; Shaari, K.; Abas, F.; Parveez, G. K. A.; Ishak, Z.; Ramli, U. S. Characterization of Apigenin and Luteolin Derivatives from Oil Palm ( Elaeis guineensis Jacq.) Leaf Using LC–ESI-MS/MS. J. Agric. Food Chem. 2012, vol. 60(no. 45), 11201–11210. [Google Scholar] [CrossRef] [PubMed]
- M. M. , E. A. , L. R. R. A. , A.-H. E. S. S. , K. S. A. , & H. S. R. C-glycosyl flavonoids-rich extract of Dipcadi erythraeum Webb & Berthel. bulbs: Phytochemical and anticancer evaluations. J. Appl. Pharm. Sci. 2019, vol. 9(no. 6), 94–98. [CrossRef]
- Pagliari, S.; et al. A comparative metabolomic investigation of different sections of Sicilian Citrus x limon (L.) Osbeck, characterization of bioactive metabolites, and evaluation of in vivo toxicity on zebrafish embryo. J. Food Sci. 2024, vol. 89(no. 6), 3729–3744. [Google Scholar] [CrossRef] [PubMed]
- Kumar, A.; Kaur, S.; Sangwan, P. L.; Tasduq, S. A. Therapeutic and cosmeceutical role of glycosylated natural products in dermatology. Phyther. Res. 2023, vol. 37(no. 4), 1574–1589. [Google Scholar] [CrossRef] [PubMed]
- Burda, S.; Oleszek, W. Antioxidant and Antiradical Activities of Flavonoids. J. Agric. Food Chem. 2001, vol. 49(no. 6), 2774–2779. [Google Scholar] [CrossRef] [PubMed]
- LI, H.; CHENG, K.; WONG, C.; FAN, K.; CHEN, F.; JIANG, Y. Evaluation of antioxidant capacity and total phenolic content of different fractions of selected microalgae. Food Chem. 2007, vol. 102(no. 3), 771–776. [Google Scholar] [CrossRef]
- Kumar, S.; Sandhir, R.; Ojha, S. Evaluation of antioxidant activity and total phenol in different varieties of Lantana camara leaves. BMC Res. Notes 2014, vol. 7(no. 1), 560. [Google Scholar] [CrossRef]
- Zhang, Y.; Cai, P.; Cheng, G.; Zhang, Y. A Brief Review of Phenolic Compounds Identified from Plants: Their Extraction, Analysis, and Biological Activity. Nat. Prod. Commun. 2022, vol. 17(no. 1). [Google Scholar] [CrossRef]
- Mira, L.; Tereza Fernandez, M.; Santos, M.; Rocha, R.; Florêncio, M. Helena; Jennings, K. R. Interactions of Flavonoids with Iron and Copper Ions: A Mechanism for their Antioxidant Activity. Free Radic. Res. 2002, vol. 36(no. 11), 1199–1208. [Google Scholar] [CrossRef] [PubMed]
- Wang, H.; Zheng, J.; Cao, S.; Lv, J. Research on the mechanisms of plant bioactive metabolites in anti-skin aging and future development prospects. Front. Pharmacol. 2025, vol. 16. [Google Scholar] [CrossRef]
- Chaiyana, W.; Charoensup, W.; Sriyab, S.; Punyoyai, C.; Neimkhum, W. Herbal Extracts as Potential Antioxidant, Anti-Aging, Anti-Inflammatory, and Whitening Cosmeceutical Ingredients. Chem. Biodivers. 2021, vol. 18(no. 7). [Google Scholar] [CrossRef]
- Jiratchayamaethasakul, C.; et al. In vitro screening of elastase, collagenase, hyaluronidase, and tyrosinase inhibitory and antioxidant activities of 22 halophyte plant extracts for novel cosmeceuticals. Fish. Aquat. Sci. 2020, vol. 23(no. 1), 6. [Google Scholar] [CrossRef]
- Papaemmanouil, C. D.; et al. ANTIAGE-DB: A Database and Server for the Prediction of Anti-Aging Compounds Targeting Elastase, Hyaluronidase, and Tyrosinase. Antioxidants 2022, vol. 11(no. 11), 2268. [Google Scholar] [CrossRef]
- Yang, S.; Liu, L.; Han, J.; Tang, Y. Encapsulating plant ingredients for dermocosmetic application: an updated review of delivery systems and characterization techniques. Int. J. Cosmet. Sci. 2020, vol. 42(no. 1), 16–28. [Google Scholar] [CrossRef]
- Oliveira, A. L. S.; Valente, D.; Moreira, H. R.; Pintado, M.; Costa, P. Effect of squalane-based emulsion on polyphenols skin penetration: Ex vivo skin study. Colloids Surf. B Biointerfaces 2022, vol. 218, 112779. [Google Scholar] [CrossRef] [PubMed]
- Juncan, M.; Morgovan, C.; Rus, L.-L.; Loghin, F. Development and Evaluation of a Novel Anti-Ageing Cream Based on Hyaluronic Acid and Other Innovative Cosmetic Actives. Polymers . 2023, vol. 15(no. 20), 4134. [Google Scholar] [CrossRef]
- de Carvalho-Guimarães, B.; Correa, K. L.; de Souza, T. P.; Rodríguez Amado, J. R.; Ribeiro-Costa, R. M.; Silva-Júnior, J. O. C. A Review of Pickering Emulsions: Perspectives and Applications. Pharmaceuticals 2022, vol. 15(no. 11), 1413. [Google Scholar] [CrossRef]
- Hazt, et al. Unconventional and conventional Pickering emulsions: Perspectives and challenges in skin applications. Int. J. Pharm. 2023, vol. 636, 122817. [Google Scholar] [CrossRef] [PubMed]
- Goh, P.; Goh, S.; Tow, W.; Toh, K.; Palanisamy, U. D.; Sundralingam, U. Exploring the Role of Herbal Compounds in Skin Aging: A Systematic Review of Topical Approaches. Phyther. Res. 2025, vol. 39(no. 1), 315–363. [Google Scholar] [CrossRef]
- Pandiselvam, R.; et al. The influence of non-thermal technologies on color pigments of food materials: An updated review. Curr. Res. Food Sci. 2023, vol. 6, 100529. [Google Scholar] [CrossRef] [PubMed]
- Lukić, M.; Pantelić, I.; Savić, S. D. Towards Optimal pH of the Skin and Topical Formulations: From the Current State of the Art to Tailored Products. Cosmetics 2021, vol. 8(no. 3), 69. [Google Scholar] [CrossRef]
- Janssens-Böcker; Doberenz, C.; Monteiro, M.; de Oliveira Ferreira, M. Influence of Cosmetic Skincare Products with pH < 5 on the Skin Microbiome: A Randomized Clinical Evaluation. Dermatol. Ther. (Heidelb) . 2025, vol. 15(no. 1), 141–159. [Google Scholar] [CrossRef]
- Lee; Kim, D.; Kim, K. Distinctive rheological properties of Pickering emulsions: from their origin to the applications. Korea-Aust. Rheol. J. 2022, vol. 34(no. 2), 91–103. [Google Scholar] [CrossRef]
- Yasin, Z. A. M.; Ibrahim, F.; Rashid, N. N.; Razif, M. F. M.; Yusof, R. The Importance of Some Plant Extracts as Skin Anti-aging Resources: A Review. Curr. Pharm. Biotechnol. 2018, vol. 18(no. 11), 864–876. [Google Scholar] [CrossRef] [PubMed]
- Dhillon, R.; Agarwal, B.; Rajput, N. Experiential marketing strategies used by luxury cosmetics companies. Innov. Mark. 2022, vol. 18(no. 1), 49–62. [Google Scholar] [CrossRef]
Figure 1.
Violin plot showing the percentage yields of seven independent hydroalcoholic extractions of the combined Ghaf matrix. The plot depicts the distribution and variability of extraction yields with n=7.
Figure 1.
Violin plot showing the percentage yields of seven independent hydroalcoholic extractions of the combined Ghaf matrix. The plot depicts the distribution and variability of extraction yields with n=7.

Figure 2.
Representative chromatogram of the Ghaf extract.

Figure 3.
(a) Concentration-dependent DPPH radical scavenging activity of the Ghaf extract. The plot shows the percentage of DPPH radical scavenging activity as a function of extract concentration (0–20 µg/mL). (b) DPPH radical scavenging activity of the Ghaf extract and ascorbic acid expressed as Trolox equivalents (µmol TE/g). Bar graph shows the antioxidant capacity of the Ghaf extract compared with ascorbic acid as a positive control. Values are expressed as mean ± standard deviation of two independent experiments, each in technical triplicate.

Figure 4.
Elastase activity in presence of Ghaf extract compared to oleanolic acid used as positive control. Each bar represents the mean percentage activity ± standard deviation of two independent experiments, each in technical triplicate. Each enzyme activity reduction was significant compared to untreated condition with p < 0.0001 (§), except for Ghaf at 12.5 μg/mL with p < 0.01 (†).

Figure 5.
Collagenase activity in presence of increasing concentration of Ghaf extract and of ECGC as positive control. Each bar represents the mean percentage activity ± standard deviation of two independent experiments, each in technical triplicate. Each enzyme activity % was significant compared to untreated condition with p < 0.0001 (§) or p < 0.01 (†), except for Ghaf at 12.5, 25 and 50 μg/mL.

Figure 6.
Hyaluronidase activity in presence of increasing concentration of Ghaf extract compared to oleanolic acid used as positive control. Each bar represents the mean percentage activity ± standard deviation of two independent experiments, each in technical triplicate. All enzyme activities reported were significant compared to untreated condition with p < 0.0001 (§).

Figure 7.
Tyrosinase inhibition by kojic acid and Ghaf extract. (a) Dose–response inhibition curve of human tyrosinase in the presence of kojic acid (positive control), and (b) exposed to increasing concentrations of Ghaf extract. Data represent mean ± SD of three independent experiments (n=3), each in technical triplicate.

Figure 8.
Cell viability (%) of HaCaT cell line treated with Ghaf extract (25–400 µg/mL) for 48 h compared to untreated condition. Bars represent mean percentage ± standard deviation of two independent experiments, each in technical quadruplicate. § (p < 0.0001) and ¤ (p < 0.05) vs untreated condition.

Figure 9.
(a) Viscosity (η) vs. shear rate for all formulations (base emulsion in red; Ghaf solution at 3% (w/w) in green; Ghaf solution at 5% (w/w) in blue; Ghaf solution at 10% (w/w) in black). (b) Oscillatory strain sweep curves of storage (G′) and loss (G″) moduli as a function of oscillation strain (%). Each value represents the mean ± standard deviation of three independent measurements (n=3).

Figure 10.
Droplet size distribution parameters of base emulsion and Ghaf-containing emulsions correspond to the incorporation of a 2 mg/mL aqueous Ghaf extract solution at 3, 5, and 10% (w/w), yielding final extract concentrations of 60, 100, and 200 μg/mL, respectively. Median, mode, mean droplet diameter, and D90 values were determined by laser diffraction granulometry and expressed as the mean of three independent measurements.

Table 1.
Percentage and weight of final Ghaf unified powder.
| Plant portion | Total weight (g) of obtained powders |
Percentage of each portion on total (%) |
Weight of each portion (g) used |
|
|---|---|---|---|---|
| Twigs | 3.77 | 8.2 | 0.082 | |
| Roots | 7.43 | 16.2 | 0.162 | |
| Leaves | 32.01 | 70.0 | 0.700 | |
| Bark | 2.53 | 5.5 | 0.055 | |
| Total | 45.74 | 100 | 1 |
Table 2.
Base emulsion percentage composition (% w/w).
| Ingredient | Phase | Quantity |
|---|---|---|
| Demineralized water | Aqueous | 85.52 |
| Glycerin | Aqueous | 5.00 |
| Potassium sorbate | Aqueous | 0.20 |
| VIVAPUR® CS TEX EASY | Aqueous | 5.50 |
| Sunflower oil | Oil | 2.53 |
| Plum oil | Oil | 1.26 |
Table 3.
Base emulsions percentage composition (% w/w) containing Ghaf extract as aqueous solution (2 mg/mL) at 3, 5, and 10% (w/w), yielding final extract concentrations of 60, 100, and 200 μg/mL, respectively.
Table 3.
Base emulsions percentage composition (% w/w) containing Ghaf extract as aqueous solution (2 mg/mL) at 3, 5, and 10% (w/w), yielding final extract concentrations of 60, 100, and 200 μg/mL, respectively.
| Ingredient | Phase | BE + Ghaf 3% | BE + Ghaf 5% | BE + Ghaf 10% |
|---|---|---|---|---|
| Demineralized water | Aqueous | 82.52 | 80.52 | 75.52 |
| Glycerin | Aqueous | 5.00 | 5.00 | 5.00 |
| Potassium sorbate | Aqueous | 0.20 | 0.20 | 0.20 |
| VIVAPUR® CS TEX EASY | Aqueous | 5.50 | 5.50 | 5.50 |
| Ghaf solution 2mg/mL | Aqueous | 3.00 | 5.00 | 10.00 |
| Sunflower oil | Oil | 2.53 | 2.53 | 2.53 |
| Plum oil | Oil | 1.26 | 1.26 | 1.26 |
Table 5.
Physical study of base emulsion and emulsion with Ghaf extract at different percentages for one week. Ghaf-containing emulsions correspond to the incorporation of a 2 mg/mL aqueous Ghaf extract solution at 3, 5, and 10% (w/w), yielding final extract concentrations of 60, 100, and 200 μg/mL, respectively.
| Duration | 7 days | ||||||
|---|---|---|---|---|---|---|---|
| Storage condition | |||||||
| Parameter | 4 °C | 25 °C | 45 °C | Parameter | 4 °C | 25 °C | 45 °C |
| Appearance | Odour | ||||||
| Base emulsion | Semisolid | Semisolid | Semisolid | Base emulsion | Characteristics | Characteristics | Characteristics |
| BE + Ghaf 3% | Semisolid | Semisolid | Semisolid | BE + Ghaf 3% | Characteristics, mild herbal | Characteristics, mild herbal | Characteristics, mild herbal |
| BE + Ghaf 5% | Semisolid | Semisolid | Semisolid | BE + Ghaf 5% | Characteristics, strong herbal | Characteristics, strong herbal | Characteristics, strong herbal |
| BE + Ghaf 10% | Semisolid | Semisolid | Semisolid | BE + Ghaf 10% | Characteristics, strong herbal | Characteristics, strong herbal | Characteristics, strong herbal |
| Colour |  |
||||||
| Base emulsion | Off white | Off white | Off white | ||||
| BE + Ghaf 3% | Off white | Off white | Off white | ||||
| BE + Ghaf 5% | Off white | Off white | Off white | ||||
| BE + Ghaf 10% | Off white | Light greyish | Light beige | ||||
Table 6.
Droplet size mean ± standard deviation of three measurements of base emulsion and Ghaf-containing emulsions correspond to the incorporation of a 2 mg/mL aqueous Ghaf extract solution at 3, 5, and 10% (w/w), yielding final extract concentrations of 60, 100, and 200 μg/mL, respectively.
Table 6.
Droplet size mean ± standard deviation of three measurements of base emulsion and Ghaf-containing emulsions correspond to the incorporation of a 2 mg/mL aqueous Ghaf extract solution at 3, 5, and 10% (w/w), yielding final extract concentrations of 60, 100, and 200 μg/mL, respectively.
| Mean (µm) | Std. Dev. | |
|---|---|---|
| Base emulsion | 10.43 | 0.50 |
| BE + Ghaf 3% | 9.81 | 0.44 |
| BE + Ghaf 5% | 13.24 | 0.51 |
| BE + Ghaf 10% | 9.29 | 0.46 |
Disclaimer/Publisher’s Note: The statements, opinions and data contained in all publications are solely those of the individual author(s) and contributor(s) and not of MDPI and/or the editor(s). MDPI and/or the editor(s) disclaim responsibility for any injury to people or property resulting from any ideas, methods, instructions or products referred to in the content. |
© 2026 by the authors. Licensee MDPI, Basel, Switzerland. This article is an open access article distributed under the terms and conditions of the Creative Commons Attribution (CC BY) license.
Copyright: This open access article is published under a Creative Commons CC BY 4.0 license, which permit the free download, distribution, and reuse, provided that the author and preprint are cited in any reuse.


