

Submitted:
16 June 2026
Posted:
18 June 2026
You are already at the latest version
Abstract
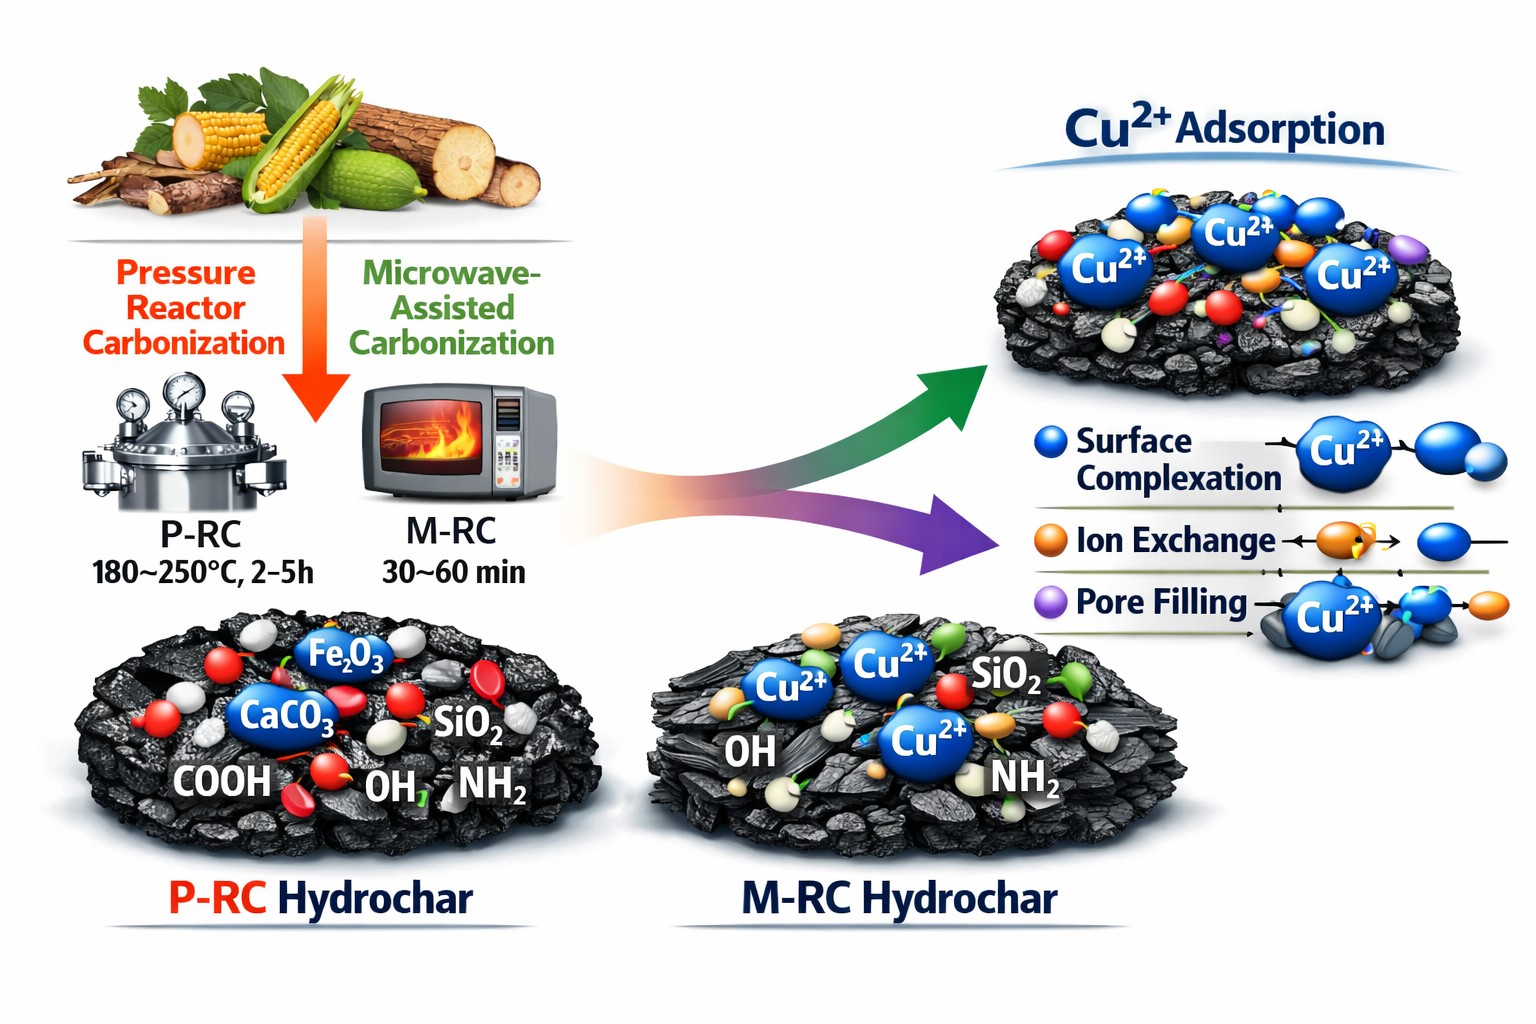
Biomass thermochemical conversion-derived hydrochar has been increasingly recognized as a functional resource for environmental remediation, but knowledge of the effect of the carbonization conditions on the surface chemistry and binding behaviour of hydrochar is still limited. In this study, hydrochar from two different processing pathways: pressure reactor carbonization (P-RC) and microwave-assisted carbonization (M-RC), is compared to understand the mechanisms of contaminant interaction and the changes in structure that occur during the carbonization processing. P-RC was synthesized at the hydrothermal temperatures (180, 220, and 250 °C) for 2 and 5 h, while M-RC was synthesized at microwave irradiation for 30 minutes and 1 hour. TGA, SEM–EDS, FTIR, and XRD were used for comprehensive characterization, which revealed systematic differences in functional group distribution, mineral phases, and microstructural development between the two carbonization methods and at different carbonization temperatures. The increase in P-RC temperature led to greater aromatic condensation, thermal stability, and mineral reorganization, while M-RC maintained a higher percentage of oxygenated functionality and a more heterogeneous surface morphology. Batch adsorption experiments indicated that the M-RC hydrochar had a faster adsorption rate, attributed to its greater number of reactive oxygenated functionalities, whereas the P-RC hydrochar produced at higher temperatures exhibited a more even distribution of adsorption sites and stronger mineral-assisted interactions. The kinetics and isotherm modeling also showed different interaction pathways: for M-RC, surface complexation on heterogeneous sites was favored, whereas for P-RC, a more monolayer-like adsorption was observed. These results collectively show how the method and temperature of carbonization affect reactivity and support the establishment of mechanistic relationships crucial to maximizing the utility of hydrochar as a functional material for environmental remediation.
Keywords:
hydrochar
; valorization
; Cu (II) adsorption
; isotherm modeling
; biomass conversion
; hydrothermal carbonization
1. Introduction
With the recent developments in thermochemical conversion, the potential role of hydrochar as a functional resource in environmental remediation has grown, especially as scientists investigate the effect of various carbonization pathways on the reactivity of the [1]. In this group, Pressure-assisted carbonization (P-RC) and Microwave-assisted carbonization (M-RC) are two different methods that produce hydrochar with different structural and chemical properties [2]. The pressure reactor system provides slow, even heating under high-pressure conditions, which favors aromatization, dehydration, and mineral restructuring, while microwave-assisted carbonization has a volumetric effect, preserving oxygenated functional groups and creating more heterogeneous microstructures. Although there is increasing interest in both approaches, the mechanisms underlying the opposing effects of thermal environments on contaminant binding are not well understood. Understanding the processes by which each carbonization route controls surface chemistry, functional group evolution, and the interaction pathway is fundamental to the further development of hydrochar as a tunable material for environmental remediation. The growing generation of biomass waste is a challenge in both environmental and resource recovery perspectives of the circular economy [3,4].
Recently, thermochemical conversion processes, particularly hydrothermal carbonization, have been recognized as a promising method for converting wet or low-value biomass into hydrochar, a carbon-rich material with tunable physicochemical properties [2,5]. The HTC process is carried out in subcritical water and combines dehydration, decarboxylation, polymerization, and aromatization reactions to produce solids with a high content of oxygen-containing functional groups and embedded mineral phases [1,6]. The characteristics discussed here indicate that hydrochar is a potential functional material for environmental cleanup applications, where surface chemistry, microstructure, and mineralogy are important factors in controlling contaminant binding. Hydrochar has been widely studied for its ability to immobilize and/or remove aqueous pollutants through surface complexation, ion exchange, electrostatic attraction, and mineral-assisted interactions mechanism [7,8]. However, the efficiency of hydrochar use is significantly affected by the carbonization pathway used to produce it [9,10]. The distribution of functional groups, the degree of aromatization, the development of pores, and the stability of mineral phases can vary significantly with differences in heating rate, pressure, reaction uniformity, and energy distribution [11,12]. The differences in structure and chemistry ultimately determine the material’s response to contaminants.
Although hydrochar remediation has been extensively studied, the mechanistic understanding of various carbonization routes remains inadequate to enable the rational design of hydrochar with predictable performance [1,9]. The present study aims to explore the use of hydrochar generated using two different processing methods: pressure reactor carbonization and microwave-assisted carbonization, and to understand the role of surface chemistry and binding mechanisms in environmental remediation.
This study provides in-depth characterization and adsorption modeling results that enable mechanistic insights into the relationships among carbonization techniques, carbon structure (hydrochar), and contaminant interaction pathways. These findings pave the way for the use of hydrochar as a tunable, functional material for environmental use and for the overall valorization of biomass in sustainable resource management systems. Two different thermochemical environments are available: pressure carbonization and microwave carbonization, which yield hydrochar with different physicochemical properties. Heat transfer is slow and uniform (conduction and convection) at high pressures for pressure reactor systems, which can allow for controlled dehydration, aromatization, and structural densification [10,11]. This slow homogeneous heating environment is conducive to the formation of more condensed aromatic domains, increased thermal stability, and reorganization of the mineral phases to more crystalline or thermodynamically stable phases [12]. Consequently, the pressure-reactor hydrochar is typically more carbon-rich, less oxygen functional, and has a more ordered microstructure. Microwave-assisted carbonization (M-RC), on the other hand, is based on the rapid, volumetric heating that occurs when the biomass-water matrix interacts with the microwave radiation, which contains both polar molecules and ions [1,16,17]. This mechanism can result in high-temperature gradients, localized hot spots, and faster reaction rates, while preserving or even increasing oxygen-containing functional groups and creating more heterogeneous, less condensed carbon structures. The surface polarity, functional groups, and defect sites of microwave-derived hydrochar are usually higher than those of conventional hydrochar [9,13]. These features can increase surface complexation and other binding interactions but can also decrease thermal stability and structural uniformity. Despite these similarities, the two carbonization processes produce hydrochar with distinct surface chemistry, mineral content, and microstructural development, leading to different mechanisms of interaction with contaminants [14,15]. A quantitative comparison of these two carbonization attempts is thus critical for understanding the influence of processing parameters on hydrochar reactivity and for optimizing carbonization conditions for carbon materials tailored for environmental remediation [16,17].
With an increasing focus on resource valorization and environmental protection, the use of waste biomass to produce functional materials has gained relevance, particularly in the context of heavy metal contamination in water bodies [18,19,20]. Hydrochar, generated by hydrothermal carbonization (HTC), has the potential to be an efficient functional material with tunable surface chemistry and desirable physicochemical properties for contaminant removal from low-value biomass [1,2,9]. The growing volume of biomass waste poses an environmental challenge and an opportunity for resource recovery within the circular economy. Wet or low-value biomass can be efficiently converted to a carbon-rich solid, called hydrochar, with tunable physicochemical properties, via hydrothermal carbonization (HTC), providing a thermochemical pathway for biomass utilization. HTC is conducted in subcritical water, and the reaction can involve carbonization, hydrolysis, dehydration, and aromatization, which can occur concurrently to produce enriched materials containing oxygen-containing functional groups and embedded mineral phases [1,21]. Hydrochar is therefore particularly promising for environmental applications such as contaminant immobilization, soil amendment, and water treatment, owing to these features.
Hydrochar is currently a research interest in water treatment due to its low cost and its ability to bind heavy metal ions via surface complexation, ion exchange, electrostatic attraction, and interactions with mineral components [22,23]. The performance of this is strongly dependent on the condition of the HTC, the composition of the precursors, and post-treatment modifications, all of which affect the distribution of functional groups, pore structure, and surface charge [24]. Cu (II) is a particular concern among priority pollutants due to its high toxicity at high concentrations and its broad industrial applications. The development of hydrochar-based materials capable of efficiently removing Cu (II) aligns with global initiatives to valorize biomass and address water quality issues [25,26]. This study investigates the Cu (II) adsorption behavior of hydrochar derived from the Pressure Reactor and Microwave-Assisted Hydrothermal Carbonization, with a focus on elucidating the surface chemistry and binding mechanisms underlying metal uptake. These goals provide a mechanistic foundation for positioning hydrochar as a viable resource for heavy-metal remediation and support broader biomass valorization in sustainable resource-management systems.
2. Materials and Methods
The chemicals used in this study were of analytical grade. CuSO₄·5H₂O (Sigma-Aldrich) was dissolved in deionized water to produce a 1000 mg L⁻¹ copper (II) stock solution, which was then diluted to the desired concentrations. Biomass feedstock was collected, washed, and milled to a uniform particle size prior to hydrothermal carbonization.
2.1. Hydrothermal Carbonization and Hydrochar Preparation
2.1.1. Pressure-Reactor Carbonization (P-RC)
Hydrochar was produced by hydrothermal carbonization in a PTFE (polytetrafluo roethylene) (LABXSCI 100mL PTFE-lined hydrothermal synthesis reactor) [27]. The mixture was placed in the reactor and hydrothermally carbonized at 180 °C, 220 and 250 °C, which are the selected hydrothermal carbonization temperatures. Each reaction was carried out for 2 and 5 h under autogenous pressure. Once it was finished, the reactor was left to cool down to room temperature before being depressurized. The solid hydrochar was filtered, washed several times with deionized water to remove soluble byproducts, and then oven-dried to constant mass at 105 °C. The dried material was ground and sieved to <500 µm for subsequent characterization and adsorption experiments. Hydrochar produced at 180, 220, and 250 °C via pressure-reactor carbonization were labeled P-RC 180-2, P-RC 180-5, P-RC 220-2, P-RC 220-5, P-RC 250-2, and P-RC 250-5, respectively [2,28,29,30].
2.1.2. Microwave-Assisted Carbonization (M-RC)
M-RC hydrochar was produced using the Commercial Microwave Oven LB-10COM. The sample was irradiated by microwave for 30 minutes and 1 hour, and during this time, the internal temperature rose in accordance with the dielectric properties of the biomass-water matrix [31]. The hydrochar was filtered, cooled to room temperature, washed with Deionized (DI) water, and then dried at 105 °C. The dried hydrochar was then ground and sieved to <500 µm to be consistent with the P-RC samples. The microwave-assisted hydrochar was labeled M-RC 30 and M-RC 1. Samples were stored in sealed containers before characterization and adsorption studies [32,33].
2.2. Characterization of Hydrochar
The structural, chemical, and thermochemical properties of the hydrochar were analyzed using different analytical techniques. The functional groups were identified by FTIR spectroscopy [34]. X-ray Diffraction (XRD): Cu Kα radiation (λ = 1.5406 Å) was used to analyze the crystalline phases [34]. The surface morphology and elemental composition were analyzed by scanning electron microscopy with energy-dispersive spectroscopy (SEM–EDS) at an accelerating voltage of 10–15 kV. Thermogravimetric Analysis and Differential Thermogravimetric Analysis (TGA/DTG), which determines thermal stability and decomposition behavior, was measured under a N₂ atmosphere from 10 to 650 °C at a heating rate of 10 °C min−1 using a thermogravimetric analyzer. A powder X-ray diffractometer (Panalytical Xpert Pro MPD, copper or molybdenum light source, X’Celerator RTMS detectors) was used to determine the amorphous and crystalline structure of the hydrochar samples. An ICP5000 Dual View Inductively Coupled Plasma (ICP-OES) system manufactured by Agilent Technologies (USA) was used to determine the concentration of Cu 2+ remaining in solution [34]. These techniques provided supporting information on functional groups, mineral phases, microstructure, and thermal behavior, all of which are relevant to Cu (II) binding.
2.3. Batch Adsorption Experiments
Batch adsorption tests were conducted to evaluate the performance of Cu (II) removal. A fixed amount of hydrochar (0.05g) was added to 10 mL of Cu (II) solution at different concentrations (5–50 mg L-1) for each experiment. The suspensions were shaken in a temperature-controlled shaker at 70 rpm [35,36].
2.4. Point Zero Charge
The pH drift method [37] was used to find the point of zero charge (pHPZC) of hydrochar. 50 mL of 0.01 M NaCl solution was adjusted to initial pH values ranging from 2 to 12 with 0.1 M HCl or 0.1 M NaOH. Subsequently, 0.05 g of hydrochar was added to each solution, and then shaken for 24 h at room temperature at 150rpm. The pH at the end of the filtration was measured, and the difference between the initial and final pH (ΔpH = pH0 − pHf) was plotted against the initial pH. The pHPZC was obtained at the point where [38,39].
2.5. Effect of pH
2.6. Contact Time and Kinetics
2.7. Initial Concentration and Isotherms
2.8. Adsorption Modeling
Kinetic data were fitted to pseudo-first-order and pseudo-second-order models to determine the rate-controlling mechanism. Nonlinear Langmuir and Freundlich isotherm models were used to analyze isotherm data and quantify adsorption capacity and surface heterogeneity.
2.8.1. Adsorption Kinetics
The adsorption kinetics of the metals in the pressure reactor and microwave-assisted hydrochar were studied to understand the rate-controlling steps and to differentiate between surface-controlled and diffusion-controlled processes. A series of time-dependent adsorption experiments was conducted at the optimum pH (6.0), a fixed concentration of metal in solution, and a constant dosage of adsorbent. The pseudo-first-order, pseudo-second order, and intra-particle diffusion models were applied to the experimental data to assess the relative importance of external mass transfer, surface complexation, and pore diffusion in the overall adsorption process [47,48,49].
2.8.2. Pseudo-First-Order (Lagergren)
The pseudo-first-order model, originally proposed by Lagergren, assumes that the rate of occupation of adsorption sites is proportional to the number of unoccupied sites and is expressed as [50]:
where and (mg/g) are the adsorption capacities at equilibrium and at time , respectively and (min-1) is the pseudo-first-order rate constant.
2.8.3. Pseudo-Second-Order
2.8.4. Intraparticle Diffusion (IPD) Model – Weber–Morris
Checks whether pore diffusion limits the rate.
where (mg·g-1·min-1/2) is the intraparticle diffusion rate constant
(mg·g-1) reflects the boundary layer thickness.
Larger C = stronger boundary-layer effect
3. Results and Discussion
3.1. Thermal Analysis (TGA–DTG)
Figure 1, Figure 2, Figure 3 and Figure 4 present the thermal stability, decomposition pathways, and structural changes of hydrochar generated from both pressure reactor carbonization (P-RC) and microwave-assisted carbonization (M-RC). The multi-stage mass loss behaviour was observed for all samples, clearly distinguishing between the influence of the carbonization temperature, residence time, and the heating mode [28,53].
The thermogravimetric analysis (TGA) curves of hydrochar produced by pressure reactor carbonization (P-RC) at 180, 220, and 250 °C for 2 and 5 h and from microwave-assisted carbonization (M-RC) at 30 min and 1 h are shown in Figure 1 and Figure 2, respectively. The three-stage mass loss features typically observed with hydrothermal carbonization (HTC) were observed for all samples. The first stage concerns the evaporation of moisture and the evolution of light volatile compounds at temperatures below approximately 150–180 °C. The second stage is the major decomposition region, attributed to the breakdown of oxygenated functional groups, for the P-RC sample (200–400 °C). Degradation of carbon structures is aromatized and more recalcitrant, as reflected in the final stage above 400 °C in both carbonization methods. The overall mass loss was also found to be monotonic, decreasing with increasing carbonization severity (either higher temperature or longer residence time), while mass gain increased in the functional group decomposition zone. This trend suggests progressive aromatization, densification of the structure, and mineral stabilization within the hydrochar matrix, consistent with previous reports on the thermal behavior of hydrothermally carbonized materials [54,55].
The extent of the mass loss from the decomposition of the oxygenated functional groups was found to be strongly temperature dependent, with samples carbonized at 180 °C losing the most mass (consistent with abundant -OH, -COOH, and C-O), whereas samples carbonized at 250 °C lost significantly less mass (consistent with extensive dehydration, de-carboxylation, and aromatization) [56,57]. In this region, a longer residence time (5 h) further reduced mass loss, suggesting further stabilization of the carbon matrix. Degradation of recalcitrant carbon structures was slower at higher temperatures (>400 °C), which indicates greater aromatic condensation. The order of residual mass held by the samples was P RC 250 °C > P RC 220 °C > P RC 180 °C, with 5 h samples holding slightly more mass.
Figure 3 presents the DTG curves of P-RC samples, which show two main decomposition peaks. The DTG₁ peak, between about 180 and 250 °C, was identified as the decomposition of labile oxygenated groups and was found to be strongest at 180 °C, weaker at 220 °C, and weakest at 250 °C as the residence time decreased. Between 300 and 380 °C, the second peak (DTG₂) was related to the degradation of more condensed aromatic domains. As carbonization severity increased, this peak broadened and decreased in intensity, shifting to higher carbonization temperatures, indicating structural densification and the formation of a more thermally stable aromatic carbon network.
Figure 2 shows microwave-assisted hydrochar (30 min and 1 h), which exhibits the same overall three-stage mass loss but with unique characteristics arising from rapid volumetric microwave heating. The loss of moisture below 150 °C was slightly higher for the 30 min sample, indicative of a more polar surface and less severe dehydration. For both microwave samples, the amount of oxygenated functionality remained higher than for the P-RC samples in the 200–350 °C range, with the 30 min microwave sample showing the greatest mass loss and the 1 h microwave sample the least. Mild stabilization was seen with increased microwave exposure time in this range. The microwave sample degraded more rapidly than P-RC hydrochar above 400 °C, suggesting lower aromatic condensation and thermal stability. The residual masses of all the samples from the pressure reactors were higher than those of their counterparts [58].
Two decomposition peaks were also observed in the DTG profiles of M-RC samples [Figure 4] at the positions mentioned earlier but were less pronounced than in the case of P-RC materials. The first peak (DTG₁) was between 250 and 310 °C and was the strongest in the 30 min sample, indicating that oxygenated groups were well preserved, whereas the intensity decreased in the 1 h sample, suggesting that some oxygenated groups were partially condensed after the longer microwave exposure. The 1 h sample showed a wider and slightly shifted second DTG₂ peak (330–380 °C) due to early development of aromatic structures, while the 30 min sample had a narrow DTG₂ peak at 350–360 °C, suggesting a less condensed carbon matrix.
3.2. SEM–EDS Analysis of Hydrochar P-RC and M-RC Before and After Cu (II) Adsorption
To understand the structural features important for Cu²⁺ adsorption, the surface morphology and elemental composition of the Pressure-reactor carbonized and Microwave-assisted carbonized hydrochar were analyzed by SEM–EDS. Micrographs and EDS spectra of the pristine and post-adsorption surfaces of P-RC 180-2, 180-5, 220-2, 220-5, 250-2, 250-5, and M-RC 30 and M-RC 1 are shown in Figure 5, Figure 6, Figure 7, Figure 8, Figure 9, Figure 10 and Figure 11.
Figure 5.
a. Pristine SEM-EDS of P-RC 180-2.
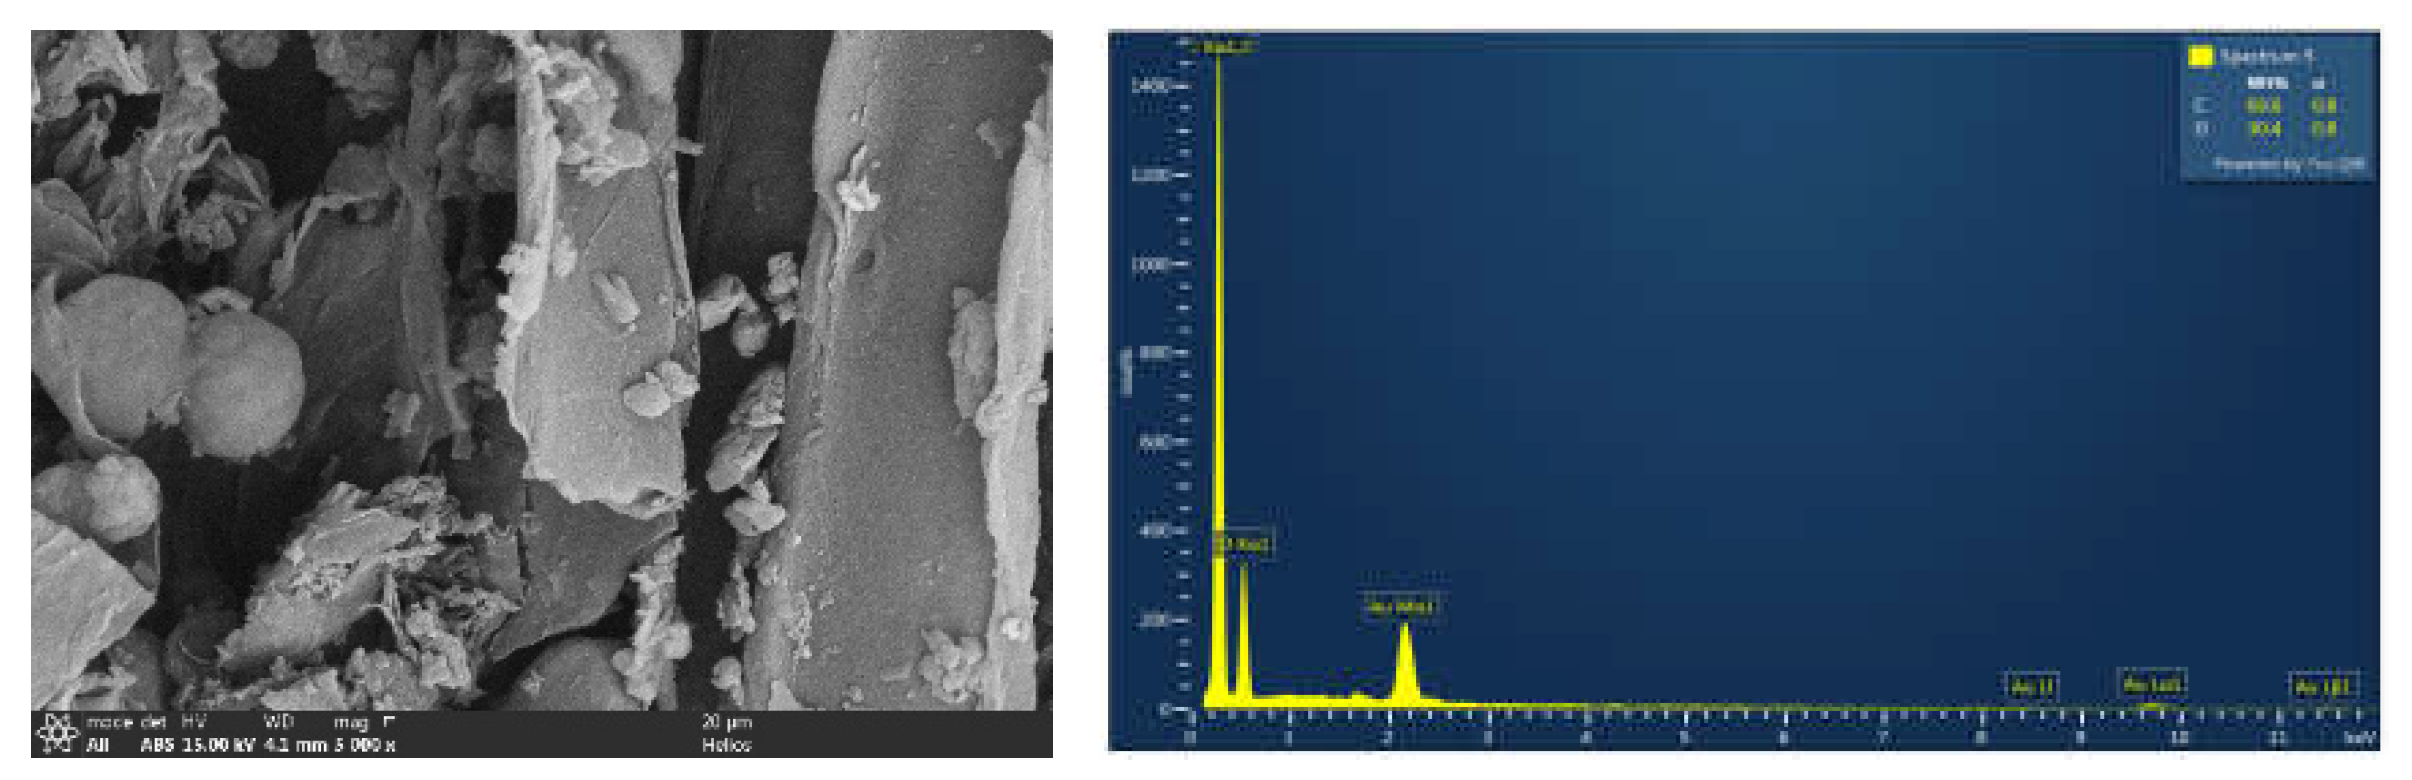
Figure 5.
b. SEM-EDS of P-RC 180-2 After adsorption.
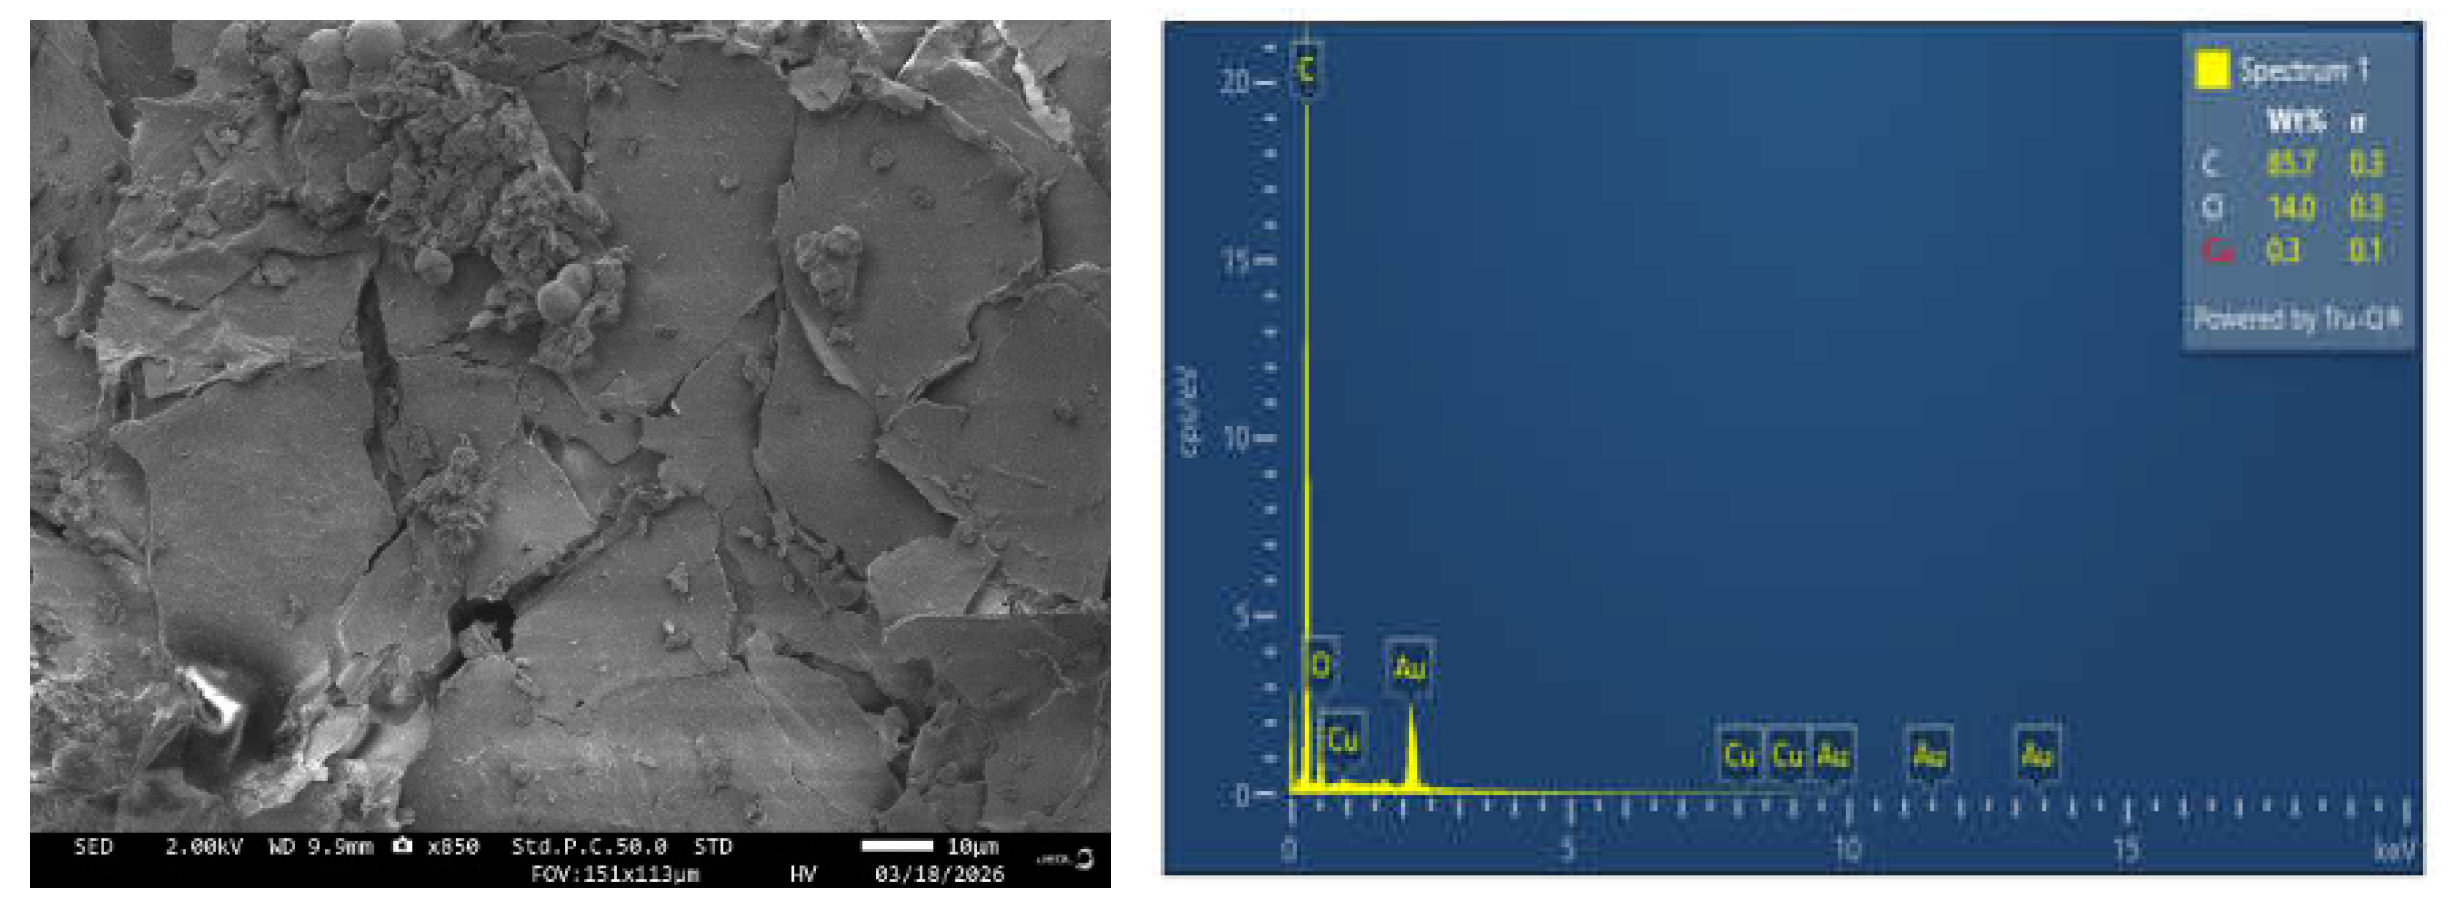
Figure 6.
a. Pristine SEM-EDS of P-RC 180-5.
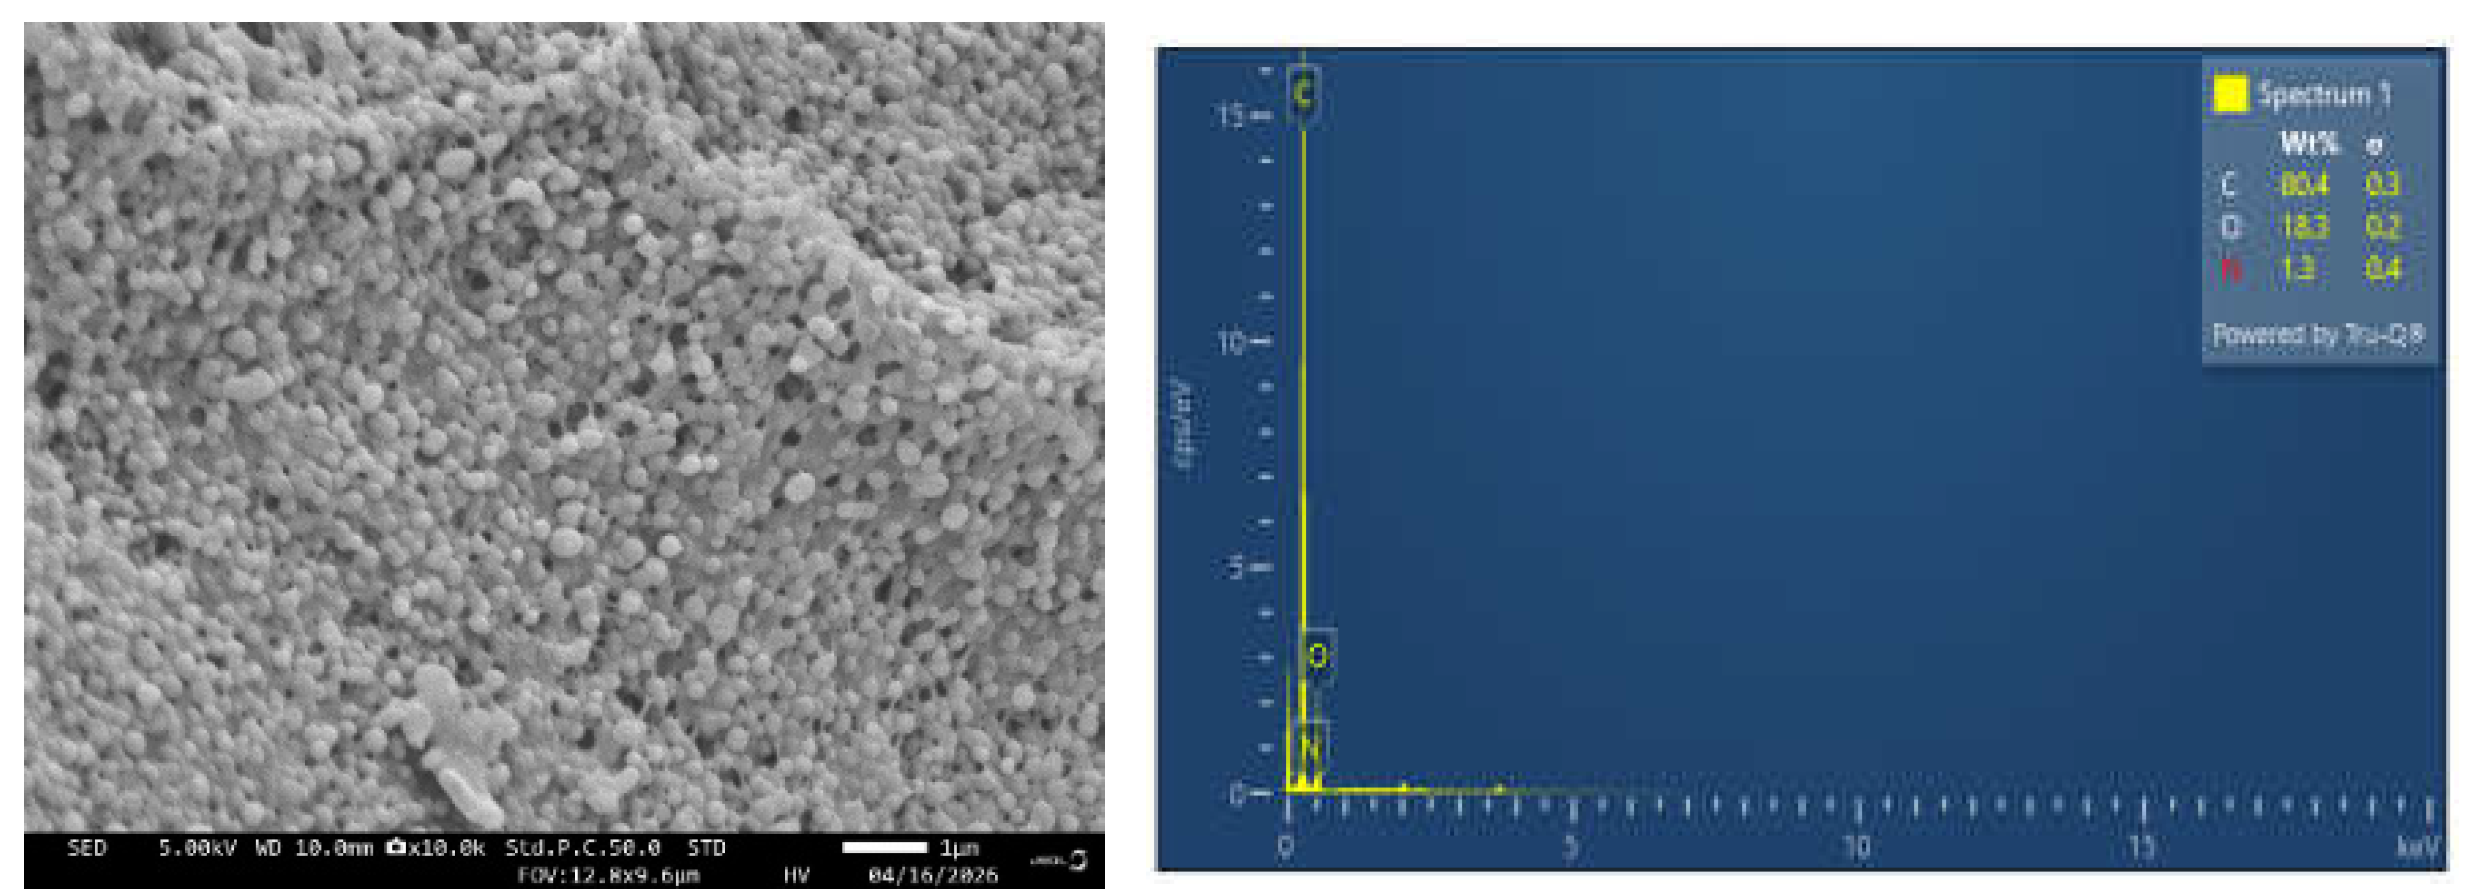
Figure 6.
b. SEM-EDS of P-RC 180-5 After adsorption.
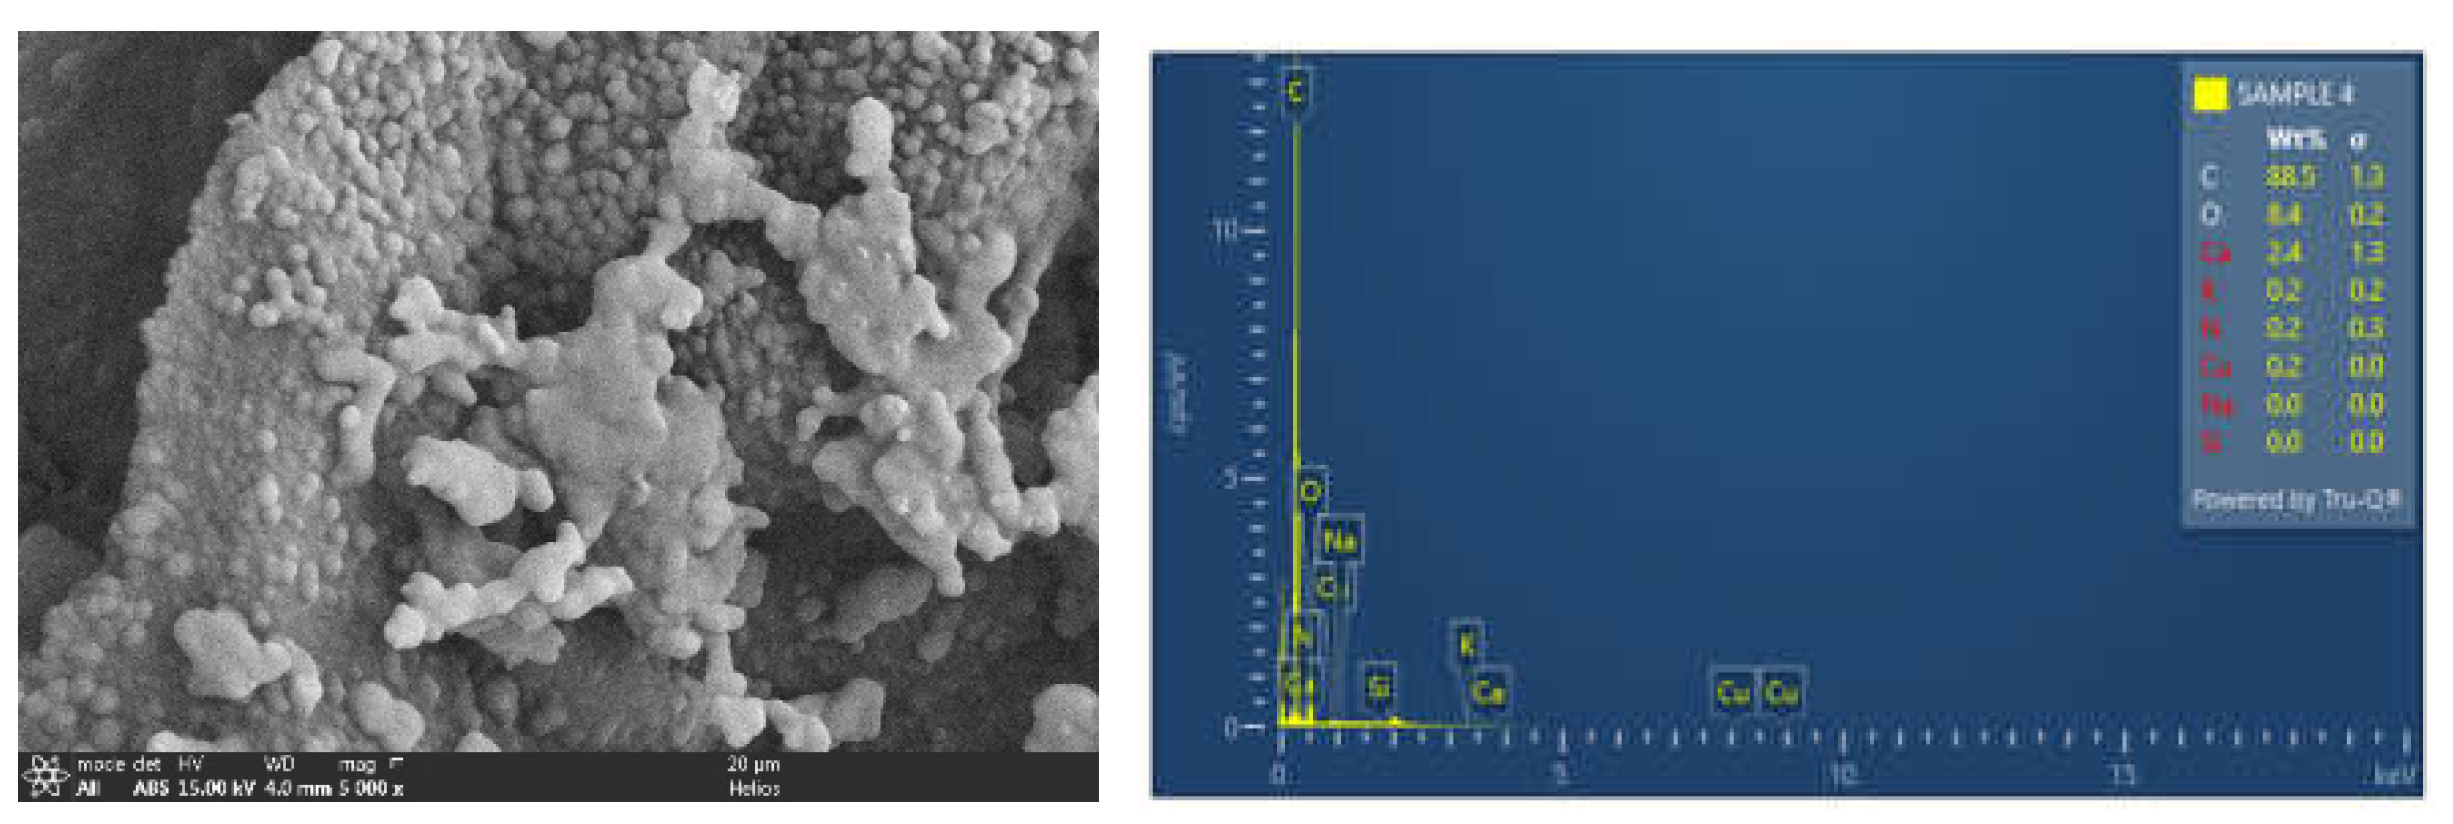
Figure 7.
a. Pristine SEM-EDS of P-RC 220-2.
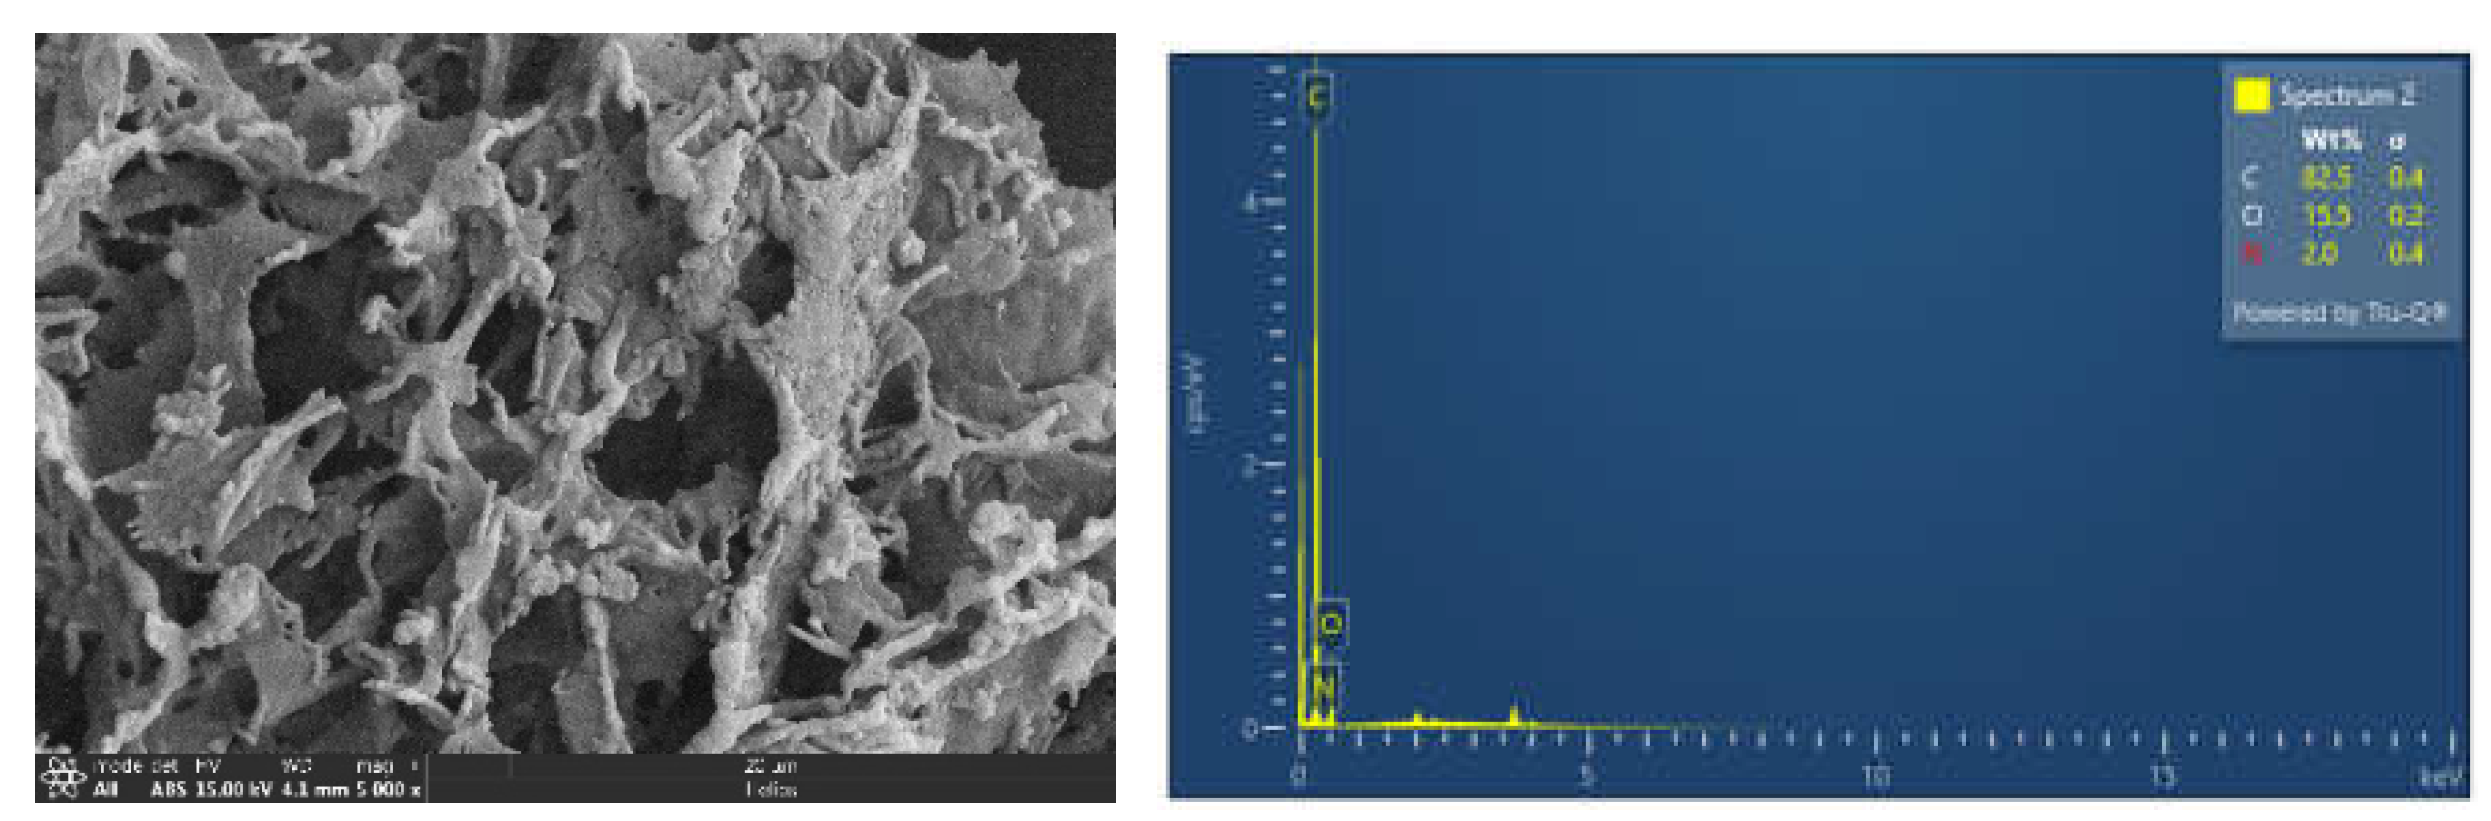
Figure 7.
b. SEM-EDS of P-RC 220-2 After adsorption.
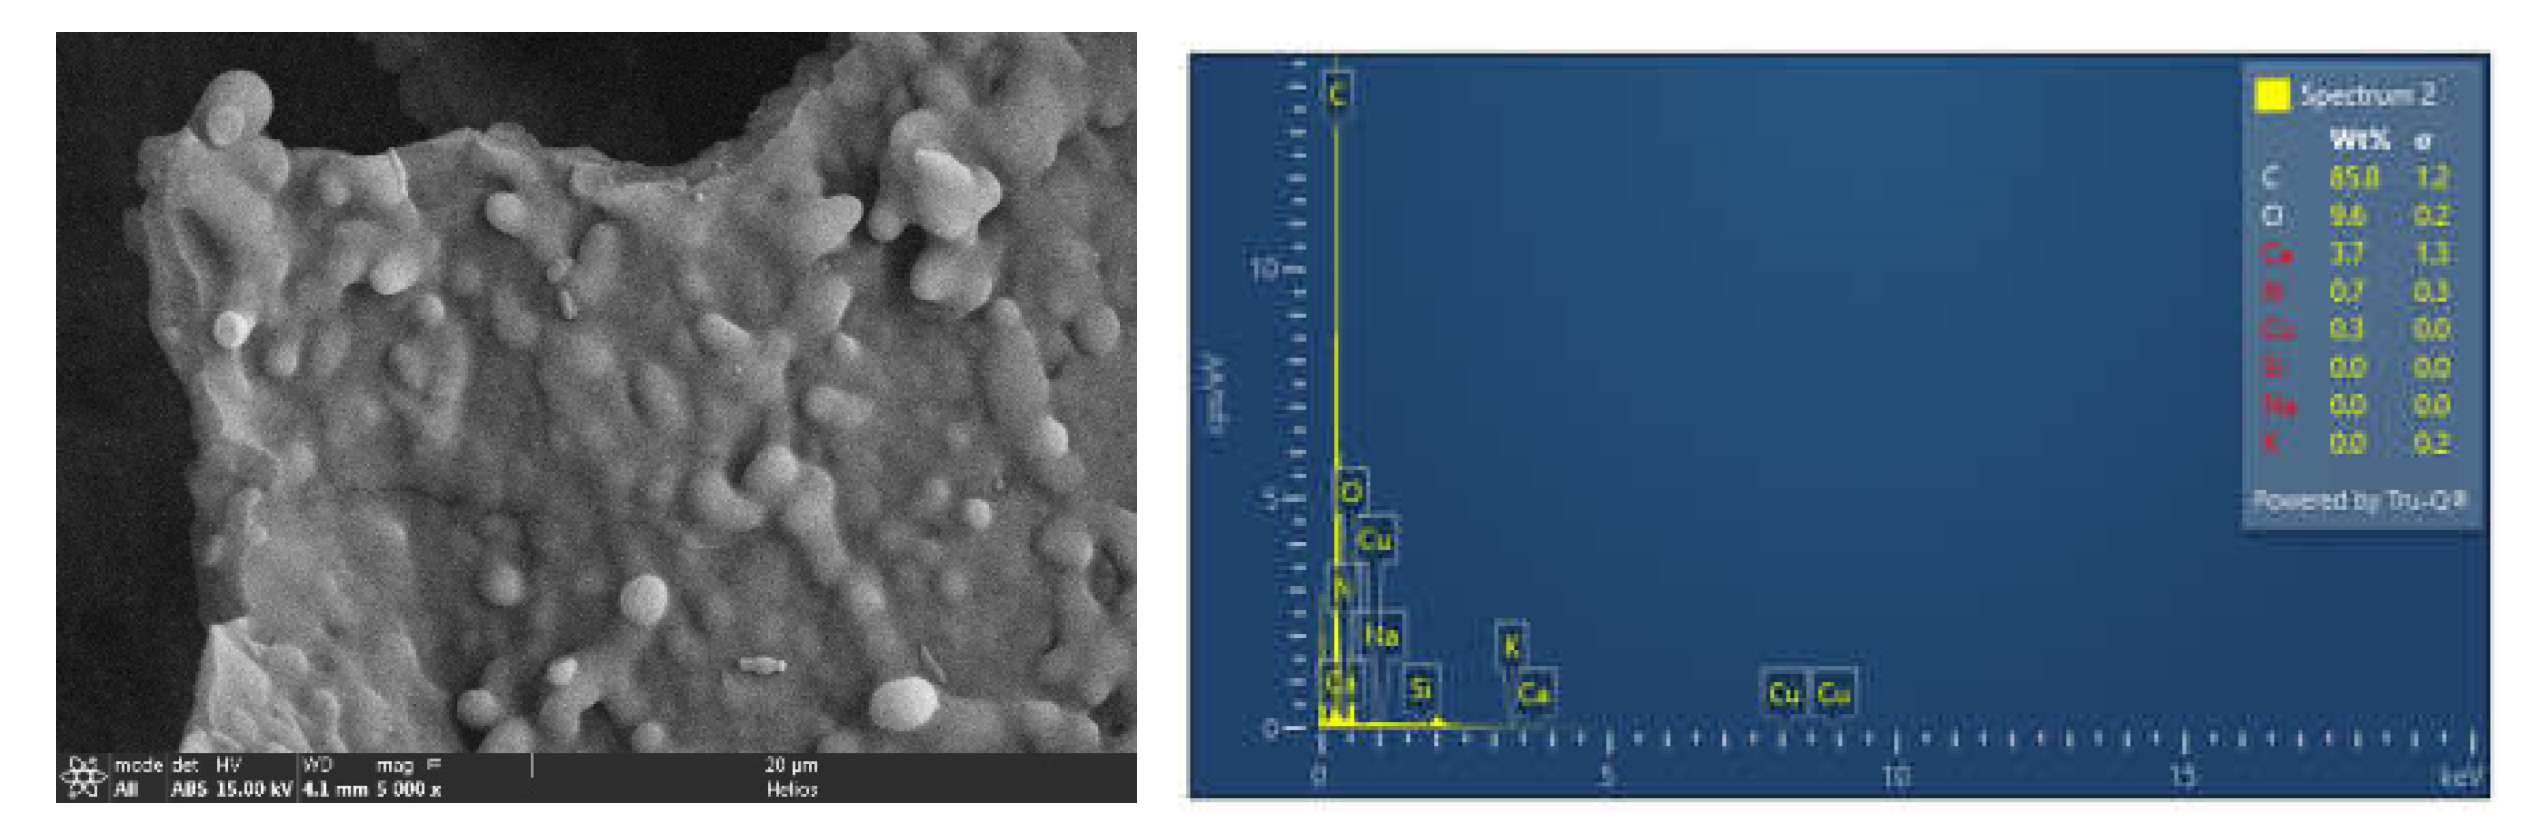
Figure 8.
a. Pristine SEM-EDS of P-RC 220-5.
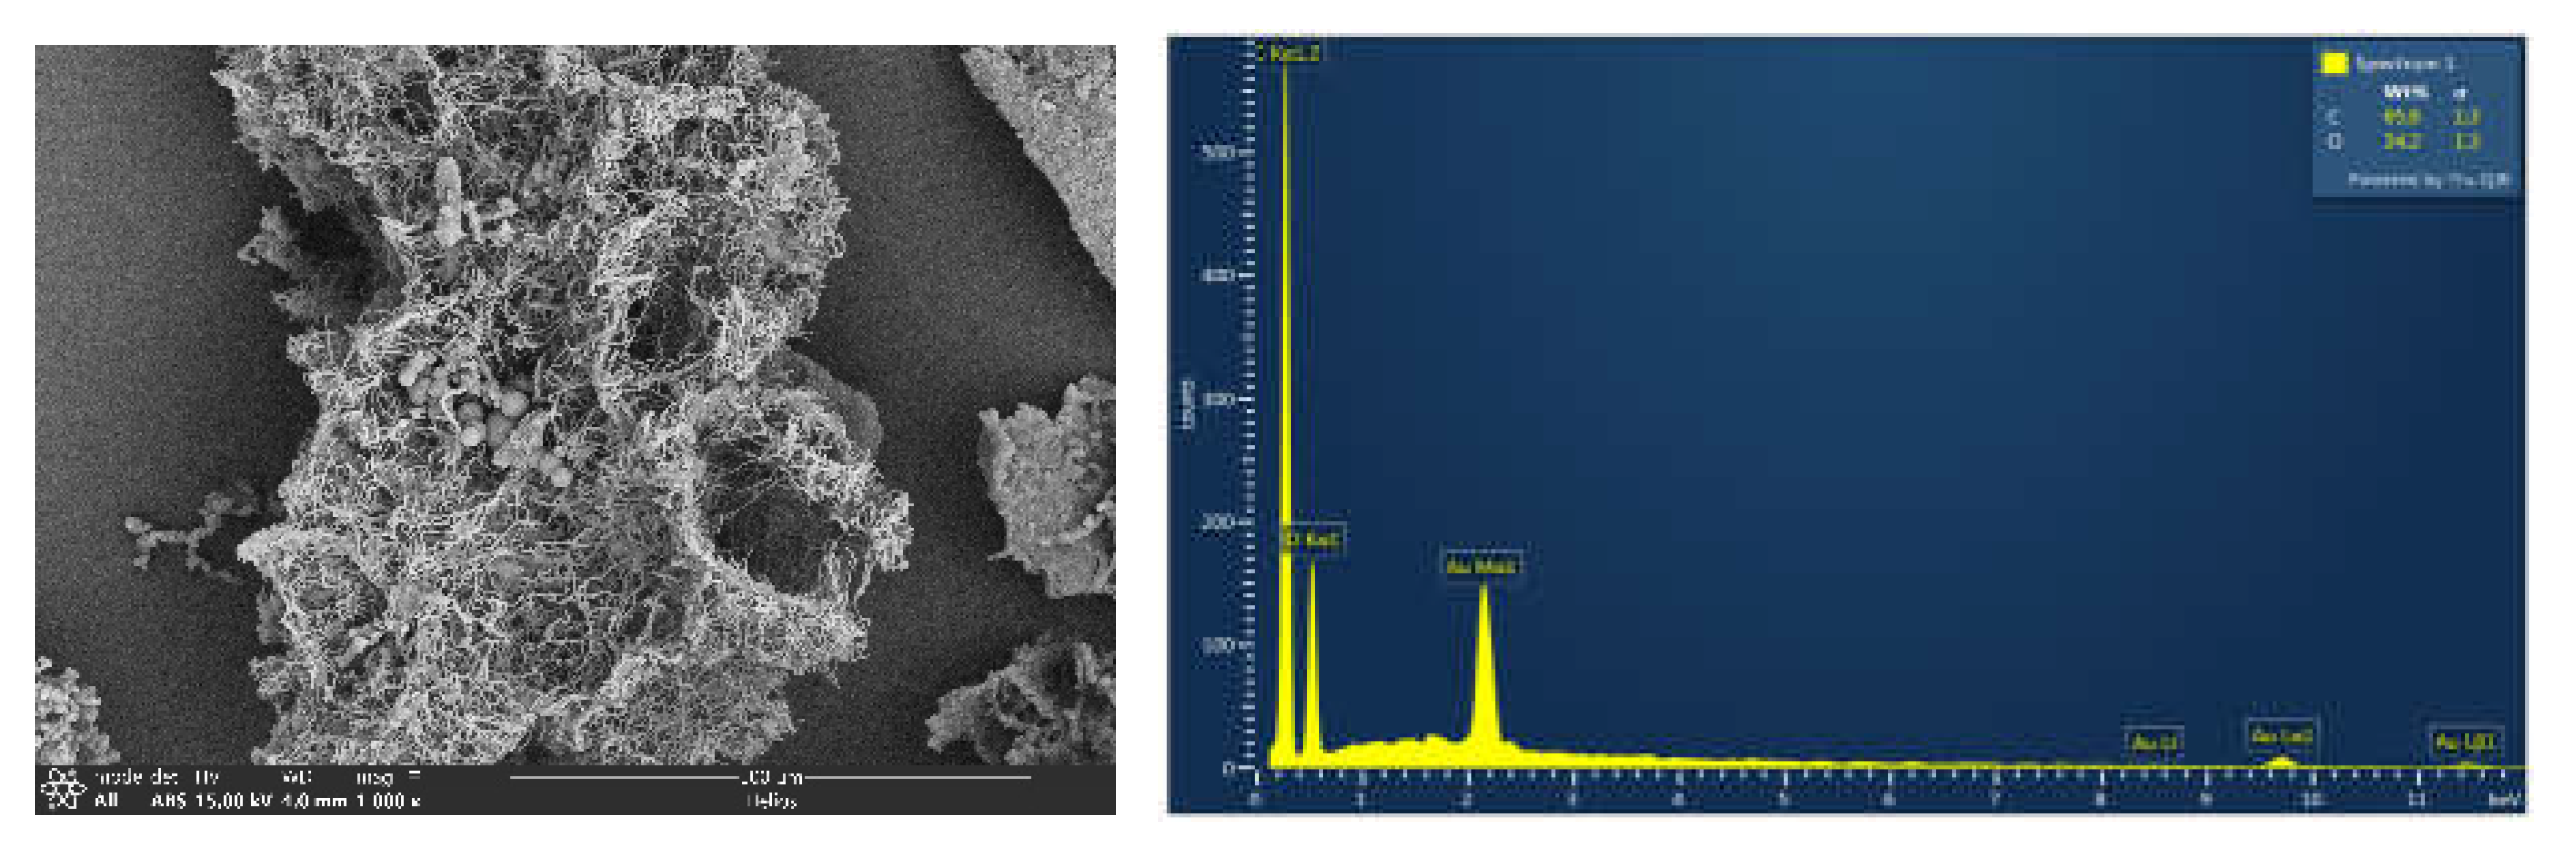
Figure 8.
b. SEM-EDS of P-RC 220-5 After adsorption.
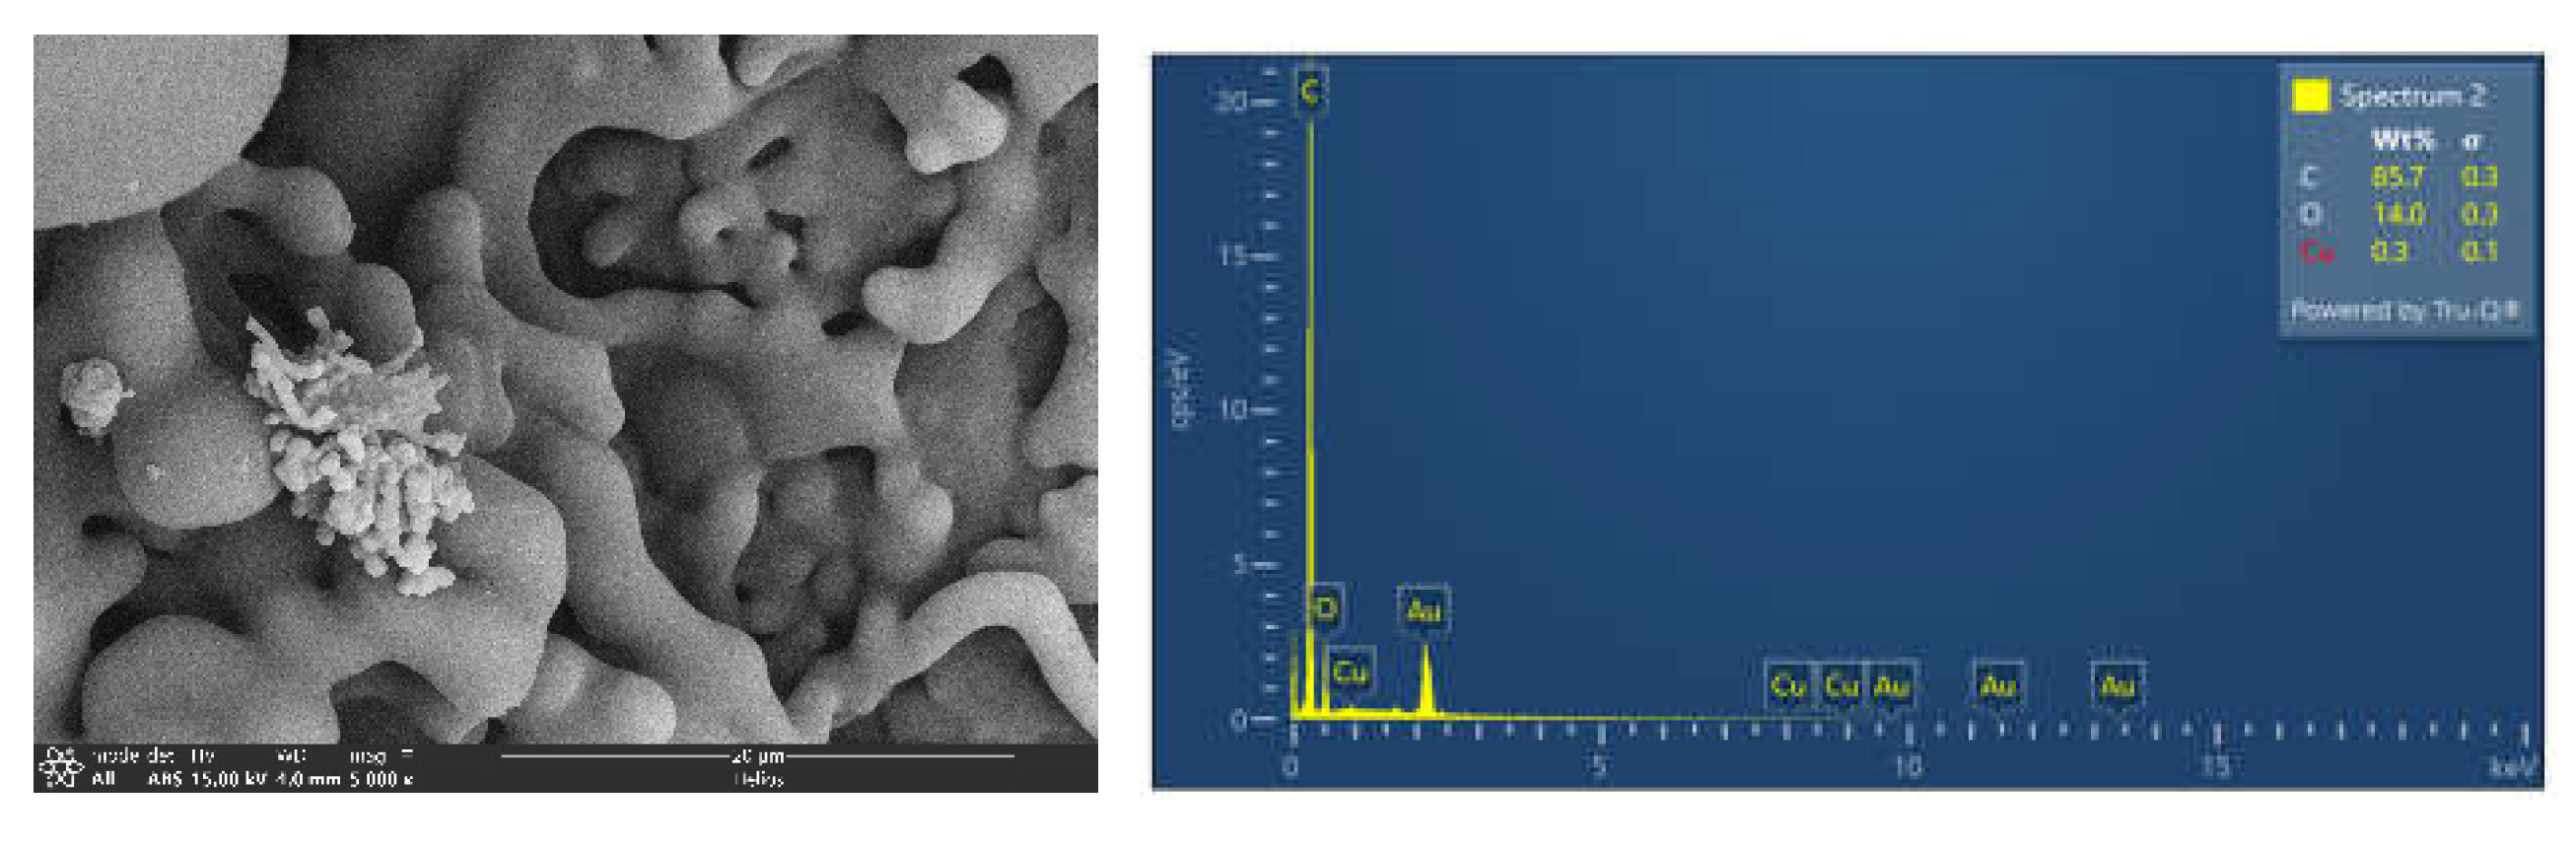
Figure 9.
a. Pristine SEM-EDS of P-RC 250-2.
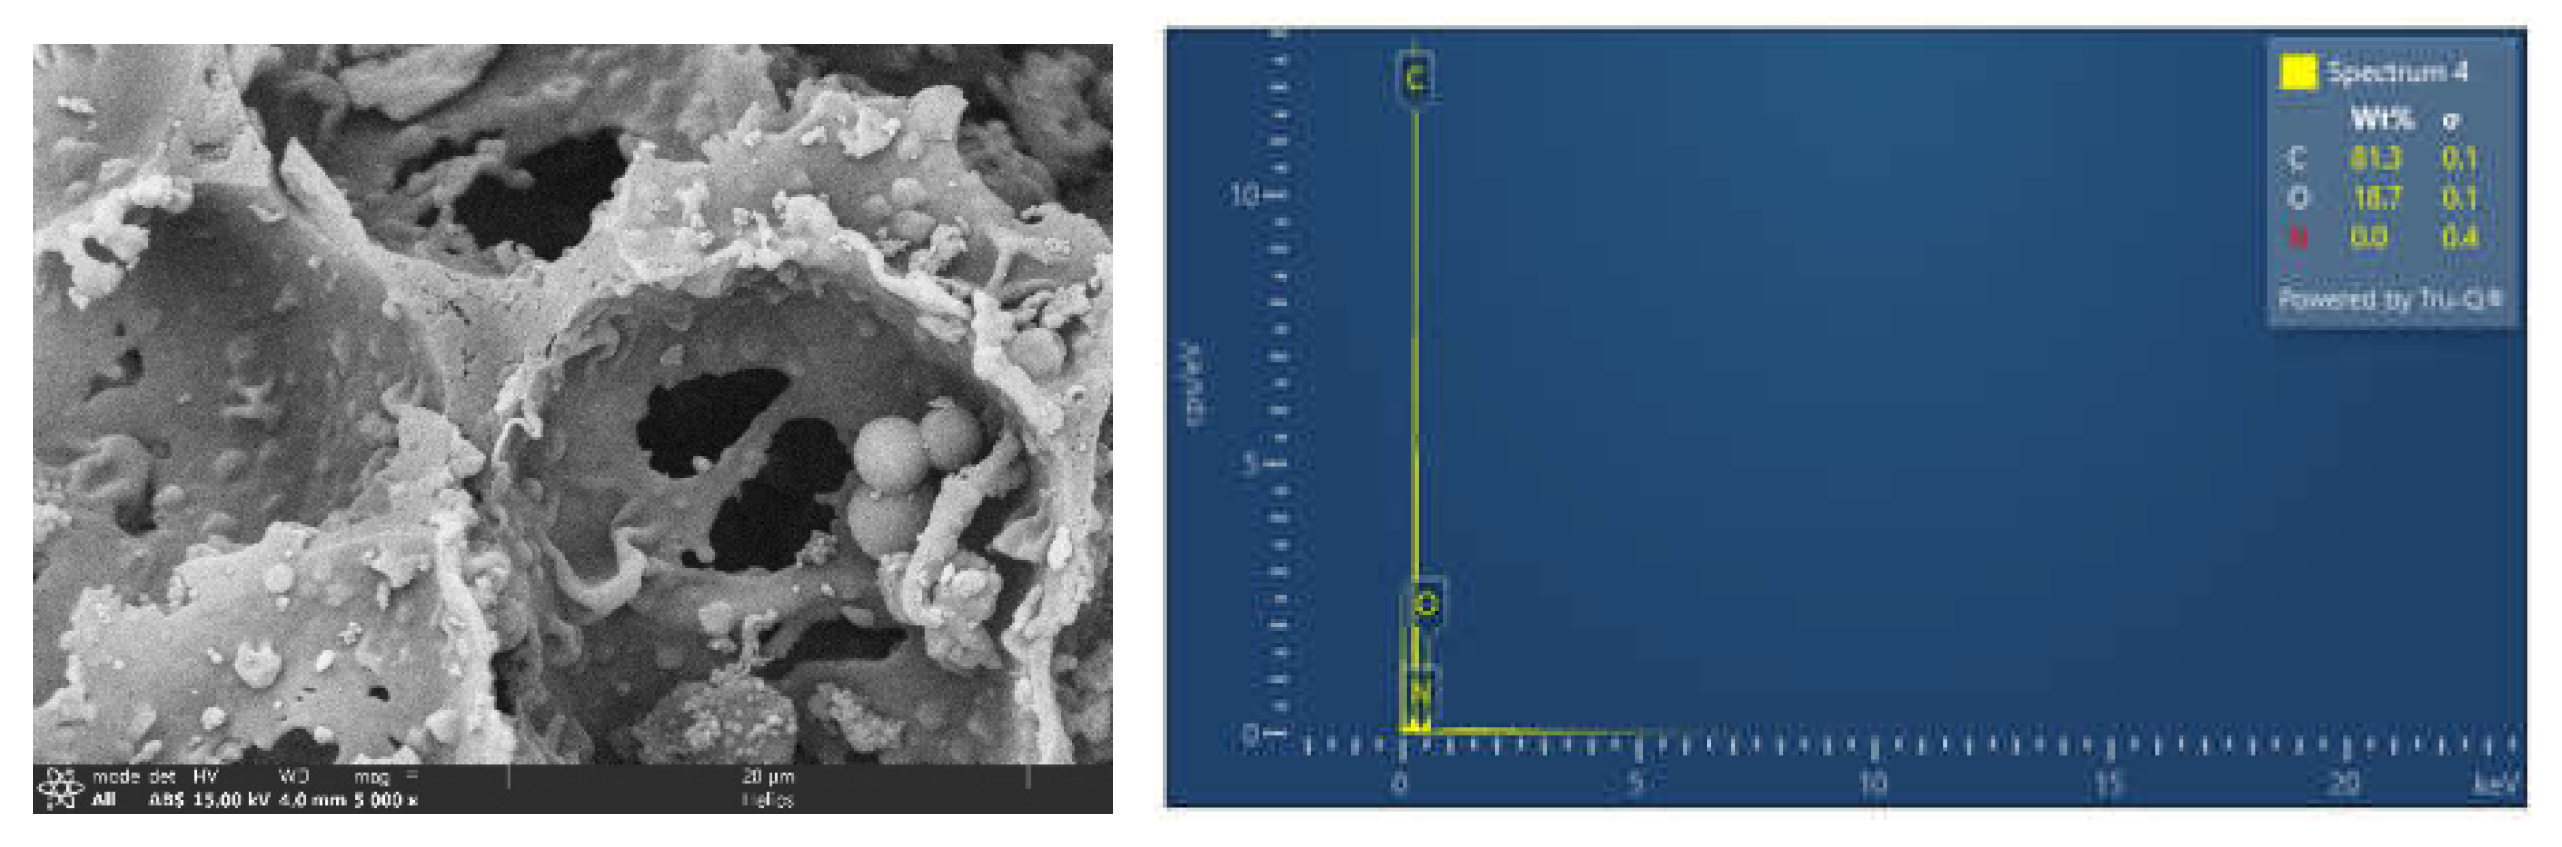
Figure 9.
b. SEM-EDS of P-RC 250-2 After adsorption.
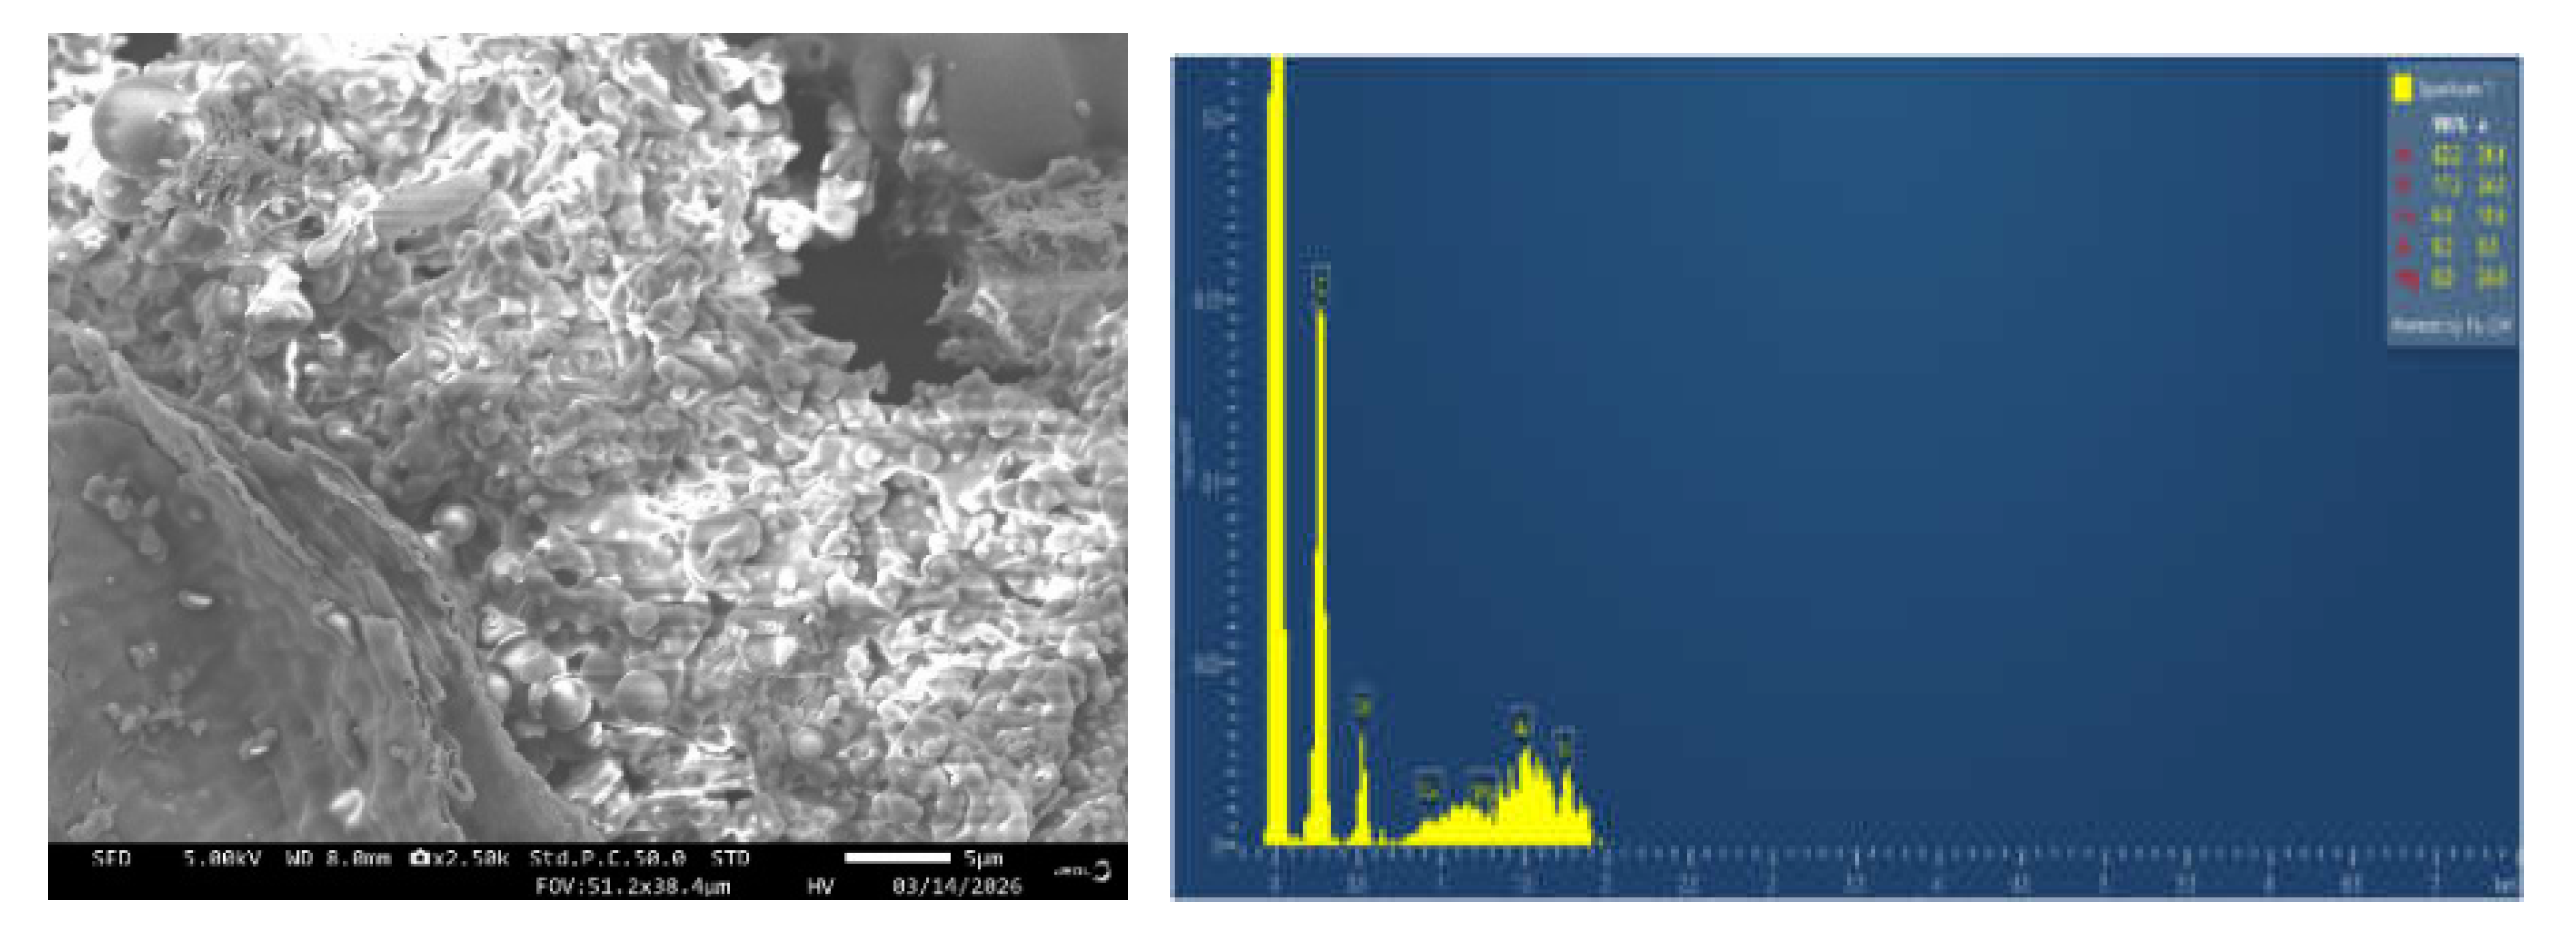
Figure 10.
a. Pristine SEM-EDS of P-RC 250-5.
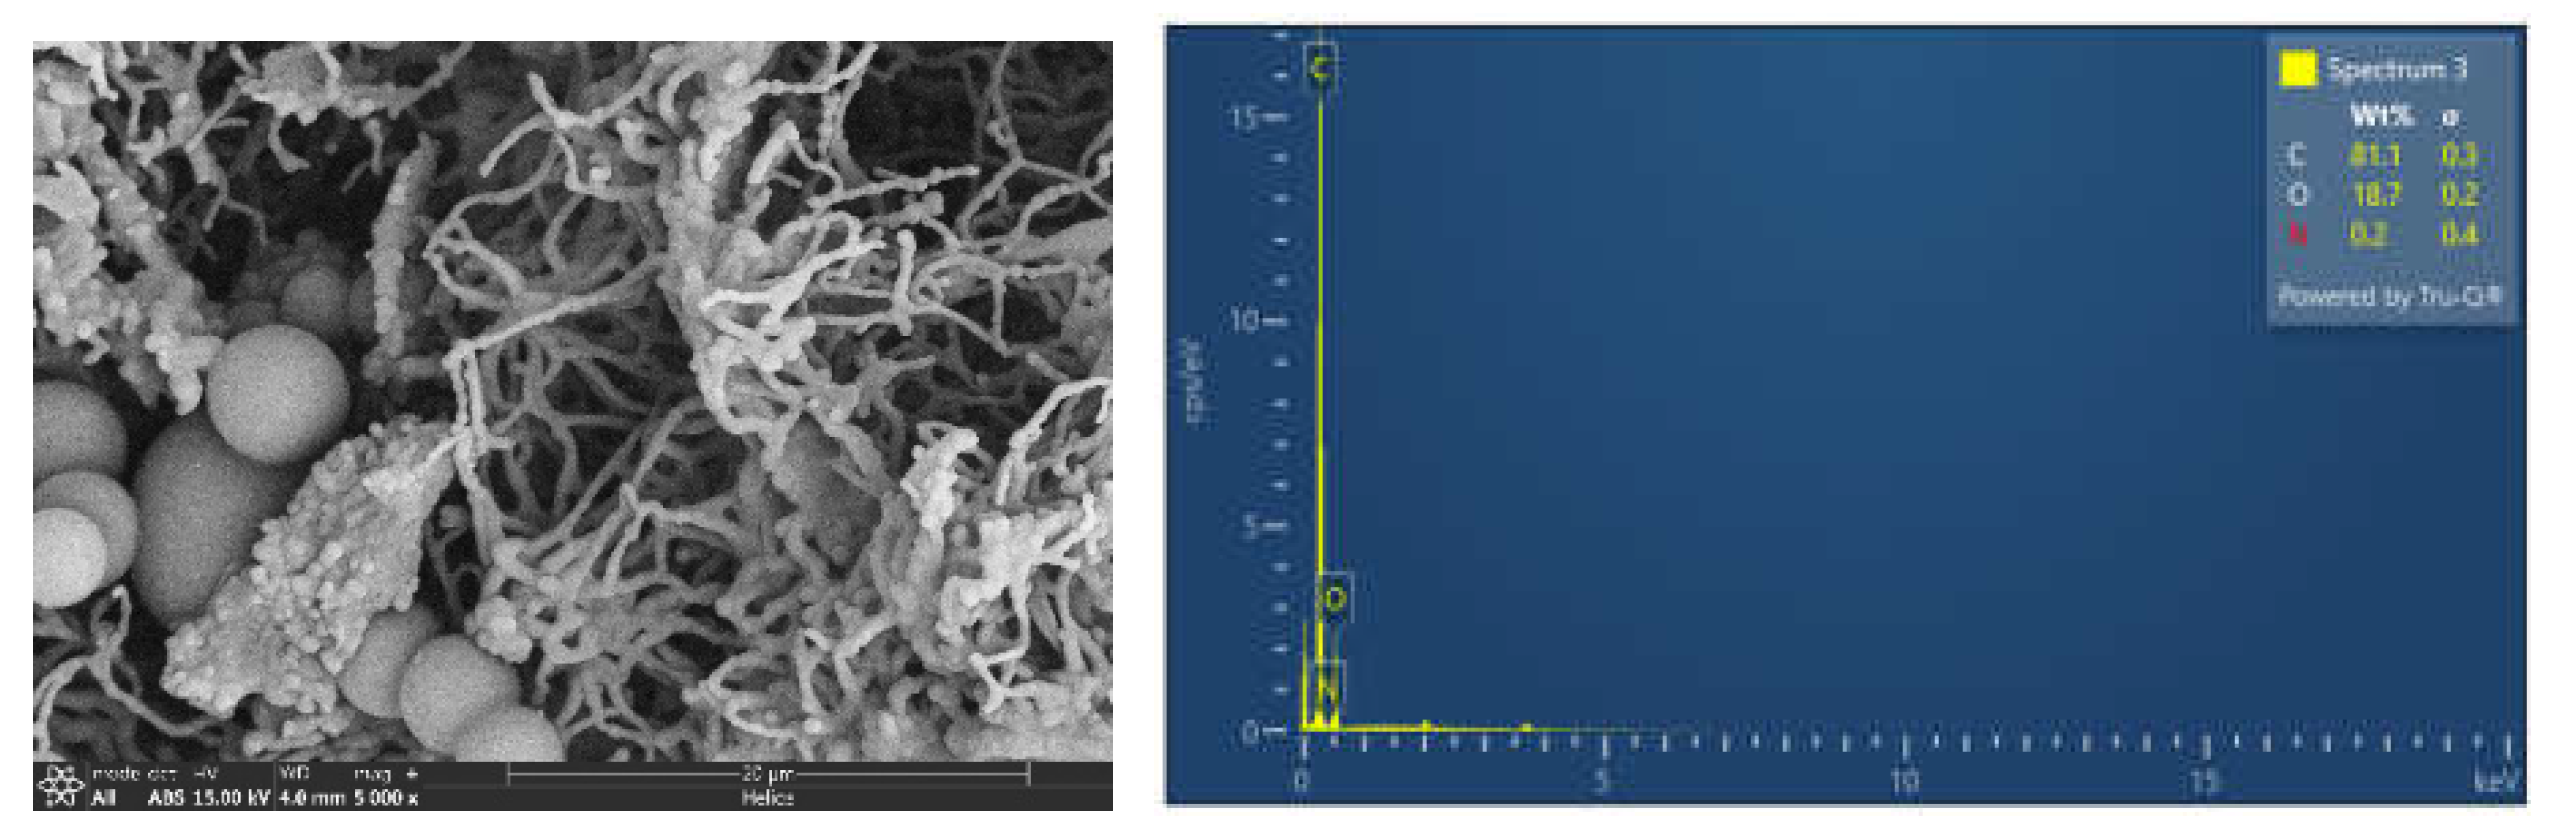
Figure 10.
b. SEM-EDS of P-RC 250-5 After adsorption.
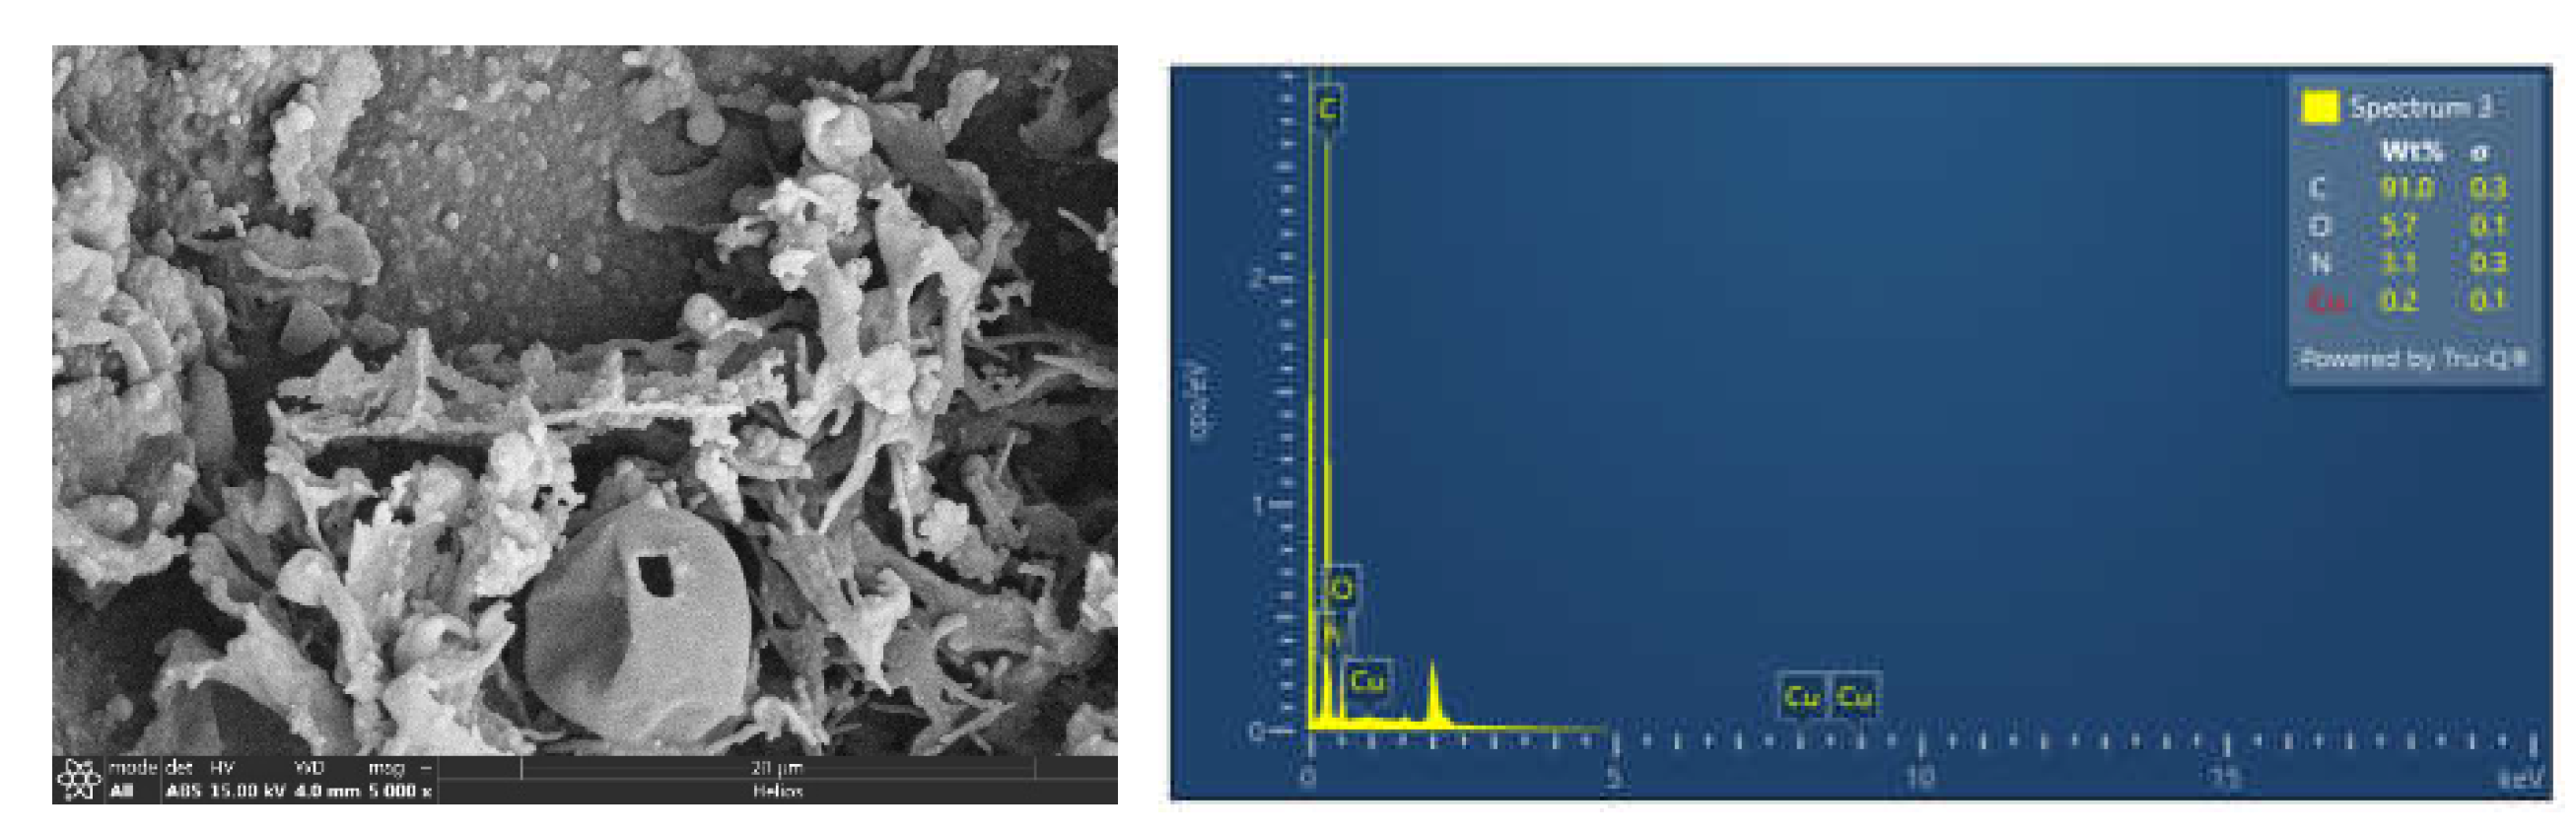
Figure 11.
a. Pristine of M-RC 30 minutes.
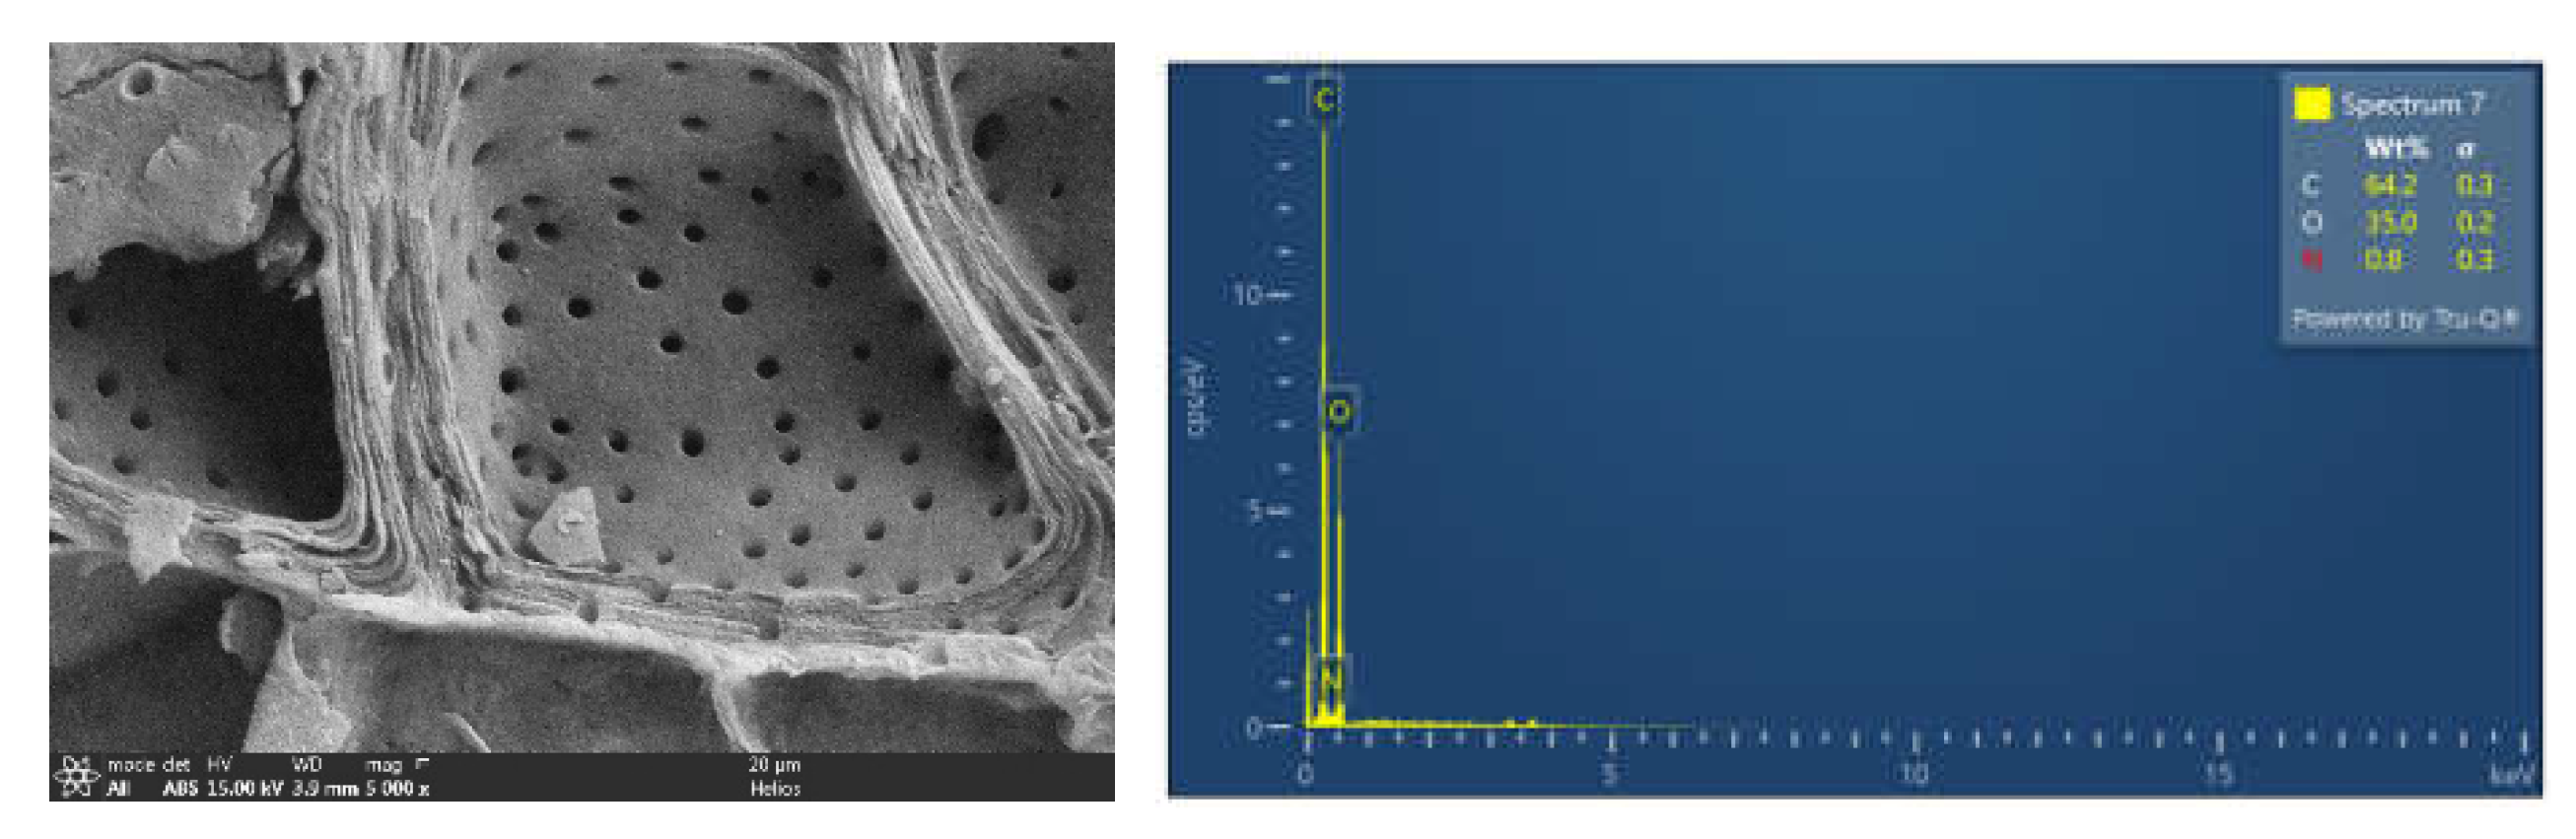
Figure 11.
b. SEM-EDS of M-RC 30 minutes after adsorption.
3.2.1. Morphology of Pristine Hydrochar
The microstructure of the pristine hydrochar is well known to be heterogeneous, and this feature is observed in all carbonization conditions [9,59,60]. The surface at lower severity, Figure 5a and Figure 6a (P-RC 180-2 and 180-5), showed loosely aggregated carbonaceous fragments, shallow pores, and irregular flake-like domains. These features suggest that aromatization is incomplete and that oxygen-rich functional groups are retained, which agrees with the FTIR and TGA results [61,62]. The morphology evolved toward more compact, fused structures as the severity of carbonization increased, as shown in Figure 7a and Figure 8a (P-RC 220-2 and 220-5), with less surface debris and more defined pore boundaries. The P-RC 250-2 and 250-5 (Figure 9a and Figure 10a) samples showed the greatest structural consolidation, with smoother carbon matrices, spherical carbon microspheres, and partially collapsed pore networks. The changes are due to progressive dehydration, aromatization, and structural densification as the temperature and residence time increase.
C and O were the major elements in the EDS spectra of all the pristine samples, indicating the biomass origin and the presence of mineral inclusions, with low N concentrations and trace amounts of inorganic elements such as Na, Si, K, and Ca. No Cu was detected in any of the pristine samples, indicating that there was no metal contamination prior to adsorption.
3.2.2. Morphological Changes After Cu²⁺ Adsorption
All post-adsorption SEM images revealed clear morphological changes indicative of Cu²⁺ uptake [63,64,65]. The surfaces appeared more compact, with pores partially obstructed; the surfaces were roughened, and granular or flake-like deposits were visible. The pore structures in these areas were more open, allowing deeper penetration of Cu2+ into the pore network, particularly in Figure 5b and Figure 6b (P-RC 180-2 and 180-5). For intermediate-severity samples, Figure 7b and Figure 8b (P-RC 220-2 and 220-5), the post-adsorption surfaces exhibited partial pore filling and the development of small, bright particulates characteristic of metal-laden surface complexes. These metal clusters were found in the samples, Figure 9b and Figure 10b (P-RC 250-2 and P-RC 250-5), where they were often spherical or irregular, indicating that high levels of aromatization in hydrochar did not significantly reduce the number of functional groups or mineral sites available for metal binding [66,67]. The morphological changes support the kinetic results, which suggest that the adsorption process is multi-stage and involves film diffusion and intraparticle diffusion [68,69].
3.2.3. Elemental Signatures of Cu²⁺ Uptake (EDS)
The adsorption of Cu²⁺ was verified by EDS analysis across all the samples. Pristine hydrochar showed a typical C, O, N, and trace minerals spectrum, while the post adsorption spectrum presented a typical Cu peak, but in low weight percentage (0.2–0.3 wt%). This is not surprising, given that the mass fraction of Cu adsorbed in the matrix is small. The presence of Cu was accompanied by a subtle change in O content, indicating the role of O-containing functional groups (such as carboxyl, hydroxyl, and carbonyl) in metal binding [70,71]. Some of the samples (e.g., PR-C 250-2 and 250-5) showed Na, Si, K, and Ca in their EDS spectra, indicating that other mineral phases may also be involved in ion exchange or surface complexation. The mechanism predominantly involves inner-sphere complexation, carboxylate coordination, and pore-associated deposition, as supported by Cu detection, O/C ratio variation, and morphology.
In general, the SEM–EDS analysis provides visual and compositional evidence that the adsorption of Cu²⁺ on hydrochar from the pressure reactors involves adsorption on the hydrochar surfaces, surface complexation, pore filling, and mineral–associated interactions, with adsorption capacity dependent on the degree of carbonization.
3.2.4. SEM–EDS Analysis of Microwave-Assisted Hydrochar (M-RC).
3.2.4.1. Morphology and Composition of Pristine M-RC (30 min and 1 h).
The pristine M-RC hydrochar exhibited heterogeneous, partially preserved plant-based structures, with obvious evidence of rapid, volumetric heating. The SEM image of M-RC (Figure 11a) reveals a highly porous surface, characterized by cavities and channels, as well as numerous pits. This morphology indicates incomplete destruction of the original cell wall structure and the formation of diffusion paths suitable for liquid–solid contact [72]. The EDS spectrum shows C as the main component, with significant O and small N, suggesting a carbonaceous matrix rich in oxygenated functional groups that can sequester metals [73].
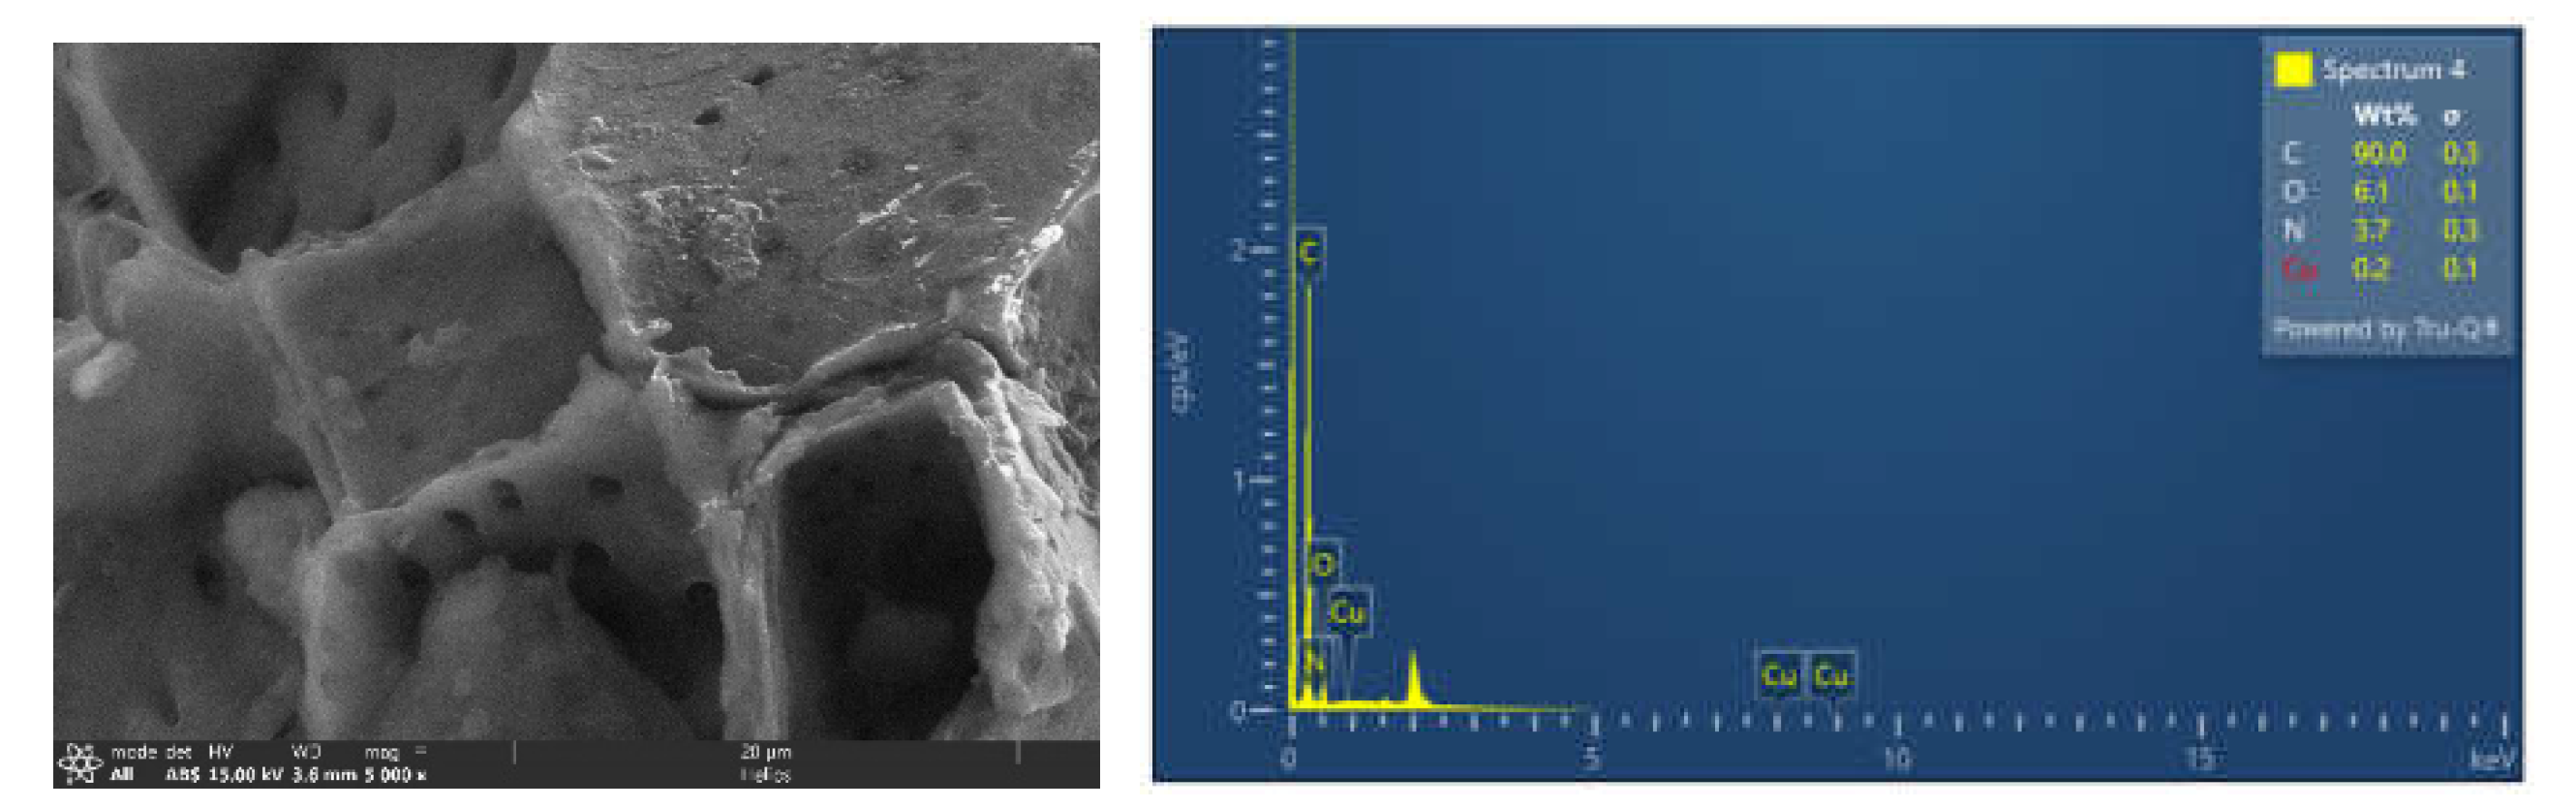
The 1-hour M-RC sample (Figure 12a) shows a more broken-up, fibrous, layered structure with broken lamellae and compacted flake-like domains. The shift from pit-rich walls (30 min) to more collapsed and intertwined fragments (1 h) indicates progressive dehydration, aromatization, and structural densification during extended exposure to microwaves. Again, there is a strong presence of C, with high O and low N content, which is indicative of a partially oxidized C-based framework with polar surface functionalities. The presence of carboxyl, hydroxyl, and carbonyl groups, as inferred from FTIR, is supported by a higher amount of O in both pristine M-RC samples.
Figure 12.
a. Pristine SEM-EDS of M-RC 1 hour.
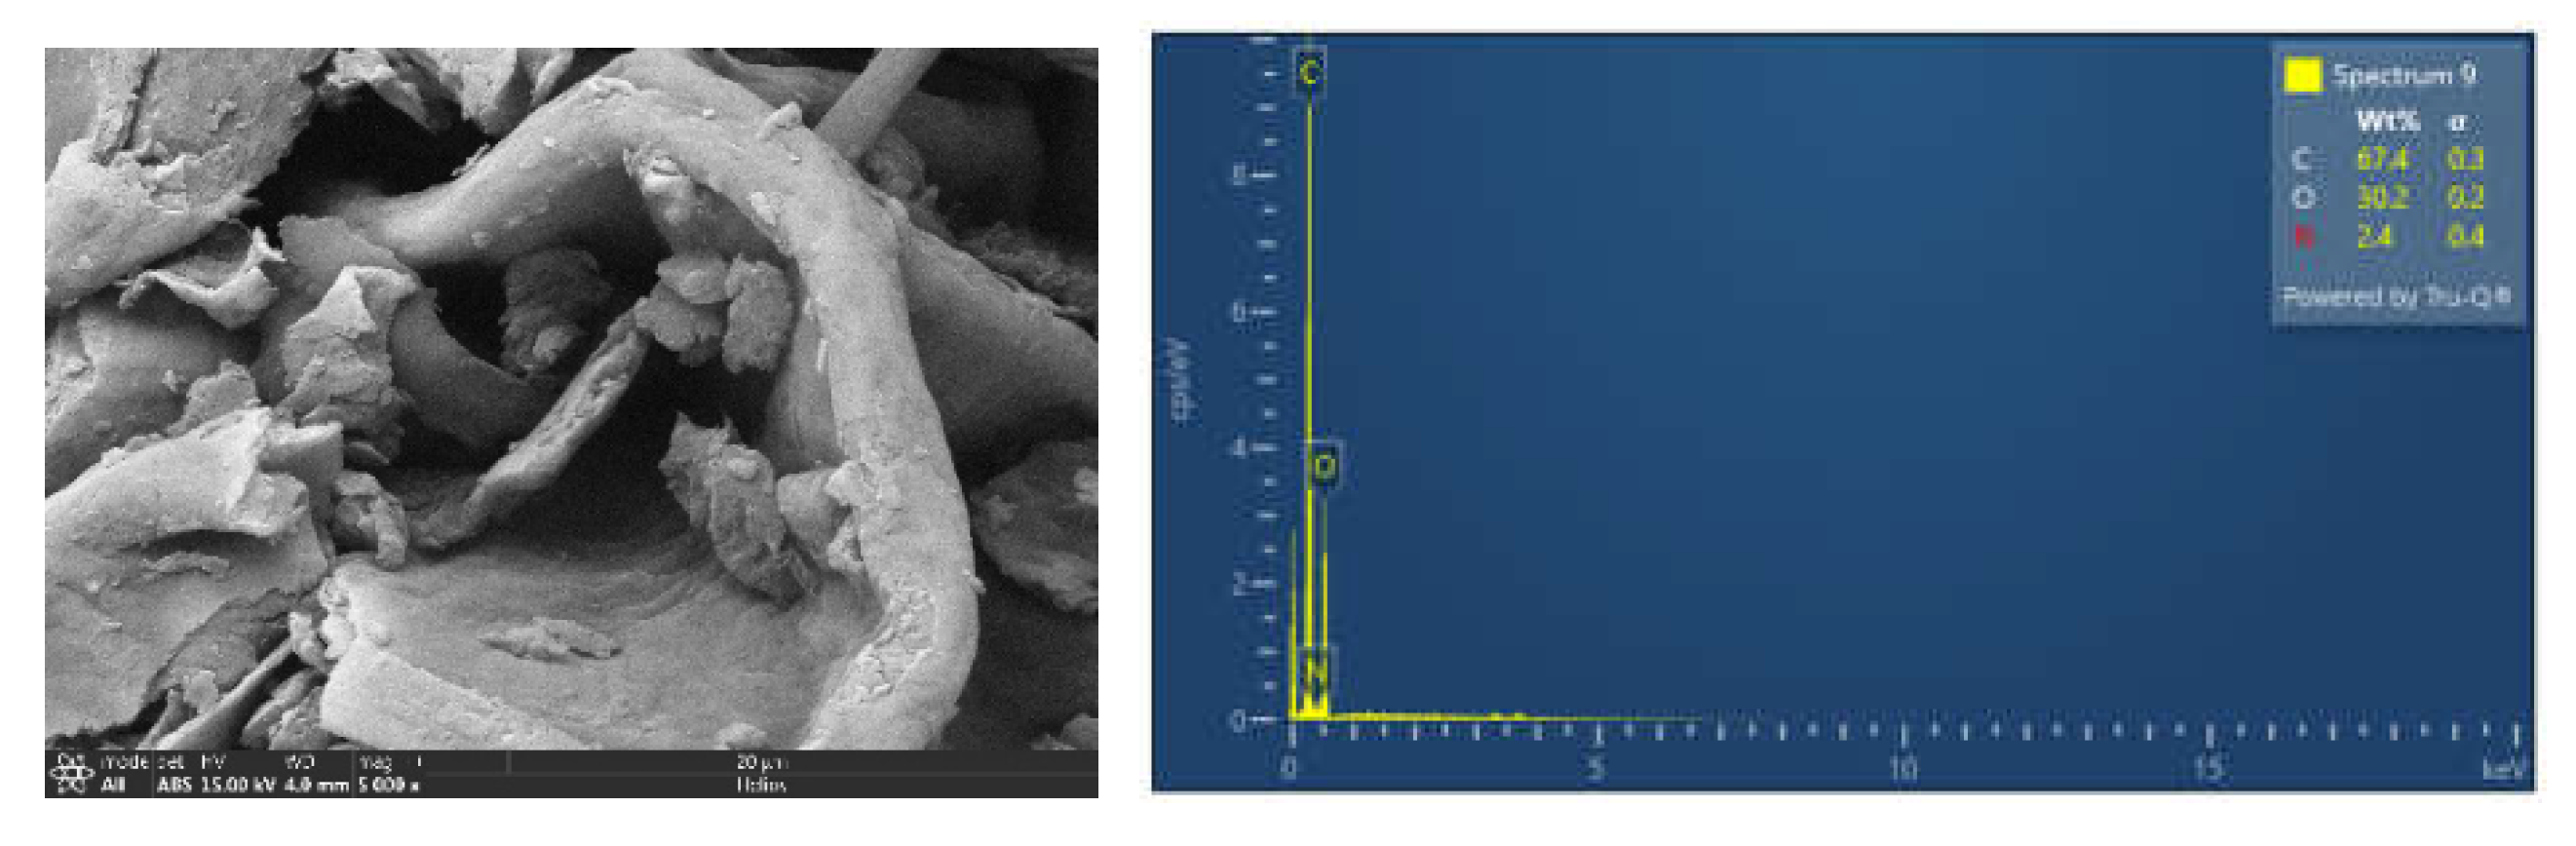
Figure 12.
b. SEM-EDS of M-RC 1 hour after adsorption.
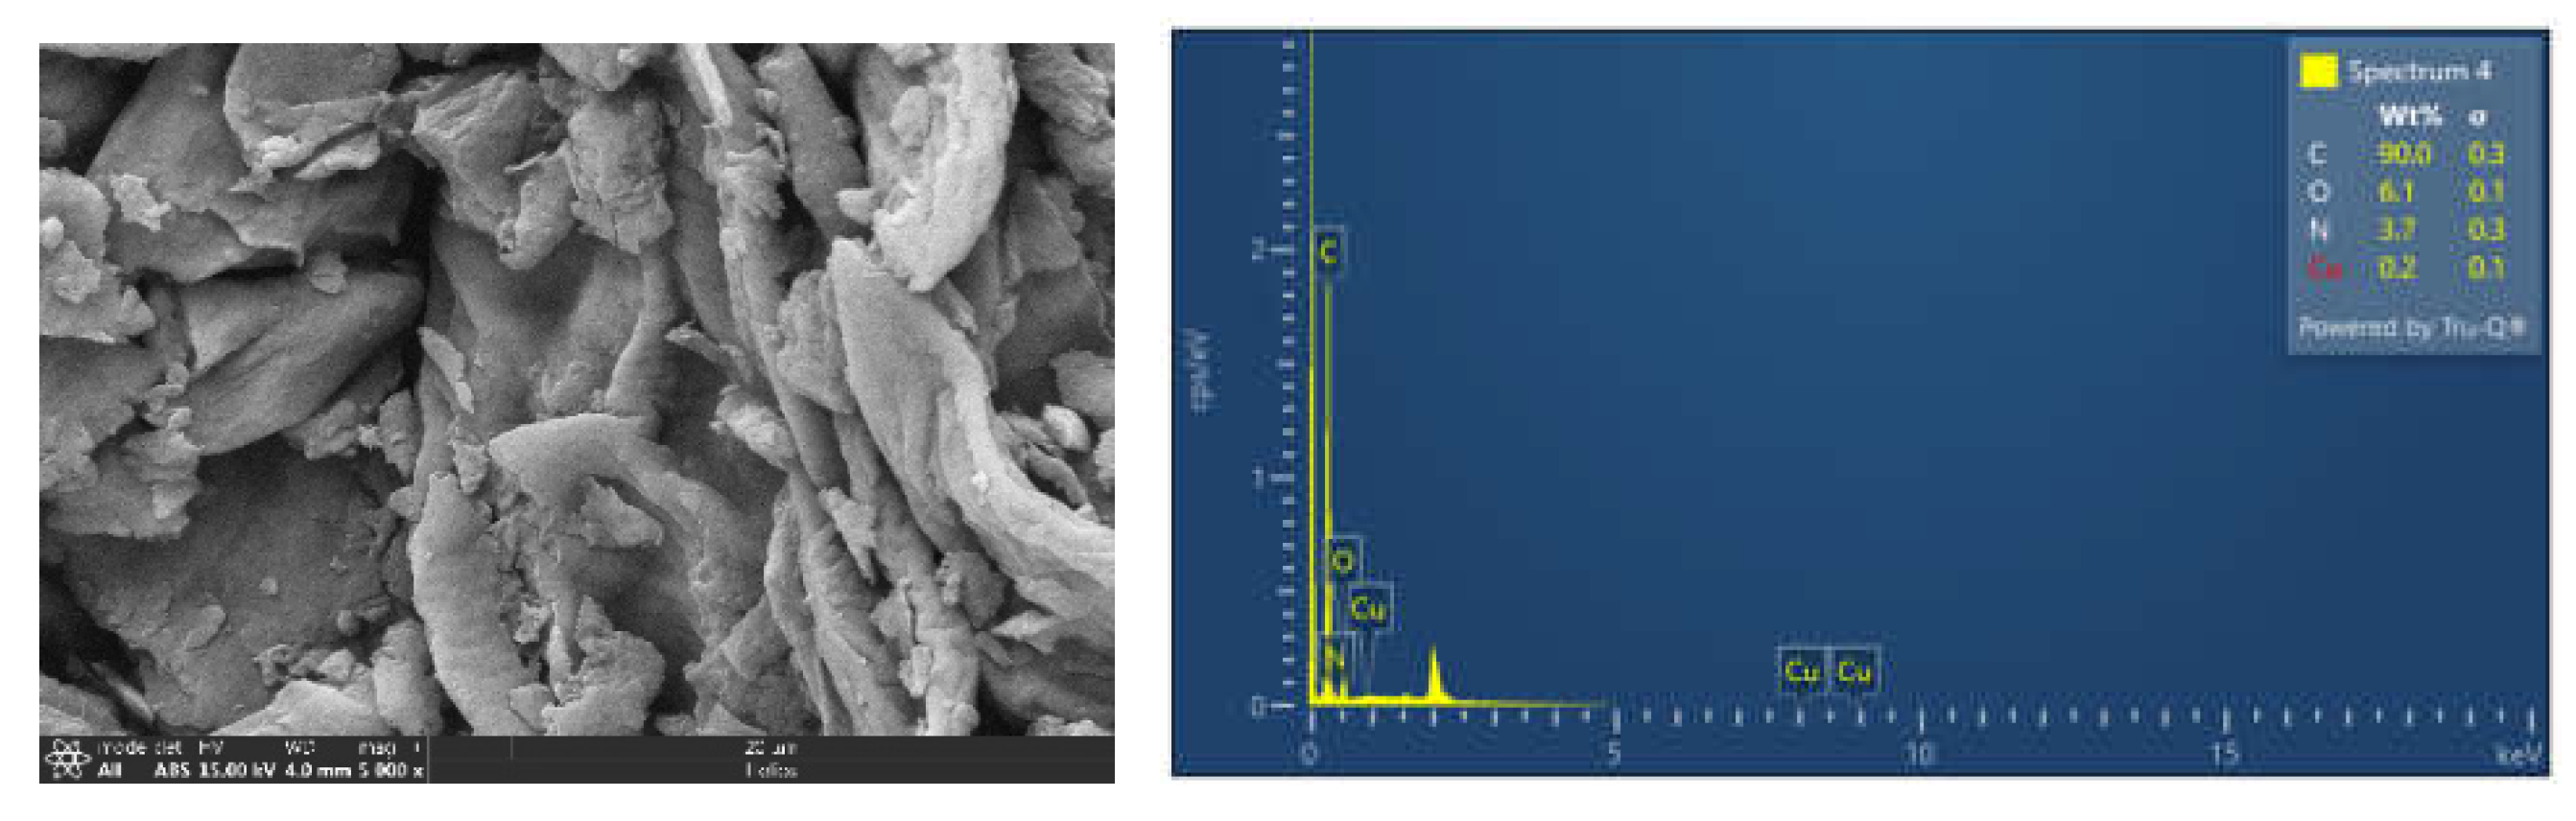
3.2.4.2. The Morphological Changes After Cu²⁺ Adsorption for M-RC Samples
The morphological changes in both M-RC samples are evident after Cu2+ adsorption. The initially open, pit-dominated structure is more compact in the 30 min M-RC (Figure 11b), showing evidence of pore infilling and rougher, granular surface features. The edges of the cavities appear thickened, and fine deposits are visible on the inner surfaces, indicating that Cu2+ entered the pore network and formed surface-bound complexes or precipitated phases.
In the 1h post adsorption M-RC (Figure 12b), the fibrous/lamellar domains are further consolidated with flakes becoming more densely packed and partially covered with fine particulates. The surface roughness grows, and some micro-voids are visible as partially blocked. These changes suggest that although the longer microwave treatment time made the structure more compact, there were still enough exposed sites to allow Cu²⁺ uptake, resulting in some deposition on the exterior surfaces and within inter-particle gaps.
3.2.4.3. EDS Evidence of Cu Binding and Surface Chemistry
Successful Cu²⁺ uptake is confirmed by the EDS spectra of the post-adsorption samples of M-RC. Cu peaks are present in addition to the main C peaks and lower O peaks in the 30 min M-RC (Figure 10b), while some N is present as a minor peak. Given the high carbon background and the relatively low mass fraction of adsorbed metal, a very low but noticeable Cu signal is expected. The reduction in O counts with pristine and the presence of N also suggest that oxygen and nitrogen-containing functional groups are involved in the Cu coordination.
Likewise, the 1-hour M-RC after adsorption (Figure 11b) shows a clear Cu spectrum on a background of mostly carbonaceous material. High C, low O, measurable N, trace Cu. The mixture of Cu detection and relatively small changes in O and N contents indicates that Cu²+ does not simply electrostatically bond to the outer sphere, but rather bonds via inner sphere complexation with surface carboxyl, phenols, and perhaps N-donor sites.
The observations show the same trends as those from the kinetic and isotherm results and confirm the Cu²⁺ removal mechanism via surface complexation and pore-associated binding, where the extent and distribution of Cu²⁺ adsorption depend on the degree of structural consolidation achieved at different microwave residence times.
3.3. Pressure-Reactor and Microwave-Assisted Hydrochar Pre- and Post- Cu (II) Adsorption Fourier-Transform Infrared (FTIR) Spectra Analysis
Figure 12 Shows the Fourier-transform infrared (FTIR) spectra of hydrochar produced via (a) pressure-reactor carbonization and (b) microwave-assisted carbonization, shown before (pristine) and after metal adsorption. The FTIR spectra of the hydrochar produced by P-RC and M-RC reveal distinct surface chemistry, functional group distributions, and types of adsorption sites for Cu (II). The chemical environments before and after adsorption reveal the intensity, sharpness, and sensitivity of the most important vibrational bands, which differ between the two carbonization routes [74,75]. The synthesized hydrochar from both the routes showed characteristic features of hydrothermally derived carbonaceous materials, including broad O-H stretching band between 3200 and 3500 cm⁻¹, O-H stretching from hydroxyl groups, adsorbed water molecules and hydrogen-bonded phenolic structures; aliphatic C-H stretching near 2920 cm⁻¹, which is due to the presence of residual lignocellulosic components; carbonyl C=O stretching around 1700 cm⁻¹, assigned to carboxylic acids, esters and conjugated carbonyls; and C-O stretching from 1020 to 1100 cm⁻¹, assigned to alcohols, phenols and polysaccharide derived functionalities [75,76]. The distributions of oxygenated functional groups that can bind metals have been well maintained in both bands [77,78].
Figure 12.
FTIR of P-RC and M-RC before and after adsorption.
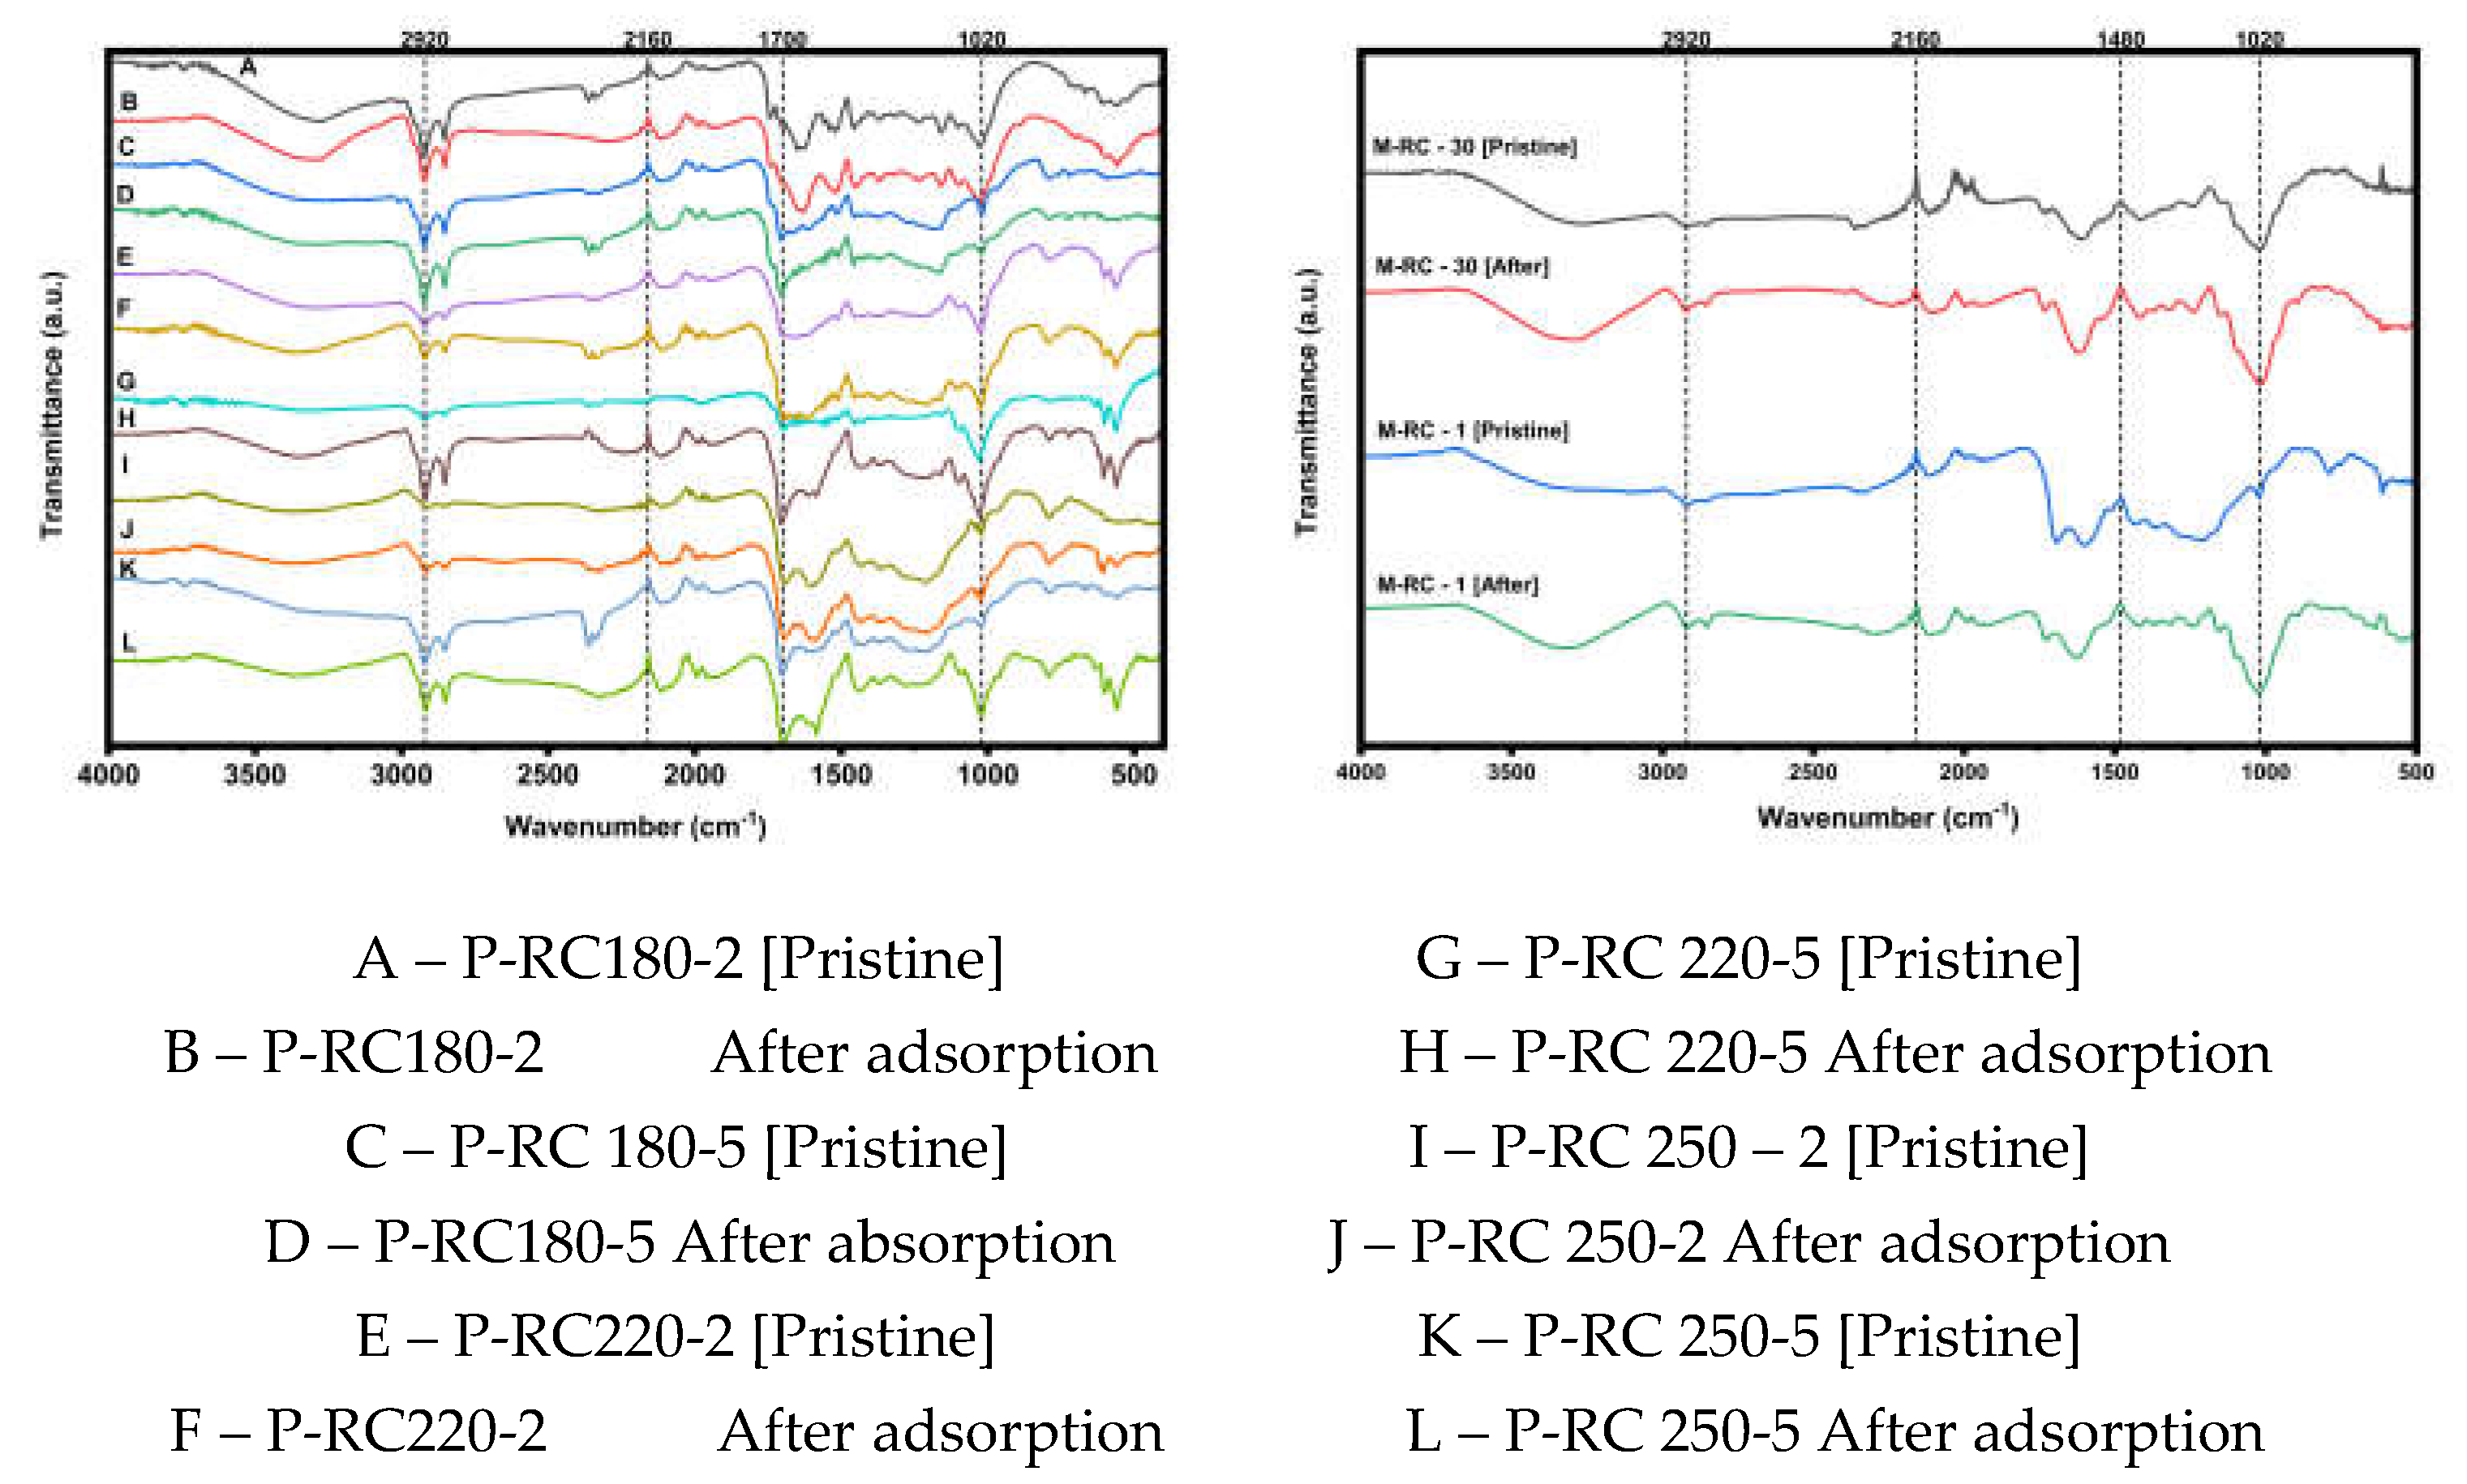
Although both materials exhibit similar functional groups in their spectral profiles, the profiles are distinctly different for the two carbonization pathways. The pressure-reactor hydrochar exhibits more diffuse O-H and C-O peaks and lower peak intensities in the spectra, suggesting that the char surfaces are less reactive and that less surface area is available for oxygen reactions [79]. They exhibit moderate-intensity carbonyl peaks, typical of the partial dehydration and aromatization that occur during hydrothermal carbonization [80,81].
Overall, the spectra of P-RC samples suggest a more homogeneous surface chemistry, though less oxygenated. In the case of the M-RC, the O-H and C-O bands are sharp and intense, thereby suggesting a higher accessible density of oxygenated groups [82]. The C=O band is more pronounced, as expected for oxidation of C=O groups, and cleavage of C-O bonds in the lignocellulosic substrate is rapid under microwave treatment. The higher aromatic skeletal vibrations also suggest greater structural disruption and greater reactivity of edge-plane sites. The differences observed in such cases indicate that the surface is more functionalized and chemically active after the microwave-assisted carbonization process, which aligns with the trends observed in the pHPZC analysis of the samples regarding the degree of development of the surface charge and ΔpH.
After Cu (II) adsorption, the two types of hydrochar exhibit substantial spectral changes, suggesting the presence of surface complexes with oxygenated functional groups, with different magnitudes and types depending on the two carbonization pathways. Pressure reactor samples show moderate decreases in intensity of the C=O bands, indicating participation of carboxyl groups in metal coordination. Both the O-H and C-O bands are slightly less intense, suggesting that hydroxyl and phenolic groups are less involved, while only minor changes are observed in the aromatic region, suggesting that the carbon framework of the pristine is more stable. The above observations indicate that the carboxylate complexation mechanism is the dominant adsorption mechanism in P-RC hydrochar. The changes in the spectra after the adsorption of the microwave-assisted hydrochar are much greater. There is a significant reduction and shift in the O-H band, suggesting that hydroxyl groups play a key role in Cu (II) binding. The C-O band is clearly weakened, indicating that phenolic and alcoholic groups are indeed reacting; the C=O band is also reduced in intensity, indicating strong coordination to deprotonated carboxyl groups. The changes confirm that the adsorption ability of the functional groups is enhanced by microwave-assisted hydrochar and that more of them are involved in adsorption, in accordance with the increased surface reactivity and deprotonation activity above the pHpzc. Results of the FTIR showed that oxygenated functional groups are present in both the pressure reactor prepared and microwave prepared hydrochar, which will bind Cu (II); however, the amount and type of functional groups that bind Cu (II) are not the same. The moderate changes in the C=O and O-H regions after adsorption of the pressure-reaction hydrochar indicate that the major active sites are the carboxyl groups, with other active sites contributing only marginally due to the more condensed carbon structure. The results indicate that the carbonized surface is more active and has a higher functional surface area, facilitating greater and deeper complexation of metal ions during M-RC. The FTIR results confirm the pHpzc and adsorption results, indicating that Cu (II) can be removed more effectively using the microwave-derived hydrochar due to its surface chemistry.
3.4. Pressure-Reactor and Microwave-Assisted Hydrochar Pre- and Post- Cu (II) Adsorption XRD Analysis
Figure 13.
XRD spectra of P-RC and M-RC hydrochar of pristine and after adsorption of Cu 2+.
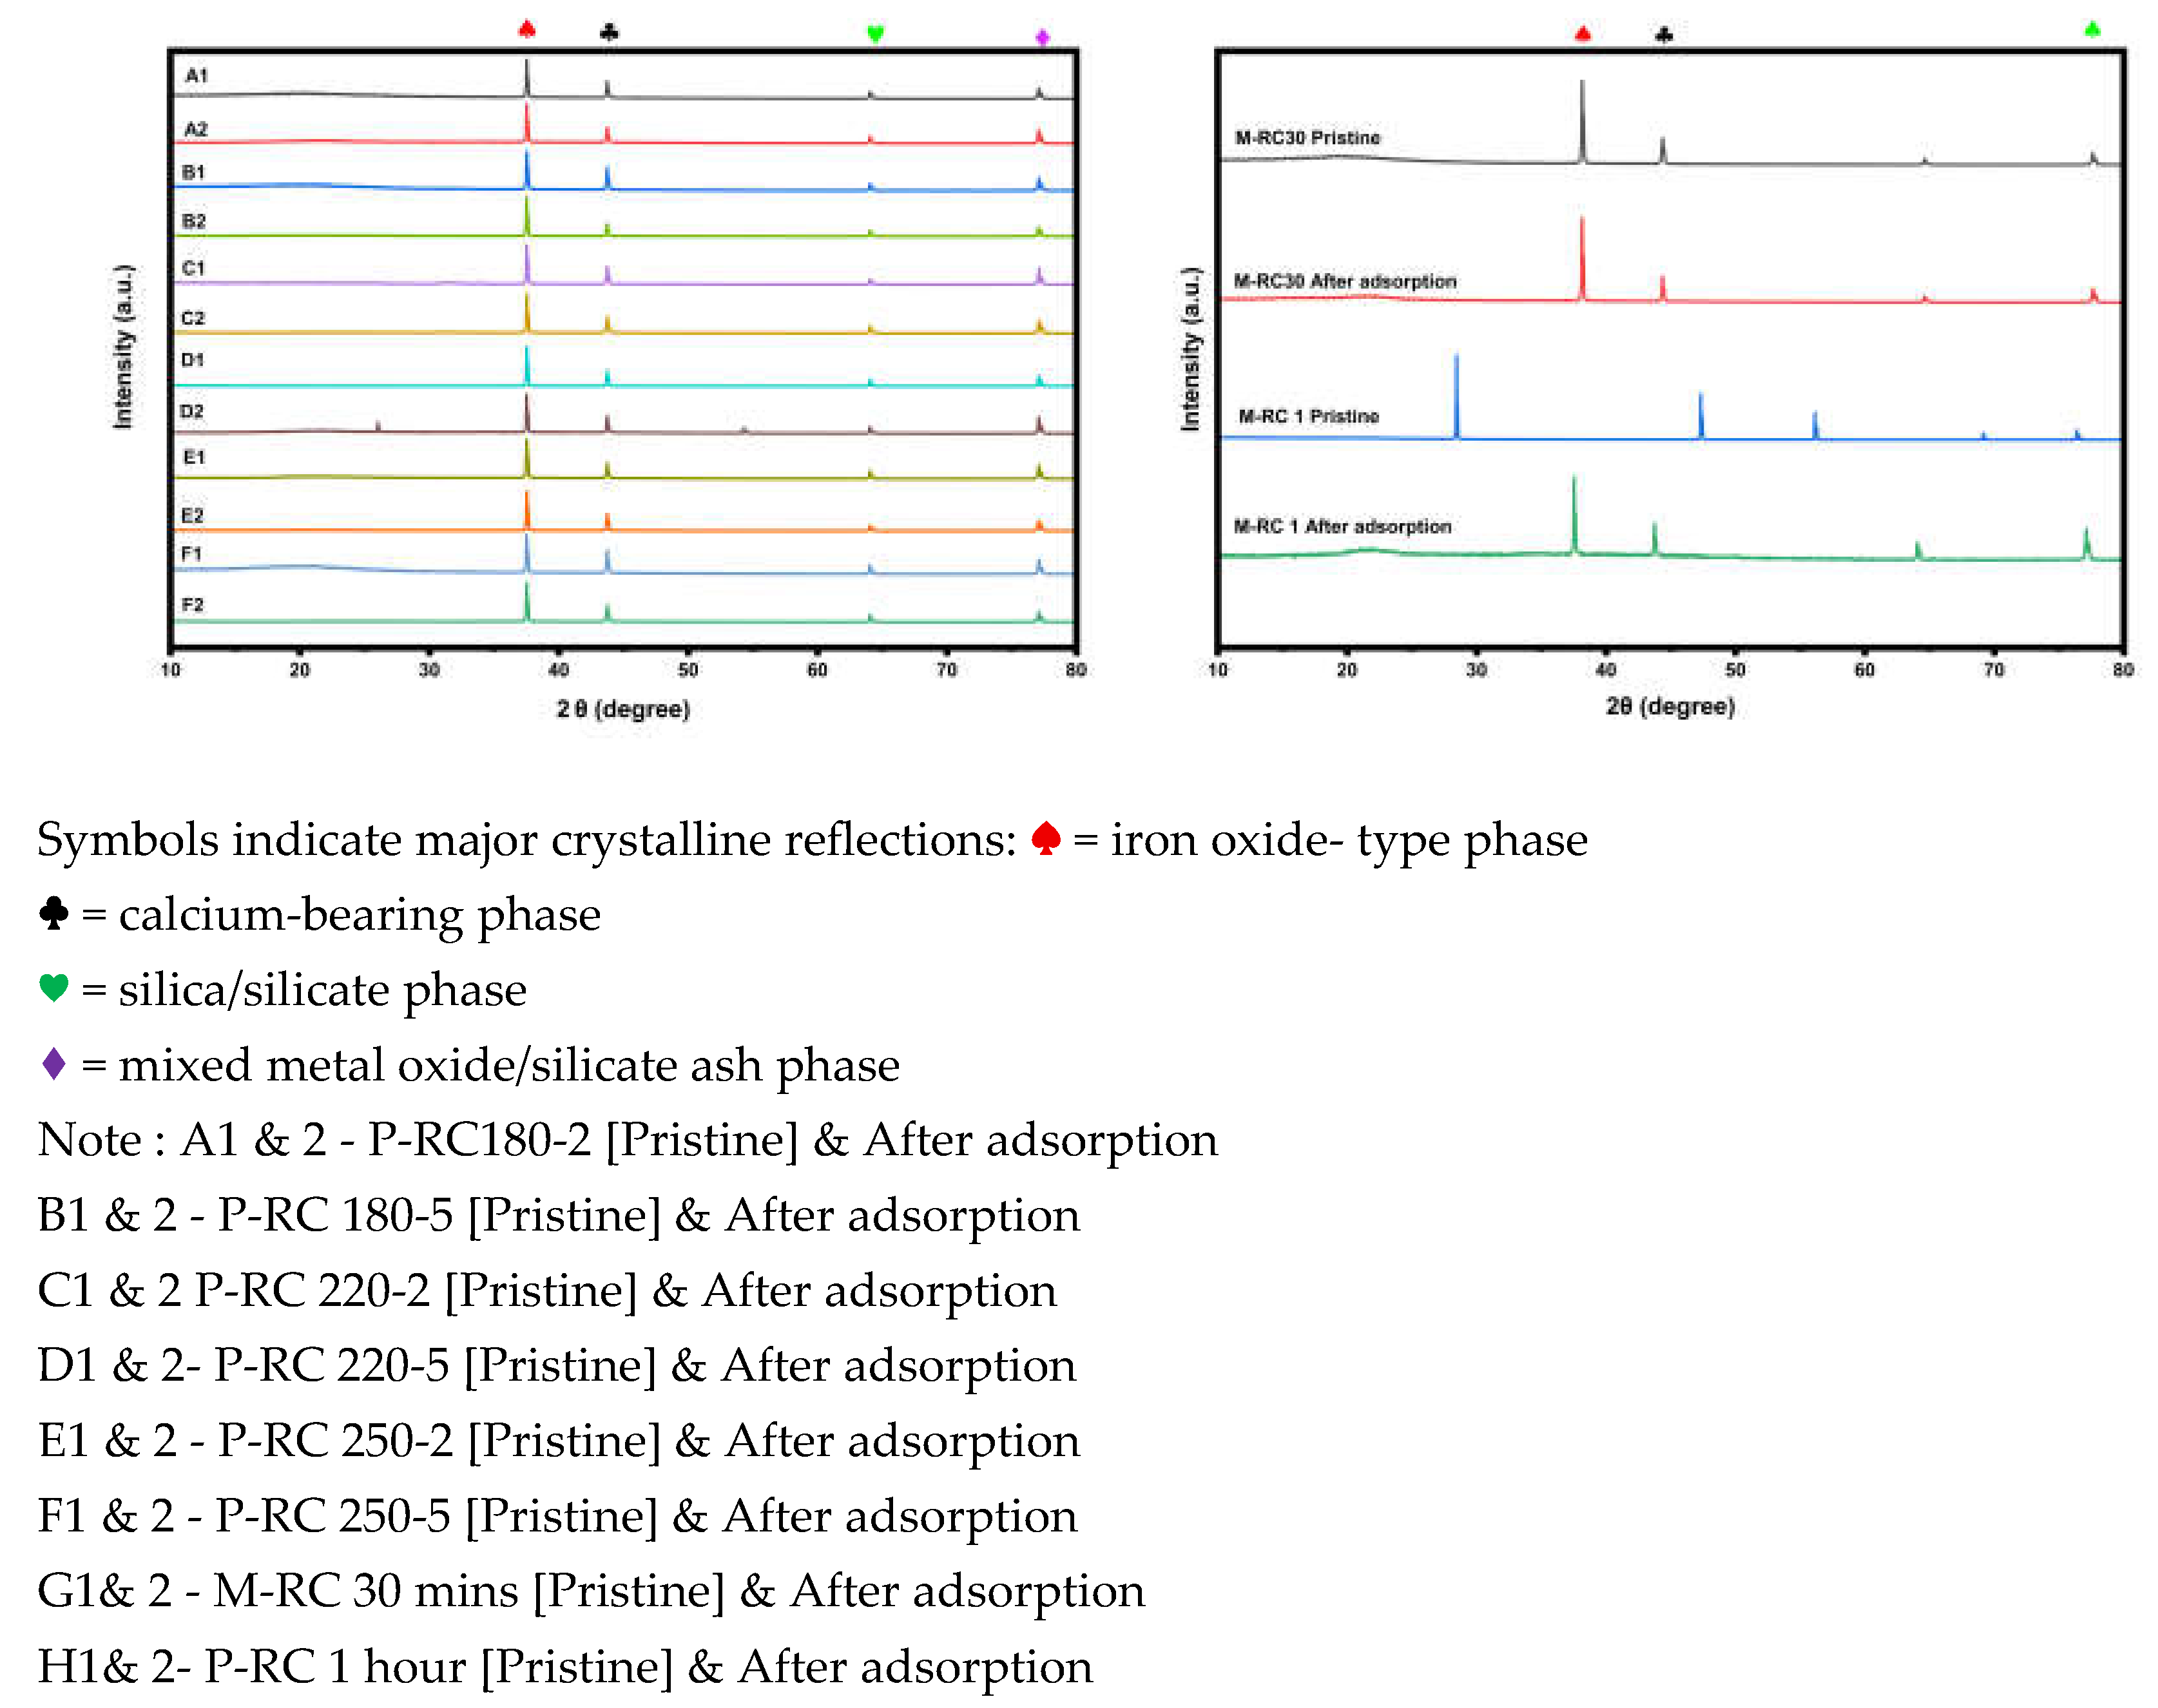
The XRD patterns of the pressure reactor (P-RC) and microwave-assisted (M-RC) hydrochar indicate that the materials formed by both carbonization methods are composed mainly of an amorphous carbon matrix, as evidenced by the broad hump centered at 20–30° 2θ [9,83]. This feature corroborates that the carbon framework is disordered and that neither thermal route leads to significant graphitic ordering. On top of this fuzzy background, the presence of distinct crystalline reflections is superimposed, which are caused by mineral residues that are naturally present in the biomass feedstock [84,85]. In P-RC and M-RC samples, characteristic peaks are present in the 35-42° region, associated with iron oxide-type phases, and reflections in the 42-46° region, related to calcium-bearing minerals (e.g., calcite or CaO). Other peaks in the 50-55° range are identified as silica or silicate phases, while the higher-angle peaks between 74-79° are identified as higher-order oxide or silicate lattice planes. The same mineral signatures are observed in both carbonization pathways, indicating that the inorganic mineral ash fraction is structurally stable under both heating conditions [86]. Minor differences in peak sharpness and intensity across the mineral families for P-RC and M-RC hydrochar indicate distinct thermal environments, despite their similarity. The slower, more regular heating of PR C samples yields slightly better-defined crystalline reflections, indicating that the carbonization process has led to some crystallization and greater stability of the minerals. Conversely, microwave processing yields a broader or less intense peak, especially for the 30-minute M-RC sample, due to a more uneven mineral distribution and fewer opportunities for reorganization within the crystals. Although differences exist, both pathways maintain the key mineral phase(s) that affect the functional properties of the hydrochar.
Importantly, the XRD pattern of both P-RC and M-RC hydrochar does not change significantly after Cu (II) adsorption. No new crystalline peaks are seen, and no shift in the positions of the existing peaks is detected, indicating that Cu does not precipitate on the surface of the hydrochar as a crystalline phase. Rather, the uptake of Cu (II) is attributed to non-crystalline processes, such as surface complexation, ion exchange, and interactions with oxygen- and nitrogen-containing functional groups (FTIR and SEM–EDS analyses). The structural stability of both hydrochar types during adsorption is another indication of the structural integrity of the mineral phases and the amorphous carbon framework.
Based on the overall XRD analysis, it is inferred that P-RC and M-RC hydrochar have comparable XRD profiles, with the highest amorphous carbon content and stable mineral residues, whereas the differences are small and due to the different heating mechanisms used. The mineral phases, together with the functionalized carbon matrix, account for the adsorption properties of these materials, thus supporting the mechanistic interpretation that mineral phase transformations do not play a major role in the removal of Cu [87,88]
3.4. Adsorption Studies
3.4.1. pH at the Point of Zero Charge (pHpzc)
The pH at the point of zero charge (pHpzc) was determined to establish the surface charge behavior of the hydrochar and to provide a mechanistic basis for interpreting the pH-dependent adsorption of metal ions [88,89].
Figure 14 presents the ΔpH (pHf – pHi) as a function of initial pH for the Pressure-Reactor hydrochar A, B, C (P-RC180-5, P-RC220-5, and P-RC250-5) and the microwave-assisted hydrochar (M-RC1), respectively. The ΔpH (pHf–pHi) was plotted as a function of initial pH for the P-RC (A, B, C) and the M-RC hydrochar. The characteristic S-shaped ΔpH profile typically observed for carbonaceous sorbents is evident in all the samples, with ΔpH values slightly positive or near neutral at low pH, a neutral point in the mid-pH range, and increasingly negative at alkaline pH. The ΔpH curves for all four materials cross at around pH 6.0, suggesting that the pHpzc is close to 6.0 for the P-RC and M-RC hydrochar. Minor variations in the experimental data for the different samples, e.g., the slightly higher ΔpH at pH 4 for the M-RC hydrochar or the slightly lower ΔpH at pH 4 for Sample A, indicate slight differences in surface acidity and mineral buffering capacity but do not affect the overall zero charge point. FTIR and XRD data agreed with the higher density of proton-active oxygenated groups and mineral exposure, leading to a higher positive ΔpH for the M-RC hydrochar at low pH. All samples have strongly negative ΔpH values at pH values above the pHpzc (approx. −1.2 to −2.8), where the final pH has decreased compared to the initial pH. This is typical of hydrochar with high concentrations of acidic functional groups [13,90]. As the solution pH rises, the -COOH and -OH groups on the surface deprotonate, releasing protons into the solution and forming -COO⁻ and -O⁻ groups. As a result, the pH of the final product decreases, with the extent of the decrease dependent on the surface acidity and buffering capacity of each material, resulting in negative ΔpH values.
Figure 14.
The point of zero charges (pHPZC) of hydrochar [P-RC].
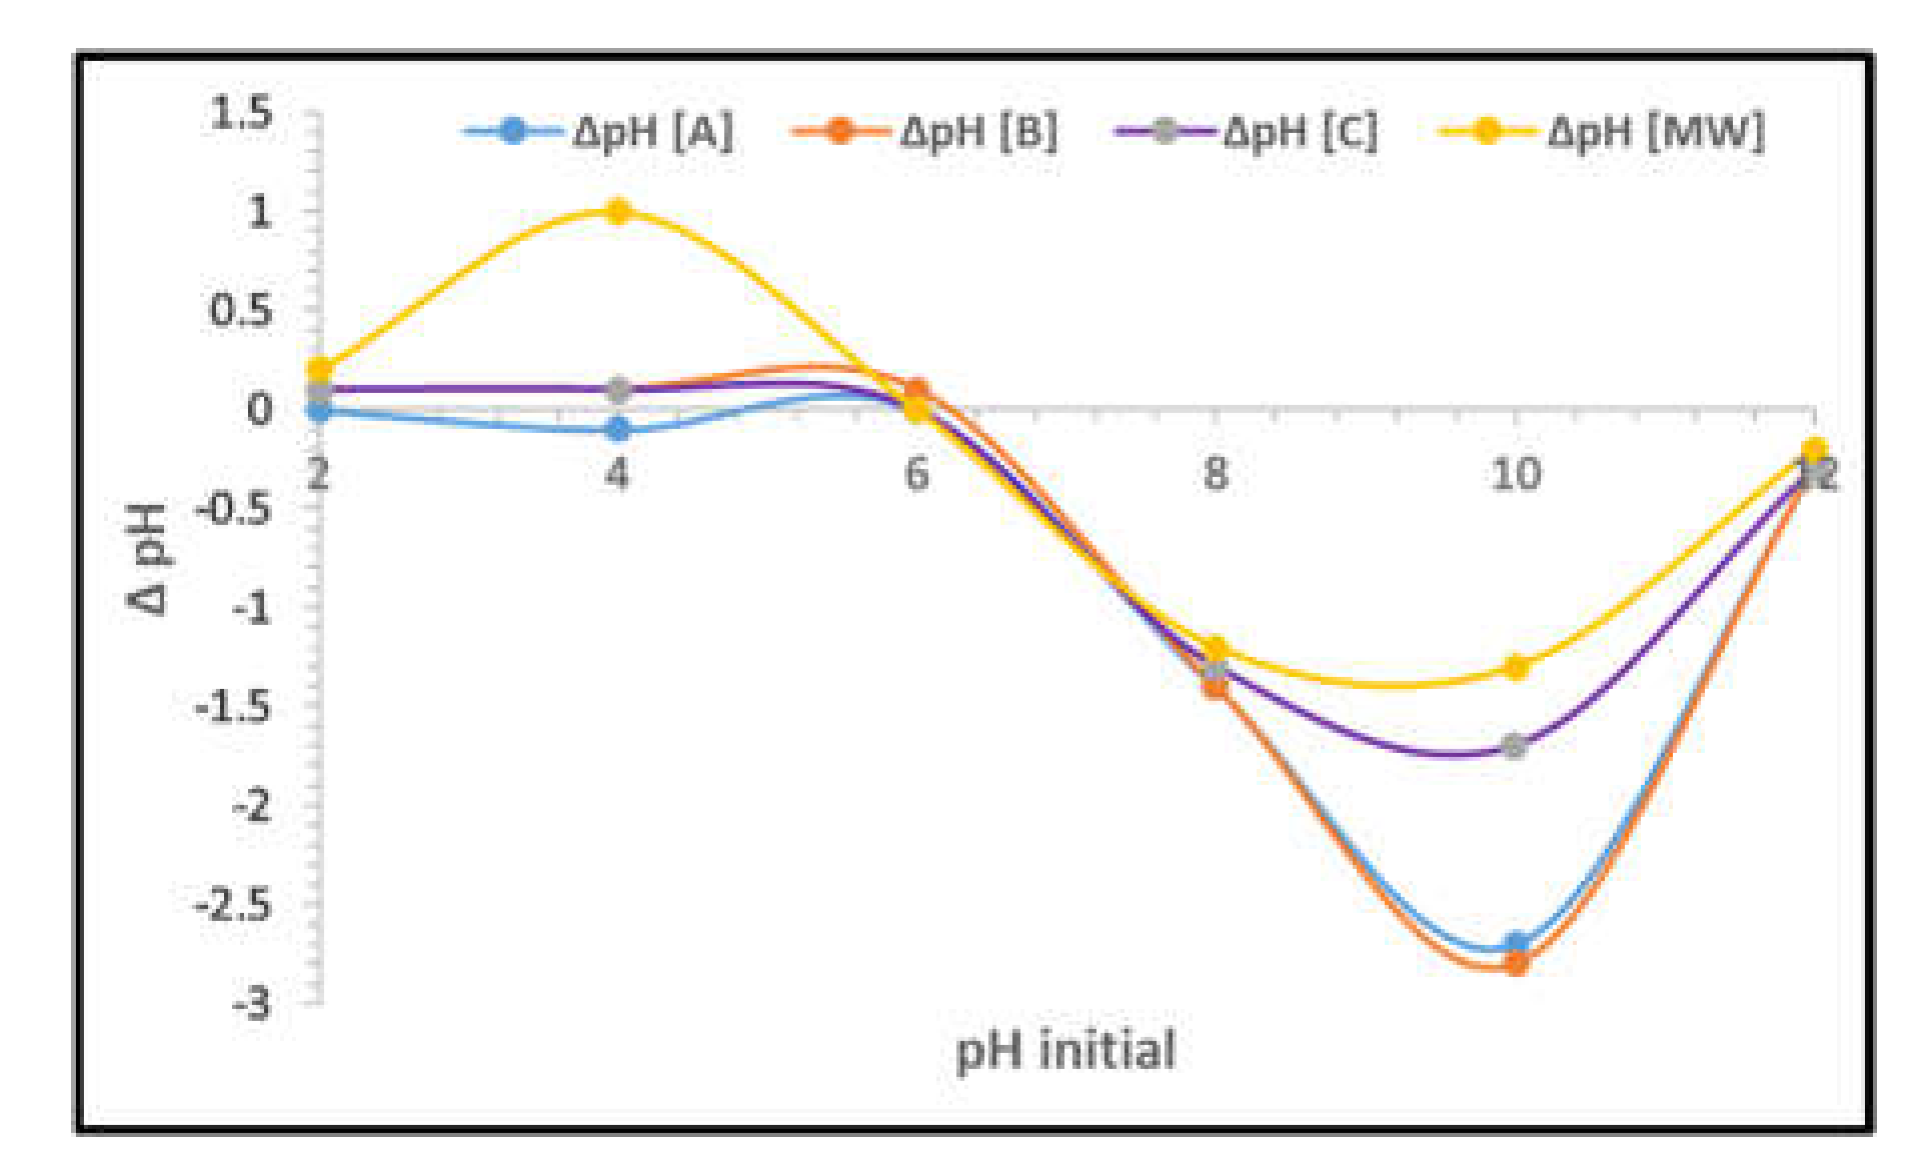
The slightly positive ΔpH values are observed at high pH for the M-RC hydrochar, most likely because the mineral phases, e.g., Calcium-bearing phases (CaCO₃/CaO), identified by XRD, buffer the released protons. The adsorption behavior is directly related to the pHpzc. The working pH for adsorption in this study is 6, which is either equal to or slightly higher than the pHpzc of all the samples; the hydrochar surfaces are negatively charged during Cu (II) uptake [34,91]. In this case, electrostatic attraction between the negatively charged surface sites and the divalent Cu²⁺ ion becomes more favorable, and deprotonation of functional groups makes more -COO⁻ and -O⁻ groups available for inner sphere complexation. Such an electrostatic and chemical environment allows for higher adsorption capacities at pH 6; at more acidic pH values, surface protonation inhibits metal binding. In general, the pHpzc of all hydrochar samples falls within 5.5–6.5, indicating that all hydrochar surfaces are negatively charged at the working adsorption pH. The continued decrease in ΔpH at higher pH values corresponds to progressive deprotonation of acidic functional groups and proton release, whereas the M-RC hydrochar showed better buffering capacity due to greater exposure of the mineral phases. These surface charge properties directly contribute to the increased adsorption capacities observed at pH 6, where electrostatic attraction and complexation mechanisms are at their maximum [92].
3.4.2. Adsorption Kinetics (Pseudo-First-Order (PFO), Pseudo-Second-Order (PSO), Intraparticle Diffusion (IPD))
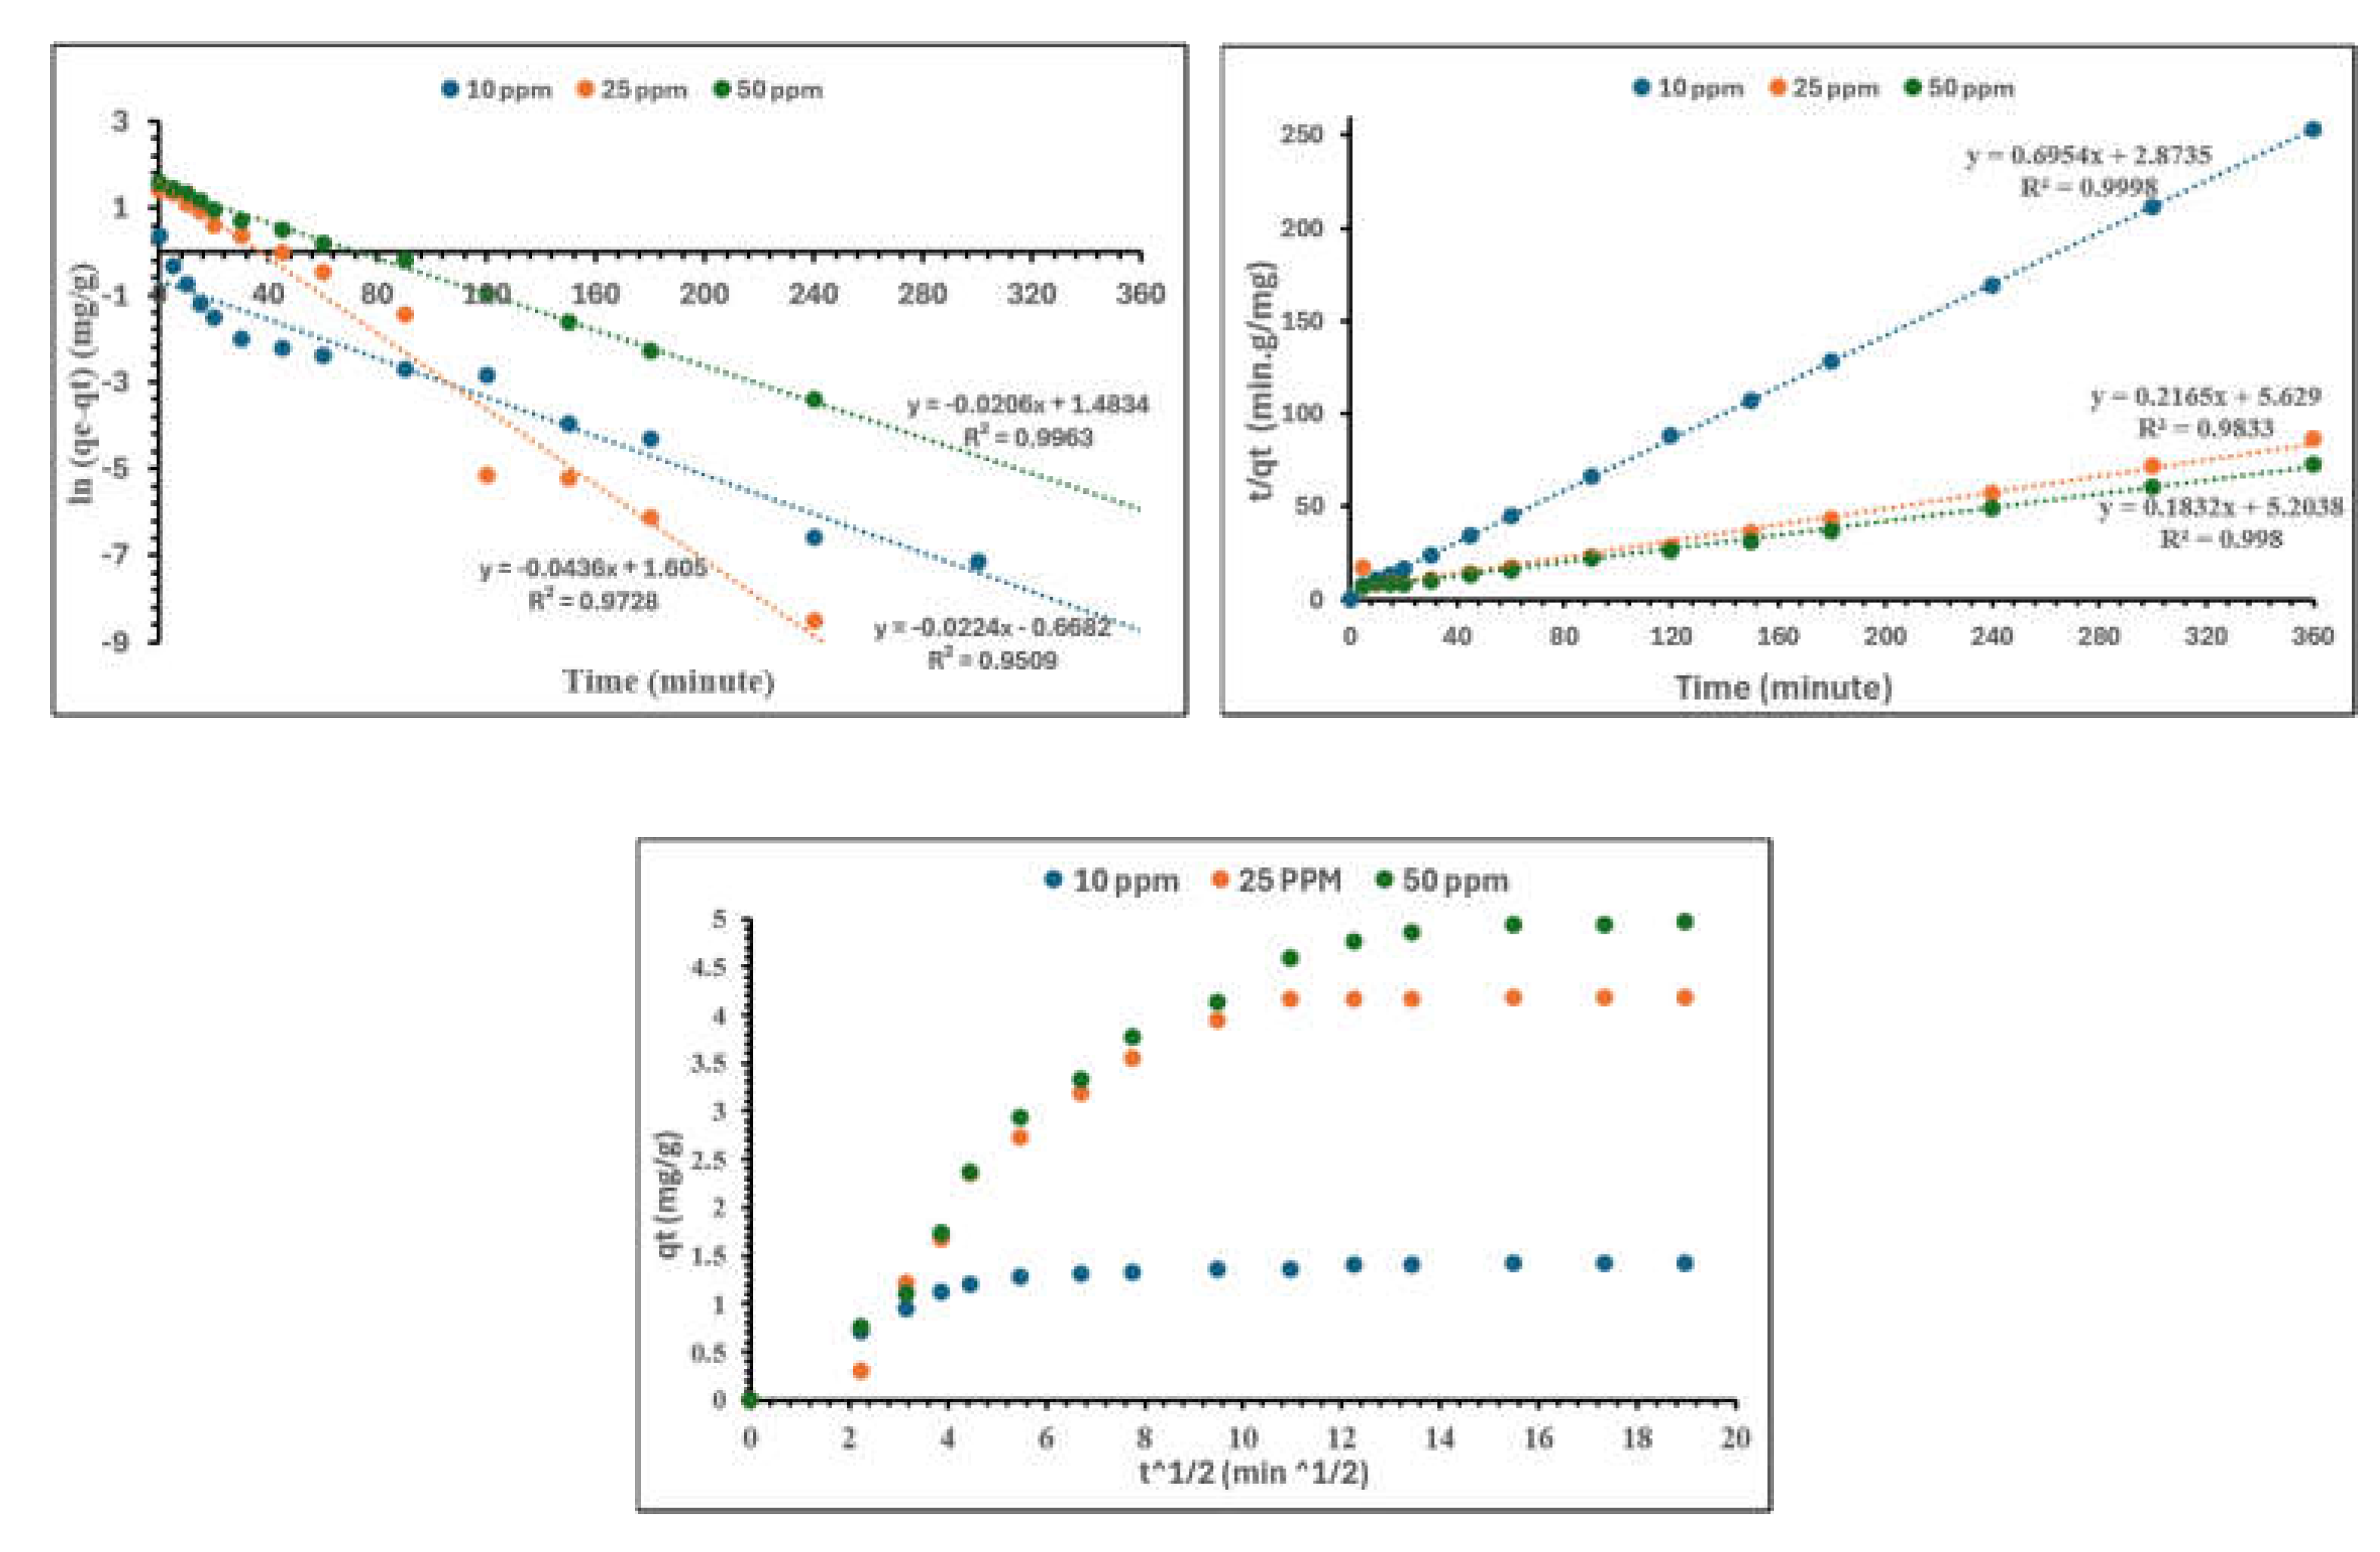
Figure 15.
The pseudo-first-order, pseudo-second-order, intraparticle diffusion respectively.
3.4.2.1. The Pseudo-First-Order
The adsorption kinetics of Cu (II) on the pressure reactor and microwave-assisted hydrochar have also been investigated to elucidate the rate-controlling steps and differentiate between surface- and diffusion-controlled processes. The PFO model was initially used to determine whether the adsorption rate was governed by the number of vacant surface sites on the hydrochar [89,93]. The linear plot of ln (qₑ − qₜ) versus time showed a strong correlation across all concentrations, with R² values ranging from 0.95 to 0.99. The regression equation y = -0.0436t + 1.605 (R² = 0.9728) for 10 mg L⁻¹ showed a high availability of active sites in the initial hours due to the high concentration of metal ions. The slope (apparent rate constant) decreased with increasing concentration to -0.0224 (R² = 0.9509), indicating a lower apparent rate constant as the ratio of available sites to ions decreased. The PFO model showed the highest linear correlation at the higher concentration (R² = 0.9963, slope = -0.0206) for the 50 mg L⁻¹ system, indicating that the high-concentration system fits the model well in the early diffusion-controlled stage. In each case, however, the model PFO underestimated the experimental equilibrium adsorption capacity (qₑ,exp), a phenomenon observed when chemisorption is dominant [94,95]. Therefore, though it is a good approximation of the first diffusion-controlled uptake, it is not the complete adsorption process.
3.4.2.2. Pseudo-Second-Order (PSO)
The PSO model, however, gave a good prediction of the overall adsorption kinetics. Linear plots of t/qₜ versus t showed very linear relationships across all t concentrations, with R² values consistently higher than those for the PFO model. The regression equation y = 0.6954t + 2.8735 (R² = 0.9998) showed good agreement between the calculated and experimental equilibrium capacities, [96,97,98]. Even at higher concentrations, the PSO model maintained strong fits, with R² = 0.9833 at 25 mg L⁻¹ and R² = 0.998 at 50 mg L⁻¹. The consistency of the PSO values and the close agreement between the calculated and experimental qₑ values at all concentrations suggested that surface reactions are the rate-determining step in the overall adsorption rate, rather than external film diffusion. These findings are consistent with the results of the FTIR and pHpzc analyses, which indicate that the deprotonated oxygenated groups (-COO⁻, -O⁻) play a key role in the formation of inner-sphere complexes with Cu (II).
3.4.2.3. Intraparticle Diffusion (IPD)
The intraparticle diffusion model was also applied by plotting qₜ versus t¹ᐟ², and the contribution of pore diffusion was further evaluated [99]. All the adsorption curves were multi-linear with a steep initial section and a more gradual approach to equilibrium. The first linear segment is a regime in which mass transfer occurs rapidly at the particle surface and from the outside of the particle; the second is a regime in which mass transfer occurs slowly into the particle’s pores and internal sites. None of the lines intersected at the origin, suggesting that intraparticle diffusion was not the only rate-controlling factor [100,101]. The nonzero intercepts are due to the boundary layer, and larger intercepts indicate greater contributions from film diffusion. These results confirm that adsorption occurs in several steps: external mass transfer and intraparticle diffusion are responsible for the overall adsorption process but are not rate-limiting. Collectively, the kinetic analysis indicates that the reaction of Cu (II) with P-RC and M-RC hydrochar is best described by the pseudo-second-order model, suggesting that chemisorption is the rate-limiting step. The PFO model accounts only for initial diffusion uptake, whereas the IPD model shows that pore diffusion occurs later but is not the rate-controlling step. The results agree with the surface chemistry indicated by FTIR and pHpzc analyses, which demonstrate the importance of deprotonated oxygenated functional groups in Cu (II) binding and the presence of both rapid surface complexation and slower intraparticle diffusion during adsorption [102,103,104].
3.5. Adsorption Isotherms
Although pH 6 was identified as the optimal adsorption pH based on the pHpzc and pH-effect studies, adsorption isotherms were also evaluated at pH 4 and pH 5 to provide a more complete understanding of how equilibrium adsorption behavior changes with surface charge and functional group protonation. Presenting isotherms at multiple pH values allows direct comparison of monolayer capacity, surface heterogeneity, and affinity under acidic and near-neutral conditions, thereby strengthening the mechanistic interpretation of adsorption [105]. The equilibrium data at pH 4, 5, and 6 were fitted to the Langmuir and the Freundlich models to assess how pH influences monolayer formation, site heterogeneity, and sorption intensity.
Presenting isotherms across these three pH values allows direct comparison of monolayer capacity, affinity, and surface heterogeneity under acidic and near-neutral conditions. The equilibrium data for the 8 samples at pH 4, 5, and 6 were fitted to the Langmuir and the Freundlich models to evaluate the influence of pH and synthesis method on adsorption capacity.

Table 1.
Adsorption Isotherms.
|
Sample |
Langmuir Model | Freundlich Model |
Best fit Model |
||||||
| Qₘₐₓ (mg/g) |
(L/mg) | R² | RSME | n | R² | RSME | |||
| P-RC180-2 | 2.71 | 0.118 | 0.9654 | 0.2019 | 2.42 | 0.527 | 0.9697 | 0.2050 | Freundlich Model |
| P-RC180-5 | 1.54 | 0.0142 | 0.0946 | 0.0509 | 1.11 | 0.0251 | 0.6321 | 0.1635 | Freundlich Model |
| P-RC220-2 | 5.46 | 1.50 | 0.9984 | 0.3744 | 2.77 | 2.61 | 0.7272 | 1.3581 | Langmuir Model |
| P-RC220-5 | 5.48 | 1.41 | 0.9938 | 0.5020 | 3.85 | 2.83 | 0.8656 | 0.5752 | Langmuir Model |
| P-RC250-2 | 0.406 | 0.5054 | 0.8762 | 0.0326 | 3.59 | 0.158 | 0.5054 | 0.0931 | Langmuir Model |
| P-RC250-5 | 2.17 | -1.58 | 0.9934 | 3.5313 | 6.14 | 1.59 | 0.5628 | 0.4511 | Langmuir Model |
| M-RC30 Mins. | -5.59 | -0.037 | 0.6531 | 0.1042 | 0.70 | 0.133 | 0.9945 | 0.2448 | Freundlich Model |
| M-RC1 hr. | -86.21 | -0.0081 | 0.1581 | 0.0258 | 0.95 | 0.676 | 0.9947 | 0.2320 | Freundlich Model |
* Isotherm was considered for only pH 6.
3.6. Effect of pH on % Removal
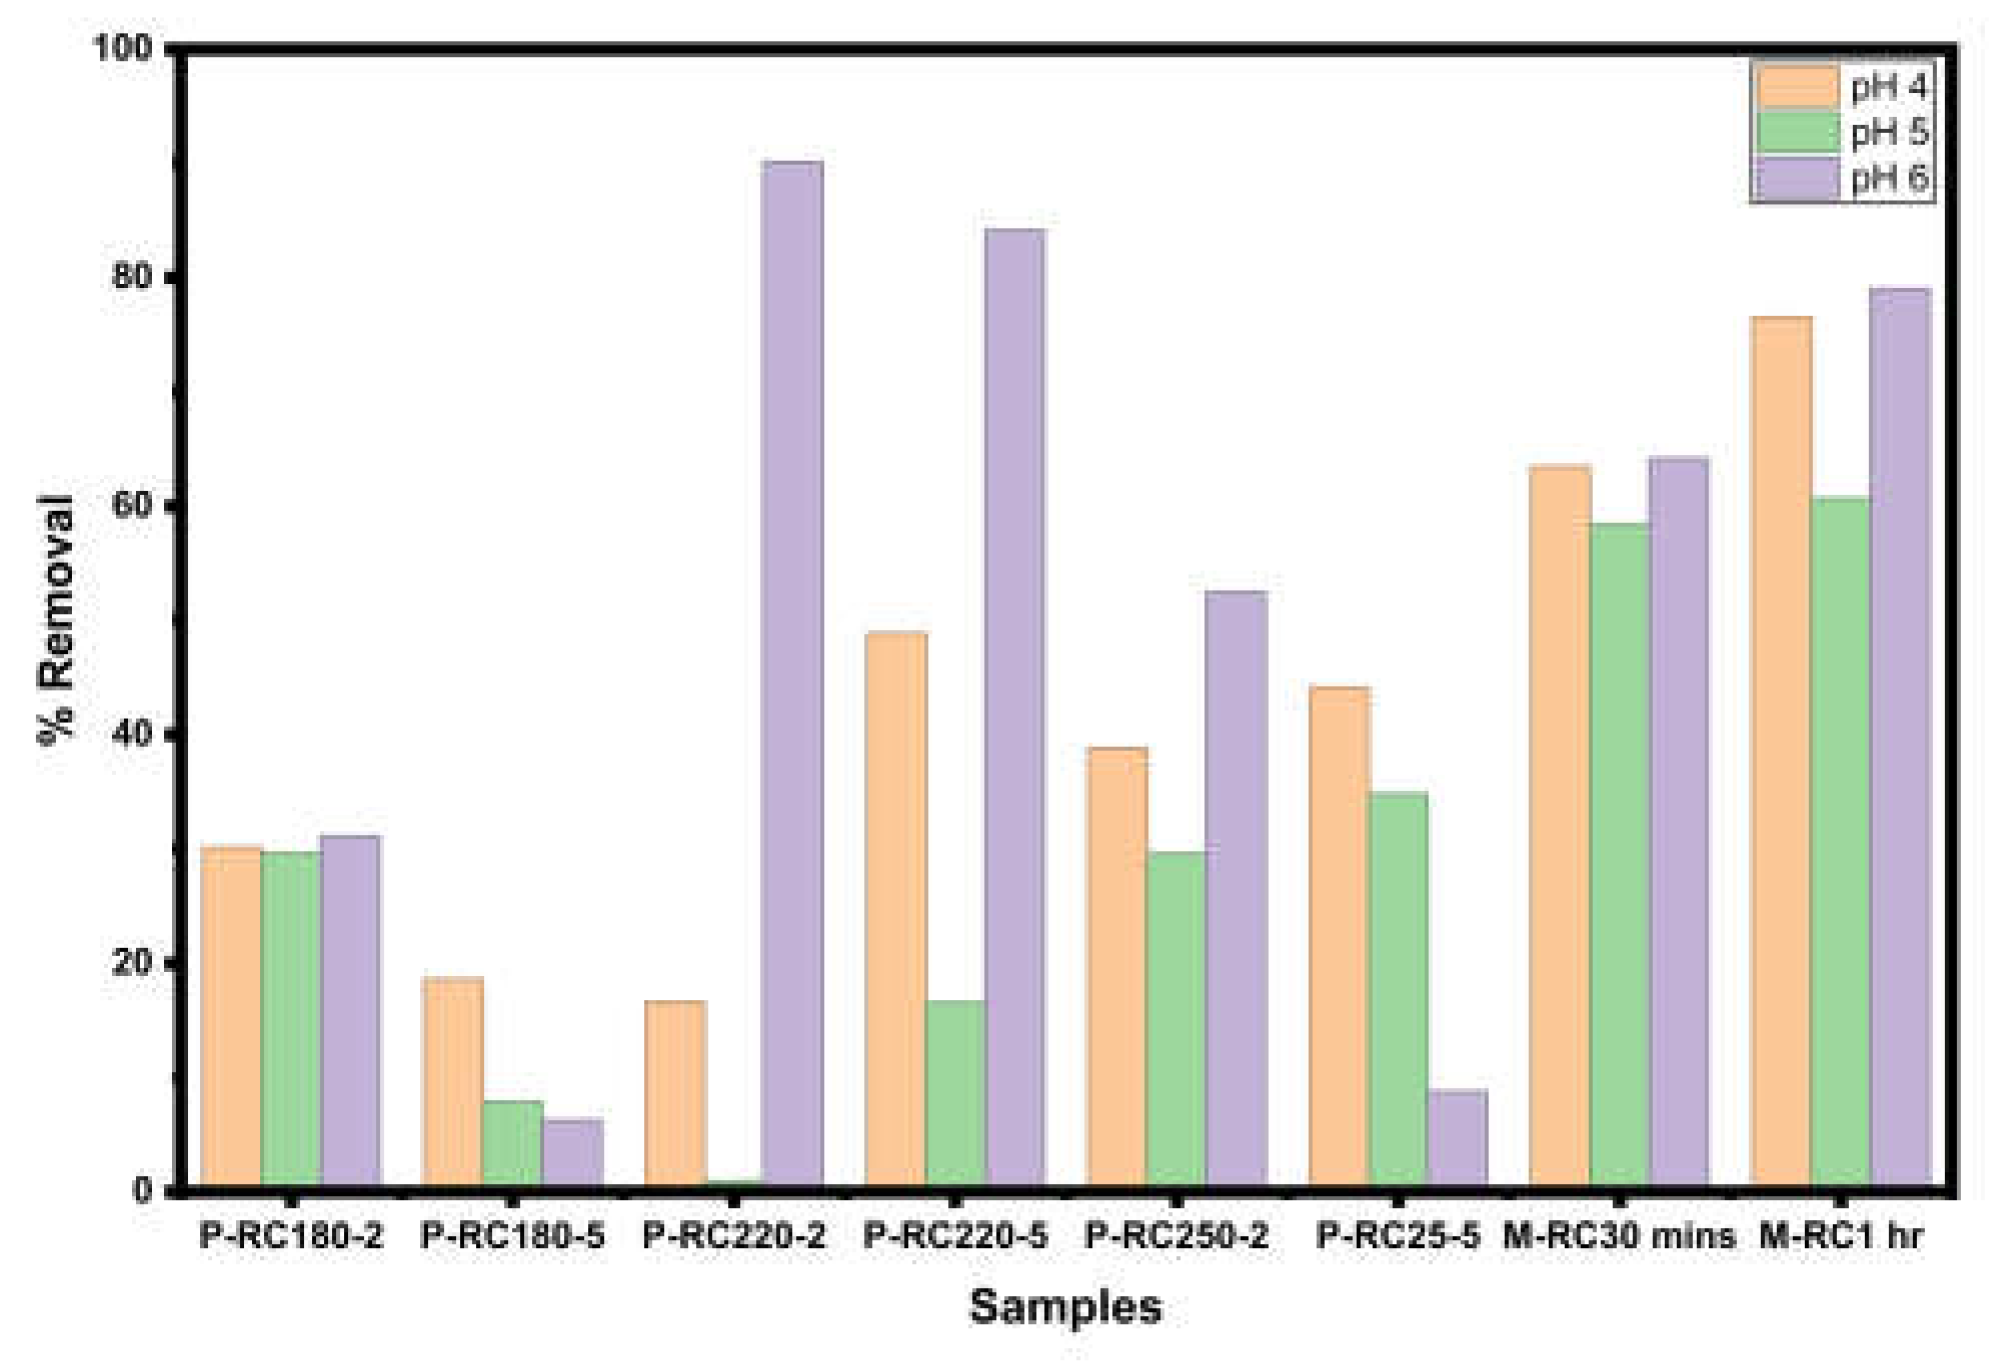
Figure 16 presents the effects of pH 4, 5, and 6 on adsorption performance at a fixed initial concentration of 25 mg·L⁻¹, a fixed dosage, and a constant time for all hydrochar samples. Across all the 8 samples, the percentage removal increased progressively from pH 4 to pH 6. At pH 4, removal efficiencies were lowest due to extensive protonation of surface functional groups and the resulting electrostatic repulsion between the positively charged hydrochar surface and metal ions [106]. Moderate improvement was observed at pH 5, as partial deprotonation began. The highest removal was consistently observed at pH 6, which corresponds to the materials’ pHpzc and marks the transition to a neutral or slightly negative surface. This enhanced deprotonation increases the availability of active oxygen-containing sites, thereby strengthening electrostatic attraction and improving adsorption [107]. Based on this trend, pH 6 was selected as the optimal pH for all subsequent kinetic and isotherm studies.
Figure 16.
The effect of pH on the % removal of Cu2+ adsorption.
3.7. Effect of Initial Concentration
Figure 17.
Effect of initial concentration on percentage removal at pH 6.
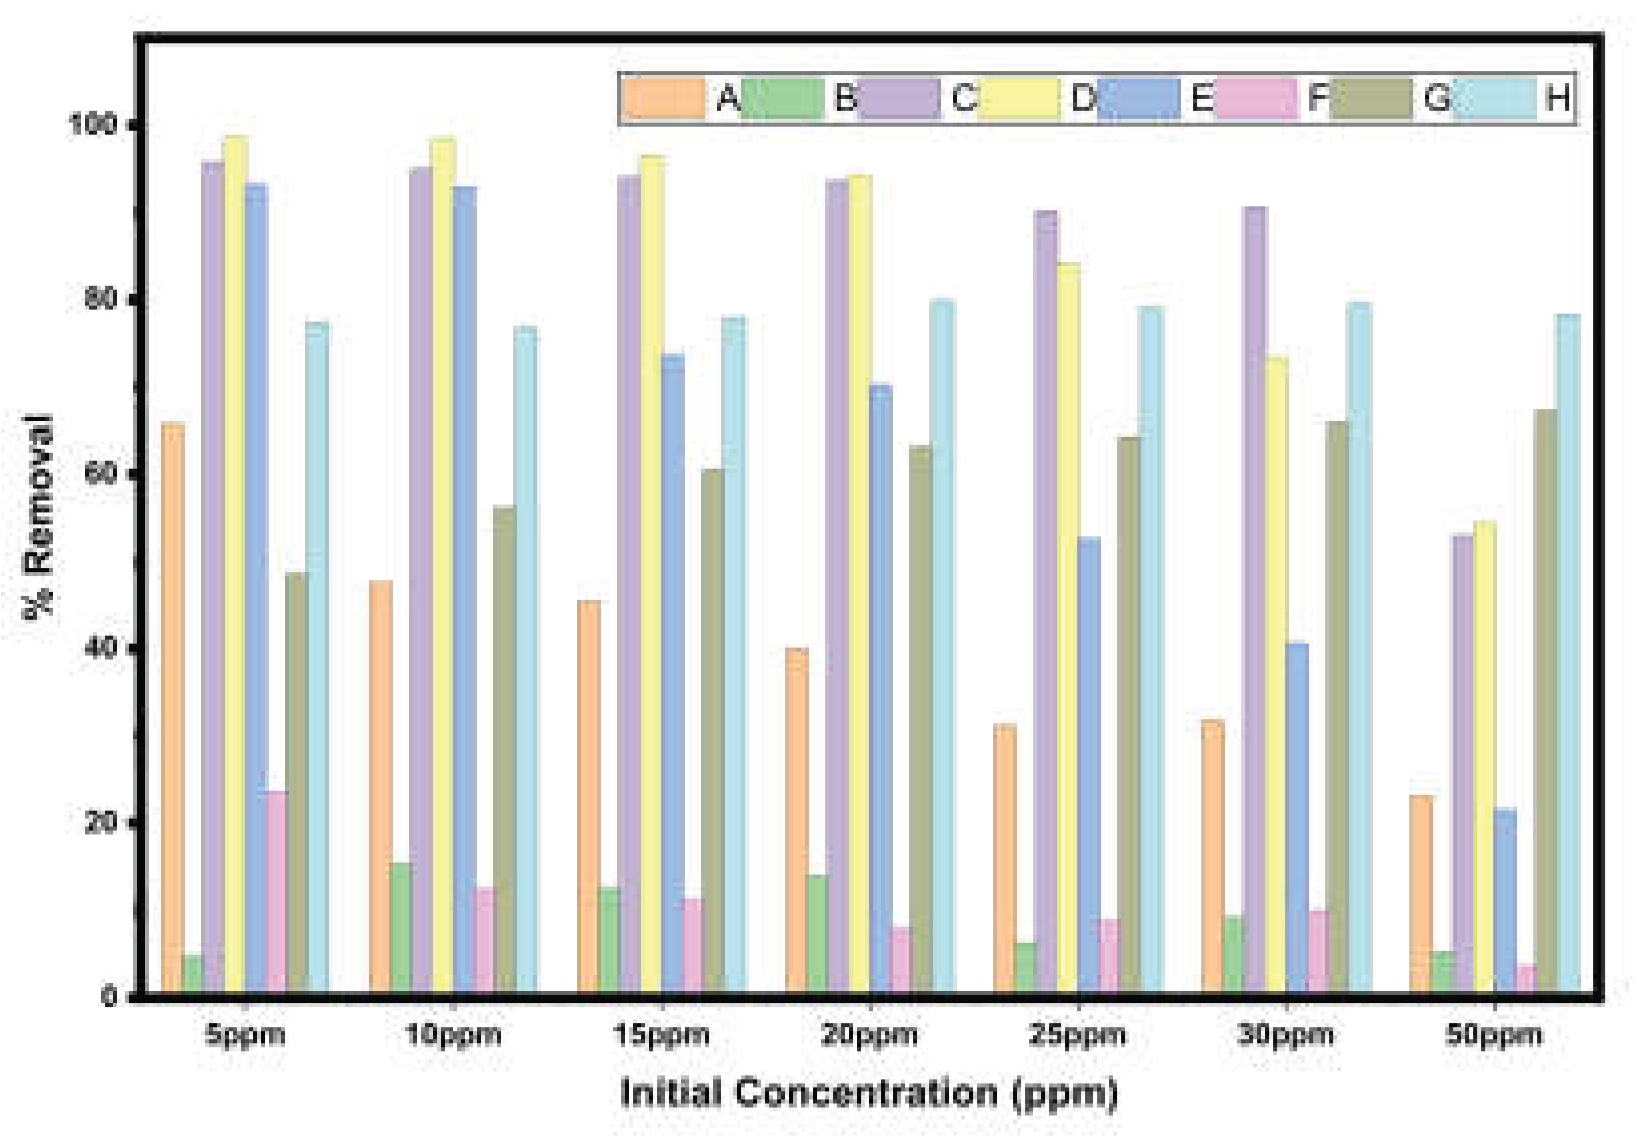
The influence of initial concentration on adsorption performance was evaluated at pH 6, the optimal adsorption pH. As shown in Figure 16, the percentage removal decreased progressively as C₀ increased from 5 to 50 mg·L⁻¹ for all hydrochar samples. At low concentrations (5–10 mg·L⁻¹), removal efficiencies were high because the number of available adsorption sites exceeded the number of metal ions in solution. As C₀ increased, the fixed number of active sites became limiting, resulting in lower removal efficiencies despite higher absolute uptake. This behavior is characteristic of site-limited adsorption systems and supports the application of Langmuir isotherm modeling in the subsequent section [108].
5. Conclusions
This study demonstrates that both pressure-reactor and microwave-assisted hydrochar are effective sorbents for Cu (II) removal, but their adsorption performance is governed by distinct structural and chemical characteristics arising from their carbonization pathways. Comprehensive characterization revealed that pressure-reactor hydrochar possesses more condensed, defect-rich carbon matrices with moderate oxygen functionality, while microwave-assisted hydrochar retains greater structural integrity, higher oxygen content, and more accessible functional groups. These differences were reflected in their thermal behavior, surface morphology, mineral composition, and surface charge properties.
SEM–EDS and XRD analyses confirmed that all hydrochar consist of an amorphous carbon framework embedded with crystalline mineral phases, which remain structurally stable during adsorption. Microwave-derived samples exhibited greater mineral exposure and more pronounced adsorption-induced surface modifications, consistent with their higher reactivity. FTIR analysis showed that Cu(II) binding occurs primarily through oxygenated functional groups, whereas microwave-assisted hydrochar engages a broader range of sites, including hydroxyl, phenolic, and carboxyl groups, resulting in stronger metal–oxygen coordination.
The pHpzc values near pH 6.0 for all samples indicate that the hydrochar surfaces become negatively charged at the working adsorption pH, promoting electrostatic attraction and facilitating inner-sphere complexation. Kinetic modeling further established that Cu (II) adsorption is predominantly governed by chemisorption, as evidenced by the superior fit of the pseudo-second-order model and the close agreement between the calculated and experimental equilibrium capacities. The intraparticle diffusion model revealed multi-stage adsorption behavior, with rapid external mass transfer followed by slower pore diffusion, but neither diffusion step served as the sole rate-limiting mechanism. Instead, adsorption proceeded through a combination of surface complexation and diffusion-assisted transport, with chemisorption controlling the overall rate.
Together, these findings provide a unified mechanistic framework in which Cu (II) uptake is driven by the interplay among surface functional groups, mineral-mediated interactions, electrostatic forces, and multi-stage diffusion processes. Microwave-assisted hydrochar consistently outperformed pressure-reactor hydrochar due to its higher density of reactive oxygenated sites, enhanced mineral accessibility, and stronger deprotonation behavior at the adsorption pH. This work highlights the importance of the carbonization pathway in tailoring hydrochar properties for targeted environmental applications and establishes microwave-assisted hydrochar as a promising, highly reactive material for heavy-metal remediation.
Supplementary Materials
The following supporting information can be downloaded at the website of this paper posted on Preprints.org, Figures A – H.
Author Contributions
Conceptualization, G.C. and V.I.; methodology, I.A.E.; software, O.E.O.; validation, M.E.O.; formal analysis, G.C.; investigation, M.E.O.; data curation, M.E.O.; writing—original draft preparation, M.E.O.; review and editing, E.O. and I.A.E; visualization and supervision, G.C.; funding acquisition, G.C.; formal analysis, H.M.P, V.L.D.B, and B.M.M. All authors have read and agreed to the published version of the manuscript.
Funding
This research received no external funding.
Institutional Review Board Statement
Not applicable.
Informed Consent Statement
Not applicable.
Data Availability Statement
The original contributions presented in this study are included in the article. Further inquiries can be directed to the corresponding author.
GenAI disclosure statement
Generative AI tools were used only for limited English-language editing. All experimental data, analyses, and tables were generated by the authors. The authors reviewed all AI-assisted content and take full responsibility for the manuscript.
Conflicts of Interest
The authors declare no conflicts of interest.
References
- Ojewumi, M.E.; Chen, G. Hydrochar production by hydrothermal carbonization: microwave versus supercritical water treatment. Biomass 2024, 4(2), 574–598. [Google Scholar] [CrossRef]
- Ojewumi, M.E.; et al. Sustainable Hydrochar Production from Biomass via Conventional Hydrothermal Carbonization: Optimization, Characterization, and Adsorption Capacity on Cu2+. Sustainability 2026. [Google Scholar] [CrossRef]
- Kumar, P. Transformation of Biomass Waste to Bioenergy: Current Status, Applications, Challenges, and Future Prospects. Biomass-Based Green Technol. Circ. Econ. 2025, 295–316. [Google Scholar]
- Prasad, S.; Gupta, V.C. Circular Economy on Utilization of Wastewater for Energy Recovery. Circ. Econ. 2024, 187–208. [Google Scholar]
- Saleh, A.M.; et al. Waste-to-Energy Innovations and Advances in Hydrothermal Carbonization, Microwave, and Pyrolysis Processes: A Review. AUIQ Complement. Biol. Syst. 2026. 3, 1, 84–99. [Google Scholar]
- Usman, M.; et al. Characterization and utilization of aqueous products from hydrothermal conversion of biomass for bio-oil and hydro-char production: a review. Green Chem. 2019, 21(7), 1553–1572. [Google Scholar]
- Xia, Y.; et al. Efficient immobilization of toxic heavy metals in multi-contaminated agricultural soils by amino-functionalized hydrochar: Performance, plant responses and immobilization mechanisms. Environ. Pollut. 2020, 261, 114217. [Google Scholar] [CrossRef] [PubMed]
- Xia, Y.; et al. Immobilization of heavy metals in contaminated soils by modified hydrochar: Efficiency, risk assessment and potential mechanisms. Sci. Total Environ. 2019, 685, 1201–1208. [Google Scholar] [CrossRef] [PubMed]
- Chen, Z.; et al. A critical review of hydrochar based photocatalysts by hydrothermal carbonization: synthesis, mechanisms, and applications. Biochar 2024, 6(1), 74. [Google Scholar] [CrossRef]
- Heidari, M. Challenges and Opportunities of Hydrothermal Carbonization of Biomass; University of Guelph, 2020. [Google Scholar]
- Krishnan, D. Graphene Oxide Assisted Biomass Carbonization; Northwestern University, 2017. [Google Scholar]
- Budai, A.; et al. Effects of pyrolysis conditions on Miscanthus and corncob chars: Characterization by IR, solid state NMR and BPCA analysis. J. Anal. Appl. Pyrolysis 2017, 128, 335–345. [Google Scholar] [CrossRef]
- Kozyatnyk, I.; Yakupova, I. Impact of chemical and physical treatments on the structural and surface properties of activated carbon and hydrochar. ACS Sustain. Chem. Eng. 2025, 13(6), 2500–2507. [Google Scholar] [CrossRef]
- Pei, B.; et al. Hard Carbon for Sodium-Ion Batteries: From Fundamental Research to Practical Applications. Adv. Mater. 2025, 37(39), 2504574. [Google Scholar]
- Pal, D.B.; Kapoor, A. Magnetic Biochar for Wastewater Remediation in the Textile Industry; CABI, 2026. [Google Scholar]
- Román, S.; et al. Hydrothermal carbonization: Modeling, final properties design and applications: A review. Energies 2018, 11(1), 216. [Google Scholar] [CrossRef]
- Mäkelä, M.; Benavente, V.; Fullana, A. Hydrothermal carbonization of lignocellulosic biomass: Effect of process conditions on hydrochar properties. Appl. Energy 2015, 155, 576–584. [Google Scholar] [CrossRef]
- 18. HPS, A.K., Environmental and Energy Technology.
- Dave, S.; Das, J.; Sillanpää, M. Bio-waste-derived Carbon Materials and their Applications, especially as Sensors; Elsevier, 2025. [Google Scholar]
- Ojewumi, M.; et al. Adsorption of Heavy Metals from an Aqueous Solution Using Activated Carbon Prepared from Ripe and Unripe Plantain Peels. J. Sustain. Mater. Process. Manag. 2024, 4(2), 111–123. [Google Scholar] [CrossRef]
- Ojewumi, M.E.; Chen, G. Microwave-Mediated Hydrothermal Carbonization (MWHTC) of food waste for conversion-ready feedstocks. Biofuels 2025, 16(7), 775–788. [Google Scholar]
- El-Hussein, A.; et al. Review of Preparation, Application, and Microbiological Reaction of Magnetic Biochar for Heavy Metal Removal from Polluted Soils. Chemistry 2026, 8(4), 47. [Google Scholar] [CrossRef]
- Zeeshan, M.; et al. Sustain. Chem. Environ. 23.
- Yao, F.; et al. Preparation of activated biochar with adjustable pore structure by hydrothermal carbonization for efficient adsorption of VOCs and its practical application prospects. J. Environ. Chem. Eng. 2023, 11(2), 109611. [Google Scholar] [CrossRef]
- Escudero-Curiel, S.; et al. From waste to resource: valorization of lignocellulosic agri-food residues through engineered hydrochar and biochar for environmental and clean energy applications—a comprehensive review. Foods 2023, 12(19), 3646. [Google Scholar] [PubMed]
- Ighalo, J.O.; et al. Biomass hydrochar: A critical review of process chemistry, synthesis methodology, and applications. Sustainability 2025, 17(4), 1660. [Google Scholar] [CrossRef]
- Kohzadi, S.; et al. Effect of hydrochar modification on the adsorption of methylene blue from aqueous solution: an experimental study followed by intelligent modeling. Water 2023, 15(18), 3220. [Google Scholar] [CrossRef]
- Zhu, G.; et al. Characterization and pelletization of cotton stalk hydrochar from HTC and combustion kinetics of hydrochar pellets by TGA. Fuel 2019, 244, 479–491. [Google Scholar] [CrossRef]
- Abdeldayem, O.M.; et al. Hydrothermal carbonization of Typha australis: Influence of stirring rate. Environ. Res. 2023, 236, 116777. [Google Scholar] [CrossRef] [PubMed]
- Alatalo, S.-M. Hydrothermal carbonization in the synthesis of sustainable porous carbon materials. 2016. [Google Scholar]
- Gaudino, E.C.; et al. From waste biomass to chemicals and energy via microwave-assisted processes. Green Chem. 2019, 21(6), 1202–1235. [Google Scholar] [CrossRef]
- Holliday, M.C.; Parsons, D.R.; Zein, S.H. Microwave-assisted hydrothermal carbonisation of waste biomass: The effect of process conditions on hydrochar properties. Processes 2022, 10(9), 1756. [Google Scholar] [CrossRef]
- Gao, Y.; Remón, J.; Matharu, A.S. Microwave-assisted hydrothermal treatments for biomass valorisation: a critical review. Green Chem. 2021, 23(10), 3502–3525. [Google Scholar] [CrossRef]
- Ojewumi, M.E.; et al. Comparative analysis on the bleaching of crude palm oil using activated groundnut hull, snail shell and rice husk. Heliyon 2021, 7(8), e07747. [Google Scholar] [CrossRef] [PubMed]
- Mohammed, Y.; et al. Kinetics and thermodynamics of heavy metal adsorption using activated carbon developed from Doum palm seeds. J. Basics Appl. Sci. Res. 2024. 2, 1, 177–194. [Google Scholar]
- Badmus, M.O.A.; Audu, T.O.K.; Anyata, B. Removal of copper from industrial wastewaters by activated carbon prepared from periwinkle shells. Korean J. Chem. Eng. 2007, 24(2), 246–252. [Google Scholar] [CrossRef]
- Memon, N.; et al. Synthesis, Characterization, and Application of Co-Al-Zn Layered Double Hydroxide/Hydrochar Composite for Simultaneous Removal of Cationic and Anionic Dyes. J. Chem. 2021, 2021(1), 1138493. [Google Scholar]
- Fairuzi, I.I.; Yuniarto, A. Determination Point of Zero Charge (PZC) of nZVI-MXene adsorbent for reduction of ciprofloxacin contaminants in wastewater. J. Serambi Eng. 2025, 10(2). [Google Scholar]
- Qin, X.; et al. Adsorption of humic acid from aqueous solution by hematite: effects of pH and ionic strength. Environ. Earth Sci. 2015, 73(8), 4011–4017. [Google Scholar]
- Hidmi, L.; Edwards, M. Role of temperature and pH in Cu (OH) 2 solubility. Environ. Sci. Technol. 1999, 33(15), 2607–2610. [Google Scholar]
- Marques, P.; Rosa, M.; Pinheiro, H. pH effects on the removal of Cu2+, Cd2+ and Pb2+ from aqueous solution by waste brewery biomass. Bioprocess Eng. 2000, 23(2), 135–141. [Google Scholar] [CrossRef]
- Perrin, D. Buffers for pH and metal ion control; Springer Science & Business Media, 2012. [Google Scholar]
- Gallo, C.D.G.; et al. Adsorptive removal of Basic Red 46 by raw corn cob: Optimization using response surface methodology, kinetic modeling, and thermodynamic analysis. J. Ecol. Eng. 2026, 27(5), 351–368. [Google Scholar] [CrossRef]
- Awad, A.A.S. Equilibrium and kinetics investigations for adsorption of aqueous lead ions using olive stone waste. J. Ecol. Eng. 2025, 26(5). [Google Scholar] [CrossRef] [PubMed]
- Castro-Jiménez, C.C.; et al. Azithromycin removal from water via adsorption on drinking water sludge-derived materials: Kinetics and isotherms studies. PLoS ONE 2025, 20(1), e0316487. [Google Scholar] [CrossRef] [PubMed]
- Oukhemamou, S.; et al. Biosorption of hexavalent chromium by a low-cost sorbent (potato peels): kinetics, equilibrium, and thermodynamics. Environ. Sci. Pollut. Res. 2026, 1–20. [Google Scholar]
- Ogbeh, G.O.; et al. Adsorption of organic micropollutants in water: A review of advances in modelling, mechanisms, adsorbents, and their characteristics. Environ. Eng. Res. 2025, 30(2). [Google Scholar]
- Oguanobi, N.C.; et al. Modeling and kinetics investigation of adsorptive properties and regeneration of modified clay on azo dyes removal from aqueous solution using artificial intelligence (ANN, ANFIS) and RSM. Sigma J. Eng. Nat. Sci. 2025, 43(1), 316–339. [Google Scholar] [CrossRef]
- Al-Shukaili, S.A.; et al. KINETIC MODELLING FOR ADSORPTIVE REMOVAL OF ACETIC ACID FROM ITS AQUEOUS SOLUTION USING BIOSORBENTS FROM WASTE BAOBAB AND TAMARIND OF DHOFAR. Int. J. Cogn. Comput. Eng. 2025. 6, 2, 101–119. [Google Scholar]
- Chu, K.H.; Hashim, M.A.; Basirun, A.A. Pseudo-First-Order Kinetics in Water Contaminant Adsorption: A Cautionary Note. Water Air Soil Pollut. 2026, 237(2), 1–6. [Google Scholar]
- Burye, T.; Sebastian, T. Kinetic evaluation of sulfur adsorption on La0. 7Sr0. 3VO3. 86-δ catalyst in methane atmosphere using pseudo-first and pseudo-second-order models. Int. J. Hydrogen Energy 2026, 233, 155070. [Google Scholar] [CrossRef]
- Mabayo, V.; et al. Revisiting isotherm and kinetic models in dye adsorption: assumptions, limitations, and common misinterpretations. Int. J. Environ. Sci. Technol. 2026, 23(6), 420. [Google Scholar] [CrossRef]
- Zhang, X.; et al. Co-combustion of municipal solid waste and hydrochars under non-isothermal conditions: Thermal behaviors, gaseous emissions and kinetic analyses by TGA–FTIR. Energy 2023, 265, 126373. [Google Scholar]
- Niu, Z.; et al. The Effect of Demineralization on Coal Functional Group Pyrolysis: Rank-Dependent Dual Mechanisms of Structural Reorganization and Mineral Catalysis. Asia-Pac. J. Chem. Eng. 2026, e70217. [Google Scholar]
- Rizwan, M.; et al. Controlled hydrothermal carbonization of wood-derived lignin-rich lignocellulose: Redefining pyrolytic pathways to tailored biochar and hydrogen-enriched syngas. J. Anal. Appl. Pyrolysis 2025, 107342. [Google Scholar] [CrossRef]
- Teğin, İ.; Polat, P.A.; Saka, C. Sulfur-engineered corncob biochar via pyrolysis–hydrothermal strategy: A sustainable bio-product for metal removal. Biomass Bioenergy 2026, 213, 109440. [Google Scholar]
- Twaróg, R.; Pielichowska, K. Citrus Waste Transformation into Functional Porous Carbon Biochar for Energy Conversion and Storage: Carbonization and Processing Opportunities for Sustainable and Cost-Effective Raw Materials. Energies 2026, 19(2), 340. [Google Scholar] [CrossRef]
- Unyay, H.; et al. Dry vs wet torrefaction of oxytree biomass: A comparative study on fuel properties and energy yield. Energy Convers. Manag. 2026. 350, 120974. [Google Scholar]
- Zhang, S.; et al. Pyrolytic and hydrothermal carbonization affect the transformation of phosphorus fractions in the biochar and hydrochar derived from organic materials: A meta-analysis study. Sci. Total Environ. 2024. 906, 167418. [Google Scholar] [CrossRef] [PubMed]
- Durak, H.; Yarbay, R.Z.; Türkmen, B. Atilgan. Hydrothermal Carbonization of Biomass for Hydrochar Production: Mechanisms, Process Parameters, and Sustainable Valorization. Processes 2026, 14(2), 339. [Google Scholar] [CrossRef]
- Lei, J.; et al. Oxygen enriched microporous carbon molecular sieves from coal-based asphalt via synergistic pre-oxidation and pre-carbonization for separation of cyclic aliphatic hydrocarbons and aromatics. Sep. Purif. Technol. 2026, 137469. [Google Scholar]
- Liu, Y.; et al. Deep eutectic solvent-assisted valorization of bamboo biomass into functional biochar for sustainable wastewater treatment. Sep. Purif. Technol. 2025, 134775. [Google Scholar]
- Jin, J.; Bao, Y.; Li, F. Enhanced removal of Cu2+ and Pb2+ ions from wastewater via a hybrid capacitive deionization platform with MnO2/N-doped mesoporous carbon nanocomposite electrodes. ACS Appl. Mater. Interfaces 2025, 17(9), 13783–13793. [Google Scholar] [PubMed]
- Zhou, W.; et al. Study on the effect of acid-aged PS and PLA on the adsorption characteristics of Cd2+, Cu2+ and Zn2+. J. Environ. Chem. Eng. 2025, 120355. [Google Scholar] [CrossRef]
- Bourachdi, S.E.; et al. Cu (II) removal from aqueous solution and real textile wastewater: mechanistic insights, process optimization, and theoretical modeling using advanced Chitosan–EDTA beads. Environ. Sci. Pollut. Res. 2026, 33(13), 5927–5964. [Google Scholar] [CrossRef] [PubMed]
- Rizwan, M.; et al. Catalyzed hydrothermal carbonization of sewage sludge: structural modification of hydrochar and its derived selective pyrolytic product distribution. RSC Adv. 2025, 15(51), 43905–43921. [Google Scholar] [CrossRef] [PubMed]
- Wang, J.; et al. Hydrothermal carbonization of heavy metal-contaminated biomass: migration, transformation, and ecological stability changes of metals. Int. J. Mol. Sci. 2025, 26(6), 2551. [Google Scholar] [CrossRef] [PubMed]
- He, S.; et al. Constructing a novel three-dimensional multi-stage pore structure to facilitate heavy metal adsorption on ceramsite. J. Environ. Sci. 2025. [Google Scholar]
- Youssef, W.M.; et al. Nitrogen-functionalized rice husk biochar prepared by dual carbonate activation for adsorption of cationic and anionic dyes: kinetic, isotherm, and thermodynamic insights. Biomass Convers. Biorefinery 2026, 16(10), 231. [Google Scholar] [CrossRef]
- Kociołek-Balawejder, E.; et al. Sulphidation of Cu 2+, CuO and Cu 2 O within the matrix of carboxylic cation exchangers–compositional, morphological and thermal properties of Cu x S containing composites. React. Chem. Eng. 2025, 10(5), 1077–1095. [Google Scholar] [CrossRef]
- Sun, M.; et al. Porous biochar adsorbent prepared by cold isostatic pressure pretreatment and adsorption performance of Cr (VI) at C and N dual active sites. J. Environ. Chem. Eng. 2025, 118286. [Google Scholar]
- Guo, Z.; et al. Visualizing Electrochemical CO2 Reduction Reaction: Recent Progress of In Situ Liquid Cell Transmission Electron Microscopy. Adv. Funct. Mater. 2025, 35(41), 2500915. [Google Scholar]
- Đukanović, N.; et al. Comparative Study of Biochar from Different Biomass Feedstocks: Toward Sustainable Resource Utilization and Environmental Applications. Molecules 2025, 31(1), 37. [Google Scholar] [CrossRef] [PubMed]
- Azimi-Juybari, H.; Mohagheghi, M.-M.B. The significance of the synthesis method for graphite-like carbon: effects of acidifying agents on properties and carbon monoxide sensitivity. J. Mater. Sci. Mater. Electron. 2025, 36(5), 319. [Google Scholar] [CrossRef]
- Al-Amin, K.; et al. Fourier transform infrared spectroscopic technique for analysis of inorganic materials: a review. Nanoscale Adv. 2025. 7, 21, 6677–6702. [Google Scholar]
- Wen, X.; et al. Controllable synthesis of hierarchical pores of carboxyl-functionalized coconut shell activated carbon and its formaldehyde adsorption properties. J. Environ. Chem. Eng. 2025, 120878. [Google Scholar]
- Wang, K.; et al. Functional Group Engineering of Single-Walled Carbon Nanotubes for Anchoring Copper Nanoparticles Toward Selective CO2 Electroreduction to C2 Products. Small 2025, 21(21), 2502733. [Google Scholar]
- Li, W.; et al. The dual selective adsorption mechanism on low-concentration Cu (II): Structural confinement and bridging effect. J. Hazard. Mater. 2025. 489, 137506. [Google Scholar]
- Yuniarto, A.; et al. Photodegradation of enrofloxacin via coconut fiber-derived hydrochar@ OCN composite. J. Ecol. Eng. 2026, 27(6), 289–311. [Google Scholar] [CrossRef] [PubMed]
- Hongthong, S.; et al. Mitigating Post-Recycling Plastic Waste Pollution Through Co-Hydrothermal Liquefaction with Freshwater Algal Biomass: Pathways to Biofuel and High-Value Products as Resource Recovery: Chi River, Thailand. Sustainability 2026, 18(6), 2962. [Google Scholar]
- Dubey, S.P.; et al. Surface-engineered naturally-derived xerogel for boosting chelation of refractory contaminants: From low-temperature hydrochar strategies, characterization probes to underlying mechanisms. 2026. [Google Scholar]
- Chen, G.; et al. Molecular structural evolution during coal oxidation based on in situ FTIR and Raman spectroscopy. J. Anal. Appl. Pyrolysis 2025. 191, 107209. [Google Scholar]
- Shi, N.; et al. Molecular structure and formation mechanism of hydrochar from hydrothermal carbonization of carbohydrates. Energy Fuels 2019, 33(10), 9904–9915. [Google Scholar] [CrossRef]
- Al-Gaashani, R.; et al. Productivity evaluation, multi-scale characterisation, and safety assessment of biochar derived from green and woody agricultural biomass in Qatar. Sci. Rep. 2026. [Google Scholar] [CrossRef] [PubMed]
- Aminu, A.; et al. Valorization of Pyrolyzed Waste Polystyrene and Cashew Nut Shell Oil (CNSO) as a Sustainable Hybrid Binder for High-Performance Paint. Int. J. Res. Sci. Innov. (IJRSI) 2026, 13(2). [Google Scholar] [CrossRef]
- Li, X.; et al. Catalytic effects of key compositions in biomass ashes on coal gasification reactivity and structural evolution characteristic during gasification process. J. Clean. Prod. 2025. 499, 145197. [Google Scholar]
- Kuang, B.; et al. Recovery of heavy metals from copper slag by slow cooling: Mechanism of matte growth and transformation behaviors of heavy metals. Sep. Purif. Technol. 2025, 361, 131327. [Google Scholar] [CrossRef]
- Yan, L.; et al. Mechanistic insight into Cu (II)-mediated transformation of oxytetracycline on Fe-bearing smectite: Evidence from kinetic modeling. Environ. Pollut. 2025. 369, 125865. [Google Scholar]
- Madhusudhan, A.; et al. A comparative study of different activation methods for hydrochar: surface properties and removal of pharmaceutical pollutant in water. Environ. Sci. Pollut. Res. 2025, 32(30), 18107–18120. [Google Scholar] [CrossRef] [PubMed]
- Chen, H.; et al. Roles of different anions on hydrochar formation of lignocellulosic biomass. Chem. Eng. J. 2025. 508, 160841. [Google Scholar]
- Zhang, P.; et al. Copper-functionalized hydrochar from swine manure with complexation sites for selective adsorption of tetracycline antibiotics. Sep. Purif. Technol. 2025. 359, 130671. [Google Scholar]
- Setiawan, W.; et al. Low-cost biosorbent derived from Hermetia illucens larval shells for competitive removal and adsorption mechanisms of lead (II), copper (II), and iron (III) ions. J. Ecol. Eng. 2026, 27(5), 57–73. [Google Scholar] [CrossRef]
- Zaccariello, L.; et al. Steam activated hydrochar from wine waste for the removal of pharmaceutical micropollutants from water. Sci. Rep. 2025, 15(1), 34169. [Google Scholar] [CrossRef] [PubMed]
- Chu, K.H.; Bollinger, J.-C.; Kierczak, J. Pseudo-first-order kinetics in environmental adsorption: Why are there two distinct equations? Environ. Surf. Interfaces 2025. [Google Scholar]
- Li, X.; et al. Kinetic study of the fluoride removal by gypsum using revised pseudo-second-order model: Insights on the surface adsorption and precipitation. Surf. Interfaces 2025, 62, 106304. [Google Scholar]
- Guo, F.; et al. Preparation of an adsorbent from citric acid-functionalized enzymatic hydrolysis lignin residue with Fe3O4 loading: Insights into Cu2+ adsorption performance and mechanisms. Int. J. Biol. Macromol. 2026, 150756. [Google Scholar] [PubMed]
- Elbager, M.A.; Al-Suwaiyan, M.; Saleh, T.A. Mechanistic insights, RSM optimization, and machine learning prediction for p-nitrophenol removal using polymer-modified carbon fibers derived from palm waste. J. Mol. Liq. 2026, 129527. [Google Scholar]
- Bourliva, A. Heavy Metal Adsorption and Desorption Behavior of Raw Sepiolite: A Study on Cd (II), Cu (II), and Ni (II) Ions. Minerals 2025, 15(11), 1110. [Google Scholar] [CrossRef]
- Sutherland, C. A method of classifying the influence of intraparticle diffusion in adsorption systems: characteristic curves of the diffusion-chemisorption kinetic model. Environ. Toxicol. Chem. 2025, 44(5), 1209–1221. [Google Scholar] [CrossRef] [PubMed]
- Wizan, A.; et al. Resin architecture as a governing factor in uranium (VI) adsorption: Integrated kinetic and equilibrium modeling of gel-type and macroporous systems. J. Water Process Eng. 2026. 84, 109791. [Google Scholar] [CrossRef]
- Wei, W.; Ren, N. Effects of activating agent and pyrolysis temperature on the pore structure and adsorption performance of sweet potato vine-based activated carbon. RSC Adv. 2026, 16(20), 18232–18241. [Google Scholar] [CrossRef] [PubMed]
- Salehi, M. Surface complexation at charged organic surfaces. Rev. Mineral. Geochem. 2025, 91(1), 149–173. [Google Scholar] [CrossRef]
- Youcef, S.; et al. Chemical surface characteristics and adsorptive efficiency of olive stone–based activated carbon in Cu (II) and Zn (II) removal: comparative evaluation with commercial carbons. React. Kinet. Mech. Catal. 2026, 1–24. [Google Scholar]
- Chaimaa, A.; et al. Adsorption kinetics and surface interactions of organic dyes and copper ions on a novel biosorbent: raw artichoke hay. React. Kinet. Mech. Catal. 2026, 1–26. [Google Scholar]
- 105; Afolagboye, L.O.; et al. Next Mater. [CrossRef] [PubMed]
- Sadaoui, L.; et al. Activated carbon derived from Cupressus sempervirens cones for hexavalent chromium removal from aqueous solutions. React. Kinet. Mech. Catal. 2026, 1–27. [Google Scholar] [CrossRef] [PubMed]
- Zheng, S.; et al. Synergistic regulation of oxygen vacancies and surface hydroxyl groups in Fe-doped CeO2 for enhanced fluoride adsorption. Chem. Eng. J. 2026, 172566. [Google Scholar] [CrossRef]
- Nguyen, T.A.H.; et al. Phosphorus Removal from Aqueous Solutions Using La (III) Modified Sugarcane Bagasse-Derived Hydrochar: Insights into Adsorption Behaviors and Mechanisms. J. Water Environ. Technol. 2026, 24(2), 195–212. [Google Scholar] [CrossRef]
Figure 1.
TGA of PR-C samples .
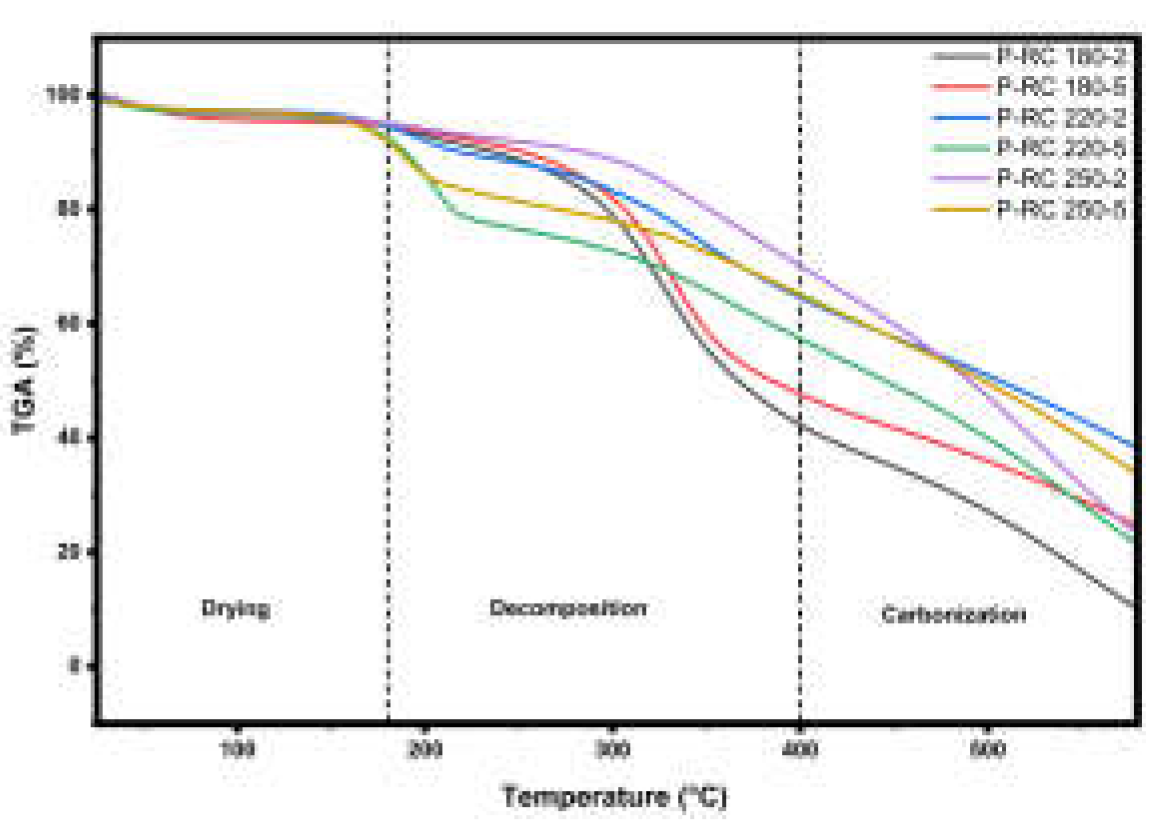
Figure 2.
TGA of MR-C samples.
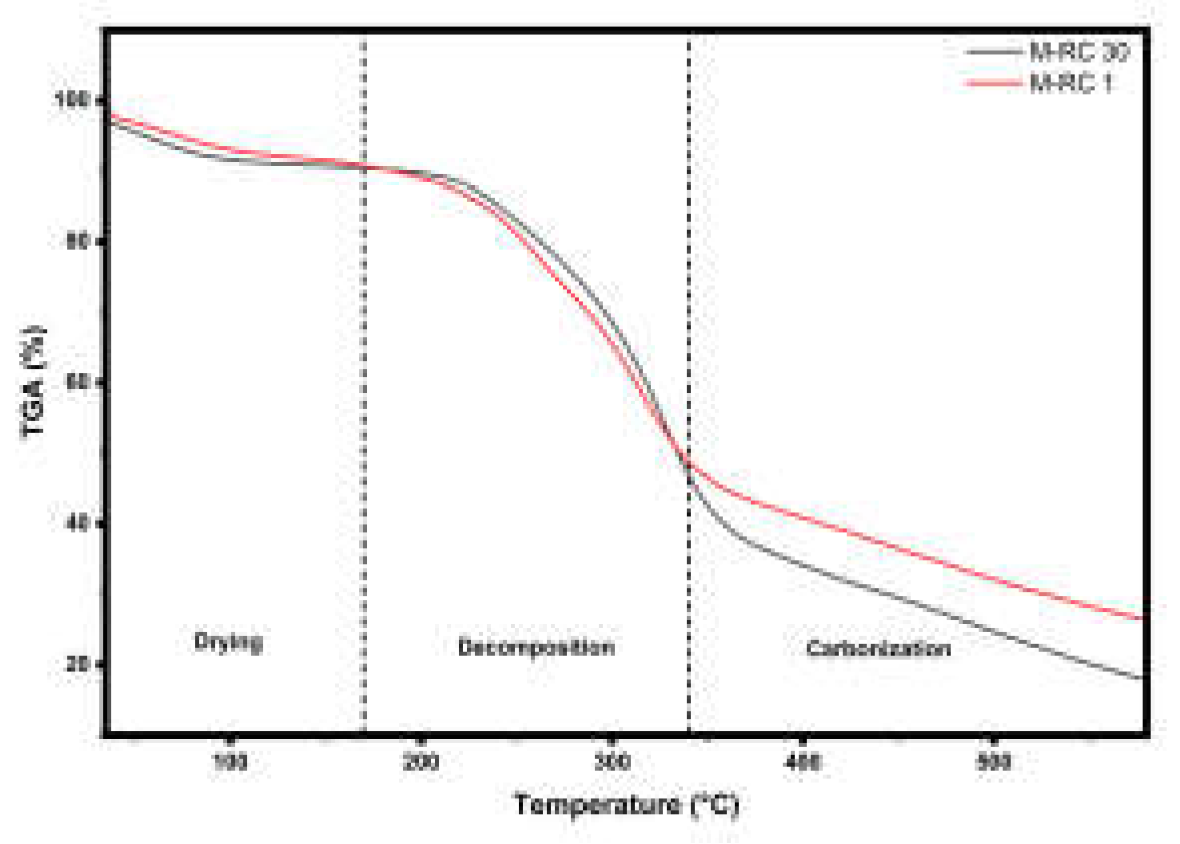
Figure 3.
DTG of PR-C.
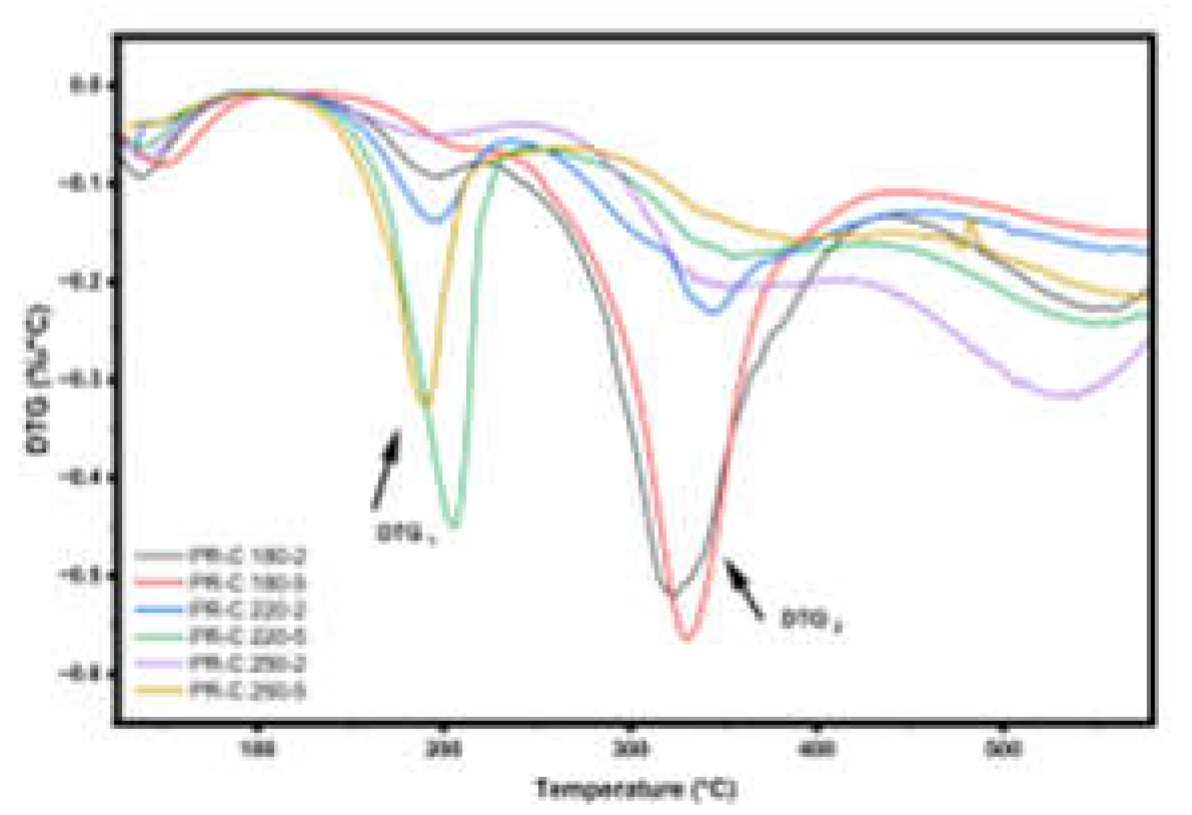
Figure 4.
DTG of MW-C.
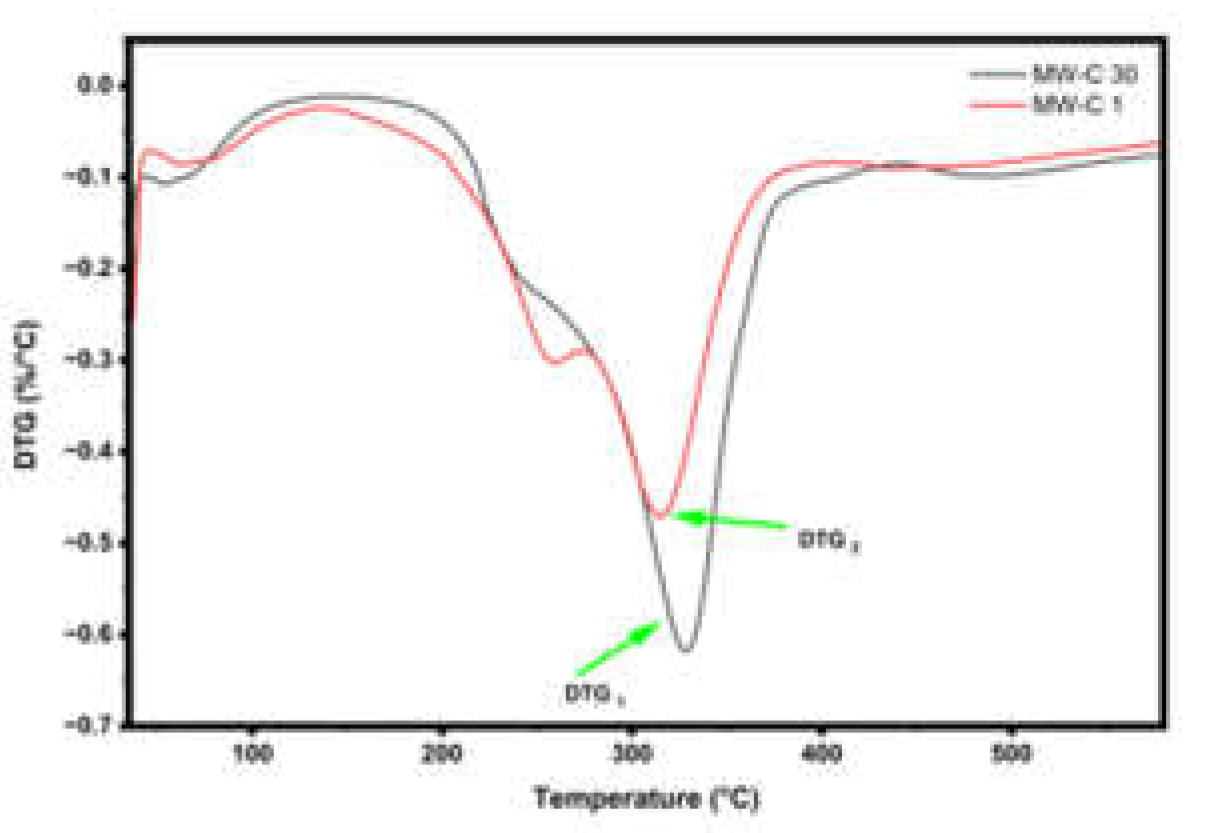
Disclaimer/Publisher’s Note: The statements, opinions and data contained in all publications are solely those of the individual author(s) and contributor(s) and not of MDPI and/or the editor(s). MDPI and/or the editor(s) disclaim responsibility for any injury to people or property resulting from any ideas, methods, instructions or products referred to in the content. |
© 2026 by the authors. Licensee MDPI, Basel, Switzerland. This article is an open access article distributed under the terms and conditions of the Creative Commons Attribution (CC BY) license.
Copyright: This open access article is published under a Creative Commons CC BY 4.0 license, which permit the free download, distribution, and reuse, provided that the author and preprint are cited in any reuse.


