

Submitted:
16 June 2026
Posted:
17 June 2026
You are already at the latest version
Abstract
This research addressed the lack of standardization in the nutritional interpretation of pecan nut kernels. The objective was to evaluate the effect of kernel defatting on nutrient concentration, generate correction factors for each element, and establish nutritional standards through the Integrated Differential Diagnosis (IDD). For this purpose, 222 kernel samples of the Western Schley variety were analyzed, collected at the “El Eden” orchard from 2023 to 2025 in Aldama, Chihuahua, Mexico. In these samples, the concentration of macro and micronutrients was determined on a defatted basis and compared with their non-defatted equivalent using a comparison of sample means by paired observations. From this, correction factors were calculated, and subsequently, nutritional standards were generated, which were validated internally and externally in an orchard with similar conditions. The results revealed that defatting significantly increased the concentrations of N, P, K, Mg, Fe, Mn, and Zn, while Ca and Na showed a significant decrease, and Cu showed no changes in its concentration. The correction factors allowed the transformation of concentrations from the defatted basis to the non-defatted basis, facilitating comparison with previously reported literature. The validation of the standards indicated that they were useful for detecting nutritional imbalances consistent with soil characteristics, highlighting deficiencies of P, Mn, and Cu, as well as an excess of Na.
Keywords:
pecan
; kernel
; integrated differential diagnosis
; IDD
; defatting
; correction factors
; nutritional standards
; mineral composition
1. Introduction
The pecan tree (Carya illinoinensis [Wangenh.] K. Koch) is a crop of great global importance due to the nutritional and economic value of its nut [1,2]. It is grown in 54 countries, with China, the United States, Turkey, Iran, Chile, and Mexico as the main producers [3]. In Mexico, 165,660 hectares were planted in 2024, with a production of 168,733 tons [4].
Pomological parameters, mainly yield and quality, are conditioned by several factors, among which the nutritional status of the trees stands out [5]; this is generally determined through foliar analysis [6,7]. On the other hand, direct kernel analysis has been proposed because it allows us to know the quality of the fruit destined for human consumption [8] and to detect possible nutritional imbalances that are not always reflected in foliar tissue [9].
A problem when analyzing the kernel is that its composition is rich in lipids, which can represent 65 to 75% of its dry weight, making extraction difficult or altering compound quantification [10]. For this reason, some studies perform defatting on kernel samples using solvents such as hexane, chloroform, and methanol [11,12]. As a result, homogeneous samples are obtained, but by reducing the sample mass, results may be altered, since the concentration of some minerals may increase [13] while others may be lost due to mechanical carryover or because they are associated with the lipid fraction of the kernel [14,15].
It is important to consider this bias because most studies report concentrations on a non-defatted kernel basis [16,17]. Others have worked with the defatted basis, especially in studies of bioactive compounds [11,18] and nutritional content [12]. The lack of standardization can hinder comparison among studies. For this reason, correction factors are proposed to transform concentrations on a defatted basis to their non-defatted equivalent. These factors vary according to the element, defatting methodology, and seed type [12,14]. For example, in soybean and flaxseed, defatting has been documented to cause significant losses of P, Mn, Zn, Na, and Mg [14], while in sunflower, losses of Fe and Mg have been reported [15]. For pecan, no studies have reported the effect of defatting on macro- and micronutrient concentrations, nor have specific correction factors been developed for this species.
Another problem is how to interpret kernel nutrient concentrations for use in further research. Comparing with values proposed in the literature is insufficient because it does not consider edaphoclimatic variability and crop management [19]. An alternative is Integrated Differential Diagnosis (IDD), developed by Uvalle-Bueno et al. [20] and applied to crops such as apple [21,22], blueberry [23], pomegranate [24], and pecan [25]. IDD is based on universal biochemical principles (enzyme kinetics, cellular energy charge, and the Q10 thermal coefficient) and differs from other systems such as DRIS (Diagnosis and Recommendation Integrated System) and CND (Compositional Nutrient Diagnosis) mainly due to its physiological foundation and its ability to distinguish whether a problem originates from a nutritional or physiological imbalance [20,24].
The objectives of this study were: to determine the effect of defatting on the concentrations of N, P, K, Ca, Mg, Na, Fe, Mn, Zn, and Cu in pecan kernels of the Western Schley variety; to generate correction factors for each element to convert concentrations from a defatted basis to a non-defatted basis; and finally, to generate nutritional sufficiency ranges using the IDD method, both on a defatted basis and on a corrected non-defatted basis, and to validate these ranges in a different orchard with similar soil and climate conditions but different management.
2. Materials and Methods
2.1. Study Area
The site where the samples used in this research were collected was the orchard called “El Edén” with a Surface of 30 hectares, located in the municipality of Aldama, Chihuahua, Mexico. It is located at coordinates 28.838732° N and -105.893811° W at an altitude of 1268 m. The prevailing climate is warm semi-arid with an average annual temperature of 20.8 °C and an average precipitation of 429.4 mm.
The orchard soil has a texture classified as clay loam (23.23% sand, 38.54% clay, 38.13% silt). Regarding its chemical characteristics, a pH of 7.56, an electrical conductivity of 0.880 dS m−1, a calcium carbonate concentration of 4.37%, and organic matter content of 1.74% were reported. Macronutrient concentrations (g kg−1) were: 0.0658 N, 0.0319 P, 0.333 K, 2.87 Ca, 0.492 Mg, and 0.508 Na; and micronutrients (mg kg−1): 1.84 Cu, 2.84 Fe, 11.71 Mn, and 8.44 Zn.
The irrigation water used in the orchard had a pH of 7.94, an electrical conductivity of 0.335 dS m−1, and a sodium adsorption ratio of 4.71, corresponding to a C2-S1 classification.
To determine the nutritional status of the trees, a foliar analysis was performed, which found macronutrient concentrations (g kg−1) of 25.1 N, 1.8 P, 9.7 K, 26.2 Ca, 5.0 Mg, and 0.13 Na. Regarding micronutrients (mg kg−1), values of 6.04 Cu, 135.82 Fe, 899.82 Mn, and 48.66 Zn were recorded.
2.2. Sample Collection
Pecan nut samples of the Western Schley variety used in this research were collected during the 2023, 2024, and 2025 growing seasons. In each season, 74 samples were collected, each consisting of 30 nuts. The trees from which samples were collected were randomly selected; all were 44-year-old adult trees, planted at a density of 69 trees per hectare. These trees have been reported to have an average yield of 2.50 t ha−1 and 157 nuts per kilogram.
2.3. Kernel Defatting
The analyses performed in this research were carried out at the Soil Laboratory of the Faculty of Agrotechnological Sciences of the Autonomous University of Chihuahua. To begin the defatting process, the kernel was manually separated from the shell, and once the samples were prepared, defatting was performed according to the methodology of Villarreal-Lozoya et al. [11] with slight modifications. The ground sample was mixed and homogenized with hexane at a 1:20 (w/v) ratio. Subsequently, the mixture was vacuum filtered at 35 °C using a Buchner funnel and slow-speed filter paper. The retained solid was subjected to two additional washes with hexane following the same procedure. Once defatted, the sample was dried in an oven at 35 °C for 2 h and stored in plastic bags at 4 °C until nutrient analyses were performed.
2.4. Nutrient Analysis
For the nutrient analysis of the defatted pecan kernel basis, N concentration was obtained using the Kjeldahl method (Novatech®, Houston, TX, USA; Micro Kjeldahl apparatus Labconco®, Kansas, MO, USA), and P using the ammonium metavanadate (NH4VO3) method. The determination of the concentration of elements such as Ca, K, Mg, Na, Fe, Mn, Zn, and Cu was performed using tri-acid digestion (HNO3:HClO4:H2SO4, 10:10:25 v:v:v), applying 25 mL of the acid mixture on a hot plate under a fume hood. Element quantification was carried out by atomic absorption spectrophotometry using an Analyst 100® spectrometer (PerkinElmer®, Waltham, MA, USA).
2.5. Correction Factor
To evaluate the effect of kernel defatting on each nutrient element, an comparison of simples means by paired observations was used. Sixteen nuts of the same variety and origin were taken; after manually removing the shell, the kernel was separated into two portions: one was analyzed without defatting and the other was defatted according to the previously described protocol. Concentrations of N, P, K, Ca, Mg, Na, Fe, Mn, Zn, and Cu were measured under both conditions, and the data were statistically analyzed using Student’s t-test for paired samples. Based on the means obtained, the relative correction factor was estimated:
A correction factor < 1 indicates that the element becomes concentrated in the defatted fraction. A factor > 1 suggests relative loss.
To verify whether these factors were applicable to the samples from the three years, the concentrations on the defatted basis of the 2023-2025 samples were compared with those used for the paired study. No significant differences were found (independent samples t-test, p > 0.05), indicating that the elemental concentrations of the samples were similar and that the factors could be used. Thus, the mean concentration of each element in the defatted samples from the three years was multiplied by the corresponding correction factor for each element, obtaining the estimated values for non-defatted kernels.
2.6. Integrated Differential Diagnosis
To generate nutritional standards for both the defatted pecan kernel basis and the estimated non-defatted kernel basis, the IDD methodology proposed by Uvalle-Bueno et al. [20] was used. This approach allows us to distinguish whether a nutrient deficiency is related to the availability of elements in the soil or to physiological alterations caused by climatic conditions or plant metabolic processes [21,22,23,25]. This methodology uses critical values, which are based on universal biochemical principles, such as enzyme kinetics, cellular energy charge, and the Q10 thermal coefficient [20,24].
Figure 1.
Flowchart for the identification of nutritional imbalances (NI) and/or physiological imbalances (PI) and for the determination of the Suggested Interpretation Range (SIR) between observed conditions and those considered ideal [23].
Figure 1.
Flowchart for the identification of nutritional imbalances (NI) and/or physiological imbalances (PI) and for the determination of the Suggested Interpretation Range (SIR) between observed conditions and those considered ideal [23].
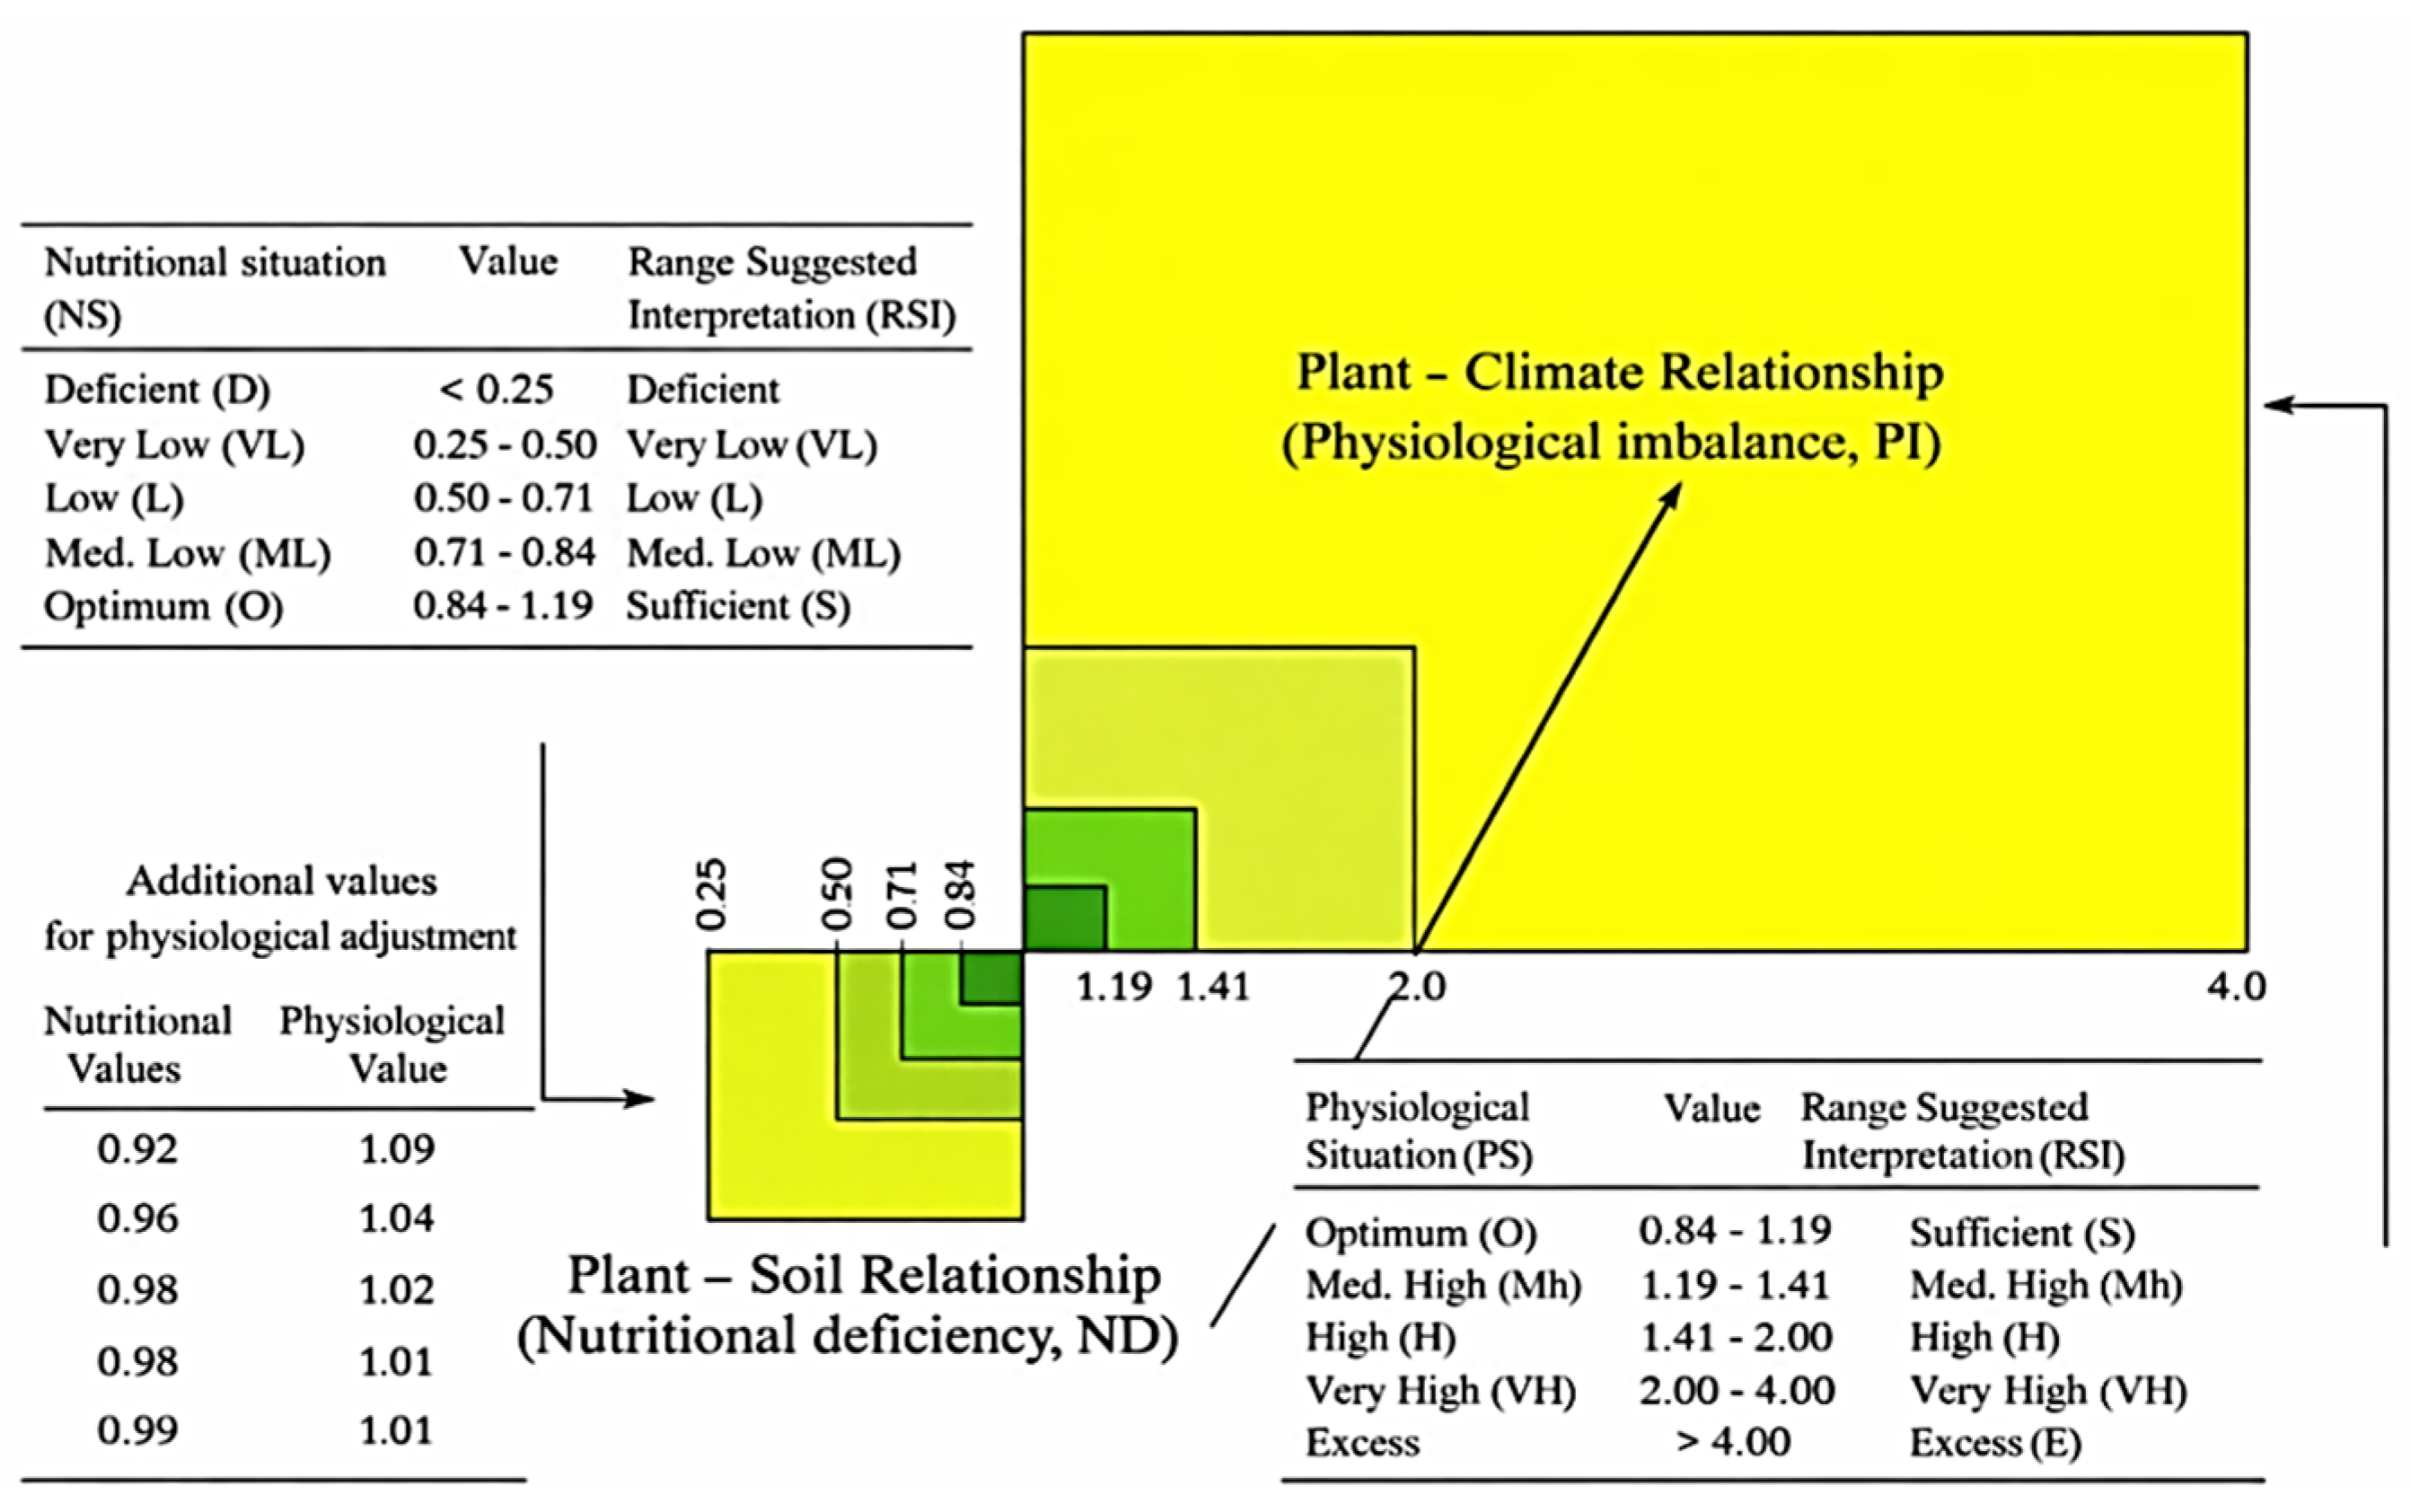
To construct the standard, the mean concentration of each nutrient from the 222 analyzed samples was used, without filtering by yield or visual symptoms, assuming that this population represents the typical variability range of the orchard. From this, the intervals for the nine IDD categories were generated by multiplying the mean concentration by each critical value of the scale (0.25, 0.5, 0.71, 0.84, 1.19, 1.41, 2, 4, and 16), where the product obtained for a given critical value corresponds to the upper limit of the associated category. This same procedure was applied to all macro- and micronutrients, using their respective means on a defatted basis (Table 1) and on an estimated non-defatted kernel basis (Table 2).
2.7. Validation of Standards
For the validation of the standards, pecan nut samples of the Western Schley variety were collected from randomly selected trees during the 2025 growing season from a neighboring orchard, located in the same municipality of Aldama, Chihuahua. It should be mentioned that this orchard has an area of 300 hectares, from which the samples were obtained. This orchard shares the same edaphic and climatic conditions as the “El Edén” orchard, but has different cultural management practices, such as fertilization programs, irrigation, and phytosanitary control.
The soil of this orchard has a texture classified as clay loam, consisting of 29.63% sand, 36.48% clay, and 33.89% silt. Regarding its chemical characteristics, a pH of 7.78, an electrical conductivity of 2.02 dS m−1, a calcium carbonate concentration of 2.33%, and 0.51% organic matter were reported. Macronutrient concentrations (g kg−1) were: 0.0460 N, 0.00764 P, 0.443 K, 3.45 Ca, 0.406 Mg, and 0.815 Na; and micronutrients (mg kg−1): 0.56 Cu, 1.11 Fe, 5.03 Mn, and 1.25 Zn.
No additional water analysis was performed in the neighboring orchard, assuming that conditions are the same because they share the same water supply source.
To determine the nutritional status of the trees in the neighboring orchard, a foliar analysis was performed, which found macronutrient concentrations (g kg−1) of 27.9 N, 2.5 P, 11.6 K, 16.4 Ca, 10.5 Mg, and 0.3 Na. Regarding micronutrients (mg kg−1), values of 7.62 Cu, 142.88 Fe, 527.42 Mn, and 35.92 Zn were recorded.
The first was an external validation with 21 non-defatted kernel samples from the neighboring orchard, compared against the nutritional standard ranges for the estimated non-defatted kernel basis (Table 2). The second was an additional external validation with 32 defatted samples from the same neighboring orchard, compared against the nutritional standard ranges for the defatted basis (Table 1). The third was an internal validation with 20 defatted samples from the same “El Edén” orchard, but independent from those used to generate the nutritional standard, also compared against Table 1 to evaluate internal consistency.
3. Results
3.1. Correction Factors Obtained
When comparing the paired means, defatted basis versus non-defatted basis of pecan kernels, significant differences (p < 0.05) were observed in practically all analyzed elements. The only exception was Cu, where no significant difference was detected (p > 0.05). The correction factors obtained were as follows: N = 0.64, P = 0.62, K = 0.35, Mg = 0.53, Fe = 0.80, Mn = 0.47, Zn = 0.53, Ca = 1.68, Na = 1.55. For Cu, a CF of 1.00 was assumed.
3.2. Nutritional Standards
Table 1 presents the nutritional standard calculated directly from the concentrations measured in the defatted samples (original basis). Table 2 shows the values corrected to non-defatted kernels using factors applied only to N, P, K, Mg, Fe, Mn, and Zn. No correction was applied to Ca and Na (they are reported only in Table 1). For Cu, the same concentration is assumed under both conditions
3.3. Characteristics of the Validation Sites
To facilitate interpretation of the validation results, Table 3 compares soil, foliar, and kernel conditions between the “El Edén” orchard, where the standards were generated, and the neighboring orchard used for external validation.
3.4. Validation of Nutritional Standards
3.4.1. External Validation with Non-Defatted Samples
Twenty-one non-defatted kernel samples from a neighboring orchard were analyzed. These values were directly compared with the standard corrected to non-defatted kernels (Table 2). The results are shown in Table 4.
All samples were deficient in P, Mn, and Cu. This coincides with soil analyses of the neighboring orchard (Table 3), which reported low concentrations of P (18.33 kg ha−1), Mn (5.03 mg kg−1), and Cu (0.56 mg kg−1). In contrast, N, Fe, and Zn showed a majority of samples in the sufficient range (76%, 67%, and 62%, respectively). For Mg, most samples were classified as high and very high in the neighboring orchard, reflecting soil conditions (EC = 2.02 dS m−1, Na = 815 mg kg−1), which differ from sites reported in the international literature.
3.4.2. External Validation with Defatted Samples
Thirty-two defatted pecan kernel samples from the same neighboring orchard were analyzed and compared with the standard on a defatted basis (Table 1). The results are shown in Table 5.
Na concentrations were entirely classified above the sufficient range (41% in “very high”), which is consistent with the high electrical conductivity of the neighboring orchard soil (2.02 dS m−1) and its elevated Na concentration (815.22 mg kg−1) (Table 3). Fe and Zn concentrations showed a tendency toward high values, with 59% and 66% in “high”, respectively. A difference was observed in P classification between Table 4 (all deficient) and Table 5 (78% sufficient).
3.4.3. Internal Validation
To evaluate whether the nutritional standard on a defatted basis has internal consistency, 20 defatted samples from the same “El Edén” orchard, different from those used to generate the standard, were compared against Table 1. The results are shown in Table 6.
Between 55% and 90% of the samples per nutrient fell into the “sufficient” category, with the highest values for N (80%), K (70%), Na (90%), and Mn (65%). This behavior is consistent with soil analyses of the “El Edén” orchard (Table 3), which showed adequate concentrations of N (157.92 kg ha−1), K (333.25 mg kg−1), and Mn (11.71 mg kg−1), as well as a moderate Na level (507.50 mg kg−1) that did not generate toxicity in the kernel. The presence of some samples in categories from moderately low to moderately high reflects the natural variability of the orchard and is expected for a nutritional standard constructed from the mean of a high-yielding population. This confirms the internal validity of the standard.
4. Discussion
The pecan kernel contains approximately 65-75% lipids, while proteins, fiber, carbohydrates, and minerals make up 25-35% [10,11]. It has been demonstrated that oil extraction, using mechanical or chemical methods, often leads to a higher concentration of nutrients compared to non-defatted samples [12,14]. This may be because once the oil is extracted, the total sample weight decreases while nutrients remain in the defatted fraction, increasing their concentration per gram of sample [14]. In this study, the same behavior was observed for most of the analyzed elements, including N, P, K, Mg, Fe, Mn, and Zn, confirming that lipid extraction with hexane concentrated these nutrients in the defatted fraction.
However, this increase does not always occur, as some nutrients may be lost due to mechanical carryover during lipid extraction. This has been reported in soybean (Glycine max L.), where losses of P, Mn, and Zn were observed [14]; in flaxseed (Linum usitatissimum L.), losses of Na and Mg were found [13,14]; and in sunflower (Helianthus annuus L.), losses of Fe and Mg were also documented [15]. In the present study, this behavior was particularly evident for Ca and Na, whose concentrations decreased after defatting, in contrast to most other elements that became concentrated. For Cu, no significant differences were found, indicating that this element is not affected by the defatting process under the experimental conditions used. These results indicate that the effect of defatting is element-specific and depends both on the affinity of the element for the lipid fraction and its susceptibility to mechanical carryover during filtration.
The correction factors obtained will allow the transformation of concentrations measured on a defatted basis to their non-defatted equivalent. The usefulness of these factors was confirmed by comparing the concentrations of samples from three consecutive years (2023-2025) with those used in the paired study, finding no significant differences (p > 0.05).
Comparison of the nutritional standard obtained from the corrected data (Table 2) with values reported in the literature showed greater agreement than when using the standard derived directly from the defatted basis (Table 1), since the latter values were considerably higher than those documented by various authors [16,17,28]. For example, the K sufficiency range on a defatted basis (0.73-1.02%) is much higher than that typically reported in non-defatted kernels [8,17], whereas the corrected range (0.26-0.36%) agrees with those reports. This reinforces the need to use correction factors when comparing studies that use different reporting bases (defatted vs. non-defatted), and it is recommended that future studies explicitly specify the defatting status of samples.
Comparison of the nutritional standard obtained from the corrected data (Table 2) with values reported in the literature showed greater similarity than when using the standard derived directly from the defatted basis (Table 1), since the latter values were higher than those reported by several authors.
For nitrogen, the corrected sufficiency range (1.85-2.60%) coincides with that found by Çelik [17] in Turkey, who reported an N percentage of 1.85%. For phosphorus, the sufficiency range (0.31-0.42%) showed greater similarity with concentrations reported for different pecan varieties grown in Mexico, Uruguay, the United States, and Australia. The values reported for the Western variety in Australia (0.325%) coincide with our ranges, this being the same variety used in the present study [8,16,19,29].
Potassium showed behavior similar to that previously reported, reinforcing the reliability of the ranges obtained in this study. Flores-Córdova et al. [8] found concentrations of 0.326% in the Western variety and 0.367% in the Wichita variety, both grown in Mexico. Likewise, similarity was observed with values reported in Turkey, China, and Poland [17,26,27].
Regarding Mg, its obtained correction factor (0.53) allowed the nutritional standard on a non-defatted basis (0.11-0.14%) to agree with values reported for the Western variety in Australia [29], Mexico [8], Uruguay [19], and China [27]. However, under high salinity and sodicity conditions (neighboring orchard), the Mg concentration in kernels was higher (classified as high/very high), which is consistent with the higher Mg concentration in foliar analysis (1.05%) and suggests that the correction factor is consistent even under contrasting edaphic conditions.
Regarding calcium, the sufficiency range on the defatted basis (0.20-0.27%) showed agreement only with that reported by Moodley et al. [20] in South Africa (0.208% Ca); it should be noted that they also used a defatted basis for element determination. The lack of agreement with most studies that did not defat samples suggests that calcium in pecan kernels may be associated with compounds in the lipid fraction that are removed during the defatting process, or may be mechanically carried over during filtration. This finding reinforces the recommendation to explicitly report the defatting status of samples when comparing calcium concentrations.
Regarding sodium, based on the sufficiency range of the nutritional standard on the defatted basis (0.0041-0.0057%), great variability was observed compared to values reported by different authors. Literature values ranged from deficient to high or very high within the generated standard [8,26]. The only agreement within the sufficiency range was with that reported by Wakeling et al. [29] in Australia for the Western variety, with a Na value of 0.0047%.
Regarding manganese, the sufficiency range (58.72-83.17 mg kg−1) was consistent with that reported by most of the consulted authors for different varieties and regions of the world [19,27,28]. The agreement with findings in China and Australia for the Western variety is notable, where concentrations of 65.6 and 83.0 mg kg−1 are reported, respectively.
On the other hand, the iron sufficiency range (54.04-76.54 mg kg−1) agrees with a large proportion of varieties grown in China, notably coinciding with the Western variety, with a value of 65.6 mg kg−1 [27].
In the case of zinc, most concentrations found in the literature are classified in the moderately high [8], high [19,27,28] to very high [29] ranges. However, the Zn concentration of 27 mg kg−1 reported by Çelik [17] in Turkey coincides with our sufficiency range. The discrepancy between our ranges and most international reports could reflect lower zinc availability in the soils of the Aldama region, resulting in a lower concentration in the kernel, or differences in the absorption efficiency of the Western Schley variety under local edaphoclimatic conditions.
Finally, the only element that showed no significant difference in the paired study between the defatted and non-defatted samples was copper. Its concentration in our ranges is consistent with that reported in other studies, coinciding with our sufficiency range (10.03-14.19) [16,19,26].
Some reports on the mineral composition of pecan kernels, such as that of Curiel-Maciel et al. [30], present concentrations well above those normally documented in the literature, which may limit their usefulness as a nutritional reference for kernels. This reinforces the need to generate regional nutritional standards using methodologies such as IDD.
Although the IDD method has previously been applied to various crops for the generation of nutritional standards, most of these studies have not incorporated any type of external or internal validation [22,23,24,25]. In this context, the present study provides an additional approach by evaluating the consistency of the generated standards through their application under independent field conditions.
External validation in a neighboring orchard with different management but similar edaphoclimatic conditions demonstrated the ability of the generated standards to detect nutritional imbalances consistent with soil analyses. The 21 non-defatted samples from the neighboring orchard were all classified as deficient in P, Mn, and Cu (Table 4), which coincides with the low levels of these elements present in the soil of that orchard (P: 18.33 kg ha−1, Mn: 5.03 mg kg−1, Cu: 0.56 mg kg−1). Likewise, external validation with 32 defatted samples from the same orchard showed that 100% of the samples classified above the sufficient range for Na (41% in “very high”), consistent with the high electrical conductivity (2.02 dS m−1) and high Na content in the soil (815.22 mg kg−1).
In the internal validation with 20 samples from the same “El Edén” orchard, it was found that between 55% and 90% of samples per nutrient were classified in the “sufficient” category, with the highest values for N (80%), K (70%), Na (90%), and Mn (65%). This behavior is consistent with the soil analysis of the “El Edén” orchard, which showed adequate concentrations of N (157.92 kg ha−1), K (333.25 mg kg−1), and Mn (11.71 mg kg−1). The presence of some samples in categories from moderately low to moderately high reflects the natural variability of the orchard and is expected for a nutritional standard constructed from the mean of a high-yielding population.
Overall, the three validation exercises demonstrate that the nutritional standards generated by IDD (Table 1 and Table 2) are sensitive to differences in soil nutrient availability and are internally consistent, supporting their use as a nutritional diagnostic tool in pecan orchards in the Aldama region, Chihuahua, Mexico.
5. Conclusions
Based on the results obtained in this study, it was found that defatting of pecan kernels with hexane affects the concentration of the analyzed elements. Notably, there was a significant increase in the concentration of N, P, K, Mg, Fe, Mn, and Zn due to the reduction in kernel mass from the lipid fraction. In contrast, Na and Ca showed a significant loss in concentration, which may be due to actual loss by mechanical carryover during the defatting process. Finally, Cu concentration was not significantly affected by the methodology employed.
Nutritional sufficiency ranges for pecan kernels were established using the IDD methodology, both for the defatted basis and for the estimated non-defatted basis. The corrected ranges showed high agreement with values reported in the literature for non-defatted kernels, validating the correction procedure. In contrast, the ranges on the defatted basis were notably higher, demonstrating the need to apply correction factors when comparing studies that use different reporting bases.
The three validation exercises (external validation with non-defatted samples, external validation with defatted samples, and internal validation) demonstrated that the generated nutritional standards are consistent. The standards detected nutritional imbalances in the neighboring orchard, which were congruent with the soil analyses of that orchard. Internal validation in the “El Edén” orchard showed that between 55% and 90% of the samples were classified in the “sufficient” category, adequately reflecting the nutritional conditions of the site of origin.
It is recommended that future research on the mineral composition of pecan kernels explicitly state whether samples were defatted or not. When using a defatted basis, the application of the correction factors proposed here will allow a more precise comparison with existing literature. The generated IDD nutritional standards constitute a reliable diagnostic tool for pecan orchards in the Aldama region, Chihuahua, Mexico.
A limitation of this study is that the standards were generated from a single population and validated in only one neighboring orchard with similar conditions. Although the IDD method has been used with this approach to establish regional sufficiency ranges, it is essential to highlight the need to obtain a larger number of samples from different regions of the state, covering different edaphoclimatic conditions. This is essential to generate a robust and representative standard at the state level before making extensive use of the proposed standards. However, it should be noted that the IDD methodology can be extrapolated to other regions, to other quantitative measurements, and even to other crops.
Author Contributions
M.A.G.-V: Data curation, formal analysis, investigation, methodology, project administration, writing—original draft. J.M.S.-P.: Conceptualization, data curation, formal analysis, investigation, methodology, project administration, resources, validation, writing—original draft, writing—review and editing. L.R.O.-M.: Writing—review and editing. A.L.S.D.: Investigation, methodology, validation. J.C.O.M.: Conceptualization. N.G.T.B.: methodology, validation, A.G.V.: degreasing, sample processing and analysis. All authors have read and approved the published version of the manuscript.
Funding
This research received no external funding.
Data Availability Statement
The original contributions presented in the study are included in the article. further inquiries can be directed to the corresponding author.
Acknowledgments
The authors thank the Faculty of Agrotechnological Sciences of the Autonomous University of Chihuahua for the use of laboratory facilities.
Conflicts of Interest
The authors declare no conflicts of interest.
References
- Ortiz-Quezada, AG.; Lombardini, L.; Cisneros-Zevallos, L. Antioxidants in pecan nut cultivars [Carya illinoinensis (Wangenh.) K. Koch]. En Nuts and seeds in health and disease prevention; Preedy, VR., Watson, RR., Patel, VB., Eds.; Elsevier: Ámsterdam, Países Bajos, 2011; pp. 881–889.
- Zhang, R.; Peng, F.; Li, Y. Pecan production in China. Sci. Hortic. 2015, 197, 719-727. [CrossRef]
- FAO. Food and Agriculture Organization Statistical Database. Disponible en línea: https://www.fao.org/faostat/es/#data/QCL (accedida el 15 de febrero de 2026).
- Servicio de Información Agroalimentaria y Pesquera. Producción Agrícola. Histórico de Siembra y Cosecha. Disponible enlínea: https://nube.agricultura.gob.mx/cierre_agricola (accedida el 20 de febrero de 2026).
- Orozco-Meléndez, LR.; Noperi-Mosqueda, LC.; Oviedo-Mireles, JC.; Torres-Beltrán, NG.; Yáñez-Muñoz, RM.; Soto-Parra, JM. Balanced Fertilization with Nitrogen, Molybdenum, and Zinc: Key to Optimizing Pecan Tree Yield and Quality of Western Schley Pecan Tree. Horticulturae 2025, 11, 741. [CrossRef]
- Smith, MW.; Rohla, CT.; Goff, WD. Pecan Leaf Elemental Sufficiency Ranges and Fertilizer Recommendations. HortTechnology 2012, 22, 594–599. [CrossRef]
- Smith, CA.; VanLeeuwen, D.; Heerema, RJ.; Sherman, JD.; Comeau, MJ.; Walworth, JL. Zinc Variability in Pecan Orchards: Implications for Leaf Sampling and Nutrient Recommendations. HortScience 2022, 57, 550–557. [CrossRef]
- Flores-Córdova, MA.; Sánchez Chávez, E.; Chávez-Mendoza, C.; García-Hernández, JL.; Preciado-Rangel, P. Bioactive compounds and phytonutrients in edible part and nutshell of pecan (Carya illinoinensis). Cogent Food Agric. 2016, 2, 1262936. [CrossRef]
- Binkley, D.; Stape, JL.; Albaugh, TJ. Foliar nutrient concentrations and stoichiometry should not be assumed to diagnose nutrient limitation. Ecol. Process. 2025, 14. [CrossRef]
- Toro-Vazquez, JF.; Charo-Alonso, MA.; Perez-Briceno, F. Fatty acid composition and its relationship with physicochemical properties of pecan (Carya illinoensis) oil. J. Am. Oil Chem. Soc. 1999, 76, 957-965. [CrossRef]
- Villarreal-Lozoya, JE.; Lombardini, L.; Cisneros-Zevallos, L. Phytochemical constituents and antioxidant capacity of different pecan [Carya illinoinensis (Wangenh.) K. Koch] cultivars. Food Chem. 2007, 102, 1241-1249. [CrossRef]
- Moodley, R.; Kindness, A.; Jonnalagadda, SB. Elemental composition and chemical characteristics of five edible nuts (almond, Brazil, pecan, macadamia and walnut) consumed in Southern Africa. J. Environ. Sci. Health Part B 2007, 42, 585-591. [CrossRef]
- Petraru, A.; Amariei, S.; Senila, L. Flaxseed Oilcake: An Ingredient with High Nutritional Value in the Realization of Innovative Food Products. Foods 2025, 14, 1087. [CrossRef]
- Kolláthová, R.; Varga, B.; Ivanišová, E.; Bíro, D.; Rolinec, M.; Juráček, M.; Šimko, M.; Gálik, B. Mineral profile analysis of oilseeds and their by-products as feeding sources for animal nutrition. Slovak J. Anim. Sci. 2019, 52, 9-15.
- Petraru, A.; Ursachi, F.; Amariei, S. Nutritional characteristics assessment of sunflower seeds, oil and cake. Perspective of using sunflower oilcakes as a functional ingredient. Plants 2021, 10, 2487. [CrossRef]
- Senter, SD. Mineral composition of pecan nutmeats. J. Food Sci. 1976, 41, 963-964. [CrossRef]
- Celik, SA. Determination of physico-mechanical and chemical properties of pecan [Carya illinoinensis (Wangenh.) K. Koch] grown in Turkiye. Erwerbs-Obstbau 2024, 66, 1983–1990. [CrossRef]
- Noperi-Mosqueda, LC.; Soto-Parra, JM.; Sánchez, E.; Piña-Ramírez, FJ.; Pérez-Leal, R.; Flores-Córdova, MA.; Salas-Salazar, NA. Impact of Organic and Mineral Fertilization in Pecan Nut on Production, Quality and Antioxidant Capacity. Agric. Sci. 2019, 10, 227-240.
- Ferrari, V.; Gil, G.; Heinzen, H.; Zoppolo, R.; Ibáñez, F. Influence of cultivar on nutritional composition and nutraceutical potential of pecan growing in Uruguay. Front. Nutr. 2022, 9, 868054. [CrossRef]
- Uvalle-Bueno, JXS.; Alcalde-Blanco; Kick, H. Fundamentos fisiológicos del diagnóstico diferencial integrado (DDI). En Memorias del XXVI Congreso Nacional de la Ciencia del Suelo; Cd. Victoria, Tamaulipas, México, 1995; p. 51.
- Soto, JM.; Hernández, AP.; Uvalle-Bueno, JX.; Yáñez, RM.; Montes, F.; Sánchez, E.; Romero, L. Relación del estado nutricional y la intensidad de mancha amarga en frutos de manzano “Golden Delicious” en postcosecha. Ars Pharm. 1999, 40, 241-245.
- Mancera-López, MM.; Soto-Parra, JM.; Sánchez-Chávez, E.; Yáñez-Muñoz, RM.; Montes-Domínguez, F.; Balandrán-Quintana, RR. Caracterización mineral de manzana ‘Red Delicious’ y ‘Golden Delicious’ de dos países productores. TECNOCIENCIA Chihuahua 2007, 1, 6-17.
- Yáñez-Muñoz, RM.; Soto-Parra, JM.; Pérez-Leal, R.; Piña-Ramírez, FJ.; Acevedo-Barrera, AA. Estándares nutricionales foliares para arándano (Vaccinium corymbosum L.) mediante diagnóstico diferencial integrado (DDI), en Chihuahua. TECNOCIENCIA Chihuahua 2018, 12, 182-192.
- Torres-Beltrán, NG.; Yáñez-Muñoz, RM.; Soto-Parra, JM.; Noperi-Mosqueda, LC. Nutritional standards through Integrated Differential Diagnosis (IDD) in pomegranate (Punica granatum L.). Notulae Bot. Horti Agrobot. Cluj-Napoca 2023, 51, 12988. [CrossRef]
- Alanís-Fierro, AK.; Soto-Parra, JM.; Sánchez-Chávez, E.; Yáñez-Muñoz, RM.; Piña-Ramírez, FJ. Caracterización del estado nutricional foliar para níquel en nogal pecanero. Rev. Cient. Biol. Agropecu. Tuxpan 2014, 2, 65–70.
- Woźniak, M.; Waśkiewicz, A.; Ratajczak, I. The content of phenolic compounds and mineral elements in edible nuts. Molecules 2022, 27, 4326. [CrossRef]
- Wu, S.; Yao, X.; Wang, K.; Yang, S.; Ren, H.; Huang, M.; Chang, J. Quality analysis and comprehensive evaluation of fruits from different cultivars of pecan (Carya illinoinensis (Wangenheim) K. Koch). Forests 2022, 13, 746. [CrossRef]
- Sparks, D. Concentration and content of 14 elements in fruit of pecan. HortScience 1975, 10, 517-519. [CrossRef]
- Wakeling, LT.; Mason, RL.; D’Arcy, BR.; Caffin, NA. Composition of pecan cultivars Wichita and Western Schley [Carya illinoinensis (Wangenh.) K. Koch] grown in Australia. J. Agric. Food Chem. 2001, 49, 1277-1281.
- Curiel-Maciel, NF.; Arreola-Ávila, JG.; Esparza-Rivera, JR.; Luna-Zapién, EA.; Minjares-Fuentes, JR.; Sierra-Campos, E.; Meza-Velázquez, JA. Nutritional quality, fatty acids content and antioxidant capacity of pecan nut fruits from Criolla and Improved walnut varieties. Notulae Bot. Horti Agrobot. Cluj-Napoca 2021, 49, 12021. [CrossRef]

Table 1.
Nutritional standard for the defatted pecan kernel basis for macro and micronutrients.
| Range | Deficient (D) |
Very Low (vL) |
Low (B) |
Medium Low (ML) | Sufficient (S) |
Medium High (MH) | High (H) |
Very High (vH) | Excess (E) |
|
|---|---|---|---|---|---|---|---|---|---|---|
| IDD | 0.25 | 0.5 | 0.71 | 0.84 | 1.19 | 1.41 | 2 | 4 | 16 | |
| Nutrient | Mean | |||||||||
| N | 3.42 | < 0.86 | 0.87 - 1.71 | 1.72 - 2.43 | 2.43 - 2.87 | 2.88 - 4.07 | 4.08 - 4.82 | 4.83 - 6.84 | 6.85 - 13.68 | > 13.69 |
| P | 0.58 | < 0.15 | 0.16 - 0.29 | 0.30 - 0.41 | 0.42 - 0.49 | 0.50 - 0.69 | 0.70 - 0.82 | 0.83 - 1.16 | 1.17 - 2.32 | > 2.33 |
| K | 0.86 | < 0.21 | 0.22 - 0.43 | 0.44 - 0.61 | 0.62 - 0.72 | 0.73 - 1.02 | 1.03 - 1.21 | 1.22 - 1.72 | 1.73 - 3.43 | > 3.43 |
| Ca | 0.23 | < 0.06 | 0.07 - 0.12 | 0.13 - 0.16 | 0.17 - 0.19 | 0.20 - 0.27 | 0.28 - 0.32 | 0.33 - 0.46 | 0.47 - 0.92 | > 0.93 |
| Mg | 0.23 | < 0.06 | 0.07 - 0.12 | 0.13 - 0.16 | 0.17 - 0.19 | 0.20 - 0.27 | 0.28 - 0.32 | 0.33 - 0.46 | 0.47 - 0.92 | > 0.93 |
| Na | 0.0048 | < 0.0012 | 0.0013 - 0.0024 | 0.0025 - 0.0034 | 0.0035 - 0.0040 | 0.0041 - 0.0057 | 0.0058 - 0.0068 | 0.0069 - 0.0096 | 0.0097 - 0.0192 | > 0.0193 |
| Fe | 80.90 | < 20.2 | 20.3 - 40.5 | 40.6 - 57.4 | 57.5 - 68.0 | 68.1 - 96.3 | 96.4 - 114.1 | 114.1 - 161.8 | 161.9 - 323.6 | > 323.7 |
| Mn | 148.70 | < 37.2 | 37.3 - 74.4 | 75.5 - 105.6 | 105.7 - 124.9 | 125.0 - 177.0 | 177.1 - 209.7 | 209.8 - 297.4 | 297.5 - 594.8 | > 594.9 |
| Zn | 47.60 | < 11.9 | 12.0 - 23.8 | 23.9 - 33.8 | 33.9 - 40.0 | 40.1 - 56.6 | 56.7 - 67.1 | 67.2 - 95.2 | 95.3 - 190.4 | > 190.5 |
| Cu | 11.40 | < 2.98 | 2.99 - 5.97 | 5.98 - 8.47 | 8.48 – 10.02 | 10.03 - 14.19 | 14.20 - 16.81 | 16.82 – 23.85 | 23.86 – 45.60 | > 45.61 |
Note: Values of N, P, K, Ca, Mg, Na are presented in %, and Fe, Mn, Zn, Cu in mg kg−1.
Table 2.
Nutritional standard for the estimated non-defatted pecan kernel basis for macro and micronutrients.
Table 2.
Nutritional standard for the estimated non-defatted pecan kernel basis for macro and micronutrients.
| Range | Deficient (D) |
Very Low (vL) |
Low (B) |
Medium Low (ML) | Sufficient (S) |
Medium High (MH) | High (H) |
Very High (vH) | Excess (E) |
|
|---|---|---|---|---|---|---|---|---|---|---|
| IDD | 0.25 | 0.5 | 0.71 | 0.84 | 1.19 | 1.41 | 2 | 4 | 16 | |
| Nutrient | Mean | |||||||||
| N | 2.19 | <0.55 | 0.56-1.10 | 1.11-1.55 | 1.56-1.84 | 1.85-2.60 | 2.61-3.09 | 3.10-4.39 | 4.40-8.76 | >8.76 |
| P | 0.36 | <0.09 | 0.10-0.18 | 0.19-0.25 | 0.26-0.30 | 0.31-0.42 | 0.43-0.50 | 0.51-0.71 | 0.72-1.42 | >1.43 |
| K | 0.30 | <0.08 | 0.09-0.15 | 0.16-0.22 | 0.23-0.25 | 0.26-0.36 | 0.37-0.43 | 0.44-0.61 | 0.62-1.21 | >1.22 |
| Mg | 0.12 | < 0.03 | 0.04 - 0.06 | 0.07 - 0.08 | 0.09 - 0.10 | 0.11 - 0.14 | 0.15 - 0.17 | 0.18 - 0.24 | 0.25 - 0.48 | > 0.48 |
| Fe | 64.32 | <16.07 | 16.08-32.16 | 32.17-45.66 | 45.67-54.03 | 54.04-76.54 | 76.55-90.68 | 90.68-128.63 | 128.64-257.26 | >257.26 |
| Mn | 69.89 | <17.47 | 17.48-34.94 | 34.95-49.62 | 49.63-58.71 | 58.72-83.17 | 83.18-98.54 | 98.55-139.78 | 139.78-279.56 | >279.56 |
| Zn | 25.04 | <6.26 | 6.27-12.52 | 12.53-17.78 | 17.79-21.03 | 21.04-29.79 | 29.80-35.30 | 35.31-50.08 | 50.09-100.15 | >100.16 |
| Cu* | 11.40 | < 2.98 | 2.99 - 5.97 | 5.98 - 8.47 | 8.48 – 10.02 | 10.03 – 14.19 | 14.20 - 16.81 | 16.82 – 23.85 | 23.86 - 45.60 | > 45.61 |
Note: Values of N, P, K, Mg are presented in %, and Fe, Mn, Zn, Cu in mg kg−1. Copper was not corrected (non-significant difference); its original value from the defatted basis is presented as reference. Ca and Na are not included in this table because defatting caused actual losses; their values are found in Table 1.
Table 3.
Integrated comparison of soil-foliar-kernel conditions between the standard generation orchard (“El Edén”) and the validation orchard (neighboring).
Table 3.
Integrated comparison of soil-foliar-kernel conditions between the standard generation orchard (“El Edén”) and the validation orchard (neighboring).
| Level | Parameter | “El Edén” Orchard | Neighboring Orchard | Observed congruence |
|---|---|---|---|---|
| Suelo | Texture | Clay loam | Clay loam | Similar |
| pH | 7.56 | 7.78 | Similar | |
| EC (dS m−1) | 0.88 | 2.02 | Higher in neighbor | |
| MO (%) | 1.74 | 0.51 | Lower in neighbor | |
| P (g kg−1) | 0.0319 | 0.00764 | Lower in neighbor | |
| K (g kg−1) | 0.333 | 0.443 | Higher in neighbor | |
| Na (g kg−1) | 0.508 | 0.815 | Higher in neighbor | |
| Mn (mg kg−1) | 11.71 | 5.03 | Lower in neighbor | |
| Cu (mg kg−1) | 1.84 | 1.11 | Lower in neighbor | |
| Foliar | N, P, K | Adequate | Adequate | No visible deficiencies |
| Mn, Cu, Zn | Adequate | Adequate | No visible deficiencies | |
| Kernel | IDD Classification (Tabla 2) | Standard base | P: 100% deficient | Consistent with soil analysis |
| Mn: 100% low | ||||
| Cu: 100% low | ||||
| Na: 41% very high |
Table 4.
Classification of 21 non-defatted kernel samples (neighboring orchard) according to the nutritional standard for the estimated non-defatted pecan kernel basis (Table 2).
Table 4.
Classification of 21 non-defatted kernel samples (neighboring orchard) according to the nutritional standard for the estimated non-defatted pecan kernel basis (Table 2).
| Nutrient | Deficient (D) |
Very Low (vL) |
Low (B) |
Medium Low (ML) | Sufficient (S) |
Medium High (MH) | High (H) |
Very High (vH) | Excess (E) |
|---|---|---|---|---|---|---|---|---|---|
| N | 0 | 0 | 0 | 0 | 16 | 5 | 0 | 0 | 0 |
| P | 21 | 0 | 0 | 0 | 0 | 0 | 0 | 0 | 0 |
| K | 0 | 0 | 4 | 6 | 10 | 1 | 0 | 0 | 0 |
| Mg | 0 | 0 | 0 | 0 | 0 | 0 | 16 | 5 | 0 |
| Fe | 0 | 0 | 0 | 0 | 14 | 6 | 1 | 0 | 0 |
| Mn | 0 | 4 | 6 | 11 | 0 | 0 | 0 | 0 | 0 |
| Zn | 0 | 0 | 0 | 1 | 13 | 4 | 3 | 0 | 0 |
| Cu | 0 | 0 | 5 | 16 | 0 | 0 | 0 | 0 | 0 |
Table 5.
Classification of 32 defatted pecan kernel samples from the neighboring orchard according to the nutritional standard for the defatted basis (Table 1).
Table 5.
Classification of 32 defatted pecan kernel samples from the neighboring orchard according to the nutritional standard for the defatted basis (Table 1).
| Nutrient | Deficient (D) |
Very Low (vL) |
Low (B) |
Medium Low (ML) | Sufficient (S) |
Medium High (MH) | High (H) |
Very High (vH) | Excess (E) |
|---|---|---|---|---|---|---|---|---|---|
| N | 0 | 0 | 0 | 2 | 23 | 6 | 1 | 0 | 0 |
| P | 0 | 0 | 1 | 5 | 25 | 1 | 0 | 0 | 0 |
| K | 0 | 0 | 2 | 20 | 10 | 0 | 0 | 0 | 0 |
| Ca | 0 | 2 | 7 | 10 | 12 | 0 | 1 | 0 | 0 |
| Mg | 0 | 0 | 0 | 5 | 12 | 13 | 2 | 0 | 0 |
| Na | 0 | 0 | 0 | 0 | 0 | 9 | 10 | 13 | 0 |
| Fe | 0 | 0 | 0 | 4 | 8 | 1 | 19 | 0 | 0 |
| Mn | 0 | 0 | 10 | 7 | 12 | 3 | 0 | 0 | 0 |
| Zn | 0 | 0 | 0 | 0 | 1 | 10 | 21 | 0 | 0 |
| Cu | 1 | 0 | 11 | 10 | 9 | 1 | 0 | 0 | 0 |
Table 6.
Classification of 20 defatted pecan kernel samples from the “El Edén” orchard against the nutritional standard for the defatted basis (Table 1).
Table 6.
Classification of 20 defatted pecan kernel samples from the “El Edén” orchard against the nutritional standard for the defatted basis (Table 1).
| Nutrient | Deficient (D) |
Very Lo0. | Low (B) |
Medium Low (ML) | Sufficient (S) |
Medium High (MH) | High (H) |
Very High (vH) | Excess (E) |
|---|---|---|---|---|---|---|---|---|---|
| N | 0 | 0 | 0 | 2 | 16 | 2 | 0 | 0 | 0 |
| P | 0 | 0 | 0 | 5 | 11 | 4 | 0 | 0 | 0 |
| K | 0 | 0 | 0 | 3 | 14 | 3 | 0 | 0 | 0 |
| Ca | 0 | 1 | 1 | 4 | 9 | 5 | 0 | 0 | 0 |
| Mg | 0 | 0 | 0 | 3 | 11 | 4 | 1 | 0 | 0 |
| Na | 0 | 0 | 0 | 1 | 18 | 0 | 0 | 1 | 0 |
| Fe | 0 | 0 | 0 | 1 | 13 | 5 | 1 | 0 | 0 |
| Mn | 0 | 0 | 0 | 4 | 13 | 3 | 0 | 0 | 0 |
| Zn | 0 | 2 | 0 | 1 | 13 | 4 | 0 | 0 | 0 |
| Cu | 0 | 0 | 2 | 5 | 7 | 5 | 1 | 0 | 0 |
Disclaimer/Publisher’s Note: The statements, opinions and data contained in all publications are solely those of the individual author(s) and contributor(s) and not of MDPI and/or the editor(s). MDPI and/or the editor(s) disclaim responsibility for any injury to people or property resulting from any ideas, methods, instructions or products referred to in the content. |
© 2026 by the authors. Licensee MDPI, Basel, Switzerland. This article is an open access article distributed under the terms and conditions of the Creative Commons Attribution (CC BY) license (http://creativecommons.org/licenses/by/4.0/).
Copyright: This open access article is published under a Creative Commons CC BY 4.0 license, which permit the free download, distribution, and reuse, provided that the author and preprint are cited in any reuse.


